Embed Size (px)
Citation preview
PUBLIC ATTITUDES TOWARD MUNICIPAL WATER CONSERVATION
ON THE TEXAS SOUTHERN HIGH PLAINS AND ROLLING PLAINS
by
RONALD GARY PUMPHREY, B.G.S., M.S.
A DISSERTATION
IN
LAND-USE PLANNING, MANAGEMENT AND DESIGN
Submitted to the Graduate Faculty of Texas Tech University in
Partial Fulfillment of the Requirements for
the Degree of
DOCTOR OF PHILOSOPHY
Approved
Gary Elbow Chairperson of the Committee
Heyward Ramsey
Brian J. Gerber
Jeffrey Edwards
Accepted
John Borrelli Dean of the Graduate School
May, 2006

© 2006, Ronald Gary Pumphrey

He knew that lean years will surely follow the fat, and so he was never really wasteful of the bounty which lay at his hand.
Paul B. Sears This is our World
ACKNOWLEDGEMENTS
I would especially like to thank Dr. Gary Elbow for his guidance, patience and
tireless editing and suggestions throughout this project. I would also like to thank the
remaining committee members, Dr. Heyward Ramsey, Dr. Brian Gerber and Dr. Jeff
Edwards for their support, guidance and expertise. A special thank you goes to the High
Plains Underground Water Conservation District #1 for their financial support for the
survey and various research expenses. The Graduate School at Texas Tech University
also provided a Summer Dissertation Research Award, which allowed full concentration
on research this past summer.
A heartfelt thank you is extended to my mentor, Dr. Otis W. Templer. He has
taught me much, has been unselfish to include me as co-author on numerous papers and
on many occasions has given helpful suggestions and guidance on many subjects. I will
never be able to put into words how much I appreciate his guidance, his wisdom and
especially his friendship.
Without financial support from the TTU Geography Department, this project
would not have been possible. Last, I would like to thank both family and friends for their
support and patience while I have labored through this project.
ii
TABLE OF CONTENTS
ACKNOWLEDGEMENTS………………………………………………………………ii
ABSTRACT……………………………………………………………………………..vii
LIST OF TABLES.…………………………………………………..……………..….viii
LIST OF FIGURES…………………………………………………………………........xi
LIST OF ABBREVIATIONS……………………………………………………….......xii
CHAPTER
I. INTRODUCTION................................................................................................1
Study Objective …………………………………………………………...1
Discussion…………………………………………………………………2
Nature of the Problem..................................................................................7
Purpose of the Study....................................................................................7
Questions.........................................................................................9
Background of The Southern High Plains Region....................................10
Study Area.....................................................................................10
Study Area Towns……………………………………………….12
Surface Water on the Southern High Plains……………………..13
Groundwater on the Southern High Plains....................................15
Texas Surface Water Law.............................................................18
Texas Groundwater Law...............................................................18
State of Texas Water Plan……………………………………….19
Recent Regional Water Shortages.................................................21
Historical Background of the Southern High Plains of Texas.......22
Adaptation and Change..................................................................27
Municipal Water- The Study Area…………………………..…..29
II. REVIEW OF LITERATURE…………………………………………………35
Water Conservation- Why Is It Needed?...................................................35
Possible Conservation Strategies...............................................................37
iii
Possible Conservation Incentives..............................................................41
Public Education............................................................................41
Water Rate Structure......................................................................42
Measures to Increase Water Use Efficiency- Indoors................................43
Low Gallon-per-Flush Toilets........................................................44
Low Flow Showerheads and Faucet Aerators………...................45
Clothes and Dishwashing Machines..............................................45
On-Demand or Tankless Hot Water Heater...................................46
Measures to Increase Water Use Efficiency- Outdoors……….................46
Grass Varieties and Water Demand...............................................47
Xeriscaping....................................................................................48
Landscape Rebate Programs and Subdivision Regulations……...48
Automatic Sprinkler Systems........................................................49
Rainwater Harvesting....................................................................50
Graywater Use...............................................................................51
Water Use Survey or Water Audit.................................................52
Financial Incentives- Rebates to Encourage Participation.............52
Selected Municipal Water Conservation Programs...................................54
California.......................................................................................54
San Antonio, Texas........................................................................56
El Paso, Texas................................................................................57
Albuquerque, New Mexico............................................................58
Attitudes and Perceptions of Water Conservation Programs.....................60
Voluntary versus Mandatory Restrictions .....................................64
Citizen Participation in the Rulemaking Process...........................67
Behavioral Change.........................................................................69
The Urban versus Rural Attitude...................................................71
Demographic Information..............................................................74
Conclusion……………………………………………………….75
iv
III. THEORETICAL FRAMEWORK………………………………………..…77
Common Pool Resources...............................................................77
Theory of Collective Action..........................................................83
Collective Action Problems...........................................................84
The Southern High Plains of Texas...............................................86
IV. RESEARCH METHODOLOGY…………………………………………....91
Introduction...................................................................................91
Selection of Cities..........................................................................91
Research Methods- Data Acquisition……………………………91
Survey Instrument Design- Water Consumer……………………93
Survey Instrument Design- Municipal Water Provider………….95
Reliability and Validity..................................................................95
Data Analysis Methods..................................................................96
Integration of Theoretical and Empirical………………………...99
Hypotheses Development............................................................105
Issue Area I- Familiarity with Regional Water Resources……………..108
Hypothesis 1…………………………………………………….111
Issue Area II- Attitudes Toward Water Conservation………………….112
Urban versus Rural Setting..……..……………………………..113
Hypothesis 2A………..….……………………………………..113
Water Conservation as a Policy Issue…………………………..115
Hypothesis 2B…………………………………………………..115
Issue Area III- Price of Water and Rebates………..…………………...116
Water Rate Structure ……………………………….…………..116
Hypothesis 3A…………………………………………………..117
Rebates as a Conservation Tool………………………….……..117
Hypothesis 3B…………………………………………………..118
Issue Area IV- Social Responsibility (collective action)………..……..119
Hypothesis 4…………………………………………………....120
v
V. RESULTS AND ANALYSIS……………………………………………...121
Demographic Data………………..……………………………...121
Issue Area Analysis- Water Consumer…………….………………..….124
Issue Area I- Familiarity with Regional Water Resources……………..124
Issue Area II- Attitudes Toward Water Conservation .……….………...138
Urban versus Rural Attitudes Toward Conservation..…………...138
Water Conservation as a Policy Issue on the SHP………..……..155
Issue Area III- Price of Water and Rebates…………………….………168
Attitudes Toward Pricing of Water……….…………………….168
Rebates as an Incentive to Conserve Water……….……………174
Issue Area IV- Social Responsibility toward Resource……….………..179
Issue Area Analysis- Water Provider……….…………………………..194
Summary of Findings………….……………….………………..199
Notes…………………………………………………………….202
VI. CONCLUSIONS AND REFLECTIONS………..…………………………203
Reflections……………………………………………………...206
Concluding Thoughts……………………..……………………208
LITERATURE CITED........................................................................................210
APPENDICES.....................................................................................................223
A. Consumer Water Conservation Questionnaire....................................224
B. Municipal Water Provider
1. Questionnaire………………………………………………...235
2. Sample Cover Letter…………………………………………242
C. Figures
1. Study Area Map.......................................................................245
2. Canadian River Municipal Water Authority………………...247
vi
ABSTRACT
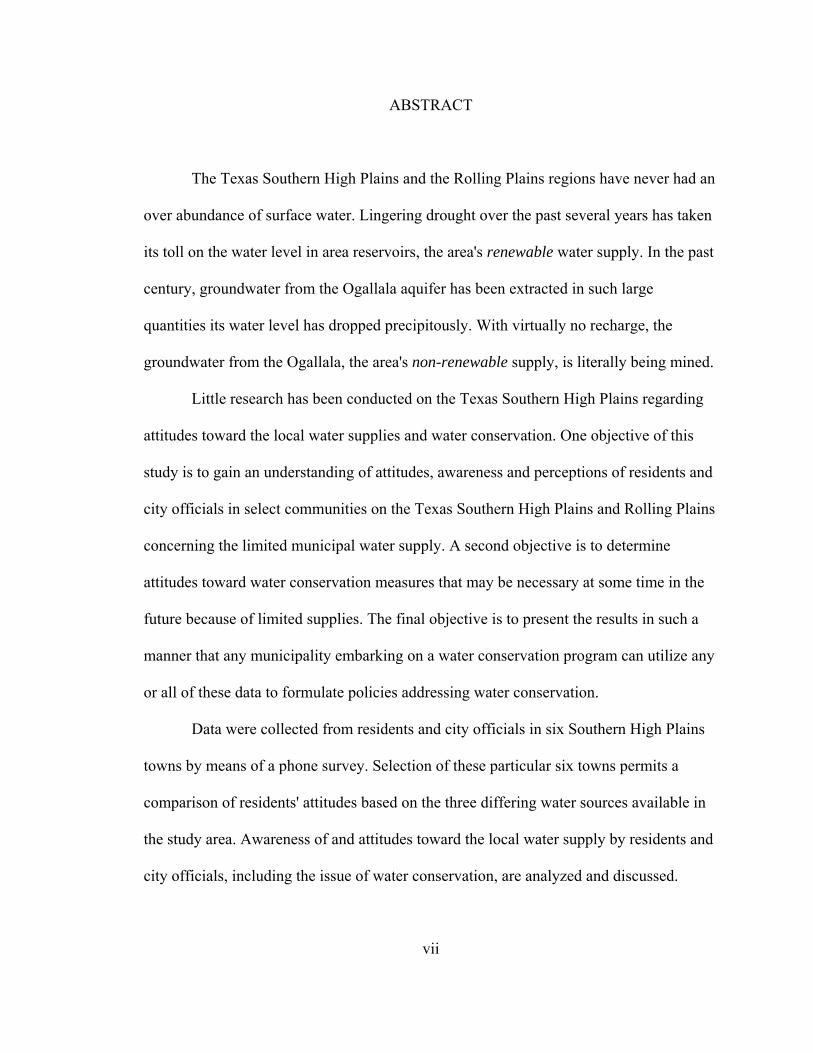
The Texas Southern High Plains and the Rolling Plains regions have never had an
over abundance of surface water. Lingering drought over the past several years has taken
its toll on the water level in area reservoirs, the area's renewable water supply. In the past
century, groundwater from the Ogallala aquifer has been extracted in such large
quantities its water level has dropped precipitously. With virtually no recharge, the
groundwater from the Ogallala, the area's non-renewable supply, is literally being mined.
Little research has been conducted on the Texas Southern High Plains regarding
attitudes toward the local water supplies and water conservation. One objective of this
study is to gain an understanding of attitudes, awareness and perceptions of residents and
city officials in select communities on the Texas Southern High Plains and Rolling Plains
concerning the limited municipal water supply. A second objective is to determine
attitudes toward water conservation measures that may be necessary at some time in the
future because of limited supplies. The final objective is to present the results in such a
manner that any municipality embarking on a water conservation program can utilize any
or all of these data to formulate policies addressing water conservation.
Data were collected from residents and city officials in six Southern High Plains
towns by means of a phone survey. Selection of these particular six towns permits a
comparison of residents' attitudes based on the three differing water sources available in
the study area. Awareness of and attitudes toward the local water supply by residents and
city officials, including the issue of water conservation, are analyzed and discussed.
vii
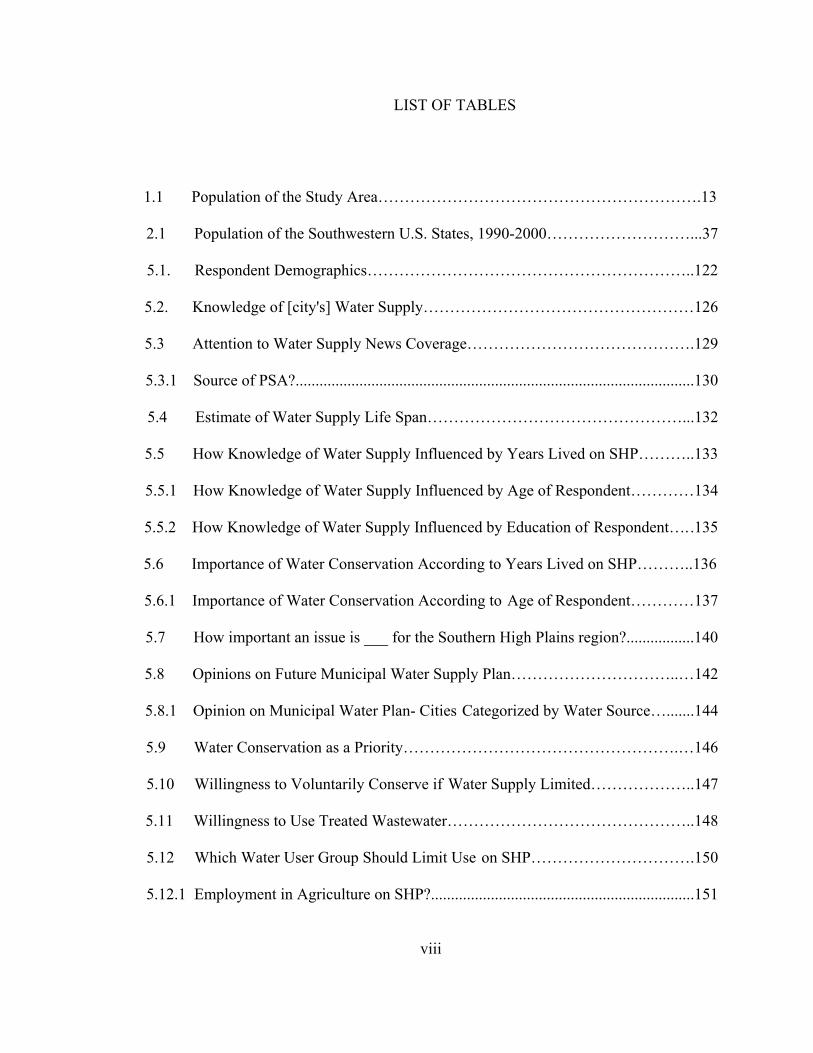
LIST OF TABLES
1.1 Population of the Study Area…………………………………………………….13 2.1 Population of the Southwestern U.S. States, 1990-2000………………………...37 5.1. Respondent Demographics……………………………………………………..122 5.2. Knowledge of [city's] Water Supply……………………………………………126 5.3 Attention to Water Supply News Coverage…………………………………….129 5.3.1 Source of PSA?....................................................................................................130 5.4 Estimate of Water Supply Life Span…………………………………………...132 5.5 How Knowledge of Water Supply Influenced by Years Lived on SHP………..133 5.5.1 How Knowledge of Water Supply Influenced by Age of Respondent…………134 5.5.2 How Knowledge of Water Supply Influenced by Education of Respondent…..135 5.6 Importance of Water Conservation According to Years Lived on SHP………..136 5.6.1 Importance of Water Conservation According to Age of Respondent…………137 5.7 How important an issue is ___ for the Southern High Plains region?.................140 5.8 Opinions on Future Municipal Water Supply Plan…………………………..…142 5.8.1 Opinion on Municipal Water Plan- Cities Categorized by Water Source….......144 5.9 Water Conservation as a Priority…………………………………………….…146 5.10 Willingness to Voluntarily Conserve if Water Supply Limited………………..147 5.11 Willingness to Use Treated Wastewater………………………………………..148 5.12 Which Water User Group Should Limit Use on SHP………………………….150 5.12.1 Employment in Agriculture on SHP?..................................................................151
viii
5.12.2 Which Water User Group Should Limit Use/Employment…………………….152 5.12.3 Cost of Water- Study Area Towns (2004)……………………………………...154
5.13 Response to Voluntary Water Restrictions……………………………………..157 5.14 Response to Mandatory Water Restrictions……………………………………159 5.14.1 Response to Mandatory Water Restrictions/Age……………………………….161 5.14.2 Response to Mandatory Water Restrictions/Years Lived on SHP……………..162 5.15 Unlimited Consumption as Long as One Pays For It…………………………..164 5.16 Residential Fines for Water Waste……………………………………………..165 5.17 Businesses Fined for Water Waste……………………………………………..166 5.18 Enforced Restrictions………………………………………………………..…167 5.19 Using Price as Conservation Measure………………………………………….169 5.20 Opinion if Cost of Water Doubled……………………………………………..171
5.21 Opinion if Cost of Water Increased by Half What it Costs Now………………172
5.22 Cost of Water/Resultant GPCD……………………………………………..…173
5.23 Respondent Opinion on Rebate Program……………………………………….176 5.24 Buy a Water Saving Appliance if it Saves Money……………………………..177 5.24.1 Buy a Water Saving Appliance if it Saves Money/Education………………….178 5.24.2 Buy a Water Saving Appliance if it Saves Money/Income…………………….179 5.25 Responsibility to Conserve Water……………………………………………...182 5.25.1 Responsibility to Conserve Water/Correct Answer on Water Supply…………183 5.25.2 Responsibility to Conserve Water/Years Lived on SHP……………………….184 5.25.3 Responsibility to Conserve Water/Age…………………………………………185
ix
5.25.4 Responsibility to Conserve Water/Income……………………………………..186 5.25.5 Responsibility to Conserve Water/Education…………………………………..187 5.26 Who Should Conserve?.......................................................................................189 5.26.1 Who Should Conserve/Correct Answer on Water Supply……………………..190 5.26.2 Who Should Conserve/Years Lived on SHP………………………………..…191 5.26.3 Who Should Conserve/Age…………………………………………………….192 5.26.4 Who Should Conserve/Income…………………………………………………193 5.26.5 Who Should Conserve/Education………………………………………………..194 5.27 Estimate of Water Supply Lifespan- Municipal Providers……………………..196 5.28 Plans for New Water Sources…………………………………………………..196 5.29 Response to Voluntary Water Restrictions……………………………………..196 5.30 Response to Mandatory Water Restrictions…………………………………….196 5.31 Water Conservation as a Priority……………………………………………….197 5.32 Using Price as Conservation Measure………………………………………….197 5.33 Rates for Larger Consumer of Water…………………………………………...197 5.34 Incentives to Encourage Water Conservation Practices………………………..198 5.35 Use of Treated Wastewater……………………………………………………..198 5.36 Promote Use of Low Water Using Plant Species………………………………198 5.37 Responsibility to Conserve Water……………………………………………...199 5.38 Which User Group Should Limit Water Use…………………………………..199
x

LIST OF FIGURES
Figure C-1………………………………………………………………………………245
Figure C-2………………………………………………………………………………247
xi
LIST OF ABBREVIATIONS
CPA- Common Property Arrangement
CPR- Common Pool Resource
CRMWA- Canadian River Municipal Water Authority
CRP- Conservation Reserve Program
EBMUD- East Bay Municipal Utility District
EPWU- El Paso Water Utilities
gpcd- gallons per capita per day
gpd- gallons per day
gpf- gallons per flush
gpl- gallons per load
gpm- gallons per minute
HPWD- High Plains Underground Water Conservation District #1
LEPA- Low Energy Precision Application
LERWPG- Llano Estacado Regional Water Planning Group
MWCS- Mohini Water Cooperative Society
NOAA- National Oceanic & Atmospheric Administration
PWCA- Panhandle Water Conservation Association
RDD- Random Digit Dialing
SHP- Southern High Plains
TWDB- Texas Water Development Board
WRMWD- White River Municipal Water District
xii
CHAPTER I
INTRODUCTION
Study Objective
The Texas Southern High Plains and Rolling Plains have never had an over
abundance of water. Historically, water on the Southern High Plains has not been
managed as a limited resource and is not currently being managed as one. In other words,
municipal water conservation measures are not being promoted on the Texas Southern
High Plains and most area residents may not consider water conservation an important
issue.
Most research regarding water conservation practices and attitudes toward water
conservation issues on the Southern High Plains has concentrated on water use by area
agricultural producers. Very limited research has been conducted regarding attitudes
toward municipal water conservation on the Southern High Plains. One study was found
that dealt with municipal water conservation on a statewide basis in Texas, but was
conducted in 1989. That study did not specifically concentrate on towns on the Llano
Estacado, and did not look at towns that are supplied water by different Southern High
Plains water sources (as does this study).
In the past several years, less than normal rainfall in the region shows the
management of this limited resource will have crucial short- and long-term consequences
for the region. How Southern High Plains communities manage the resource today to
insure a sustainable supply well into the future will have major consequences for the
1
entire region. A partial list of factors that may affect the decisions made by communities
concerning the management of the region's limited water supply in the near future may
include 1). sustainability of the resource and maintaining the quality of life present today,
2). population growth and the inherent increase in demand, 3). competition for water by
both agriculture and municipalities and 4). climate conditions that are beyond human
control (i.e. drought).
It is the purpose of this study to gain an understanding of attitudes, awareness and
perceptions of residents from a representative sample of communities on the Texas
Southern High Plains and Rolling Plains concerning the limited local municipal water
supply and to determine their subsequent attitudes toward any future water conservation
measures that may be necessary because of limited supplies.
Discussion
In 2003, approximately eighty percent of the southwestern United States was
suffering some of the worst drought conditions in history. The previous twelve months
ending August 2002 were the driest in recorded history for the southwestern U.S.
Predictions are that the seven year drought this area is currently experiencing may last
anywhere from five to thirty years. Some experts are comparing the current drought to
that of the “Dust Bowl” of the 1930s. In 2003, water levels in a majority of the reservoirs
in the western and southwestern portions of the U.S. were below average capacity. To
end the drought, it is predicted above average rainfall will have to occur. Depending on
the location, estimates range from five to twenty additional inches of rainfall (above the
2
annual average) will be needed to end the drought in the southwestern United States
(Anderson, Rundall and Cobb, 2003).
Lake Mead dropped to approximately 50 percent capacity during the summer of
2004. Lake Powell was reported to be at only 40 percent of capacity and if it drops
another 10 feet, federal law states surplus water from the Upper Colorado River Basin is
to be cut off to Nevada, California, and Arizona ("Western Water Shortage Brings
Surplus of Politics", 2004).
The climate in the southwestern U.S. ranges from semi-arid to arid. Except for the
far West Coast along the Pacific Ocean, rainfall for a majority of the western portion of
the U.S. averages approximately twenty inches or less annually. Even during normal or
above average rainfall years, water is not a plentiful commodity. Also from 1990 to 2000,
the southwestern U. S. experienced rapid population growth. The Census Bureau reported
40% population growth from 1990 to 2000 in Arizona, 30.6% for Colorado, and 29.6 %
in Utah. The largest percentage was reported in Nevada, as the population grew 66%
from 1990 to 2000 (Western Resource Advocates, 2003). With continued population
growth, so grows the demand for water. Water has always been a topic of discussion in
the southwestern U.S., but with the lingering drought of the past several years, and if
population continues to grow as it has historically, water will be an even “hotter topic.”
Both agriculture and municipal water supplies have been hard-hit by the drought.
Mountain states have had lighter than normal snowfall for several winters, which results
in lower than normal streamflows and water supplies during the warmer months. With
lower than average reservoir levels, cities are experiencing water shortages and some
3
have had to implement water restrictions, ranging from voluntary to mandatory (U.S.
Drought Affects Regions…, 2000).
By January 2005, drought conditions had eased somewhat in the southwestern
U.S. According to the National Climatic Data Center's Palmer Hydrological Drought
Index Long-Term Hydrological Conditions (NOAA), much of the southwestern U.S. was
either "moderately moist" to "extremely moist" (National Climatic Data Center, 2005).
The National Oceanic and Atmospheric Administration (NOAA), in March 2005, stated
September 2004 to February 2005 was the wettest fall/winter period in the southwest
U.S. in 110 years of record keeping. At least for the short-term, the drought may have
been lessened for southern California, Nevada, Utah, Arizona, New Mexico and much of
Colorado (NOAA, 2005a). From December 2005 to March 2006, the forecast was for
drier than normal conditions for most of the southwestern U.S., especially Arizona and
New Mexico. NOAA estimated the drought had lessened for much of the nation, stating
20% of the U.S. was in some level of drought as compared to 30% during the same time
period in 2004 (Climas, 2005; NOAA, 2005b)
Texas communities have not been immune to the above-mentioned drought
conditions. In 1996, San Antonio implemented Stage III or drought restrictions on water
use. Austin, at the same time, had implemented a Stage II drought contingency measure,
which required a twenty percent reduction in water usage. The drought in Texas has
lingered, and as of January 2004, the Texas Water Development Board (TWDB) reported
that reservoirs statewide were at 79% capacity. At that time, 51 communities had some
form of mandatory water restrictions and 9 communities had some type of voluntary
4
water restrictions (Texas Water Development Board, 2004a). Spring 2004 was wetter
than normal, and by May 2004, statewide reservoir storage capacity had gone up to 86%,
and the number of communities that previously had implemented some form of water
restrictions had dropped to 42, while 12 additional communities had enacted some form
of voluntary restrictions (Texas Water Development Board, 2004b). The City of Austin
reported 2003 as the tenth driest year on record (Rose, 2004) and the City of Lubbock
reported 8.83 inches of rainfall for the entire year, the second driest year on record. In
1917, the National Weather Service recorded 8.73 inches of rainfall for Lubbock
(National Weather Service Forecast Office, Lubbock, Texas. 2004.). To put more of a
strain on the already tight water supply in Texas, the population grew by 23% from 1990
to 2000 (Western Resource Advocates, 2003).
Lake Meredith, located on the Canadian River north of Amarillo, Texas, supplies
water to eleven member cities on the Texas High Plains and Canadian River Municipal
Water Authority (CRMWA) distributes that water. Record low inflows into Lake
Meredith for the past several years have caused the water level to drop to its lowest level
since the dam was constructed and the lake filled. Without significant rainfall and under
2003 climate conditions, Lake Meredith had approximately a two-year supply of water.
In October 2003, the CRMWA cut the municipal water supply allocations to all eleven
member cities by 10%. Further cuts in allocation may be necessary if conditions do not
improve (Fuquay, 2003c). As of December 2005, Lake Meredith was only three feet
above the record low level of June 2004 and was only at 14% capacity in February 2006
(CRMWA, n.d.). The Ogallala aquifer, another High Plains of Texas water source, on
5
average, has been dropping at a rate of approximately one foot per year. White River
Lake, which supplies water to four smaller communities on the Southern High Plains and
Rolling Plains of Texas, has also been suffering from low inflow and the water level is
seriously low. At the end of 2005, the water depth in White River Lake was reported at
11 feet (the maximum depth is 65 feet) and capacity was only at 19% (TPWD, 2005;
Rogers, 2006). In contrast, the statewide average reservoir capacity was at 90%, above
the average for that time of year (TWDB, 2005).
In mid January 2006, the Governor of Texas declared a statewide drought
disaster. The Dallas/Ft. Worth area, including central and south Texas areas were in an
extreme drought. The Southern High Plains was not excluded, as the National Weather
Service (mid-January 2006) had not recorded measurable precipitation in Lubbock for a
record setting 98 days (Blackburn, 2006; Bradley, 2006). The drought conditions were
not relieved, as only a trace of moisture was recorded then. The last time measurable
rainfall (at least a tenth on an inch) was recorded in the SHP region was in October 2005.
With few alternatives to augment the water supply in the region and because of
the limited alternatives, the region will in all likelihood have to consider more extensive
use of conservation practices to reduce the consumption of water. Water conservation
measures include not only the consumption of smaller amounts of water, but also include
a more efficient use of available water. Any water that is conserved or not used today will
be available for use in the future.
6
Nature of the Problem
With record low inflows into Lake Meredith and White River Lake plus the
steady decline of the Ogallala aquifer, water on the Texas High Plains is becoming an
increasingly limited resource. Towns in the region may soon have to begin looking at
both the supply and demand and must search for ways to reduce consumption and/or
increase supply. Municipalities in the region have limited alternatives available to
increase supply. On the demand side, residents cannot continue consuming the large
amounts of water as they have used historically. Municipalities will have to look at
strategies to encourage a more efficient use of the existing water supply, and consider
conservation measures that limit use and/or "extend" the supply.
Purpose of the Study
The purpose of this dissertation was to gain an understanding of perceptions of
residents on the Texas Southern High Plains concerning the limited water supply and to
determine their attitudes toward any future water conservation programs that may be
necessary because of limited supplies. Research focused solely on towns located in the
Southern High Plains and Rolling Plains region that are supplied by the Ogallala aquifer,
White River Lake and CRMWA. Because they are supplied by CRMWA, Lubbock and
Slaton both have a fairly "consistent" year round supply of water. Lubbock also
supplements its municipal supply with groundwater during high demand. Other towns
included in this study are Abernathy and Littlefield, both of which are dependent solely
upon groundwater (and not a member of CRMWA). Crosbyton and Post are supplied
7
water primarily from White River Lake by White River Municipal Water District
(WRMWD). (see Figure C-2, map of region, p.246). Incorporating area towns in the
study that are dependent on groundwater, a dwindling surface water supply or a
combination of the two (both surface water and groundwater), a better representation of
the Southern High Plains residents’ attitudes concerning our limited water supply and
conservation practices can be obtained. It is also believed residents who are dependent
solely on groundwater (Littlefield and Abernathy) and those in towns supplied water
from White River Lake (Crosbyton and Post) may have a different attitude concerning
water and water conservation than those residents supplied water from CRMWA
(Lubbock and Slaton). Lubbock and Slaton may consider their water supply to be a more
dependable resource, compared to towns that rely solely on groundwater or White River
Lake, which may be seen as less dependable and less sustainable supplies.
This study focused on both the residential consumers of water and the city
officials whose charge it is to supply the water to residents. Attitudes of consumers were
surveyed to portray 1) perceptions toward the regional water supply, 2) attitudes toward
water conservation measures already practiced and/or that may be necessary in the future,
3) what incentives (if any) it would take for a consumer behavioral change in case of
shortage and some form of rationing were necessary. In addition, municipal water
suppliers were contacted to ascertain their perceptions of the water situation of their
communities and the region. This study focused solely on the residential consumers of
water and the municipal suppliers of that water. The agricultural industry has established
and successful conservation programs already in place. Industrial and commercial use of
8
water in the Southern High Plains area would possibly be the subject of an entirely
independent study at a future date.
Currently, municipal water conservation programs on the Southern High Plains
area are either non-existent or limited to voluntary practices. The City of Lubbock and
the High Plains Underground Water Conservation District (HPWD) are engaged in public
awareness campaigns stressing the importance for all citizens of the area to conserve
water (Water Utilities, 2000; Lubbock Power & Light, 2000). The City of Lubbock has
asked residents to voluntarily limit water use and have passed conservation ordinances (to
be discussed below) (Fuquay, 2003d).
Questions
Certain questions come to light in this study, including some related to the fact
that only certain cities are supplied by CRMWA. Does that give those municipalities and
water consumers a greater sense of security of their water supply versus those cities not
supplied by CRMWA? Will there be any change in quality of the groundwater as the
Ogallala aquifer is drawn down versus the quality of the surface water being supplied
from Lake Meredith or White River Lake? As the Ogallala aquifer continues to drop, cost
to pump the groundwater to the surface will continue to increase. How will the cost of
pumping groundwater to the surface compare to the cost of constructing another surface
water reservoir in the very near future? If the current low cost of groundwater were to
increase, how much would it have to increase to inhibit dependence upon the limited
groundwater supply and ultimately decrease usage of the resource? What will be the
9
future impacts to the groundwater resource when one considers agriculture producers,
who rely solely on groundwater for irrigation needs versus the surrounding towns that
rely on groundwater for municipal purposes? Will there be competition between the
agriculture producer and municipalities for the limited groundwater resource? Will one
"win out" over the other or will both suffer because of the loss of the resource?
Obviously, not all these questions or problems can be answered in this study, but they are
issues that will have to be addressed at some point in the near future by inhabitants of the
Southern High Plains region. All of the above issues are the reason water conservation is
so important to the region now. Residents have to be aware of the current and future
issues concerning the water supply, have to be informed about the severity of the
situation and may possibly be forced to accept conservation practices (willingly or not).
Background of the Southern High Plains Region
Study Area
This study includes six communities located in Crosby, Garza, Lamb, Lubbock
and Hale counties of Texas. Specifically, the towns of Lubbock, Slaton, Abernathy,
Littlefield, Crosbyton and Post are studied (see map, Figure C-1, p. 245). The five
counties in the study area encompass 4,700 square miles and the population of the five
county study area, according to the 2000 Census is 306,000 (U. S. Census Bureau, f).
The Great Plains is a vast region, extending from Canada as far south as Texas.
The largest section of the Great Plains, known as the High Plains, is located east of and in
10
the rain shadow of the Rocky Mountains. The High Plains region stretches from southern
Nebraska into northwest Texas, with the southernmost portion being commonly called
the Southern High Plains. Specifically, this study has concentrated on towns located on
the Llano Estacado, a subregion of the Southern High Plains. The Llano Estacado is a
plateau bounded on the west by the Pecos River Valley, to the north by the Canadian
River in the Texas Panhandle and to the east and south by the Caprock Escarpment.
Perched atop the Southern High Plains, the Llano Estacado is a high, flat, treeless plain.
As one drops off the Caprock escarpment to the east and southeast, the region transitions
from the Llano Estacado into the Rolling Plains. The terrain changes to a mix of rolling
hills and flat areas with grasses, junipers, mesquites and oaks. All counties in the study
area, with the exception of portions of Crosby and Garza County, are located on the
Llano Estacado (and on the Southern High Plains). Those portions of Crosby and Garza
Counties not located on the Llano Estacado are located in the Rolling Plains region
(Texas Almanac: 2004-2005, 2004). In this study, the term Southern High Plains (SHP)
will be used throughout to denote the entire five county study area, including those areas
on the Llano Estacado and those areas just off the Llano Estacado in the Rolling Plains
region.
As mentioned above, the SHP and the Llano Estacado are located in the rain
shadow of the Rocky Mountains. The SHP region has characteristically low rainfall, and
is an area known for high winds and a long growing season. The study area climate is
semi-arid, with annual rainfall averaging from 18.7 inches in Lamb and Lubbock
Counties to 22.95 inches in Crosby County. As one travels east from the Llano Estacado,
11
annual rainfall increases. On average, 80 to 90 percent of rainfall occurs from May to
October in the study area counties (Texas Almanac: 2006-2007, 2006; Brooks & Emel,
2000).
Study Area Towns
Lubbock, the largest city in the region, is the wholesale and retail trade center for
a fifty county area on the SHP, the Rolling Plains of Texas and eastern New Mexico.
Lubbock is also the area's major education center with Texas Tech University, a major
employer in Lubbock. Lubbock Christian University, South Plains College and Wayland
Baptist University also have branches in Lubbock. Lubbock also houses the largest
medical community in this portion of the state.
Abernathy, the second smallest town in the study, is located 15 minutes north of
Lubbock on Interstate 27. Crosbyton is the county seat of Crosby County. It is located
approximately thirty minutes east of Lubbock and has the smallest population of all
towns in the study. The economies in both Abernathy and Crosbyton are largely
agribusiness. Littlefield is the county seat of Lamb County and is located approximately
thirty-five minutes northeast of Lubbock. Littlefield has the second largest population of
all towns in the study. The economy is based on agriculture, manufacturing, textiles and
cattle feedlots. Post is located forty minutes southeast of Lubbock, is located just off the
Caprock Escarpment in the Rolling Plains region and is the county seat of Garza County.
The Post area is dependent on the oil and gas industry, agriculture, ranching, tourism and
12
a prison. Slaton is located 15 minutes from Lubbock in southeastern Lubbock County. It's
economy is based on agribusiness, manufacturing and the railroad.
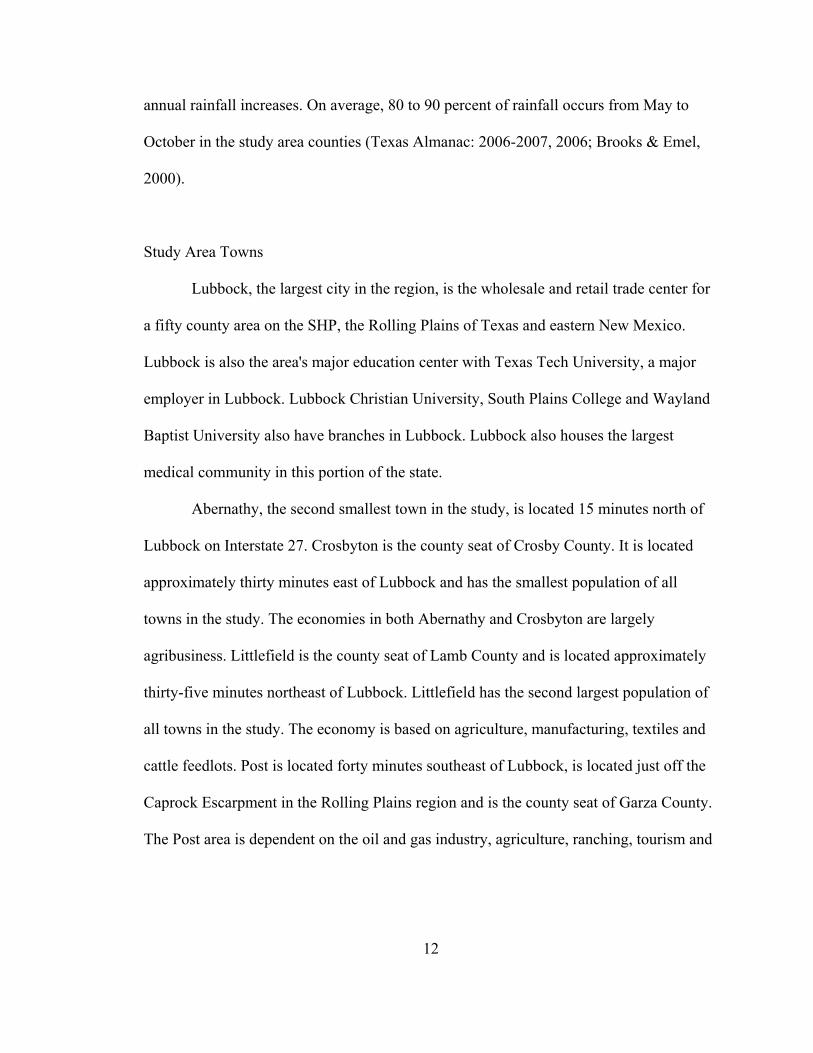
Table 1.1 Population of the Study Area City 2000 Population Water Sources
Lubbock 199,564 CRMWA
Littlefield 6,507 Groundwater
Slaton 6,109 CRMWA
Post 3,708 White River Lake/ Groundwater/Slaton
Abernathy 2,839 Groundwater
Crosbyton 1,874 White River Lake/ Groundwater
Population Source: U.S. Census Bureau, e
Surface Water on the Southern High Plains
The study area depends on both surface and ground water to meet current
demand. Surface water stored in area reservoirs is supplied by inflow from sporadic
rainfall in the area. Several man-made reservoirs are located within the study area,
including (see Figure C-2, p.246):
Lake Meredith is located on the Canadian River, was built by the Bureau of
Reclamation and completed in 1967. The CRMWA is charged with the management and
distribution of the water to 11 member cities on the SHP and Texas Panhandle. Those
cities include Pampa, Borger, Amarillo, Plainview, Lubbock, Levelland, Slaton,
Brownfield, Tahoka, O’Donnell, and Lamesa. The water is transferred across four major
13
watersheds on the High Plains, including the Canadian River, the Red River, the Brazos
and the Colorado River basins. (Templer and Urban, 1995; McKinney, 2002).
Lake Alan Henry is located in Garza County on the South Fork of the Double
Mountain Fork of the Brazos River. The City of Lubbock contracted with the Brazos
River Authority to build, maintain and manage the lake after completion. Lubbock has
now taken over the management of the lake. The reservoir covers approximately 2,900
acres and has a storage capacity of about 116,000 acre-feet when completely full. Before
being able to use any of Lake Alan Henry water, a 55-mile pipeline will have to be built,
the water from the lake will have to be lifted some 1,000 feet in elevation and a new
storage and treatment facility will have to be constructed (Templer, 2002; Templer and
Urban, 1994). In early 2003, the City of Lubbock stated hopes are the water from Lake
Alan Henry will not be needed for thirty years or so. In the meantime, the City of
Lubbock has developed certain areas around Lake Alan Henry for recreational purposes
including fishing, parks and camping areas, hiking, game hunting and public access
(Short, 2003). Recently, some talk has surfaced about possibly selling water to several
towns near Lake Alan Henry. Justiceburg, Clairemont, Girard, Jayton and Post have
expressed interest in purchasing Lake Alan Henry water (Fuquay, 2002a; Fuquay,
2003a). A water district has been formed in the area of Alan Henry, and the Lubbock City
Council is currently in the “discussion phase” of deciding whether to sell water to towns
in the near vicinity of the lake (Diane Selby-Personal communication).
White River Lake is located on the Salt Fork of the Brazos River, covers
approximately 1,800 acres and supplies water to Crosbyton, Post, Spur and Ralls. The
14
lake level has dropped over the past several years, causing concern by those cities
supplied by White River Lake. The four towns have been forced to search for alternate
water sources. As of April 2003, the National Weather Service in Lubbock, Texas
reported that White River Lake was at 17 per cent capacity. In May 2004, the
conservation capacity had risen to only 22% (National Weather Service, n.d.(a)) and by
May 2005, it was at 26% and down to 19% by February 2006 (National Weather Service,
n.d.(b); Rogers, 2006).
Buffalo Springs Lake is located southeast of the City of Lubbock and is on the
Double Mountain Fork of the Brazos River. The lake covers 200 acres. The lake is for
recreational purposes only, as the water is not used for a potable water supply. A housing
development also surrounds the lake (Buffalo Springs Lake, n.d.).
Groundwater on the Southern High Plains
The Ogallala aquifer underlies the study area. In fact, the Ogallala is the largest
aquifer in the United States and extends into eight Great Plains states. Large portions are
found in Nebraska, Kansas, Oklahoma and Texas. Smaller areas are found in South
Dakota, Wyoming, Colorado and New Mexico. The water, it is theorized, was deposited
some 10 million years ago. Estimates from 1990 showed the Ogallala contained
approximately 3.3 billion acre-feet of water (in the entire eight states collectively). It is
estimated Texas alone has approximately 12% of the water stored in the Ogallala or about
400 million acre-feet. In Texas, the Ogallala underlies approximately 36,000 square
miles. The water in the underground formation is reported to move at only 100 to 150
15
feet per year in the Panhandle of Texas (HPWD, n.d.). The Ogallala aquifer is considered
non-renewable, as natural recharge is minimal. Studies have estimated recharge to the
Ogallala at 3 inches per year (Llano Estacado Regional Water Planning Group, 2001). In
essence, the Ogallala aquifer is being mined, meaning water is being withdrawn at a rate
exponentially faster than recharge. It is believed the Ogallala aquifer does not contribute
baseflow to the Canadian River or impact any surface water appreciably nor does the
Canadian River contribute substantial recharge to the Ogallala. In other words, there does
not appear to be any interconnectedness between the Ogallala aquifer and any surface
water systems in the Southern High Plains area. Each system apparently acts
independently of the other (Templer & Urban, 1997)
Irrigation for farming takes 90 to 95% of groundwater from the Ogallala (HPWD,
n.d.). The HPWD monitors the aquifer water level on a yearly basis. In the High Plains
region, the Ogallala groundwater table dropped 1.14 feet in the year 2000 and dropped
0.78 of a foot in 2001. In the previous ten years, the Ogallala aquifer dropped over 12 feet
("Depth to Water…," 2002). In the 1950’s, the Ogallala aquifer on the SHP of Texas
dropped approximately 40 feet, and in Hale, Lubbock and Floyd counties, it dropped as
much as 100 feet between 1937 and 1959. Green (1973, p.167) explains the early Texas
SHP farmers who utilized Ogallala water for irrigation believed the Ogallala aquifer was
an "inexhaustible source," a belief most held even into the 1950's. Opie (1993, p. 163)
also describes early beliefs about the Ogallala aquifer as a "...grand underground river
that swept down from the snowfields of the Rocky Mountains...."
16
Saturated thickness of the Ogallala ranges from 500 to 600 feet in the far northern
Panhandle of Texas (north of the Canadian River) to less than 100 feet in other areas. In
some localized areas south of the Canadian River, the thickness nears zero (Williams and
Satterwhite, 1998). The Texas Department of Water Resources predicts increased
shortages of groundwater from the Ogallala for future irrigation needs on the High Plains
of Texas. “Unless an effective conservation program is implemented, it is estimated that
the irrigated acreage on the High Plains of Texas will be decreased by slightly more than
one-half of the present acreage by 2030.” (Ryder, 1996, Internet).
Another threat to the Ogallala aquifer is looming in the northern Panhandle of
Texas and specifically in the Roberts County area. Several groups have joined forces to
attempt to market the groundwater from under their land to distant cities including San
Antonio, Dallas, Ft. Worth and El Paso. Various groups have several high production
permits that allow them to pump upwards of one acre-foot of groundwater per acre of
land owned and/or leased or groundwater rights owned and/or leased per year. The goal
of TWDB is to retain 50% of the groundwater in the Ogallala aquifer (as of 1998) by the
year 2050, and concerns are the goal (50% remaining by 2050) will not be met if all
groups owning groundwater rights in the area start pumping at the same time (Pumphrey,
2002).
If groundwater from the Ogallala aquifer is depleted as the Department of Water
Resources predicts, cities on the SHP that depend on groundwater for municipal supplies
are soon going to have to look for alternative water sources to continue to meet present
demand without considering future needs. Both surface and groundwater are a limited
17
resource now. It is obvious residents on the SHP of Texas along with the agricultural
industry and municipalities must look at conserving water now and not wait until they are
forced to further curtail usage, ration its use or realize the water is gone. A municipal
conservation program will allow smaller amounts to be used more efficiently, hopefully
saving that water for future use. The agricultural industry will also have to look at further
conservation strategies to curtail usage.
Texas Surface Water Law
The state of Texas regulates all of the surface water in the state. Texas Water
Code states that a permit is required if the water is used for any other purpose than for
livestock or domestic uses, and usage without a permit is punishable by a penalty of up to
$5,000 per day. The Water Code also stipulates that a person may not store more than
200 acre-feet of water without a permit (Texas Statutes Online: Sections 11.082, 11.0842,
11.142).
Texas Groundwater Law
Groundwater is regulated by the "rule of capture" or the "absolute ownership"
rule. The rule of capture allows the landowner to drill a water well on her/his land and
capture or claim as much water as she/he chooses, as long as there is no waste. The rule
of capture was established by the landmark case Houston and T. C. Railway v. East
(1904). This decision by the Texas Supreme Court allowed the landowner the right to
pump an infinite amount of groundwater without regard to the effect it may have on
18
neighboring wells. (Todd, 1992; McCain, 2001). The rule of capture has been challenged
many times in the past one hundred years, but in all cases, the courts have upheld it. The
last unsuccessful challenge was in 1999 (Sipriano et al., 1999). In conjunction with the
rule of capture, groundwater conservation districts (GCD) may regulate groundwater by
"...statutory powers to make and enforce rules for conserving, preserving, protecting,
recharging, and preventing waste of groundwater." (Templer and Pumphrey, 2001, p.1).
The GCD issues permits, regulates well spacing, sets guidelines on the withdrawal of
groundwater, sets and oversees the construction standards of wells (McCain, 2001; Opie,
1993). Most importantly, the GCD equates to local management of water. In the state of
Texas, 88 groundwater conservation districts have been established and they manage
approximately 90 per cent of the groundwater in the state (Kaiser, 2004.).
State of Texas Water Plan
According to the Texas Water Development Board in the State Water Plan of
2002, the agency reiterates that water is a "…finite resource that requires careful and
proactive management…." (TWDB, 2002, p. 13). In the Plan, only eight new major
reservoirs (with 5,000 acre/feet storage capacity) are planned in the entire state of Texas
by 2050. The State Water Plan (TWDB, 2002, p. 7) calls for water conservation as a
"critical element" and the preferred method in an attempt to meet future needs in the
state. Included in the plan are conservation measures recommended to assist in dropping
the gallon per capita per day (gpcd) use. According to the plan, one major element is
more efficient plumbing fixtures (a code requirement). Other strategies recommended are
19
increased educational programs to inform the consuming public about conservation
measures, water suppliers establishing water conservation measures for consumers,
graywater reuse, and rainwater harvesting among others to encourage a more efficient
and lower use of a limited resource (TWDB, 2002).
The State Water Plan for 2002 was a compilation of sixteen regional water plans
for the entire state of Texas by TWDB. The Llano Estacado Regional Water Planning
Group (LERWPG) was given the authority to develop a regional water plan for the next
fifty years for Region O, a twenty-one county area on the SHP. In the Region O plan,
short-term strategies call for more groundwater development, precipitation enhancement,
brush control, desalination, reuse of wastewater, municipal conservation, irrigation
conservation and farm water conservation measures and the development of more
drought tolerant crops. Long-term plans call for more importation of water to the area,
reuse of wastewater for municipal supply and the capture and use of stormwater. The
LERWPG states that municipal water conservation should be implemented to reduce
residents' gpcd usage but should not "…adversely affect…" the quality of life of the
residents of the region (LERWPG, 2001, p. ES-22). Also mentioned as an important
component in the regional plan was the emphasis on municipal water conservation
conveyed through education and public information programs in schools, in the media
and through the water supplier (LERWPG, 2001).
20
Recent Regional Water Shortages
Across the state of Texas, 352 water systems implemented some form of water
conservation or rationing in 1996. In 1998, that number was down to 317. In 2000, 159
water systems implemented some form of conservation or rationing of water. Most
restrictions were in summer, when the demand and the temperature were the highest in
towns relying upon unpredictable and spotty rainfall. It was reported that reservoir levels
across the state, in June 2000, were at approximately 80% of capacity. ("Water Rationing
on Rise in State", 2000).
One of the more notable water shortages in the West Texas area occurred in the
year 2000. Throckmorton, Texas, at that time had a population of 1,000, and located
approximately 60 miles north of Abilene. In February 2000, Throckmorton County was
declared a drought disaster area, and in July of the same year, the town was faced with
running completely out of water within 60 days (Easton, 2000a; Easton, 2000b). During
the spring of that year, Throckmorton made an agreement with Graham to tap into their
supply. At the time, Throckmorton Lake was at 35% of capacity. A pipeline was
constructed to connect Throckmorton with Graham’s water treatment plant in September
2000 (Easton, 2000b). By November 2000, Lake Throckmorton was down even lower
than previously during early summer, even though some rain had fallen. At that particular
time, the area was reported to be 10 inches below the annual average rainfall total
(Easton, 2000c).
Runoff from rainfall fills the reservoirs that many towns on the SHP and in the
Rolling Plains region depend on for their municipal water supply, as with the
21
Throckmorton example. Whether it rains or not, people continue consuming water. If an
area does not receive sufficient rainfall to maintain the water level in a town's reservoir,
the water level will continue to drop. In the case of Throckmorton, rainfall was far below
average and they faced the proposition of running completely out of water within a very
short time. Luckily, Throckmorton was able to rely on an alternate water supply until
conditions improved, an alternative some municipalities may not have.
It is for this reason that water conservation is important for every municipality
and all communities, regardless of size, should consider its implementation. Rainfall is
neither dependable nor predictable, and amounts can vary dramatically from year to year.
Historical Background of the Southern High Plains of Texas
According to the Spaniards in Coronado's time (1540's), the High Plains of Texas,
which includes both the northern panhandle of Texas and the Southern High Plains, was a
treeless and flat expanse with very level ground, with no landmarks to guide the men.
The Spaniards were constantly getting lost, and would have to mark the trail with dung to
find their way (Webb, 1931). With only a sea of grass as far as one could see and a
shortage of surface water, the Llano Estacado was given almost a human quality as it
"...almost seemed to reject man's presence." (Morris, 1997, p. 28). In 1852, Randolph
Marcy, U. S. Army captain, led an expedition across the Canadian River and Red River
areas of the northern panhandle of Texas. As Captain Marcy described the region, even
the Indians and animals would give the area a wide berth, except for just a few areas that
22
were somewhat hospitable to man and beast (The Handbook of Texas Online: Llano
Estacado).
Even up until the 1880's, the Texas High Plains region was mostly "untouched."
The initial comment of a first time visitor to the Texas High Plains in the early 1880's
was that one could plow a straight line for two hundred miles without any interruptions.
The region alone was a "…barrier to westward settlement…." because of the steep cliffs
that separate the level plains (the "caprock") and the rolling hills (off the "caprock"),
along with the lack of water and the Comanche (Green, 1973, p. 3). Instead of settling on
the level flat expanse of the area, early frontier people in the mid to late 1870's built
homes where there was any sign of water, i.e. near ephemeral streams and canyons. The
Texas SHP region saw the first settlers and the first cattle ranches in the 1870's and the
early 1880's along the White River in Blanco Canyon. The town of Lubbock was
established in 1891 (Green, 1973).
In the late 1880's, drought and harsh winters dealt a deadly blow to the ranchers
and caused some to leave the region. In 1887, the first railroad crossed the northern
panhandle of Texas, came as far as Plainview in 1907 and extended south to Lubbock by
1909. By the late 1880's and early 1890's, the railroads started promoting farmland in the
region. Another drought occurred in the early 1890's and forced many "new" farmers to
leave, but did not stop people from moving to the area. The farmers who survived the
1890's drought planted more drought tolerant feed for livestock and irrigated several rows
of garden crops with the windmill to survive. Due to the lack of a constant flow of water
in streams or rivers, the settlers on the High Plains of Texas were solely dependent upon
23
the sporadic rainfall the region received or depended on the windmill and it's meager
flow of water from underground (Green, 1973).
Without dependable surface water flow within the SHP region, the only source of
ample amounts of water then as well as now is from underground. The Ogallala aquifer
was "…first tapped by railroads, ranchers, and farmers. As early as 1854, a Swiss
geologist named Jules Marcou…wrote that underground water on the Llano Estacado
…may be found everywhere." (Green, 1973, p. 33). Wells were dug to a depth ranging
from 10 to 125 feet to bring water to the surface using windmills. One weakness of the
windmill was that its efficiency decreased when the depth of the well exceeded 70 to 80
feet and it quit pumping water when the wind dropped below a certain speed (Green,
1973).
By the early 1900's, the centrifugal pump was introduced. It was able to
inexpensively lift groundwater to the surface and was quickly utilized to deliver water for
irrigation in the western U.S. By 1907, a different type of pump was available, capable
of lifting larger volumes of groundwater to the surface by fairly inexpensive power.
Steam was also powering engines to pull water to the surface. By 1912, gasoline engines
were available to power pumps for lifting groundwater. In the 1930's and 1940's,
irrigation of crops with groundwater grew but at a slow pace, partly because of
technology and partly because of the price of equipment and acceptance of that
equipment by farmers of the region. From the 1940's to the 1960's, irrigation with
groundwater increased because of new technology that made irrigation profitable.
Electricity, natural gas, siphon tubes to convey the water from the ditch to the row and
24
fertilizers, just to name several new innovations, were available to the industry to
improve profits. By the 1950's, the average farm in the SHP region was fairly large and
dependent upon groundwater for irrigation (Green, 1973; Opie, 1993).
By the 1950's and 1960's, irrigation was widespread on the Texas SHP. As
mentioned in the Groundwater Section above, in the 1950's the Ogallala aquifer dropped
approximately 40 feet in certain areas in Hale County and dropped as much as 100 feet in
Lubbock and Floyd Counties between the late 1930's to the 1950's. At that time, it was
believed the supply of groundwater was inexhaustible and that one could pump water
endlessly. Even as far back as the late 1940's, the Texas legislature was looking at the
regulation of groundwater withdrawals. Also during the 1940's on the SHP, certain
groups including the Lubbock Chamber of Commerce wanted to conserve and protect the
groundwater resource. The Chamber was also calling for the establishment of
conservation districts that would regulate withdrawal. Others in the region were opposed
to the idea that groundwater withdrawals could or should be regulated. A groundwater
bill was introduced in the Texas legislature in 1947 but had enough opposition it was
defeated (Green, 1973).
Support for local control of the region's groundwater instead of control by a state
or federal agency was growing. The local conservation district approach to conservation
was seen as the "…least objectionable of the proposed conservation measures…." (Firey,
1960, p. 218). In September 1951, an election was held to vote on the formation of a
water conservation district in the High Plains area. Lubbock and Parmer counties voted to
join the district, and portions of eleven other counties also joined, including Armstrong,
25
Bailey, Castro, Cochran, Deaf Smith, Floyd, Hockley, Lamb, Lynn, Potter and Randall
counties. The new High Plains Underground Water Conservation District No. 1 (HPWD)
began operations in late 1952. Initial enforcement consisted of drilling permits for wells
pumping in excess of 100,000 gallons per day, logs for drillers, well spacing and
prevention of waste (Green, 1973).
Opposition to legislation creating water conservation districts was fairly strong.
Comments against legislation to create local groundwater rule included "…[giving]
bureaucrats…ten or not more than twelve years of unrestricted rule and most of the
farmers will be reduced to spiritless peasants just one degree above the insensible
clod…." (Green, 1973, p. 183). Further comments on the subject included "This
proposition should be met with 30-30's [rifles] and its sponsors not only driven back to
the City of Austin, but on south across San Jacinto battlefield and into the Gulf of Mexico
where they can get their fill of water." (Green, 1973, p. 183). Another comment by a SHP
resident was "All the water under my land belongs to me. No government, no association,
nobody can tell me how to use it….I don’t intend to live in a country full of Hitlerism
laws." (Opie, 1993, p. 168). This type of opposition to groundwater regulation depicts the
independent attitude of the farmers on the SHP of Texas. The farmer did not want anyone
telling him/her what to do and did not want anyone "meddling" into his/her business.
The argument that agriculture producers in the Texas SHP region were
independent and not willing to change is refuted by the new conservation technologies
that producers have adopted over the years. Water conservation is not a "new" topic
today. As early as the 1920's, flood control in the Texas Panhandle had been discussed.
26
The water conservation movement began in the northern panhandle of Texas in 1936. To
be more specific, it began in December 1936 when approximately 50 men met in
Amarillo to start the process of forming a region-wide "conservation association" (Flynn,
1999, p. 157). All attendees to the meeting in December 1936 agreed that short- and long-
term water conservation plans were important for the survival of all residents on the
Texas High Plains. On December 19, 1936, the Panhandle Water Conservation
Association (PWCA) was established and in May 1937, the Texas Legislature formally
approved the association. Thirty-two counties in northwest Texas and New Mexico were
given the control over the surface waters of the "…Red, Canadian and Brazos Rivers and
their tributaries for domestic, flood control, irrigation, power and other useful purposes;
the reclamation and irrigation of arid and semi-arid land needing irrigation and
conservation development …." (Flynn, 1999, p. 161).
The PWCA not only wanted to promote water conservation, but also wanted to
enhance the quality of life for residents living in the region and create some permanence
for families and businesses. The PWCA was also involved in soil conservation, flood
control and public education. Farmers as far back as the 1930's welcomed innovation and
improved techniques and machinery that would increase profits, but did not like anyone
telling them what to do (Flynn, 1999).
Adaptation and Change
Texas SHP agriculture producers have adapted. Agriculture producers have gone
from irrigation practices that were lowering the Ogallala aquifer anywhere from 10 to 50
27
feet per year to a current average of less than one foot per year (however, no drop is good
for sustainability of the aquifer). Reasons for the change in aquifer depletion (smaller
annual drop in the groundwater level) may include LEPA (Low Energy Precision
Application) irrigation systems, CRP (Conservation Reserve Program- taking farmland
out of production), new crop varieties that require less water, and possibly new and
improved land preparation technologies, higher cost of pumping groundwater for
irrigation and higher cost of equipment.
Irrigators today are well aware the Ogallala aquifer is declining annually, and as
the groundwater table continues to drop, producers are faced with increasing costs to
bring the water to the surface. Not only will the pumping cost increase as the aquifer
declines, but energy costs are sure to continue to increase also. It is apparent that more
efficient irrigation methods are an ever-increasingly important issue today and into the
future.
Advances in genetic engineering are available today to improve the drought
tolerance of plant species (to use less water), to improve the yields with less water use, to
increase a plant's ability to tolerate stress, and to create plant species that can better adapt
to a semi-arid climate. The application of the water to the field has also changed over the
years, from wasteful row irrigation to center pivot systems that deliver water with higher
efficiency. In some instances, twenty percent less water can be used without hurting
yields. The LEPA system applies the water near the ground and at low pressure, with less
evaporation by heat and wind. An efficiency rate of eighty percent can be achieved with
the LEPA system. Drip irrigation can be expensive but very efficient, furrow dikes and
28
many other practices have been developed to help conserve the dwindling supply of
groundwater the region possesses (Opie, 1993).
If producers can adapt and change their water consuming behavior, there is no
doubt municipal residents of the area can change their attitudes and behavior toward
water conservation and adopt methods of consumption that are more efficient. It may take
some time and money to persuade individual consumers to change behavior, but it will
mean a more sustainable water supply for agriculture and municipal supplies.
Municipal Water – The Study Area
The Texas Legislature created the Canadian River Municipal Water Authority
(CRMWA) in 1953 as a special water district with the sole purpose of providing
municipal and industrial water from Lake Meredith to eleven member cities on the South
Plains of Texas. The Canadian River Compact was the impetus for the Canadian River
Project and was an agreement between the states of New Mexico, Texas and Oklahoma.
The Compact allows Texas to store an agreed upon amount of water from the Canadian
River in Lake Meredith. In turn, each of the eleven cities has a specified annual allotment
of surface water supplied by CRMWA. As mentioned above, the water is transferred
across four major watersheds on the Panhandle and Southern High Plains, including the
Canadian River, the Red River, the Brazos and the Colorado River basins and consists of
approximately 325 miles of pipeline. Lake Meredith is located approximately 150 miles
north of Lubbock (see Figure C-2, p.246) (Templer and Urban, 1995; McKinney, 2002).
The water from Lake Meredith is of fairly low quality and contains high concentrations
29
of chlorides, sulfates and total dissolved solids. CRMWA takes the surface water and
blends it with groundwater in an attempt to improve the quality and the quantity of water
supplied to member cities (Williams and Satterwhite, 1998, Pumphrey, 2002).
Rainfall is sporadic on the SHP, meaning surface water, a supposedly renewable
resource, may be limited at certain times. Record low inflows into, and continued
withdrawals from Lake Meredith for the past several years have caused the water level to
drop to its lowest level since the dam was completed in the late 1960's. Predictions by
CRMWA in late 2003 were that if there is no significant rainfall and conservation
measures were not put in place, Lake Meredith could be unusable within two years. In
October 2003, CRMWA cut the water allocation to all member cities by 10%. As of
October 2003, the lake was approximately 40 feet below normal storage capacity, a
record low level (Fuquay, 2003b, 2003c). After almost double the average annual rainfall
for the Lubbock area in 2004, Lake Meredith still remained at 17% capacity as of January
2005, and by late January 2006 was still at only 14% capacity (National Weather Service
Forecast Office, 2004; Chandler, 2005; CRMWA, n.d.).
Abernathy and Littlefield depend solely upon groundwater for their water supply.
These cities have acquired groundwater rights to supply their municipal needs. Crosbyton
and Post get their potable water from White River Lake, located approximately 45 miles
east of Lubbock. The water level in White River Lake has dropped to seriously low levels
and both towns are looking to supplement their municipal water supply with
groundwater. As of December 2004, White River Lake was at approximately 30%
capacity and as mentioned above, at 19% in early 2006 (Rogers, 2004, 2006). Post
30
recently made an agreement to purchase surplus water from Slaton, has completed the
construction of a pipeline and began purchasing water in the fall of 2003 (Fuquay, 2002b;
Toni Chrestman-Personal communication).
On the SHP, where surface water is almost nonexistent, cities rely on either
groundwater or surface water. Up until the late 1960's, most all towns on the Texas High
Plains and SHP were dependent exclusively on groundwater for each community's
municipal water supply. When CRMWA began delivering surface water from Lake
Meredith in 1968, Lubbock and the other ten member cities began relying more on that
source of water. In addition to the water being delivered from CRMWA, Lubbock
acquired water rights to approximately 80,000 acres of groundwater in Bailey County,
starting back in the 1950's, as an emergency and/or back up to augment the supply during
peak demand. The groundwater from Bailey County is mixed with the surface water from
Lake Meredith and is distributed to residents of the City of Lubbock, in what is termed
conjunctive use of both surface water and groundwater. In the mid-1990's, CRMWA
acquired the groundwater rights to a fairly large tract of land in Roberts County and is
currently blending surface water and groundwater to improve quality and quantity of
water to all member towns (conjunctive use) (Templer & Urban, 1997). WRMWD has
also drilled water wells to serve as back up and actually switched two of the four member
cities to groundwater (away from surface water) during the summer of 2004 (Rogers,
2004).
CRMWA has acquired groundwater rights to improve the quality and quantity of
water supplied to member towns. The City of Lubbock has acquired groundwater rights
31
and pumps groundwater from Bailey County to supplement the supply from CRMWA
during high demand times and/or times of emergency. Crosbyton and Post are both in a
situation similar to Lubbock and Slaton, as WRMWD has a permit to impound and
distribute surface water from White River Lake, but has also acquired groundwater rights
and developed a wellfield to pump groundwater to supplement their surface water supply.
In other words, all study area towns on the SHP of Texas are reliant on groundwater to
varying degrees and are "competing" with the agricultural community for the dwindling
groundwater supply from the Ogallala aquifer.
At the same time, the Ogallala aquifer is being "mined," or in other words, water
is being withdrawn in larger quantities than is being recharged. The water level of the
Ogallala on the SHP has been dropping on average approximately one foot per year. In
2001, the Ogallala aquifer dropped 0.78 feet, in 2002 it dropped just over one foot and in
2003 the drop was 1.34 feet ("Depth to water…," 2002; "Depth-to-water level…," 2003;
"District water level…," 2004).
With the ongoing drought and the low water levels in Lake Meredith, the City of
Lubbock has instigated several steps to start conserving the city’s water supply. A water
advisory panel was formed to study the long-term water outlook for Lubbock (Fuquay,
2003b). The Lubbock City Council, in November 2003, also asked citizens to voluntarily
refrain from watering during daylight hours. Another conservation measure the City of
Lubbock enacted was to pass a city ordinance banning outside landscape watering
between the hours of 10 a.m. and 6 p.m., if temperatures drop below 35 degrees, and
when it is raining. The ordinance allows for a warning for a first offense and up to a $200
32
fine for repeat offenders. The ordinance went into effect May 15, 2004 (Fuquay, 2004a,
b). In January 2006, the City of Lubbock reinstated voluntary measures for city water
consumers.
As a result of lower than average storage capacities in area reservoirs, more
communities in the region are turning to more groundwater extraction to augment supply.
Removal of water from the Ogallala aquifer at rates higher than recharge and with lower
than average rainfall in recent years presents communities in the SHP region with several
policy challenges with respect to water management. Communities in the region will
soon have to confront challenges related to either reduced water consumption and/or new
methods to increase supply. Municipalities on the SHP of Texas have limited alternatives
available to increase supply. On the demand side, residents very likely cannot continue
consuming the large amounts of water as they have historically.
With few alternatives to augment the water supply in the region and because of
limited alternatives, the region will most likely have to consider region wide conservation
practices to save or postpone the consumption of water. Water conservation measures
also include a more efficient use of available water. Any water that is conserved or not
used today will be available for use in the future.
With lower than average rainfall for the past seven to eight years, lower capacity
in both Lake Meredith and White River Lake, and with a declining groundwater supply in
the Texas Southern High Plains region, the situation has helped…
…focus attention on the long-term policy challenge of managing a natural resource with meaningful availability constraints. Such circumstances mean that the debate over how best to manage the limited resources--and what that
33

means for residents of the region--within a context of drought conditions, heightened resource demands associated with population growth, and divergent user demands, will likely engage both public officials and the general public on the Southern High Plains…for both the present and the foreseeable future. (Pumphrey & Gerber, 2005, p.1)
34
CHAPTER II
REVIEW OF LITERATURE
Water Conservation- Why Is It Needed?
The meaning of water conservation remains the same whether one is looking at
the agricultural, commercial and the industrial/manufacturing sectors, or looking at the
municipal (domestic consumption) side of water usage. The definition of water
conservation includes:
• Activities designed to reduce the demand for water, improve efficiency in
use, and reduce losses and waste of water. (Beecher & Laubach, 1989)
• The wise use of water with methods ranging from more efficient practices
in the farm, home and industry to capturing water for use through water
storage or conservation projects. (Waskom & Neibauer, 2002)
• The act of only using as much water as is needed; the protection and wise
use of water. (St. Johns River Water Management District, n.d.)
The same basic idea is portrayed in each of the definitions above, that
conservation is the more efficient and wise use of water, reduced demand, using only as
much water as needed and reduction of waste and losses of water. Snodgrass and Hill
(1977, p. 46) use the terms "resource savings," "efficiency" and "sustained yield" in their
version of the definition of conservation, which can also be applied to water
conservation. Snodgrass and Hill (1977, p. 23-24) also discuss the fact that humans have
35
"...dominion over nature...." (this ideology comes originally from the Bible), and that
humans must possess the attitude of "stewardship of nature." In other words, humans
living on earth now are only stewards of the earth for future generations. Present day
inhabitants of the earth, all should practice sustainable activities and leave the earth at
least as well off or better than it was found. The day of building more and taller dams is
most likely over. The "best" locations have already been utilized for reservoir building
and water storage. It also is becoming more costly to dedicate new land for reservoir
storage, and environmentally it is not prudent to flood that land. No doubt, drought will
also continue to occur. What makes more sense now is the more efficient use of what
water we have, or stretching the developed supplies we have. The terms "efficient use"
and "stretching the supply" both contain the same idea of sustainability of the present day
water supply. The idea of efficient use is much less expensive for taxpayers and
governments that are attempting to meet the growing demand for water and is also more
environmentally prudent.
The growing demand for water is not only coming from much less efficient use
than is possible, but increased demand is also coming from double-digit population
growth in the western and southwestern United States. As mentioned in the Introduction
section, the top states in population growth (by percentage) from 1990 to 2000 include
Nevada at 66%, Arizona at 40%, Colorado at 30.6%, with Texas in eighth place at almost
23% (see Table 2.1) (U. S. Census Bureau, a). Estimates are the population in Texas will
double in the next fifty years, from approximately the current total of 21 million to almost
40 million by 2050 (Texas Water Development Board, 2002). With increased population
36
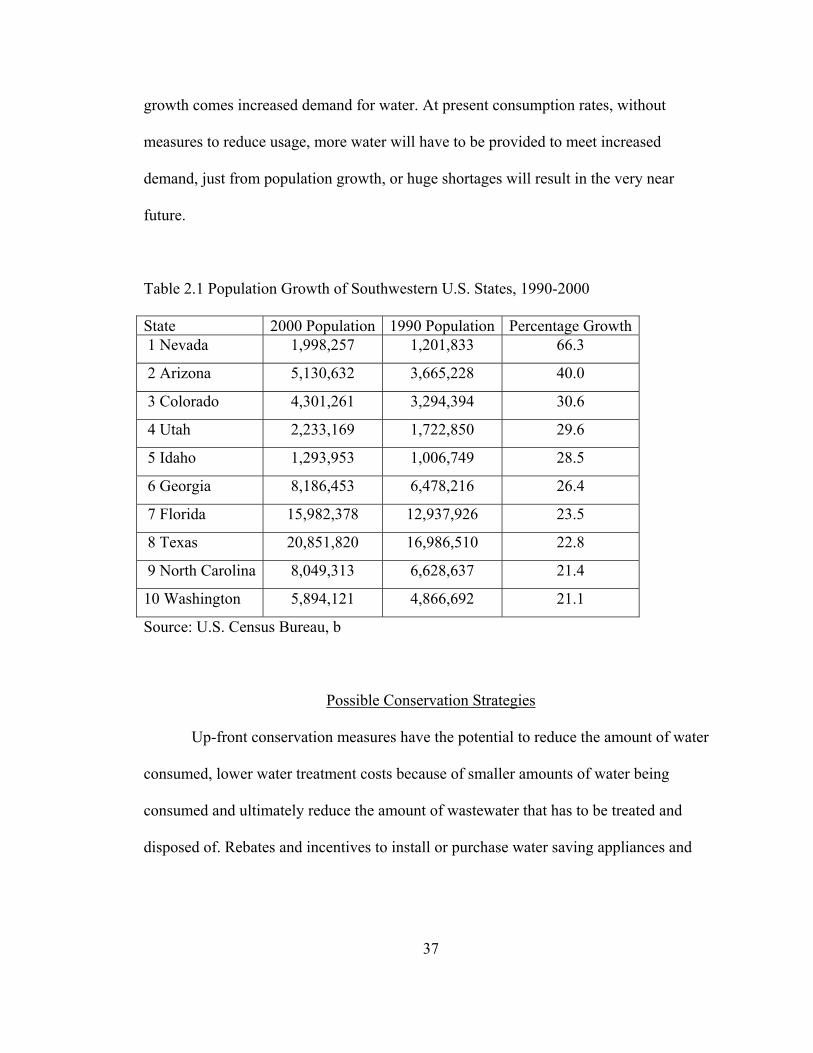
growth comes increased demand for water. At present consumption rates, without
measures to reduce usage, more water will have to be provided to meet increased
demand, just from population growth, or huge shortages will result in the very near
future.
Table 2.1 Population Growth of Southwestern U.S. States, 1990-2000 State 2000 Population 1990 Population Percentage Growth 1 Nevada 1,998,257 1,201,833 66.3
2 Arizona 5,130,632 3,665,228 40.0
3 Colorado 4,301,261 3,294,394 30.6
4 Utah 2,233,169 1,722,850 29.6
5 Idaho 1,293,953 1,006,749 28.5
6 Georgia 8,186,453 6,478,216 26.4
7 Florida 15,982,378 12,937,926 23.5
8 Texas 20,851,820 16,986,510 22.8
9 North Carolina 8,049,313 6,628,637 21.4
10 Washington 5,894,121 4,866,692 21.1
Source: U.S. Census Bureau, b
Possible Conservation Strategies
Up-front conservation measures have the potential to reduce the amount of water
consumed, lower water treatment costs because of smaller amounts of water being
consumed and ultimately reduce the amount of wastewater that has to be treated and
disposed of. Rebates and incentives to install or purchase water saving appliances and
37
fixtures, if marketed correctly, can have a positive effect on behavior of consumers.
Water conservation strategies that will be evaluated here include:
• Public education is an important issue concerning the water supply
and knowledge of water conservation programs and rebate programs.
• Discourage excessive use of water by increasing the cost per 1,000
gallons over a specific amount.
• Low gallon per flush toilets reduce the amount of water per flush
compared to older models. Towns can offer rebates for purchasing
the fixture and possibly offer rebates for installation.
• Low flow showerheads or faucet aerators reduce the amount of water
per use. Towns can offer a rebate for purchasing the fixture and
possibly offer a rebate for installation.
• Rebates can be offered for purchasing low water consuming
dishwashing and clothes washing appliances.
• Rebates or other incentives can be offered to purchase and/or install
an on-demand water heater.
• Lawn watering restrictions can be implemented, even without
drought conditions. Residential and commercial watering schedules
can be set, including the length of the watering session and times of
day, etc. Moisture sensors, temperature sensors and timers can be
required on automatic sprinkler systems.
38
• New residential and commercial construction landscape requirements
can be put in place to require more drought tolerant plants (that
require less water).
• Existing residential and commercial customers can be offered an
incentive and/or rebate to replace high water using plant species with
native (more drought tolerant) species of plants and xeriscaping.
• Rainwater harvesting should be promoted on the residential and
commercial level. Water caught from the roof of a structure can be
stored and used at a later time. This would also mean that smaller
amounts of water would enter the stormwater sewer system during
rain events.
• Graywater could be an alternate water source for golf courses and
city parks.
• Water Use Survey- Trained staff can look at water in residential,
commercial and industrial facilities to assist in reducing usage.
To be successful, a water conservation program has to have a commitment from
the policy makers, the water provider and the consuming public. Public awareness of the
problem and acceptance of the conservation program is also necessary. Promotion of the
water efficiency strategies is another important aspect of the education program (GDS
Associates, Inc., 2002). Along with commitment and public awareness and acceptance,
several steps are necessary before a program can be implemented. Goals have to be
39
identified, the water supply has to be assessed, incentives and measures have to be chosen
(see section below), a cost/benefit analysis should be done, and monitoring and
evaluation of the program are just several of the steps that are involved in implementing a
desirable and productive water conservation program (Vickers, 2001).
Goals of each municipal water conservation program may differ depending upon
each individual situation. Goals to be met in a conservation program might include a
demand side reduction or reduced water use by consumers, reducing waste by the
provider (supply side) and individual consumer (demand side), improving wastewater
management and possible recycling of wastewater and stormwater.
According to Vickers (2001, p. 6), a conservation program includes incentives and
measures, and these two terms are defined as:
...a conservation incentive increases customer awareness about the value of reducing water use. A conservation measure is the device or practice that actually reduces demand. A utility conservation program includes a strategic combination of measures and incentives.
A conservation measure, according to Vickers, saves water or improves
efficiency. A conservation incentive is a public awareness or education campaign,
changing the rate a utility charges for water, ordinances, etc. Vickers makes a good point
concerning mailing out water conservation tips to customers. The mailing campaign
(education) may increase public awareness but by itself will not conserve water. To
encourage individuals to start conserving, there has to be motivation (Vickers, 2001).
40
Possible Conservation Incentives
Public Education
Public education is in all likelihood the most important aspect of a successful
conservation program. Vickers (2001) states the success of a water conservation program
is based primarily on informing the public about the importance of water conservation for
both indoor and outdoor activities. She suggests that both adults and children be included
in the information campaign. Fiske & Weiner (1994, p. 2-1) state that the absence of
"...information about water-conserving technologies and behaviors may prevent
customers from using water efficiently." Fiske and Weiner (1994) agree with Vickers
(2001) and Flack (1982) that public awareness and education are important factors in
public acceptance and public support of a water conservation program. Hamilton (1985)
suggests with any voluntary water conservation program, an education program is
imperative and the more people that are informed about the program, the more people
that will participate. Hamilton (1985, p. 322) also reiterates the fact that "...knowledge
influences conservation: those who are most aware of their water use are most likely to
begin to conserve it." There are several methods of informing the public about a
conservation program. Methods include direct mail, news media including television,
websites, newspaper, billboards, radio, public meetings, direct contact, etc. (Whipple,
1994).
41
Water Rate Structure
Vickers (2001) states the average single-family residence uses approximately 100
gallons per capita per day (gpcd). Of that total, indoor use accounts for 69 percent. A
strategy that can promote or encourage water conservation is the pricing of water or the
water rate structure established by a provider. Vickers (2001, p. 8) refers to this as
"conservation pricing strategies." Water rates can be structured to penalize excessive use.
Flack (1982) suggests that increased rates, along with a public that is more aware that
water may be in short supply can be an incentive to conserve. The additional revenue can
also be utilized to offset the rebate costs or can be used to subsidize such programs. Flack
(1982) also recommends different rate schedules, depending on the season. By utilizing
winter usage as the basis, a surcharge can be added for summer usage (above the winter
average). Flack (1982) also cited a study in 1976 that reported the inclining block rate, a
rate that increases with increased usage, produced a 10 percent savings from residential
customers.
Western Resource Advocates (2003) reported an increase in rates did not result in
a decrease in usage by a majority of municipalities. They suggest that pricing strategies
may not have the desired effect on higher income brackets without some other type of
incentive or disincentive.
Driver (2002) cites an example of water rate pricing in Irvine Ranch California.
The water district set a minimum usage total for each property based on historic use and
several other variables. If each individual customer exceeds the base total by 50%, water
rates are doubled. If the base is exceeded up to 100%, rates are quadrupled and if the
42
customer exceeds the base by more than 100%, rates are increased eight times the normal
charge. The pricing schedule reduced water consumption by almost twenty percent in the
first two years of implementation.
Measures to Increase Water Use Efficiency-Indoors
The American Water Works Association Research Foundation reported the
average person, living in a single-family residence, used approximately 69.3 gpcd
(Vickers, 2001; Western Resource Advocates, 2003). A residence that is "conserving"
can reduce the usage to approximately 40 to 45 gpcd and a "state-of-the-art" home can
bring the gpcd down below 30 gallons. Low-flow showerheads, low gallon per flush
toilets, low water consuming dishwashers and clothes washers, faucet aerators and on-
demand hot water heaters combined with small habit changes can drastically reduce the
amount of water used in a typical residence (Western Resource Advocates, 2003). In
older homes with fixtures that were manufactured prior to 1980, the water usage figure
can increase to 60 to 80 gpcd. With just the installation of the low-flow showerhead, low
gallon-per-flush toilet and a faucet aerator, Vickers (2001) estimates a household can
reduce indoor usage of water by 35%. This is only an average and may be different for
each individual home, area and climate.
The Energy Policy Act was passed in 1992. It established a national standard for
the maximum water use rate for toilets, urinals, faucets and showerheads. Any device
manufactured after 1994 and some after 1997 have to adhere to the standard. In Texas,
43
the Water-Efficient Plumbing Standards Act was passed requiring faucets, toilets, and
showerheads to adhere to the water efficient standards (LERWPG, 2001.)
Low Gallon-per-Flush Toilets
Toilets, on average, are the number one water-using fixture in the household. New
toilets can have a maximum of 1.6 gallons per flush (gpf). The City of Austin, Texas,
since 1992, has had a rebate program allowing residents to replace the 3.5 gpf to 7 gpf
models with a new 1.6 gpf toilet. Water savings have been estimated at 1.4 million
gallons per day at a cost of $2 million to the City of Austin from 1992 to 1999. A
majority of those surveyed in Austin that have installed the new toilet are satisfied with
its performance (Vickers, 2001). The program allows Austin customers to pick up a 1.6
gpf toilet free of charge and offers a $30 rebate on the installation of that toilet (City of
Austin Green Building Program Website). Where the savings have accrued for the City of
Austin is in treating smaller amounts of water on the demand side, which means less
wastewater is entering the treatment system to be treated and disposed of on a daily basis.
(Not to again mention the smaller amount of water consumed and lower amount of
electricity consumed).
Toilet dams can be placed inside the tank of a toilet to displace a certain amount
of water. This can be considered a conservation device that does not require a behavioral
change and can save 1 to 2 gallons of water per flush (Whipple, 1994).
44
Low Flow Showerheads and Faucet Aerators
Low water use showerheads can deliver from 1.75 gallons per minute (gpm) to
2.5 gpm, depending on the water pressure. As suggested by Vickers (2001), the low-flow
showerhead is probably the most common item that is included in a conservation
program, and is often included in retrofit kits supplied by municipalities. They are easy to
install, very inexpensive, can save large volumes of water when replacing an older fixture
and if kept for some time. Vickers (2001) reports that the low-flow showerhead has a
high retention rate, that a majority of individuals who retrofit/install the device are
satisfied with it and will not replace it. The City of El Paso reported a reduction of one
billion gallons of wastewater due to the showerhead retrofit program (Western Resource
Advocates, 2003). A & N Technical Services, Inc. (2000) estimates the water savings by
installing a low flow showerhead at approximately 5.5 gpcd in a single-family residence.
Faucets in kitchens and bathrooms, on average, consume approximately 11 gpm.
This is the fourth largest water demand in the home and represents 16% of indoor use in a
single-family home. Aerators are designed to reduce water consumption by mixing air
with the water (Vickers, 2001).
Clothes and Dishwashing Machines
Clothes washing machines, on average, rank second in water used in the
household. Conventional clothes washing machine models manufactured from 1980 to
1990 used on average 50 gallons of water per load (gpl). Models manufactured after 1990
were designed to use approximately 20 percent less. Newer models use on average 25 to
45
30 gpl (Vickers, 2001). New more efficient dish washing machines can also save water.
Older models on average used 7 to 14 gpl, now they are designed to use from as low as
4.5 pgl to 7 gpl (Vickers, 2001). GDS Associates, Inc. (2002) and A & N Technical
Services, Inc. (2000) both agree that a high efficiency clothes washing machine can save,
on average, 13 gallons of water per load.
On-Demand or Tankless Hot Water Heater
A tankless or on-demand hot water heater is designed to provide hot water
instantly when needed. As soon as the hot water faucet is turned on, the heater starts
heating the water and continues as long as the faucet is on. Unlike the conventional tank-
type water heater, the tankless type does not have a pilot light that burns continuously,
and has an efficiency rating of up to 98 percent. The tankless type is rated to last a
lifetime versus 2 to 10 years for the tank-type (The Tankless Water Heater Company,
n.d.). According to A & N Technical Services, Inc. (2000), the most obvious savings is
the cold water that is standing in the pipe that has to be evacuated to get hot water, the
term used is a "..."cold start" hot water run...." (p. 2-69). The cold water is flushed out of
the pipe and is normally wasted. With the on-demand unit and depending on design, less
cold water can be standing in the pipe, thus less water is wasted.
Measures to Increase Water Use Efficiency- Outdoors
Outdoor water usage (for a single-family home in the U.S.) averages 31 gpcd or
approximately 31 percent of the total daily usage. That total will vary depending on the
46
geographic region. During summer months, a municipal water supplier can see demand
increase two to three times the usage of water during winter months (Vickers, 2001). The
typical aesthetically pleasing landscape for the average U.S. home, even in the semi-arid
southwest, is an area that includes green grasses and landscape plant varieties that require
large amounts of water.
Typical examples of outdoor water waste include over-watering, watering at
inappropriate times of the day, and allowing the water to spray onto hard surfaces such as
concrete or streets (Vickers, 2001). Techniques that conserve water or are a more
efficient method of application are briefly discussed below. Western Resource Advocates
(2003, p. 37) refers to this more efficient method of landscape maintenance as a "new
conservation ethic" that should be practiced at all times, not just in times of drought.
Grass Varieties and Water Demand
Western Resource Advocates (2003, p. 37) states that such practices as planting
and trying to maintain grass varieties that require large amounts of water are "...not
sustainable...." Bermuda requires 40 inches of water per year to survive. More sustainable
practices include planting more native or drought tolerant plant species that are adapted
to a particular region of the country. A species native to Texas is buffalo grass, which
only requires approximately 25 inches of water per year to survive (Texas Water
Development Board, 1997). Native plants can tolerate the climate conditions more than
non-native or introduced varieties and do not require as much water to maintain. By
47
incorporating drought tolerant or native species into the landscape, one can either expect
to water less or eliminate watering altogether (Vickers, 2001).
Xeriscaping
Xeriscaping is a method of reducing the excessive use of water, while maintaining
a more luxuriant and higher quality landscape. The term xeriscape was actually
originated and trademarked by Denver Water Department in 1981. Simply defined,
xeriscaping is a landscape method that conserves water while being more
environmentally friendly (Vickers, 2001). The common misconception is that xeriscaping
is cactus and rock, but in all actuality, lush, green plants are common in a xeriscaped
landscape. Vickers (2001, p. 147) uses the term "water-wise landscaping" to imply that
xeriscaping can be used in any climate. According to Western Resource Advocates
(2003), xeriscaping can be very aesthetically pleasing, in addition to providing water
savings, if the design and selection of plant species is done correctly.
Landscape Rebate Programs and Possible Subdivision Regulations
Cities have also started an incentive program (rebate) for replacing grasses that
require large amounts of water with more drought resistant species of plants. El Paso has
offered $1.00 per square foot for replacing existing grass varieties with low water
consuming species. Estimates are the City of El Paso has saved approximately 20 gallons
of water per square foot replaced (Driver, 2002).
48
Xeriscaping or replacing high water consuming plant species with more drought
tolerant species can be promoted or specified in the deed restrictions of new subdivisions
or can be included in a citywide ordinance. A program to encourage the replacement of
high water consuming plant varieties with more drought tolerant varieties can be offered
to landowners who reside in existing residential subdivisions, and to those that own or
lease commercial or industrial property with existing landscaping. A rebate program
similar to the program in El Paso mentioned above could be offered.
Subdivision regulations, deed restrictions or city ordinances can also spell out
specific details concerning when water can be applied to outdoor landscapes (times of
day) and if necessary what days certain areas of the city can water. The length of time per
watering sessions, etc. can also be detailed.
Automatic Sprinkler Systems
If operating correctly, soil moisture sensors, rain sensors or temperature sensors
installed to control automatic irrigation equipment can save water and apply water only
when and where needed (Western Resource Advocates, 2003). Vickers (2001) notes
sprinkler systems can be very efficient, but do require maintenance to maintain peak
efficiency. The automatic timers control the time of day the water is applied and the
amount of water that is applied per watering session, thus eliminating sessions that may
waste large amounts of water, i.e. watering during the hotter, colder or windier times of
the day or just after or during a rain event.
49
Rainwater Harvesting
Many ancient cultures caught rainwater and with some, it was the only supply of
water available. As early as the 1900's and later into the 1930's and early 1940's, cisterns
and windmills were the only source of water for some in parts of Texas (Lorena
Pumphrey, Personal Communication). This ancient practice is again gaining popularity.
Single-family residences are again being designed with guttering and tanks to catch and
store rainwater in cisterns for future use. For some, it is a secondary source, for some this
water is the only source. Creative designs can incorporate the storage tank(s) into the
design of the structure. Some individuals have built the house over the cistern while
others have installed tank(s) outdoors. The design possibilities are endless and are only
limited by the extent of the imagination.
Uses of the collected rainwater can range from only watering outdoor landscapes
to using the rainwater for domestic purposes, i.e. drinking water, bathing, etc. (Texas
Water Development Board, 1997). A rainwater harvesting program that utilizes rain
barrels for households to catch small amounts of rainwater is obviously not designed to
completely stop the use of potable water for landscape needs. On the SHP, with sporadic
rainfall and a majority of it falling during May to October, storage capacity would be a
limiting factor especially for homeowners living inside the city limits of most area towns.
This type of program, if implemented on the SHP, would be supplemental to other water
sources needed for landscape purposes. By storing rainwater for use in the future, the
municipal (potable) water is conserved and that amount of rainwater captured and stored
in the rain barrels is prevented from entering the storm water drainage and wastewater
50
treatment system. Rainwater harvesting on the SHP will not be addressed further in this
study, but may well be the subject of a future research project.
Graywater Use
Graywater is defined as water that is used in the bathroom (from the shower or
tub, bathroom vanity or clothes washing machine). It is of lower quality than clean
potable water, but can be used for outdoor irrigation purposes. Water from toilets and the
kitchen, or dishwashing machine cannot be used for landscape purposes. One advantage
of using recycled or graywater is that it conserves potable water, in other words it is used
in place of the potable water in certain applications (Gelt,1993; Noah, 2002).
The municipal use of graywater for parks, golf courses, and public open spaces is
gaining in popularity. The City of El Paso, Texas has been recycling wastewater and
reusing it for landscape and industrial purposes since 1963. Recently, a portion of the
wastewater from the City of El Paso is being treated to drinking water standards and
injected into one of the aquifers (aquifer storage/recovery or ASR) that the city has been
using for municipal purposes for many years. A reported 736 million gallons of the
treated wastewater was injected into the Hueco Bolson aquifer in 2001 and El Paso is
utilizing the bolson as an "…underground reservoir to be utilized for water supply during
dry years of reduced flow in the Rio Grande." (included in Western Resource Advocates,
2003, p. 137-138, originally from El Paso Water Utility website).
51
Water Use Survey or Water Audit
A water audit or a survey can be performed on any type of facility, ranging from a
single-family residence to any size commercial or industrial facility. A trained individual
can perform the audit and the cost can range from as little as $40 to $75 or more (an
estimate that can depend on the region of the country). Education about water use and
efficiency for both indoor and outdoor practices can be a major outcome of an audit.
Other positive outcomes can include leak detection, observation of water use and/or
overuse, dissemination of information about retrofit programs and other water
conservation options (Vickers, 2001).
Financial Incentives- Rebates to Encourage Participation
Financial incentives that might be included to encourage individual participation
in water conservation programs, in addition to restructuring water rates, include rebates
and discounts on the water bill. As mentioned above, rebates can be offered to encourage
participation in a retrofit program. Discounts can be offered on the water bill for reduced
consumption or for a rebate program. Ordinances or regulations can be passed to
encourage conservation or penalize waste (Vickers, 2001).
According to Western Resource Advocates (2003), rebate and retrofit programs
are designed to recover the customer's expense in a fairly short period of time, and long-
term savings can continue to accumulate. From the supply side (the water provider), the
savings come from a long-term reduction in demand. With this reduction in demand and
52
if the savings are substantial, the supplier can postpone or avoid altogether the search for
new water supplies.
The issue of education and awareness by the water customer cannot be
emphasized enough. A well-educated customer is more likely to participate in rebate and
retrofit programs if she/he understands the situation with the water supply, why the
program is being offered in the first place and is aware of the potential savings that she/he
(the water customer) can possibly enjoy (Western Resource Advocates, 2003).
Certain water conservation strategies do not require a behavioral change, others
do. For a behavioral change to become habit (or permanent), repetition of the activity is
key. Along with repetition of the activity to trigger a behavioral change, incentives and
rebates for water saving fixtures and appliances will have to be offered to entice
consumers to participate in the programs. Low flow showerheads, low gallon per flush
toilets and low water consuming clothes washers and dishwashers require relatively little
behavioral change by consumers. Once the appliance or fixture is installed, the appliance
does the conserving. This would be a long-term savings for the water provider. There are
no known rebates or financial incentive programs being offered by Lubbock or any other
towns in the study. The City of Lubbock has implemented only voluntary water
conservation measures and it may be necessary to survey Texas SHP citizens to gauge
attitudes toward what Vickers calls "conservation measures and conservation incentives"
prior to creating or implementing any conservation programs by area towns (2001, p. 6).
A baseline can be established concerning attitudes toward the possible conservation
measures and incentives mentioned above by surveying residents of the study area. Based
53
on that data, it will be much easier to create a water conservation program that is
acceptable to all by utilizing the opinions and attitudes of those residents that will have to
accept and adopt those measures.
Select Municipal Water Conservation Programs
Flack detailed several water conservation programs that were developed in the
1970's, including programs in Maryland, the San Francisco area, Denver and Virginia. In
all programs, informing the general public (education) on the measures and goals of the
water conservation programs was the first goal mentioned. Methods of disseminating
information to the public included mailing a "...water-savings handbook to all
customers...," "...a "'tips to save water' brochure," and "…[an] extensive public education
program…." (Flack, 1982, pp. 75-77).
California
Talarowski (1982) detailed the Santa Barbara County water conservation program
that was implemented because of a severe drought that plagued California in 1976-1977.
An allotment program was established and allotments were based on pre-drought usage in
1976. Single-family residences that used over 171 gallons per person per day were
required to reduce usage by 15 percent, and residences using from 115 to 171 gallons
were required to reduce usage by 10 percent. Others were allotted the 1976 amount. To
inform the water district customers of the conservation program, letters were sent to all
residents outlining each customer's water allotment, with follow-up letters sent as a
54
reminder several times during the summer. A public education campaign was established
to inform customers of techniques to save water. A "conservation kit" that had
information on methods of conserving water within the household, flow restrictors, dye to
detect toilets leaks, and equipment to reduce the water level in the toilet tank (toilet dam).
The drought was short-lived and the restrictions were lifted in February 1978. The water
district in Santa Barbara County also implemented a penalty for overuse of water
(exceeding the customer's allotment) during the drought period.
According to Talarowski (1982), to achieve success in a water conservation
program, each individual consumer has to have a fairly good knowledge about
conservation techniques, plus some sort of motivation to conserve. Motivation to
conserve may have been "encouraged" by the penalty for overuse or may have been
internally motivated by personal values or habit. After the allotment program was
suspended, consumers were surveyed regarding water practices during and after the
drought. The water district customers responded that overall most took shorter showers,
did not flush the toilet after each use, installed a showerhead water restrictor and shut the
water off while brushing teeth and shaving. They also searched for water leaks, reduced
the water level in the toilet tank, washed only full loads of clothing and dishes, reduced or
refrained from watering lawns and washing the car, and many did not use water to wash
down the driveway. As mentioned above, a majority (84%) of the respondents said they
were still practicing some conservation practice(s) as they did during the drought period.
Cook and Berrenberg (1981) make the point that the media in conjunction with
education and information programs may have had an impact on California residents
55
during the 1976-1977 drought. Pictures of empty reservoirs and messages that described
the water shortage as being critical may have instilled a sense of fear and a more urgent
need (or persuasion) to change behavior (behavior change will be discussed further
below.
San Antonio, Texas
The City of San Antonio has a water conservation plan called the Aquifer
Management Plan. The plan is activated in stages by the changing water level of the
Edwards Aquifer. The Aquifer Management Plan currently has three stages, with each
consecutive stage having more restrictive water conservation requirements. Stage One
Alert begins when the water level in the Edwards aquifer drops to 655 feet mean sea
level, and the goal is a 10 percent reduction in water usage based on winter usage (a
base). Restrictions are voluntary and include no waste of water or water running into the
gutter, restaurants to serve water only when requested, pools must have at least 25
percent of their surface area covered to reduce evaporation, watering outdoor landscape is
permitted only on designated days and washing of vehicles has restrictions. Stage Two
Alert is mandatory and begins when the water level in the aquifer drops to 648 feet. In
addition to all of the restrictions in Stage One, additional restrictions are implemented
including further residential landscape watering restrictions, golf courses and athletic
fields have restrictions on times and amounts of water that can be applied, and washing a
car is limited to only two times a month. Stage Three Alert is also mandatory and has all
restrictions from Stage Two plus tighter restrictions on watering outdoor landscapes and
56
washing automobiles. The goal of Stage Three is a 40 percent reduction in overall water
usage. (de Oliver, 1999; San Antonio Water System, n.d.).
El Paso, Texas
The City of El Paso, Texas depends on three sources for municipal water, surface
water from the Rio Grande, and groundwater from the Mesilla aquifer and Hueco Bolson.
In 2002, approximately 40 percent of the year's annual demand for water came from the
aquifers. Surface water from the Rio Grande is normally unavailable for four to five
months each year or the water quality is poor enough the water cannot be used for
municipal purposes. Single-family residences account for approximately 60 percent of
usage in El Paso (Western Resource Advocates, 2003).
El Paso Water Utilities (EPWU) has implemented several water conservation
programs and ordinances over the past ten to fifteen years. In 1991, the City passed an
ordinance that all toilets installed had to be low gallon per flush. Low flow showerheads
and water efficient faucets were also mandatory in all new construction and remodeling
retrofits. In 2000, EPWU distributed 160,000 low flow showerheads to water customers.
As a direct result of the showerhead replacement program, the City saw a reduction of
one billion gallons of wastewater, which also equates to the same savings from the
demand side. The City has also offered a rebate of up to $100 on each low gallon per
flush toilet purchased. A $200 rebate for purchasing a water efficient clothes washing
machine has been offered through El Paso Electric Company. As mentioned above, the
City has offered a rebate program for replacing higher water consuming turf and
57
landscape species with more drought tolerant plant species. EPWU estimates that
residential customers are saving approximately 150 to 180 gpcd due directly from the turf
replacement program. City ordinances specifically set standards for landscapes in new
commercial and residential building sites. Landscape watering restrictions were put in
place in 1991 and all customers of EPWU have to abide by them. Restrictions include no
watering on Mondays, watering of outdoor landscapes only three days a week, specifying
only certain days and times of day for watering, allowing only a bucket or a hose with a
shut-off installed when washing a car, and punishing water waste or runoff with a fine. In
1992, an ordinance was implemented for "large water users" that average over 10,000
gallons per day (Western Resource Advocates, 2003, p. 136). These "large water users"
were required to submit a water conservation plan and attempt to reduce consumption.
EPWU also offers both an indoor and outdoor water audit. On the supply side, EPWU
has started storing treated wastewater in Hueco Bolson, as mentioned above (Western
Resource Advocates, 2003).
Albuquerque, New Mexico
Western Resource Advocates (2003) outlined the water supply problems of the
City of Albuquerque. The city has been solely dependent on the Middle Rio Grande
Aquifer for its municipal water supply. The aquifer has had the same fate as the Ogallala
aquifer, a dramatic drop in the water level because of heavy pumping. The Middle Rio
Grande aquifer is also experiencing limited recharge compared to withdrawals, which
results in "mining" of the aquifer. The drop in the aquifer water level has also led to land
58
subsidence. The City has adopted a Water Resources Strategy, a water conservation plan
that outlines the reduced use of groundwater from the Middle Rio Grande Aquifer. It
requires use of surface water from the San Juan-Chama Diversion Project. Albuquerque
also has implemented a reuse program, using reclaimed water for landscape purposes for
schools, parks and golf courses.
Albuquerque also changed its plumbing code to comply with the 1992 federal
policy of low flush toilets, faucets and showerheads. A fairly successful rebate program
was established to retrofit the low gallon per flush toilet for water customers. For a
residential customer, a $125 credit is given for the first toilet replaced and $75 for the
second, $50 for the third and so forth. As of 2003, approximately 44,000 toilets had been
replaced. A $100 rebate is offered for the purchase of water efficient clothes washing
machines. A rebate program has been implemented to replace high water consuming
plant species with more drought tolerant species. Public education concerning both
indoor and outdoor water conservation practices has been provided customers by inserts
in the water bill. Landscape restrictions have been placed on new construction, requiring
only 20 percent of the landscape area to be planted with non-drought tolerant species.
Watering restrictions have also been implemented and penalties were put in place for
exceeding the annual "water budget" (Western Resource Advocates, 2003, p. 124).
Albuquerque estimates residential usage has been reduced 28% since the water
restrictions and ordinances were implemented. Other water ordinances Albuquerque
passed detail specific times to water outdoor landscapes and spell out specific water
runoff or water waste details. The City also offers indoor water audits. Customers that use
59
over 50,000 gallons of water each day are required to submit a water conservation plan to
detail how they plan to reduce usage. The Water Resource Strategy plans for future use of
treated wastewater and reclaimed surface water for use in industrial applications and for
landscape irrigation in parks, golf courses etc (Western Resource Advocates, 2003).
Attitudes and Perceptions of Water Conservation Programs
Perception may be defined as a mental image, an idea or even a concept about a
situation or the environment (Merriam-Webster Online Dictionary). Saarinen (1966)
described the early settlers' perception of the SHP climate as "ignorance of the facts" (p.
16). Certain individuals and professionals employed by the government had a good idea
of the climate of the SHP region, but the information was not shared with the early
settlers of the region. Saarinen described the early SHP farmers' perception of the area as
very optimistic when climatic conditions were good, or in times of plentiful rainfall.
More settlers came and more land was broken out for agricultural purposes during years
of more rainfall. When drought came, many of the farmers were forced to leave. Malin
(1967, p. 175) discussed the early settlers' idea that moving to the Great Plains and
settling in the area would "...change the climate, later that irrigation would neutralize it
and finally that man must adapt his way of life to regional differences and complexities."
It is that final stage of adaptation to the idiosyncrasies and climate that will allow
for a more sustainable way of life on the semi-arid SHP. Dwindling surface water
supplies are directly correlated not only with increased demand but also with the
lingering drought that the SHP has been experiencing over the past several years. For
60
society to survive in this region, more sustainable water usage is necessary. As mentioned
previously, developing new supplies of water is neither the preferred nor the affordable
option currently. Recommendations by TWDB (2002), consider water conservation as the
preferred method of meeting the growing demand for water in the state (instead of
developing new dams and reservoirs). Drought contingency plans are an important
element for local and state agencies and legislation should encourage public education
and promote the conservation of water with current and new technologies.
Depending on demand, drought obviously can put quite a strain on a water
supply. Measures to extend the supply or to use the supply more efficiently are required,
especially during drought. During times of extended low rainfall, municipalities can use
various methods of conservation or restrictions to extend their water supply. At the same
time, each entity should gauge perceptions and attitudes of the residents who are
experiencing the restrictions. The attitudes of residents concerning the restrictions and
perceptions regarding the severity of the drought can have an impact on the amount of
water that will actually be saved.
One in-depth study, Trauth (1989), was found that dealt specifically with attitudes
and perceptions of municipal water conservation in Texas. The only common town in that
study and this study is Post. That study did not specifically concentrate on towns on the
Llano Estacado, and did not look at towns that are supplied water by different water
sources on the SHP.
One conclusion found by Trauth (1989) was that the consuming public preferred
involvement with public hearings instead of a survey. The population surveyed did not
61
want a voluntary conservation program and preferred fines instead of names published in
the paper for those not adhering to the regulations. She also found that a conservation
plan should be developed with measures that are acceptable to the general public, and
increasing water rates for those who consume large amounts was preferred to raising
rates overall by 50% (to all customers). For a mandatory conservation program, an initial
warning prior to implementing the program was preferred.
According to Talarowski (1982) as mentioned above, a majority (84%) of the
residents in Santa Barbara who responded to a survey distributed after the drought
restrictions were lifted said they were still using certain conservation practices as they
had during the drought restrictions. The most popular response for continuing the practice
was because it had become habit, and a second response was that conservation "…makes
sense." (p. 41). The continuing fear of a water shortage had prompted some to continue to
conserve. The savings on the water bill was also a reason for continuing the conservation
practices.
Talarowski (1982) discovered that customers who adopted conservation practices
believed there was an actual shortage of water. Those who did not adopt conservation
measures did not believe there was an actual shortage. A final suggestion offered by
Talarowski was that more knowledge by customers concerning the actual water supply
was needed before a successful conservation program could be started.
The study by de Oliver (1999), outlined above, discussed attitudes and
perceptions of San Antonio residents who experienced water restrictions that transitioned
from voluntary to eventual mandatory during a drought event that lingered from 1995 to
62
1997. A survey of residents of Bexar County revealed most agreed that conservation of
water should be practiced on a continual basis and not just during warmer months when
demand is higher. A majority of respondents stated that increasing water rates or fines for
excessive water use would not encourage residents to conserve water. Data showed that
during the voluntary portion of the drought plan, water consumption did not decrease and
only when mandatory restrictions were implemented did certain areas of the city actually
use less water. Results of the San Antonio study showed certain groups conserved more
than others did. It was suggested that some residents thought others were not conserving
or were wasting more water than they were. The notion that others were not conserving
translated into "Why should I conserve if others are not conserving?" That thought can
cause reduced conservation efforts by all. Another conclusion from the de Oliver study
was that the response residents gave in a survey differed from actual practices of water
usage or water conservation practices implemented.
Corral-Verdugo et al. (2002) suggest that sacrifices need to be shared by all
members of a community to save natural resources (collectively). The authors refer to
Hardin's Tragedy of the Commons and call an exploitation of resources as an
"externality" if the decision to consume injures others and no feeling of harm is involved
(p. 527). The study looked at the perception of behavior of neighbors, or as one watched
a neighbor's consumption increase, his consumption will also increase ("...perception of
[the] externalities regarding water consumption...," p. 534). This observation parallels the
de Oliver (1999) study in San Antonio. Also in the article, Corral-Verdugo et al. (2002)
make a point that an individual "...has to feel the drive to behave in a responsible way,
63
has to have reasons for engaging in a proenvironmental action, or his/her pro-ecological
behavior has to receive a positive response." (p. 529). Another good point is that "The
higher the reason for conserving water, the higher people's effort in saving it. That means
that a water conservation campaign should seek to increase people's motivation for
saving water, and, simultaneously, should prevent the occurrence of situations inhibiting
such motivation." (Corral-Verdugo, et al., 2002, p. 534).
Voluntary versus Mandatory Restrictions
As discussed above, California experienced a severe drought in the mid to late
1970's. Californians went from unrestricted water use to mandatory restrictions during
the drought period. According to Muldavin (1981), soon after the drought restrictions
were lifted in 1978, several water utilities, including the East Bay Municipal Utility
District (EBMUD), decided that water conservation should be integrated into their plans
for meeting future water demand. After the drought restrictions were lifted, residential
gpcd started increasing and soon was back to almost the pre-drought level of
consumption.
Muldavin (1981) outlined the results of a residential survey regarding attitudes
and behaviors of customers of EBMUD in Oakland, California regarding water
conservation after the drought. Muldavin (1981, p. 3) suggested that a successful
voluntary water conservation program must "... first communicate the benefits of water
conservation, then provide people with specific information on methods to reduce water
use." Muldavin also suggested the customer has to understand the reasons why the
64
conservation measures are necessary, why cooperation among the customers is important,
and why a commitment by the utility or the water provider plus backing from the city are
needed. The water provider must emphasize the importance of the program to the
customers and must include the message that the savings are for the collective good of
the area's residents and also that the program will delay or ultimately prevent future water
supply projects, which can be translated into savings to all taxpayers.
Hamilton (1985, p. 315) calls the voluntary conservation program an "education
campaign" and stated to be successful "...the more people know about the resource in
question, the more they will be inclined to conserve it." Another point made was the
more a customer knows concerning her/his own amount of consumption, the more likely
she/he is to reduce and conserve the resource.
Syme et al. (2000, p. 540) suggests that voluntary water conservation programs or
"save-water campaigns" as the authors call them, may be "socially responsible" and may
cause "...behavioral changes that can result in long-term reductions." Syme et al. on page
542 cite several studies that were only "informational campaigns" or a voluntary program
in response to drought conditions. Reported savings ranged from 15 percent to 30 percent
in these voluntary programs. The argument can be made that voluntary programs are
usually adopted for short-term periods and are virtually impossible to enforce. Motivation
to voluntarily conserve is difficult to attain. Wang et al. (1999) suggested a continual
information program is needed if it is expected to be effective.
In 2001, the City of Roanoke, Virginia saw signs of impending municipal water
shortage due to low rainfall that had plagued the area for some time. Reaction of the city
65
was initially to inform, "...encourage and assist citizens to voluntarily conserve water.
Officials felt that in the long run such a proactive, educational approach would be more
effective than a punitive approach." (Communications Plan Helped Roanoke Survive
Drought, 2003-Internet). A public education program named "Every Drop Counts"
focused on education of the citizens of Roanoke. The program also had a goal to avoid
using coercion or fines to force water customers to comply with mandatory restrictions.
The city distributed a free water conservation kit that contained a water restricting
showerhead, a dam for the toilet tank, and a timer (five minutes) to be used when taking a
shower. By early 2002, the surface water reservoir was at approximately 50 percent
capacity. The city implemented "partial mandatory conservation measures." An
informational packet was mailed to all residents outlining the water situation that
included a reminder of various household conservation tips and the city's plan to conserve
water. By October 2002, the reservoir had fallen to only one quarter of capacity
(Communications Plan Helped Roanoke Survive Drought, 2003-Internet).
The City reported the conservation program was apparently working, as water
usage had dropped during the first half of 2002 by one million gallons a day. By January
2003, the restrictions were dropped, in part because of the concerted effort to conserve by
all residents plus heavy rain during the fall of 2003. During the entire ordeal, the City of
Roanoke stated the words "crisis," "ban" and "restriction" were never used. One
accomplishment the City of Roanoke felt was important was the fact that citizens were
knowledgeable about conservation and most supported the concept. A quote from the
Roanoke City Manager was "We kept telling people that conservation is not a quick fix
66
but a way of life." (Communications Plan Helped Roanoke Survive Drought, 2003-
Internet).
As mentioned above, the de Oliver study in 1999, stated water consumption did
not decrease when the City of San Antonio implemented voluntary conservation
measures. Only after going to mandatory restrictions did water usage decrease. The
argument can be made that voluntary programs are usually adopted just for a short-term
period and are virtually impossible to enforce. Motivation to conserve voluntarily is
difficult to establish and it is virtually impossible to penalize non-participation.
Mandatory restrictions, if handled correctly as in the case of the City of Roanoke, can
result in not only saving water, but also the citizens' attitudes and perception toward
water conservation may be positive and long lasting.
Citizen Participation in the Rulemaking Process
It has been found that there are four distinctive types of water conservation
programs including 1).Voluntary, 2). Incentives to encourage participation,
3). Mandatory measure and 4). A combination of any of the three. In a voluntary
program, it is impossible to force individuals to participate in the program. With the
incentive program, usually monetary rewards or rebates are offered to encourage
participation. With mandatory regulations, coercion is used to force participation.
Coercion may be in the form of a verbal warning, fines, increased water rates, rationing,
or watering restrictions. With all three types of conservation programs, but especially the
mandatory water conservation program where coercion may be necessary to force
67
participation, it is important the municipality or water provider have input from the
consuming public regarding the regulations (this is more in line with collective action by
the larger group, discussed in Chapter II).
According to Trauth (1989), a good understanding of the attitudes and beliefs of
the public regarding water conservation is of utmost importance, as these are the people
who will have to abide by the rules (water conservation measures) that will be enacted.
Water conservation measures that are acceptable by a majority of the affected individuals
should be the goal, especially if mandatory measures are to be enacted. By canvassing the
residents, the water provider can find out what is important to the individual or the group
and gather a better data set of characteristics and opinions of the residents from the area.
This information can be utilized to target specific groups to inform and better educate
these individuals, and ultimately may result in more overall or community wide support
for the program.
According to Steelman and Ascher (1997, p. 73), public "...deliberation and
participation [in the rulemaking process] are keystones in our democratic culture." Public
hearings and comment periods are also part of the public involvement in the rulemaking
process and the comments can be "non-binding" (Steelman & Ascher, 1997, p. 83) and in
this manner the general public can make public their opinions and attitudes to the
officials.
Brintnall (1999, p. 1) states that public involvement in the rulemaking process is
an "information gathering stage." He further argues that better policy decisions can be
made with the cooperation of the affected groups (stakeholders) and the process can be
68
"...viewed as a two-stage process of information gathering and participation." (p. 2). By
inviting the general public to participate in the rulemaking process, it is believed a better
understanding of what the public prefers can be gained. Another method of gauging
attitudes of the area residents and municipal officials is the survey.
Behavioral Change
A habit is an activity that a human being performs many times. These actions can
be performed around the house and the work place. Brushing the teeth, shaving or
washing dishes while allowing the water to run continually is an action that has been
performed by an individual so many times that it eventually becomes a habit, or an action
that does not require thought. After an action has become a habit, it is fairly independent
of belief or attitude (Ronis, et al., 1989).
Aitken et al. (1994) completed two related studies that compared individuals'
beliefs and their actions. The results of the study, (p. 147), showed that "…attitudes,
habits, and values were poorly correlated with water consumption. Thus many
households were in a dissonant situation, and the potential existed for a change in attitude
or behavior to reduce that dissonance." It was also stated when an individual's action and
their belief are incompatible with one another, an attitude change most likely will occur.
The opposite may occur, in other words, the behavior may change if the attitude is
"…central and powerful…." (Aitken et al., 1994, p. 147). An individual will attempt to
change either an attitude or an action if the dissonance has some degree of strength. The
suggestion is made that to change a behavior, feedback is an effective tool. Feedback, in
69
Study 2 by Aitken et al. (1994) was in the form of monitoring water consumption of
individuals who responded to the questionnaire distributed for Study #1 and sending them
the total amount of water consumed along with averages of similar households for
comparison.
As a result of the second study by Aitken et al. (1994), it was concluded that in
the short-term, dissonance can be modified by feedback (a behavioral change can occur).
The study concluded that by making water consumers aware of their actions, and
showing their actual consumption compared to a norm, awareness of the consequences of
their actions may have been a determining factor in the behavioral change. Corral-
Verdugo et al. (2002) agreed with the fact that education can motivate change in habits
and consumption, as they stated, "[T]hrough environmental education, it is possible to
develop savvy citizens, who have positive attitudes toward the environment and engage
in responsible behaviors." (p. 534).
De Young (1993, p. 485) states "durable behavior change" is difficult to attain.
His argument is that most conservation promotion is geared toward more short-term
behavioral change. He outlines three differing techniques to change behavior. Included
are informational programs that increase awareness about environmental issues and
eventually cause a change in behavior. A second technique is to entice or encourage
individuals to change behavior with monetary rewards, social recognition or other
inducements. A third technique is coercive in nature and as de Young (1993, p. 489)
stated: "People are known to rapidly alter their behavior while under duress." Examples
of coercion by de Young include "monetary disincentives," "social disincentives" and
70
"physical barriers to nonconserving behavior." (1993, p. 490). De Young (1993) also
stated that "material incentives" can change behavior quickly, but when the incentive is
withdrawn, the behavior may not continue (p. 497). What makes conservation behavior a
difficult matter, according to de Young (1993, p. 499), is that it (conservation behavior) is
not a highly "...visible part of life. [Its]…effects are spread thinly through time and space
reducing any sense of immediate accomplishment."
The Urban versus Rural Attitude
According to the U.S. Census Bureau, an urban area is "...territory, population,
and housing units located within urbanized areas and urban clusters." An "urban cluster"
is a new term for the 2000 Census and is defined as a "...densely settled area that has a
census population of 2,500 to 49,999." A rural area is located outside this "urban cluster"
or an urban area (U.S. Census Bureau, d).
All towns, except Lubbock and Crosbyton, are listed as urban clusters by the
Census Bureau. The population of Lubbock (listed as an urban area) is well over 49,999
and Crosbyton has a population of 1,874, which is below the minimum (U.S. Census
Bureau, g). Notwithstanding the Census Bureau definitions of urban and rural, rural in
this study is defined as a smaller incorporated community that has agriculture as the
major economic base or a population of less than 49,999. Towns in this study that will be
considered rural include Abernathy, Littlefield, Crosbyton, Post and Slaton. For this
study, only Lubbock will be considered an urban setting.
71
Both Abernathy and Slaton are located within a fifteen-minute drive from
Lubbock and are considered bedroom communities. Both towns have residents who
commute to Lubbock to work but may prefer a smaller community in which to live and
raise a family. Given that Abernathy and Slaton are considered bedroom communities,
will residents have a mindset more comparable to Lubbock residents with regard to water
and water conservation?
Is there an attitude difference between urban and rural residents concerning the
region's water supply and water conservation? According to Tremblay and Dunlap
(1978), rural residents are less likely to be concerned with environmental issues than are
those residing in an urban area. Tremblay and Dunlap (1978) also mention the fact rural
residents do not encounter the level of pollution that urbanites are exposed to and those
"...dependent upon the direct utilization of natural resources-such as farmers-are
especially unlikely to be concerned with environmental pollution." (p. 486). Their
conclusion was rural non-farmers had more concern for the environment than did those
that made their living from the land.
Tremblay and Dunlap (1978), referring to the differing view of the environment
between rural and urban residents, also stated education, income and age are not an
influence. Articles on the rural versus urban issue that are more recent have a somewhat
different view. Alm and Witt (1997) found that more money is being spent on
environmentally related issues in northern Idaho counties that are experiencing faster
growth rates, both urban and rural. They also found that more individuals (in the same
northern counties) who belong to the Democratic Party, have more education and that do
72
not earn a living from manipulation of the environment or resources extraction are in
favor of environmentalism. Overall, Idaho counties that have a high proportion of urban
residents, spent more on environmental issues than counties with a high proportion of
income derived from extraction of minerals and other resources (actual dollars spent, not
a per capita figure). Jones, Fly and Cordell (1999) agree there does not appear to be a
difference between the rural and the urban resident concerning the environment. Those
individuals with a higher education and income, the more liberal politically, the rancher,
the farmer and others involved in some type of natural resource industry seem to be more
sensitive to the environment.
Freudenburg (1991) found in western Colorado both farmers and ranchers had a
higher than average community-wide level of concern for the environment. The area was
facing the possibility of large-scale coal operations coming in and orchestrating major
environmental changes. Not surprisingly, Freudenburg also found those industries that
exploited the environment expressed less concern for environmental issues.
Even in view of the limited research done on the urban/rural issue and with the
brief discussion included above, it is believed that residents in rural areas on the SHP will
be more concerned with the limited supply of water and will be receptive to possible
water conservation measures. As mentioned above, the producers on the SHP are faced
with a declining water table, which increases the cost of bringing the water to the surface.
The most dramatic fact is the water supply is decreasing. By using highly efficient
irrigation methods, producers are attempting to conserve water in the agricultural sector.
With the realization that the region is experiencing a dwindling water supply, and the fact
73
that farming and ranching contributes most to the economy in these small towns on the
SHP, it is believed most residents in the rural areas will be receptive to municipal water
conservation measures because of a close association with agriculture and declining
water supplies.
Demographic Information
An important aspect to any study is demographic information. As demonstrated
in the de Oliver (1999) study, demographics on the census tract level were helpful in
identifying what groups or neighborhoods participated in water conservation programs
and which groups conserved the most water. Demographics utilized in the de Oliver
study included income, education, political party, ethnicity and information on home
ownership. With this information, statistical relationships were generated and studied. As
stated in the de Oliver article (1999), individuals with a higher income and more
education are more aware of the environment and more apt to participate in conservation
programs. In addition, it was been found that Democrats and liberals are generally more
environmentally aware. De Oliver did not find a strong relationship between ethnicity
and political affiliation and conservation. Successful advertising campaigns can be
developed to reach certain groups to inform them of the importance of conservation and
the conservation measures adopted by the municipality. As with the Tremblay and
Dunlap study (1978), demographics were used to identify what influences motivate
which groups to conserve. Other factors that may be important to a study may include
ethnicity, education, age, income and political affiliation.
74
Conclusion
In the early stage of the Roanoke, Virginia conservation program, city officials
thought it wise to educate the public concerning how critical the water situation was.
Second, the City chose not to use mandatory restrictions and fines, and on several
occasions sent reminders to each household about the water situation and reminders of
certain water conservation practices that were needed to conserve the dwindling supply.
Another term used during the ordeal was "acceptance" or "support" of the conservation
measures by the residents. Whether intentional or not, residents bought into the program
and, individually and collectively, they conserved water. Another important point made
by the City of Roanoke was that "...conservation is not a quick fix but a way of life."
(Communication Plan Helped Roanoke Survive Drought, 2003- Internet). In other words,
it is not a temporary behavioral change but a permanent one.
Again, according to Vickers (2000), a conservation program must include both
conservation incentives and conservation measures. A conservation incentive should
"…increase customer awareness about the value of reducing water use." and a
conservation measure "…is the device or practice that actually reduces demand."
(Vickers, 2001, p. 6). Conservation measures examined in this study will include issues
that promote general public awareness, issues that encourage acceptance of conservation
measures including both economic incentives and regulatory measures that may be
necessary by planners and policymakers because of a limited water supply. Probably the
most important factor included in this study will be the attitudes and perceptions of the
75

residents toward the conservation incentives and conservation measures that they may
have to accept and adopt.
76
CHAPTER III
THEORETICAL FRAMEWORK
The Southern High Plains region has only one water supply consisting of both
surface water and groundwater. This communal water supply the region depends on will
be treated as a common pool resource for the purposes of this study. The concept and the
definition of common pool resource will be discussed in the section below.
Common Pool Resource
A commons, according to Garrett Hardin (1968), literally means a “…pasture
open to all.” (p. 1244). The tragedy of the commons, according to Hardin, was the
exploitation of a scarce resource to the point of degradation of the environment by many
individuals (Hardin, 1968). A commons can be portrayed as almost anything that more
than one person can gain access to such as land, parks, highways, fishing grounds, forest
and water. Even though Hardin suggested “all” are permitted to access the “pasture,” that
does not mean that any and everyone can gain access, some level of exclusivity remains.
In Hardin’s Tragedy of the Commons, the villagers had only a certain amount of land that
was considered the commons and only villagers were able to access the land. Oakerson
describes a commons as a natural resource that “…can be shared by a community of
producers or consumers.”(Oakerson, 1992, p. 41). Characteristics of a common pool
resource are that the…
77
…commons can have a fixed location (like a woodlot) or it can occur as a “fugitive” resource (like fish and wildlife). The commons can be renewable (grasslands), or not (oil pools). Some cases (oceans, the atmosphere) are indivisible over large areas, so that they cannot feasibly be divided and organized as separate parcels of private property; other cases (small pastures) are organized as commons by social preference. While patterns of organization vary across continents and cultures, the key problem remains the same: how to coordinate use by numerous individuals in order to obtain an optimal rate of production or consumption overall. (Oakerson, 1992, p. 41)
According to Singh, a common pool resource (CPR) is "…an economic resource
…which is communally or collectively held/owned by an identifiable community or a
group of people and is … accessible to and jointly used by all members of the community
or group. By a resource, we mean something that is useful and valuable in the condition
in which it is found." (Singh, 1994, p. 5). Singh further explains that a common pool
natural (my emphasis) resource, "…land, water, forest, and fish…" can be defined as any
resource that can be "…accessible to and jointly used by people living in a particular
geographical location…." (Singh, 1994, p. 5-6).
In India, according to Singh (1994, pp. 185-202), a majority of the land, forests,
fisheries and water are considered CPRs. He includes several case studies on CPRs, and
details their policy-making and management techniques. One such study documents the
Mohini Water Cooperative Society (MWCS), an irrigation cooperative in the Indian state
of Gujarat. The common goal was to work toward an adequate, dependable, and equitable
supply of water for all and to involve individual farmers in the management of the
surface water and its conveyance system. The MWCS was organized to collectively
manage the canal and water for the six villages that were all part of a larger irrigation
78
project. MWCS also encouraged techniques for more efficient use of the water and to
stop waste. Membership was voluntary and any irrigator in the area was welcome to join.
Singh (1994, p.203-206) included another CPR case study involving the
management of irrigation tanks in India. Irrigation tanks are any man-made or natural
earthen structure that can catch and hold water. They have been a crucial source of
irrigation in Indian society for many centuries. The ancient zamindari and talukdari
system (landlords and feudal lords) was abolished, which allowed the ownership of the
tanks to be turned over to the State. In essence, the tanks became a CPR, as the ownership
and management was given to either the State or each individual village. These tanks are
considered to be a CPR because all farmers owning land in a prescribed area had access
to the tank and its water. More recently, these tanks are being used as supplemental
irrigation water or for a second crop with the farmers participating in the management of
the tanks and the water. The maintenance of the tanks is being neglected since they are
now considered a secondary source of water. The CPR tanks, according to Singh, are
experiencing the “tragedy of the commons,” as they are silting up, overgrown with weeds
and not being cleaned on a regular basis as in earlier times.
Ostrom (1990, p. 30-1) defines a common pool resource as a "…natural or man-
made resource system that is sufficiently large as to make it costly (but not impossible) to
exclude potential beneficiaries from obtaining benefits from its use." She also defines a
provider as someone (person or entity) that supplies the resource and a producer as those
(person or entity) that builds, maintains or manages the resource for sustainability. The
"appropriator," according to Ostrom, is the consumer of the resource. Ostrom further
79
describes a CPR as a resource that multiple users or consumers can access (jointness), but
that each "resource unit" cannot be jointly used (1990, p. 31). Ostrom defines a resource
unit as what consumers use from the "resource system" or the commons and that would
include, for example, the fishing grounds or the groundwater aquifer. In other words, a
resource unit that cannot be jointly used would include a fish caught by one fisherman
cannot be caught by anyone else. A gallon of water one landowner diverts or pumps onto
her/his land cannot be captured or consumed by anyone else. The resource originates
from one supply source for all consumers, but what one appropriator/consumer uses is
not available for another appropriator/consumer to access or use for her/his personal
consumption. As per Ostrom (1990, p. 31) "…the resource units are not jointly used, but
the resource system is subject to joint use."
Other key characteristics of a CPR include excludability, indivisibility and the
effect each member of the community can have on the resource by individual use of the
resource (subtractability). Related to excludability would be the actual management of
the resource (a CPR). Management can determine how much access each member has
and/or limit who may access the resource. Another key feature of a CPR is indivisibility
of the resource, in other words, separating what is yours from your neighbor's is difficult
to accomplish, which is the case especially for the groundwater supply on the SHP.
Subtractability, or the use of the resource by each member of the group may have an
effect on the resource as a whole and therefore will impact each individual member of the
group (Barbanell, 2001; Schlager & Blomquist, 2001).
80
Ostrom (1990) includes the California water scenario as an example of a CPR.
Several types of groundwater rights exist in California, depending on whether the
individual is a property owner or a municipal user. A correlative right to groundwater
allows a mutual right to a reasonable and "beneficial" amount of water by the overlying
landowner (p. 107). All overlying users of the groundwater share the resource equally in
times of shortage. An appropriative right can be granted by a non-overlying user, which
would include municipal uses. An appropriative rights holder is allowed to use any
surplus water after the overlying user (correlative right). A third form of California
groundwater right is called prescriptive rights and is allowed by any unauthorized use or
trespass after a five-year length of time. Pueblo rights allow a municipality the beneficial
use of surface water and/or groundwater under certain conditions. Riparian rights are also
recognized in California and pertain only to surface water (Ostrom, 1990).
Ostrom (1990) describes the Los Angeles area as a semi-arid region that not only
uses surface water from several sources, but also supplements its supply with less
expensive and higher quality groundwater from the area. With several types of water
doctrines operating throughout the state, special water districts were set up to regulate the
supply and access to water. Even with several types of water doctrines and entities that
regulate both surface and groundwater, Ostrom describes the water supply as an "open-
access CPR" (Ostrom, 1990, p. 108).
Barbanell (2001) also describes the Colorado River Basin in California as a CPR,
though he uses the term "common-property arrangement." Common-property
arrangement (CPA), according to Barbanell (2001, p. 151) "…is a form of resource
81
management in which a group of co-owners collectively decides how its individual
members should use a particular resource according to rules it establishes, promulgates,
and enforces." He also explains a resource community or the producer or provider of a
resource, is responsible for collectively setting the limits on usage of the resource and
who is able to access the resource. In Texas, the groundwater conservation district
regulates how many wells can be drilled and the spacing of those wells. Barbanell (2001,
p. 68) suggests this is a form of ownership or private property for the specific group (of
owners). He continues by explaining other factors that make a resource a common-
property arrangement, including jointness, excludability and indivisibility. Jointness
refers to the fact that more than one individual can use the resource. The resource can
only be offered to certain individuals, thus the resource can be excludable. According to
Barbanell, resources that are easily divisible are not usually considered common-property
arrangements. As is the case in California, many consumers have many uses of the water
and all have an impact on the resource (Barabnell, 2001).
Common pool resources can be owned or accessed by a variety of groups ranging
from private individuals to corporations, by many levels of government and also by
groups that are formed because of some common interest (collectively owned). With the
formation of such a group, certain rights are bestowed upon the group because of their
association. The term Ostrom uses is "communal property rights" and she explains that as
a group they manage the resource and try to watch out for the best interest of all
concerned (Ostrom, 2003).
82
Theory of Collective Action
Two or more individuals assembled in some sort of alliance or concerted effort
(common interest) can be considered a group. In theory, a group will attempt to further its
interest in the same manner as an individual who attempts to improve her/his own
personal welfare. In other words, the reason for assemblage of a group is to attempt to
further or improve the group’s common interest. The actions of this group will result in
some sort of outcome, whether negative or positive, and constitutes collective action
(Olson, 1971; Sandler, 1992). Olson (1971, p. 1) suggests
The idea that groups tend to act in support of their group interests is supposed to follow logically from this widely accepted premise of rational, self-interested behavior. In other words, if the members of some group have a common interest or objective, and if they would all be better off if that objective were achieved, it has been thought to follow logically that the individuals in that group would, if they were rational and self-interested, act to achieve that objective.
According to Olson, the reason for individuals forming a group is for some
collective benefit that the assemblage of individuals, as a group, would accomplish
whereas an individual alone could not. The group is expected to accomplish the group
goal or common or collective interest and the common or collective interest may or may
not be the same as each individual group member’s interest. It is assumed not all group
members may have the same exact personal interests or goals, but it is assumed all group
members will have a common interest. A group will not normally form without a cause,
purpose or common interest (Olson, 1971).
83
Collective Action Problems
Olson (1971) also explains it is usually not true that groups will collectively act to
further or improve the group interest. Even if all the members of the group would benefit
from the achievement of the group goal, not all members will cooperate to achieve that
group goal. Olson suggests that only if the group is fairly small or there is some sort of
coercion to entice all members to accomplish the group goal "…rational, self-interested
individuals will not act to achieve their common or group interest." (Olson, 1971, p. 2).
(Olson emphasis). Assuming the group is comprised of rational individuals, the group is
fairly large, and all members are fully aware that the action of the group will make all
members of the group better off, all individuals will not voluntarily act for the betterment
of the entire group (Olson, 1971).
As an illustration of his premise that individuals in large groups will not
voluntarily support or contribute to the betterment of the group, Olson uses the nation
state as an example, and states "…no major nation state in modern history has been able
to support itself through voluntary dues or contributions. Taxes, compulsory (Olson
emphasis) payments by definition, are needed. Indeed, as the old saying indicates, their
necessity is as certain as death." (Olson, 1971, p. 13). The main reason no nation can rely
on voluntary taxation is that all services/ benefits provided by that nation state have to be
available to all citizens. No individuals can be excluded (or it would be very expensive to
exclude certain individuals) from any and all of the services that a nation/state provides
for its citizens, as these "common or collective benefits" cannot be provided for only the
individuals that voluntarily made payments. These "common or collective benefits" are
84
also called a public good. Individuals in a group cannot be excluded from acquiring a
common, collective or a public good or benefit, even though certain individuals did not
pay for the good or benefit (Olson, 1971, p. 13-15).
As mentioned above, a group is an alliance between two or more individuals for
some common interest. It does not matter whether the group is large or small. That group
is in existence because of some collective benefit to be gained by all members. It is a
given that the individuals are members of the group for the collective benefit to be gained
by the group, and in turn each individual member of the group should benefit. According
to Olson, one drawback to a large group is "…all of the members of the group …have a
common interest in obtaining this collective benefit, [but] they have no common interest
in paying the cost of providing that collective good. Each would prefer the others pay the
entire cost, and ordinarily would get any benefit provided whether he had borne part of
the cost or not." (Olson, 1971, p. 21). Olson continues with the statement "…the larger
the group, the less it will further its common interests." (Olson, 1971, p. 36). If, in any
group whether large or small, one individual cannot be excluded and will be better off
from the benefit(s) gained by the group and that individual stops contributing to the
group, she/he is called a "free-rider." If a majority of the group members stop
contributing or "…behave in a narrow self-interested way and never cooperate…"
(Ostrom et al., 1999, p.279), these "free-riders" can cause the group benefit to deteriorate
or become nonexistent (Ostrom, 1990, p. 6).
The free-rider problem is a good example where rational individuals can make
irrational decisions. Rationally, anyone who benefits from the actions of a group should
85
continue to contribute to the group and hope that all members’ actions collectively will
continue the benefit(s). Sandler (1992, p. 3) described the collective action problem very
well in his statement "…individual rationality is not sufficient for collective rationality."
(Sandler emphasis).
In a large group (Olson (1971, p. 50) calls a very large group a "latent group," as
one individual’s contribution may not be perceivable by all members or it may not make
a noticeable difference in achieving the group goal or common interest. If an individual
does not have an incentive to contribute, one’s lack of contribution to the group goal is
not noticeable or significant, thus that individual either may stop contributing or will not
contribute at all. If in a latent group, the lack of contribution or the practice of narrow
self-interested behavior happens numerous times by many individual members, the group
goal may not be met. Some type of incentive (coercion) to "force" or "entice"
participation by all members in achieving the common goal or interest may be necessary
to continue the collective action and benefit(s) for the group (Olson, 1971, p. 44).
The Southern High Plains of Texas
To reiterate, the Southern High Plains has one supply of water, originating from
both surface water and groundwater sources. That water, regardless of source, can be
considered a common pool resource. The members of the group (the collective group or
resource community in this study) include the individual towns and their residents that
are dependent upon groundwater, White River Lake and CRMWA for their municipal
water supply. All members of the collective group are dependent upon each other and
86
each person’s individual actions as well as the group’s collective action, since all are
dependent upon the same water supply. The members of the group have a common
interest (a collective benefit)-- that is to maintain a good quality water supply for today
and into the future. Included is the maintenance of the quality of life present today in this
semi-arid climate. The collective good (public good) is a sustainable water supply for the
area. The cost of providing and sustaining that collective benefit will have to be borne by
all residents of the area. The action necessary for a sustainable water supply is water
conservation practices that all residents accept and participate in, whether voluntarily or
by mandate. Water conservation is the adoption of practices that conserve and are a more
efficient use of the limited resource. Measures will most likely have to be implemented
to "entice" or "encourage" individuals in the SHP region to adopt water conservation
practices. The tragedy of the commons for the area is the dwindling water supply, both
surface water and groundwater and no concerted effort to encourage a more efficient use
of and conservation practices of that resource. The SHP of Texas common pool resource
is in short supply. The first reason is the climate of the area is semi-arid. A second reason
for the limited water supply is the lack of any coordinating body to regulate the usage or
to actively promote and assist in educating the residents of the region about water
conservation initiatives. Olson (1970, p. 7) states that individuals alone (the term he uses
is "unorganized") cannot achieve the goal(s) that a group collectively can accomplish. If
some type of coordinating body were formed to coordinate actions of the collective
group, harm to the resource community and the individual members could possibly be
reduced and benefits could possibly be improved for all.
87
Residents of the area have not to date experienced a serious shortage of water and
take for granted that when a faucet is turned on, water will be available. Free riders are
present throughout the SHP. This free rider problem goes back to Olson’s (1971, p. 21)
idea that "…all of the members of the group…have a common interest in obtaining this
collective benefit, [but] they have no common interest in paying the cost of providing that
collective good. Each would prefer that others pay the entire cost, and ordinarily would
get any benefit provided whether he had borne part of the cost or not." The act of free-
riding (and narrow self-interested behavior) includes all the individuals in the study area
who are not practicing water conservation. The "…common interest in paying the cost of
that collective good…." (Olson, 1971, p.21) in this instance is not actually spending
money or paying the water bill and using all the water they want, but changing old habits
and methods of consuming water. In other words, the "cost," in this instance, is a
behavioral change (in consumption) and/or an attitude change toward the limited resource
versus the attitude that the supply is unlimited (apathy). The consumers of water on the
Texas SHP who are not conserving and those who will not in the near future start
practicing any type of water conservation are considered to be free-riders. The lack of
awareness concerning the status of the resource by the consuming public may be from
lack of education or attention given to the limited resource, or it may simply be from
apathy. The residents of the resource community may lack the social capital to come
together as a group. What may be causing the reluctance of residents to form an
association? Is it a lack of willingness, cooperation or trust among residents? What
happens when a large enough number of individuals have the same thought and no one
88
conserves? Consequently, a large amount of water is wasted each day because water
conservation measures are not in place and water conservation is not being practiced. If
conservation measures were in place, the amount of water that could be saved today
collectively by all residents of the region would be available for consumption some time
in the future. Therein lies the tragedy of the commons for residents on the SHP of Texas--
the common pool resource (water) is being consumed in an inefficient manner whereas
portions of it could be saved for future use if, as a group, individuals would collectively
agree on water conservation measures that would force a change in behavior and as a
resource community would actively adopt and practice water conservation for current use
and the future use of a limited resource. Olson’s idea that the actions of the group
members may be negative, not positive and will injure and not help the group’s collective
well being is evident on the SHP. Water, the area’s limited resource, is being used
collectively in a manner that is not sustainable and not in the group’s best interest.
Therein also lies the proven fact that "…individual rationality is not sufficient for
collective rationality. " (Sandler, 1992, p. 1,3).
The Texas Southern High Plains is a very distinct region of the country. Surface
water is not available in large enough quantities to be a constant, dependable or sole
supply for municipalities in the region. The SHP is also somewhat unusual in the fact that
the water supply is transferred from a distant watershed. A second source SHP residents
depend on is groundwater. Even as far back as the 1950's and 1960's, it was known the
groundwater supply was finite. Within the past several years drought has put a stress on
the region's surface water supply and without significant rainfall, Lake Meredith and
89
White River Lake may not last very far into the future. Residents have, it seems, had an
attitude that the water supply will take care of itself or have an "out of sight, out of mind"
type mentality.
This study hypothesizes that residents in the SHP region will have to be
"encouraged" to adopt water conservation practices, although the rural residents in the
smaller towns of Abernathy, Littlefield, Crosbyton and Post may be more willing to
accept and adopt conservation practices than those in Lubbock and Slaton. It is also
assumed the residents living in the smaller communities will be more willing to work
collectively as a group than will the urban dwellers to help formulate a water
conservation plan. These assumptions will be tested with the survey instrument created to
assess attitudes of both the water consumer and the water provider.
90
CHAPTER IV
RESEARCH METHODOLOGY
Introduction
The methodology chapter below describes the procedures used in gathering the
data, analysis of the data, the integration of theoretical and the empirical portions, and the
development of hypotheses for this research.
Selection of Cities
Lubbock obviously is the largest city in the area and, along with Slaton, is
supplied water by CRMWA. Abernathy and Littlefield both rely on groundwater for
municipal needs. Crosbyton and Post are supplied by WRMWD from White River Lake
and are "in transition" as both towns are being forced to seek alternate sources of water
because of the record low level of the lake. By incorporating all three water sources and
various size towns, a representative sample from the region is obtained. This will allow
for a more thorough determination of whether the differing water sources are related to
attitudes concerning how the resource will be managed now and in the future.
Research Methods- Data Acquisition
Data regarding the consumers of water in the study area were collected by means
of a phone survey completed by the Earl Survey Research Lab at Texas Tech University.
91
To insure a random sample, the survey was accomplished by using random digit dialing
(RDD), which does not exclude unlisted numbers. (Earl Survey Research Lab, 2005). The
survey of public opinion and attitudes on water policy issues was conducted in November
and December 2004. The final sample consisted of a total of 829 randomly selected
respondents from Abernathy, Crosbyton, Littlefield, Lubbock, Post, and Slaton. A
cooperation rate for the survey (completed interviews divided by completed interviews
plus refusals) was 67%. The response rate for the survey (including households where no
one was ever contacted, scheduled callbacks were never completed, etc.) was 50.5%
(Cannon, 2004). Survey respondents were free to refuse to answer any specific question
or to give a "don’t know" response to any given item. Thus, for this study, the count (sum
total) for each question included in this report may not total 829.
Representatives of the municipal water provider (in Abernathy, Crosbyton,
Littlefield, Lubbock, Post and Slaton) were asked to respond to a questionnaire sent by
mail. In all towns, the City Manager and the Director of Public Works or someone in
charge of the Water Department was chosen and asked to complete the Water Provider
survey. Accompanying the questionnaire was a cover letter explaining the importance of
the study. A follow-up personal interview was also conducted to pick up the completed
questionnaire, to meet the official, and to ask or answer any questions that may have
arisen.
92
Survey Instrument- Water Consumer
Previous studies concerning recycling attitudes/habits, water conservation
attitudes and water consumption/habits were examined prior to designing the survey
instrument questions. Oskamp et al. (1991) gauged attitudes toward household recycling
with a 4-point Likert scale and used closed-ended questions for the behavioral portion.
Moore, Murphy and Watson (1994) studied knowledge, attitudes and behavior
concerning water conservation, and utilized true/false questions, bipolar adjective scale
and a 4-point rating scale. De Young (1986), studying water conservation and recycling
attitudes, used a 5-point rating scale. Aitken et al. (1994), studying water use and
conservation, utilized a 7-point bipolar scale and a 5-point scale. Trauth (1989) studied
various cities in Texas concerning the development and enforcement of water
conservation plans and attitudes toward water conservation. She used a 5-point Likert
scale with choices ranging from Strongly Disapprove to Strongly Approve, several
closed-ended questions and questions on demographics of respondents.
The format for the survey instrument used in this study is based on a combination
of the above-mentioned approaches including several closed-ended questions, a section
that gauges attitudes on a 4-point Likert scale and demographics of respondents. The
survey instrument in the Trauth (1989) dissertation has had the strongest influence on the
design of the survey instrument for this study.
The consumer questionnaire consists of six distinct parts and is located in
Appendix A-1, p.223. The sections include consumer knowledge and concern for the
water supply; attitudes toward water conservation; attitudes of consumers regarding
93
government regulation with respect to water and water conservation as a policy issue;
current and future consumer behavior; government ideology issues and demographic
information about the respondents. With demographic data collected, it will be possible
to design a future advertising campaign to target certain groups as may be deemed
necessary by the cities and agencies that supply the water to the area residents.
Important to an area are the attitudes and opinions of the residents who will have
to accept and adopt any possible water conservation measures that may be enacted.
Crucial to the survey are questions that measure the agreement or disagreement with
issues and attitudes of the residents toward certain water supply and water conservation
measures. The consumer survey instrument includes questions dealing with knowledge of
the source of the city's water, how long the water supply will last, how important an issue
are water and water conservation to the region. Also included are questions that ask what
type of water saving (efficient) appliances and fixtures does each individual have in
her/his home, attitudes toward voluntary and mandatory conservation measures, and what
it will take for the region to have a sustainable water supply years in the future. Opinions
of consumers to such questions as installing or purchasing water efficient fixtures and
appliances, interior and exterior water use and habits such as turning off the faucet when
brushing teeth, the use of more drought tolerant plants in the landscape, etc. were also
covered in the survey.
94
Survey Instrument- Municipal Water Provider
For the Water Provider portion of the survey, officials from the cities of
Abernathy, Crosbyton, Littlefield, Lubbock, Post and Slaton were surveyed. Topics
discussed were water rates, any current water conservation programs each city may have
implemented, each city government's attitude concerning the abundance of the water
supply, and any plans each city may have had for future new sources of water. In
addition, any comments or reactions city water officials cared to offer concerning water
conservation plan, proposed or those in effect, were welcomed. The water provider
questionnaire can be found in Appendix B-1, p.234.
Reliability and Validity
For the results of this study to be of value or reliable, they must be consistently
repeatable. The instrument must be straightforward and not misunderstood by anyone.
Results that are viewed as unreliable are assumed to be invalid. Reliability can be
accomplished with a truly random sample from the total population of a study. An
instrument is deemed valid if it actually measures what it was intended to measure and
the results are consistent. A truly random sample can also improve validity. Bias can be
introduced with a low response rate (on the survey) even with a truly random sample
(Lindolf & Taylor, 2002).
To insure validity, a pre-test or a pilot study is advised. For this study, a pre-test
was conducted, with 47 residents randomly contacted by phone from Littlefield and
95
Crosbyton. Results of this pre-test did not indicate that any modifications to the survey
instrument were needed.
Data Analysis Methods
This study, as with most, deals with a sample of a population, not the entire
population. Statistical analyses are commonly utilized to help understand data, to explain
and/or to evaluate behavior, relationships or information about a population or in most
instances a sample of that population (as with this study).
Since a majority of the data in this study is nominal (the nominal level
measurement scale), the cross-tabulation method was used throughout. The Pearson's
Chi-square (χ2) test is a commonly used statistical method to test for the existence of a
relationship between two variables and to test the statistical significance of that
relationship. In the Chi-square test for independence, this hypothesis testing procedure
assumes no relationship exists between two variables (the null hypothesis). By rejecting
the null hypothesis (that no relationship exists), one is stating that a relationship does in
fact exist between the variables. Any relationship that may exist in the sample is not
attributable to chance and will apply to the entire population, not just to the sample being
tested.
Pearson's Chi-square compares the actual (observed) frequencies to the expected
frequencies, assuming no relationship exists between the two variables (the null
hypothesis). The actual (observed) frequencies originate from the data gathered in the
study and the expected frequencies are determined by some hypothetical, theoretical or
96
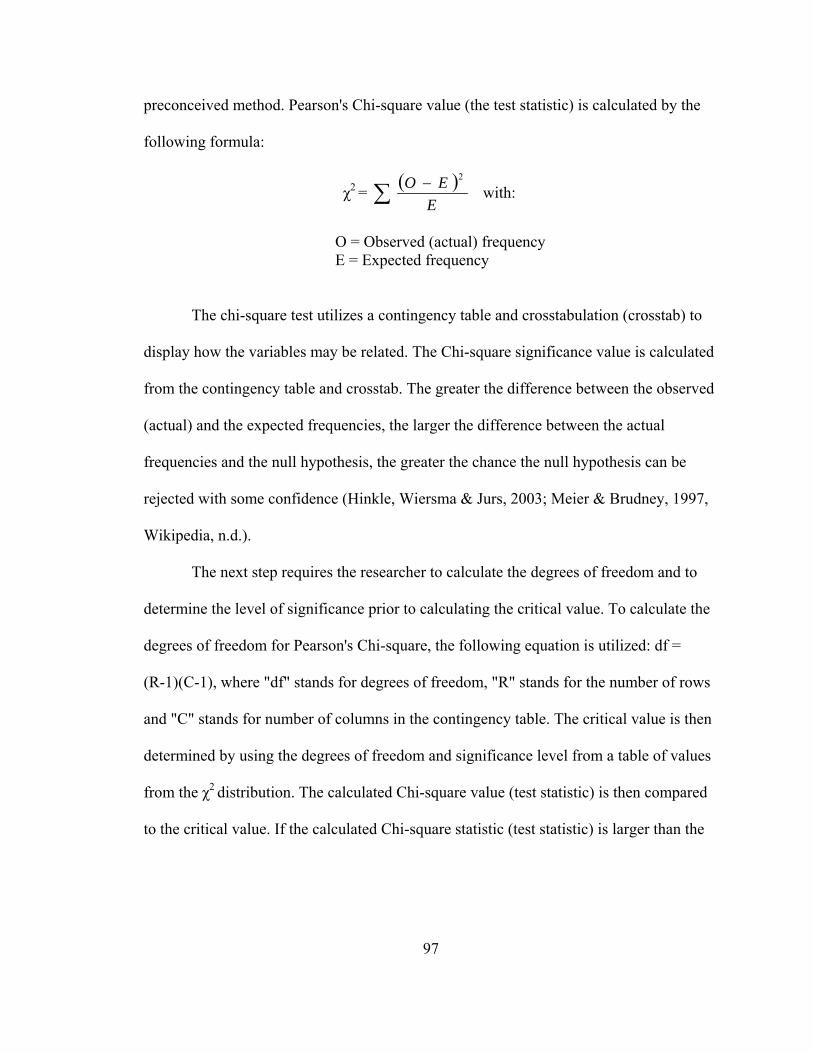
preconceived method. Pearson's Chi-square value (the test statistic) is calculated by the
following formula:
χ2 = ( )∑ −E
EO 2
with:
O = Observed (actual) frequency E = Expected frequency
The chi-square test utilizes a contingency table and crosstabulation (crosstab) to
display how the variables may be related. The Chi-square significance value is calculated
from the contingency table and crosstab. The greater the difference between the observed
(actual) and the expected frequencies, the larger the difference between the actual
frequencies and the null hypothesis, the greater the chance the null hypothesis can be
rejected with some confidence (Hinkle, Wiersma & Jurs, 2003; Meier & Brudney, 1997,
Wikipedia, n.d.).
The next step requires the researcher to calculate the degrees of freedom and to
determine the level of significance prior to calculating the critical value. To calculate the
degrees of freedom for Pearson's Chi-square, the following equation is utilized: df =
(R-1)(C-1), where "df" stands for degrees of freedom, "R" stands for the number of rows
and "C" stands for number of columns in the contingency table. The critical value is then
determined by using the degrees of freedom and significance level from a table of values
from the χ2 distribution. The calculated Chi-square value (test statistic) is then compared
to the critical value. If the calculated Chi-square statistic (test statistic) is larger than the
97
critical value, the null hypothesis is rejected, that no relationship exists, and the
alternative or research hypothesis can be accepted.
In most studies, researchers tend to agree that a significance level of .05 (a 5%
probability of error or a 95% confidence level) or smaller, indicates a statistically
significant correlation, and that particular relationship is unlikely to have occurred by
chance. The level of significance is set a priori for most studies. Statistically significant
implies there is a good chance or a certain degree of confidence that it is correct to
assume a relationship exists between two variables and that an inference can be made
from the sample to the entire population (Meier & Brudney, 1997). The level of alpha (α)
or the accepted significance level for this study was set a .05 (a 5% probability of error).
Where the Chi-square method does in fact test for the existence of a relationship,
the test lacks the ability to measure the strength of that relationship. The measure of
association that is used in conjunction with Chi-square differs, depending on whether the
variable is nominal, ordinal or interval. For nominal variables, where there is no specific
ordering or ranking, Cramer's V is used. Gamma is used with ordinal variables, and Eta is
used with a combination of interval, ordinal and nominal variables. Values for Cramer's
V, Gamma and Eta range from .00, which indicates no relationship to 1.0, which
indicates a very strong relationship between variables (Hinkle, Wiersma & Jurs, 2003;
Meier & Brudney, 1997).
The final data set contained 67% female respondents, and the actual percentage of
female residents in Lubbock, Texas in 2000 was 51.4% (U.S. Census Bureau, c). For a
more accurate representation of the actual population being studied, an adjustment for
98
this imperfect representation had to be made. In other words, weights had to be calculated
for the inconsistent variables. It is recommended that "…survey data be weighted to
reflect variations in probabilities of selection as well as differential nonresponse and other
factors which cause the sample and population distributions to differ." (Institute of
Survey Research, n.d.). With a phone survey, one requirement is that only one person per
household be interviewed, even though, in most instances, more than one person usually
lives in a household and would be eligible to be interviewed. By using this post-
stratification weight (the final weight), each respondent, in essence, is representing all
members of the household by combining the various ratios (Institute of Survey Research,
n.d.; Cannon, 2004).
The gender and household size variables were weighted in this case. The result
gave more weight to male respondents' answers and less weight to female respondents'
answers. The weight for this nonresponse was calculated by dividing the population
proportion (of the study area) by the sample proportion (actual percentage from the
sample population. The final calculated post-stratification weight for male, female and
household size was 1.16 (Cannon, 2004).
Data were analyzed using the statistical software SPSS for Windows, Version
11.5.0 (Standard Version, 2002).
Integration of Theoretical and Empirical
The status of the water resource for the purpose of this study refers to the fact the
resource may be adequate to supply needs, there may be an abundance or the resource
99
may be constrained or in limited supply. The status of the water supply on the SHP is
limited and constrained and water conservation practices may have to be introduced at
some time in the future. The level of awareness and the attitudes of the water consumers
residing in the study area concerning the status of the resource are an important aspect of
this study and can be considered a collective action problem. Miller (1989) suggests any
change in public policy has a higher probability of occurring, especially when the
residents of the resource community have been made aware of a resource problem, they
have a strong opinion concerning the resource/problem and the resource community has
agreed that action is necessary to alleviate the problem.
As suggested by Miller (1989), awareness of the resource has to be present before
residents of the resource community can form an opinion or attitude about the resource.
Without knowledge concerning the status of the resource, one may be unaware a problem
exists. Lack of knowledge may be from apathy or it may be from not being informed
about the status of the resource by the appropriate municipal authorities. Without
knowledge of the resource, no one will participate in collective action.
The process of information dissemination, or "social learning" according to Steins
and Edwards (1999, p. 251), is an effective technique of informing individuals and
communities about the status of a resource through written messages and public
meetings. Social learning has to be implemented on a community wide basis or
collectively between all stakeholders. All stakeholders have to be aware of all problems
with the resource before any policy or decision making process can take place (Steins and
Edwards, 1999; Pretty and Smith, 2004).
100
Once awareness has been established and the severity has been understood,
willingness to participate in collective action to help conserve the resource is the next
step. On an individual basis, one can decide to adopt conservation measures in the home
or office, what de Young (1986, p. 282) calls "intrinsic motivation" or some reward or
goal that is achieved because of human behavior or "…participation in an ongoing
activity." On a resource community basis, individuals can come together to form
collective groups or associations to discuss policy issues regarding the management of
the troubled resource (the common pool resource).
Only after awareness of the resource is established through the process of social
learning can the community as a whole understand the status of the resource. According
to Pretty and Smith (2004), social learning is a very necessary item in the conservation of
a resource, but alone is not enough to encourage participation in conservation behavior.
Since awareness alone is not enough to promote a behavioral change, the problem has to
be considered severe before one will believe a crisis does actually exist (Van Vugt and
Samuelson, 1999). Forsyth et al. (2004, p. 117) suggest an "…individual's actions are
generally based on their attitudes, values, or beliefs pertaining to desirable goals. So by
identifying knowledge, attitudes, and desired outcomes, behavior across situations related
to those goals can often be predicted." Van Vugt and Samuelson (1999), in a water
conservation study done during drought conditions in the United Kingdom in 1995, found
individuals were willing to limit the amount of water consumed especially when they
were informed about the drought and believed the drought was severe. Once the
individual or community becomes aware of the situation or problem and understands the
101
severity, environmentally friendly behavior is more likely to be adopted, as suggested by
Forsyth et al. (2004) and Baldassare and Katz (1992).
Anytime a resource community comes together as a group to manage a natural
resource, they are participating in a form of collective action. As previously mentioned,
the reason individuals form a group is for some collective benefit that the assemblage of
individuals, as a group would accomplish, where an individual alone could not.
Individuals who join a group for some collective action reason are participating in what
Pretty and Ward (2001, p. 210) call social capital, or "…social bonds and social
norms…." and what Putnam (1993, p. 167) calls "features of social organization." To
counter the free-rider problem in a group or resource community, certain social capital
factors have to be present for the group to be successful in achieving the collective
benefit. Initially, the willingness of a diverse array of stakeholders in a resource
community to participate in or join a group fosters cooperation by working as a single
unit or group. Knowing others in the group are willing to cooperate (reciprocity) can
create an atmosphere of trust among members and the combination of trust and
reciprocity can contribute "…to the development of long-term obligations between
people." (Pretty and Smith, 2004, p. 633). Norms, sanctions or rules of behavior that the
group adopts collectively assures individuals that rights will not be violated and those
that do not follow the rules know they can be punished (Pretty and Ward, 2001; Lubell,
2004). When considering the factors of social capital, cooperation, reciprocity and trust,
along with behavior norms the group has established, the resource community
102
collectively is more likely to be successful in developing specific methods of managing
the resource (a public good) over time (Argawal & Gibson, 1999;Lubell, 2004).
With any activity, certain costs are expected, and as a result of these costs, certain
benefits are anticipated. Initially, the individual will most likely weigh expected costs and
benefits (or incentives) before deciding to participate in collective action. Unless the
outcome of participation is positive or if the effort will make a difference in the long run,
the individual may decide to free-ride or abstain from participation. By free-riding, a
group member can expect to receive the same benefits as those who are participating in
the collective action. Incentives may be offered or the group may have to resort to
coercion to encourage participation. Incentives can be selective, or offered to only those
who participate in collective action, which may provide motivation for all individuals to
participate. These selective incentives can produce greater benefits to those who
participate than for those who choose not to participate (Finkel & Muller, 1998, Lubell,
2002).
It was previously established the Texas SHP has only one supply of water and that
it is a common pool resource. Individual residents in the SHP region have joined into
associations to acquire collectively the water rights to certain sources and quantities of
water, a communal property right. These associations, or resource communities, in this
study include individuals who are supplied by groundwater, surface water from White
River Lake or Lake Meredith (or some combination). The water rights are possessed by
the resource community, are shared equally and are available exclusively only to
members of the resource community (jointness and excludability). This resource
103
community has assembled in an alliance or concerted effort to pursue one common goal,
that is to acquire a public good-- a good quality and sustainable water supply (to combat
subtractability). Most importantly, it is the hope and expectations of all members of the
resource community to have a dependable and sustainable water supply. A second
expectation of all residents of the resource community is the desire to maintain the
quality of life that is present today.
The residents of the SHP have assembled to improve the group's common
interest, and whether the outcome (the collective benefit) is positive or negative, the
action can be considered collective action. If all members of the resource community on
the SHP are rational, group members expect all to participate in collective action, which
is the acceptance and participation in water conservation (reciprocity with an element of
trust). It is evident that the concept of free-riding, or not adopting water conservation
behavior, is present on the SHP, as only one town (in this study) has a water conservation
program in effect. (Lubbock is the only town that currently has voluntary restrictions in
effect for water customers). Selective incentives and coercive measures (norms) are
designed to encourage water conservation behavior. These norms can insure a more
efficient use of the water supply on the SHP.
The action of each individual of the resource community with regard to usage of
the common pool resource has an impact on all other members of the community. All
members of the group are dependent on each other's actions as well as the group's
collective action, as all are dependent on the same water supply. One individual's use of
the resource will affect the amount of the resource others will have available today and in
104
the future (subtractability). The public good or the collective good is a sustainable water
supply and the cost of providing that collective benefit will have to be borne by all
members of the resource community that share the resource.
Hypotheses Development
Questions arise as to the best methods of managing the regional resource to
maintain it (sustainability of the water supply), to maintain the quality of life that
residents of the SHP are accustomed to and to counter the growing demand for water that
will require new sources and additional supplies for the increasing population of the
region. In the following, the null hypothesis for all Issue Areas is that there is no
relationship between the variables. The hypotheses stated are the alternative (research)
hypotheses.
This study was designed 1). to gain an understanding of attitudes and perceptions
of residents and public officials from a representative sampling of communities on the
Texas SHP and Rolling Plains concerning the limited water supply; and 2). to determine
their subsequent attitudes toward any future water conservation policy options that may
be necessary because of limited supplies. With that purpose in mind, it is appropriate to
ask if all residents on the SHP have the same attitude toward the water supply and
subsequently toward water conservation as a policy issue? Will residents in rural (small)
towns on the SHP have the same attitude as residents of a larger more urban setting? In
addition, will the attitudes and perceptions of residents on the SHP differ because of the
105
source of the water supply in each particular town (from CRMWA, WRMWD, or
groundwater)?
As mentioned above, the water from CRMWA may be perceived as a more
"dependable" supply. With agriculture taking a majority of the groundwater in the study
area and the Ogallala aquifer steadily declining, Abernathy and Littlefield, which both
rely on groundwater for their municipal supply, may have more concern for the future of
their water supply than the other study towns. Crosbyton and Post, because of water
supply constraints, are in transition, as they have been forced to search for alternative
sources of water. It is for the above reasons the six towns (because of water source) have
been selected and are included in this study. Two towns are perceived to have the
"dependable" water supply compared to the other towns that are presumed to have a more
"questionable" or a less "dependable" water supply.
Four major issue areas have become evident in this study of attitudes concerning
water conservation and the water supply on the SHP. Issue areas examined are
knowledge (or heightened awareness) of the regional resource, urban versus rural
residents' attitudes, policy issues (restrictions and fines), the price of water and rebates to
encourage conservation, and social values of residents. The first area examines the
relationship a resource community's water source may have with the residents' knowledge
or awareness of the water supply. How much have the residents seen about the water
supply? When a community has ample supplies, do consumers become complacent about
conserving water, or is conservation an ever-present thought on consumers' minds? Do
106
other factors affect the attitude of consumers concerning the use of water, such as age,
length of time lived in the region or how much one has heard about the water supply?
Attitudes toward water conservation are examined in the second major issue area.
What influence does a rural or urban setting have on the resident's attitudes regarding
water conservation? Agriculture contributes considerably to the economy of the region,
thus does the agricultural producer have more awareness of water conservation because
of the association she/he has with the aquifer and irrigation issues? Is there a difference in
the attitudes of residents toward water conservation in towns supplied by groundwater
versus surface water, or some combination of the two? A second area deals with
residents' attitudes toward water conservation as policy. In other words, what do residents
on the SHP think about the possibility of governmental regulation of water, such as
voluntary and enforced restrictions or fines?
The third major issue area deals with the price of water and rebates as an
incentive to conserve water. Rebate programs to encourage the consumer to purchase
water saving appliances and fixtures and the pricing structure of water and what factors
might help change water consumption behavior are discussed.
A fourth issue area deals with social values of SHP residents. This area looks at
the degree of social responsibility residents in the study area possess (collective action is
the term used throughout this study). What factors will affect the decisions of consumers
to act in a socially responsible manner (stewardship) with respect to managing a common
pool resource, in this case water? Will knowledge of the resource affect the decision
making process of a resource community?
107
Issue Area I- Familiarity with Regional Water Resources
Several studies have found that awareness or knowledge of the environment (of
and by itself) is not a strong enough influence to motivate an individual to adopt certain
environmentally friendly behavior. Forsyth, et al. (2004, p. 118) found that an individual
first has to know an environmental problem exists (awareness), and second, that
individual must believe that the problem does actually exist and then must assess the
severity of the problem before she/he will "…engage in environmentally responsible
behavior." Oskamp, et al. (1991) also found that individuals with increased conservation
awareness were more likely to engage in environmentally friendly behavior. Baldassare
& Katz (1992) found that those individuals who perceived that an environmental problem
posed a personal threat to either their health or well-being were more likely to adopt
some sort of conservation or environmentally friendly behavior. Also, Moore, Murphy
and Watson (1994) argue that attitude and behavioral changes may not necessarily be the
result of increased knowledge about conservation. They suggest an individual that
develops a stronger pro-conservation attitude may be more interested in learning more
about conservation.
As members of CRMWA, the cities of Lubbock and Slaton each have a specified
allocation (an annual predetermined amount of water each city is entitled to and delivered
by pipeline). Even with the storage capacity of Lake Meredith at approximately 30% and
an allocation cut by CRMWA in October 2003, CRMWA determined the 2005 total
allocation to all 11 member cities would remain the same as the 2004 allocation (Pernell,
2004). Currently, CRMWA blends an increased amount of groundwater with lesser
108
amounts of surface water to improve quality and more importantly to meet the allocation
demand of member cities. Lubbock has additional groundwater wells located in Bailey
County that are in place as back-up in case of emergency and also to supply additional
water in times of high demand. Slaton also has back up groundwater wells for emergency
purposes (Field, 2004).
White River Lake was at approximately 30% storage capacity in December 2004,
and as of March 2005, the lake remained approximately 20 feet below the conservation
pool elevation (Texas Parks & Wildlife Department, 2005). WRMWD previously drilled
and put online a wellfield for emergency purposes at the beginning of summer 2004. As it
turned out, the lake level was critically low enough that two member towns, Crosbyton
and Ralls, were supplied groundwater from the wellfield during the summer of 2004
(Rogers, 2004). Even with the extraordinarily large amount of rainfall the region received
in 2004, the water level in both White River Lake and Lake Meredith did not rise in
proportion to rainfall received.
Residents in Lubbock and Slaton may perceive the water supply from CRMWA
as more dependable than do residents in Crosbyton and Post (with water from White
River Lake). With the allocation remaining the same in 2005 for member towns, it is
possible a "mixed signal" was being sent to residents by CRMWA. Even with the storage
capacity of Lake Meredith at such a critically low level, the allocation was not cut
further, indicating to some that the situation was not as severe as it may actually have
been. If CRMWA had elected to cut the allocation again, it might have sent a message
that the situation was critical. Instead, CRMWA made the shortage up with increased
109
dependence on groundwater which does not avoid the inevitable (a dwindling supply of
water- both surface and groundwater in the region without conservation measures to slow
consumption).
Not only is Lake Meredith larger than White River Lake (sheer size), but
CRMWA has 11 member cities compared to 4 member cities for WRMWD. To acquire
and fund new sources of water, one can assume that purchasing additional water rights,
the drilling expense and all necessary equipment would be an easier task to accomplish
for CRMWA than for WRMWD. Both CRMWA and WRMWD have had to find
alternate sources of water for member cities, and both have tapped into the Ogallala
aquifer for supplemental water. It is the only quick and easy solution and is the only other
alternative available for towns on the SHP (besides conservation). The water level in the
Ogallala is dropping because of such a heavy reliance on it, in other words it will not last
forever. That one thought should be inspiration enough for all to think about water
conservation in the region.
Olson (1971) states the main reason for a group to assemble is to improve its
collective interest. In theory, assemblage of the group will also improve each individual's
interest. In the case of the SHP, the public good will be a sustainable water supply for all
residents. If the group assembles to attain a public good, will individual members be
more aware of the resource? If awareness of the resource is heightened, will individuals
have a more clear understanding of its status? As Forsyth et al. (2004), Gibson (2001)
and Barbanell (2001) suggest, individual members of a group will ultimately take action
110
to alleviate a problem only when they have an awareness of the resource, understand the
resource is threatened (or limited) and have a belief the threat is real and severe.
Keeping in mind that the water supply on the SHP is limited (not an over
abundance), are residents of the region (the collective group) well enough informed about
the status of the supply to engage in collective action, to accept and adopt water
conservation behavior? Will the status of a community's water supply (adequacy or
abundance versus constrained) have an effect on residents' knowledge of the water supply
issues? With these statements in mind, residents living in towns on the SHP supplied
water by the Ogallala aquifer (Abernathy and Littlefield) and White River Lake
(Crosbyton and Post) are more likely to have a heightened awareness (and a keener
knowledge) of the origin of their water supply than compared to residents in Lubbock and
Slaton, who are supplied water by CRMWA (Hypothesis 1).
Hypotheses 1
There should be a positive relationship between a person's knowledge (awareness)
of the local water supply and their willingness to adopt water conservation measures. To
test the hypothesis above, questions were constructed and included in the survey
instrument to determine knowledge, attitudes and perceptions of respondents concerning
the familiarity with the regional water resources and supply (dependent variables).
The first area of concern is to determine whether SHP residents know the source
of their town's water supply. Four categories were included (but not read aloud to
participants), "Lake or River," "Groundwater/Aquifer," "Combination of Sources" and
111
"Do Not Know." The question has been recoded to reflect whether the respondent
answered the question correctly or not, including the "Do Not Know" category.
A second question is included to gauge how much information the respondent has
seen, heard or read about the water supply in the past year. Response choices are "A
Great Deal," "Some," "A Little" and "None." Respondents were also asked to estimate
how long they thought their water supply might last. Four response choices were given,
"Less than 20 years," "20 to 50 years," "More than 50 years" and "Do Not Know." This
question helps to measure the respondent's knowledge (or perception) of the
sustainability of the water supply. The importance of water conservation to the region is
also included here, and has five categories ranging from "Not at all Important" (value of
1) to "Extremely Important" (value of 5). Knowledge of the water source and the
importance of water conservation may also be affected by the length of time lived on the
SHP, their age and education.
Issue Area II- Attitudes Toward Water Conservation
This section deals with attitudes of residents on the SHP concerning the issue of
water conservation. It is broken into two sections. The first deals with the attitudes of the
urban versus rural citizen and if there is a difference in attitudes toward water
conservation because of where a person lives. The second section deals with attitudes
toward water conservation as a policy issue. What are opinions of residents concerning
government regulation of water in the form of restrictions, fines, etc?
112
Urban versus Rural Setting
The Ogallala aquifer on the SHP is steadily declining, which puts the water
supply for all towns on the SHP in peril. Not only is there a threat to the water supplies of
area towns, but the falling water table means the cost to bring the water to the surface will
increase and there is a greater chance groundwater quality may be suspect. Also because
of lower than normal rainfall for several years in the past, area reservoirs have lower than
normal capacities.
Freudenburg (1991) found that both farmers and ranchers in western Colorado
had a more favorable attitude concerning the environment, contrasted by less concern for
environmental issues by those employed in industries that exploit the environment.
Considering these research findings and the fact the water supplies of Abernathy,
Littlefield, Crosbyton and Post are limited, will respondents' attitude (toward water
conservation) in these rural towns be different from those that live in an urban setting
with a more "dependable" water supply?
Most residents in the rural areas (Abernathy, Crosbyton, Littlefield, Post and
Slaton) will have a more positive attitude toward the water supply and be more receptive
to municipal water conservation measures than residents that live in a more urban setting
(Lubbock) (Hypothesis 2A).
Hypothesis 2A
The major issues discussed here include 1) the importance of water conservation
to the region, 2) whether area towns should have a short- or long-term supply plan, 3) the
113
attitudes toward the priority of conservation and wastewater, 4) user groups who should
limit use and 5) whether the individual would voluntarily use less water. Residents in
study area towns were asked to rank the importance of crime, education, the town's
economy and water conservation to the region. The response choices ranged from 1 (not
at all important) to 5 (extremely important).
Respondents were also asked if the town in which they live should have a plan to
insure a water supply for 20 years, 50 years and for 100 years. The response choices
range from "Strongly Agree" (1) to "Strongly Disagree" (4) and "Do Not Know." The
importance of water conservation to local governments is included, with response choices
"Very Low Priority," "Somewhat Important" or "Very High Priority." The question "I
would use less water if I knew it was in short supply." is not only a measure of social
responsibility, but measures a respondent's attitude toward water conservation. It has a 4-
point Likert-scale response choice (1 representing "Strongly Agree" and 4 denoting
"Strongly Disagree"). Respondents were also asked if they would be willing to use
treated wastewater to water their lawn, with the same 4-point Likert scale ("Strongly
Agree" to "Strongly Disagree"). If restrictions were placed on the amount of water area
agriculture, municipalities, businesses and/or industry could use, given that all sectors
rely on the same water supply, a question was posed to examine respondents' opinions
concerning which type of user should have to reduce the amount of water they use.
Response choices include agricultural users, residential users, other area businesses and
all should reduce use equally. The cost of water in each town is included in this section.
114
Water Conservation as a Policy Issue
Should towns in the study area implement restrictions or punitive measures
because of constraints to the resource or for over use or waste of the resource? Is there an
attitude difference, concerning water conservation as a policy issue, between residents of
towns being supplied water from different sources (groundwater versus CRMWA versus
WRMWD) on the SHP? It is believed because of source/supply constraints, residents in
towns supplied by groundwater and WRMWD, will have a more positive attitude toward
water conservation as a policy issue (voluntary or mandatory restrictions and fines),
compared to residents of towns supplied water by CRMWA (Hypothesis 2B).
Hypothesis 2B
Questions in this section deal with issues of voluntary, mandatory and enforced
restrictions on water use and the factors that may influence the consumers' attitudes
toward each policy issue. This section also deals with the attitudes toward the issue of
unlimited usage and fines for wasting water. Respondents were asked whether local
governments should emphasize voluntary or mandatory water conservation measures.
Factors that may influence attitudes toward voluntary or mandatory restrictions include
length of time lived on the SHP and age. Other issues are if the respondent should be able
to use as much water as he/she wants but pay for it and the issue of enforced restrictions
and fines for residents and businesses. Response choices for all questions are the 4-point
Likert scale ("Strongly Agree" to "Strongly Disagree").
115
Issue Area III- Price of Water and Rebates
This section deals with the issue of the price of water and rebates as incentives to
conserve water. Can either one or both effectively encourage resource community
members to accept and adopt water conservation behavior? Financial incentives can be
designed to encourage participation in water conservation programs, such as a water rate
structure that encourages reduced water use, discounts on the water bill for reduced
consumption or participation in a rebate program, rebates for retrofitting appliances
and/or fixtures, and a variety of other possibilities. Rebates are also studied. Their
primary aim is to recover a customer's expense of purchasing a water saving appliance or
fixture in a short time period, with long-term savings to continue to accumulate. For the
water provider (the supply side), savings come from a long-term reduction in demand
(Western Resource Advocates, 2003). Olson (1971, p. 1) suggests that "rational," "self-
interested individuals" will not act to achieve the common goal of a group, thus coercion
is suggested to encourage participation in collective action. In this instance, the collective
action is water conservation.
Water Rate Structure
Will price of a resource have an influence on an individual's attitude toward that
resource? Moore, Murphy and Watson (1994) suggest using price as an incentive to
encourage conservation in place of doing a large-scale knowledge based education
outreach program. If price for a certain resource or item increases to the point where it
116
becomes cost prohibitive, an individual may start looking for alternatives for that product,
or in the case of water, ways to reduce the amount used.
Price can be considered a coercive action, as water rates can be structured to
penalize excessive use. It was mentioned previously by Flack (1982) that increased rates,
along with a public who is more aware that water may be in short supply, can be an
incentive to conserve. It is believed an increase in the price of water will motivate
consumers to conserve water (Hypothesis3A).
Hypotheses 3A
The abundance or scarcity of a community's water supply can directly influence
the price charged for the resource (supply and demand). Included in this section will be
the pricing of water as a conservation tool and the relationship of price and gpcd in each
town. Three statements are included: 1)"Increasing the price of water is a good way to
save water for the future."; 2) "I would use less water if my bill increased to twice what it
usually costs now." and 3) "I would use less water if my bill increased to half what it
usually costs now." All have the 4-point Likert scale response choices, "Strongly Agree"
to "Strongly Disagree." Also included is the comparison of the cost of water (in each
town) compared to the actual gpcd average (in each town).
Rebates as a Conservation Tool
A rebate program is designed to encourage a person to buy a new plumbing
fixture or appliance that saves water, such as a low flow showerhead, low gallon per flush
117
toilet, or water saving clothes washing machine. For outdoor water savings, a rebate
program can be offered to replace plants that require more water with plant species that
are more drought tolerant. Rebate programs will not be successful if the consumer is not
made aware of the program. Information regarding why conservation is necessary and
more importantly educating the consumer as to why a rebate program is needed and being
offered is also crucial for the success of the programs. The ultimate goal is a more
efficient use of water (a reduction in consumption). Inherent in an appliance or fixture
retrofit is the lower use of water, requiring less of a behavioral change by the consumer
and ultimately more of a long-term water savings. Water consumers on the SHP will be
receptive to a rebate program that offers water saving appliances and fixtures at a
discounted price (Hypothesis 3B).
Hypothesis 3B
Issues dealing with attitudes toward a rebate program and other factors that might
influence those attitudes toward rebates as a conservation tool are discussed here. The
question "If I knew I could save money over the long run, I would be willing to pay more
up front for a water saving appliance." and "A rebate program would encourage people to
buy a new water saving appliance." have been included to examine whether residents of
the region would participate in a rebate program. Both have the 4-point Likert scale
response choices ranging from "Strongly Agree" to "Strongly Disagree." Education and
income are included as factors that may influence attitudes toward a rebate program.
118
Issue Area IV- Social responsibility (collective action)
In any setting, whether it is on the scale of a local community, a watershed or
larger, the role stakeholder education plays can be an important aspect in managing a
resource. In an example Steins and Edwards (1999) cite, the role of "social learning in
resource management" (p. 251) had a profound effect on Dutch fishermen in the Wadden
Sea. Due to several colder than normal winters, more competition among fishermen along
with improved fishing technology and techniques, the cockle stocks started declining. By
disseminating information in writing and with public meetings, fishermen were educated
not only about the ecosystem but also about management strategies. Educating the
fisherman gave them a better understanding of the species and the level of
interdependence the cockle had within the ecosystem. An ancillary but important point
about this example is the fishermen were persuaded to self-regulate their fishing industry,
a resource that had previously been managed as an open access common pool resource.
As mentioned above, in Forsyth et al. (2004), an individual must not only be
aware of a resource problem, but must realize the severity of the problem. Barbanell
(2001) tends to agree that only after individuals believe the resource is constrained and
they realize there are solutions to possibly remedy the problem, will discussions to
improve the situation (on a collective basis) be organized. Gibson (2001) also found that
when members of a community consider a resource as both necessary but in limited
supply will they attempt to manage it against overexploitation. What factors will
influence the decisions of stakeholders collectively concerning the management of a
limited regional water supply (a common pool resource)? The knowledge of the
119
stakeholders regarding the source of the community's water supply will have an effect on
the stewardship (social responsibility) of SHP residents concerning the common pool
resource, in this case water (Hypothesis 4).
Hypothesis 4
To gauge the strength of social responsibility SHP residents may possess, the
statement "All residents on the South Plains have a responsibility to conserve water." and
"I don't really have to conserve water because other people will." are included. Both
questions have the same 4-point Likert scale response choices ranging from "Strongly
Agree" to "Strongly Disagree." The next step in the collective management of a resource,
as mentioned above, is to examine how much community members know about their
water supply. The awareness of the water supply by individuals in all study area towns
can be measured with the question that asks the source of the town's water supply and
whether a relationship exists between it and the two social responsibility questions can
analyzed in a crosstab. Other factors that may influence attitudes concerning social
responsibility toward water conservation and included in this section are how long the
respondent has lived on the SHP, age, income and education.
Data analysis and the reported results for both the consumer survey and the
municipal water provider follow in Chapter V.
120
CHAPTER V
RESULTS AND ANALYSIS
This chapter is divided into three sections. The first section deals with survey
demographic data. The second section discusses the four Issue Areas reviewed in the
previous chapter. The Conclusions section summarizes the data analysis.
Demographic Data
Randomly selected residents in Abernathy, Crosbyton, Littlefield, Lubbock, Post
and Slaton were contacted by telephone to survey public opinion and attitudes about the
region's water supply and water policy issues, as mentioned previously. Data were
collected regarding the area residents’ knowledge of and concern for the local water
supply, area residents’ current and future behavior with respect to water use, and
residents’ approval or disapproval of possible local government actions and regulations
on water use. These data will allow inferences to be drawn from the above sample, and it
is assumed the data is generalizable to the entire SHP population.
Table 5.1 shows the general demographics of the sample surveyed. Of the 829
respondents selected, Lubbock has the largest number of respondents surveyed (26%). In
terms of age of respondents, overall, more respondents fell between the age groups of 35
to 44, 45 to 54 and 65 and older. One-third of all respondents have a high school diploma
or GED, while 26% said they have taken some college or community college courses.
The largest percentage of respondents said their income ranges from $31,000 to $50,000.
121
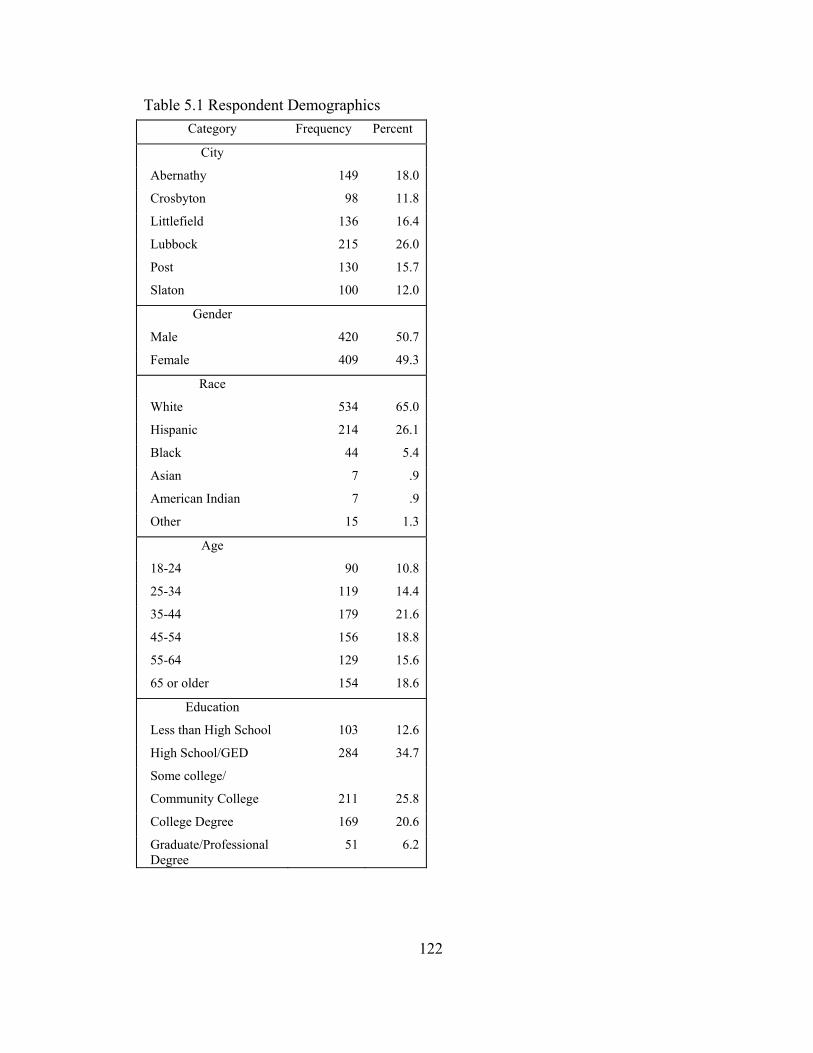
Table 5.1 Respondent Demographics
Category Frequency Percent
City
Abernathy 149 18.0
Crosbyton 98 11.8
Littlefield 136 16.4
Lubbock 215 26.0
Post 130 15.7
Slaton 100 12.0
Gender
Male 420 50.7
Female 409 49.3
Race
White 534 65.0
Hispanic 214 26.1
Black 44 5.4
Asian 7 .9
American Indian 7 .9
Other 15 1.3
Age
18-24 90 10.8
25-34 119 14.4
35-44 179 21.6
45-54 156 18.8
55-64 129 15.6
65 or older 154 18.6
Education
Less than High School 103 12.6
High School/GED 284 34.7
Some college/ Community College 211
25.8
College Degree 169 20.6 Graduate/Professional
Degree 51 6.2
122
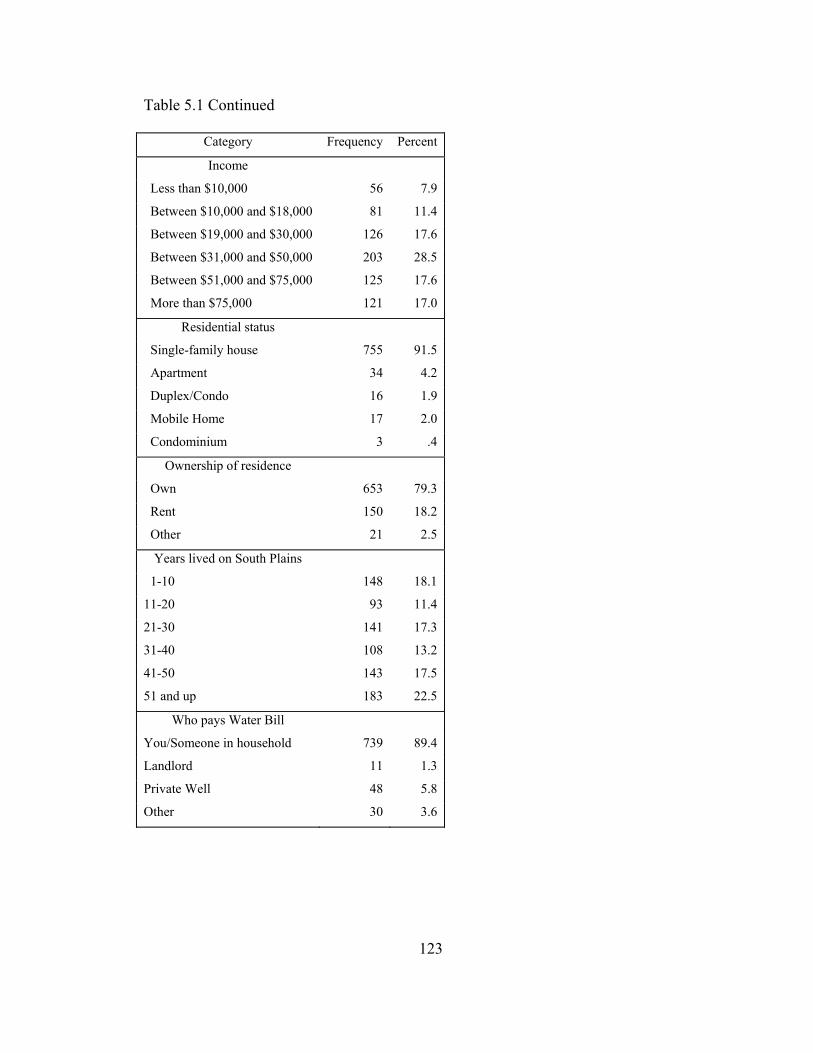
Table 5.1 Continued
Category Frequency Percent
Income
Less than $10,000 56 7.9
Between $10,000 and $18,000 81 11.4
Between $19,000 and $30,000 126 17.6
Between $31,000 and $50,000 203 28.5
Between $51,000 and $75,000 125 17.6
More than $75,000 121 17.0
Residential status
Single-family house 755 91.5
Apartment 34 4.2
Duplex/Condo 16 1.9
Mobile Home 17 2.0
Condominium 3 .4
Ownership of residence
Own 653 79.3
Rent 150 18.2
Other 21 2.5
Years lived on South Plains
1-10 148 18.1
11-20 93 11.4
21-30 141 17.3
31-40 108 13.2
41-50 143 17.5
51 and up 183 22.5
Who pays Water Bill
You/Someone in household 739 89.4
Landlord 11 1.3
Private Well 48 5.8
Other 30 3.6
123
Most respondents live in a single-family house (91%) and 79% own their home.
Approximately 22 percent of respondents have lived on the SHP or Rolling Plains region
over 50 years, with other categories from one to fifty years distributed fairly evenly.
Issue Area Analysis- Water Consumer
The results of the four main issue areas concerning water conservation, detailed in
Chapter IV, are discussed in detail below. Issue Area I covers respondent familiarity with
the regional water resources and the resultant supply issues on the SHP. Issue Area II
details respondent attitudes toward water conservation with respect to urban versus rural
attitudes and water conservation as a policy issue. Issue Area III will cover attitudes
toward both price and rebates as a conservation tool. The issue of social responsibility of
respondents toward water as a limited resource is discussed in Issue Area IV. The
Conclusion section follows the analysis of data and briefly summarizes the data analysis
section.
Issue Area I- Familiarity with Regional Resources and Supply Issues
One of the first areas of importance to a water provider or agency is to have some
idea how knowledgeable the consuming public may be concerning the region's water
supply. As discussed previously, only after awareness of the resource is established
through the process of social learning can the community as a whole understand the
status of the resource. Pretty and Smith (2004) state awareness is a very necessary item in
the conservation of a resource. Along with awareness, Van Vugt and Samuelson (1999)
124
suggest one has to understand the severity of the problem before one might believe a
crisis does actually exist. Once the individual or community becomes aware of the
situation or problem and understands its severity, environmentally friendly behavior is
more likely to be adopted, as suggested by Forsyth et al. (2004) and Baldassare and Katz
(1992).
Residents living in towns on the SHP supplied water by the Ogallala aquifer
(Abernathy and Littlefield) and White River Lake (Crosbyton and Post) are more likely
to have a heightened awareness (and a keener knowledge) of the origins of their water
supply than residents in Lubbock and Slaton (supplied water by CRMWA) (Hypothesis
1). If the general water consumer is more knowledgeable about the quality, quantity and
status of the region's water supply, they should be more willing to conserve when and if
the supply becomes critically low.
The percentages for respondents correctly answering the question regarding the
source of their town's water supply are shown in Table 5.2. The data are broken into two
categories for the crosstabs, individual city and cities categorized by water source.
Of the 829 respondents who participated in this survey, 312 or approximately 40
percent did not know the source of water for the city in which they live (see Table 5.2).
When both "Not Correct" and "Do Not Know" (7.5% and 37.7% respectively) totals were
combined, approximately half of all respondents who participated in the survey did not
know where their water comes from. Of the individual towns, Crosbyton had the highest
percentage of respondents that knew where their water comes from. Crosbyton residents
may be more aware of their water source because of the recent drought conditions
125
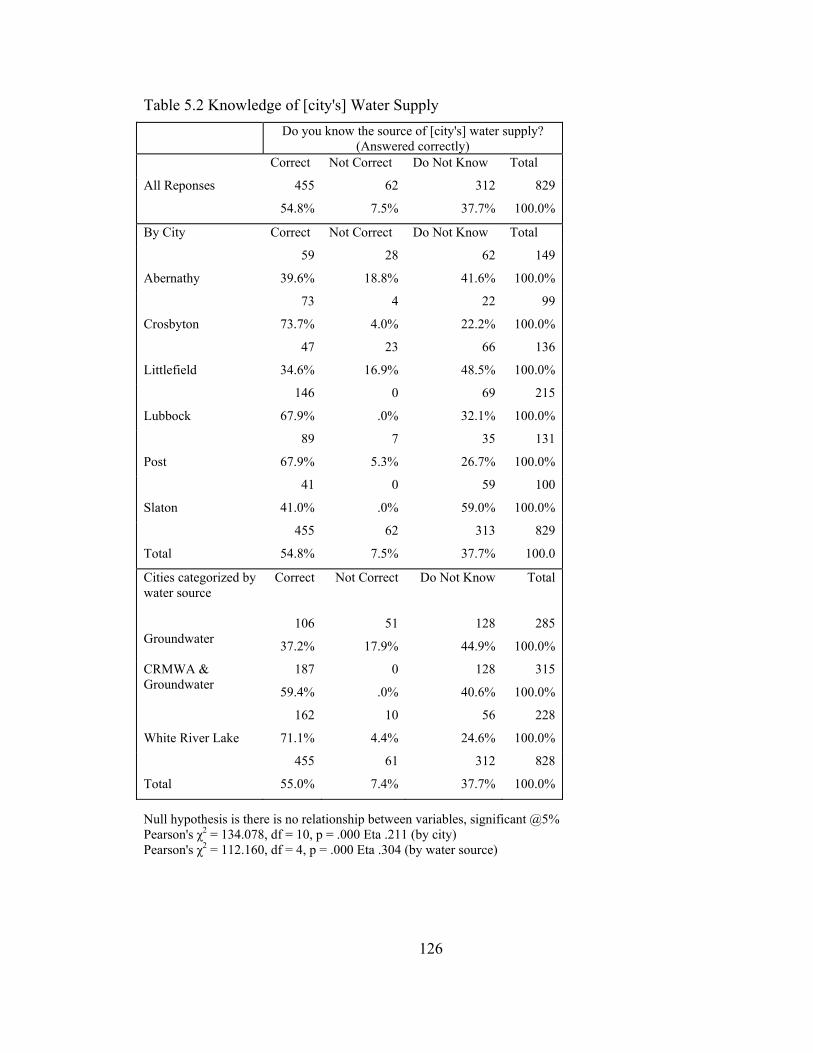
Table 5.2 Knowledge of [city's] Water Supply Do you know the source of [city's] water supply?
(Answered correctly) Correct Not Correct Do Not Know Total
All Reponses
455
54.8%
62
7.5%
312
37.7%
829
100.0%
By City Correct Not Correct Do Not Know Total
59
39.6%
28
18.8%
62
41.6%
149
100.0% Abernathy
73
73.7%
4
4.0%
22
22.2%
99
100.0% Crosbyton 47
34.6%
23
16.9%
66
48.5%
136
100.0% Littlefield
146
67.9%
0
.0%
69
32.1%
215
100.0%
Lubbock 89
67.9%
7
5.3%
35
26.7%
131
100.0% Post
41
41.0%
0
.0%
59
59.0%
100
100.0%
Slaton 455
54.8%
62
7.5%
313
37.7%
829
100.0 Total
Cities categorized by water source
Correct
106
37.2%
Not Correct
51
17.9%
Do Not Know
128
44.9%
Total
285
100.0%
Groundwater
CRMWA & 187
59.4%
0
.0%
128
40.6%
315
100.0%
Groundwater 162
71.1%
10
4.4%
56
24.6%
228
100.0% White River Lake 455
Total 55.0%
61
7.4%
312
37.7%
828
100.0%
Null hypothesis is there is no relationship between variables, significant @5% Pearson's χ2 = 134.078, df = 10, p = .000 Eta .211 (by city) Pearson's χ2 = 112.160, df = 4, p = .000 Eta .304 (by water source)
126
that have caused record low capacity in White River Lake for the past several years. In
contrast, Slaton had the highest percentage of residents (for an individual city) who did
not know their city's water source. Littlefield and Abernathy respondents (for an
individual city) were also less likely to know the source of their water supply. One
possible reason for the high percentage in Slaton may be the city's "abundance" of water,
or the lack of a shortage, which may have led to apathy among residents. In addition,
Slaton's ability to sell a portion of their allocation of water from CRMWA to the
neighboring town of Post, and the fact Slaton has never consumed over 50% of their
allocation from CRMWA, may lessen the worry over current and future supply issues by
Slaton residents. In other words, residents of Slaton may consider their water supply very
dependable, now as well as for some time into the future.
When the individual cities were categorized by their particular water source,
Abernathy and Littlefield combined, whose source is from groundwater, had the highest
percentage of residents that "Do Not Know" where their water originates; not supporting
Hypothesis I. When the two categories "Not Correct" (18%) and "Do Not Know" (45%)
were combined, the percentage was well over half of residents in Abernathy and
Littlefield who were not knowledgeable about the water supply. Respondents in
Crosbyton and Post were considerably more knowledgeable about the water source, as
almost three-quarters of respondents stated correctly that their water originates from
White River Lake. This data supports Hypothesis I. Likely reasons for respondents in
Crosbyton and Post being more knowledgeable about their water supply are discussed in
127
more detail below (see Issue Area II(A)- Urban versus Rural Attitudes toward Water
Conservation for discussion about possible reasons why, p.138 below).
Table 5.3 displays data from the question "How much have you seen, heard, or
read about the water supply on the High Plains of Texas in the past year?" A larger
percent of the region's residents responded they have seen, heard or read "A Great Deal"
about the water supply on the Southern High Plains and Rolling Plains than have not. Of
individual cities, Slaton, in which more than half of respondents claimed they did not
know the source of the water supply, almost half of respondents stated they had read "A
Great Deal" about the water supply. Post had a somewhat higher percentage than Slaton
who stated they have seen, heard or read "A Great Deal." When the cities were
categorized by water source, all three ("Groundwater," "CRMWA & Groundwater" and
"White River Lake") had a fairly equal percentage (almost 50%) stating they have seen,
read or heard "A Great Deal" about the water supply. When "A Great Deal" and "Some"
are combined, a larger percentage of respondents are from "White River Lake," towns
supplied by "Groundwater" are second (CRMWA a very close third). Overall, these data
support Hypothesis I.
Table 5.3.1 summarizes the results of where the respondents had seen the public
service announcement (PSA). Responses were "Television," "Radio," "Print" or "More
than one place." A larger percentage of respondents stated they had seen a PSA on
television, second was "More than one place," "Print" was third and the smallest
percentage stated they had heard a PSA on "Radio." Of all individual towns, more
128
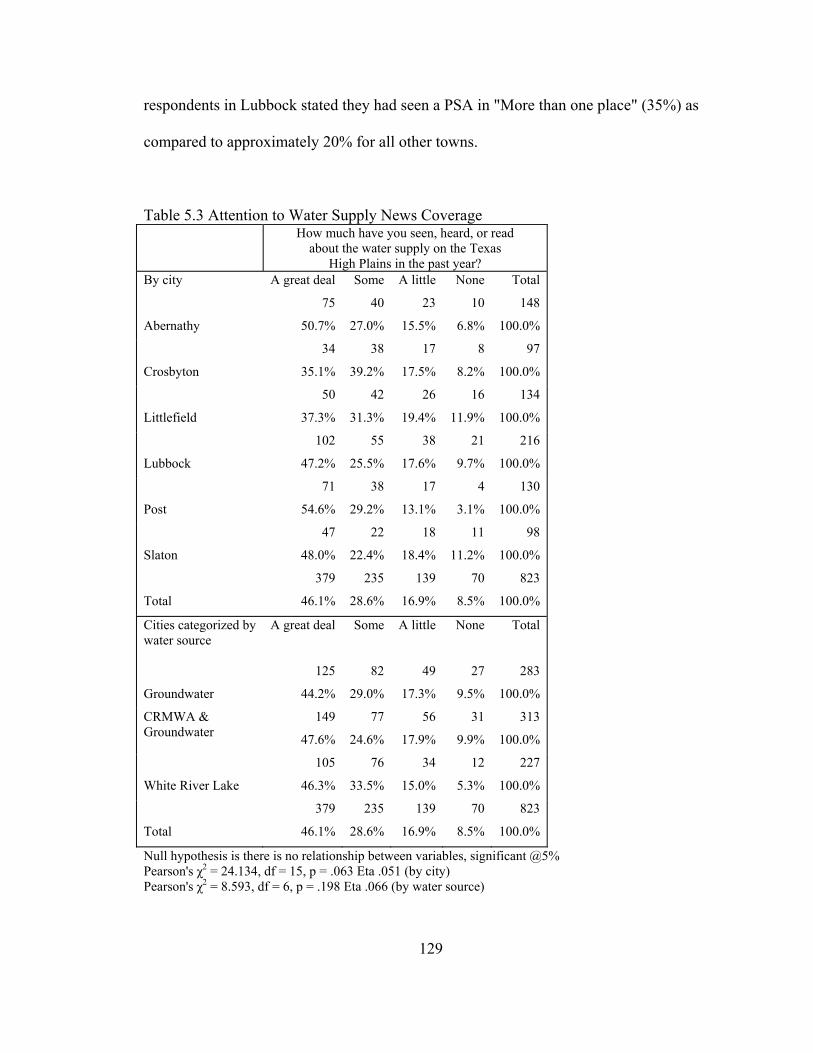
respondents in Lubbock stated they had seen a PSA in "More than one place" (35%) as
compared to approximately 20% for all other towns.
Table 5.3 Attention to Water Supply News Coverage How much have you seen, heard, or read
about the water supply on the Texas High Plains in the past year?
By city A great deal
75
50.7%
Some
40
27.0%
A little
23
15.5%
None
10
6.8%
Total
Abernathy
148 100.0%
Crosbyton
34
35.1%
38
39.2%
17
17.5%
8
8.2%
97
100.0%
Littlefield
50
37.3%
42
31.3%
26
19.4%
16
11.9%
134 100.0%
Lubbock
102
47.2%
55
25.5%
38
17.6%
21
9.7%
216
100.0%
Post
71
54.6%
38
29.2%
17
13.1%
4
3.1%
130 100.0%
Slaton
47
48.0%
22
22.4%
18
18.4%
11
11.2%
98 100.0%
Total
379
46.1%
235
28.6%
139
16.9%
70
8.5%
823
100.0%
Cities categorized by water source
Null hypothesis is there is no relationship between variables, significant @5% Pearson's χ2 = 24.134, df = 15, p = .063 Eta .051 (by city) Pearson's χ2 = 8.593, df = 6, p = .198 Eta .066 (by water source)
Groundwater
A great deal
125
44.2%
Some
82
29.0%
A little
49
17.3%
None
27
9.5%
Total
283
100.0%
CRMWA & Groundwater
149
47.6%
77
24.6%
56
17.9%
31
9.9%
313
100.0%
White River Lake
105
46.3%
76
33.5%
34
15.0%
12
5.3%
227
100.0%
Total
379
46.1%
235
28.6%
139
16.9%
70
8.5%
823
100.0%
129
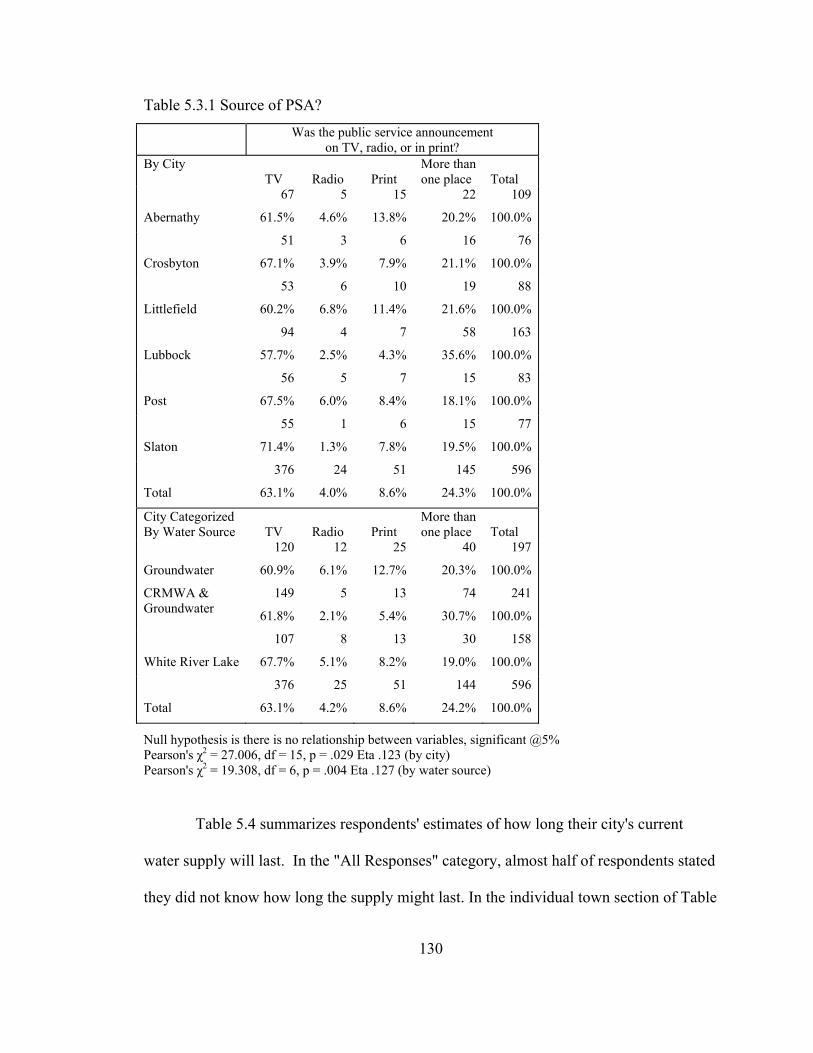
Table 5.3.1 Source of PSA? Was the public service announcement on TV, radio, or in print? By City
TV
Print More than
Radio one place Total
Abernathy
67
61.5%
5
4.6%
15
13.8%
22 109 20.2% 100.0%
Crosbyton
51
67.1%
3
3.9%
6
7.9%
16 76
21.1% 100.0%
Littlefield
53
60.2%
6
6.8%
10
11.4%
19
88 21.6% 100.0%
Lubbock
94
57.7%
4
2.5%
7
4.3%
58 163
35.6% 100.0%
Post
56
67.5%
5
6.0%
7
8.4%
15
83 18.1% 100.0%
Slaton
55
71.4%
1
1.3%
6
7.8%
15 77
19.5% 100.0%
Total
376
63.1%
24
4.0%
51
8.6%
145
596 24.3% 100.0%
City Categorized By Water Source
TV
More than Radio one place Total
Groundwater
120
60.9%
12
6.1%
25
12.7%
40 197 20.3% 100.0%
CRMWA & Groundwater
149
61.8%
5
2.1%
13
5.4%
74
241 30.7% 100.0%
White River Lake
107
67.7%
8
5.1%
13
8.2%
30 158 19.0% 100.0%
Total
376
63.1%
25
4.2%
51
8.6%
144
596 24.2% 100.0%
Null hypothesis is there is no relationship between variables, significant @5% Pearson's χ2 = 27.006, df = 15, p = .029 Eta .123 (by city) Pearson's χ2 = 19.308, df = 6, p = .004 Eta .127 (by water source)
Table 5.4 summarizes respondents' estimates of how long their city's current
water supply will last. In the "All Responses" category, almost half of respondents stated
they did not know how long the supply might last. In the individual town section of Table
130
5.4, just over half of respondents living in Littlefield and Slaton stated they "Do Not
Know" how long their water supply will last. The high percentage may be partly because
Littlefield is solely dependent on groundwater, and the status of the groundwater supply
on the SHP is somewhat unpredictable with respect to future sustainability at this point.
In addition, Abernathy and Littlefield respondents (in "Cities Categorized by Water
Source") have a larger percentage who stated they "Do Not Know" how long their water
supply will last. Crosbyton and Post, both supplied water by White River Lake, have the
largest percentage of respondents that stated the water supply will last less than 20 years
("By city"). In the "Cities Categorized by Water Source" category, respondents in
Crosbyton and Post were split between stating White River Lake has "Less than 20
Years" supply and stating that they "Do Not Know" how long the supply will last. At the
time of the survey, WRMWD had just drilled several groundwater wells to supply water
to member towns in case of emergency, as White River Lake had approximately 25%
capacity at the time of the survey. Slaton ("By city") had the lowest percentage of
respondents that stated the water supply will last less than 20 years, as might be expected,
but as mentioned above, it had a considerably larger percentage that stated they "Do Not
Know" how long the supply will last.
Table 5.5 summarizes the relationship between those who correctly identified the
source of the water supply and the number of years the respondent has lived on the SHP.
As shown in Table 5.5, a positive correlation exists between the length of time the
respondent has lived on the SHP and the knowledge of the water source. The "Do Not
131
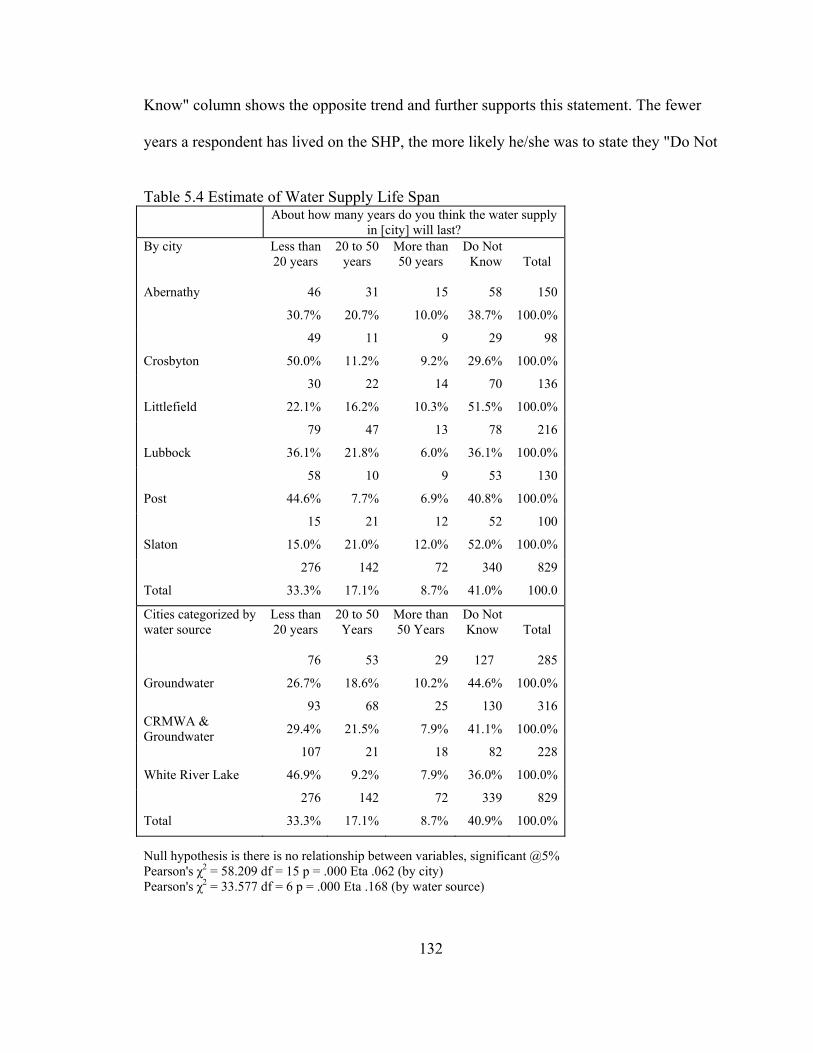
Know" column shows the opposite trend and further supports this statement. The fewer
years a respondent has lived on the SHP, the more likely he/she was to state they "Do Not
Table 5.4 Estimate of Water Supply Life Span
About how many years do you think the water supply in [city] will last?
By city Less than 20 years
20 to 50 years
More than 50 years
Do Not Know
Total
Abernathy 46 31 15
30.7% 20.7% 10.0%
58
38.7%
150
100.0%
Crosbyton
49
11 9 50.0% 11.2% 9.2%
29
29.6%
98
100.0%
Littlefield
30 22 14 22.1% 16.2% 10.3%
70
51.5%
136
100.0%
Lubbock
79
47 13 36.1% 21.8% 6.0%
78
36.1%
216
100.0%
Post
58 10 9 44.6% 7.7% 6.9%
53
40.8%
130
100.0%
Slaton
15
21 12 15.0% 21.0% 12.0%
52
52.0%
100
100.0%
Total
276 142 33.3% 17.1%
72
8.7%
340
41.0%
829
100.0
Cities categorized by water source
Less than 20 to 50
Years More than 50 Years
Do Not Know
20 years Total
76
26.7%
53
18.6%
29
10.2%
127
44.6%
285 Groundwater 100.0%
Null hypothesis is there is no relationship between variables, significant @5% Pearson's χ2 = 58.209 df = 15 p = .000 Eta .062 (by city) Pearson's χ2 = 33.577 df = 6 p = .000 Eta .168 (by water source)
CRMWA & Groundwater
93
29.4%
68
21.5%
25
7.9%
130
41.1%
316
100.0%
White River Lake
107
46.9%
21
9.2%
18
7.9%
82
36.0%
228
100.0%
276 142 72 339 829
Total 33.3% 17.1% 8.7% 40.9% 100.0%
132
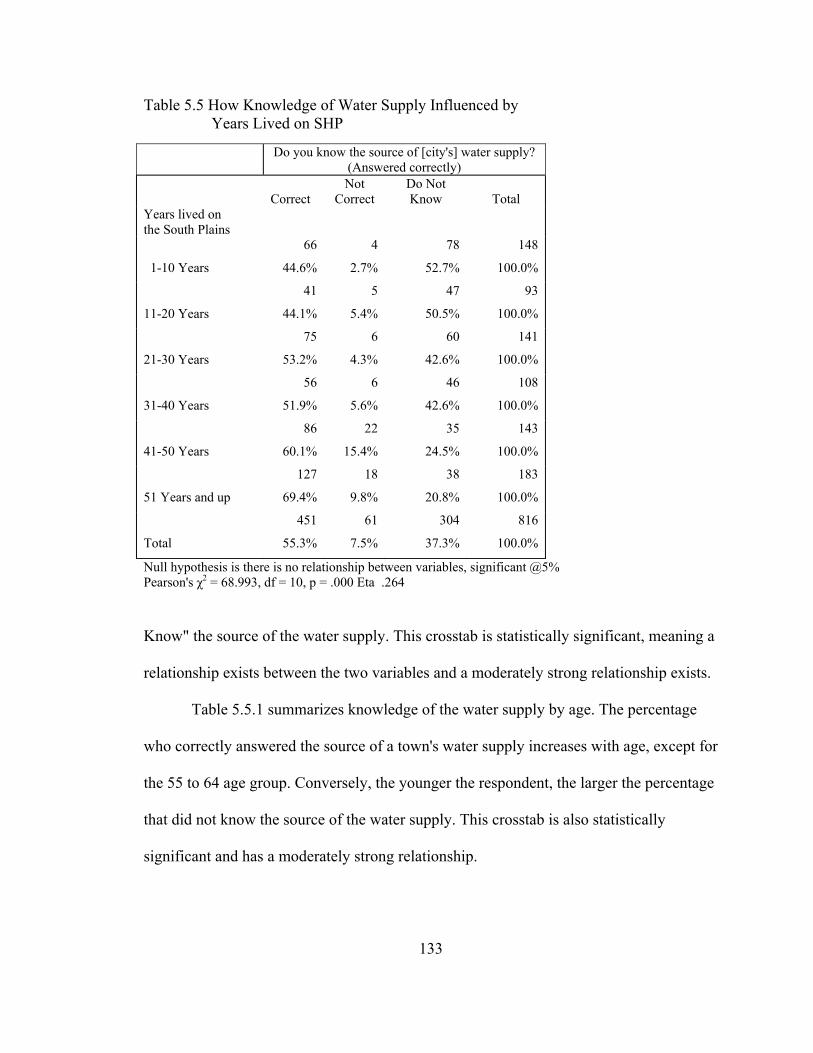
Table 5.5 How Knowledge of Water Supply Influenced by Years Lived on SHP
Null hypothesis is there is no relationship between variables, significant @5% Pearson's χ2 = 68.993, df = 10, p = .000 Eta .264
Do you know the source of [city's] water supply? (Answered correctly)
Not Correct
Do Not Know
Total Correct
Years lived on the South Plains
1-10 Years
66
44.6%
4 78
2.7% 52.7%
148
100.0%
11-20 Years
41
44.1%
5 47
5.4% 50.5%
93
100.0%
21-30 Years
75
53.2%
6 60
4.3% 42.6%
141
100.0%
31-40 Years
56
51.9%
6 46
5.6% 42.6%
108
100.0%
41-50 Years
86
60.1%
22 35
15.4% 24.5%
143
100.0%
51 Years and up
127
69.4%
18 38 183
9.8% 20.8% 100.0%
451 61
7.5%
304 816
Total 55.3% 37.3% 100.0%
Know" the source of the water supply. This crosstab is statistically significant, meaning a
relationship exists between the two variables and a moderately strong relationship exists.
Table 5.5.1 summarizes knowledge of the water supply by age. The percentage
who correctly answered the source of a town's water supply increases with age, except for
the 55 to 64 age group. Conversely, the younger the respondent, the larger the percentage
that did not know the source of the water supply. This crosstab is also statistically
significant and has a moderately strong relationship.
133
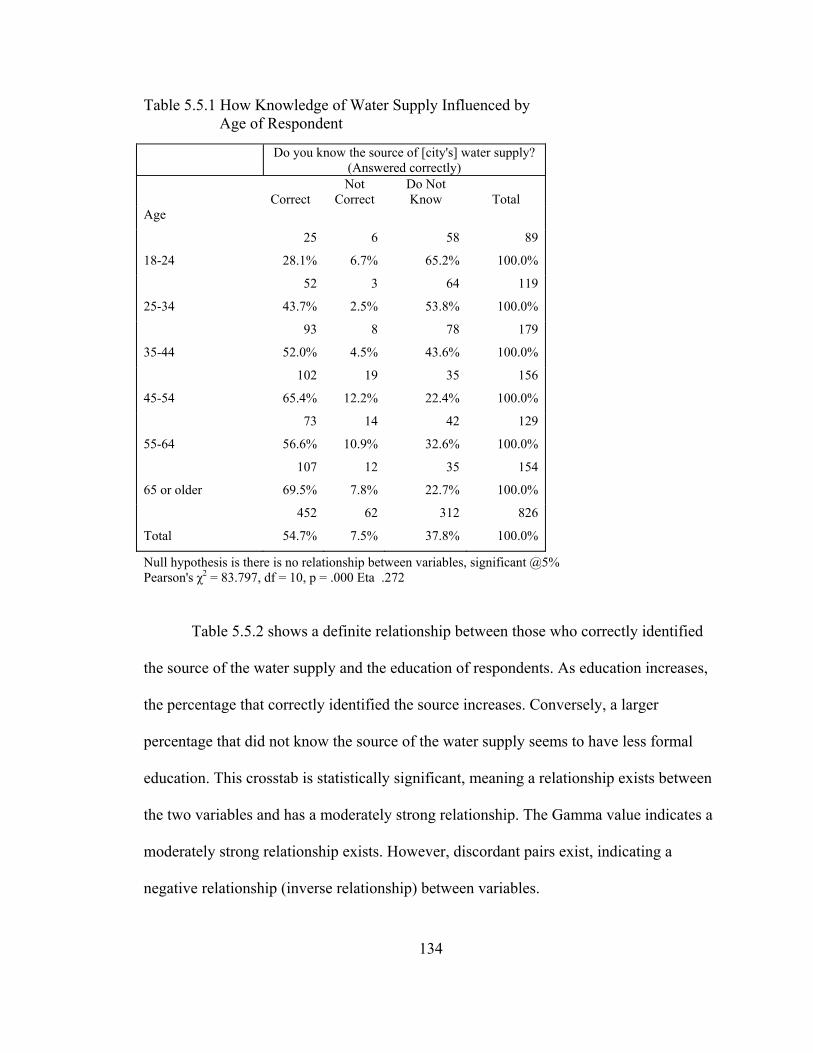
Table 5.5.1 How Knowledge of Water Supply Influenced by Age of Respondent
Do you know the source of [city's] water supply?
(Answered correctly)
Correct Not
Correct Do Not Know
Total Age
18-24
25 6
28.1% 6.7%
58
65.2%
89
100.0%
25-34
52 3 43.7% 2.5%
64
53.8%
119
100.0%
35-44
93 8
52.0% 4.5%
78
43.6%
179
100.0%
45-54
102 19
65.4% 12.2%
35
22.4%
156
100.0%
55-64
73 14
56.6% 10.9%
42
32.6%
129
100.0%
65 or older
107 12 35 154
69.5% 7.8% 22.7% 100.0%
452 62 312 826
Total 54.7% 7.5% 37.8% 100.0%
Null hypothesis is there is no relationship between variables, significant @5% Pearson's χ2 = 83.797, df = 10, p = .000 Eta .272
Table 5.5.2 shows a definite relationship between those who correctly identified
the source of the water supply and the education of respondents. As education increases,
the percentage that correctly identified the source increases. Conversely, a larger
percentage that did not know the source of the water supply seems to have less formal
education. This crosstab is statistically significant, meaning a relationship exists between
the two variables and has a moderately strong relationship. The Gamma value indicates a
moderately strong relationship exists. However, discordant pairs exist, indicating a
negative relationship (inverse relationship) between variables.
134
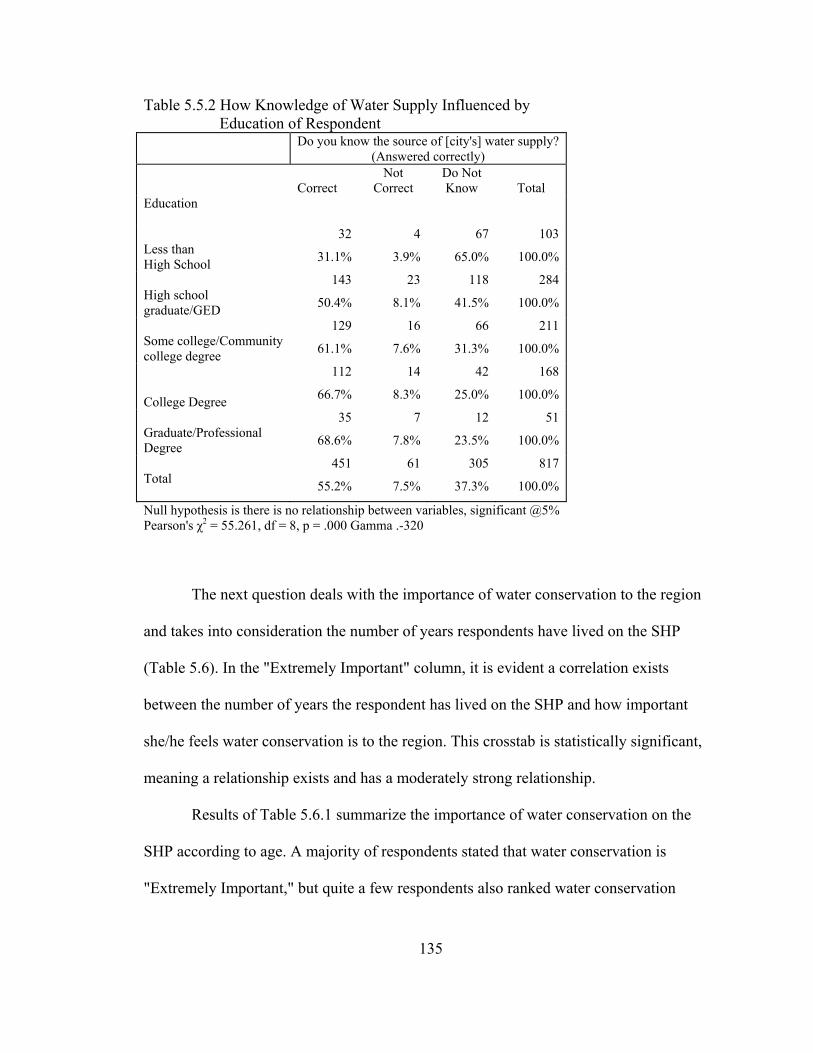
Table 5.5.2 How Knowledge of Water Supply Influenced by Education of Respondent Do you know the source of [city's] water supply?
(Answered correctly)
Correct Not
Correct Do Not Know
Total
Education
Less than High School
32
31.1%
4
3.9%
67
65.0%
103
100.0%
High school graduate/GED
143
50.4%
23
8.1%
118
41.5%
284
100.0%
Some college/Community college degree
129
61.1%
16
7.6%
66
31.3%
211
100.0%
College Degree
112
66.7%
14
8.3%
42
25.0%
168
100.0%
Graduate/Professional Degree
35 7 12 51
68.6% 7.8% 23.5% 100.0%
Total
451
55.2%
61
7.5%
305
37.3%
817
100.0%
Null hypothesis is there is no relationship between variables, significant @5% Pearson's χ2 = 55.261, df = 8, p = .000 Gamma .-320
The next question deals with the importance of water conservation to the region
and takes into consideration the number of years respondents have lived on the SHP
(Table 5.6). In the "Extremely Important" column, it is evident a correlation exists
between the number of years the respondent has lived on the SHP and how important
she/he feels water conservation is to the region. This crosstab is statistically significant,
meaning a relationship exists and has a moderately strong relationship.
Results of Table 5.6.1 summarize the importance of water conservation on the
SHP according to age. A majority of respondents stated that water conservation is
"Extremely Important," but quite a few respondents also ranked water conservation
135
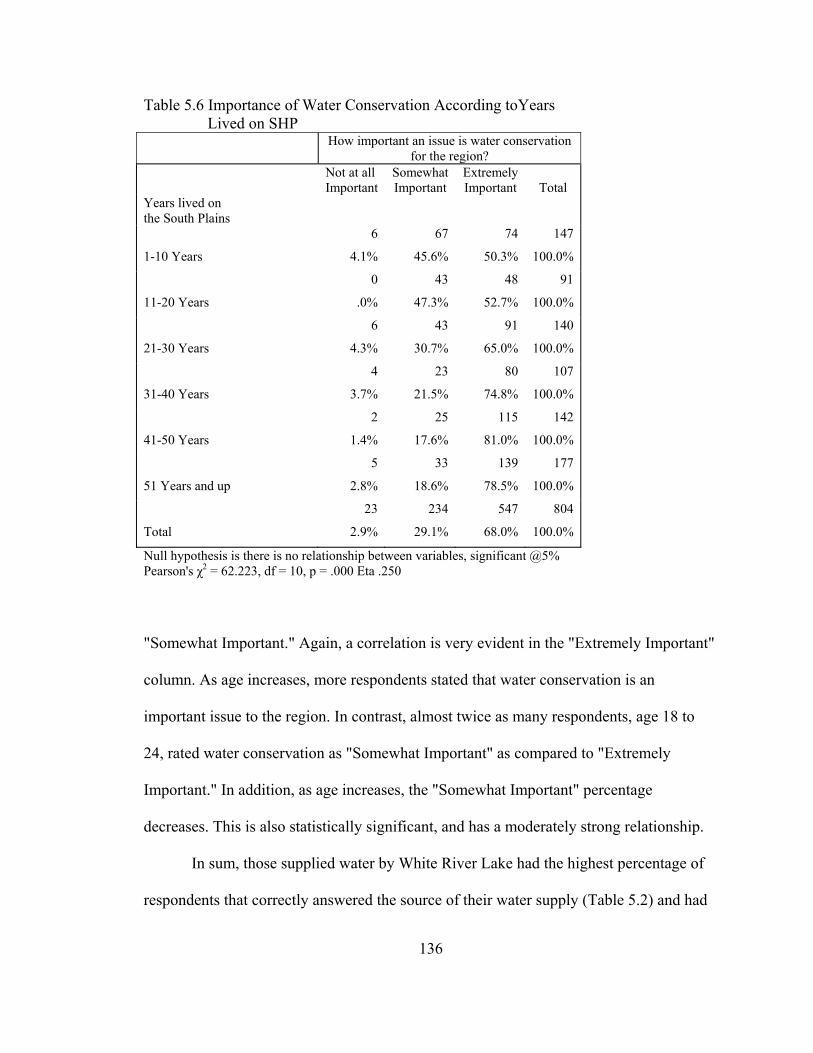
Table 5.6 Importance of Water Conservation According toYears Lived on SHP
How important an issue is water conservation for the region?
Not at all Somewhat Extremely Important Important Important Total Years lived on the South Plains 6 67 74 147
1-10 Years 4.1% 45.6% 50.3% 100.0%
0
.0%
43
47.3%
48
11-20 Years 52.7%
91
100.0%
21-30 Years
6
4.3%
43
30.7%
91
65.0%
140
100.0%
31-40 Years
4
3.7%
23
21.5%
80
74.8%
107
100.0%
41-50 Years
2
1.4%
25
17.6%
115
81.0%
142
100.0%
51 Years and up
5 33 139 177
2.8% 18.6% 78.5% 100.0%
23
Total 2.9%
234
29.1%
547
68.0%
804
100.0%
Null hypothesis is there is no relationship between variables, significant @5% Pearson's χ2 = 62.223, df = 10, p = .000 Eta .250
"Somewhat Important." Again, a correlation is very evident in the "Extremely Important"
column. As age increases, more respondents stated that water conservation is an
important issue to the region. In contrast, almost twice as many respondents, age 18 to
24, rated water conservation as "Somewhat Important" as compared to "Extremely
Important." In addition, as age increases, the "Somewhat Important" percentage
decreases. This is also statistically significant, and has a moderately strong relationship.
In sum, those supplied water by White River Lake had the highest percentage of
respondents that correctly answered the source of their water supply (Table 5.2) and had
136
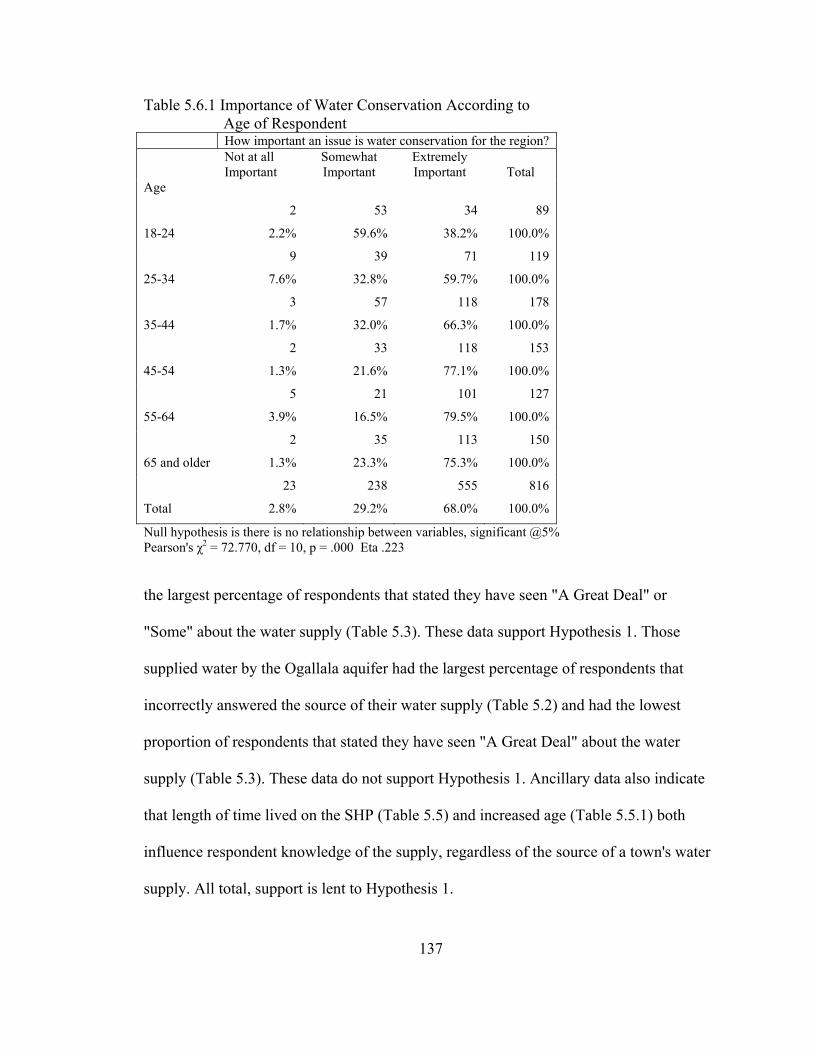
Table 5.6.1 Importance of Water Conservation According to Age of Respondent How important an issue is water conservation for the region? Not at all
Important Somewhat Important
Extremely Important
Total
Age
18-24
2
2.2%
53
59.6%
34
38.2%
89
100.0%
25-34
9
7.6%
39
32.8%
71
59.7%
119
100.0%
35-44
3
1.7%
57
32.0%
118
66.3%
178
100.0%
45-54
2
1.3%
33
21.6%
118
77.1%
153
100.0%
55-64
5
3.9%
21
16.5%
101
79.5%
127
100.0%
65 and older
2 35 113 150
1.3% 23.3% 75.3% 100.0%
23 238 555 816
Total 2.8% 29.2% 68.0% 100.0%
Null hypothesis is there is no relationship between variables, significant @5% Pearson's χ2 = 72.770, df = 10, p = .000 Eta .223
the largest percentage of respondents that stated they have seen "A Great Deal" or
"Some" about the water supply (Table 5.3). These data support Hypothesis 1. Those
supplied water by the Ogallala aquifer had the largest percentage of respondents that
incorrectly answered the source of their water supply (Table 5.2) and had the lowest
proportion of respondents that stated they have seen "A Great Deal" about the water
supply (Table 5.3). These data do not support Hypothesis 1. Ancillary data also indicate
that length of time lived on the SHP (Table 5.5) and increased age (Table 5.5.1) both
influence respondent knowledge of the supply, regardless of the source of a town's water
supply. All total, support is lent to Hypothesis 1.
137
Issue Area II- Attitudes toward Water Conservation
As mentioned previously, water is not an abundant resource on the SHP of Texas.
With record low rainfall for the past several years, the region's surface water storage has
dropped to critically low levels. Even with one year of almost double the average annual
precipitation in 2004, area reservoirs did not recover from record low capacity. Most
residents on the SHP have not experienced a shortage of water, and take for granted and
expect that water is available when a faucet is turned on. Water issues are becoming a
more widely discussed topic today, and will be more important in the very near future.
With all regional sources of water declining (or maintaining a low capacity), the time is
near for local community leaders to call for a more efficient use of this limited resource.
Section II summarizes attitudes of respondents/consumers toward water
conservation. In the first subsection, attitudes toward water conservation of urban and
rural respondents on the SHP are compared. In the second subsection, attitudes toward
water conservation as a governmental policy issue are analyzed.
Urban versus Rural Attitudes toward Water Conservation
Limited research discussed previously (see "The Urban versus Rural Attitude"
section, Chapter II) suggests urban and rural residents are somewhat equally split as to
concern for the environment. (Five of the six towns in this study are considered rural
communities: Abernathy, Crosbyton, Littlefield, Post and Slaton). In these towns,
agriculture is the dominant economic base. More efficient irrigation application methods
are a result of improved technology and design of equipment. In addition, genetic
138
engineering has produced more drought tolerant crop varieties. Thus, most residents in
the rural areas (Abernathy, Crosbyton, Littlefield, Post and Slaton) should have a more
positive attitude toward the water supply and be more receptive to municipal water
conservation measures than residents who live in a more urban setting (Lubbock)
(Hypothesis 2A).
Table 5.7 ranks the importance of attitudes of residents on the SHP concerning
regional issues such as crime, education, the economy and water conservation. In the "By
City" category, education was by far the most important issue to respondents. In the "By
City" section, only Crosbyton and Post (the two towns supplied water by WRMWD)
ranked water conservation second, behind education. Respondents in Abernathy and
Littlefield ranked water conservation third behind education and crime. Towns supplied
water from CRMWA (Lubbock and Slaton) ranked water conservation last among the
four issues. When looking specifically at the category "Water Conservation" by itself
(Table 5.7 above), a majority of respondents in all towns ranked water conservation as
either "Somewhat Important" or "Extremely Important."
When the issue of water conservation was categorized by water source, those
supplied water by the Ogallala aquifer ranked water conservation first with
approximately 75%, towns supplied water by White River Lake second and Lubbock and
Slaton (supplied water by CRMWA) ranked water conservation a distant third (at 59%).
(These data support Hypothesis 2A).
139
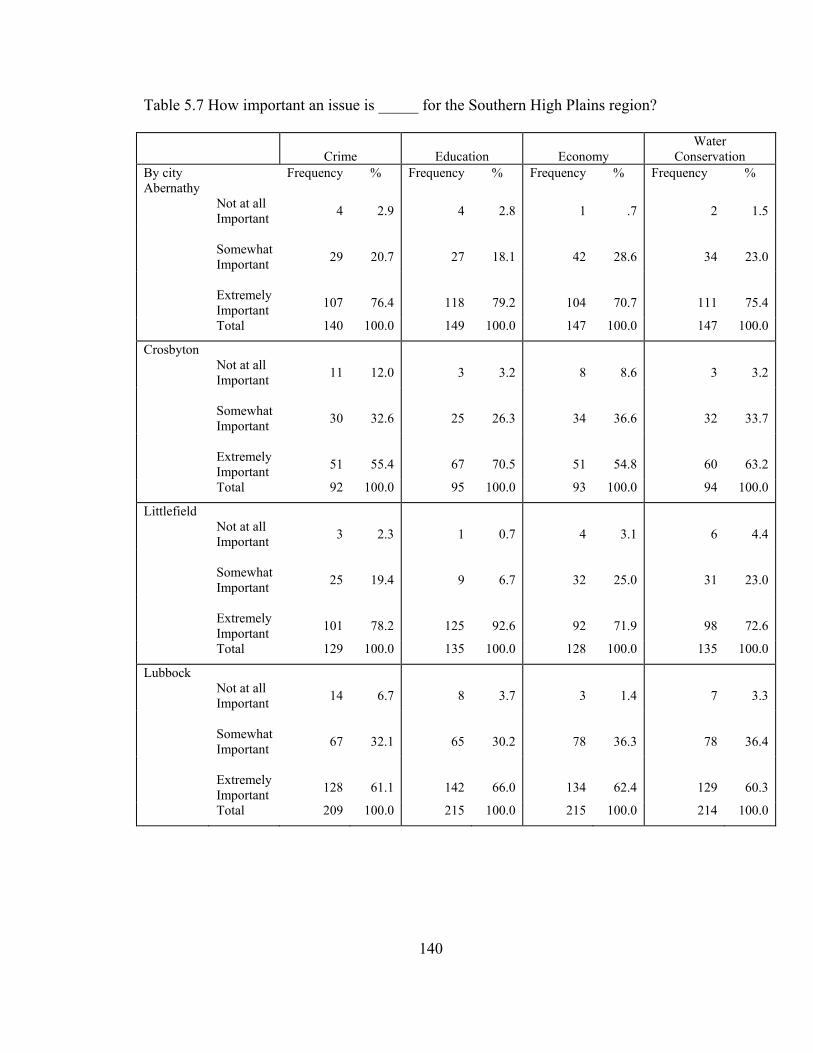
Table 5.7 How important an issue is _____ for the Southern High Plains region?
Crime
Education
Economy Water
Conservation By city Frequency % Frequency % Frequency % Frequency % Abernathy
Not at all Important
4
2.9
4
2.8
1
.7
2
1.5
Somewhat Important
29
20.7
27
18.1
42
28.6
34
23.0
Extremely Important
107
76.4
118
79.2
104
70.7
111
75.4
Total 140 100.0 149 100.0 147 100.0 147 100.0
Crosbyton Not at all Important
11
12.0
3
3.2
8
8.6
3
3.2
Somewhat Important
30
32.6
25
26.3
34
36.6
32
33.7
Extremely Important
51
55.4
67
70.5
51
54.8
60
63.2
Total 92 100.0 95 100.0 93 100.0 94 100.0
Littlefield Not at all Important
3
2.3
1
0.7
4
3.1
6
4.4
Somewhat Important
25
19.4
9
6.7
32
25.0
31
23.0
Extremely Important
101
78.2
125
92.6
92
71.9
98
72.6
Total 129 100.0 135 100.0 128 100.0 135 100.0
Lubbock
Not at all Important
14
6.7
8
3.7
3
1.4
7
3.3
Somewhat Important
67
32.1
65
30.2
78
36.3
78
36.4
Extremely Important
128
61.1
142
66.0
134
62.4
129
60.3
Total 209 100.0 215 100.0 215 100.0 214 100.0
140
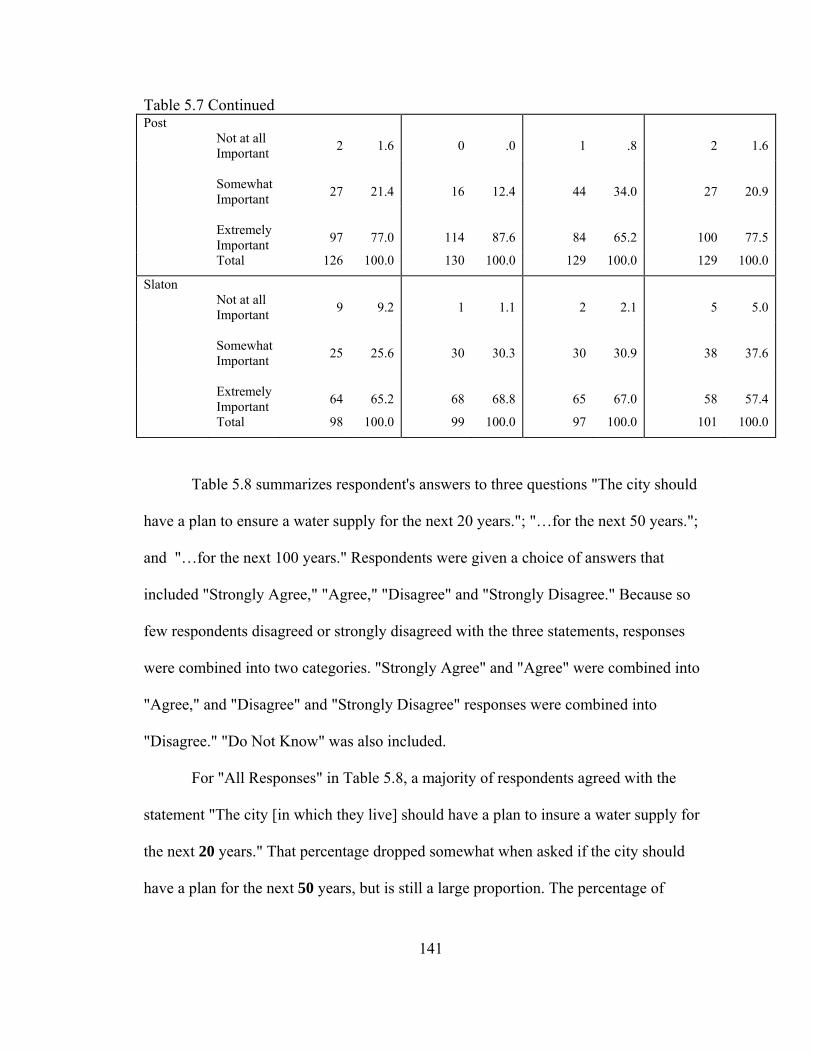
Table 5.7 Continued Post
Not at all Important
2
1.6
0
.0
1
.8
2
1.6
Somewhat Important
27
21.4
16
12.4
44
34.0
27
20.9
Extremely Important
97
77.0
114
87.6
84
65.2
100
77.5
Total 126 100.0 130 100.0 129 100.0 129 100.0
Slaton Not at all Important
9
9.2
1
1.1
2
2.1
5
5.0
Somewhat Important
25
25.6
30
30.3
30
30.9
38
37.6
Extremely Important
64
65.2
68
68.8
65 67.0 58 57.4
Total 98 100.0 99 100.0 97 100.0 101 100.0
Table 5.8 summarizes respondent's answers to three questions "The city should
have a plan to ensure a water supply for the next 20 years."; "…for the next 50 years.";
and "…for the next 100 years." Respondents were given a choice of answers that
included "Strongly Agree," "Agree," "Disagree" and "Strongly Disagree." Because so
few respondents disagreed or strongly disagreed with the three statements, responses
were combined into two categories. "Strongly Agree" and "Agree" were combined into
"Agree," and "Disagree" and "Strongly Disagree" responses were combined into
"Disagree." "Do Not Know" was also included.
For "All Responses" in Table 5.8, a majority of respondents agreed with the
statement "The city [in which they live] should have a plan to insure a water supply for
the next 20 years." That percentage dropped somewhat when asked if the city should
have a plan for the next 50 years, but is still a large proportion. The percentage of
141
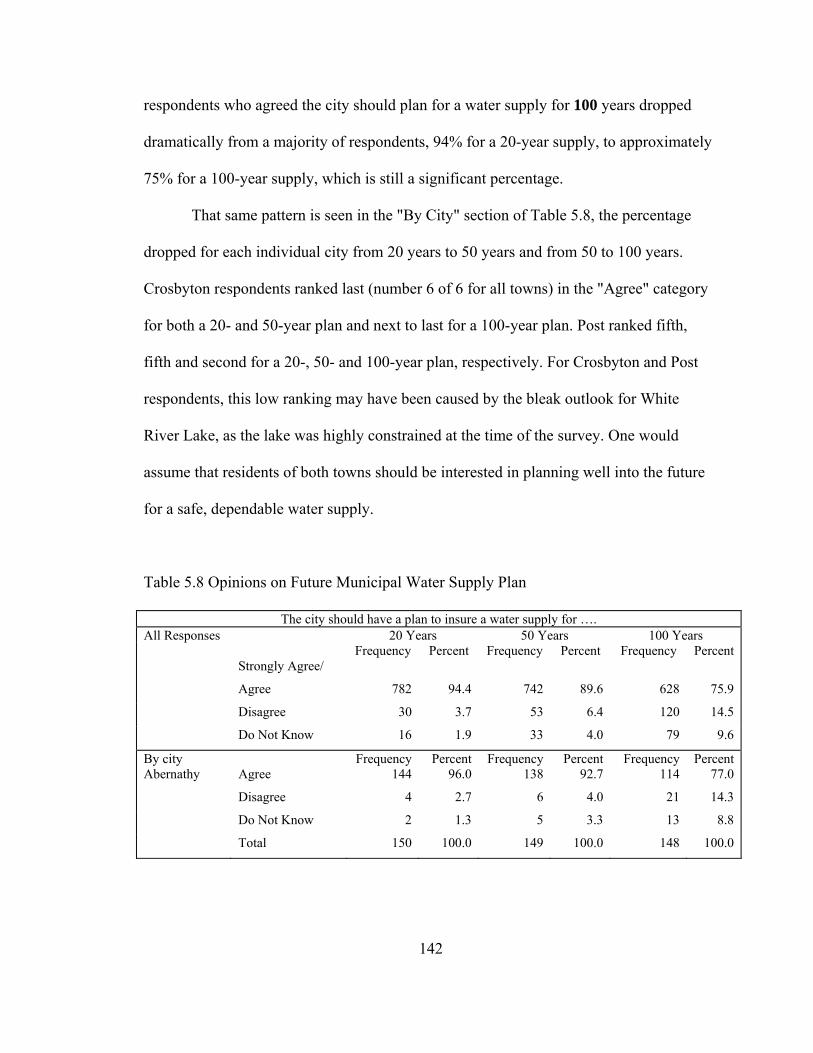
respondents who agreed the city should plan for a water supply for 100 years dropped
dramatically from a majority of respondents, 94% for a 20-year supply, to approximately
75% for a 100-year supply, which is still a significant percentage.
That same pattern is seen in the "By City" section of Table 5.8, the percentage
dropped for each individual city from 20 years to 50 years and from 50 to 100 years.
Crosbyton respondents ranked last (number 6 of 6 for all towns) in the "Agree" category
for both a 20- and 50-year plan and next to last for a 100-year plan. Post ranked fifth,
fifth and second for a 20-, 50- and 100-year plan, respectively. For Crosbyton and Post
respondents, this low ranking may have been caused by the bleak outlook for White
River Lake, as the lake was highly constrained at the time of the survey. One would
assume that residents of both towns should be interested in planning well into the future
for a safe, dependable water supply.
Table 5.8 Opinions on Future Municipal Water Supply Plan
The city should have a plan to insure a water supply for …. All Responses 20 Years 50 Years 100 Years Frequency Percent Frequency Percent Frequency Percent Strongly Agree/
Agree 782 94.4
742
89.6
628
75.9
Disagree 30 3.7 53 6.4 120 14.5
Do Not Know 16 1.9 33 4.0 79 9.6
By city Frequency Percent Frequency Percent Frequency Percent Abernathy Agree 144 96.0 138 92.7 114 77.0
Disagree 4 2.7 6 4.0 21 14.3
Do Not Know 2 1.3 5 3.3 13 8.8
Total 150 100.0
149 100.0 148 100.0
142
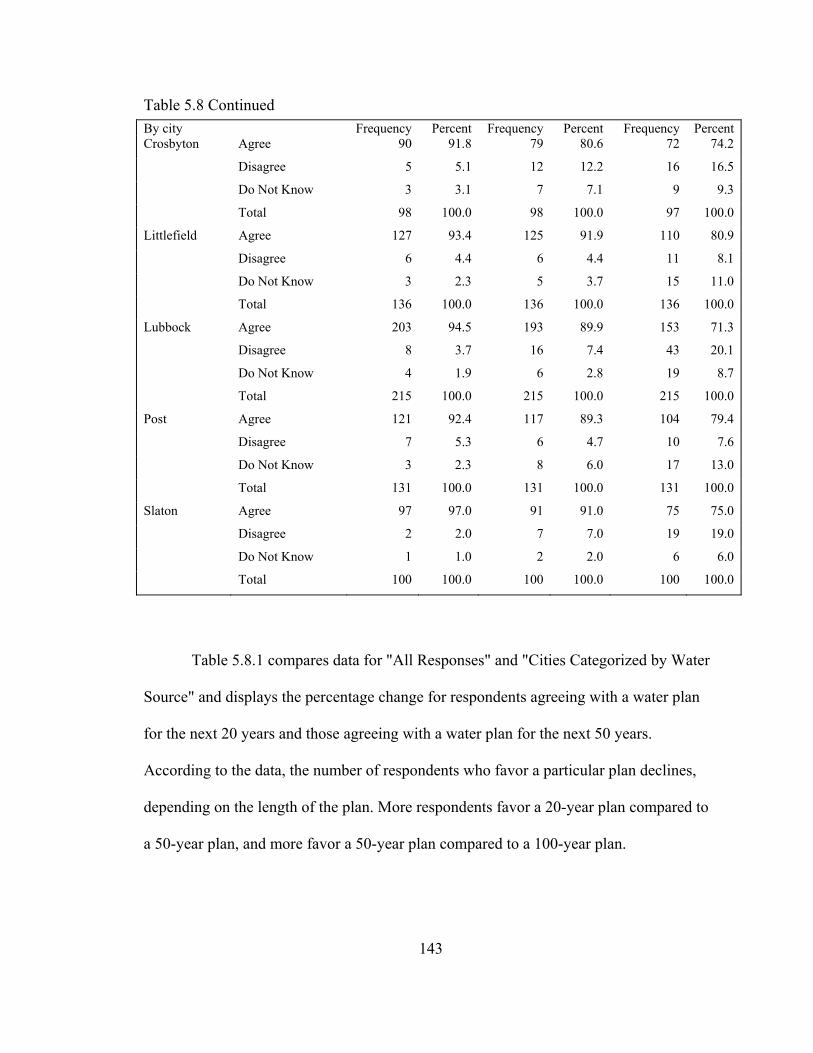
Table 5.8 Continued
By city Frequency Percent Frequency Percent Frequency Percent Crosbyton Agree 90 91.8 79 80.6 72 74.2
Disagree 5 5.1 12 12.2 16 16.5
Do Not Know 3 3.1 7 7.1 9 9.3
Total 98 100.0 98 100.0 97 100.0
Littlefield Agree 127 93.4 125 91.9 110 80.9
Disagree 6 4.4 6 4.4 11 8.1
Do Not Know 3 2.3 5 3.7 15 11.0
Total 136 100.0 136 100.0 136 100.0
Lubbock Agree 203 94.5 193 89.9 153 71.3
Disagree 8 3.7 16 7.4 43 20.1
Do Not Know 4 1.9 6 2.8 19 8.7
Total 215 100.0 215 100.0 215 100.0
Post Agree 121 92.4 117 89.3 104 79.4
Disagree 7 5.3 6 4.7 10 7.6
Do Not Know 3 2.3 8 6.0 17 13.0
Total 131 100.0 131 100.0 131 100.0
Slaton Agree 97 97.0 91 91.0 75 75.0
Disagree 2 2.0 7 7.0 19 19.0
Do Not Know 1 1.0 2 2.0 6 6.0
Total 100 100.0 100 100.0 100 100.0
Table 5.8.1 compares data for "All Responses" and "Cities Categorized by Water
Source" and displays the percentage change for respondents agreeing with a water plan
for the next 20 years and those agreeing with a water plan for the next 50 years.
According to the data, the number of respondents who favor a particular plan declines,
depending on the length of the plan. More respondents favor a 20-year plan compared to
a 50-year plan, and more favor a 50-year plan compared to a 100-year plan.
143
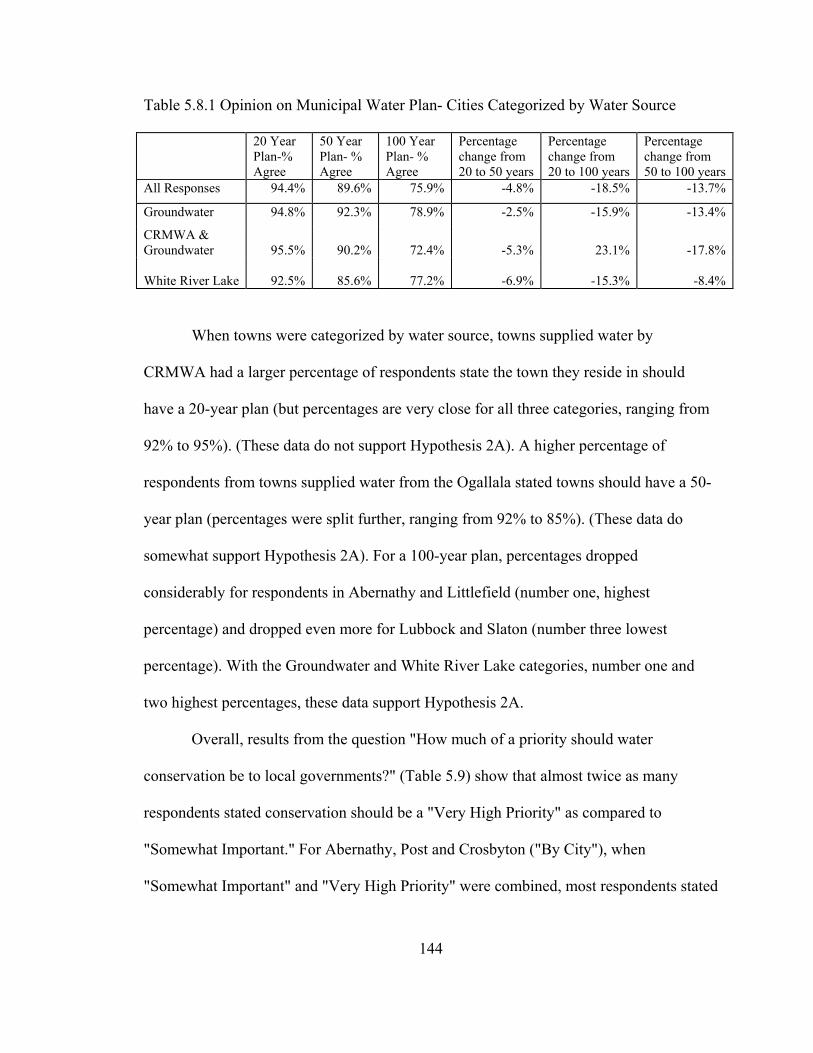
Table 5.8.1 Opinion on Municipal Water Plan- Cities Categorized by Water Source 20 Year
Plan-% Agree
50 Year Plan- % Agree
100 Year Plan- % Agree
Percentage change from 20 to 50 years
Percentage change from 20 to 100 years
Percentage change from 50 to 100 years
All Responses 94.4% 89.6% 75.9% -4.8% -18.5% -13.7%
Groundwater 94.8% 92.3% 78.9% -2.5% -15.9% -13.4%
CRMWA & Groundwater
95.5%
90.2%
72.4%
-5.3%
23.1% -17.8%
-15.3%
White River Lake 92.5% 85.6% 77.2% -6.9% -8.4%
When towns were categorized by water source, towns supplied water by
CRMWA had a larger percentage of respondents state the town they reside in should
have a 20-year plan (but percentages are very close for all three categories, ranging from
92% to 95%). (These data do not support Hypothesis 2A). A higher percentage of
respondents from towns supplied water from the Ogallala stated towns should have a 50-
year plan (percentages were split further, ranging from 92% to 85%). (These data do
somewhat support Hypothesis 2A). For a 100-year plan, percentages dropped
considerably for respondents in Abernathy and Littlefield (number one, highest
percentage) and dropped even more for Lubbock and Slaton (number three lowest
percentage). With the Groundwater and White River Lake categories, number one and
two highest percentages, these data support Hypothesis 2A.
Overall, results from the question "How much of a priority should water
conservation be to local governments?" (Table 5.9) show that almost twice as many
respondents stated conservation should be a "Very High Priority" as compared to
"Somewhat Important." For Abernathy, Post and Crosbyton ("By City"), when
"Somewhat Important" and "Very High Priority" were combined, most respondents stated
144
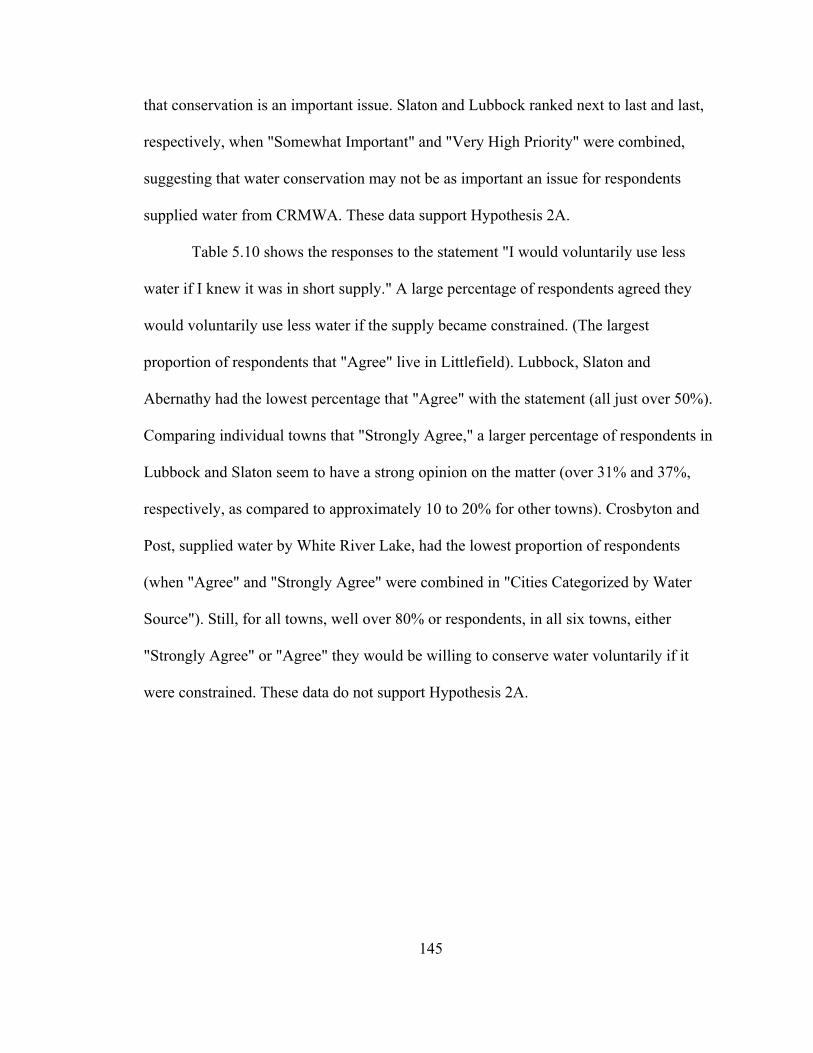
that conservation is an important issue. Slaton and Lubbock ranked next to last and last,
respectively, when "Somewhat Important" and "Very High Priority" were combined,
suggesting that water conservation may not be as important an issue for respondents
supplied water from CRMWA. These data support Hypothesis 2A.
Table 5.10 shows the responses to the statement "I would voluntarily use less
water if I knew it was in short supply." A large percentage of respondents agreed they
would voluntarily use less water if the supply became constrained. (The largest
proportion of respondents that "Agree" live in Littlefield). Lubbock, Slaton and
Abernathy had the lowest percentage that "Agree" with the statement (all just over 50%).
Comparing individual towns that "Strongly Agree," a larger percentage of respondents in
Lubbock and Slaton seem to have a strong opinion on the matter (over 31% and 37%,
respectively, as compared to approximately 10 to 20% for other towns). Crosbyton and
Post, supplied water by White River Lake, had the lowest proportion of respondents
(when "Agree" and "Strongly Agree" were combined in "Cities Categorized by Water
Source"). Still, for all towns, well over 80% or respondents, in all six towns, either
"Strongly Agree" or "Agree" they would be willing to conserve water voluntarily if it
were constrained. These data do not support Hypothesis 2A.
145
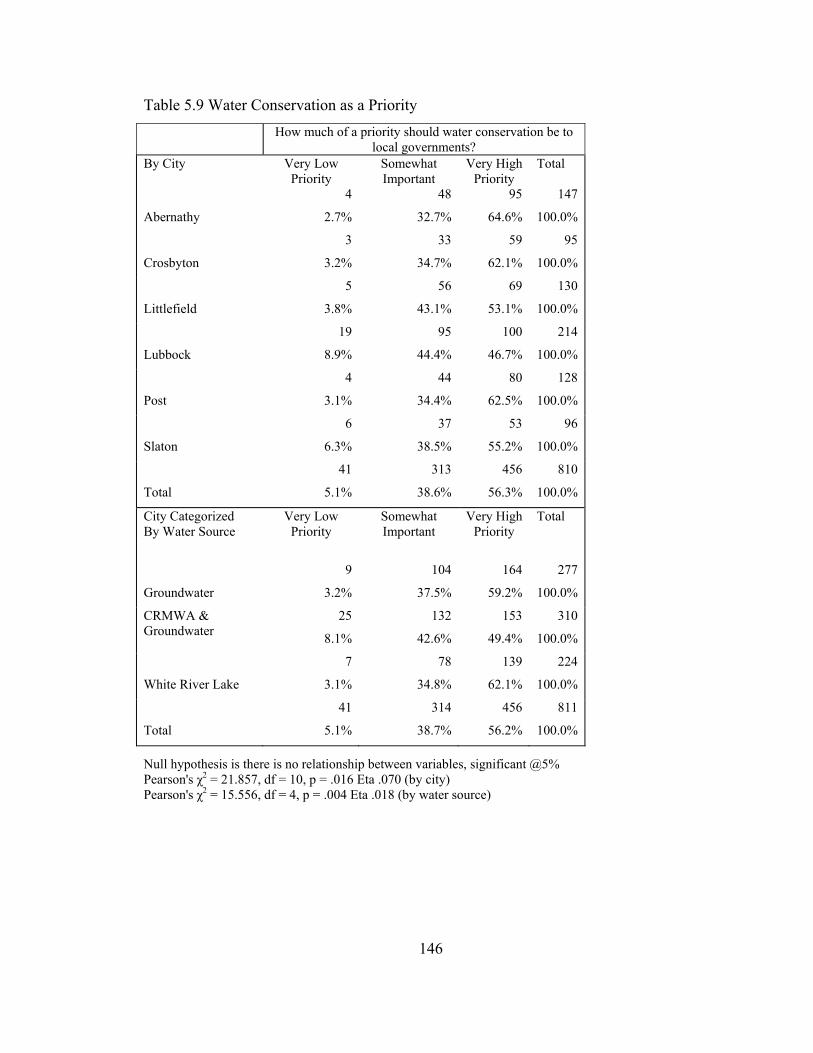
Table 5.9 Water Conservation as a Priority How much of a priority should water conservation be to
local governments? By City Very Low Somewhat Priority Important
Very High Priority
Total
Abernathy
4 48 2.7% 32.7%
95
64.6%
147
100.0%
Crosbyton
3 33
3.2% 34.7%
59
62.1%
95
100.0%
Littlefield
5 56
3.8% 43.1%
69
53.1%
130
100.0%
Lubbock
19 95
8.9% 44.4%
100
46.7%
214
100.0%
Post
4 44
3.1% 34.4%
80
62.5%
128
100.0%
Slaton
6 37
6.3% 38.5%
53
55.2%
96
100.0%
41
5.1%
313
38.6%
456 Total 56.3%
810
100.0%
City Categorized By Water Source
Very Low Priority
Somewhat Important
Very High Priority
Total
Groundwater
9
3.2%
104 164
37.5% 59.2%
277
100.0%
CRMWA & Groundwater
25 132
Null hypothesis is there is no relationship between variables, significant @5% Pearson's χ2 = 21.857, df = 10, p = .016 Eta .070 (by city) Pearson's χ2 = 15.556, df = 4, p = .004 Eta .018 (by water source)
8.1% 42.6%
153
49.4%
310
100.0%
White River Lake
7 78 139 224
3.1% 34.8% 62.1% 100.0%
41 314 456 811
Total 5.1% 38.7% 56.2% 100.0%
146
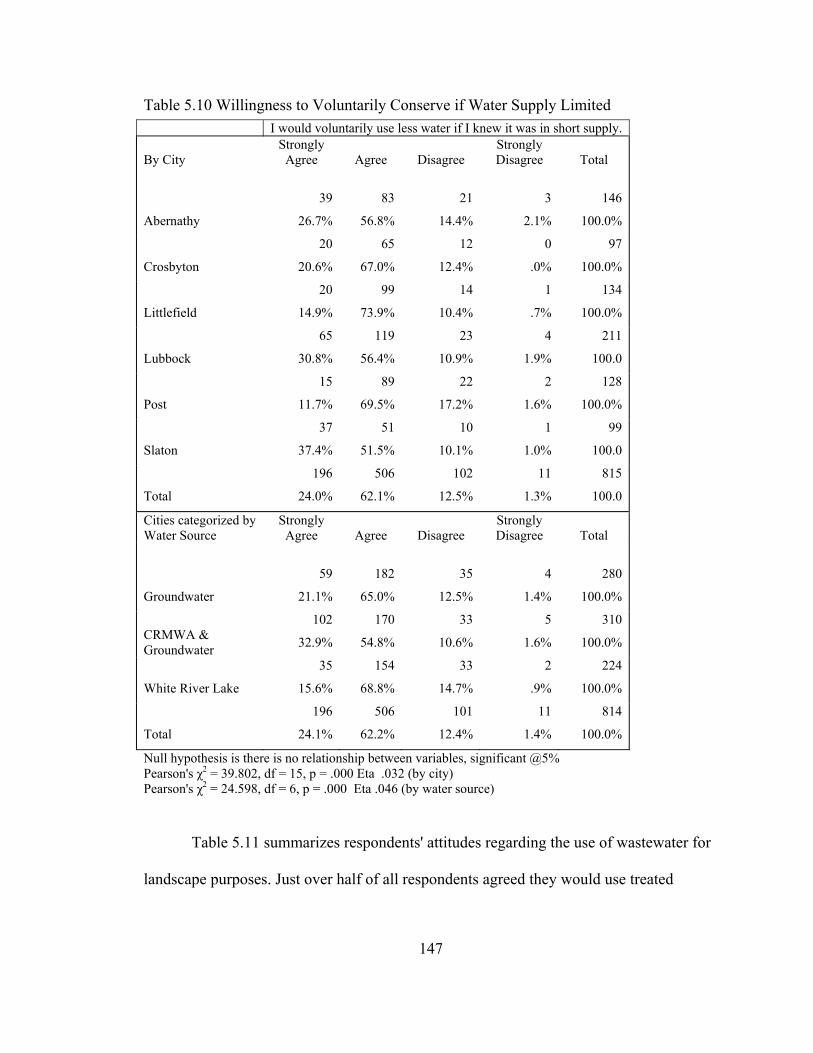
Table 5.10 Willingness to Voluntarily Conserve if Water Supply Limited
Null hypothesis is there is no relationship between variables, significant @5% Pearson's χ2 = 39.802, df = 15, p = .000 Eta .032 (by city) Pearson's χ2 = 24.598, df = 6, p = .000 Eta .046 (by water source)
I would voluntarily use less water if I knew it was in short supply. By City
Strongly Agree
Agree
Disagree
Strongly Disagree
Total
39
26.7%
83
56.8%
21
14.4%
3
Abernathy 2.1%
146
100.0%
Crosbyton
20
20.6%
65
67.0%
12 0
12.4% .0%
97
100.0%
Littlefield
20
14.9%
99
73.9%
14 1
10.4% .7%
134
100.0%
Lubbock
65
30.8%
119
56.4%
23 4
10.9% 1.9%
211
100.0
Post
15
11.7%
89
69.5%
22 2
17.2% 1.6%
128
100.0%
Slaton
37
37.4%
51
51.5%
10 1
10.1% 1.0%
99
100.0
Total
196
24.0%
506
62.1%
102
12.5%
11 815
100.0 1.3%
Cities categorized by Water Source
Strongly Agree
Agree
Disagree
Strongly Disagree
Total
59
21.1%
182
65.0%
35
12.5%
4 280
Groundwater 1.4% 100.0%
CRMWA & Groundwater
102
32.9%
170
54.8%
33 5
10.6% 1.6%
310
100.0%
White River Lake
35
15.6%
154
68.8%
33 2 224
14.7% .9% 100.0%
196
24.1%
506
Total 62.2%
101
12.4%
11
1.4%
814
100.0%
Table 5.11 summarizes respondents' attitudes regarding the use of wastewater for
landscape purposes. Just over half of all respondents agreed they would use treated
147
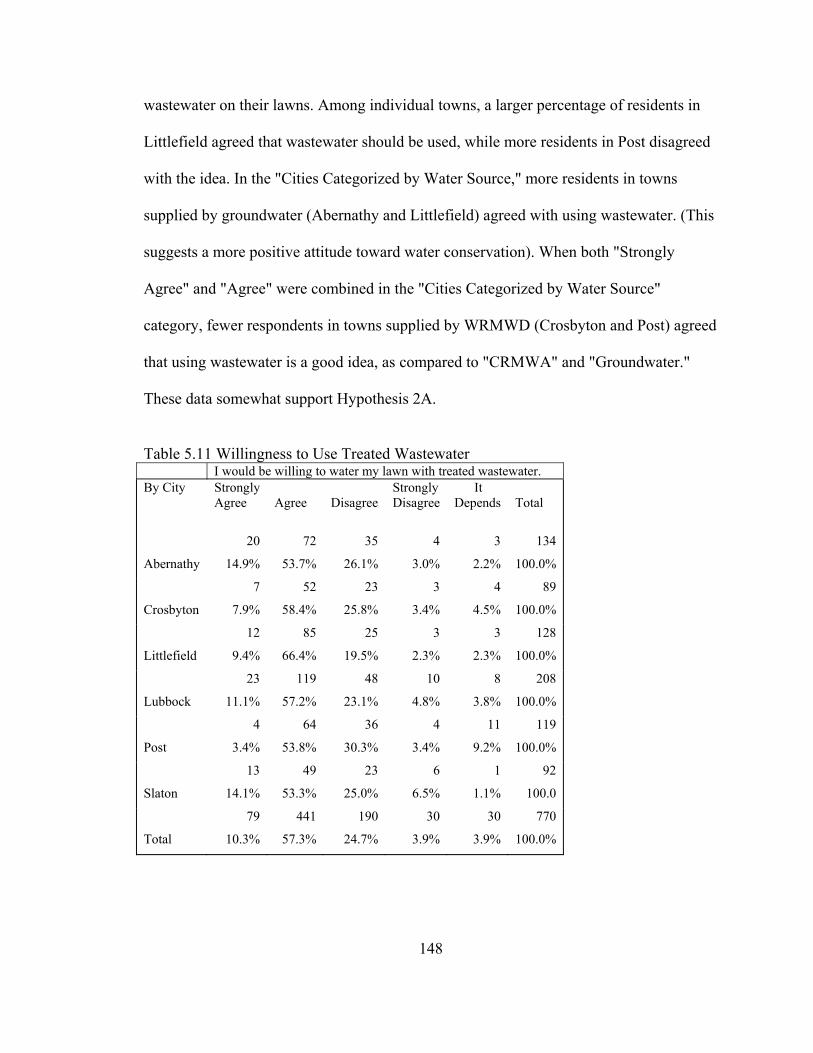
wastewater on their lawns. Among individual towns, a larger percentage of residents in
Littlefield agreed that wastewater should be used, while more residents in Post disagreed
with the idea. In the "Cities Categorized by Water Source," more residents in towns
supplied by groundwater (Abernathy and Littlefield) agreed with using wastewater. (This
suggests a more positive attitude toward water conservation). When both "Strongly
Agree" and "Agree" were combined in the "Cities Categorized by Water Source"
category, fewer respondents in towns supplied by WRMWD (Crosbyton and Post) agreed
that using wastewater is a good idea, as compared to "CRMWA" and "Groundwater."
These data somewhat support Hypothesis 2A.
Table 5.11 Willingness to Use Treated Wastewater I would be willing to water my lawn with treated wastewater. By City Strongly
Agree Agree
Disagree
Strongly Disagree
It Depends
Total
20
14.9%
72
53.7%
35
26.1%
4
3.0%
3
Abernathy 2.2%
134
100.0%
Crosbyton
7
7.9%
52
58.4%
23
25.8%
3
3.4%
4
4.5%
89
100.0%
Littlefield
12
9.4%
85
66.4%
25
19.5%
3
2.3%
3
2.3%
128
100.0%
Lubbock
23
11.1%
119
57.2%
48
23.1%
10
4.8%
8
3.8%
208
100.0%
Post
4
3.4%
64
53.8%
36
30.3%
4
3.4%
11
9.2%
119
100.0%
Slaton
13
14.1%
49
53.3%
23
25.0%
6
6.5%
1
1.1%
92
100.0
Total
79
10.3%
441
57.3%
190
24.7%
30
3.9%
30
3.9%
770
100.0%
148
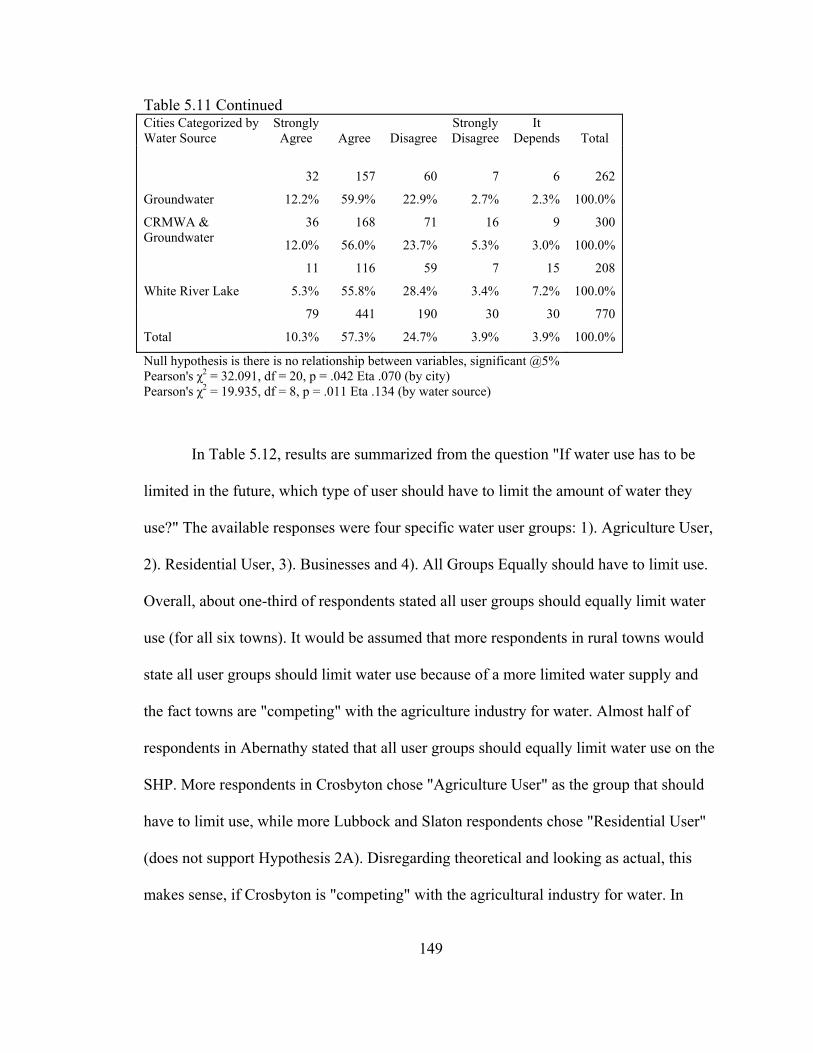
Table 5.11 Continued Cities Categorized by Water Source
Strongly Agree
Agree
Disagree
Strongly Disagree
It Depends
Total
32
12.2%
157
59.9%
60
22.9%
7
2.7%
6
Groundwater 2.3%
262
100.0%
CRMWA & Groundwater
36
12.0%
168
56.0%
71
23.7%
16
5.3%
9
3.0%
300
100.0%
White River Lake
11
5.3%
116
55.8%
59
28.4%
7
3.4%
15 208
7.2% 100.0%
79
10.3%
441 190
Total 57.3% 24.7%
30
3.9%
30
3.9%
770
100.0%
Null hypothesis is there is no relationship between variables, significant @5% Pearson's χ2 = 32.091, df = 20, p = .042 Eta .070 (by city) Pearson's χ2 = 19.935, df = 8, p = .011 Eta .134 (by water source)
In Table 5.12, results are summarized from the question "If water use has to be
limited in the future, which type of user should have to limit the amount of water they
use?" The available responses were four specific water user groups: 1). Agriculture User,
2). Residential User, 3). Businesses and 4). All Groups Equally should have to limit use.
Overall, about one-third of respondents stated all user groups should equally limit water
use (for all six towns). It would be assumed that more respondents in rural towns would
state all user groups should limit water use because of a more limited water supply and
the fact towns are "competing" with the agriculture industry for water. Almost half of
respondents in Abernathy stated that all user groups should equally limit water use on the
SHP. More respondents in Crosbyton chose "Agriculture User" as the group that should
have to limit use, while more Lubbock and Slaton respondents chose "Residential User"
(does not support Hypothesis 2A). Disregarding theoretical and looking as actual, this
makes sense, if Crosbyton is "competing" with the agricultural industry for water. In
149
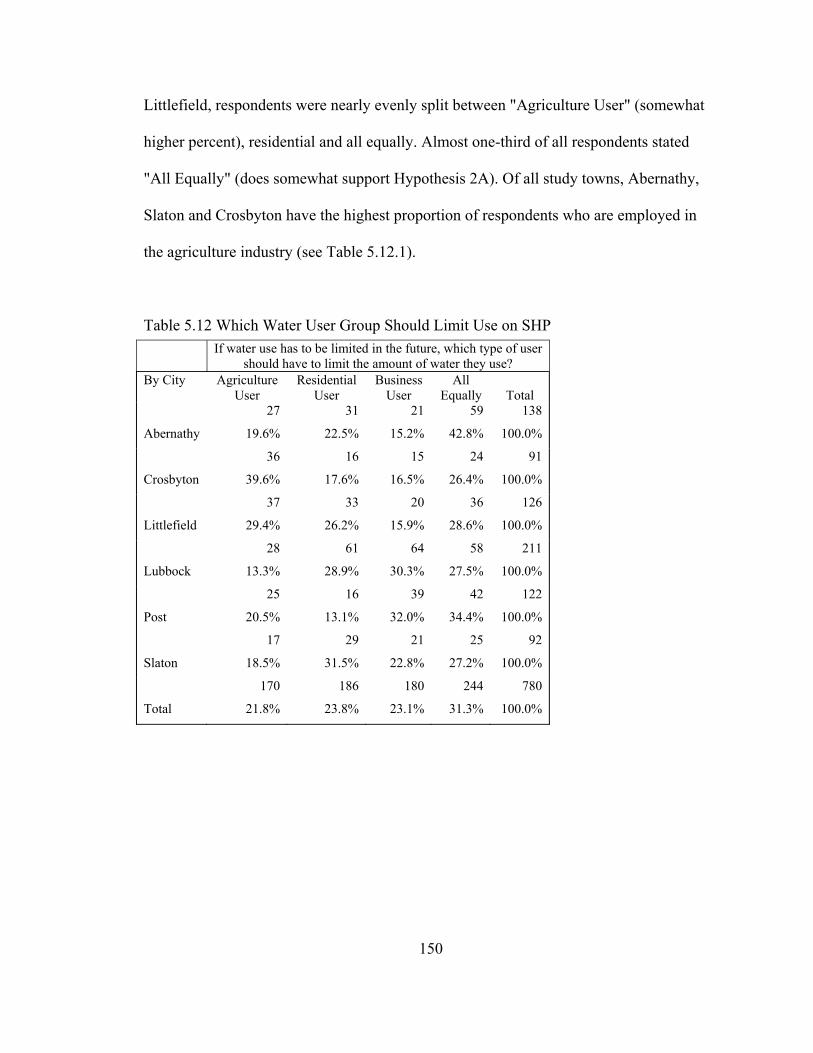
Littlefield, respondents were nearly evenly split between "Agriculture User" (somewhat
higher percent), residential and all equally. Almost one-third of all respondents stated
"All Equally" (does somewhat support Hypothesis 2A). Of all study towns, Abernathy,
Slaton and Crosbyton have the highest proportion of respondents who are employed in
the agriculture industry (see Table 5.12.1).
Table 5.12 Which Water User Group Should Limit Use on SHP If water use has to be limited in the future, which type of user
should have to limit the amount of water they use? By City Agriculture
User Residential Business All
User User Equally
Total
Abernathy
27
19.6%
31 21 59
22.5% 15.2% 42.8%
138
100.0%
Crosbyton
36
39.6%
16 15 24
17.6% 16.5% 26.4%
91
100.0%
Littlefield
37
29.4%
33 20 36
26.2% 15.9% 28.6%
126
100.0%
Lubbock
28
13.3%
61 64 58
28.9% 30.3% 27.5%
211
100.0%
Post
25
20.5%
16 39 42
13.1% 32.0% 34.4%
122
100.0%
Slaton
17
18.5%
29 21 25
31.5% 22.8% 27.2%
92
100.0%
Total
170
21.8%
186 180 244
23.8% 23.1% 31.3%
780
100.0%
150
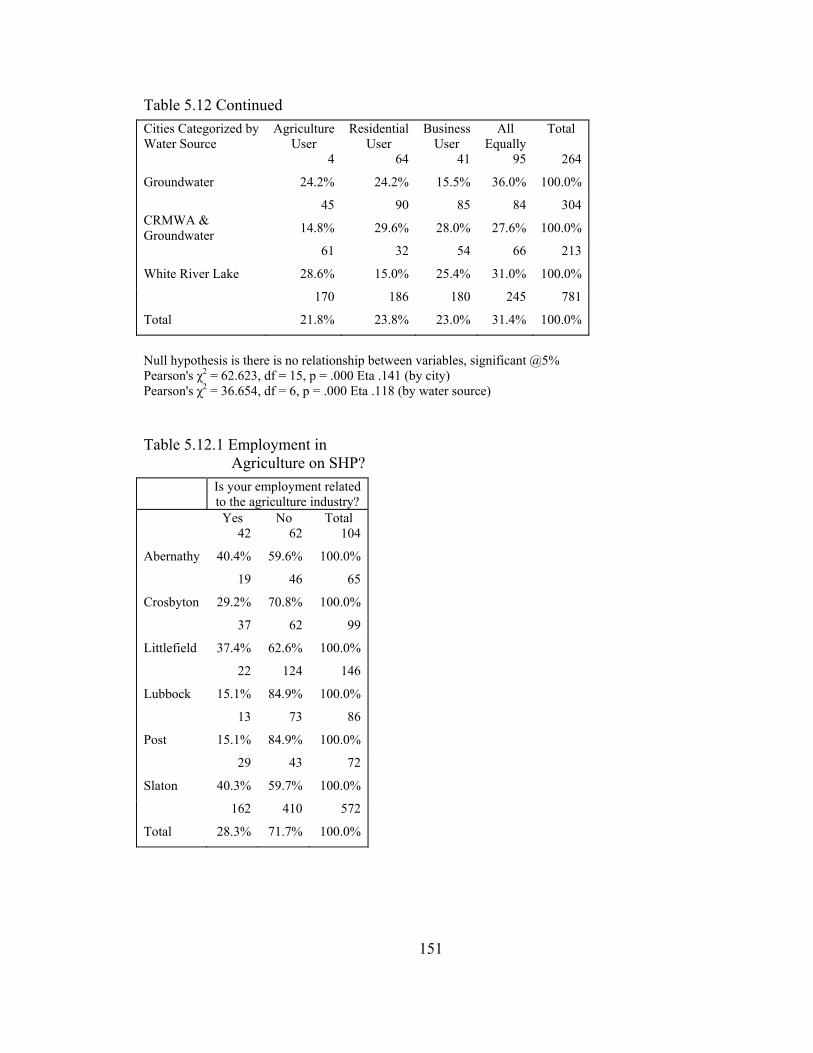
Table 5.12 Continued Cities Categorized by
Water Source Agriculture
User Residential
User Business All
User Equally Total
Groundwater
4
24.2%
64
24.2%
41 95
15.5% 36.0%
264
100.0%
CRMWA & Groundwater
45
14.8%
90 85 84
29.6% 28.0% 27.6%
304
100.0%
White River Lake
61
28.6%
32 54 66 213 15.0% 25.4% 31.0% 100.0%
Null hypothesis is there is no relationship between variables, significant @5% Pearson's χ2 = 62.623, df = 15, p = .000 Eta .141 (by city)
170 186 180 245 781
Total 21.8% 23.8% 23.0% 31.4% 100.0%
Pearson's χ2 = 36.654, df = 6, p = .000 Eta .118 (by water source)
Table 5.12.1 Employment in Agriculture on SHP?
Is your employment related to the agriculture industry?
Yes No
Total
Abernathy
42
40.4%
62 104
59.6% 100.0%
Crosbyton
19
29.2%
46 65
70.8% 100.0%
Littlefield
37
37.4%
62 99
62.6% 100.0%
Lubbock
22
15.1%
124 146
84.9% 100.0%
Post
13
15.1%
73 86
84.9% 100.0%
29 43 72
Slaton 40.3% 59.7% 100.0%
162 410 572
Total 28.3% 71.7% 100.0%
151
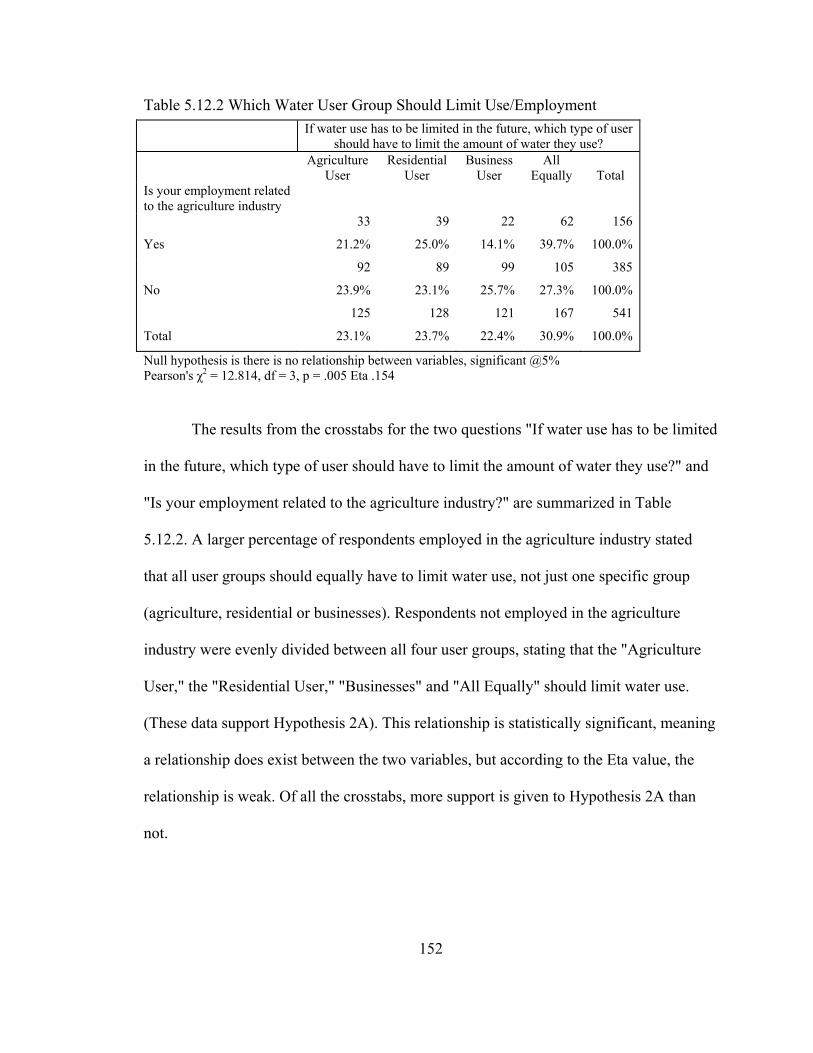
Table 5.12.2 Which Water User Group Should Limit Use/Employment If water use has to be limited in the future, which type of user should have to limit the amount of water they use? Agriculture
User Residential
User Business
User All
Equally
Null hypothesis is there is no relationship between variables, significant @5%
Total Is your employment related to the agriculture industry
33 39
Yes 21.2% 25.0%
22
14.1%
62
39.7%
156
100.0%
92 89 99 105 385
No 23.9% 23.1% 25.7% 27.3% 100.0%
125 128 121 167 541
Total 23.1% 23.7% 22.4% 30.9% 100.0%
Pearson's χ2 = 12.814, df = 3, p = .005 Eta .154
The results from the crosstabs for the two questions "If water use has to be limited
in the future, which type of user should have to limit the amount of water they use?" and
"Is your employment related to the agriculture industry?" are summarized in Table
5.12.2. A larger percentage of respondents employed in the agriculture industry stated
that all user groups should equally have to limit water use, not just one specific group
(agriculture, residential or businesses). Respondents not employed in the agriculture
industry were evenly divided between all four user groups, stating that the "Agriculture
User," the "Residential User," "Businesses" and "All Equally" should limit water use.
(These data support Hypothesis 2A). This relationship is statistically significant, meaning
a relationship does exist between the two variables, but according to the Eta value, the
relationship is weak. Of all the crosstabs, more support is given to Hypothesis 2A than
not.
152
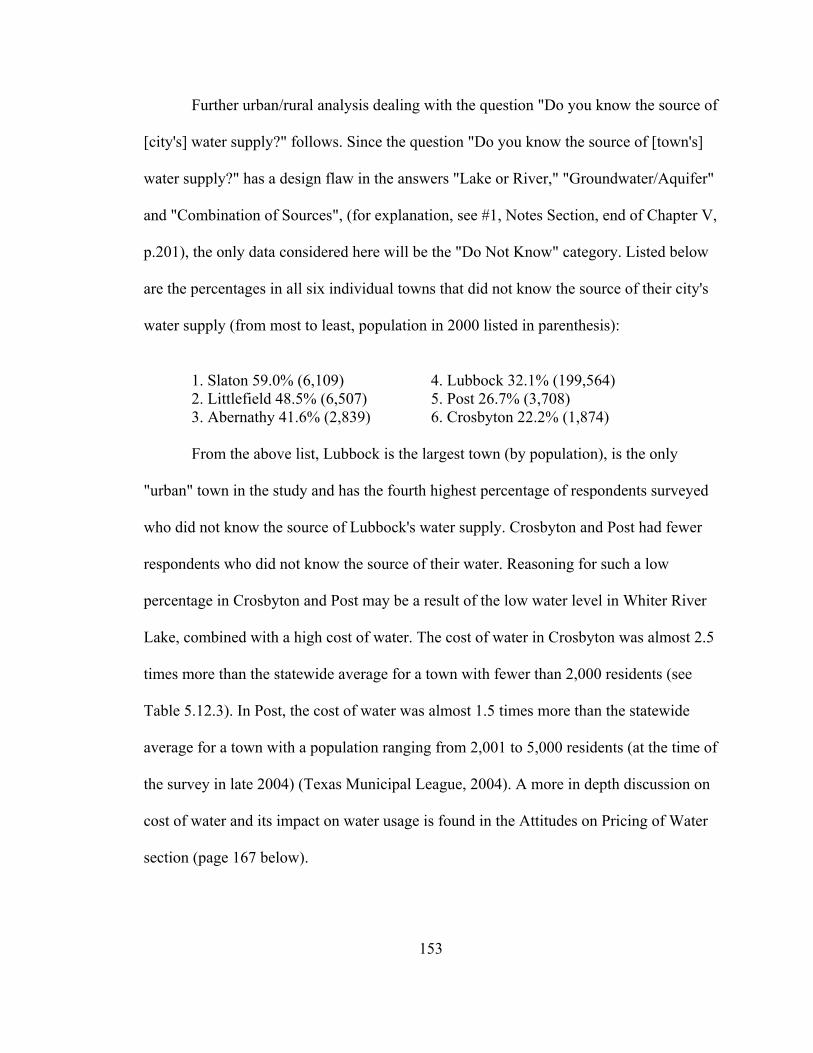
Further urban/rural analysis dealing with the question "Do you know the source of
[city's] water supply?" follows. Since the question "Do you know the source of [town's]
water supply?" has a design flaw in the answers "Lake or River," "Groundwater/Aquifer"
and "Combination of Sources", (for explanation, see #1, Notes Section, end of Chapter V,
p.201), the only data considered here will be the "Do Not Know" category. Listed below
are the percentages in all six individual towns that did not know the source of their city's
water supply (from most to least, population in 2000 listed in parenthesis):
1. Slaton 59.0% (6,109) 4. Lubbock 32.1% (199,564) 2. Littlefield 48.5% (6,507) 5. Post 26.7% (3,708) 3. Abernathy 41.6% (2,839) 6. Crosbyton 22.2% (1,874) From the above list, Lubbock is the largest town (by population), is the only
"urban" town in the study and has the fourth highest percentage of respondents surveyed
who did not know the source of Lubbock's water supply. Crosbyton and Post had fewer
respondents who did not know the source of their water. Reasoning for such a low
percentage in Crosbyton and Post may be a result of the low water level in Whiter River
Lake, combined with a high cost of water. The cost of water in Crosbyton was almost 2.5
times more than the statewide average for a town with fewer than 2,000 residents (see
Table 5.12.3). In Post, the cost of water was almost 1.5 times more than the statewide
average for a town with a population ranging from 2,001 to 5,000 residents (at the time of
the survey in late 2004) (Texas Municipal League, 2004). A more in depth discussion on
cost of water and its impact on water usage is found in the Attitudes on Pricing of Water
section (page 167 below).
153
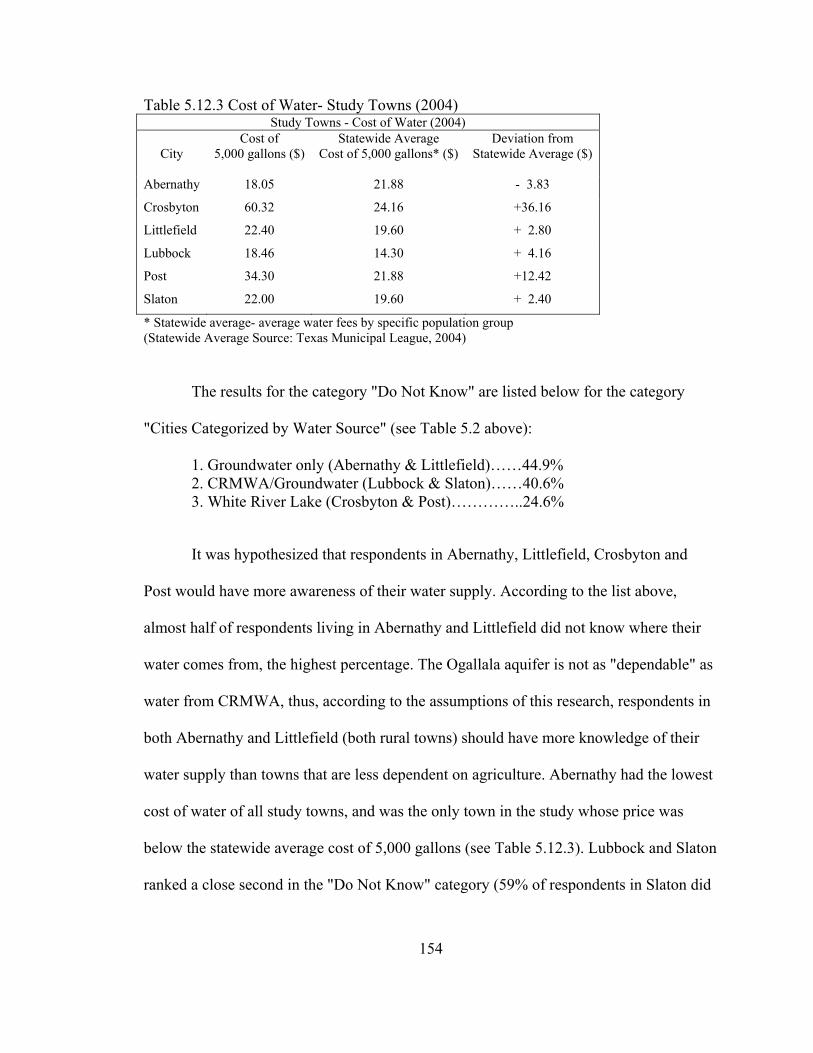
Table 5.12.3 Cost of Water- Study Towns (2004) Study Towns - Cost of Water (2004)
City
Cost of 5,000 gallons ($)
Statewide Average Cost of 5,000 gallons* ($)
Deviation from Statewide Average ($)
Abernathy 18.05 21.88 - 3.83
Crosbyton 60.32 24.16 +36.16
Littlefield 22.40 19.60 + 2.80
Lubbock 18.46 14.30 + 4.16
Post 34.30 21.88 +12.42
Slaton 22.00 19.60 + 2.40
* Statewide average- average water fees by specific population group (Statewide Average Source: Texas Municipal League, 2004)
The results for the category "Do Not Know" are listed below for the category
"Cities Categorized by Water Source" (see Table 5.2 above):
1. Groundwater only (Abernathy & Littlefield)……44.9% 2. CRMWA/Groundwater (Lubbock & Slaton)……40.6% 3. White River Lake (Crosbyton & Post)…………..24.6%
It was hypothesized that respondents in Abernathy, Littlefield, Crosbyton and
Post would have more awareness of their water supply. According to the list above,
almost half of respondents living in Abernathy and Littlefield did not know where their
water comes from, the highest percentage. The Ogallala aquifer is not as "dependable" as
water from CRMWA, thus, according to the assumptions of this research, respondents in
both Abernathy and Littlefield (both rural towns) should have more knowledge of their
water supply than towns that are less dependent on agriculture. Abernathy had the lowest
cost of water of all study towns, and was the only town in the study whose price was
below the statewide average cost of 5,000 gallons (see Table 5.12.3). Lubbock and Slaton
ranked a close second in the "Do Not Know" category (59% of respondents in Slaton did
154
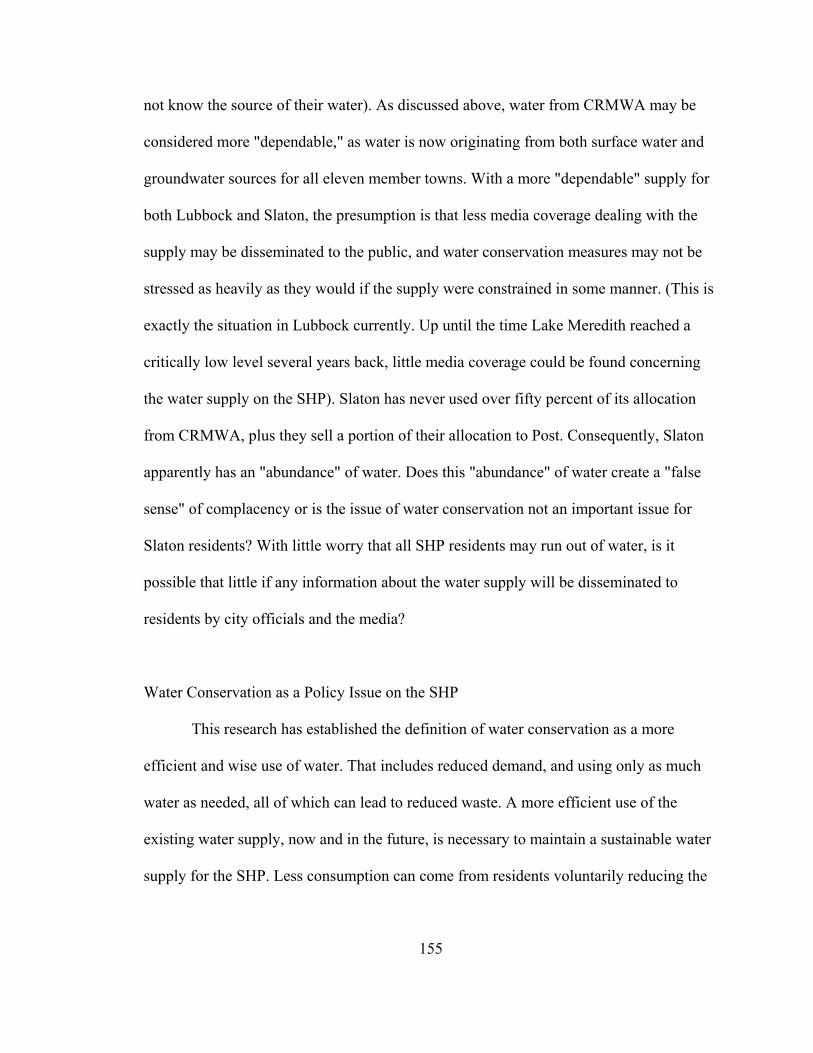
not know the source of their water). As discussed above, water from CRMWA may be
considered more "dependable," as water is now originating from both surface water and
groundwater sources for all eleven member towns. With a more "dependable" supply for
both Lubbock and Slaton, the presumption is that less media coverage dealing with the
supply may be disseminated to the public, and water conservation measures may not be
stressed as heavily as they would if the supply were constrained in some manner. (This is
exactly the situation in Lubbock currently. Up until the time Lake Meredith reached a
critically low level several years back, little media coverage could be found concerning
the water supply on the SHP). Slaton has never used over fifty percent of its allocation
from CRMWA, plus they sell a portion of their allocation to Post. Consequently, Slaton
apparently has an "abundance" of water. Does this "abundance" of water create a "false
sense" of complacency or is the issue of water conservation not an important issue for
Slaton residents? With little worry that all SHP residents may run out of water, is it
possible that little if any information about the water supply will be disseminated to
residents by city officials and the media?
Water Conservation as a Policy Issue on the SHP
This research has established the definition of water conservation as a more
efficient and wise use of water. That includes reduced demand, and using only as much
water as needed, all of which can lead to reduced waste. A more efficient use of the
existing water supply, now and in the future, is necessary to maintain a sustainable water
supply for the SHP. Less consumption can come from residents voluntarily reducing the
155
amount used or it can be forced on the residents in mandatory restrictions that can affect
when and how much water may be used. Of the six towns included in the study, Lubbock
is the only town that has implemented voluntary water conservation measures.
Should towns in the study area implement restrictions or punitive measures
because of resource constraints or for over use or waste of the resource? Is there an
attitude difference, concerning water conservation as a policy issue, between residents of
towns being supplied water from different sources (groundwater versus CRMWA versus
WRMWD) on the SHP? Because of source/supply constraints, residents of towns
supplied by groundwater and WRMWD, will have more positive attitudes toward water
conservation as a policy issue (voluntary or mandatory restrictions and fines) than
residents of towns supplied water by CRMWA (Hypothesis 2B).
In all six towns, a large percentage of respondents "Agree" that voluntary water
conservation measures are a good method of meeting the future water needs on the SHP
(see Table 5.13). Littlefield ranked highest with the most that "Agree," Post and
Crosbyton were second and third, respectively. The percentage of respondents with a
strong opinion (Strongly Agree) that voluntary measures are a good method of
conserving water ranged from 10% to almost 30% for all six towns. These data support
Hypothesis 2B. In the "Cities Categorized by Water Source," most (almost 80% of
respondents) "Agree" or "Strongly Agree" with voluntary measures. ("Voluntary
measures" was compared to "Age" and "Years Lived on the SHP." Most agreed with
voluntary restriction in both crosstabs, but neither one is statistically significant).
156
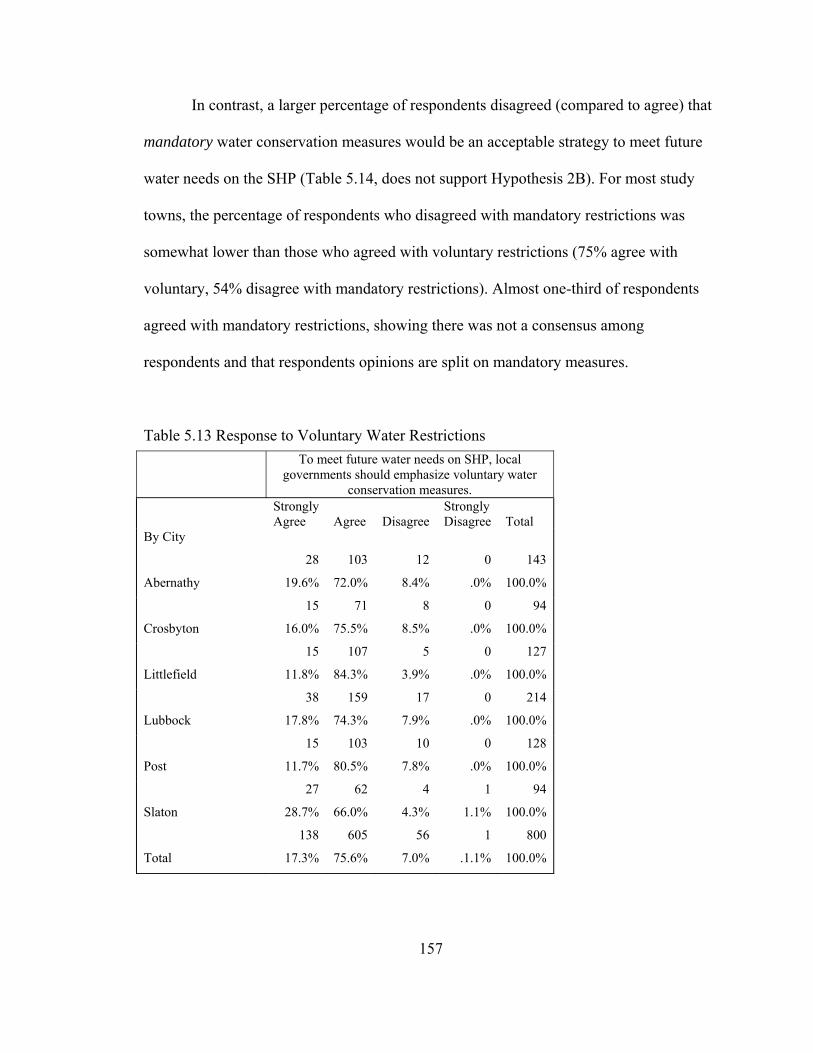
In contrast, a larger percentage of respondents disagreed (compared to agree) that
mandatory water conservation measures would be an acceptable strategy to meet future
water needs on the SHP (Table 5.14, does not support Hypothesis 2B). For most study
towns, the percentage of respondents who disagreed with mandatory restrictions was
somewhat lower than those who agreed with voluntary restrictions (75% agree with
voluntary, 54% disagree with mandatory restrictions). Almost one-third of respondents
agreed with mandatory restrictions, showing there was not a consensus among
respondents and that respondents opinions are split on mandatory measures.
Table 5.13 Response to Voluntary Water Restrictions
To meet future water needs on SHP, local governments should emphasize voluntary water
conservation measures. Strongly
Agree Agree
Strongly Disagree Disagree
Total
By City
Abernathy
28
19.6%
12
8.4%
0
.0%
143
100.0%
103
72.0%
15 71
75.5%
8
8.5%
0
.0%
94
100.0%
Crosbyton 16.0% 15 107
84.3%
5
3.9%
0
.0%
127
100.0% Littlefield 11.8%
38 159
74.3%
17
7.9%
0
.0%
214
100.0% Lubbock 17.8% 15
103
80.5%
10
7.8%
0
.0%
128
100.0% Post 11.7%
27 62 4 1 94
Slaton 28.7% 66.0% 4.3% 1.1% 100.0%
138 605 56 1 800
Total 17.3% 75.6% 7.0% .1.1% 100.0%
157
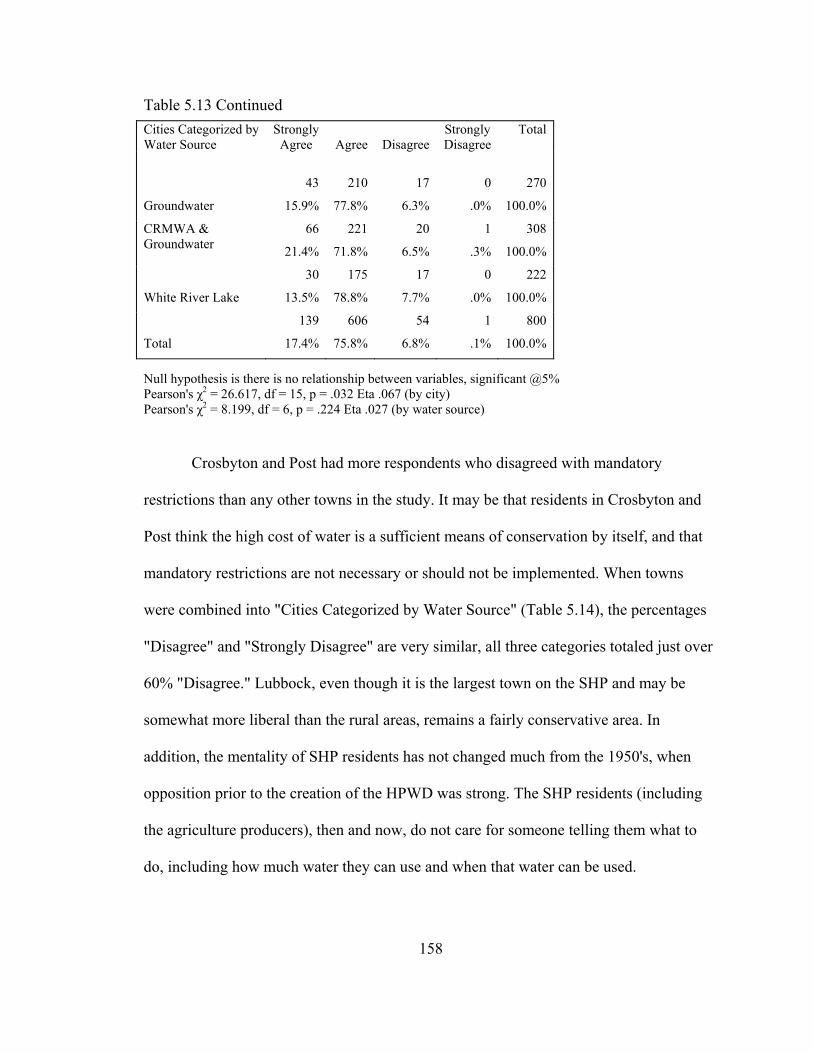
Table 5.13 Continued
Cities Categorized by Water Source
Strongly Agree
Strongly Agree Disagree Disagree
Total
Groundwater
43
15.9%
17
6.3%
0
.0%
270
100.0%
210
77.8%
CRMWA & 66 221
71.8%
20
6.5%
1
.3%
308
100.0% Groundwater 21.4% 30 175 17 0 222 White River Lake 13.5% 78.8% 7.7% .0% 100.0%
139 606 54 1
.1%
800
Total 17.4% 75.8% 6.8% 100.0%
Null hypothesis is there is no relationship between variables, significant @5% Pearson's χ2 = 26.617, df = 15, p = .032 Eta .067 (by city) Pearson's χ2 = 8.199, df = 6, p = .224 Eta .027 (by water source)
Crosbyton and Post had more respondents who disagreed with mandatory
restrictions than any other towns in the study. It may be that residents in Crosbyton and
Post think the high cost of water is a sufficient means of conservation by itself, and that
mandatory restrictions are not necessary or should not be implemented. When towns
were combined into "Cities Categorized by Water Source" (Table 5.14), the percentages
"Disagree" and "Strongly Disagree" are very similar, all three categories totaled just over
60% "Disagree." Lubbock, even though it is the largest town on the SHP and may be
somewhat more liberal than the rural areas, remains a fairly conservative area. In
addition, the mentality of SHP residents has not changed much from the 1950's, when
opposition prior to the creation of the HPWD was strong. The SHP residents (including
the agriculture producers), then and now, do not care for someone telling them what to
do, including how much water they can use and when that water can be used.
158
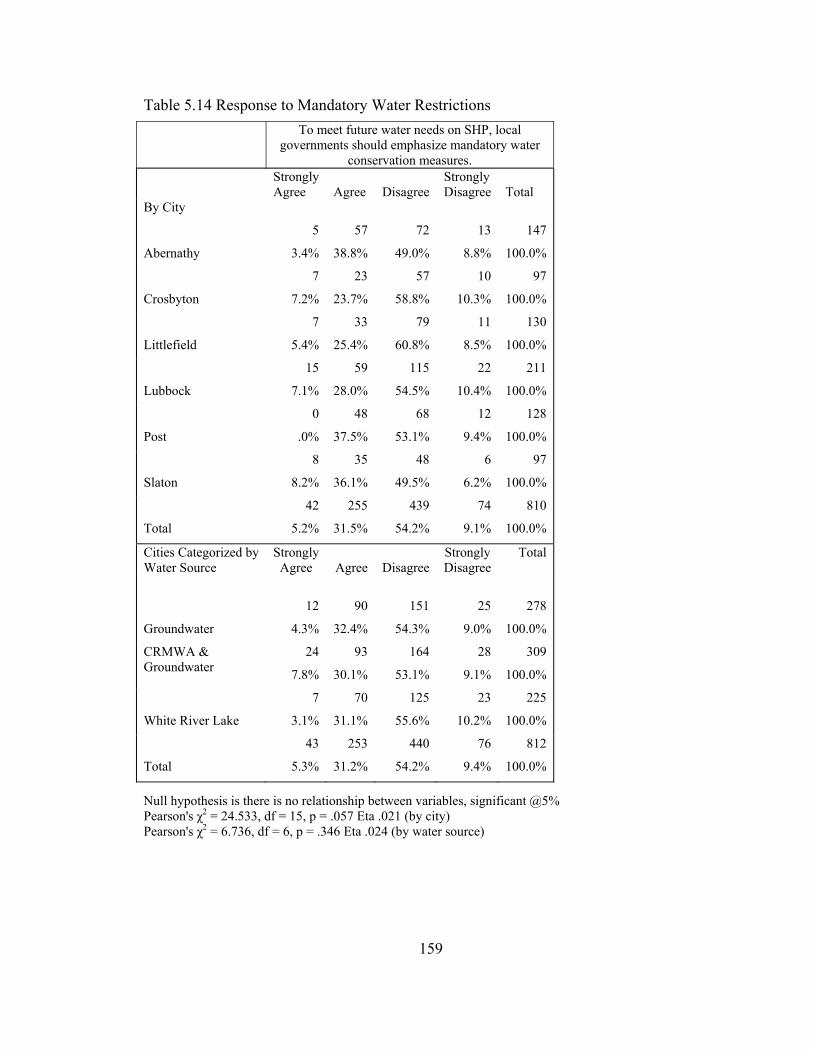
Table 5.14 Response to Mandatory Water Restrictions To meet future water needs on SHP, local
governments should emphasize mandatory water conservation measures.
Strongly Agree
Strongly Agree Disagree Disagree
Total
By City
Abernathy
5
72
49.0%
13
8.8%
147
100.0%
57
3.4% 38.8%
7
7.2%
23
23.7%
57
58.8%
10
10.3%
97
100.0% Crosbyton
7
5.4%
33
25.4%
79
60.8%
11
8.5%
130
100.0%
Littlefield
15
7.1%
59
28.0%
115
54.5%
22
10.4%
211
100.0% Lubbock
0
.0%
48
37.5%
68
53.1%
12
9.4%
128
100.0% Post
8 35
36.1%
48
49.5%
6
6.2%
97
Slaton 8.2% 100.0%
42
5.2% Total
255
31.5%
439
54.2%
74
9.1%
810
100.0%
Cities Categorized by Water Source
Strongly Agree
Agree Disagree
Strongly Disagree
Total
Groundwater
12
151
54.3%
25
9.0%
278
100.0%
90
4.3% 32.4%
CRMWA & 24
7.8%
93
30.1%
164
53.1%
28
9.1%
309
100.0% Groundwater
7 70 125 23 225
White River Lake 3.1% 31.1% 55.6% 10.2% 100.0%
Null hypothesis is there is no relationship between variables, significant @5% Pearson's χ2 = 24.533, df = 15, p = .057 Eta .021 (by city) Pearson's χ2 = 6.736, df = 6, p = .346 Eta .024 (by water source)
43 253 440 76 812
Total 5.3% 31.2% 54.2% 9.4% 100.0%
159
Table 5.14.1 displays the results of mandatory restrictions compared to age. The
18 to 24 age group had a considerably lower number of respondents that "Disagree" with
mandatory water conservation measures than all other age groups (statistically
significant, low Eta value, but a relationship does exist). In contrast, the 18 to 24 age
group had the highest percentage that "Agree" with mandatory restrictions, almost double
the number of other age groups (that "Agree"). Younger respondents, at this point in their
life, may not have established a strong political opinion. In addition, local PSAs and
educational outreach have targeted the younger water consumer, especially in schools.
The younger person may not have formed as many habits with regard to water usage, and
may not have forgotten the water conservation messages heard in school.
Table 5.14.2 summarizes the results of the crosstab between mandatory
conservation measures and the number of years lived on the SHP. A majority of
respondents disagreed with mandatory measures. For those respondents who have lived
on the SHP between 21 to 30 years, approximately equal percentages agreed and
disagreed. The percentages that disagreed (Table 5.14.2), except for 1 to 10 years and 21
to 30 years, were all in the range of 50% to 60%, a convincing amount but not a large
majority (statistically significant, but a weak relationship). A crosstab on voluntary
conservation measures and years lived on SHP was also run, but not included as the
results were not statistically significant.
160
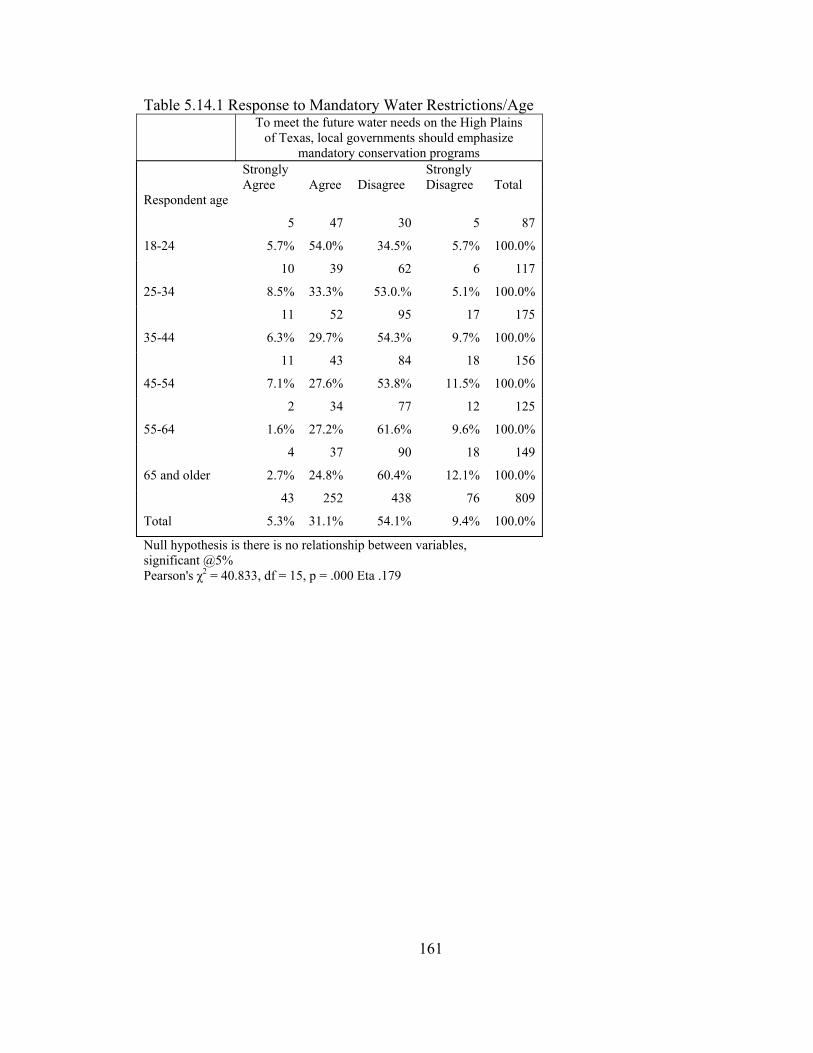
Table 5.14.1 Response to Mandatory Water Restrictions/Age To meet the future water needs on the High Plains
of Texas, local governments should emphasize mandatory conservation programs
Strongly Agree
Agree
Disagree
Strongly Disagree
Total
Respondent age
18-24
5
5.7%
47
54.0%
30
34.5%
5
5.7%
87
100.0%
25-34
10
8.5%
39
33.3%
62
53.0.%
6
5.1%
117
100.0%
35-44
11
6.3%
52
29.7%
95
54.3%
17
9.7%
175
100.0%
45-54
11
7.1%
43
27.6%
84
53.8%
18
11.5%
156
100.0%
55-64
2
1.6%
34
27.2%
77
61.6%
12
9.6%
125
100.0%
4 37 90 18 149
65 and older 2.7% 24.8% 60.4% 12.1% 100.0%
Total
43
5.3%
252
31.1%
438
54.1%
76
9.4%
809
100.0%
Null hypothesis is there is no relationship between variables, significant @5% Pearson's χ2 = 40.833, df = 15, p = .000 Eta .179
161
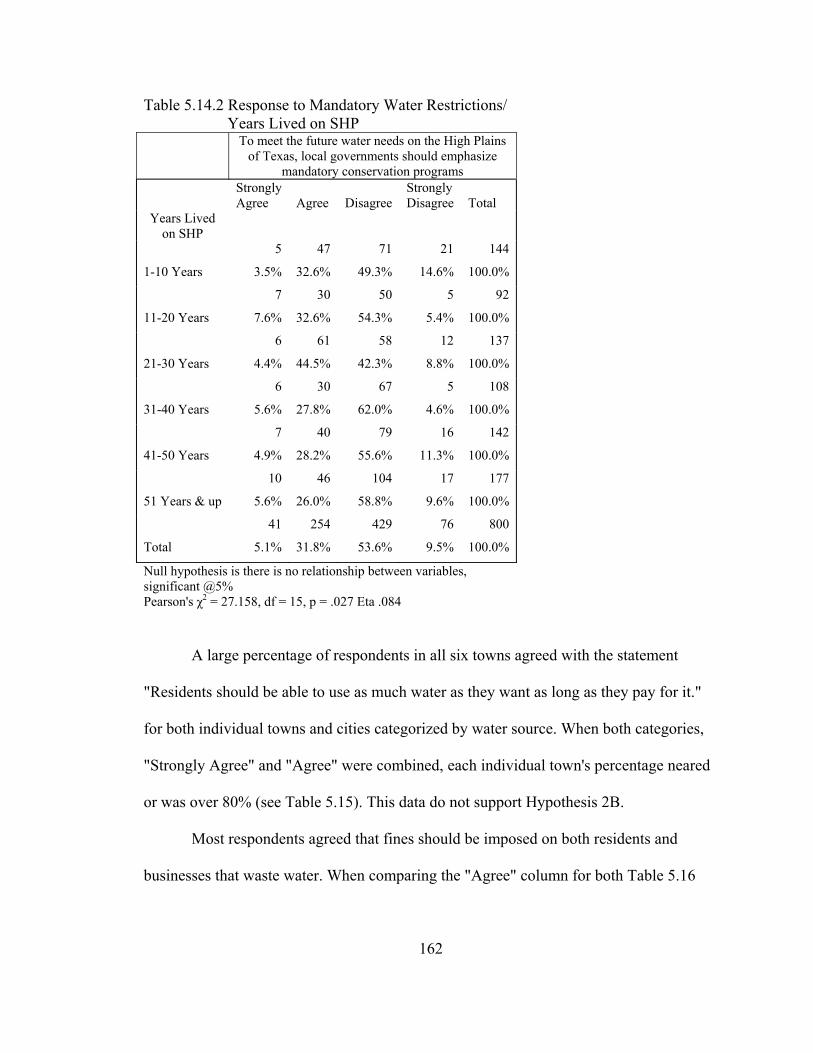
Table 5.14.2 Response to Mandatory Water Restrictions/ Years Lived on SHP To meet the future water needs on the High Plains
of Texas, local governments should emphasize mandatory conservation programs
Strongly Agree
Agree
Disagree
Strongly Disagree
Total
Years Lived on SHP
1-10 Years
5
3.5%
47
32.6%
71
49.3%
21
14.6%
144
100.0%
11-20 Years
7
7.6%
30
32.6%
50
54.3%
5
5.4%
92
100.0%
21-30 Years
6
4.4%
61
44.5%
58
42.3%
12
8.8%
137
100.0%
31-40 Years
6
5.6%
30
27.8%
67
62.0%
5
4.6%
108
100.0%
41-50 Years
7
4.9%
40
28.2%
79
55.6%
16
11.3%
142
100.0%
10 46 104 17 177
51 Years & up 5.6% 26.0% 58.8% 9.6% 100.0%
41 254 429 76
Total 5.1% 31.8% 53.6% 9.5%
800
100.0%
Null hypothesis is there is no relationship between variables, significant @5% Pearson's χ2 = 27.158, df = 15, p = .027 Eta .084
A large percentage of respondents in all six towns agreed with the statement
"Residents should be able to use as much water as they want as long as they pay for it."
for both individual towns and cities categorized by water source. When both categories,
"Strongly Agree" and "Agree" were combined, each individual town's percentage neared
or was over 80% (see Table 5.15). This data do not support Hypothesis 2B.
Most respondents agreed that fines should be imposed on both residents and
businesses that waste water. When comparing the "Agree" column for both Table 5.16
162
(fine residents) and Table 5.17 (fine businesses), the percentages are comparable, ranging
from 60% to 70% for both. When both "Strongly Agree" and "Agree" columns were
combined for residential and business fines, it is evident more respondents would rather
fine businesses that waste water than to fine residents that waste water (the crosstabs for
both residents and businesses are not statistically significant though). These data support
Hypothesis 2B.
Percentages ranged from approximately half to three-quarters of respondents (By
City) who "Agree" there should be enforced restrictions as to when people can water the
lawn (see Table 5.18). Overall, well over half of respondents (By City) "Agree" that
towns should enforce lawn watering restrictions. Post had the largest percentage (in
individual towns) who "Agree" with the statement and a larger percentage in both
Crosbyton and Post agreed (when combined into Cities Categorized by Water Source).
These data support Hypothesis 2B. Overall, for Tables 5.13 to 5.18, more support is
given to Hypothesis 2B.
163

Table 5.15 Unlimited Consumption as Long as One Pays For It Residents should be able to use as much water as
they want as long as they pay for it. Strongly
Agree
Agree Disagree Strongly Disagree
Total
By City
Abernathy
Null hypothesis is there is no relationship between variables, significant @5% Pearson's χ2 = 33.096, df = 15, p = .005 Eta .097 (by city) Pearson's χ2 = 23.195, df = 6, p = .001 Eta .020 (by water source)
25 87
60.4%
32
22.2%
0
.0%
144
17.4% 100.0%
12
12.8%
62
66.0%
20
21.3%
0
.0%
94
Crosbyton 100.0%
14
10.9%
88
68.8%
25
19.5%
1
.8%
128
Littlefield 100.0%
29
13.9%
134
64.4%
34
16.3%
11
5.3%
208
Lubbock 100.0%
15
12.4%
81
66.9%
25
20.7%
0
.0%
121
Post 100.0%
18 65
69.1%
9 2
2.1%
94
Slaton 19.1% 9.6% 100.0%
Total
113
14.3%
517
65.5%
145
18.4%
14
1.8%
789
100.0%
Cities Categorized by Water Source
Strongly Agree Agree Disagree
Strongly Disagree
Total
Groundwater
39 175
64.3%
57
21.0%
1
.4%
272
14.3% 100.0%
CRMWA & 47
15.6%
199
65.9%
43
14.2%
13
4.3%
302 Groundwater 100.0%
27 143 45 0 215
White River Lake 12.6% 66.5% 20.9% .0% 100.0%
113 517 145 14 789
Total 14.3% 65.5% 18.4% 1.8% 100.0%
164

Table 5.16 Residential Fines for Water Waste
Residents should be fined for wasting water. Strongly Agree Agree Disagree
Strongly Disagree
Total
By City
Abernathy
88
61.1%
29
18.1%
5
3.5%
25 144
17.4% 100.0%
Crosbyton
16
16.8%
63
66.3%
16
16.8%.
0
.0%
95
100.0%
Littlefield
15
11.1%
93
68.9%
25
18.5%
2
1.5%
135
100.0%
Lubbock
48
22.7%
128
60.7%
31
14.7%
4
1.9%
211
100.0%
Post
15
12.0%
90
72.0%
19
15.2%
1
.8%
125
100.0%
21
21.4%
58
59.2%
18
18.4%
1 98
100.0%
Slaton 1.0%
Total
140
17.3%
520 135
16.7%
13
1.6%
808
64.4% 100.0%
Null hypothesis is there is no relationship between variables, significant @5% Pearson's χ2 = 19.059, df = 15, p = .211 Eta .049 (by city) Pearson's χ2 = 11.679, df = 6, p = .070 Eta .058 (by water source)
Cities Categorized by Strongly Water Source Agree Agree
Disagree
Strongly Disagree
Total
Groundwater
181
64.6%
52
18.6%
7
2.5%
40 280
14.3% 100.0%
CRMWA & Groundwater
69
22.3%
186
60.2%
49
15.9%
5
1.6%
309
100.0%
31 153 35 2 221
White River Lake 14.0% 69.2% 15.8% .9% 100.0%
140 520 136 14 810
Total 17.3% 64.2% 16.8% 1.7% 100.0%
165
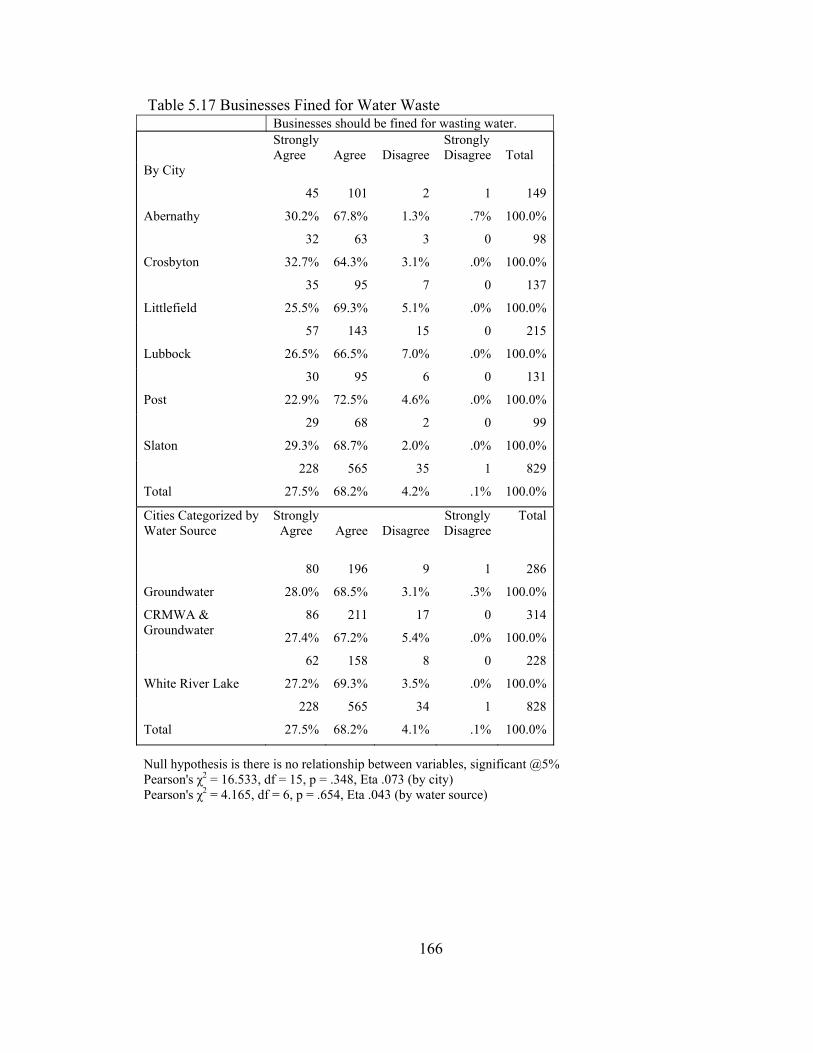
Table 5.17 Businesses Fined for Water Waste Businesses should be fined for wasting water.
Strongly Agree Agree
Disagree
Strongly Disagree
Total
By City
101
67.8%
2
1.3%
1
.7%
45 149
Abernathy 30.2% 100.0%
Crosbyton
32
32.7%
63
64.3%
3
3.1%
0 98
.0% 100.0%
Littlefield
35
25.5%
95
69.3%
7
5.1%
0
137 .0% 100.0%
Lubbock
57
26.5%
143
66.5%
15
7.0%
0 215
.0% 100.0%
Post
30
22.9%
95
72.5%
6
4.6%
0
131
.0% 100.0%
29
29.3%
68 2
2.0%
0
.0%
99
Slaton 68.7% 100.0%
Total
228
27.5%
565
68.2%
35 1
.1% 4.2%
829
100.0%
Cities Categorized by Strongly Water Source Agree Agree
Disagree
Strongly Disagree
Total
196
68.5%
9
3.1%
1
.3%
80 286
Groundwater 28.0%
Null hypothesis is there is no relationship between variables, significant @5% Pearson's χ2 = 16.533, df = 15, p = .348, Eta .073 (by city) Pearson's χ2 = 4.165, df = 6, p = .654, Eta .043 (by water source)
100.0%
CRMWA & Groundwater
86
27.4%
211
67.2%
17
5.4%
0 314
.0% 100.0%
62 158 8 0 228
White River Lake 27.2% 69.3% 3.5% .0% 100.0%
228 565 34 1 828
Total 27.5% 68.2% 4.1% .1% 100.0%
166

Table 5.18 Enforced restrictions There should be enforced restrictions as to when
people are allowed to water the lawn. Strongly
Agree Agree
Disagree
Strongly Disagree
Total
By City
31
20.8%
87
58.4%
26
17.4%
5
3.4%
Abernathy
149
100.0%
Crosbyton
15
15.8%
62
65.3%
17
17.9%
1
1.1%
95
100.0%
Littlefield
14
10.8%
95
73.1%
18
13.8%
3
2.3%
130
100.0%
Lubbock
42
19.8%
126
59.4%
40
18.9%
4
1.9%
212
100.0
Post
13
10.6%
91
74.0%
18
14.6%
1
.8%
123
100.0%
Slaton
22
22.2%
55
55.6%
21
21.2%
1
1.0%
99
100.0
Total
137
17.0%
516
63.9%
140
17.3%
15
1.9%
808
100.0
Cities Categorized by Water Source
Strongly Agree
Agree
Disagree
Strongly Disagree
Total
45
16.2%
181
65.1%
45
16.2%
7
2.5%
Groundwater
278
100.0%
CRMWA & Groundwater
64
20.8%
180
58.4%
60
19.5%
4 308
1.3% 100.0%
28 153 35 2
White River Lake 12.8% 70.2% 16.1% .9%
0218
100.0%
Total
137
17.0%
514
63.9%
140
17.4%
13
1.6%
804
100.0%
Null hypothesis is there is no relationship between variables, significant @5% Pearson's χ2 = 22.039, df = 15, p = .107 Eta .052 (by city) Pearson's χ2 = 11.219, df = 6, p = .082 Eta .060 (by water source)
167
Issue Area III- Price and Rebates as a Water Conservation Incentive
What types of incentives will motivate a reduction in water consumption
behavior? The price of water can be structured in such a way as to promote conservation
and rebates and incentives can be offered to encourage conservation. The ultimate result
of rebates and incentives is to have a positive effect on behavior of consumers. Options
include water rates that are structured to penalize excessive use, or different rate
structures can be implemented for summer and winter consumption. Another method is a
rate structure that will penalize the consumer for excessive use by charging more per unit
of water used above a specified quantity.
Attitudes toward Pricing of Water
This section examines the attitudes of SHP residents concerning the price of water
and rebates as incentives to encourage conservation. An increase in the cost of water will
motivate consumers to conserve water (Hypothesis 3A).
Table 5.19 summarizes SHP residents' attitudes toward the idea of increasing the
price of water to help conserve the resource for the future. For individual cities,
respondents were fairly evenly split between "Agree" and "Disagree" (somewhat more
disagreed). Of those who disagreed, Crosbyton had the highest percentage. Again, that
can possibly be explained by the price of water in Crosbyton. For all towns, when
"Disagree" and ''Strongly Disagree" were combined into one category, the cumulative
total for both was higher than the total for "Strongly Agree" and "Agree," signifying
168
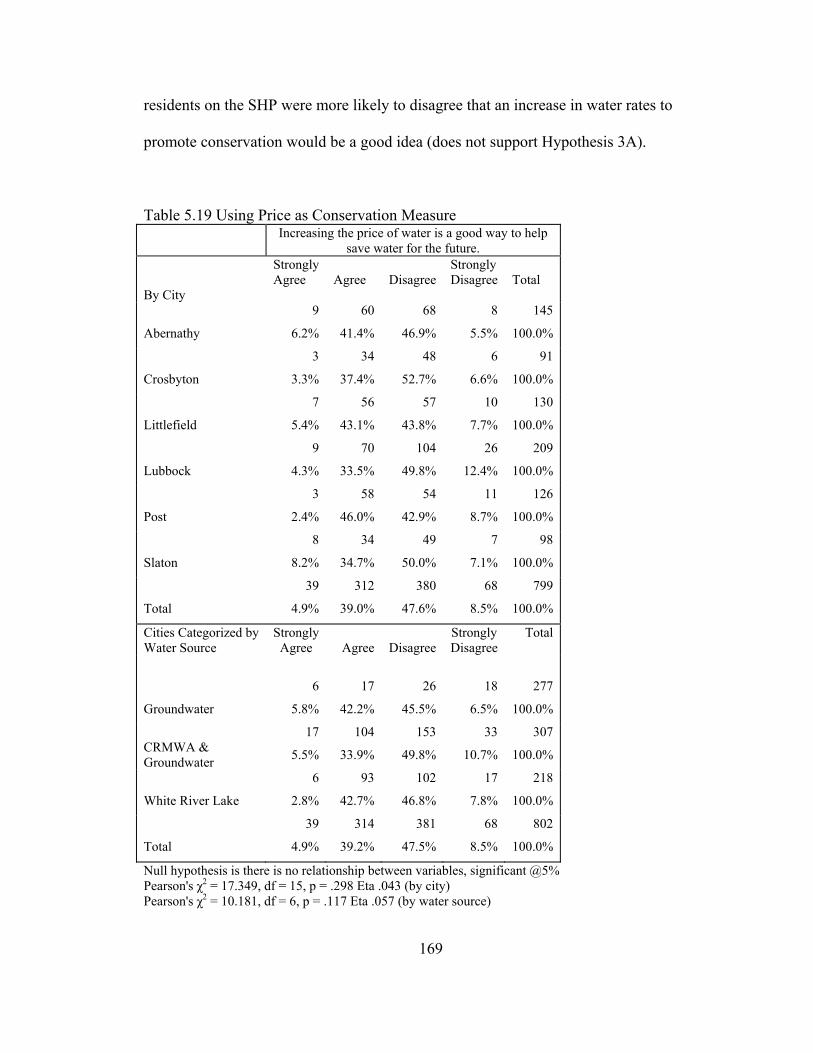
residents on the SHP were more likely to disagree that an increase in water rates to
promote conservation would be a good idea (does not support Hypothesis 3A).
Table 5.19 Using Price as Conservation Measure Increasing the price of water is a good way to help
save water for the future. Strongly
Agree Agree
Disagree
Strongly Disagree
Total
By City
Abernathy
9
6.2%
60
41.4%
68
46.9%
8
5.5%
145
100.0%
Crosbyton
3
3.3%
34
37.4%
48
52.7%
6
6.6%
91
100.0%
Littlefield
7
5.4%
56
43.1%
57
43.8%
10
7.7%
130
100.0%
Lubbock
9
4.3%
70
33.5%
104
49.8%
26
12.4%
209
100.0%
Post
3
2.4%
58
46.0%
54
42.9%
11
8.7%
126
100.0%
Slaton
8
8.2%
34
34.7%
49
50.0%
7
7.1%
98
100.0%
Total
39
4.9%
312
39.0%
380
47.6%
68
8.5%
799
100.0%
Cities Categorized by Water Source
Strongly Agree
Agree
Disagree
Strongly Disagree
Total
Groundwater
6
5.8%
17
42.2%
26
45.5%
18
6.5%
277
100.0%
CRMWA & Groundwater
17
5.5%
104
33.9%
153
49.8%
33 307
10.7% 100.0%
6 93
42.7%
102
White River Lake 2.8% 46.8%
17
7.8%
218
100.0%
39
4.9%
314
39.2%
381
47.5%
68 802
Total 8.5% 100.0%
Null hypothesis is there is no relationship between variables, significant @5% Pearson's χ2 = 17.349, df = 15, p = .298 Eta .043 (by city) Pearson's χ2 = 10.181, df = 6, p = .117 Eta .057 (by water source)
169
Tables 5.20 and 5.21 summarize the results of whether doubling the price or a
50% increase in the price of water would result in the individual reducing the amount of
water used. In both instances, whether the increase is 50% or 100%, a larger percentage
agreed (than disagreed) the increase would lessen water consumption. For individual
towns, Littlefield had the most respondents who agreed they would use less water if their
water bill either increased by 50% or if their bill doubled. When cities were categorized
by water source, those on groundwater (Abernathy and Littlefield) had the largest
percentage of residents who agreed or strongly agreed that an increase in the bill would
decrease usage (both double and a 50% increase).
In Table 5.20, a somewhat smaller percentage of respondents agreed they would
use less water if their bill doubled, compared to those who agreed with the statement
about using less water if their bill increased by half what it usually costs now (By City,
Table 5.21). Overall, the percentage that strongly agreed (doubling of bill) was somewhat
larger than for the bill increasing by half (24% to 17%, respectively). When the
categories "Strongly Agree" and "Agree" were combined for both statements, a larger
percentage said they would use less water if their bill doubled, as compared to the bill
increasing by half. These data in Tables 5.20 and 5.21 support Hypothesis 3A.
Table 5.22 summarizes the cost of 5,000 gallons of water by individual city,
precipitation average, average gpcd and each individual town's actual gpcd (averaged
over four years- 2001, 2002, 2003 and 2004). The "Average GPCD" is an average taken
from the seasonal year gpcd average and the dry year gpcd average calculated by the
LERWPG (2001). The seasonal year gpcd is an average for a year when the rainfall is at
170
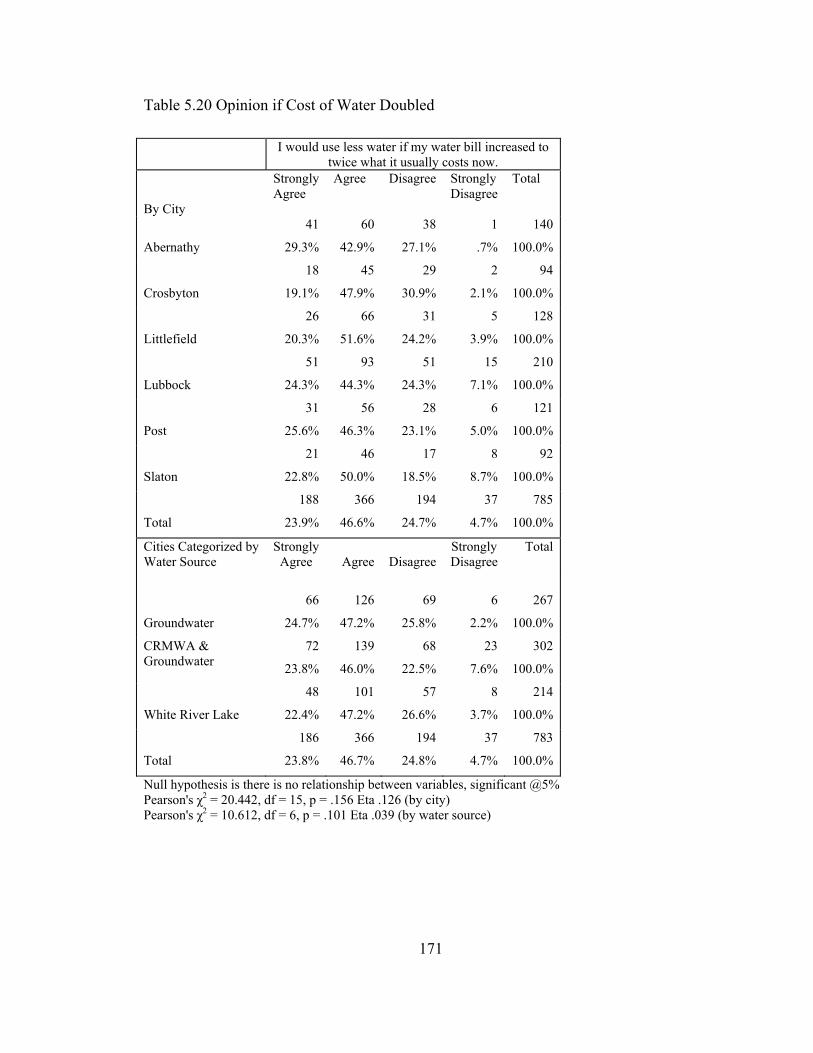
Table 5.20 Opinion if Cost of Water Doubled
Null hypothesis is there is no relationship between variables, significant @5% Pearson's χ2 = 20.442, df = 15, p = .156 Eta .126 (by city) Pearson's χ2 = 10.612, df = 6, p = .101 Eta .039 (by water source)
I would use less water if my water bill increased to twice what it usually costs now.
Strongly Agree
Agree Disagree Strongly Disagree
Total
By City
Abernathy
41
29.3%
60
42.9%
38 1 140
27.1% .7% 100.0%
Crosbyton
18
19.1%
45
47.9%
29 2 94
30.9% 2.1% 100.0%
Littlefield
26
20.3%
66
51.6%
31 5 128
24.2% 3.9% 100.0%
Lubbock
51
24.3%
93
44.3%
51 15 210
24.3% 7.1% 100.0%
Post
31
25.6%
56
46.3%
28 6 121
23.1% 5.0% 100.0%
Slaton
21 46
50.0%
17
18.5%
8 92
100.0% 22.8% 8.7%
Total
188
23.9%
366
46.6%
194
24.7%
37
4.7%
785
100.0%
Cities Categorized by Strongly Agree
Agree
Disagree
Strongly Disagree
Total Water Source
66
24.7%
126
47.2%
69
25.8%
6 267
Groundwater 2.2% 100.0%
CRMWA & Groundwater
72
23.8%
139
46.0%
68 23 302
22.5% 7.6% 100.0%
48
22.4%
101
47.2%
57
26.6%
8
3.7%
214
100.0% White River Lake
Total
186
23.8%
366
46.7%
194
24.8%
37
4.7%
783
100.0%
171
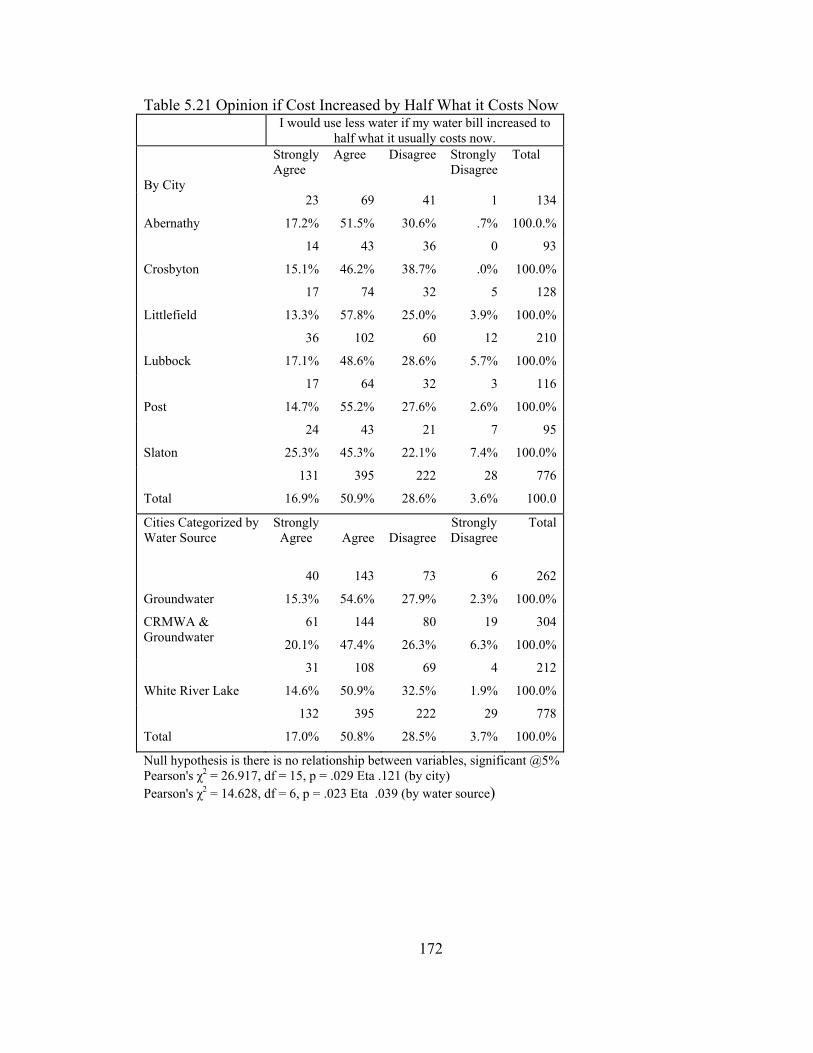
Table 5.21 Opinion if Cost Increased by Half What it Costs Now I would use less water if my water bill increased to
half what it usually costs now. Strongly
Agree Agree Disagree Strongly
Disagree Total
By City
Abernathy
23
17.2%
69
51.5%
41
30.6%
1
.7%
134
100.0.%
Crosbyton
14
15.1%
43
46.2%
36
38.7%
0
.0%
93
100.0%
Littlefield
17
13.3%
74
57.8%
32
25.0%
5
3.9%
128
100.0%
Lubbock
36
17.1%
102
48.6%
60
28.6%
12
5.7%
210
100.0%
Post
17
14.7%
64
55.2%
32
27.6%
3
2.6%
116
100.0%
Slaton
24
25.3%
43
45.3%
21
22.1%
7
7.4%
95
100.0%
Total
131
16.9%
395
50.9%
222
28.6%
28
3.6%
776
100.0
Cities Categorized by Water Source
Strongly Agree
Agree
Disagree
Strongly Disagree
Total
Groundwater
40
15.3%
143
54.6%
73
27.9%
6
2.3%
262
100.0%
CRMWA & Groundwater
61
20.1%
144
47.4%
80 19 304
26.3% 6.3% 100.0%
31
White River Lake 14.6%
108
50.9%
69
32.5%
4
1.9%
212
100.0%
Total
132
17.0%
395
50.8%
222
28.5%
29
3.7%
778
100.0%
Null hypothesis is there is no relationship between variables, significant @5% Pearson's χ2 = 26.917, df = 15, p = .029 Eta .121 (by city) Pearson's χ2 = 14.628, df = 6, p = .023 Eta .039 (by water source)
172
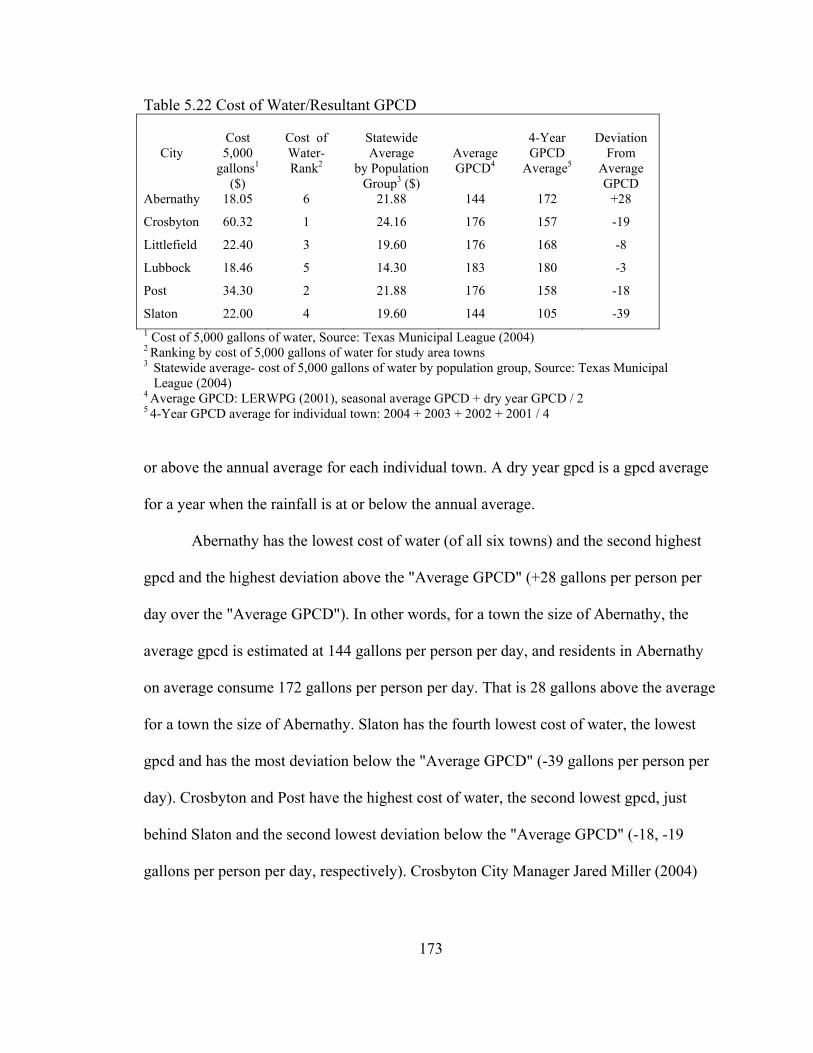
Table 5.22 Cost of Water/Resultant GPCD
City
Cost 5,000
gallons1
($)
Cost of Water- Rank2
Statewide Average
by Population Group3 ($)
Average GPCD4
4-Year GPCD
Average5
Deviation
From Average GPCD
Abernathy 18.05 6 21.88 144 172 +28
Crosbyton 60.32 1 24.16 176 157 -19
Littlefield 22.40 3 19.60 176 168 -8
Lubbock 18.46 5 14.30 183 180 -3
Post 34.30 2 21.88 176 158 -18
Slaton 22.00 4 19.60 144 105 -39 1 Cost of 5,000 gallons of water, Source: Texas Municipal League (2004) 2 Ranking by cost of 5,000 gallons of water for study area towns 3 Statewide average- cost of 5,000 gallons of water by population group, Source: Texas Municipal League (2004) 4 Average GPCD: LERWPG (2001), seasonal average GPCD + dry year GPCD / 2 5 4-Year GPCD average for individual town: 2004 + 2003 + 2002 + 2001 / 4
or above the annual average for each individual town. A dry year gpcd is a gpcd average
for a year when the rainfall is at or below the annual average.
Abernathy has the lowest cost of water (of all six towns) and the second highest
gpcd and the highest deviation above the "Average GPCD" (+28 gallons per person per
day over the "Average GPCD"). In other words, for a town the size of Abernathy, the
average gpcd is estimated at 144 gallons per person per day, and residents in Abernathy
on average consume 172 gallons per person per day. That is 28 gallons above the average
for a town the size of Abernathy. Slaton has the fourth lowest cost of water, the lowest
gpcd and has the most deviation below the "Average GPCD" (-39 gallons per person per
day). Crosbyton and Post have the highest cost of water, the second lowest gpcd, just
behind Slaton and the second lowest deviation below the "Average GPCD" (-18, -19
gallons per person per day, respectively). Crosbyton City Manager Jared Miller (2004)
173
stated the cost of water has acted as a conservation tool, as higher water pricing has
reduced usage. By comparing the two extremes on water cost, a pattern can be seen.
Crosbyton and Post have the highest cost of water and the second highest deviation below
the "Average GPCD." Abernathy has the lowest cost of water and the highest deviation
above the "Average GPCD," suggesting price is correlated with usage of water on the
SHP. Slaton has the fourth lowest cost of all study towns and has the lowest gpcd. One
reason for the low gpcd may be found in a statement from Slaton's Director of Public
Works, Doyce Field. The city (of Slaton) is doing the minimum to promote water
conservation, but in the past, Mr. Field has seen a drop in consumption by Slaton
residents when water rates have increased. He admitted, that the rate increase in itself,
has acted as a conservation measure. He also stated the water rate structure in Slaton is
designed to penalize those who consume large amounts of water, as both water and sewer
rates increase with increased consumption (Field, Doyce. Personal Communication).
Rebates as an Incentive to Conserve Water
Numerous rebate programs exist, but a typical rebate program is designed to save
the consumer money. Among the many programs, rebates can be designed to reduce the
purchase price of an appliance or fixture, a reduced price can be charged for the
installation of that appliance or fixture (in say a retrofit program) or the rebate can be in
the form of a discount on the water bill itself. Water consumers on the SHP will be
receptive to a rebate program that offers water saving appliances and fixtures at a
discounted price (Hypothesis 3B).
174
Survey respondents on the SHP were more likely to agree with a rebate program
(see Table 5.23). Overall, only one-quarter of respondents "Disagree" or "Strongly
Disagree" that a rebate program would encourage people to buy a water conserving
appliance or fixture. Of individual towns, those who disagreed with a rebate program
ranged from 15% to over 25%. Littlefield had the highest percentage of respondents that
agreed with a rebate program and the smallest proportion favoring rebates were found in
Slaton and Lubbock. When presenting the rebate program as a way to save money over
the long term, a large percentage stated a rebate program is a good idea (Table 5.24).
Compared to Table 5.23, a somewhat lower percentage of respondents stated a rebate
program is not a good idea and stated they would not participate. Post and Abernathy
ranked first and second with the highest percentage of respondents who agreed they
would buy a water saving appliance if it saved money. Slaton had the smallest percentage
of respondents who agreed they would buy a water saving appliance. Data from both
Tables 5.23 and 5.24 support Hypothesis 3B.
Analyses were also run on the statement about buying a water saving appliance
and saving money over the long run and respondent education, income and age. Of those
who "Strongly Agree" and "Agree" they would buy an appliance if it saved money over
the long run, the largest group was respondents with less than a high school education
(Table 5.24.1). Those with a graduate or a professional degree were the smallest group
(number of respondents) who agreed they would be willing to buy a water saving
appliance. Well over half of respondents in all income brackets, from those that make less
than $10,000 annually to those that make over $75,000 a year, agreed they would buy a
175
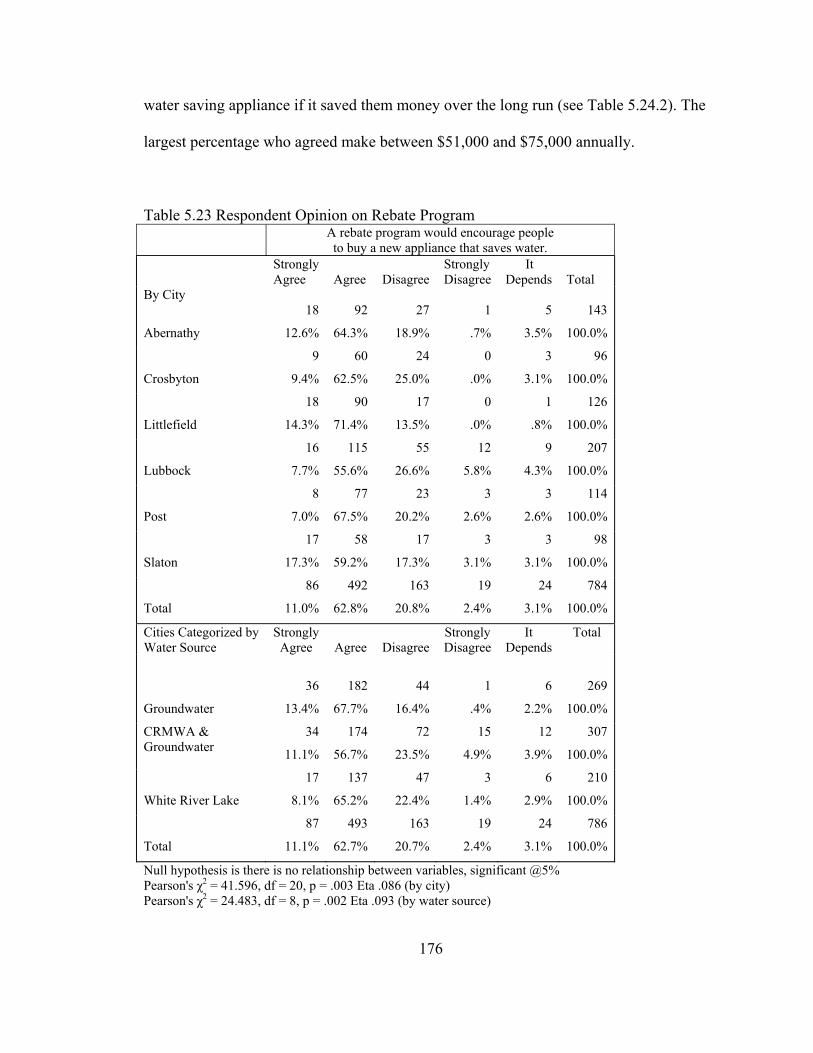
water saving appliance if it saved them money over the long run (see Table 5.24.2). The
largest percentage who agreed make between $51,000 and $75,000 annually.
Table 5.23 Respondent Opinion on Rebate Program A rebate program would encourage people
to buy a new appliance that saves water. Strongly
Agree Agree
Disagree
Strongly Disagree
It Depends
Total
By City
Abernathy
18
12.6%
92
64.3%
27
18.9%
1
.7%
5
3.5%
143
100.0%
Crosbyton
9
9.4%
60
62.5%
24
25.0%
0
.0%
3
3.1%
96
100.0%
Littlefield
18
14.3%
90
71.4%
17
13.5%
0
.0%
1
.8%
126
100.0%
Lubbock
16
7.7%
115
55.6%
55
26.6%
12
5.8%
9
4.3%
207
100.0%
Post
8
7.0%
77
67.5%
23
20.2%
3
2.6%
3
2.6%
114
100.0%
Slaton
17
17.3%
58
59.2%
17
17.3%
3
3.1%
3
3.1%
98
100.0%
Total
86
11.0%
492
62.8%
163
20.8%
19
2.4%
24
3.1%
784
100.0%
Cities Categorized by Water Source
Strongly Agree
Agree
Disagree
Strongly Disagree
It Depends
Total
Groundwater
36
182
67.7%
44
16.4%
1
.4%
6
2.2%
269
13.4% 100.0%
CRMWA & Groundwater
34
11.1%
174
56.7%
72
23.5%
15
4.9%
12
3.9%
307
100.0%
17
8.1%
137
65.2%
47
White River Lake 22.4%
3
1.4%
6
2.9%
210
100.0%
Total
87
11.1%
493 163
20.7%
19
2.4%
24
3.1%
786
62.7% 100.0%
Null hypothesis is there is no relationship between variables, significant @5% Pearson's χ2 = 41.596, df = 20, p = .003 Eta .086 (by city) Pearson's χ2 = 24.483, df = 8, p = .002 Eta .093 (by water source)
176
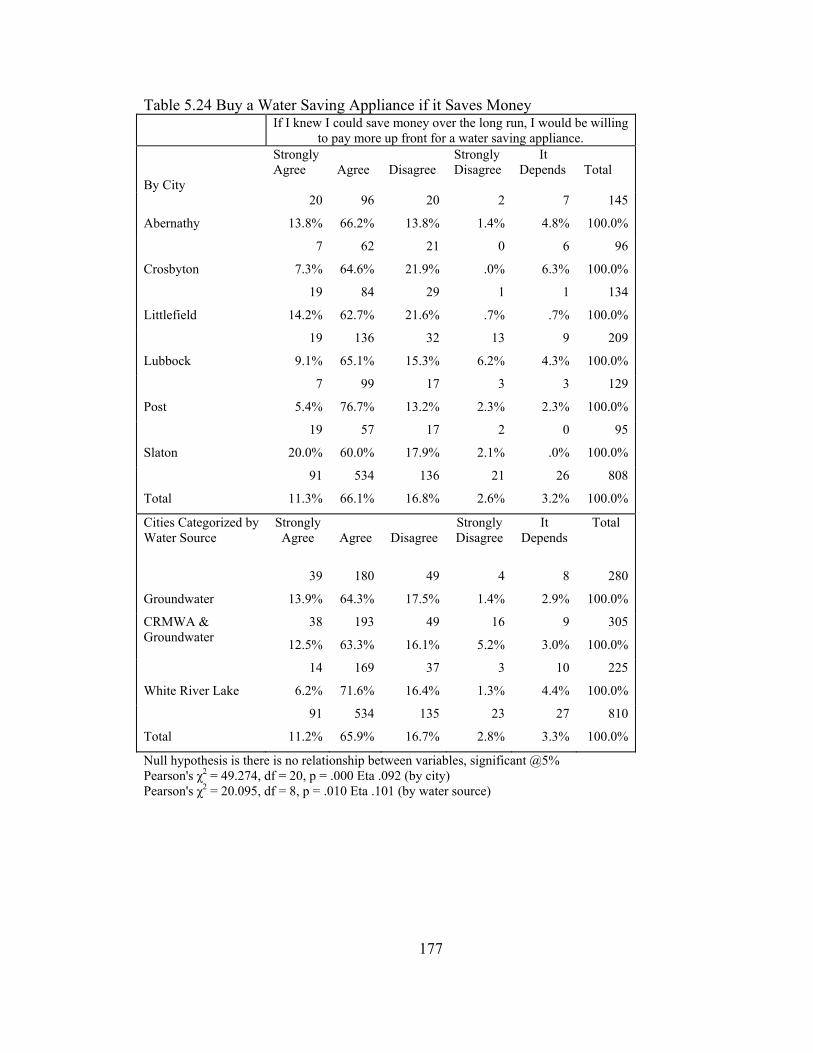
Table 5.24 Buy a Water Saving Appliance if it Saves Money If I knew I could save money over the long run, I would be willing
to pay more up front for a water saving appliance. Strongly
Agree Agree
Disagree
Strongly Disagree
It Depends
Total
By City
Abernathy
20
13.8%
96
66.2%
20
13.8%
2
1.4%
7
4.8%
145
100.0%
Crosbyton
7
7.3%
62
64.6%
21
21.9%
0
.0%
6
6.3%
96
100.0%
Littlefield
19
14.2%
84
62.7%
29
21.6%
1
.7%
1
.7%
134
100.0%
Lubbock
19
9.1%
136
65.1%
32
15.3%
13
6.2%
9
4.3%
209
100.0%
Post
7
5.4%
99
76.7%
17
13.2%
3
2.3%
3
2.3%
129
100.0%
Slaton
19
20.0%
57
60.0%
17
17.9%
2
2.1%
0
.0%
95
100.0%
Total
91
11.3%
534
66.1%
136
16.8%
21
2.6%
26
3.2%
808
100.0%
Cities Categorized by Water Source
Strongly Agree
Agree
Disagree
Strongly Disagree
It Depends
Total
Groundwater
39
180
64.3%
49
17.5%
4
1.4%
8
2.9%
280
13.9% 100.0%
CRMWA & Groundwater
38
12.5%
193
63.3%
49
16.1%
16
5.2%
9
3.0%
305
100.0%
14 169 37
16.4%
3
White River Lake 6.2% 71.6% 1.3%
10
4.4%
225
100.0%
Total
91
11.2%
534
65.9%
135
16.7%
23
2.8%
27
3.3%
810
100.0%
Null hypothesis is there is no relationship between variables, significant @5% Pearson's χ2 = 49.274, df = 20, p = .000 Eta .092 (by city) Pearson's χ2 = 20.095, df = 8, p = .010 Eta .101 (by water source)
177
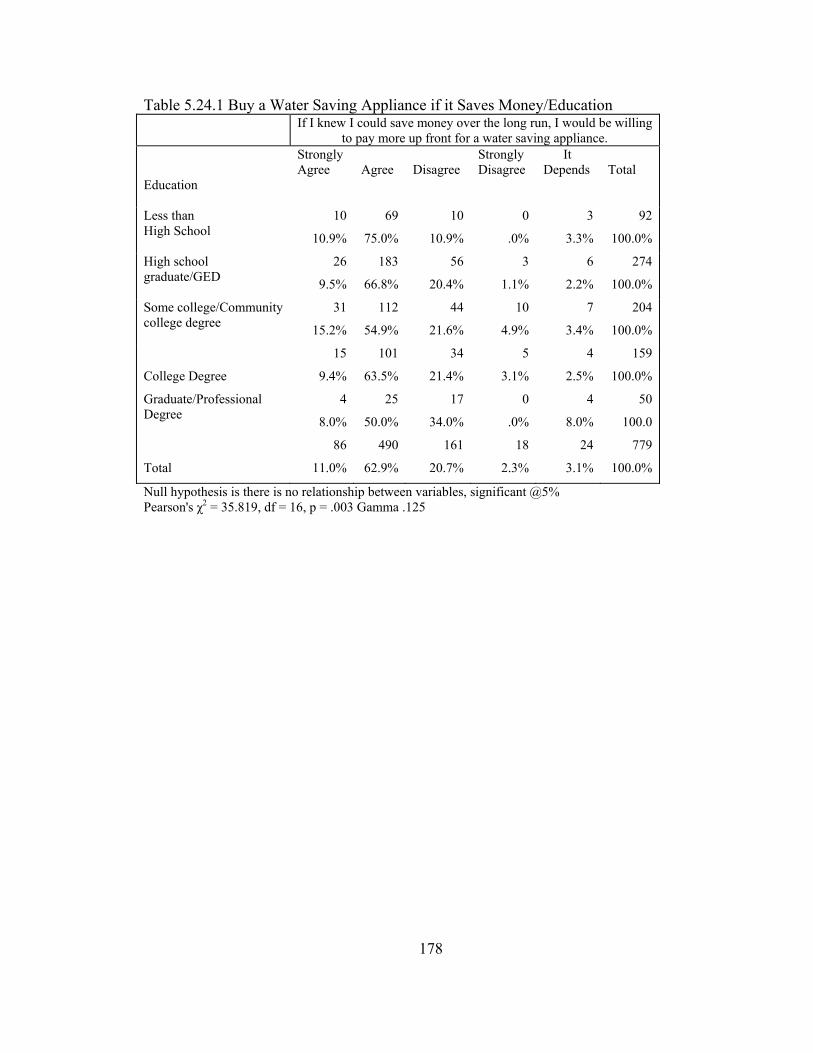
Table 5.24.1 Buy a Water Saving Appliance if it Saves Money/Education If I knew I could save money over the long run, I would be willing
to pay more up front for a water saving appliance. Strongly
Agree Agree
Disagree
Strongly Disagree
It Depends
Total
Education
Less than High School
10
10.9%
69
75.0%
10
10.9%
0
.0%
3
3.3%
92
100.0%
High school graduate/GED
26
9.5%
183
66.8%
56
20.4%
3
1.1%
6
2.2%
274
100.0%
Some college/Community college degree
31
15.2%
112
54.9%
44
21.6%
10
4.9%
7
3.4%
204
100.0%
College Degree
15
9.4%
101
63.5%
34
21.4%
5
3.1%
4
2.5%
159
100.0%
Graduate/Professional 4 25 17 0 4 50 Degree 8.0% 50.0% 34.0% .0% 8.0% 100.0
86 490 161
20.7%
18
2.3%
24
Total 11.0% 62.9% 3.1%
779
100.0%
Null hypothesis is there is no relationship between variables, significant @5% Pearson's χ2 = 35.819, df = 16, p = .003 Gamma .125
178
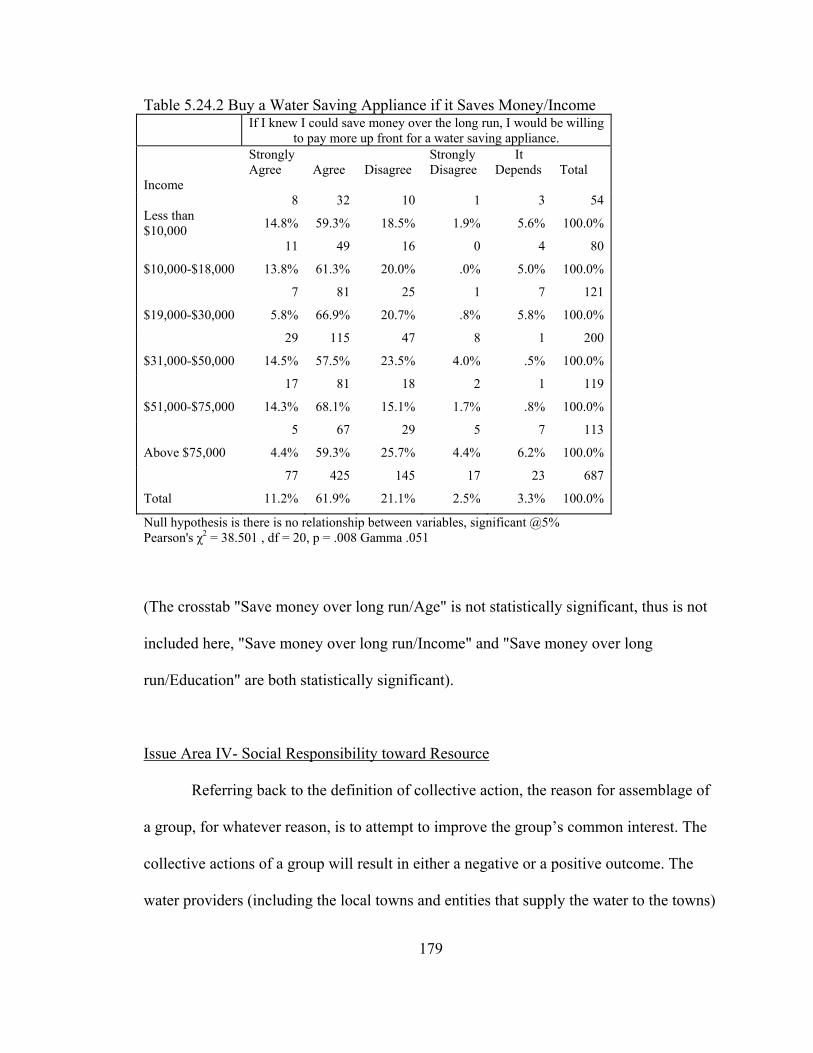
Table 5.24.2 Buy a Water Saving Appliance if it Saves Money/Income If I knew I could save money over the long run, I would be willing
to pay more up front for a water saving appliance. Strongly
Agree Agree
Disagree
Strongly Disagree
It Depends
Total
Income Less than $10,000
8
14.8%
32
59.3%
10
18.5%
1
1.9%
3
5.6%
54
100.0%
$10,000-$18,000
11
13.8%
49
61.3%
16
20.0%
0
.0%
4
5.0%
80
100.0%
$19,000-$30,000
7
5.8%
81
66.9%
25
20.7%
1
.8%
7
5.8%
121
100.0%
$31,000-$50,000
29
14.5%
115
57.5%
47
23.5%
8
4.0%
1
.5%
200
100.0%
$51,000-$75,000
17
14.3%
81
68.1%
18
15.1%
2
1.7%
1
.8%
119
100.0%
5 67 29 5 7 113
Above $75,000 4.4% 59.3% 25.7% 4.4% 6.2% 100.0%
77
11.2%
425
61.9%
145
21.1%
17
Total 2.5%
23
3.3%
687
100.0%
Null hypothesis is there is no relationship between variables, significant @5% Pearson's χ2 = 38.501 , df = 20, p = .008 Gamma .051
(The crosstab "Save money over long run/Age" is not statistically significant, thus is not
included here, "Save money over long run/Income" and "Save money over long
run/Education" are both statistically significant).
Issue Area IV- Social Responsibility toward Resource
Referring back to the definition of collective action, the reason for assemblage of
a group, for whatever reason, is to attempt to improve the group’s common interest. The
collective actions of a group will result in either a negative or a positive outcome. The
water providers (including the local towns and entities that supply the water to the towns)
179
all have a common goal- that is to maintain a good quality water supply for today and
into the future. Inherent in the idea of maintaining a good quality water supply for SHP
residents also is the idea of maintaining a quality of life all are accustomed to today. At
times, this can be a difficult task in this semi-arid climate. To maintain that quality of life,
assuring a sustainable water supply for the area is paramount. The cost of providing and
sustaining the water supply for now and in the future will have to be borne by all the
residents of the area, a result of collective action by all residents.
The fourth issue area deals with social values of SHP residents and looks at the
degree of social responsibility (or collective action) residents possess in the study area.
What factors will affect the decisions of consumers to act in a socially responsible
manner (stewardship) with respect to managing a common pool resource, in this case
water. Can the respondents' knowledge of the water source be correlated with the
decision making process of their resource community?
SHP residents will have to come together as a group for the collective good of the
group to insure a sustainable water supply for today and for future generations. The
questions "All residents on the SHP have a responsibility to conserve water." and "I don't
have to conserve because other people will." have been included as companion questions
to assess attitudes of residents regarding collective action on the SHP. The knowledge of
the stakeholders regarding the community's water supply (future supply and source) will
have an effect on the stewardship of the common pool resource, in this case water
(Hypothesis 4).
180
To test the attitudes of SHP residents toward collective action concerning water
conservation, the question "All residents on the SHP have a responsibility to conserve
water." was analyzed and results are shown in Table 5.25. Respondents to this question
seem to realize all residents on the SHP have a responsibility to conserve water, as almost
all (nearly 100%) respondents either "Agree" or "Strongly Agree" with the statement.
Post and Crosbyton ranked first and second, respectively, as having the largest
percentage of respondents who "Agree" that all residents on the SHP should conserve
water. Abernathy had the smallest percentage of respondents who "Agree," but when
Abernathy and Littlefield were combined (Cities Categorized by Water Source), they
ranked second in the "Agree" category (Table 5.25).
When social responsibility to conserve water was compared (in a crosstab) to
whether the respondent answered correctly the source of their town's water supply, a
definite trend can be seen (see Table 5.25.1). In the "Strongly Agree" category, those who
correctly identified their water source have a stronger attitude toward social responsibility
than those who did not know the source of their water supply. Those who correctly
identified the town's water source were fairly evenly split between "Agree" and "Strongly
Agree" with social responsibility to conserve water. The percentage who incorrectly
answered the source of the town's water supply and who agreed with social responsibility
increased (from "Correct Answer") and those that "Do Not Know" the source of the water
supply and agreed with social responsibility increased substantially (from "Correct
Answer"). When the two categories were combined, "Agree" and "Strongly Agree" with
181
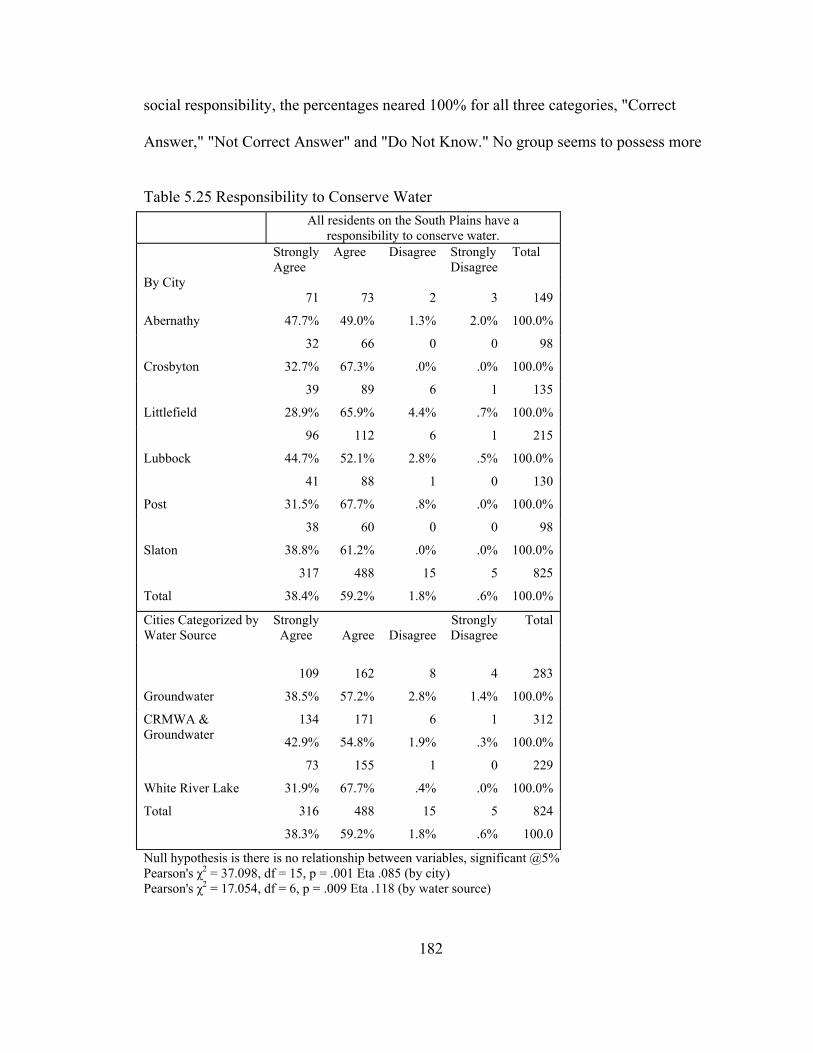
social responsibility, the percentages neared 100% for all three categories, "Correct
Answer," "Not Correct Answer" and "Do Not Know." No group seems to possess more
Table 5.25 Responsibility to Conserve Water
All residents on the South Plains have a responsibility to conserve water.
Strongly Agree
Agree Disagree Strongly Disagree
Total
By City
Abernathy
71
47.7%
73 2 3
49.0% 1.3% 2.0%
149
100.0%
Crosbyton
32
32.7%
66 0 0 67.3% .0%
Null hypothesis is there is no relationship between variables, significant @5% Pearson's χ2 = 37.098, df = 15, p = .001 Eta .085 (by city) Pearson's χ2 = 17.054, df = 6, p = .009 Eta .118 (by water source)
.0%
98
100.0%
Littlefield
39
28.9%
89 6 1
65.9% 4.4% .7%
135
100.0%
Lubbock
96
44.7%
112 6 1
52.1% 2.8% .5%
215
100.0%
Post
41
31.5%
88 1 0 130
67.7% .8% .0% 100.0%
38
38.8%
60
61.2%
0 0
.0% Slaton .0%
98
100.0%
Total
317
38.4%
488
59.2%
15
1.8%
5 825
.6% 100.0%
Cities Categorized by Water Source
Strongly Agree
Agree
Disagree
Strongly Disagree
Total
Groundwater
109
38.5%
162
57.2%
8
4
2.8% 1.4%
283
100.0%
CRMWA & Groundwater
134
42.9%
171 6 1 312
54.8% 1.9% .3% 100.0%
73 155 1 0 229
White River Lake 31.9% 67.7% .4% .0% 100.0%
Total 316
38.3%
488
59.2%
15
1.8%
5
.6%
824
100.0
182
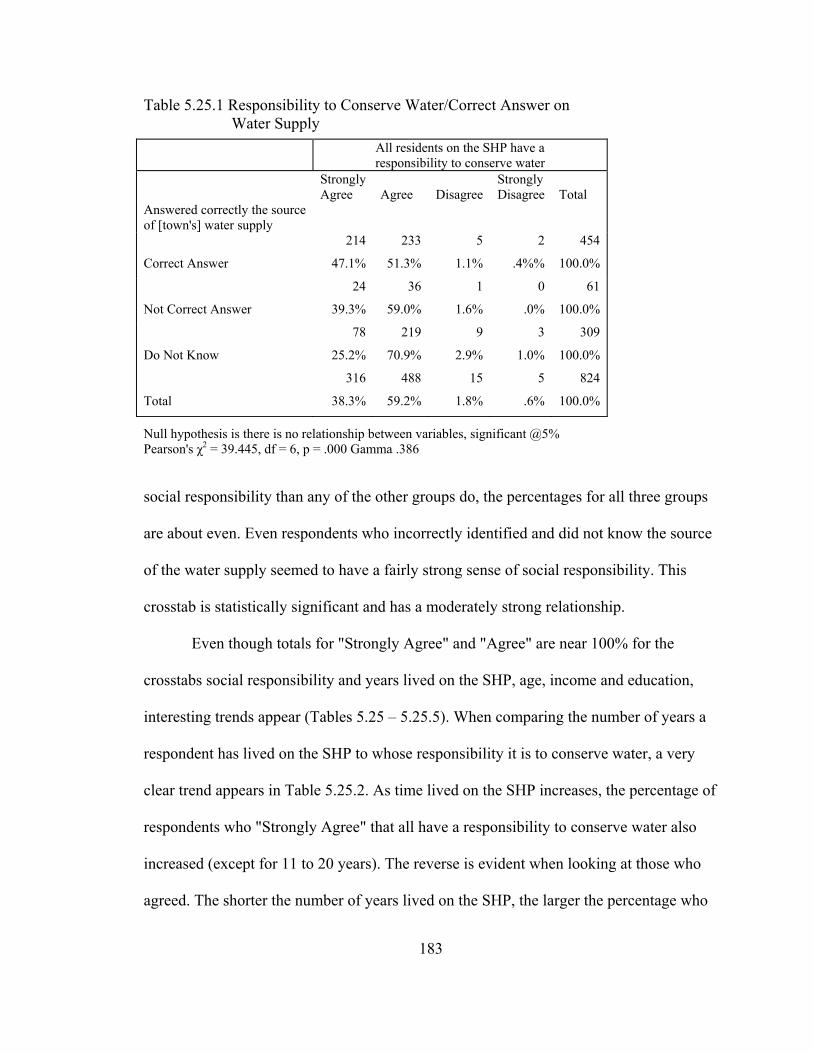
Table 5.25.1 Responsibility to Conserve Water/Correct Answer on Water Supply
All residents on the SHP have a responsibility to conserve water
Strongly Agree
Agree
Disagree
Strongly Disagree
Total
Answered correctly the source
of [town's] water supply
Correct Answer
214 233
47.1% 51.3%
Null hypothesis is there is no relationship between variables, significant @5% Pearson's χ2 = 39.445, df = 6, p = .000 Gamma .386 social responsibility than any of the other groups do, the percentages for all three groups
are about even. Even respondents who incorrectly identified and did not know the source
of the water supply seemed to have a fairly strong sense of social responsibility. This
crosstab is statistically significant and has a moderately strong relationship.
5
1.1%
2
.4%%
454
100.0%
Not Correct Answer
24 36 1 0 61
39.3% 59.0% 1.6% .0% 100.0%
78 219 9 3 309
Do Not Know 25.2% 70.9% 2.9% 1.0% 100.0%
316
38.3%
488
Total 59.2%
15
1.8%
5
.6%
824
100.0%
Even though totals for "Strongly Agree" and "Agree" are near 100% for the
crosstabs social responsibility and years lived on the SHP, age, income and education,
interesting trends appear (Tables 5.25 – 5.25.5). When comparing the number of years a
respondent has lived on the SHP to whose responsibility it is to conserve water, a very
clear trend appears in Table 5.25.2. As time lived on the SHP increases, the percentage of
respondents who "Strongly Agree" that all have a responsibility to conserve water also
increased (except for 11 to 20 years). The reverse is evident when looking at those who
agreed. The shorter the number of years lived on the SHP, the larger the percentage who
183
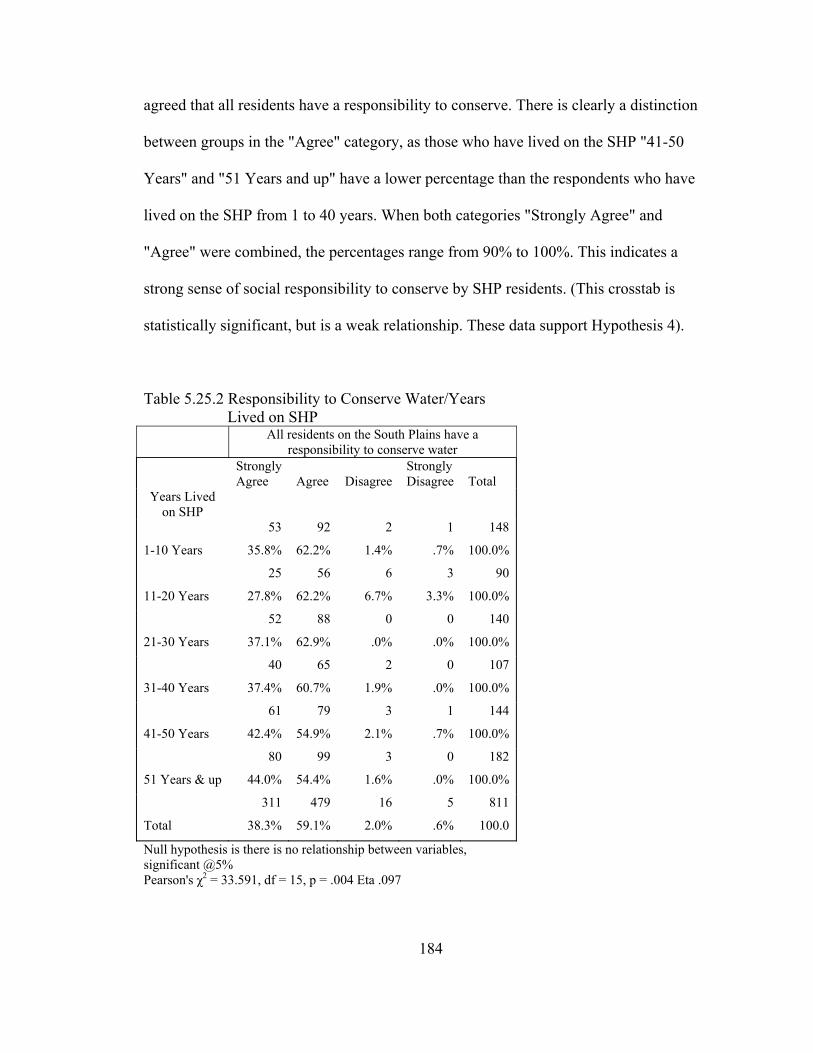
agreed that all residents have a responsibility to conserve. There is clearly a distinction
between groups in the "Agree" category, as those who have lived on the SHP "41-50
Years" and "51 Years and up" have a lower percentage than the respondents who have
lived on the SHP from 1 to 40 years. When both categories "Strongly Agree" and
"Agree" were combined, the percentages range from 90% to 100%. This indicates a
strong sense of social responsibility to conserve by SHP residents. (This crosstab is
statistically significant, but is a weak relationship. These data support Hypothesis 4).
Table 5.25.2 Responsibility to Conserve Water/Years Lived on SHP All residents on the South Plains have a
responsibility to conserve water Strongly
Agree Agree
Disagree
Strongly Disagree
Total
Years Lived on SHP
1-10 Years
53
35.8%
92
62.2%
2
1.4%
1
.7%
148
100.0%
11-20 Years
25
27.8%
56
62.2%
6
6.7%
3
3.3%
90
100.0%
21-30 Years
52
37.1%
88
62.9%
0
.0%
0
.0%
140
100.0%
31-40 Years
40
37.4%
65
60.7%
2
1.9%
0
.0%
107
100.0%
41-50 Years
61 79 3 1
42.4% 54.9% 2.1% .7%
144
100.0%
51 Years & up
80
44.0%
99
54.4%
3
1.6%
0
.0%
182
100.0%
311 479
59.1%
16
2.0%
5
.6%
811
100.0 Total 38.3%
Null hypothesis is there is no relationship between variables, significant @5% Pearson's χ2 = 33.591, df = 15, p = .004 Eta .097
184
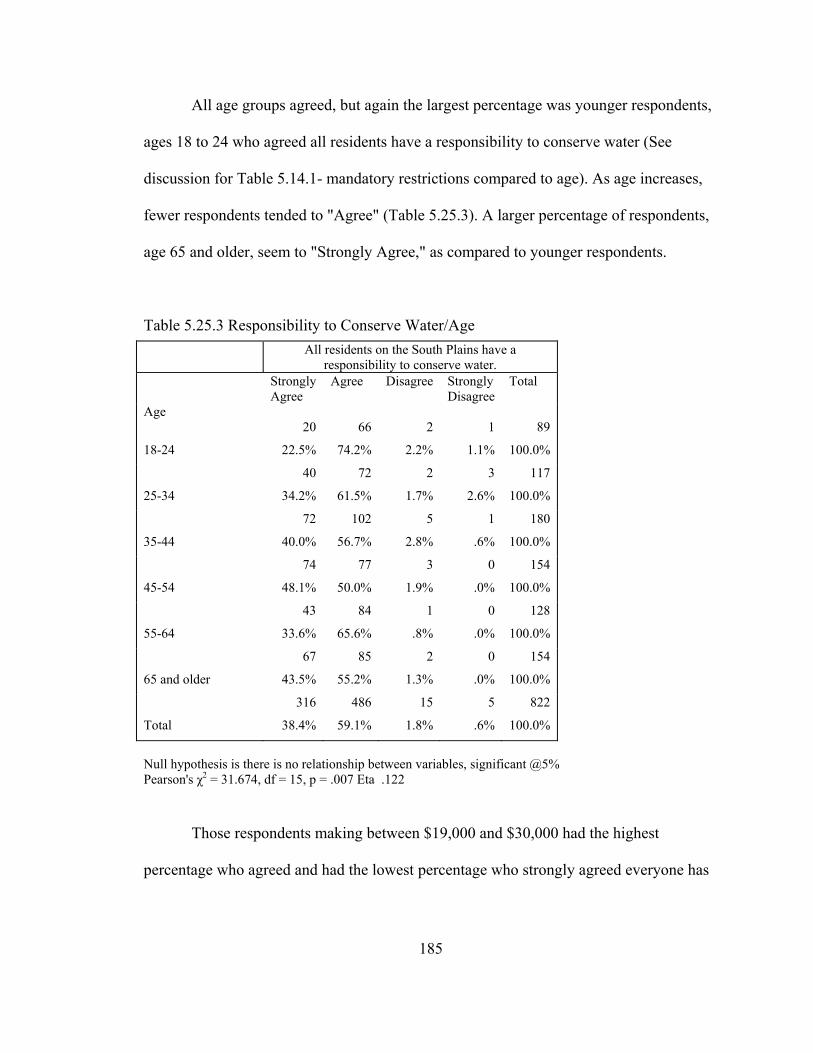
All age groups agreed, but again the largest percentage was younger respondents,
ages 18 to 24 who agreed all residents have a responsibility to conserve water (See
discussion for Table 5.14.1- mandatory restrictions compared to age). As age increases,
fewer respondents tended to "Agree" (Table 5.25.3). A larger percentage of respondents,
age 65 and older, seem to "Strongly Agree," as compared to younger respondents.
Table 5.25.3 Responsibility to Conserve Water/Age
All residents on the South Plains have a responsibility to conserve water.
Strongly Agree
Agree Disagree Strongly Disagree
Total
Age 20 66
74.2%
2
2.2%
1
1.1%
89
100.0% 18-24 22.5%
40 72
61.5%
2
1.7%
3
2.6%
117
100.0% 25-34 34.2%
72 102
56.7%
5
2.8%
1
.6%
180
100.0% 35-44 40.0%
74
Null hypothesis is there is no relationship between variables, significant @5% Pearson's χ2 = 31.674, df = 15, p = .007 Eta .122
77
50.0%
3
1.9%
0
.0%
154
100.0% 45-54 48.1%
43 84 1 0 128
55-64 33.6% 65.6% .8% .0% 100.0%
67 85 2 0 154
65 and older 43.5% 55.2% 1.3% .0% 100.0%
316 486
59.1%
15
Total 38.4% 1.8%
5
.6%
822
100.0%
Those respondents making between $19,000 and $30,000 had the highest
percentage who agreed and had the lowest percentage who strongly agreed everyone has
185
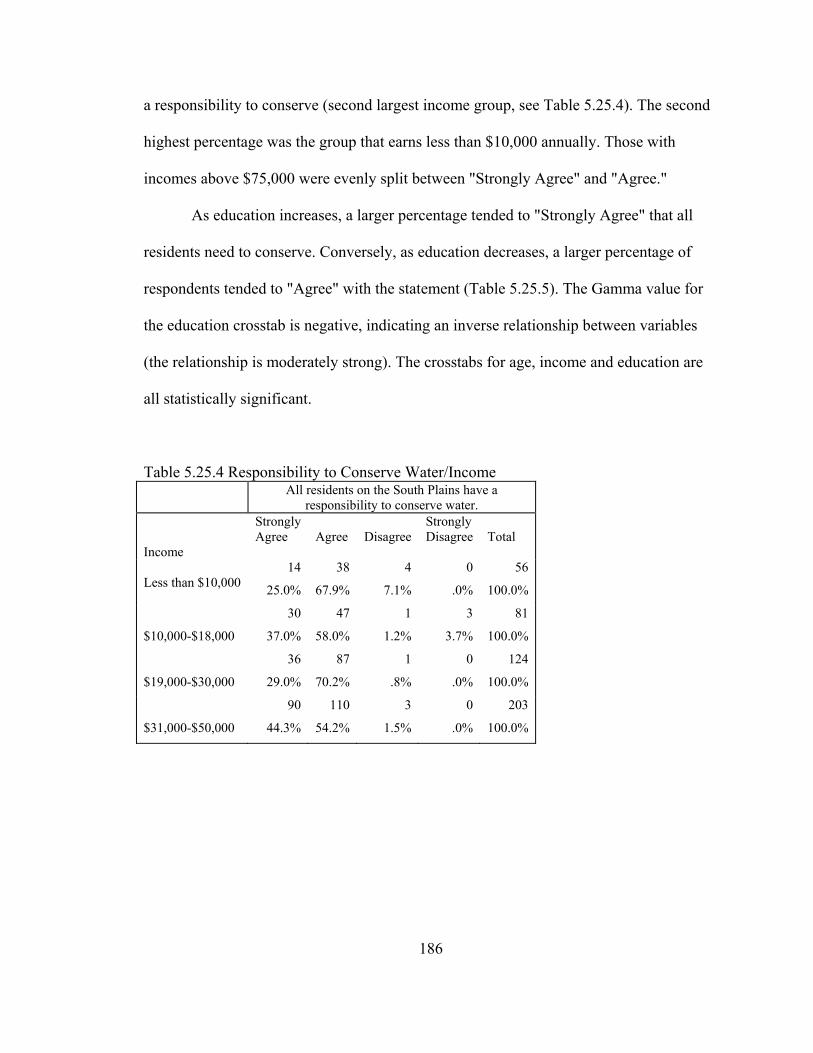
a responsibility to conserve (second largest income group, see Table 5.25.4). The second
highest percentage was the group that earns less than $10,000 annually. Those with
incomes above $75,000 were evenly split between "Strongly Agree" and "Agree."
As education increases, a larger percentage tended to "Strongly Agree" that all
residents need to conserve. Conversely, as education decreases, a larger percentage of
respondents tended to "Agree" with the statement (Table 5.25.5). The Gamma value for
the education crosstab is negative, indicating an inverse relationship between variables
(the relationship is moderately strong). The crosstabs for age, income and education are
all statistically significant.
Table 5.25.4 Responsibility to Conserve Water/Income All residents on the South Plains have a
responsibility to conserve water. Strongly
Agree Agree
Disagree
Strongly Disagree
Total
Income Less than $10,000
14
25.0%
38
67.9%
4
7.1%
0
.0%
56
100.0%
30
37.0%
47
58.0%
1
1.2%
3
3.7%
81
100.0% $10,000-$18,000
$19,000-$30,000
36
29.0%
87
70.2%
1
.8%
0
.0%
124
100.0%
$31,000-$50,000
90
44.3%
110
54.2%
3
1.5%
0
.0%
203
100.0%
186
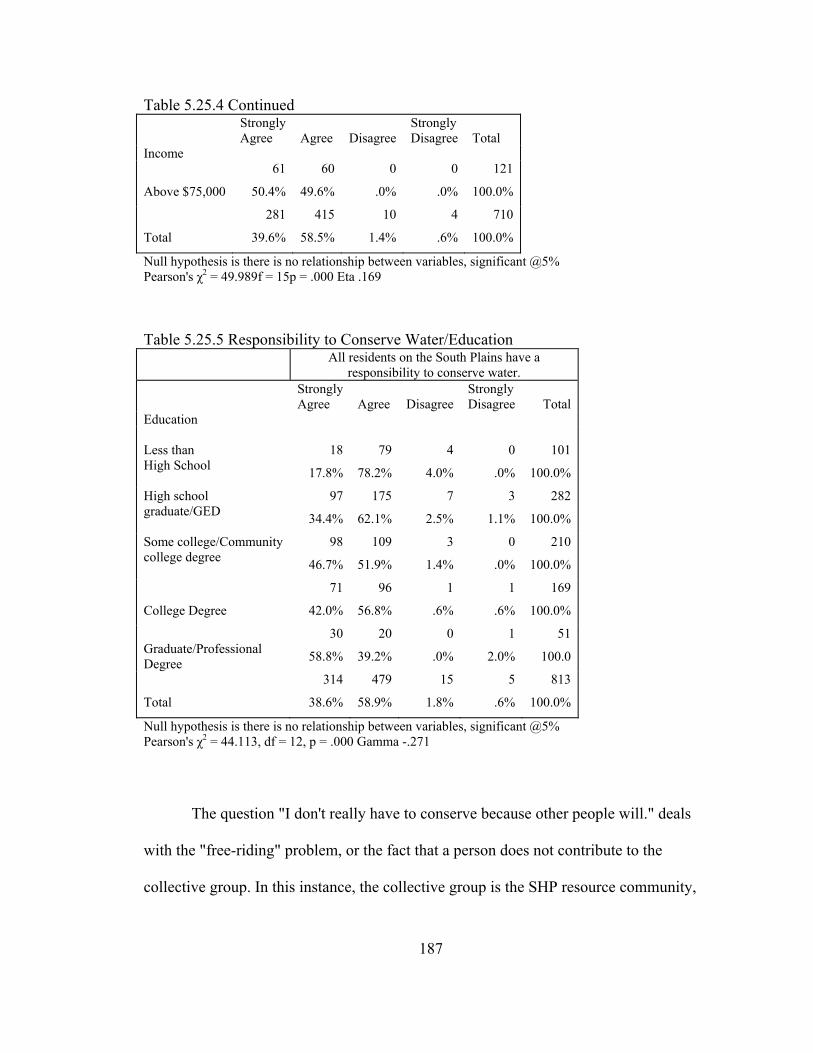
Table 5.25.4 Continued Strongly
Agree Agree
Strongly Disagree Disagree Total
Income
Above $75,000
61
50.4%
60
49.6%
0
.0%
0
.0%
121
100.0%
Total
281 415
58.5%
10
1.4%
4
.6%
710
39.6% 100.0%
Null hypothesis is there is no relationship between variables, significant @5% Pearson's χ2 = 49.989f = 15p = .000 Eta .169 Table 5.25.5 Responsibility to Conserve Water/Education All residents on the South Plains have a
responsibility to conserve water. Strongly
Agree Agree
Disagree
Strongly Disagree
Total
Education Less than High School
18
17.8%
79
78.2%
4
4.0%
0
.0%
101
100.0%
High school graduate/GED
97
34.4%
175
62.1%
7
2.5%
3
1.1%
282
100.0%
Some college/Community college degree
98
46.7%
109
51.9%
3
1.4%
0
.0%
210
100.0%
71 96 1 1 169
College Degree 42.0% 56.8% .6% .6% 100.0%
Graduate/Professional Degree
30
58.8%
20
39.2%
0
.0%
1
2.0%
51
100.0
Total
314 479
38.6% 58.9%
15
1.8%
5
.6%
813
100.0%
Null hypothesis is there is no relationship between variables, significant @5% Pearson's χ2 = 44.113, df = 12, p = .000 Gamma -.271
The question "I don't really have to conserve because other people will." deals
with the "free-riding" problem, or the fact that a person does not contribute to the
collective group. In this instance, the collective group is the SHP resource community,
187
and the contribution to the group is that each individual participates or practices water
conservation. According to the concept of collective action, the predicted answer to this
question should be "Disagree" or "Strongly Disagree." In other words, all residents on the
SHP should conserve. Results are summarized below in Tables 5.26 to 5.26.5. A large
percentage of respondents "Disagree" with the statement "I don't have to conserve
because other people will." signifying residents do have a sense of social responsibility
toward the water supply on the SHP and do not have an attitude that they can "free-ride."
The following data support Hypothesis 4.
Among study area towns, Crosbyton had the largest percentage that "Disagree"
with the statement, with Abernathy having the smallest proportion who "Disagree."
Littlefield had the second most respondents who "Disagree" and Abernathy ranked last.
When cities were combined into "Cities Categorized by Water Source," towns supplied
water by White River Lake ranked number one, those supplied water by the Ogallala
ranked last ("Disagree") (Table 5.26). As with Tables 5.25 to 5.25.5 above, some
interesting trends appear with the question "I don't have to conserve water because other
people will." (Tables 5.26.1 to 5.26.5).
A trend can be seen from the results of the crosstab comparing "I don't have to
conserve because other people will." and whether the respondent answered correctly the
source of their town's water supply (Table 5.26.1). A large percentage disagreed with this
statement, but there was an increase in the percentage from "Correct Answer" (66%) to
"Do Not Know" (76%). The percentage for the categories "Not Correct Answer" and
"Disagree" was somewhat lower than "Correct Answer" (63%). When both "Disagree"
188
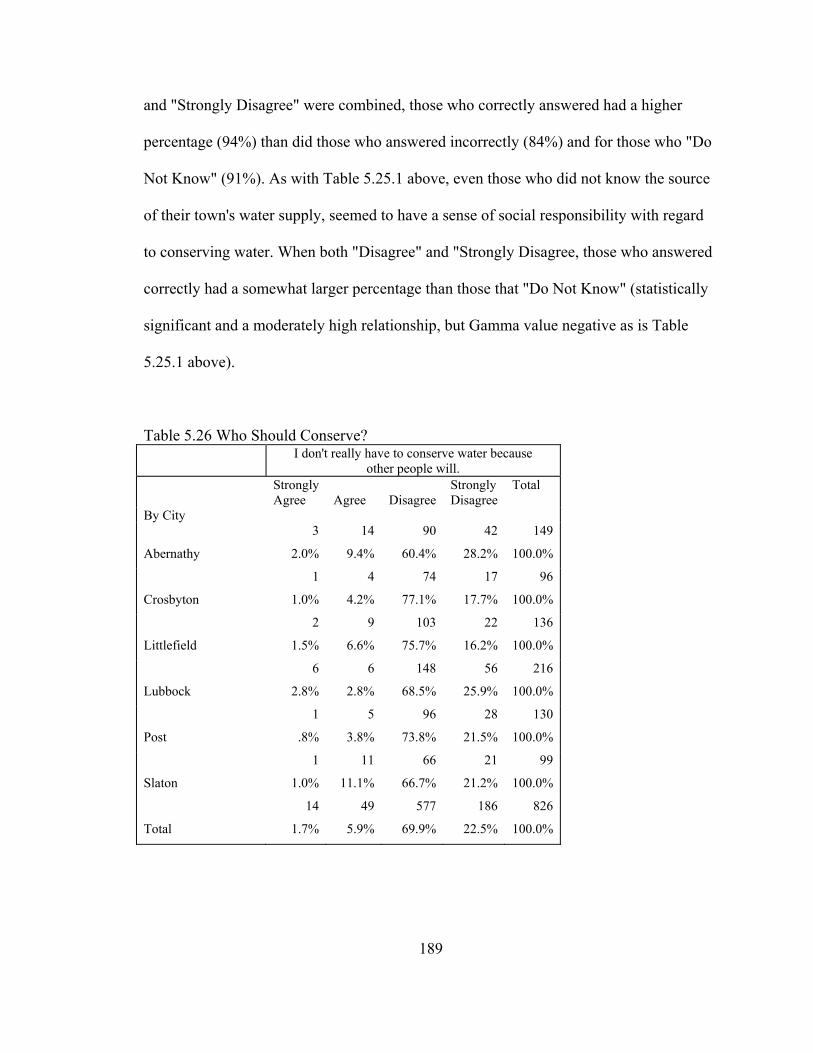
and "Strongly Disagree" were combined, those who correctly answered had a higher
percentage (94%) than did those who answered incorrectly (84%) and for those who "Do
Not Know" (91%). As with Table 5.25.1 above, even those who did not know the source
of their town's water supply, seemed to have a sense of social responsibility with regard
to conserving water. When both "Disagree" and "Strongly Disagree, those who answered
correctly had a somewhat larger percentage than those that "Do Not Know" (statistically
significant and a moderately high relationship, but Gamma value negative as is Table
5.25.1 above).
Table 5.26 Who Should Conserve? I don't really have to conserve water because
other people will. Strongly
Agree Agree Disagree Strongly Disagree
Total
By City
Abernathy
3
2.0%
14
9.4%
90
60.4%
42
28.2%
149
100.0%
Crosbyton
1
1.0%
4
4.2%
74
77.1%
17
17.7%
96
100.0%
Littlefield
2
1.5%
9
6.6%
103
75.7%
22
16.2%
136
100.0%
Lubbock
6
2.8%
6
2.8%
148
68.5%
56
25.9%
216
100.0%
1 5
3.8%
96 28
21.5%
130
Post .8% 73.8% 100.0%
Slaton
1
1.0%
11
11.1%
66
66.7%
21
21.2%
99
100.0%
Total
14 49 577
1.7% 5.9% 69.9%
186
22.5%
826
100.0%
189
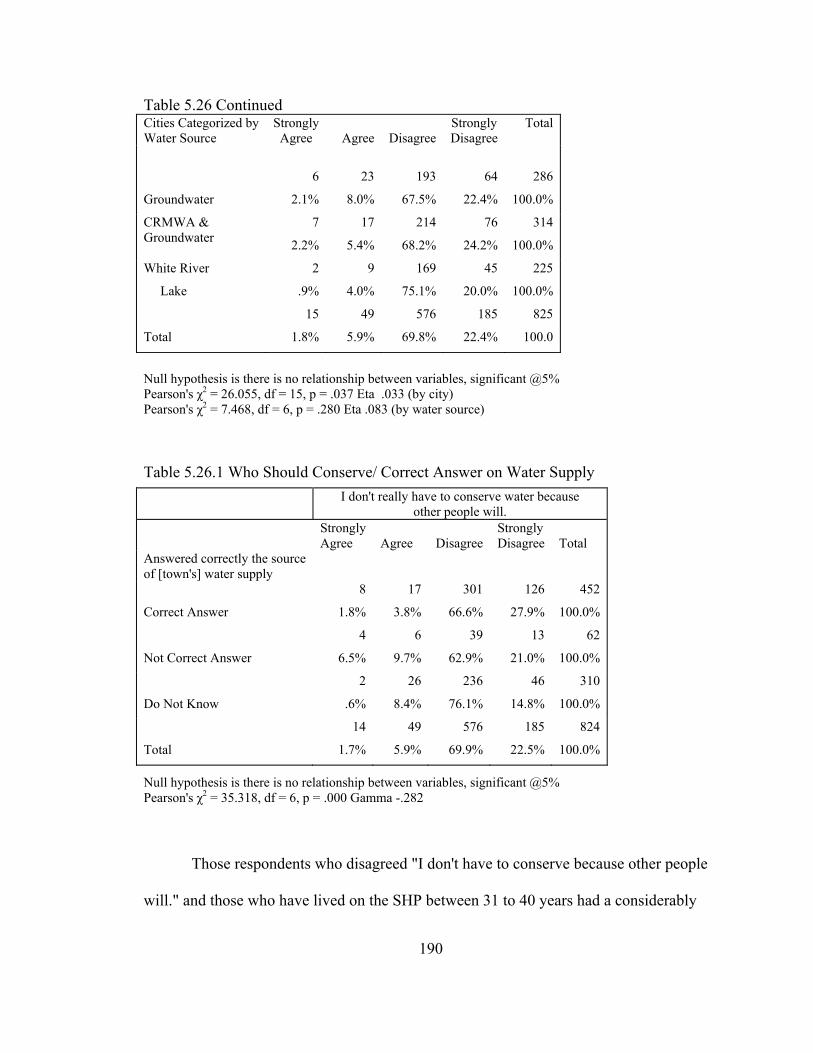
Table 5.26 Continued Cities Categorized by
Water Source Strongly Agree Agree
Disagree
Strongly Disagree
Total
Groundwater
23
8.0%
193
67.5%
64
22.4%
6 286
2.1% 100.0%
CRMWA & 7 17 214 76 314 Groundwater 2.2% 5.4% 68.2% 24.2% 100.0%
White River 2 9
4.0%
169
Lake .9% 75.1%
45
20.0%
225
100.0%
Total
15
1.8%
49
5.9%
Null hypothesis is there is no relationship between variables, significant @5% Pearson's χ2 = 26.055, df = 15, p = .037 Eta .033 (by city) Pearson's χ2 = 7.468, df = 6, p = .280 Eta .083 (by water source)
Table 5.26.1 Who Should Conserve/ Correct Answer on Water Supply
576
69.8%
185
22.4%
825
100.0
I don't really have to conserve water because other people will.
Strongly Agree Agree
Disagree
Strongly Disagree
Total
Answered correctly the source of [town's] water supply
Correct Answer
8
1.8%
17
3.8%
301 126 452
66.6% 27.9% 100.0%
4 6 39 13 62
Not Correct Answer 6.5% 9.7% 62.9% 21.0% 100.0%
2 26 236
76.1%
46
Do Not Know .6% 8.4% 14.8%
Null hypothesis is there is no relationship between variables, significant @5% Pearson's χ2 = 35.318, df = 6, p = .000 Gamma -.282
Those respondents who disagreed "I don't have to conserve because other people
will." and those who have lived on the SHP between 31 to 40 years had a considerably
310
100.0%
Total
14
1.7%
49
5.9%
576
69.9%
185
22.5%
824
100.0%
190
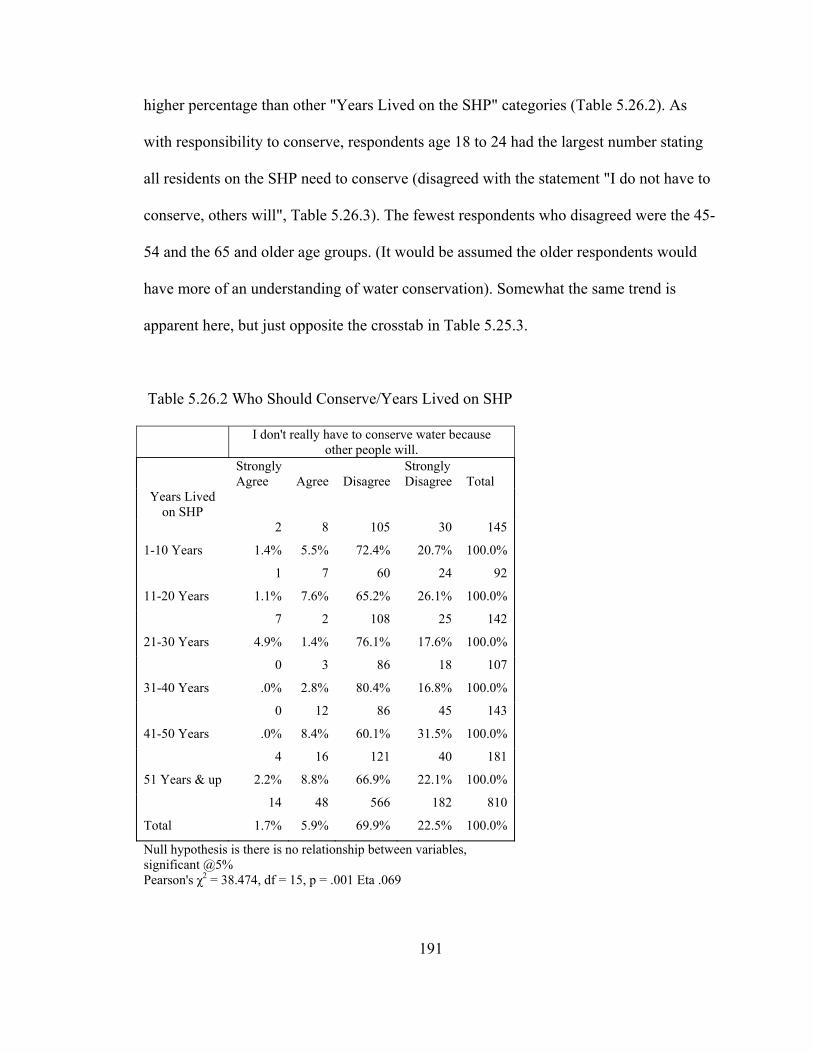
higher percentage than other "Years Lived on the SHP" categories (Table 5.26.2). As
with responsibility to conserve, respondents age 18 to 24 had the largest number stating
all residents on the SHP need to conserve (disagreed with the statement "I do not have to
conserve, others will", Table 5.26.3). The fewest respondents who disagreed were the 45-
54 and the 65 and older age groups. (It would be assumed the older respondents would
have more of an understanding of water conservation). Somewhat the same trend is
apparent here, but just opposite the crosstab in Table 5.25.3.
Table 5.26.2 Who Should Conserve/Years Lived on SHP
I don't really have to conserve water because other people will.
Strongly Agree
Agree
Disagree
Strongly Disagree
Total
Years Lived on SHP
1-10 Years
2
1.4%
8
5.5%
105
72.4%
30
20.7%
145
100.0%
11-20 Years
1
1.1%
7
7.6%
60
65.2%
24
26.1%
92
100.0%
21-30 Years
7
4.9%
2
1.4%
108
76.1%
25
17.6%
142
100.0%
31-40 Years
0
.0%
3
2.8%
86 18 107
80.4% 16.8% 100.0%
0 12
41-50 Years .0% 8.4%
86
60.1%
45
31.5%
143
100.0%
51 Years & up
4
2.2%
16
8.8%
121 40
66.9% 22.1%
181
100.0%
Total
14
1.7%
48 566 182
5.9% 69.9% 22.5%
810
100.0%
Null hypothesis is there is no relationship between variables, significant @5% Pearson's χ2 = 38.474, df = 15, p = .001 Eta .069
191
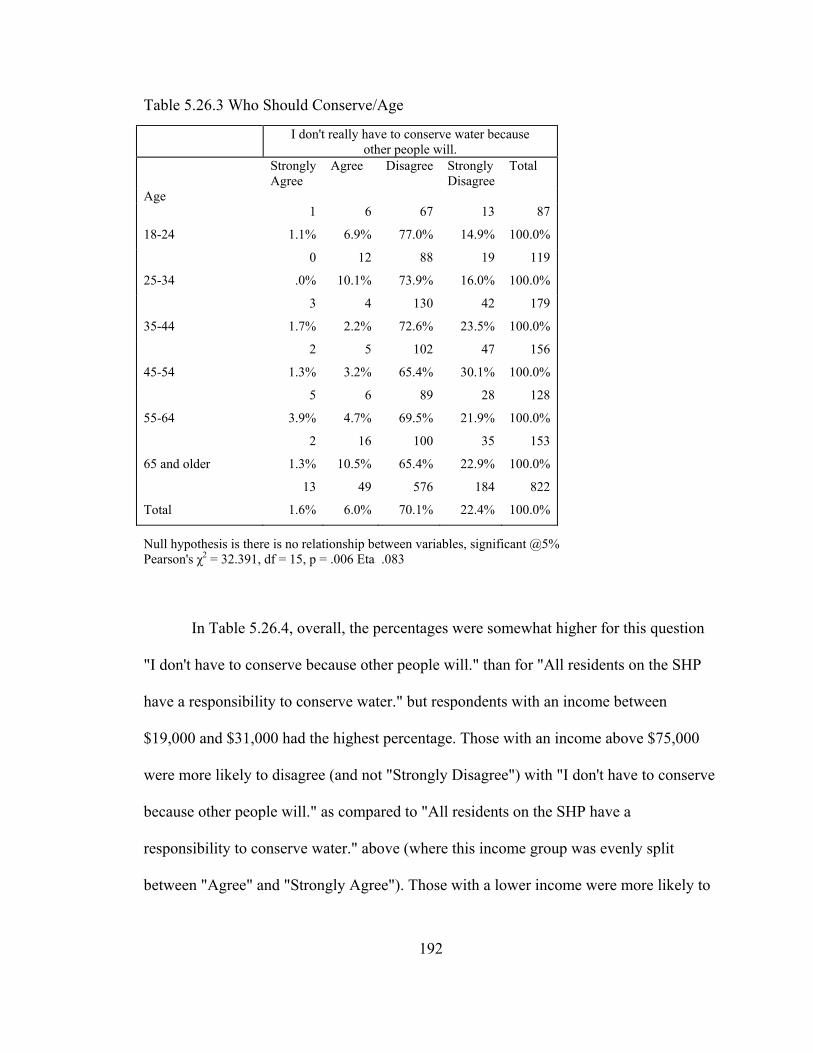
Table 5.26.3 Who Should Conserve/Age
I don't really have to conserve water because
other people will. Strongly
Agree Agree Disagree Strongly
Disagree Total
Age
18-24
1
1.1%
6 67 13
6.9% 77.0% 14.9%
87
100.0%
25-34
0
.0%
12 88 19
10.1% 73.9% 16.0%
119
100.0%
35-44
3
1.7%
4 130 42
2.2% 72.6% 23.5%
179
100.0%
45-54
2
1.3%
5 102 47 156
3.2% 65.4% 30.1% 100.0%
5 6 89 28 128
55-64 3.9% 4.7% 69.5% 21.9% 100.0%
2 16 100 35 153
65 and older 1.3% 10.5% 65.4% 22.9% 100.0%
Null hypothesis is there is no relationship between variables, significant @5% Pearson's χ2 = 32.391, df = 15, p = .006 Eta .083
In Table 5.26.4, overall, the percentages were somewhat higher for this question
"I don't have to conserve because other people will." than for "All residents on the SHP
have a responsibility to conserve water." but respondents with an income between
$19,000 and $31,000 had the highest percentage. Those with an income above $75,000
were more likely to disagree (and not "Strongly Disagree") with "I don't have to conserve
because other people will." as compared to "All residents on the SHP have a
responsibility to conserve water." above (where this income group was evenly split
between "Agree" and "Strongly Agree"). Those with a lower income were more likely to
Total
13
1.6%
49
6.0%
576
70.1%
184
22.4%
822
100.0%
192
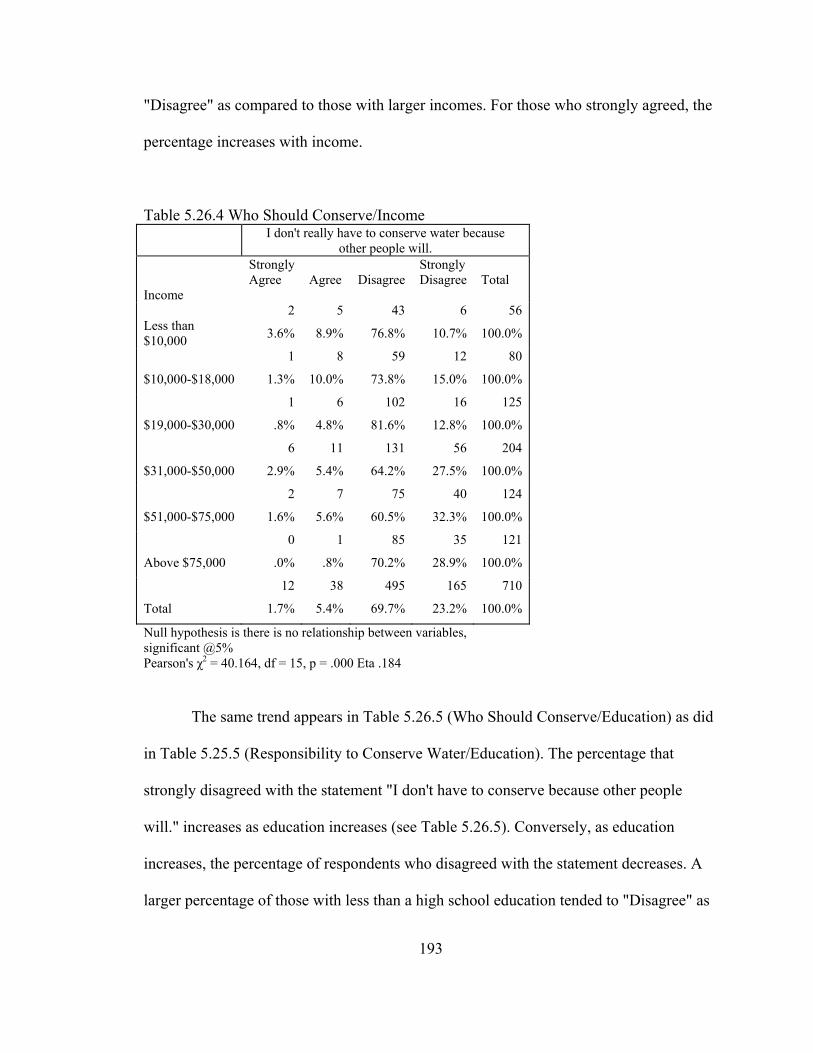
"Disagree" as compared to those with larger incomes. For those who strongly agreed, the
percentage increases with income.
Table 5.26.4 Who Should Conserve/Income I don't really have to conserve water because
other people will. Strongly
Agree Agree
Disagree
Strongly Disagree
Total
Income Less than $10,000
2
3.6%
5
8.9%
43
76.8%
6
10.7%
56
100.0%
$10,000-$18,000
1
1.3%
8
10.0%
59
73.8%
12
15.0%
80
100.0%
$19,000-$30,000
1
.8%
6
4.8%
102
81.6%
16
12.8%
125
100.0%
$31,000-$50,000
6
2.9%
11 131 56 204
5.4% 64.2% 27.5% 100.0%
$51,000-$75,000
2
1.6%
7
5.6%
75
60.5%
40
32.3%
124
100.0%
Above $75,000
0
.0%
1
.8%
85
70.2%
35
28.9%
121
100.0%
Total
12
1.7%
38
5.4%
495
69.7%
165
23.2%
710
100.0%
Null hypothesis is there is no relationship between variables, significant @5% Pearson's χ2 = 40.164, df = 15, p = .000 Eta .184
The same trend appears in Table 5.26.5 (Who Should Conserve/Education) as did
in Table 5.25.5 (Responsibility to Conserve Water/Education). The percentage that
strongly disagreed with the statement "I don't have to conserve because other people
will." increases as education increases (see Table 5.26.5). Conversely, as education
increases, the percentage of respondents who disagreed with the statement decreases. A
larger percentage of those with less than a high school education tended to "Disagree" as
193
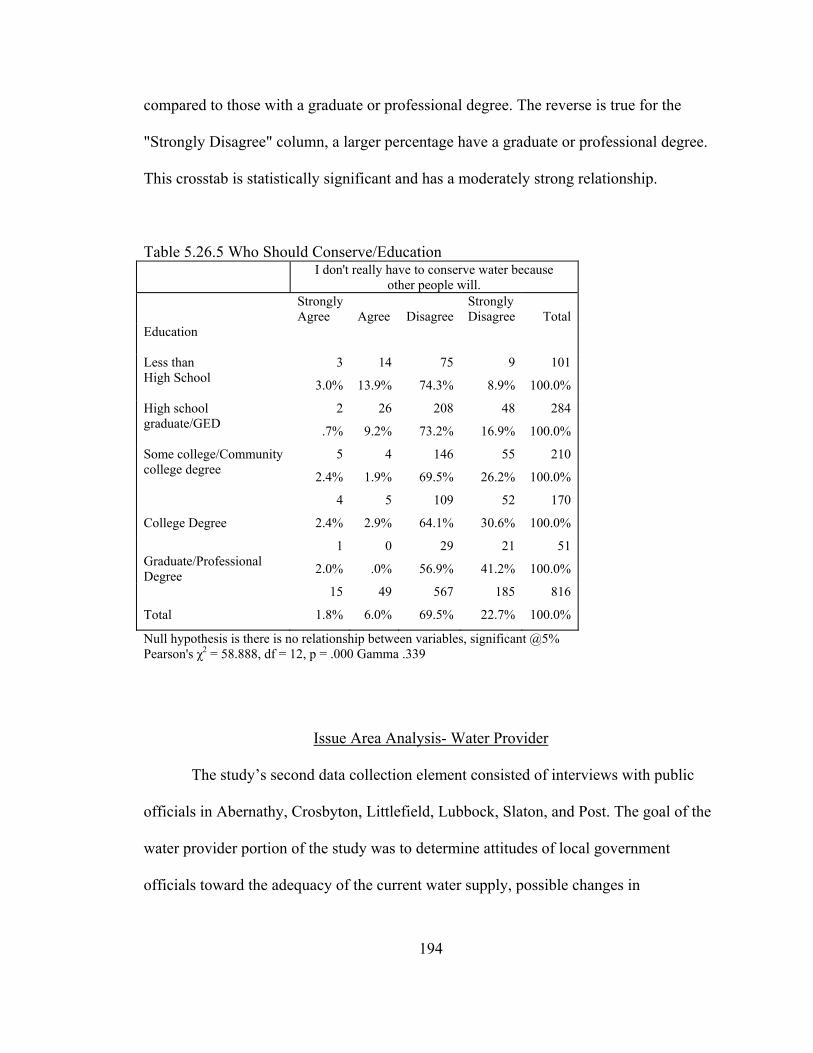
compared to those with a graduate or professional degree. The reverse is true for the
"Strongly Disagree" column, a larger percentage have a graduate or professional degree.
This crosstab is statistically significant and has a moderately strong relationship.
Table 5.26.5 Who Should Conserve/Education I don't really have to conserve water because
other people will. Strongly
Agree Agree
Disagree
Strongly Disagree
Total
Education Less than High School
3
3.0%
14
13.9%
75
74.3%
9
8.9%
101
100.0%
High school graduate/GED
2
.7%
26
9.2%
208
73.2%
48
16.9%
284
100.0%
Some college/Community college degree
5
2.4%
4
1.9%
146 55 210
69.5% 26.2% 100.0%
4 5 109
64.1%
52
College Degree 2.4% 2.9% 30.6%
170
100.0%
Graduate/Professional Degree
1
2.0%
0
.0%
29
56.9%
21
41.2%
51
100.0%
Total
15
1.8%
49
6.0%
567 185 816
69.5% 22.7% 100.0%
Null hypothesis is there is no relationship between variables, significant @5% Pearson's χ2 = 58.888, df = 12, p = .000 Gamma .339
Issue Area Analysis- Water Provider
The study’s second data collection element consisted of interviews with public
officials in Abernathy, Crosbyton, Littlefield, Lubbock, Slaton, and Post. The goal of the
water provider portion of the study was to determine attitudes of local government
officials toward the adequacy of the current water supply, possible changes in
194
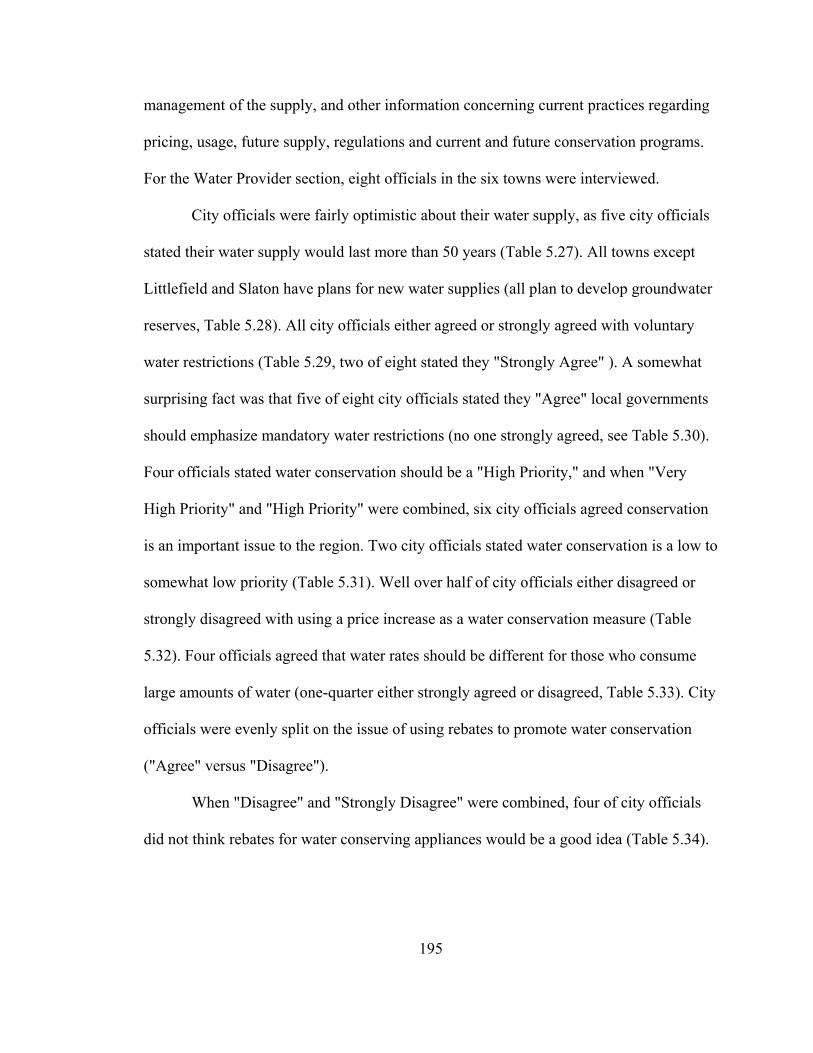
management of the supply, and other information concerning current practices regarding
pricing, usage, future supply, regulations and current and future conservation programs.
For the Water Provider section, eight officials in the six towns were interviewed.
City officials were fairly optimistic about their water supply, as five city officials
stated their water supply would last more than 50 years (Table 5.27). All towns except
Littlefield and Slaton have plans for new water supplies (all plan to develop groundwater
reserves, Table 5.28). All city officials either agreed or strongly agreed with voluntary
water restrictions (Table 5.29, two of eight stated they "Strongly Agree" ). A somewhat
surprising fact was that five of eight city officials stated they "Agree" local governments
should emphasize mandatory water restrictions (no one strongly agreed, see Table 5.30).
Four officials stated water conservation should be a "High Priority," and when "Very
High Priority" and "High Priority" were combined, six city officials agreed conservation
is an important issue to the region. Two city officials stated water conservation is a low to
somewhat low priority (Table 5.31). Well over half of city officials either disagreed or
strongly disagreed with using a price increase as a water conservation measure (Table
5.32). Four officials agreed that water rates should be different for those who consume
large amounts of water (one-quarter either strongly agreed or disagreed, Table 5.33). City
officials were evenly split on the issue of using rebates to promote water conservation
("Agree" versus "Disagree").
When "Disagree" and "Strongly Disagree" were combined, four of city officials
did not think rebates for water conserving appliances would be a good idea (Table 5.34).
195
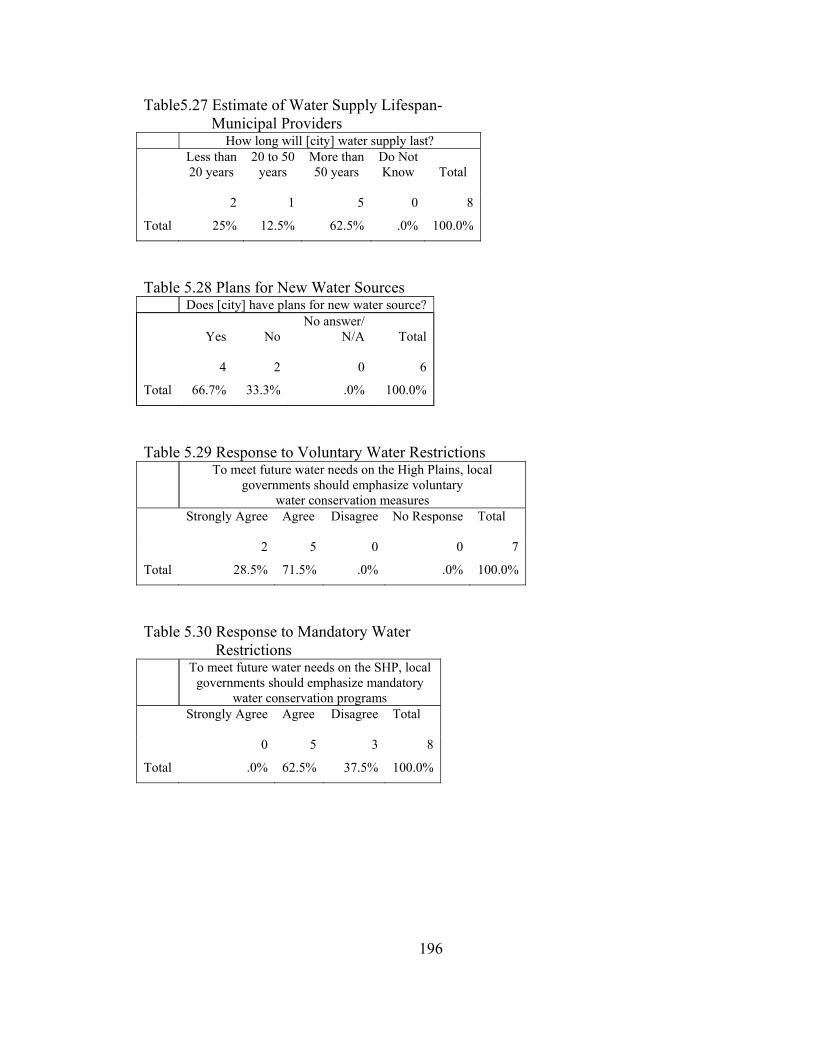
Table5.27 Estimate of Water Supply Lifespan- Municipal Providers How long will [city] water supply last? Less than
20 years
20 to 50 years
More than Do Not 50 years Know Total
Total
2
25%
1
12.5%
5
62.5%
0
.0%
8
100.0%
Table 5.28 Plans for New Water Sources Does [city] have plans for new water source?
Yes
No answer/ No N/A Total
Total
4
66.7%
2
33.3%
0
.0%
6
100.0%
Table 5.29 Response to Voluntary Water Restrictions To meet future water needs on the High Plains, local
governments should emphasize voluntary water conservation measures
Strongly Agree Agree Disagree No Response Total
Total
2
28.5%
5
71.5%
0
.0%
0
.0%
7
100.0%
Table 5.30 Response to Mandatory Water Restrictions To meet future water needs on the SHP, local
governments should emphasize mandatory water conservation programs
Strongly Agree
Agree Disagree Total
Total
0
.0%
5 3
62.5% 37.5%
8
100.0%
196
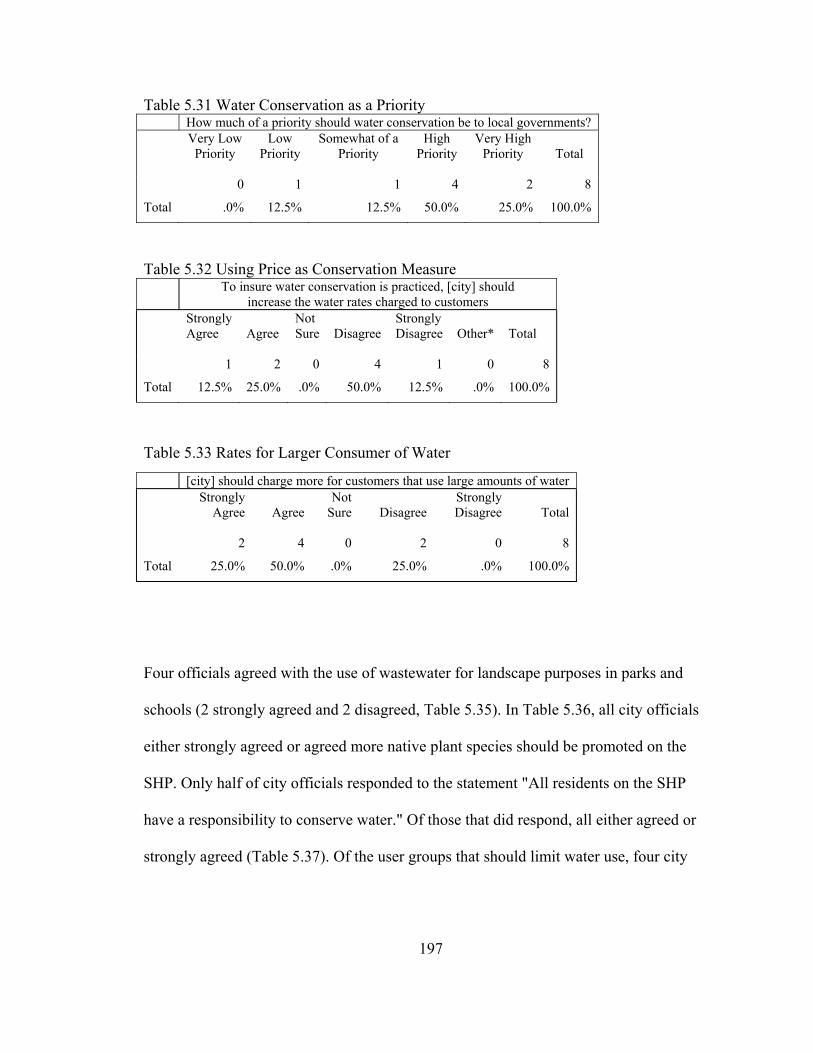
Table 5.31 Water Conservation as a Priority How much of a priority should water conservation be to local governments? Very Low
Priority
Low Somewhat of a Priority Priority
High Priority
Very High Priority
Total
Total
0
.0%
1
12.5%
1 4 2 8
12.5% 50.0% 25.0% 100.0%
Table 5.32 Using Price as Conservation Measure
To insure water conservation is practiced, [city] should increase the water rates charged to customers
Strongly Agree
Agree
Not Sure
Disagree
Strongly
Disagree Other*
Table 5.33 Rates for Larger Consumer of Water
Total
Total
1
12.5%
2
25.0%
0
.0%
4 1 0 8
50.0% 12.5% .0% 100.0%
[city] should charge more for customers that use large amounts of water
Strongly Agree
Not Agree Sure
Four officials agreed with the use of wastewater for landscape purposes in parks and
schools (2 strongly agreed and 2 disagreed, Table 5.35). In Table 5.36, all city officials
either strongly agreed or agreed more native plant species should be promoted on the
SHP. Only half of city officials responded to the statement "All residents on the SHP
have a responsibility to conserve water." Of those that did respond, all either agreed or
strongly agreed (Table 5.37). Of the user groups that should limit water use, four city
Disagree
Strongly Disagree
Total
Total
2
25.0%
4 0 2 0 8
50.0% .0% 25.0% .0% 100.0%
197
officials stated agriculture users should limit water use. Two stated businesses should
limit water use and two stated all should equally limit water use (Table 5.38).
Table 5.34 Incentives to Encourage Water Conservation Practices
Table 5.35 Use of Treated Wastewater
The city will have to offer incentives to encourage citizens to accept and adopt water conservation practices
Strongly Agree
Agree Other
Disagree
Strongly Disagree
Total
0 3 0 3 1 7
Total .0% 42.9% .0% 42.9% 14.2% 100.0%
[city] should reuse treated wastewater for landscape purposes in parks and schools
Strongly
Agree
Table 5.36 Promote Use of Low Water Using Plant Species
Agree
Other
Disagree
Strongly Disagree
Total
2 4 0 2 0 8
Total 25.0% 50.0% .0% 25.0% .0% 100.0%
[city] should promote a program for residential customers to put in low water using plant species
Strongly Agree
Agree Not Sure
Disagree
Strongly Disagree
Total
2 6 0 0 0
Total 25.0% 75.0% .0% .0% .0%
8
100.0%
198
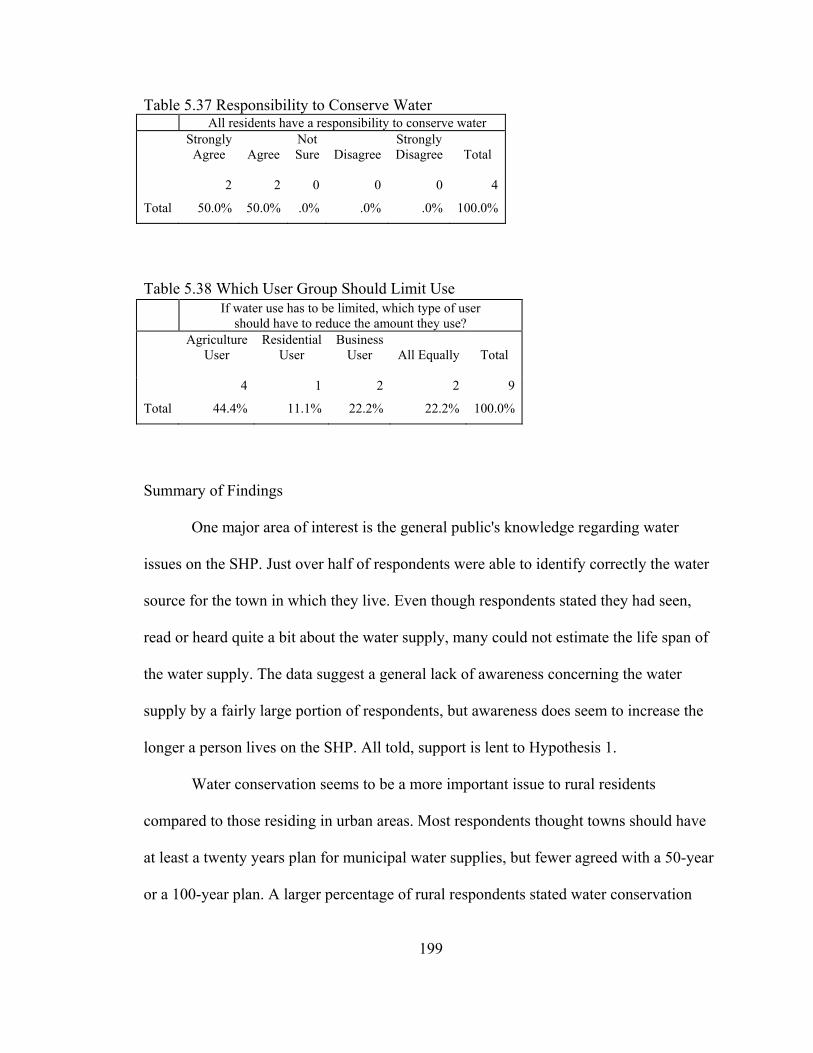
Table 5.37 Responsibility to Conserve Water All residents have a responsibility to conserve water
Strongly Agree
Not Strongly Agree Sure Disagree Disagree Total
2 2 0 0 0 4
Total 50.0% 50.0% .0% .0% .0% 100.0%
Table 5.38 Which User Group Should Limit Use
If water use has to be limited, which type of user should have to reduce the amount they use?
Agriculture Residential Business User User User All Equally Total
4 1 2 2 9
Total 44.4% 11.1% 22.2% 22.2% 100.0%
Summary of Findings
One major area of interest is the general public's knowledge regarding water
issues on the SHP. Just over half of respondents were able to identify correctly the water
source for the town in which they live. Even though respondents stated they had seen,
read or heard quite a bit about the water supply, many could not estimate the life span of
the water supply. The data suggest a general lack of awareness concerning the water
supply by a fairly large portion of respondents, but awareness does seem to increase the
longer a person lives on the SHP. All told, support is lent to Hypothesis 1.
Water conservation seems to be a more important issue to rural residents
compared to those residing in urban areas. Most respondents thought towns should have
at least a twenty years plan for municipal water supplies, but fewer agreed with a 50-year
or a 100-year plan. A larger percentage of rural respondents stated water conservation
199
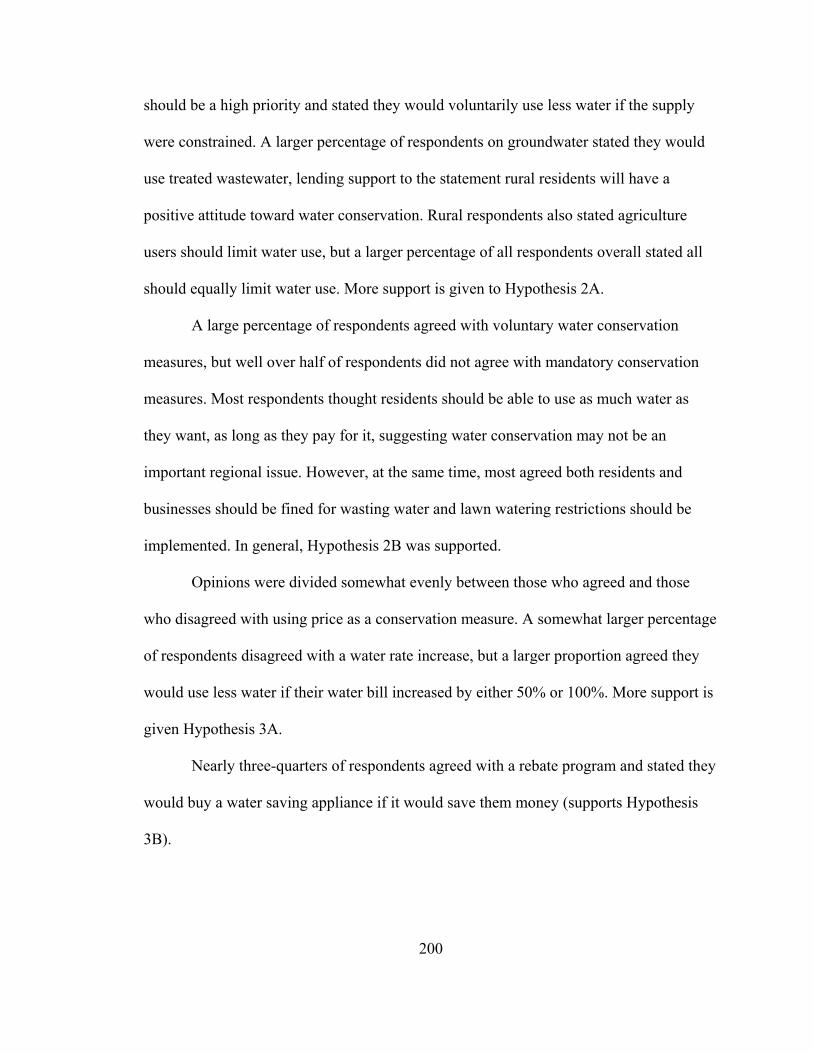
should be a high priority and stated they would voluntarily use less water if the supply
were constrained. A larger percentage of respondents on groundwater stated they would
use treated wastewater, lending support to the statement rural residents will have a
positive attitude toward water conservation. Rural respondents also stated agriculture
users should limit water use, but a larger percentage of all respondents overall stated all
should equally limit water use. More support is given to Hypothesis 2A.
A large percentage of respondents agreed with voluntary water conservation
measures, but well over half of respondents did not agree with mandatory conservation
measures. Most respondents thought residents should be able to use as much water as
they want, as long as they pay for it, suggesting water conservation may not be an
important regional issue. However, at the same time, most agreed both residents and
businesses should be fined for wasting water and lawn watering restrictions should be
implemented. In general, Hypothesis 2B was supported.
Opinions were divided somewhat evenly between those who agreed and those
who disagreed with using price as a conservation measure. A somewhat larger percentage
of respondents disagreed with a water rate increase, but a larger proportion agreed they
would use less water if their water bill increased by either 50% or 100%. More support is
given Hypothesis 3A.
Nearly three-quarters of respondents agreed with a rebate program and stated they
would buy a water saving appliance if it would save them money (supports Hypothesis
3B).
200
Data indicate that a majority of SHP respondents are at least aware of the social
responsibility of having a sustainable water supply well into the future (collective action).
The concept of social responsibility or stewardship that is clearly evident in the minds of
SHP respondents is indicated by the responses to the two statements "All residents on the
SHP have a responsibility to conserve water." and "I don’t have to conserve water
because other people will." (supports Hypothesis 4).
Half of water providers estimated their municipal water supply should last over 50
years, but the same percentage stated they were searching for new sources. All city
officials agreed with voluntary water conservation measures, but a larger percentage
stated mandatory measures might have to be implemented at some time to help meet
future water needs. Most thought water conservation should be a priority, but did not
think the price of water should be used as a conservation tool (even though all admitted
water generated a large portion of the total revenue for each city). Municipal officials did
not support rebates as an incentive to conserve water. Most city officials seemed to think
water is a critical issue, and that water conservation is an important issue to the region.
However, it seems city officials consider the revenue generated by the water as an
equally important element in their community's fiscal well being.
201
Notes
1. After the data were collected and the analysis was underway, it was realized the
question ("Do you know the source of [city's] water supply?") has a design flaw. Answers
to the question were: 1) Lake or River, 2) Groundwater or Aquifer, 3) A combination of
sources, 4) Do Not Know and 5) Refused to Answer. As the question is worded, there
was not an incorrect answer for Lubbock and Slaton, as both cities get water from all
three sources, a lake or a river, groundwater and a combination of sources. That is the
reason for the zero in the "Not Correct" category for "CRMWA and Groundwater" (for
both Lubbock and Slaton, in the "By City" category, see Table 5.2). If the "Do Not
Know" category for Lubbock and Slaton is considered in Table 5.2, 32% of Lubbock
respondents and 59% of Slaton respondents did not know the source of their water
supply, which is comparable to the combined total "Groundwater" category for
Abernathy and Littlefield. For future studies that include towns with several sources of
water, the wording will need to be changed. By including one word "Do you know the
'majority' source of [city's] water supply", the answers would possibly be less confusing
for analysis. An alternative would be to include the word only in the answers: 1) Lake or
River only, 2) Groundwater or Aquifer only, 3) A Combination of Sources, 4) Do Not
Know and 5) Refused to Answer.
202
CHAPTER VI
CONCLUSIONS AND REFLECTIONS
The six towns in this study were selected to insure representation by various
community sizes and water sources on the SHP, to assure a representative selection of the
area's residents and to allow the comparison of attitudes of consumers supplied water by
the differing sources. It is assumed, the conclusions drawn from analyses of the data
gathered in this study can be applied to the entire SHP region's population, not just the
sample studied.
The first area of concern for any municipality is the public's awareness of the
water supply and related issues. To gain important support and to ensure success of a
municipal water conservation program, those who will have to abide by the water use
restrictions have to be informed about the details of the restrictions (what they are and
why they are necessary). Knowledge of the source of the community's water supply and
water quantity and quality issues are also important. In this study, almost half of
respondents answered incorrectly or did not know the source of their town's water supply.
However, about three-quarters of respondents stated they had at least heard some
information about the local water supply or water conservation in the past year. When
asked how long the water supply should last in their town, almost 40% could not or did
not want to venture an estimate. Length of residence on the SHP and age both seem to
enhance awareness of water issues on the SHP.
203
A majority of respondents in all six towns ranked education as the most important
issue to the region. Water conservation was ranked from the second most important issue
to the fourth most important issue in the region. Even though water conservation was not
ranked the most important issue, almost all respondents stated it was either "Extremely
Important" or "Somewhat Important." Most residents thought a short-term water plan (a
20-year water plan) would be a good idea, but fewer thought a 100-year plan was
important. A majority (95%) stated water conservation should be a very high priority or a
somewhat important priority. Most (86%) either strongly agreed or agreed they would
use less water if it was in short supply and a large percentage stated they would use
treated wastewater to water their lawn. Almost all respondents (93%) either strongly
agreed or agreed that voluntary water conservation measures are a good idea. A smaller
percentage (63%) disagreed with mandatory restrictions. Most respondents agreed that
residents should have unlimited consumption of water as long as they pay for it.
Respondents stated both residents and businesses should be fined for wasting water and
63% said restrictions should be implemented concerning the issue of when lawn watering
should be allowed. Interestingly, almost 40% of respondents employed in the agriculture
industry and 30% of residents in all towns stated all users (residential, agriculture and
business users) should equally limit their water use.
On the issue of increasing water rates as a way to conserve water, respondents
were fairly evenly split between "Agree" and "Disagree" (56% either disagreed or
strongly disagreed, 44% either agreed or strongly agreed). Respondents stated they would
use less water if their bill doubled in cost or if their bill increased by half what it normally
204
costs. Most respondents (74%) agreed a rebate program would encourage people to buy a
water saving appliance or fixture and about three-quarters stated they would buy one if
they thought they could save money over the long run.
A majority (97%) agreed all residents have a social responsibility to conserve
water. Respondents also disagreed with the statement "I don't have to conserve because
other people will." indicating an awareness of the concept of social responsibility toward
water conservation on the SHP.
Residents on the SHP, in general support water conservation, but do not support
mandatory restrictions and do not want the price to increase significantly, but if it did,
they would use less water. It appears length of time a respondent has lived on the SHP
and a person's age influence knowledge of the water supply and attitudes toward water
conservation. Awareness of the concept of social responsibility is also evident in this
study, as most respondents realize all residents have to participate in water conservation
for it to be effective and successful (age and education also seem to have an influence).
Water usage and price of water seem to be correlated, even though this conclusion
is isolated to this study and is based on only six towns on the SHP (see Table 5.22). The
highest cost of water is in Crosbyton, second highest is in Post and both towns have the
second lowest 4-year gpcd average (gpcd of 157 and 158, respectively). In contrast,
Abernathy has the least expensive water of all six towns in the study, and has the highest
deviation from the 4-year average gpcd (gpcd specific for their particular town). Slaton
has the third lowest cost of water, but has by far the lowest gpcd of all six towns (and the
205
highest deviation from their 4-year average gpcd). (This would be an interesting topic for
a future study).
Most city officials estimated their water supply should last more than fifty years,
but they also stated they have plans to develop new water sources. All city officials
agreed towns should emphasize voluntary conservation measures to meet future water
supply needs, and surprisingly, over half agreed with mandatory restrictions. Most did
not like the prospects of a price increase for water, but agreed the large volume water
consumers should be penalized by charging more. A larger percentage of city officials
stated water conservation should be a high priority, but several stated it was only a low to
somewhat low priority. The idea of offering incentives to encourage the adoption of
water conservation practices was not a popular idea among city officials. Treated
wastewater was a good idea, as was promoting more native plant species that use less
water.
Reflections
Results presented in this study were, for the most part, what were expected.
Exceptions were anticipated and a few surprising results appeared. One surprise was
respondents in Abernathy and Littlefield, supplied water by the Ogallala aquifer, have the
highest percentage of respondents who did not know the source of their water supply. It
was assumed at the outset of this study that residents in both towns would have a keener
awareness of their water supply because of the unpredictable status of the groundwater,
and the fact these two towns "compete" with the agriculture user for water. In addition,
206
the results were somewhat surprising because of the fact approximately 40% of residents
in Abernathy and 37% of residents in Littlefield were employed in the agriculture
industry in some manner (see Table 5.12.1). It was assumed respondents in both
Abernathy and Littlefield would be more aware of the source and status of their water
supply than respondents in Lubbock or Slaton would be. In contrast, it was not surprising
to see those employed in the agriculture industry would think all water user groups on the
SHP should equally limit water use, even though agriculture takes a majority of the water
from the Ogallala aquifer.
An area that would be useful to look at if this study were expanded is the
correlation between local climate and water usage. A study could be conducted in the
western U.S. to compare regions in which residents have adapted or changed their
preference for plant species (more drought tolerant) to other regions that have not; and to
determine why these differences exist (discussed in Western Resource Advocates, 2003).
A second area that should be included in any future study is how much media
coverage concerning the quantity and/or quality of the water supply is being disseminated
to a community. One important question comes to mind regarding media coverage of the
water supply/problems. Is the amount of information being disseminated accurate, is it
adequate to inform or educate the consumer about the situation and is this information
causing a change in behavior? A second question, important to this type of study, is what
type of media coverage exists and what proportion is being disseminated by the various
media types (public meetings, television, radio, all types of print, the Internet). One
problem seen with a study of this nature is the degree of difficulty in collecting this type
207
of data. However, this data is important, because water providers need to gain an
understanding of the knowledge (and awareness) of water consumers concerning the
local source and supply and how this information may affect their resulting behavior
(attitudes toward water conservation and the eventual consumption of water).
Concluding Thoughts
The results of this study should be useful not only to the towns included in this
study, but also to any municipality that may have water supply constraints. The study has
looked at the issue of knowledge of consumers concerning the water supply. Without
knowledge about the source of a town's water supply, how can consumers be expected to
know the status of its supply? Education of the consumers about the source and the status
of the supply is a critical element in maintaining the present quality of life in any
community. The opinion of consumers regarding government regulation is also critical,
as public support prior to any policy implementation is important. If the price of water
has to be increased, consumers have to be made aware of the reasons why. The
community as a whole has to be informed on issues crucial to the sustainability of their
resources (education) and made aware of the need of any changes that may be necessary
(public relations) if community support is to be gained. Included in the education and
public relations program should be the message that all consumers in the community
have to adopt water conservation behavior. If all consumers accept and adopt some
degree of conservation behavior, the program has a better chance of success and has a
better chance of accomplishing the desired results.
208

The survey instrument, with a few exceptions, accomplished the outcomes
established at the outset of this study. With limited modifications, the instrument would
be useful for any local study of water supplies, U.S. or globally, but especially in arid or
semi-arid climates.
209
LITERATURE CITED
A & N Technical Services, Inc. (2000). "BMP Costs & Savings Study: A Guide to Data and Methods for Cost-Effectiveness Analysis of Urban Water Conservation Best Management Practices." Prepared for The California Urban Water Conservation Council. Encinitas, California, July, 2000.
Aitken, Campbell K.; McMahon, Thomas. A.; Wearing, Alexander J. and Finlayson,
Brian J. (1994). "Residential Water Use: Predicting and Reducing Consumption." Journal of Applied Social Psychology, Volume 24, Number 2, pp. 136-158.
Alm, Leslie R. and Witt, Stephanie L. (1997). "The Rural-Urban Linkage to
Environmental Policy Making in the American West: A Focus on Idaho." The Social Science Journal, Volume 34, Number 2, pp. 271-284.
Anderson, Jesse; Rundall, Jill and Cobb, Neil. (2003). "Is the Southwest in an
Unprecedented Drought?" Merriam-Powell Center for Environmental Research. Internet: http://environment.nau.edu/water/Drought_Facts.pdf.
Argawal, Arun and Gibson, Clark, (1999). "Enchantment and Disenchantment: The Role
of Community in Natural Resource Conservation." World, Development, Volume 27, Number 4, pp. 629-649.
Baldassare, Mark and Katz, Cheryl. (1992). "The Personal Threat of Environmental
Problems as Predictor of Environmental Practices." Environment and Behavior, Volume 24, No. 5, September 1992, pp. 602-616.
Barbanell, Edward M. (2001). Common-Property Arrangements and Scarce Resources:
Water in the American West. Westport, Connecticut: Praeger Publishers. Beecher, J. A. and A. P. Laubach. (1989). "Compendium on water supply, drought, and
conservation." Report No. NRRI 89-15. National Regulatory Research Institute, Columbus, OH.
Blackburn, Elliott. (2006). "Dry spell nears record-busting stretch in area." Lubbock
Avalanche Journal, January 20, 2006, p. A-1, A-5. Bradley, Ruth. (2006). "Sleet storm can't crack dry spell." Lubbock Avalanche Journal,
January 2, 2006, p. A-1, A-4.
210
Brintnall, Michael. (1999). "Public Participation in Rulemaking: Interests v. Information." National Assocoation of Schools of Public Affairs and Administration. Paper for Fifth National Public Management Research Conference, Texas A&M University, December 4, 1999. Internet: http://bush. Tamu.edu/pubman/papers/1999/Brintnall99.pdf.
Brooks, Elizabeth and Emel, Jacque. (2000). The Llano Estacado of the U.S. Southern High Plains: Environmental Transformation and the Prospect for Sustainability. New York: United Nations University Press. Buffalo Springs Lake. ( n.d.). Internet: http://www.buffalospringslake.net/. Canadian River Municipal Water Authority (CRMWA). (n.d.). Internet: http://www. crmwa.com. Cannon, Brian. (2004). Director- Earl Survey Lab, Texas Tech University. Personal
communication, e-mail dated November 30, 2004. Chandler, Cory. (2005). "Thirst for Answers." Lubbock Avalanche Journal, January 14,
2005, p. A-1, A-3. Chrestman, Toni. Personal Communication, May 19, 2004. City of Slaton, Texas. City of Austin Green Building Program. "Water Conservation- Single Family-Toilet
Replacement Program." Internet: http://www.ci.austin.tx.us/watercon/ sfannounce1.htm.
Climas. (2005) "Southwest Climate Outlook- October 2005". CLIMAS- Climate Assessment for the Southwest, October 25, 2005. Internet: http://www.ispe. arizona.edu/climas/forecasts/swoutlook.html. "Communications Plan Helped Roanoke Survive Drought." (2003). Virginia Town and
City Magazine, Volume 39, Number 9, September 2003. Internet:http:www.vml. org/VTC/VTC3809-2.html.
Cook, Stuart W. and Berrenberg, Joy L. (1981). "Approaches to Encouraging
Conservation Behavior: A Review and Conceptual Framework." Journal of Social Issues, Volume 37, Number 2.
Corral-Verdugo, Victor; Frias-Armenta, Martha; Perez-Urias, Faviola; Orduna-Cabrera,
Virginia;and Espinoza-Gallego, Noelia. (2002). "Residential Water Consumption, Motivatioin for Conserving Water and the Continuing Tragedy of the Commons." Environmental Management, Volume 30, Number 4, pp. 527-535.
211
"Depth-to-Water Level Measurements in District Observation Well Network Reveal Average Ground Water Level Decline of 0.78 of a Foot During 2001." (2002). The Cross Section, Volume 48, Number 4, April 2002.
"Depth-to-Water Level Measurements in District Observation Well Network Reveal
Average Ground Water Level Decline of 1.06 Feet during 2002." (2003). The Cross Section, Volume 49, Number 4, April 2003.
de Oliver, Miguel. (1999)." Attitudes and Inaction: A Case Study of the Manifest
Demographics of Urban Water Conservation." Environment and Behavior, Volume 31, Number 3, May 1999, p. 372-394.
de Young, Raymond. (1986). "Encouraging Environmentally Appropriate Behavior: The
Role of Intrinsic Behavior." Journal of Environmental Systems, Volume 15, Number 4, 1985-1986, pp. 281-292.
de Young, Raymond. (1993). "Changing Behavior and Making It Stick: The
Conceptualization and Management of Conservation Behavior." Environment and Behavior, Volume 25, Number 4, July 1999, pp. 485-505.
"District Water Level Measurements Reveal Average Decline of 1.34 Feet." (2004). The
Cross Section, Volume 50, Number 5, May 2004. Driver, Bruce. (2002). "Water Use Efficiency Improvements: A Solution to Colorado's
Urban Water Supply Problems: Land and Water Fund of the Rockies." Western Resource Advocates. July 2002. Internet: http:www.westernresourceadvocates. org/pdf/Efficiency%20 [email protected].
Earl Survey Research Laboratory. (2005). Telephone Surveys. Internet: http://www.orgs.
ttu.edu/earlsurveyresearchlab/phone.html. Easton, Pam. (2000a). "West Texas Rural Areas Low on Water." Lubbock Avalanche
Journal, July 14, 2000, p. A-11. Easton, Pam. (2000b). "Drought-weary Throckmorton to Turn on New Water Tap
Today." Lubbock Avalanche Journal, September 13, 2000, p. A-12. Easton, Pam. (2000c). "Rain Too Little Too Late for Drought Ridden Throckmorton:
Hope Continues." Lubbock Avalanche Journal, November 23, 2000, p. A-29. Field, Doyce. Personal Communication, November 30, 2004. Director of Public Works,
Slaton, Texas.
212
Finkel, Steven E. and Muller, Edward N. (1998). "Rational Choice and the Dynamics of Collective Political Action: Evaluating Alternative Models with Panel Data." American Political Science Review, Volume 92, Number 1, March 1998, pp. 37 - 49.
Firey, Walter. (1960). Man, Mind and Land: A Theory of Resource Use. The Free Press
of Glencoe, Illinois. Fiske, Gary S. and Weiner, Ronnie Ann. (1994). A Guide To: Customer Incentives for
Water Conservation. California Urban Water Agencies with California Urban Water Conservation Council and United States Environmental Protection Agency. Barakat & Chamberlin, Inc.
Flack, J. Ernest. (1982). Urban Water Conservation: Increasing Efficiency-in-Use
Residential Water Demand. New York: American Society of Civil Engineers. Flynn, Sean J. (1999). "John L. McCarty and the Texas Panhandle." Ph.D. Dissertation,
Texas Tech University, 1999. Forsyth, Donelson; Garcia, Margot; Zyzniewski, Linda E.; Story, Paul A. and Kerr,
Natalie A. (2004). "Watershed Pollution and Preservation: The Awareness-Appraisal Model of Environmentally Positive Intentions and Behaviors." Analyses of Social Issues and Public Policy, Volume 4, No. 1, pp. 115-128.
Freudenburg, William R. (1991). "Rural-Urban Differences in Environmental Concern: A
Closer Look." Sociological Inquiry, Volume 61, Number 2, May 1991, pp. 167-198.
Fuquay, John. (2002a). "Four Towns Hope to Tap into Lake Alan Henry." Lubbock
Avalanche Journal, July 7, 2002, p A-1, A-16. Fuquay, John. (2002b). "Waves of Frustration Build As Lake Level Sinks Fast." Lubbock
Avalanche Journal Online. August 25, 2002. Internet: http://lubbockonline. com/cgi-bin/printit 2000.pl.
Fuquay, John. (2003a). "City, Counties Reach Pact on Water Sales." Lubbock Avalanche
Journal, March 13, 2003, p. D-1. Fuquay, John. (2003b). "Lubbock Water Supply Triggers Low-Level Alert." Lubbock
Avalanche Journal, October 8, 2003, p. A-1. Fuquay, John. (2003c). "Agency Reduces Water Allocation." Lubbock Avalanche
Journal, October 9, 2003, p. A-1, A-5.
213
Fuquay, John. (2003d). "Lubbock Takes Voluntary Step to Save Water." Lubbock Avalanche Journal, November 6, 2003, pp. A-1, A-9.
Fuquay, John. (2004a). "City Council Approves Measures to Curb Water Wasting."
Lubbock Avalanche Journal, February 9, 2004, p. B-11. Fuquay, John. (2004b). "Revised Ordinance Limiting Watering Times Goes Into Effect in
City Today." Lubbock Avalanche Journal, May 15, 2004, p. A-7. GDS Associates, Inc. (2002). "Quantifying The Effectiveness of Various Water
Conservation Techniques in Texas: Texas Water Development Board Study." Internet: http://www.twdb.state.tx.us/assistance/conservation.GDSReport.pdf.
Gelt, Joe. (1993). "Home Use of Graywater, Rainwater Conserves Water-and May Save
Money." Arroyo Newsletter, Summer 1993. Arizona Water Resource. Internet: http://ag.arizona.edu/AZWATER/arroyo/071rain.html. Gibson, Clark C. (2001). "Forest Resources: Institutions for Local Governance in
Guatemala." Chapter 3 in Protecting the Commons: A Framework for Resource Management in the Americas. Burger, Joanna; Ostrom, Elinor; Norgaard, Richard B.; Policansky, David and Goldstein, Bernard D, editors. Washington: Island Press
Green, Donald E. (1973). Land of the Underground Rain. Austin: University of Texas
Press. Hamilton, Lawrence C. (1985). "Self-Reported and Actual Savings in a Water
Conservation Campaign." Environment and Behavior, Volume 17, Number 3, May 1985, pp. 315-326.
Hardin, Garrett. (1968). "The Tragedy of the Commons." Science, Volume 162,
December 1968, pp. 1243-1248. High Plains Underground Water Conservation District No. 1. (n.d.). "The Ogallala
Aquifer." Internet: http://www.hpwd.com/agallala/ogallala.asp. Hinkle, Dennis E., Wiersma, William and Jurs, Stephen G. (2003). Applied Statistics for
the Behavioral Sciences, Fifth Edition. Boston: Houghton Mifflin Company. Houston & T.C. Ry. Co. v. East, 1904. 98 Tex 146, 81 S.W. 279. (Texas Supreme Court). Institute of Survey Research. (n.d.) Sampling Department. Internet: http://www. temple.edu/ISR/Sampling.htm.
214
Jones, Robert Emmet; Fly, J. Mark and Cordell, H. Ken. (1999). "How Green is My Valley? Tracking Rural and Urban Environmentalism in the Southern Appalachian Ecoregion." Rural Sociology, Volume 64, Number 3, pp. 482-499.
Kaiser, Ronald. (2004). "A Problem in Search of a Solution." Texas Bar Journal, March
2004, pp. 188-192. Lindlof, Thomas R. and Taylor, Bryan C. (2002). Qualitative Communication Research
Methods, Second Edition. London: Sage Publications. Llano Estacado Regional Water Planning Group (LERWPG). (2001). "Regional Water
Plan: Llano Estacado Regional Water Planning Area." January 2001. Internet: www.llanoplan.org.
Lubbock Power & Light. (2000.) "Conservation Tips." Lubbock: Lubbock Power &
Light. Internet: http://wwwlpandl.com/html/conservation8.html. Lubell, Mark. (2002). "Environmental Activism as Collective Action." Environment and
Behavior, Volume 34, Number 4, July 2002, pp. 431-454. Lubell, Mark. (2004). "Collaborative Watershed Management: A View from the
Grassroots." The Policy Studies Journal, Volume 32, Number 3, 2004. Malin, James C.(1967). The Grassland of North America: Prolegomena to Its History
with Addenda and Postscripts. Gloucester, Mass: P. Smith. McCain, Carmon. (2001). "Regional Ground Water Forum Discusses Water Marketing
Concerns." The Cross Section, Volume 47, Number 1, (January, 2001), p. 1, 4-5. McKinney, Larry. (2002). "Water for the Future." Texas Parks and Wildlife: The Outdoor
Magazine of Texas, July 2002. Meier, Kenneth J and Brudney, Jeffrey L. (1997). Applied Statistics for Public
Administration, Fourth Edition. New York: Harcourt Brace College Publishers. Merriam-Webster Online Dictionary. Inetnet:http://www.m-w.com/cgi-bin /dictionary
?book=Dictionary&va…. Miller, Jared. (2004). Personal Communication, November 16, 2004. City Manager- City
of Crosbyton, Texas. Miller, Tim R. (1989). "The Pending Water Crisis." Chapter 3 in Water and the Future of
the Southwest, Zachary A. Smith, Editor. Albuquerque: University of New Mexico Press.
215
Moore, Susan; Murphy, Margot and Watson, Ray. (1994). "A Longitudinal Study of Domestic Water Conservation Behavior." Population and Environment, Volume 16, Number 2, November 1994, pp. 175-189.
Morris, John Miller. (1997). El Llano Estacado: Exploration and Imagination on the High
Plains of Texas and New Mexico, 1536-1860. Austin: Texas State Historical Association.
Muldavin, Scott. (1981). Residential Water Use Survey. Oakland, CA: East Bay
Municipal Utility District. January 1981. National Climatic Data Center. (2005). Palmer Hydrological Drought Index. Internet: http://www.ncdc.noaa.gov/img/climate/research/2005/jan/phd200501_pg.gif. Accessed May 11, 2005. National Weather Service. (n.d.(a)). Lubbock, Texas. "Hydrologic Summary." Internet:
http://iwin.nws.noaa. gov/iwin/tx/hydro.html. National Weather Service. (n.d.(b)). Lubbock, Texas. Advanced Hydrologic Prediction
Service. Internet: http://www.srh.noaa.gov/cgi-bin/ahps.cgi?lub&cwrt2.
National Weather Service Forecast Office. (2004). Lubbock, Texas. "Lubbock Precipitation from 1911 to Present." Internet:http://www.srh.noaa.gov/ lub/climate/LBB_Climate/Precipdata/Precipdata.htm.
NOAA. (2005a). "NOAA Announces Spring Outlook." NOAA Magazine. Internet: http://www.noaanews.noaa.gov/stories2005/s2406.htm. NOAA. (2005b). "NOAA Announces 2005-2006 U.S. Winter Outlook" NOAA Magazine. Internet: http://www.noaanews.noaa.gov/stories2005/s2520.htm. Noah, Marilyn. (2002). "Graywater use still a gray area." Journal of Environmental
Health, Volume 64, Number 10, June 2002, pp. 22-25. Oakerson, Ronald. J.(1992). "Analyzing the Commons: A Framework." In Making the
Commons Work: Theory, Practice, and Policy, Daniel W. Bromley, General Editor. San Francisco: CS Press.
Olson, Mancur. (1971). The Logic of Collective Action: Public Goods and the Theory of
Groups. Cambridge: Harvard University Press. Opie, John. (1993). Ogallala: Water for a Dry Land. Lincoln: University of Nebraska
Press.
216
Oskamp, Stuart; Harrington, Maura J.; Edwards, Todd C.; Sherwood, Deborah L.; Okuda, Shawn M.; and Swanson, Deborah C. (1991). "Factors Influencing Household Recycling Behavior." Environment and Behavior, Volume 23, Number 4, July 1991, pp. 494-519.
Ostrom, Elinor. (1990). Governing the Commons: The Evolution of Institutions for
Collective Action. Cambridge, UK: Cambridge University Press. Ostrom, Elinor. (2003). "How types of goods and property rights jointly affect collective
action." Journal of Theoretical Politics, Volume 15, Number 3, July 2003, pp. 239- 270.
Ostrom, Elinor; Burger, Joanna; Field, Christopher B.; Norgaard, Richard; and
Policansky, David. (1999). "Revisiting the Commons: Local Lessons, Global Challenges." Science, Volume 284, Number 5412, April 9, 1999, pp. 278-282.
Pernell, Chad. Personal Communication, November 22, 2004. Deputy General Manager,
Canadian River Municipal Water Authority, Sanford, Texas. Pretty, Jules and Smith, David. (2004). "Social Capital in Biodiversity Conservation and
Management." Conservation Biology, Volume 18, Number 3, June 2004, pp. 631-638.
Pretty, Jules and Ward, Hugh. (2001). "Social Capital and the Environment." World
Development Volume 29, Number 2, pp. 209-227. Pumphrey, Lorena. Personal Communication, April 14, 2004. Lubbock, Texas. Pumphrey, R. Gary. (2002). "The Sale of Groundwater Rights in the Northern Panhandle
of Texas." Forum of the Association For Arid Lands Studies, Volume 18, pp. 67-74.
Pumphrey, R. Gary and Gerber, Brian J. (2005). Public Attitudes Toward Municipal
Water Conservation on the Southern High Plains and the Rolling Plains: A Report Prepared for the High Plains Underground Water Conservation District, No. 1, Lubbock, Texas, unpublished manuscript.
Putnam, Robert D with Leonardi, Robert and Nanetti, Raffaella Y. (1993). Making
Democracy Work. Princeton, New Jersey: Princeton University Press. Rogers, Mickey. (2004). Personal Communication, December 6, 2004. General Manager,
White River Municipal Water District, Spur, Texas.
217
Rogers, Mickey. (2006). Personal Communication, January 30, 2006. General Manager, White River Municipal Water District, Spur, Texas.
Ronis, , D.L.; Yates, J.F. and Kirscht, J.P. (1989). "Attitudes, Decisions and Habits as
Determinants of Repeated Behavior." In A.R. Pratkanis, S.J. Breckler and A.G. Greenwals (Eds.). Attitude Structure and Function, pp. 213-239. Hillsdale, NJ: Lawrence Erlbaum Associates.
Rose, Bob. (2004). "Think 2003 was a wet year? Not if you lived in Austin." Lower
Colorado River Authority. Internet:http://www.lcra.org.featurestory/2003_preip. html.
Ryder, Paul D. (1996). "Ground Water Atlas of the United States: Oklahoma, Texas."
United States Geological Survey Publication # HA730-E. Internet: http://capp.water.usgs.gov/gwa/ch_e/E-text5.html.
Saarinen, Thomas Fredrick.(1966). Perception of the Drought Hazard on the Great Plains.
Department of Geography, Research Paper No. 106. Chicago: The University of Chicago.
San Antonio Water System. (n.d.). "Aquifer Management Plan." Internet:
http://www.sawa.org/ conservation/aquifermgmt/stage1.shtml. Sandler, Todd. (1992). Collective Action: Theory and Applications. Ann Arbor: The
University of Michigan Press. Schlager, Edella and Blomquist, William. (2001). "Water Resources: The Southwestern
United States." Chapter 6 in Protecting the Commons: A Framework for Resource Management in the Americas, Burger, Joanna; Ostrom, Elonir; Norgaard, Richard B.; Policansky, David and Goldstein, Bernard D., editors. Washington: Island Press.
Selby, Diane. Personal Communication, March 4, 2004. City of Lubbock, Texas. Short, Mary Jane. (2003). "Senate Oks Bill Opening Way for Lake Alan Henry Water
District." Lubbock Avalanche Journal, May 8, 2003, p. A4. Singh, Katar. (1994). Managing Common Pool Resources: Principles and Case Studies.
Delhi: Oxford University Press. Sipraino et al. v. Great Spring Waters of America, Inc., 1999. 1 SW 3d 75, 1999 TexSup.
J. 629 (Texas Supreme Court).
218
Snodgrass, Robert Warren and Hill, Duane W. (1977). Achieving Urban Water Conservation. Fort Collins: Colorado Water Resources Research Institute, Environmental Resources Center, Colorado State University.
St. Johns River Water Management District. (n.d.). "Water Resources Education
Glossary." Internet: http:sjr.state.fl.us/programs/outreach/education/ glossary.html.
Steelman, Toddi. A and Ascher, William. (1997). "Public Involvement Methods in
Natural Resource Policy Making: Advantages, disadvantages and Trade-offs." Policy Sciences, Volume 30, pp. 71-90.
Steins, Nathalie A. and Edwards, Victoria M. (1999). "Platforms for Collective Action in
Multiple-Use Common-Pool Resources." Agriculture and Human Values, Volume 16, pp. 241-255.
Syme, Geoffrey J.; Nancarrow, Blair E. and Seligman, Clive. (2000). "The Evaluation of
Information Campaigns to Promote Voluntary Household Water Conservation." Evaluation Review, Volume 24, Number 6. December 2000, pp. 539-578.
Talarowski, Francis Stanley. (1982). "Attitudes Toward and Perceptions of Water
Conservation In a Southern California Community." Ph.D. Dissertation, University of California, Santa Barbara, June 1982.
Templer, Otis. (2002). "Lubbock's Lake Alan Henry: Thirty Years and Counting." Paper
presented on the program of the Association For Arid Lands Studies, Albuquerque, New Mexico, April 11, 2002.
Templer, Otis & Pumphrey, Gary. (2001). "Groundwater Transfers on the Semiarid
Texas High Plains." Forum of the Association for Arid Lands Studies, Volume 17, pp.1-8.
Templer, Otis & Urban, Lloyd V. (1994). "Lake Alan Henry: Lubbocks’ Twenty-First
Century Water Supply." Paper presented on the program of the Association For Arid Lands Studies, Albuquerque, NM, April 12, 2002.
Templer, Otis & Urban, Lloyd V. (1995). "The Canadian River Project: A Quarter
Century of Interbasin Transfer." Water Management in Urban Areas, American Water Resources Association, Houston, TX, November 5-10, 1995.
Templer, Otis & Urban, Lloyd V. (1997). "Conjunctive Use of Water on the Texas High
Plains." Water Resources Update, Journal of the Universities Council on Water Resources, Number 106, Winter 1997, pp. 102-108.
219
Texas Almanac: 2004-2005. (2004). The Dallas Morning News. Texas Almanac: 2006-2007. (2006). The Dallas Morning News. Texas Municipal League. (2004). "2004 Water and Wastewater Survey Results." Texas
Town & City, May 2004, pp. 21-47. Texas Parks and Wildlife Department (TPWD). (2005).Texas Freshwater Fishing: White
River Lake. Internet: http://waterdata.usgs.gov/tx/nwis/current?type=lake. Texas Statutes Online: Water Code: Chapter 11- Water Rights, Subchapter C- Unlawful
Use, Diversion, Waste, etc. Internet: http://www.capitol.state.ts.us/ststutes/ watoc.html.
Texas Water Development Board. (1997). Texas Guide To Rainwater Harvesting. In
Cooperation with the Center for Maximum Potential Building Systems. Second Edition. Austin, Texas.
Texas Water Development Board. (2002). Water for Texas- 2002. Document No. GP-7-1.
January 2002. Austin, Texas. Texas Water Development Board. (2004a). "Texas Drought Conditions Summary for
January 6, 2004." Internet:http://twdb.state.tx.us/publications/reports/water conditions/drought_summary/droughtarchive/2004/Drought%2001-06-04.asp.
Texas Water Development Board. (2004b). "Texas Drought Conditions Summary for
May 6, 2004." Internet: twdb.state.tx.us/publications/reports/waterconditions/ drought_summary/droughtarchive/2004/Drought%2005-06-04.asp.
Texas Water Development Board. (2005). "Texas Drought Conditions Summary for
January 5, 2005." Internet: twdb.state.tx.us/publications/reports/waterconditions/ drought_summary/droughtarchive/2005/Drought%2001-05-05.asp.
"The Handbook of Texas Online." Internet: http://www.tsha.utexas.edu/handbook/online /articles/print/LL/ry12.html>. The Tankless Water Heater Company. (n.d.). Internet: http:www.gotankless.com/
tech_benefit.html. Todd, David. (1992). “Common Resources, Private Rights and Liabilities: A Case Study
on Texas Groundwater Law.” Natural Resources Journal, Volume 32, Number 2, Spring 1992, pp. 233-263.
220
Trauth, Kathleen Marie. (1989). "Public Perceptions/Opinions of Municipal Water Conservation Plans." Ph.D. Dissertation, Texas Tech University, May 1989.
Tremblay, Kenneth R. and Dunlap, Riley E. (1978). "Rural-Urban Residence and
Concern with Environmental Quality: A Replication and Extension." Rural Sociology, Volume 40 Number 3, pp. 474-491.
U.S. Census Bureau, a. Census 2000 Summary File 3 (SF3). Custom Table H108001,
Lubbock, TX MSA- Occupied Housing Units: Imputation of Telephone Service available. Internet: http://factfinder.census.gov/servlet/CTTable?_bm_=y&-filter
=DEC_2000_SF3_U_H108.H.... U.S. Census Bureau, b. "Census 2000 Table PHC-T-2. Ranking Table for States: 1990
and 2000." Internet: www.census/population/cen2000/phc-t2/tab03.xls. U.S. Census Bureau, c. Table DP-4. Profile of Selected Housing Characteristics: 2000.
Lubbock, TX MSA. Internet: http://factfinder.census.gov/servlet/QTTable?_bm= Y&-content-qt&qr_name=DEC_2000.... U.S. Census Bureau, d. Glossary. Internet: http://www.census.gov/geo/www/tiger/
glosssary.html#glossary. U. S. Census Bureau, e. Table P1." Total Population, Census 2000 Summary File (SF1)
100 Percent Data." Internet: http:factfinder.census.gov/servlet/DTTable?.... U. S. Census Bureau, f. Table P2: Urban and Rural Census 2000 Summary File 1 (SF1)
100-Percent Data. Internet: http://factfinder.census.gov/home/en/datanotes/ expsf1u.htm.
U. S. Census Bureau, g. Urbanized Area and Urban Cluster Central Place, Census 2000. Internet: http://www.census.gov/geo/www/ua/uapltab.pdf. "U.S. Drought Affects Regions From Florida to Montana." (2000). CNN, June 14, 2000. Internet: http://edition.cnn.com/2000/WEATHER/06/14/drought. Van Vugt, Mark and Samuelson, Charles D. (1999). "The Impact of Personal Metering in
the Management of a Natural Resource Crisis: A Social Dilemma Analysis." Personality and Social Psychology Bulletin, Volume 25, Number 6, June 1999, pp. 731-745.
Vickers, Amy. (2001). Handbook of Water Use and Conservation. Amherst, Mass:
Waterplow Press.
221
Wang, Young Doo; Song, Jae-Shuck; Byrne, John and Yun, Sun-Jin. (1999). "Evaluating the Persistence of Residential Water Conservation: A 1992-1997 Panel Study of a Water Utility Program in Delaware." Journal of the American Water Resources Association, Volume 35, Number 5, October 1999, pp. 1269-1276.
Waskom, R. and Neibauer, M. 2002. "Glossary of Water Terminology." Colorado State
University Cooperative Extension. Internet: www.ext.colostate.edu/pubs/crops /0417.html. Water Utilities Department.(2000.) "Are You Watering Your Money Away?" Lubbock:
City of Lubbock. Internet: http://www.water.ci.Lubbock.tx.us/faq.html. "Water Rationing on Rise in State." (2000). Lubbock Avalanche Journal, June 27, 2000,
p. A-3. AP Wire Service. Webb, Walter Prescott. (1931). The Great Plains. Boston: Ginn and Company. Western Resource Advocates. (2003). "Smart Water: A Comparative Study of Urban
Water Use Efficiency Across the Southwest." Boulder, Colorado: Western Resource Advocates.
"Western Water Shortage Brings Surplus of Politics". (2004). Source: Bulletin of the
American Meteorological Society, 85, no 7, pp. 939-940, July 2004. Internet:http: newfirstsearch.oclc.org/images/WSPL/wsppdf1/HTML/04105/L55JV/RS7.htm.
Whipple, William Jr. (1994). New Perspectives in Water Supply. Boca Raton: Lewis
Publishers, Inc. Wikipedia. (n.d.). "Pearson's Chi-square test". Internet: http://en.wikipedia.org/wiki/
Pearson's_chi-square_test. Williams, John C. and Satterwhite, Kent K. (1998). "Conjunctive Use of Surface and
Groundwater Supplies." Paper at the 25th Water for Texas Conference, December 1-2, 1998, Austin, TX, 5p. Internet: http://twri.tamu.edu/twriconf/w4tx98/papers/
Williams.html.
222
APPENDIX A Consumer Water Conservation Questionnaire
223
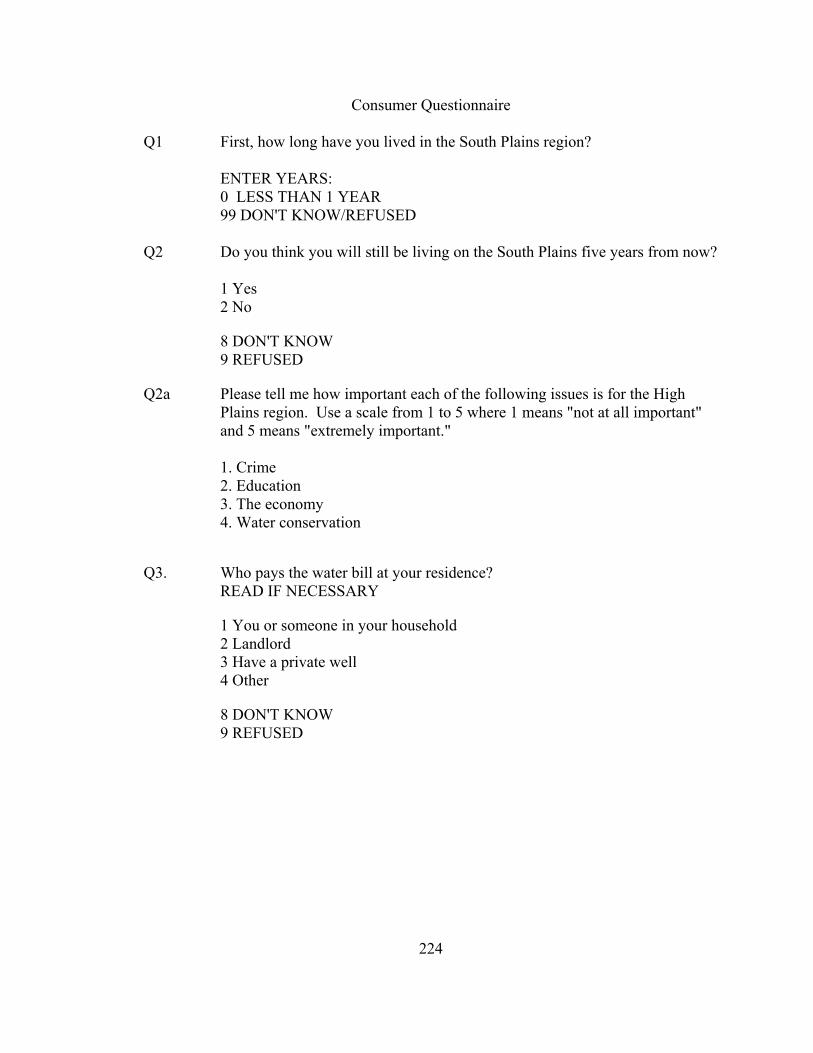
Consumer Questionnaire Q1 First, how long have you lived in the South Plains region?
ENTER YEARS: 0 LESS THAN 1 YEAR 99 DON'T KNOW/REFUSED Q2 Do you think you will still be living on the South Plains five years from now? 1 Yes 2 No
8 DON'T KNOW 9 REFUSED
Q2a Please tell me how important each of the following issues is for the High Plains region. Use a scale from 1 to 5 where 1 means "not at all important" and 5 means "extremely important." 1. Crime 2. Education 3. The economy 4. Water conservation
Q3. Who pays the water bill at your residence? READ IF NECESSARY
1 You or someone in your household 2 Landlord 3 Have a private well 4 Other
8 DON'T KNOW 9 REFUSED
224
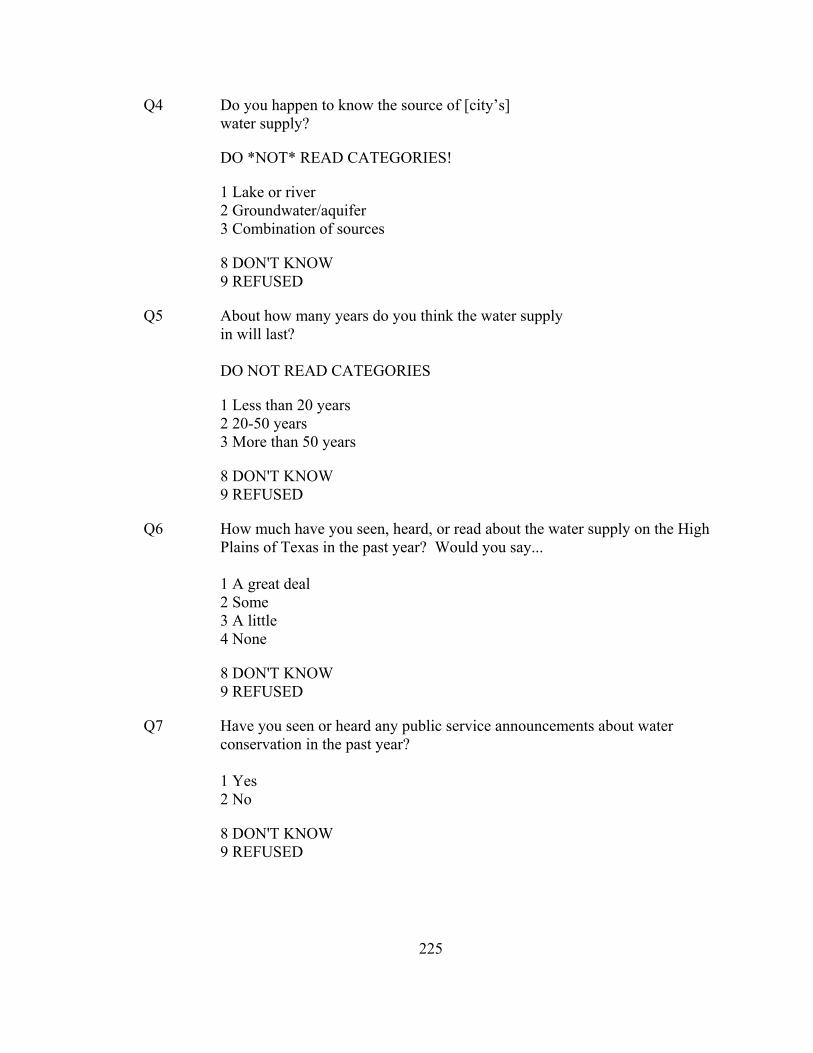
Q4 Do you happen to know the source of [city’s] water supply?
DO *NOT* READ CATEGORIES!
1 Lake or river 2 Groundwater/aquifer 3 Combination of sources
8 DON'T KNOW 9 REFUSED
Q5 About how many years do you think the water supply in will last? DO NOT READ CATEGORIES
1 Less than 20 years 2 20-50 years 3 More than 50 years
8 DON'T KNOW 9 REFUSED
Q6 How much have you seen, heard, or read about the water supply on the High Plains of Texas in the past year? Would you say... 1 A great deal 2 Some 3 A little 4 None
8 DON'T KNOW 9 REFUSED
Q7 Have you seen or heard any public service announcements about water conservation in the past year? 1 Yes 2 No
8 DON'T KNOW 9 REFUSED
225
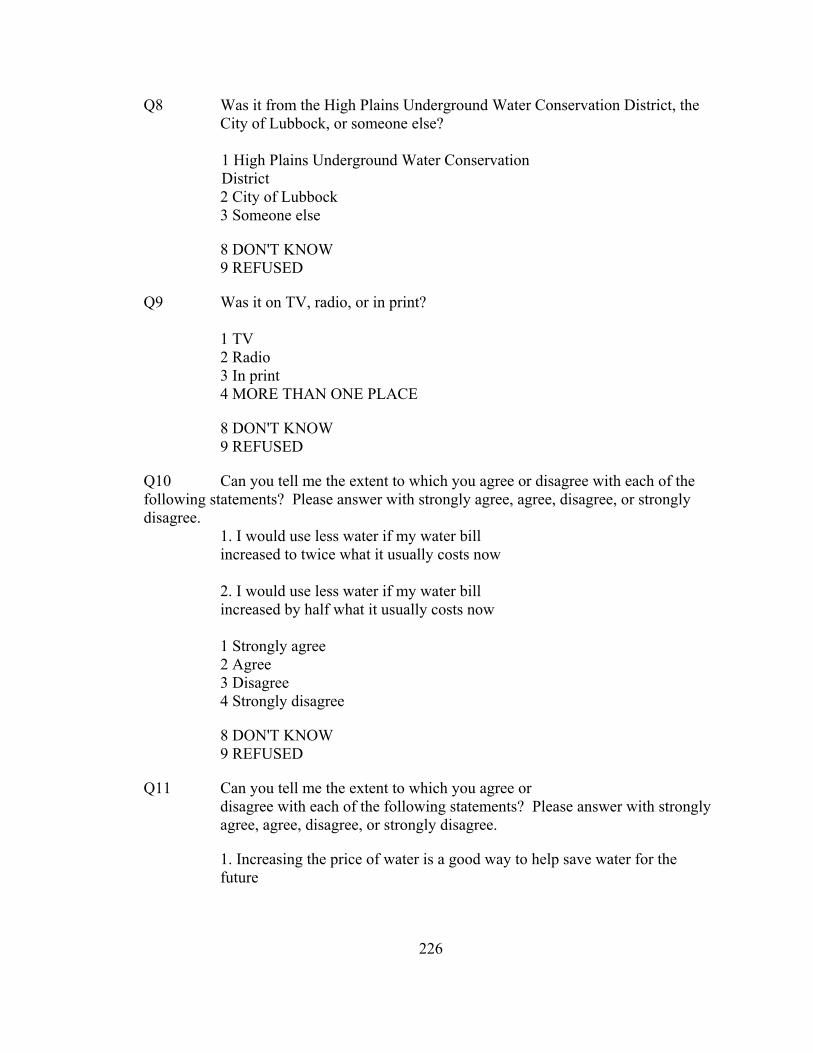
Q8 Was it from the High Plains Underground Water Conservation District, the City of Lubbock, or someone else?
1 High Plains Underground Water Conservation District
2 City of Lubbock 3 Someone else
8 DON'T KNOW 9 REFUSED
Q9 Was it on TV, radio, or in print? 1 TV 2 Radio 3 In print 4 MORE THAN ONE PLACE
8 DON'T KNOW 9 REFUSED
Q10 Can you tell me the extent to which you agree or disagree with each of the following statements? Please answer with strongly agree, agree, disagree, or strongly disagree.
1. I would use less water if my water bill increased to twice what it usually costs now 2. I would use less water if my water bill increased by half what it usually costs now
1 Strongly agree 2 Agree 3 Disagree 4 Strongly disagree
8 DON'T KNOW 9 REFUSED
Q11 Can you tell me the extent to which you agree or disagree with each of the following statements? Please answer with strongly agree, agree, disagree, or strongly disagree.
1. Increasing the price of water is a good way to help save water for the future
226
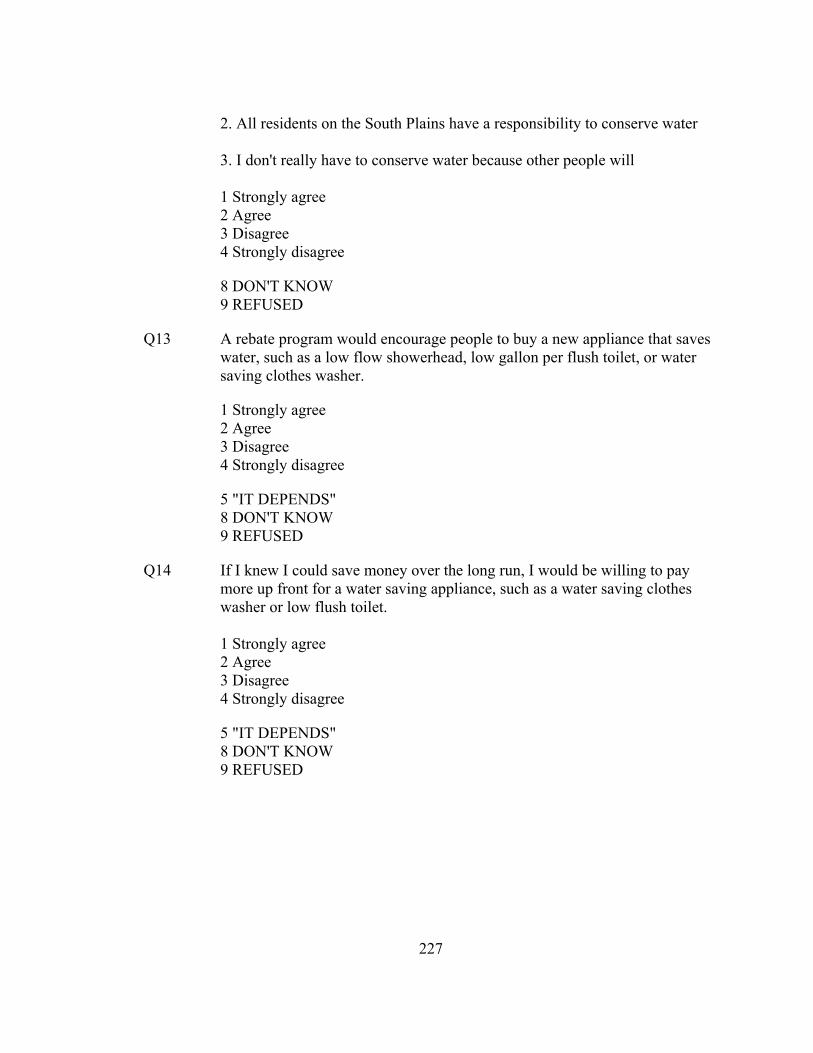
2. All residents on the South Plains have a responsibility to conserve water 3. I don't really have to conserve water because other people will
1 Strongly agree 2 Agree 3 Disagree 4 Strongly disagree
8 DON'T KNOW 9 REFUSED
Q13 A rebate program would encourage people to buy a new appliance that saves water, such as a low flow showerhead, low gallon per flush toilet, or water saving clothes washer.
1 Strongly agree 2 Agree 3 Disagree 4 Strongly disagree
5 "IT DEPENDS" 8 DON'T KNOW 9 REFUSED
Q14 If I knew I could save money over the long run, I would be willing to pay more up front for a water saving appliance, such as a water saving clothes washer or low flush toilet. 1 Strongly agree 2 Agree 3 Disagree 4 Strongly disagree
5 "IT DEPENDS" 8 DON'T KNOW 9 REFUSED
227
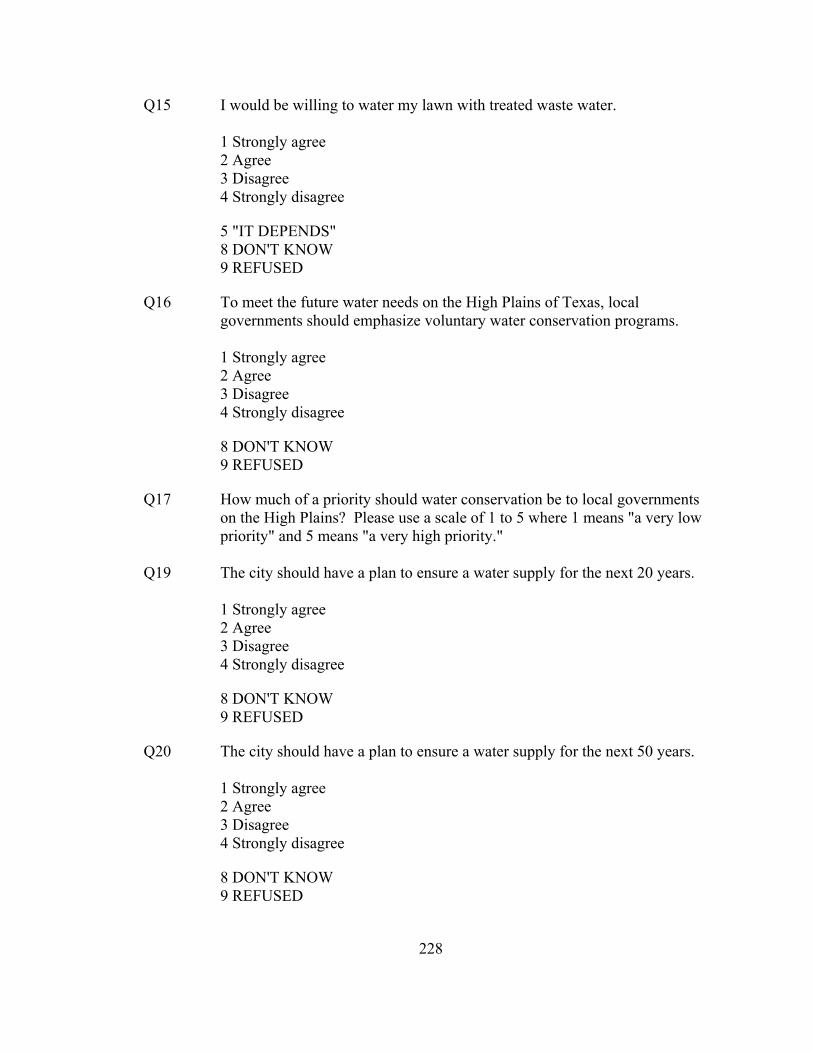
Q15 I would be willing to water my lawn with treated waste water. 1 Strongly agree 2 Agree 3 Disagree 4 Strongly disagree
5 "IT DEPENDS" 8 DON'T KNOW 9 REFUSED
Q16 To meet the future water needs on the High Plains of Texas, local governments should emphasize voluntary water conservation programs. 1 Strongly agree 2 Agree 3 Disagree 4 Strongly disagree
8 DON'T KNOW 9 REFUSED
Q17 How much of a priority should water conservation be to local governments on the High Plains? Please use a scale of 1 to 5 where 1 means "a very low priority" and 5 means "a very high priority." Q19 The city should have a plan to ensure a water supply for the next 20 years. 1 Strongly agree 2 Agree 3 Disagree 4 Strongly disagree
8 DON'T KNOW 9 REFUSED
Q20 The city should have a plan to ensure a water supply for the next 50 years. 1 Strongly agree 2 Agree 3 Disagree 4 Strongly disagree
8 DON'T KNOW 9 REFUSED
228
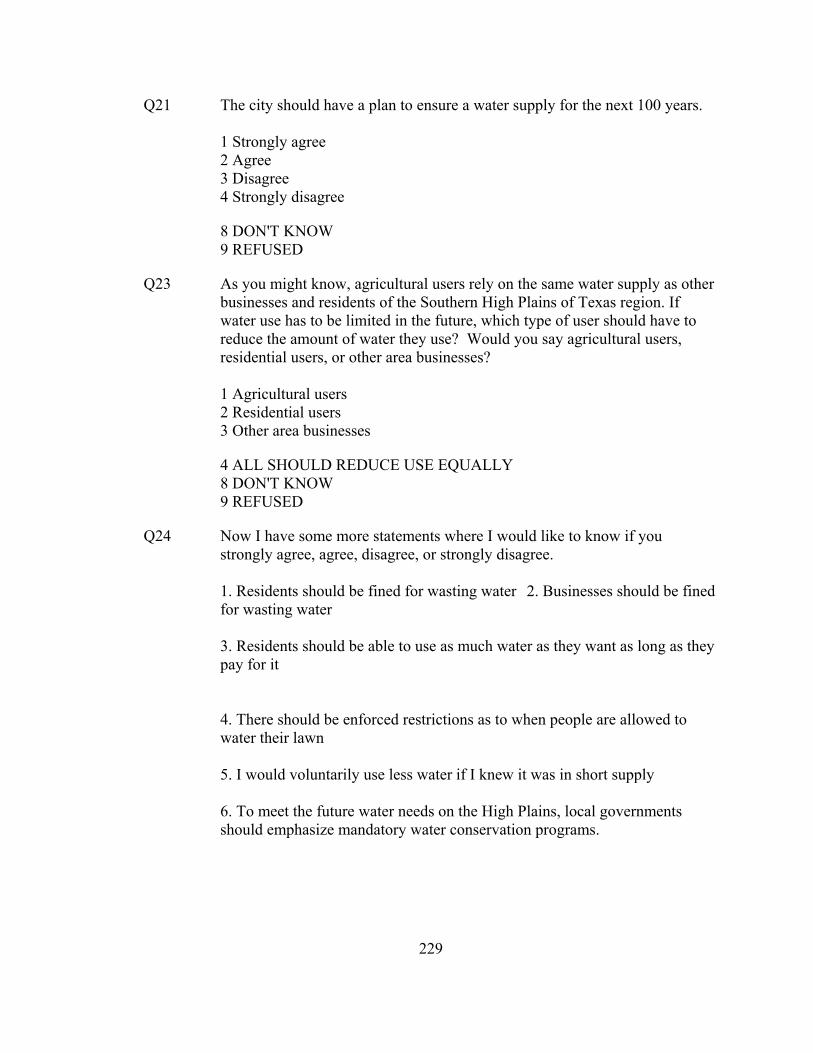
Q21 The city should have a plan to ensure a water supply for the next 100 years. 1 Strongly agree 2 Agree 3 Disagree 4 Strongly disagree
8 DON'T KNOW 9 REFUSED
Q23 As you might know, agricultural users rely on the same water supply as other businesses and residents of the Southern High Plains of Texas region. If water use has to be limited in the future, which type of user should have to reduce the amount of water they use? Would you say agricultural users, residential users, or other area businesses?
1 Agricultural users 2 Residential users 3 Other area businesses
4 ALL SHOULD REDUCE USE EQUALLY 8 DON'T KNOW 9 REFUSED
Q24 Now I have some more statements where I would like to know if you strongly agree, agree, disagree, or strongly disagree.
1. Residents should be fined for wasting water 2. Businesses should be fined for wasting water
3. Residents should be able to use as much water as they want as long as they pay for it
4. There should be enforced restrictions as to when people are allowed to water their lawn
5. I would voluntarily use less water if I knew it was in short supply
6. To meet the future water needs on the High Plains, local governments should emphasize mandatory water conservation programs.
229
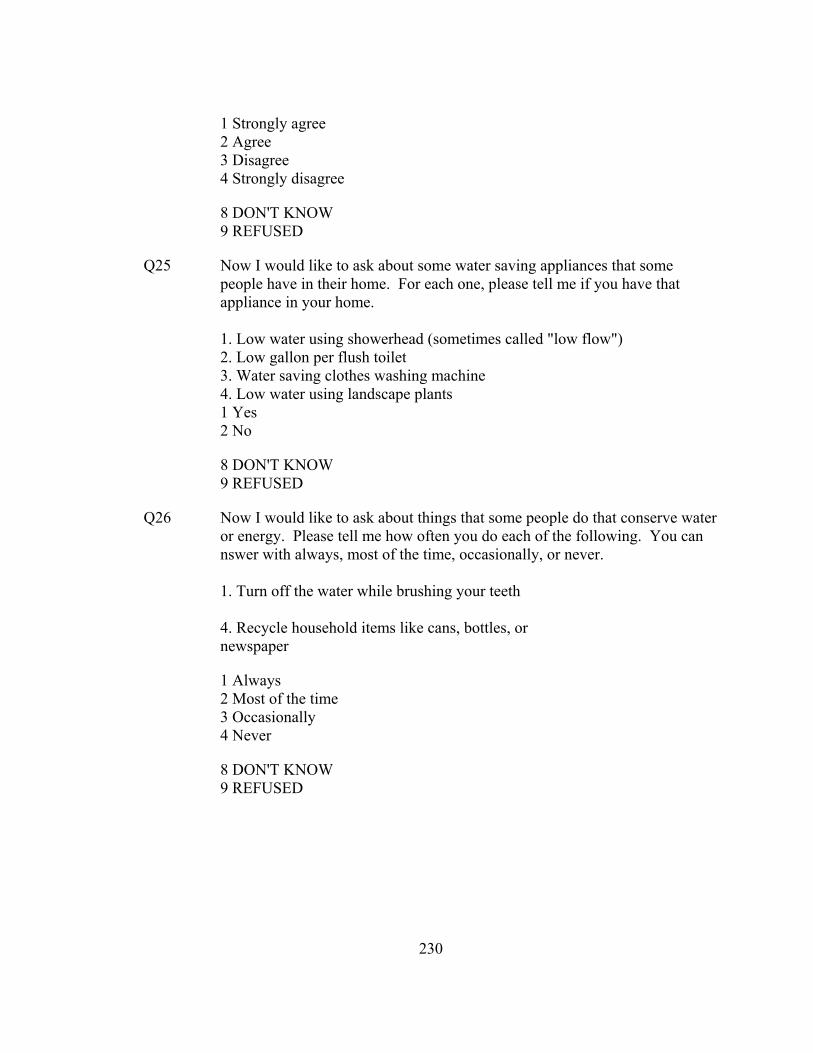
1 Strongly agree 2 Agree 3 Disagree 4 Strongly disagree
8 DON'T KNOW 9 REFUSED
Q25 Now I would like to ask about some water saving appliances that some people have in their home. For each one, please tell me if you have that appliance in your home. 1. Low water using showerhead (sometimes called "low flow") 2. Low gallon per flush toilet 3. Water saving clothes washing machine 4. Low water using landscape plants 1 Yes 2 No
8 DON'T KNOW 9 REFUSED
Q26 Now I would like to ask about things that some people do that conserve water or energy. Please tell me how often you do each of the following. You can nswer with always, most of the time, occasionally, or never. 1. Turn off the water while brushing your teeth
4. Recycle household items like cans, bottles, or newspaper
1 Always 2 Most of the time 3 Occasionally 4 Never
8 DON'T KNOW 9 REFUSED
230
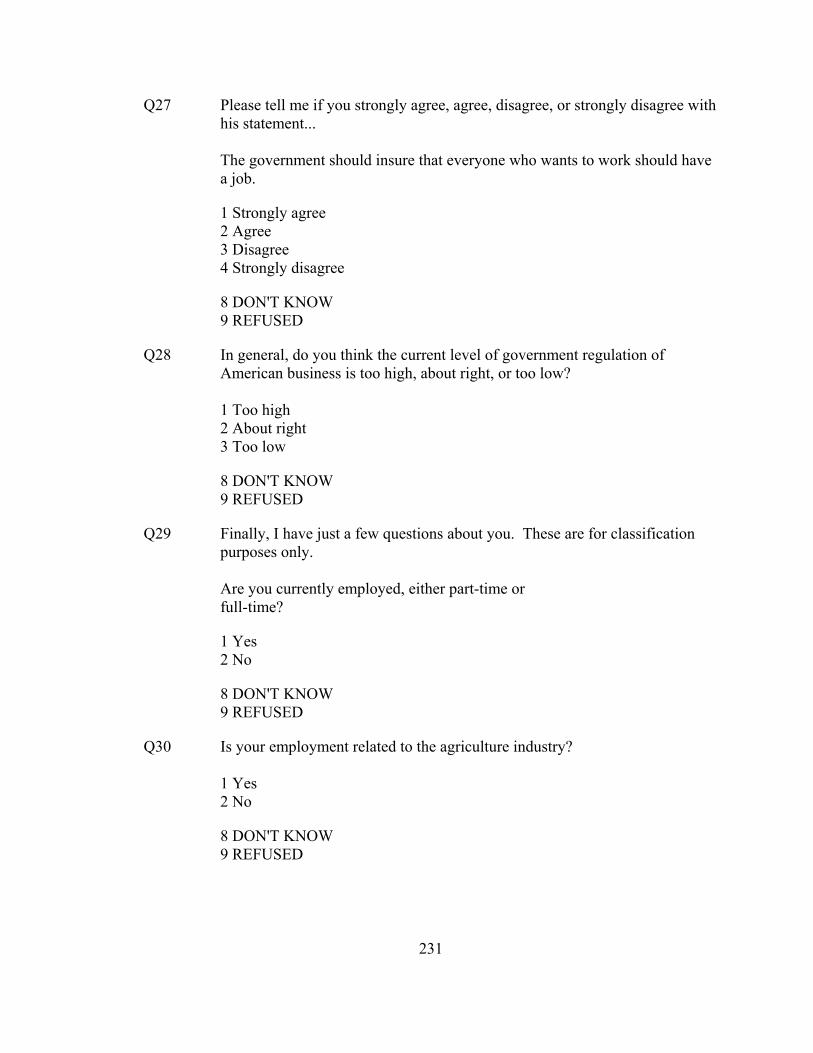
Q27 Please tell me if you strongly agree, agree, disagree, or strongly disagree with his statement...
The government should insure that everyone who wants to work should have a job.
1 Strongly agree 2 Agree 3 Disagree 4 Strongly disagree
8 DON'T KNOW 9 REFUSED
Q28 In general, do you think the current level of government regulation of American business is too high, about right, or too low? 1 Too high 2 About right 3 Too low
8 DON'T KNOW 9 REFUSED
Q29 Finally, I have just a few questions about you. These are for classification purposes only.
Are you currently employed, either part-time or full-time?
1 Yes 2 No
8 DON'T KNOW 9 REFUSED
Q30 Is your employment related to the agriculture industry? 1 Yes 2 No
8 DON'T KNOW 9 REFUSED
231
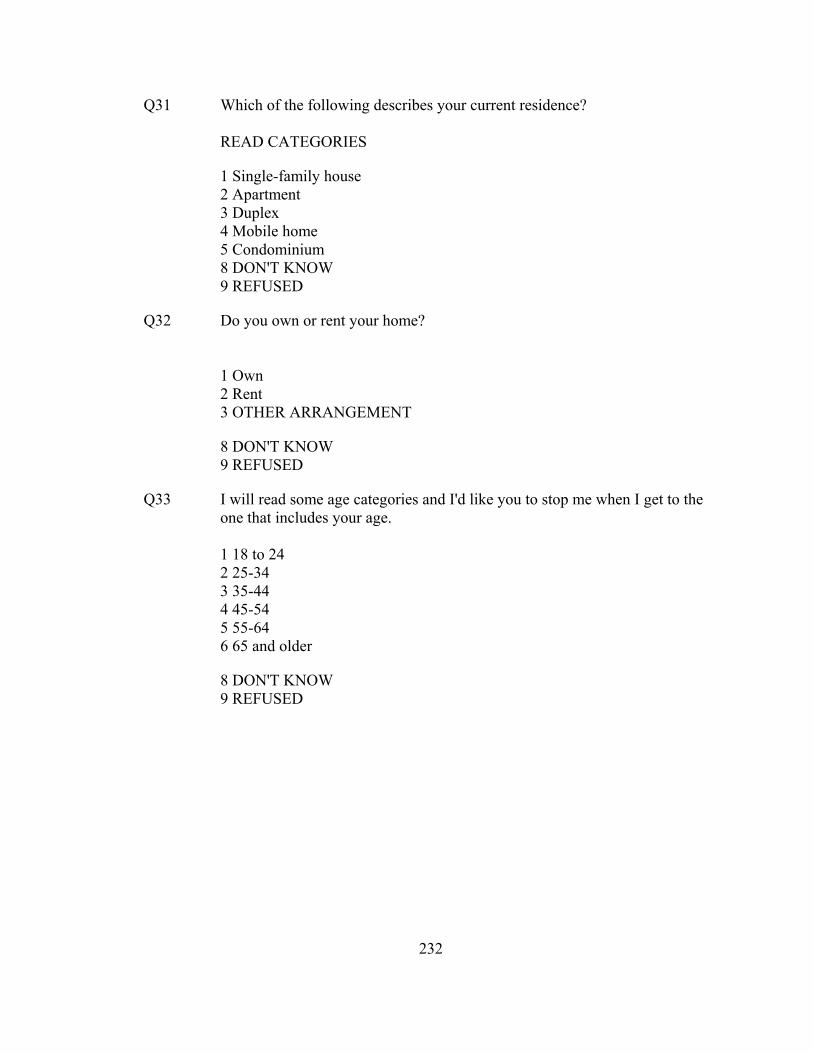
Q31 Which of the following describes your current residence? READ CATEGORIES
1 Single-family house 2 Apartment 3 Duplex 4 Mobile home 5 Condominium 8 DON'T KNOW 9 REFUSED
Q32 Do you own or rent your home? 1 Own 2 Rent 3 OTHER ARRANGEMENT
8 DON'T KNOW 9 REFUSED
Q33 I will read some age categories and I'd like you to stop me when I get to the one that includes your age. 1 18 to 24 2 25-34 3 35-44 4 45-54 5 55-64 6 65 and older
8 DON'T KNOW 9 REFUSED
232
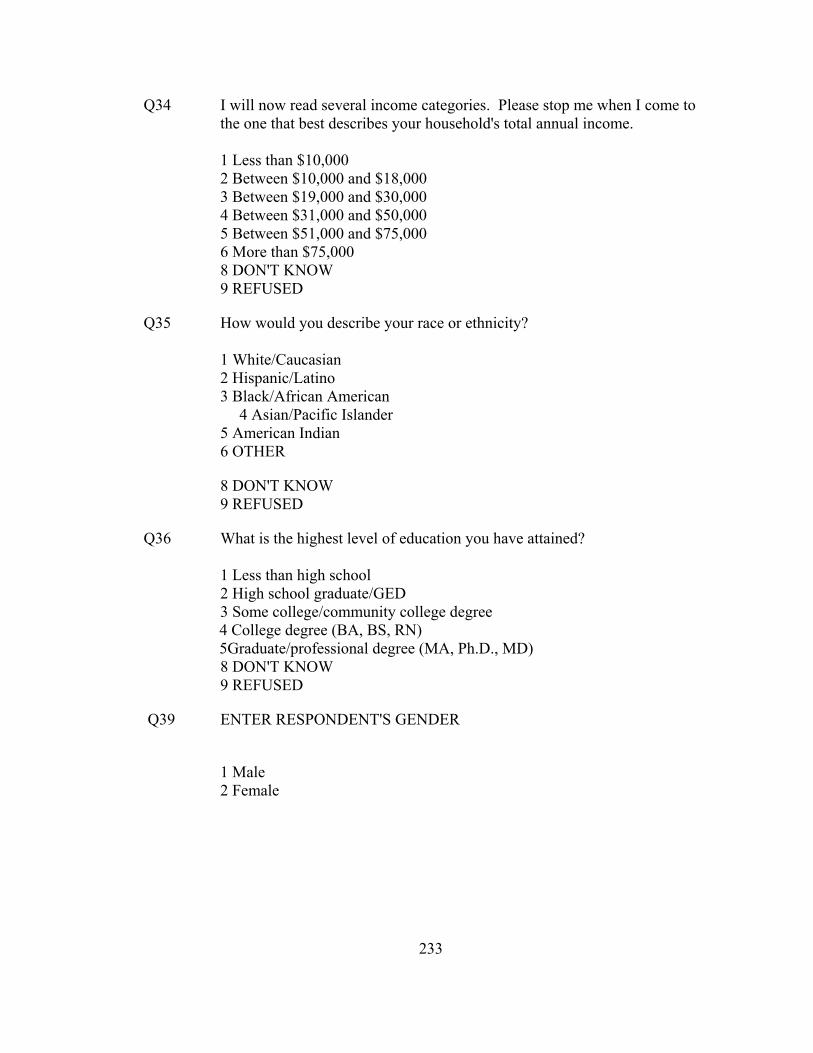
Q34 I will now read several income categories. Please stop me when I come to the one that best describes your household's total annual income. 1 Less than $10,000 2 Between $10,000 and $18,000 3 Between $19,000 and $30,000 4 Between $31,000 and $50,000 5 Between $51,000 and $75,000 6 More than $75,000 8 DON'T KNOW 9 REFUSED
Q35 How would you describe your race or ethnicity? 1 White/Caucasian 2 Hispanic/Latino 3 Black/African American 4 Asian/Pacific Islander 5 American Indian 6 OTHER
8 DON'T KNOW 9 REFUSED
Q36 What is the highest level of education you have attained? 1 Less than high school 2 High school graduate/GED 3 Some college/community college degree
4 College degree (BA, BS, RN) 5Graduate/professional degree (MA, Ph.D., MD)
8 DON'T KNOW 9 REFUSED
Q39 ENTER RESPONDENT'S GENDER
1 Male 2 Female
233

APPENDIX B-1 Municipal Water Provider Questionnaire
234
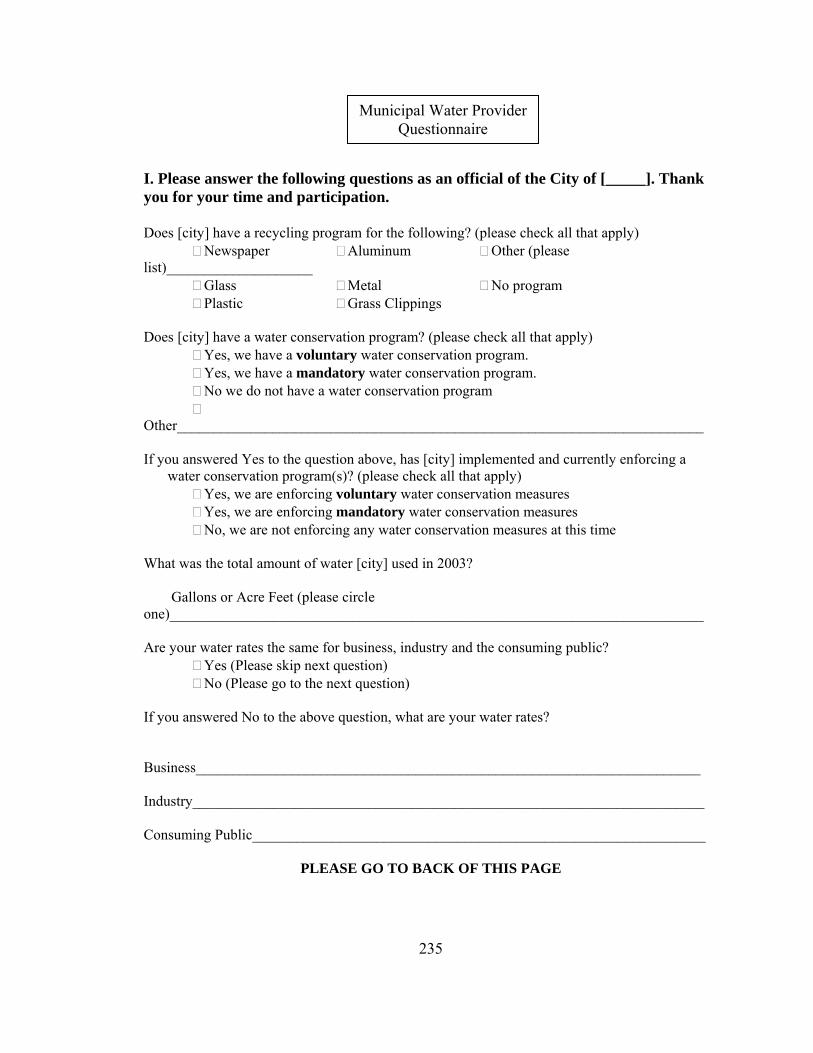
Municipal Water Provider Questionnaire
I. Please answer the following questions as an official of the City of [_____]. Thank you for your time and participation. Does [city] have a recycling program for the following? (please check all that apply) Newspaper Aluminum Other (please list)____________________ Glass Metal No program Plastic Grass Clippings Does [city] have a water conservation program? (please check all that apply) Yes, we have a voluntary water conservation program. Yes, we have a mandatory water conservation program. No we do not have a water conservation program Other________________________________________________________________________ If you answered Yes to the question above, has [city] implemented and currently enforcing a
water conservation program(s)? (please check all that apply) Yes, we are enforcing voluntary water conservation measures Yes, we are enforcing mandatory water conservation measures No, we are not enforcing any water conservation measures at this time What was the total amount of water [city] used in 2003?
Gallons or Acre Feet (please circle one)_________________________________________________________________________ Are your water rates the same for business, industry and the consuming public? Yes (Please skip next question) No (Please go to the next question) If you answered No to the above question, what are your water rates? Business_____________________________________________________________________ Industry______________________________________________________________________ Consuming Public______________________________________________________________
PLEASE GO TO BACK OF THIS PAGE
235
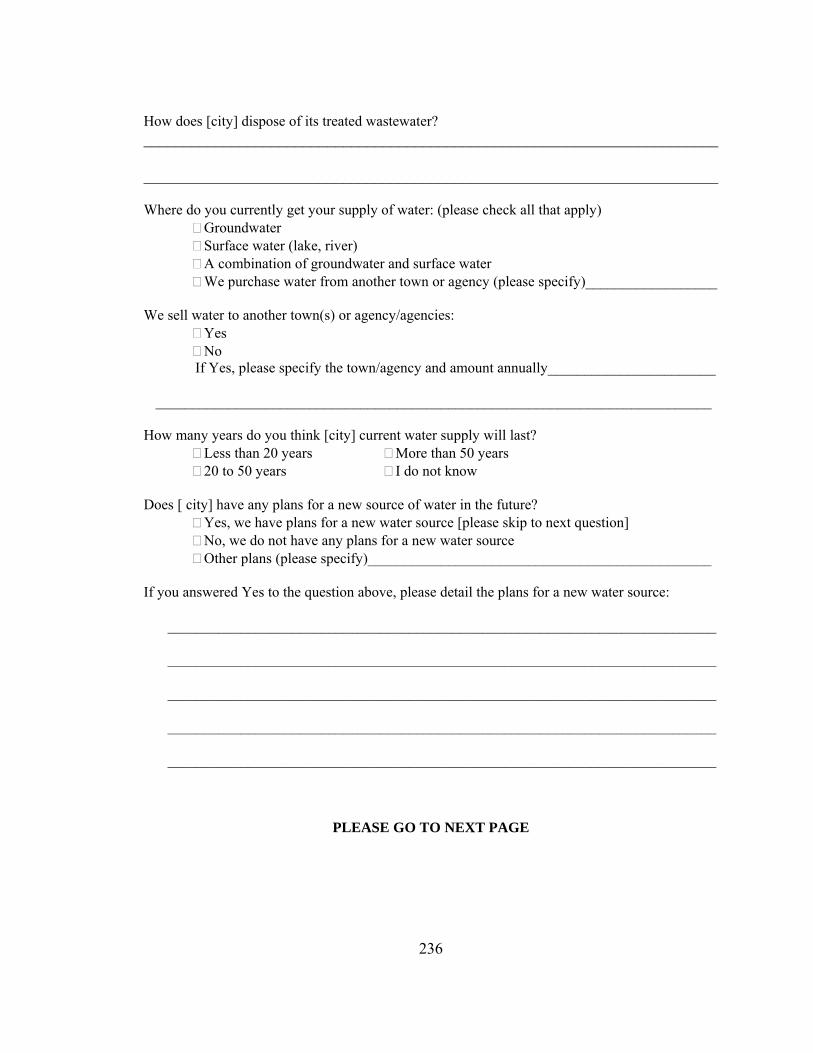
How does [city] dispose of its treated wastewater? ________________________________________________________________________ ________________________________________________________________________ Where do you currently get your supply of water: (please check all that apply) Groundwater Surface water (lake, river) A combination of groundwater and surface water We purchase water from another town or agency (please specify)__________________ We sell water to another town(s) or agency/agencies: Yes No
If Yes, please specify the town/agency and amount annually_______________________
____________________________________________________________________________ How many years do you think [city] current water supply will last? Less than 20 years More than 50 years 20 to 50 years I do not know Does [ city] have any plans for a new source of water in the future?
Yes, we have plans for a new water source [please skip to next question] No, we do not have any plans for a new water source Other plans (please specify)_______________________________________________
If you answered Yes to the question above, please detail the plans for a new water source: ___________________________________________________________________________ ___________________________________________________________________________ ___________________________________________________________________________ ___________________________________________________________________________ ___________________________________________________________________________
PLEASE GO TO NEXT PAGE
236
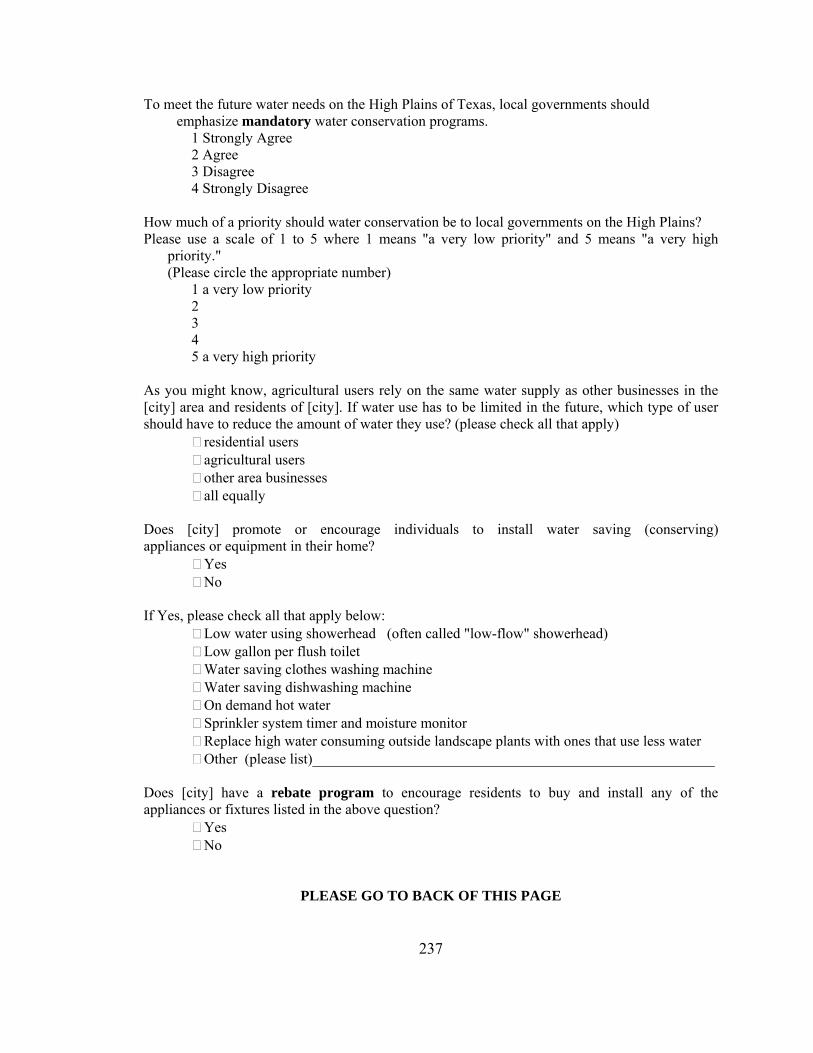
To meet the future water needs on the High Plains of Texas, local governments should emphasize mandatory water conservation programs. 1 Strongly Agree 2 Agree 3 Disagree 4 Strongly Disagree How much of a priority should water conservation be to local governments on the High Plains? Please use a scale of 1 to 5 where 1 means "a very low priority" and 5 means "a very high
priority." (Please circle the appropriate number) 1 a very low priority 2
3 4
5 a very high priority As you might know, agricultural users rely on the same water supply as other businesses in the [city] area and residents of [city]. If water use has to be limited in the future, which type of user should have to reduce the amount of water they use? (please check all that apply) residential users agricultural users other area businesses all equally Does [city] promote or encourage individuals to install water saving (conserving) appliances or equipment in their home? Yes No If Yes, please check all that apply below: Low water using showerhead (often called "low-flow" showerhead) Low gallon per flush toilet Water saving clothes washing machine Water saving dishwashing machine On demand hot water Sprinkler system timer and moisture monitor
Replace high water consuming outside landscape plants with ones that use less water Other (please list)_______________________________________________________ Does [city] have a rebate program to encourage residents to buy and install any of the appliances or fixtures listed in the above question? Yes No
PLEASE GO TO BACK OF THIS PAGE
237
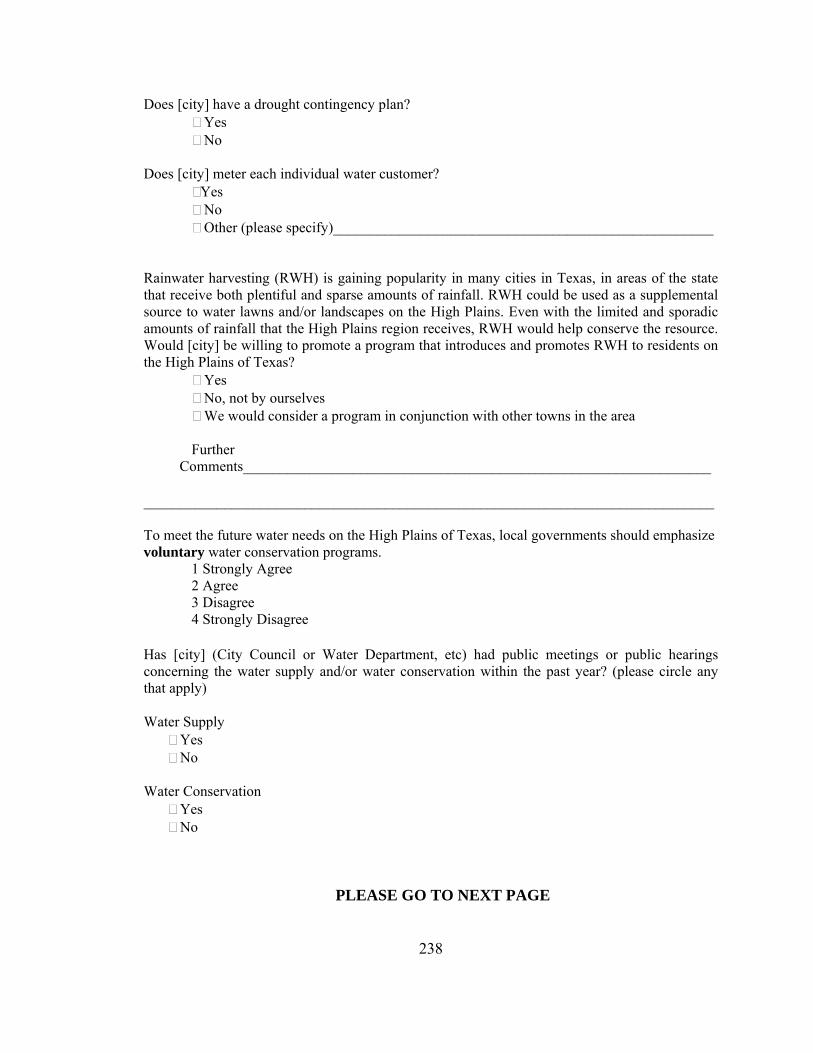
Does [city] have a drought contingency plan? Yes No Does [city] meter each individual water customer? Yes No Other (please specify)____________________________________________________ Rainwater harvesting (RWH) is gaining popularity in many cities in Texas, in areas of the state that receive both plentiful and sparse amounts of rainfall. RWH could be used as a supplemental source to water lawns and/or landscapes on the High Plains. Even with the limited and sporadic amounts of rainfall that the High Plains region receives, RWH would help conserve the resource. Would [city] be willing to promote a program that introduces and promotes RWH to residents on the High Plains of Texas? Yes No, not by ourselves We would consider a program in conjunction with other towns in the area Further
Comments________________________________________________________________ ______________________________________________________________________________ To meet the future water needs on the High Plains of Texas, local governments should emphasize voluntary water conservation programs. 1 Strongly Agree 2 Agree 3 Disagree 4 Strongly Disagree Has [city] (City Council or Water Department, etc) had public meetings or public hearings concerning the water supply and/or water conservation within the past year? (please circle any that apply) Water Supply Yes No Water Conservation Yes
No
PLEASE GO TO NEXT PAGE
238
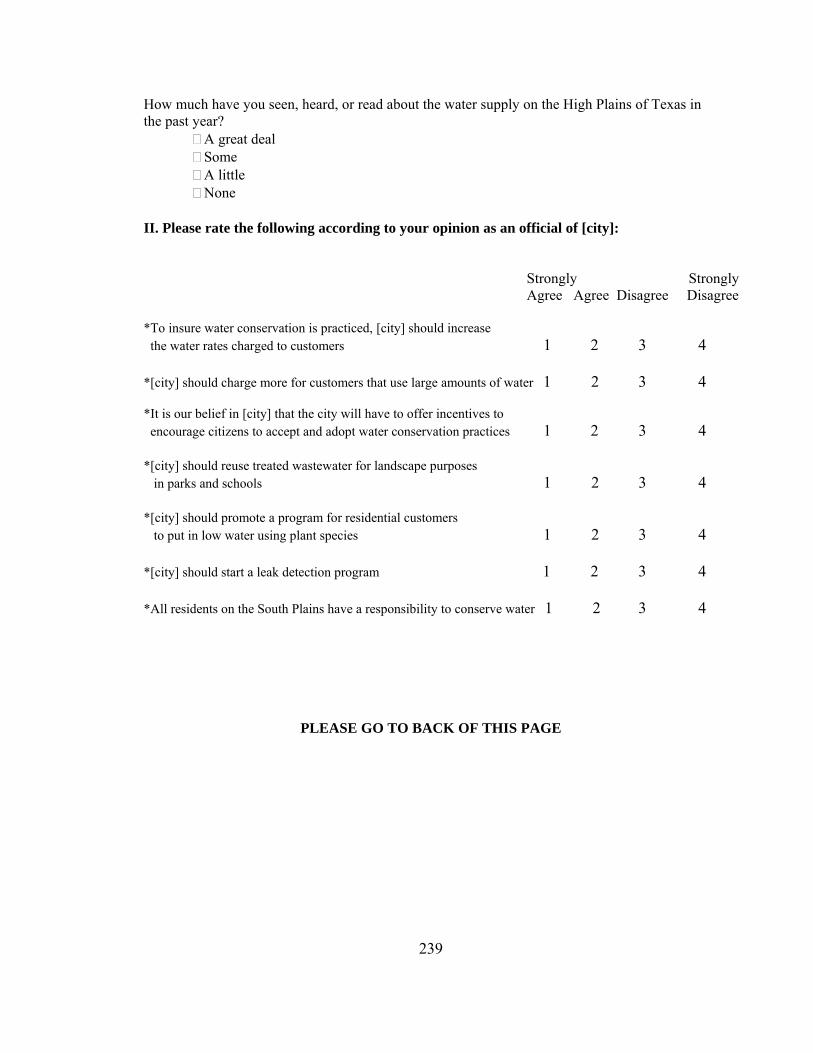
How much have you seen, heard, or read about the water supply on the High Plains of Texas in the past year? A great deal
Some A little None II. Please rate the following according to your opinion as an official of [city]:
Strongly Strongly Agree Agree Disagree Disagree *To insure water conservation is practiced, [city] should increase the water rates charged to customers 1 2 3 4 *[city] should charge more for customers that use large amounts of water 1 2 3 4 *It is our belief in [city] that the city will have to offer incentives to encourage citizens to accept and adopt water conservation practices 1 2 3 4 *[city] should reuse treated wastewater for landscape purposes in parks and schools 1 2 3 4 *[city] should promote a program for residential customers to put in low water using plant species 1 2 3 4 *[city] should start a leak detection program 1 2 3 4 *All residents on the South Plains have a responsibility to conserve water 1 2 3 4
PLEASE GO TO BACK OF THIS PAGE
239
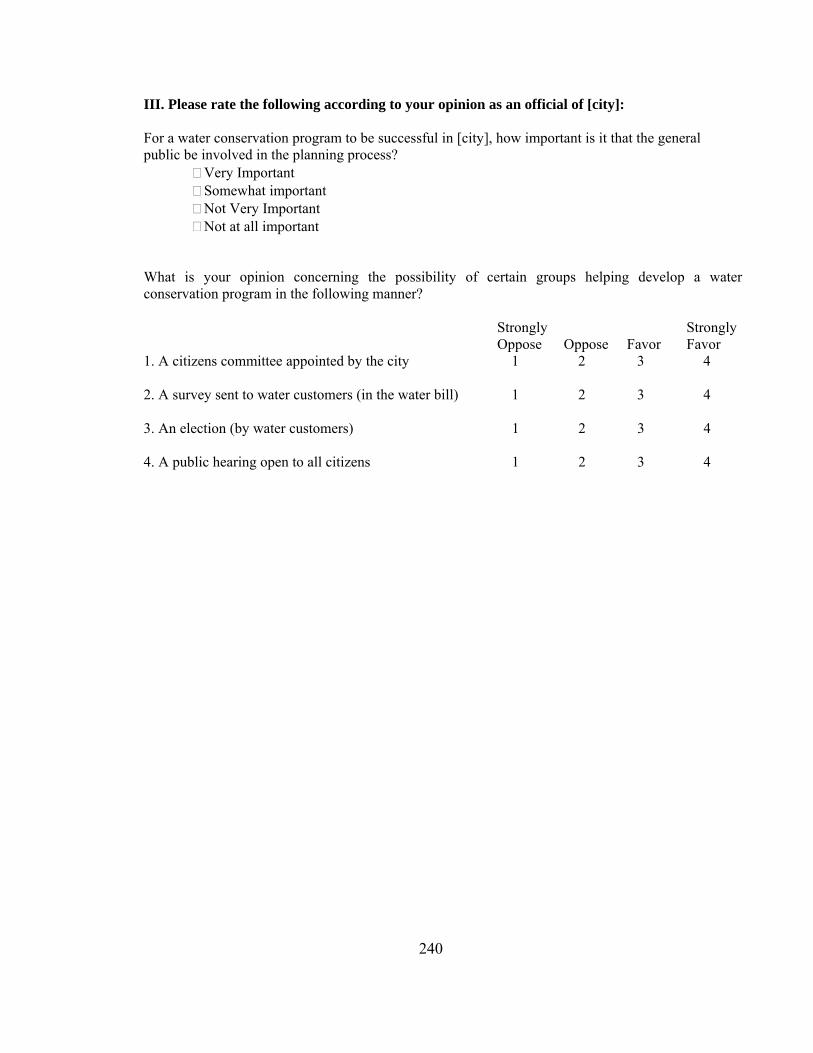
III. Please rate the following according to your opinion as an official of [city]: For a water conservation program to be successful in [city], how important is it that the general public be involved in the planning process? Very Important Somewhat important Not Very Important
Not at all important What is your opinion concerning the possibility of certain groups helping develop a water conservation program in the following manner? Strongly Strongly Oppose Oppose Favor Favor 1. A citizens committee appointed by the city 1 2 3 4 2. A survey sent to water customers (in the water bill) 1 2 3 4 3. An election (by water customers) 1 2 3 4 4. A public hearing open to all citizens 1 2 3 4
240
APPENDIX B-2
Sample Cover Letter- Municipal Water Provider
241
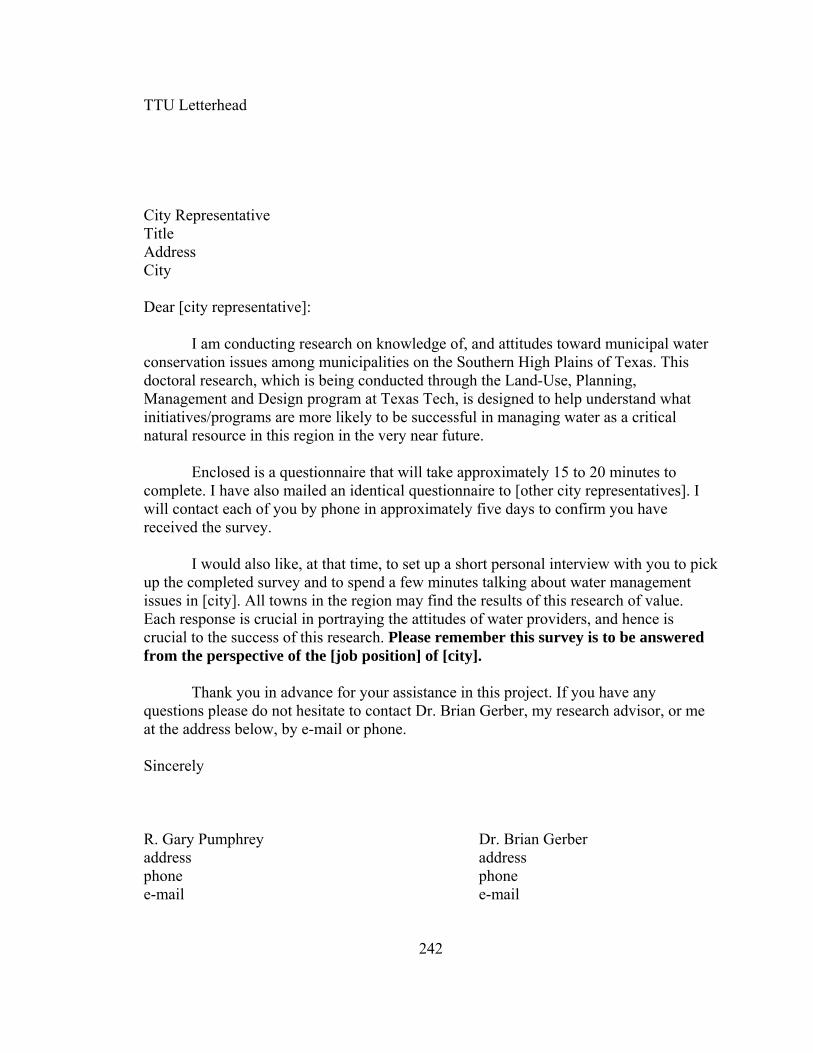
TTU Letterhead City Representative Title Address City Dear [city representative]: I am conducting research on knowledge of, and attitudes toward municipal water conservation issues among municipalities on the Southern High Plains of Texas. This doctoral research, which is being conducted through the Land-Use, Planning, Management and Design program at Texas Tech, is designed to help understand what initiatives/programs are more likely to be successful in managing water as a critical natural resource in this region in the very near future. Enclosed is a questionnaire that will take approximately 15 to 20 minutes to complete. I have also mailed an identical questionnaire to [other city representatives]. I will contact each of you by phone in approximately five days to confirm you have received the survey. I would also like, at that time, to set up a short personal interview with you to pick up the completed survey and to spend a few minutes talking about water management issues in [city]. All towns in the region may find the results of this research of value. Each response is crucial in portraying the attitudes of water providers, and hence is crucial to the success of this research. Please remember this survey is to be answered from the perspective of the [job position] of [city]. Thank you in advance for your assistance in this project. If you have any questions please do not hesitate to contact Dr. Brian Gerber, my research advisor, or me at the address below, by e-mail or phone. Sincerely R. Gary Pumphrey Dr. Brian Gerber address address phone phone e-mail e-mail
242

APPENDIX C FIGURES
243

Figure C-1 Study Area Map
244
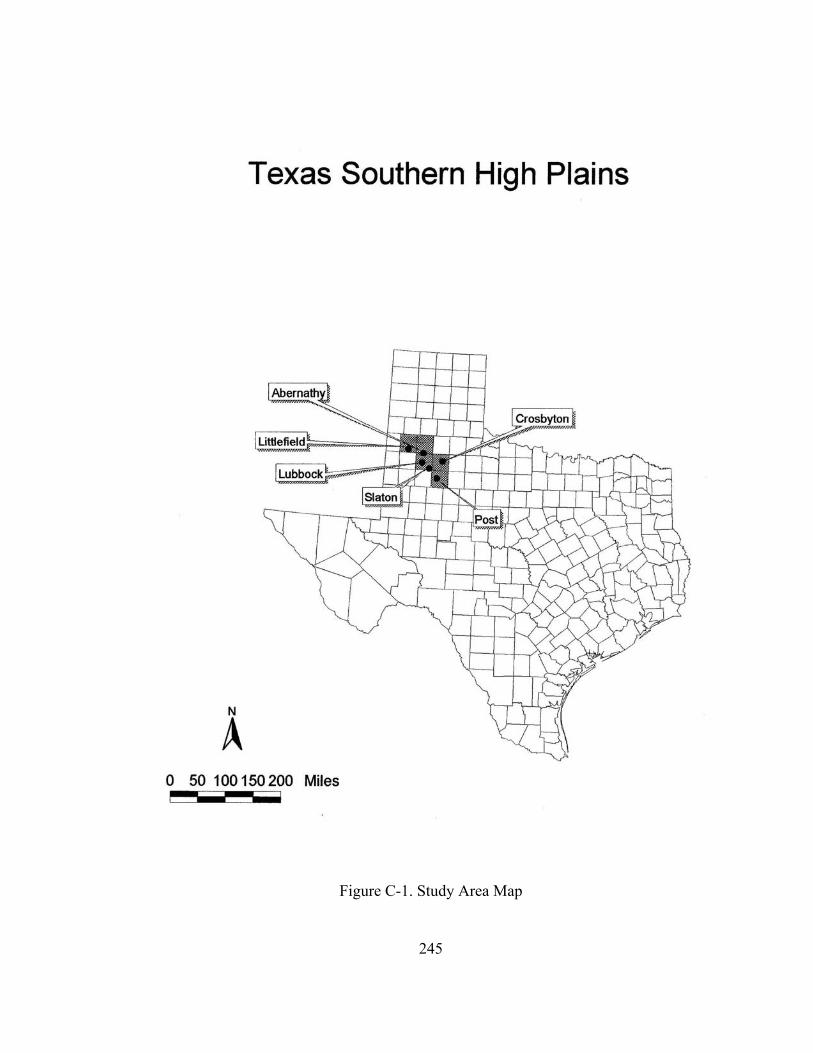
Figure C-1. Study Area Map
245

Figure C-2 Canadian River Municipal Water Authority
246
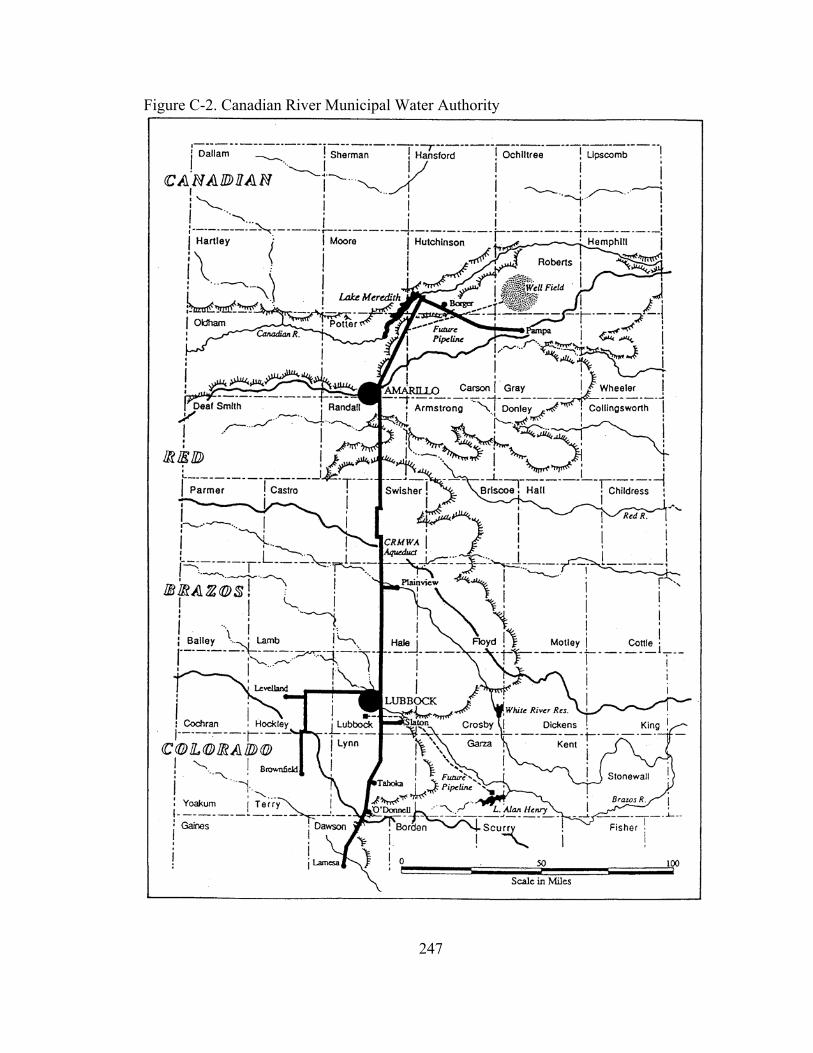
Figure C-2. Canadian River Municipal Water Authority
247