Embed Size (px)
Citation preview
© 2007 by Prentice Hall 10-1
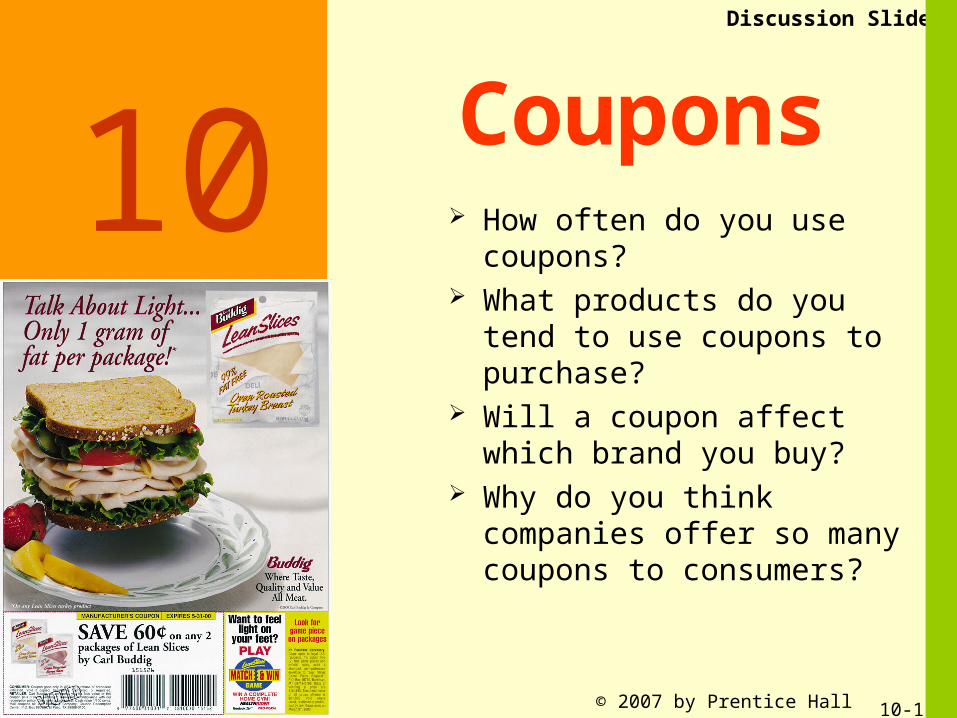
Coupons How often do you use
coupons? What products do you tend to
use coupons to purchase? Will a coupon affect which
brand you buy? Why do you think companies
offer so many coupons to consumers?
Discussion Slide
10
© 2007 by Prentice Hall 10-2
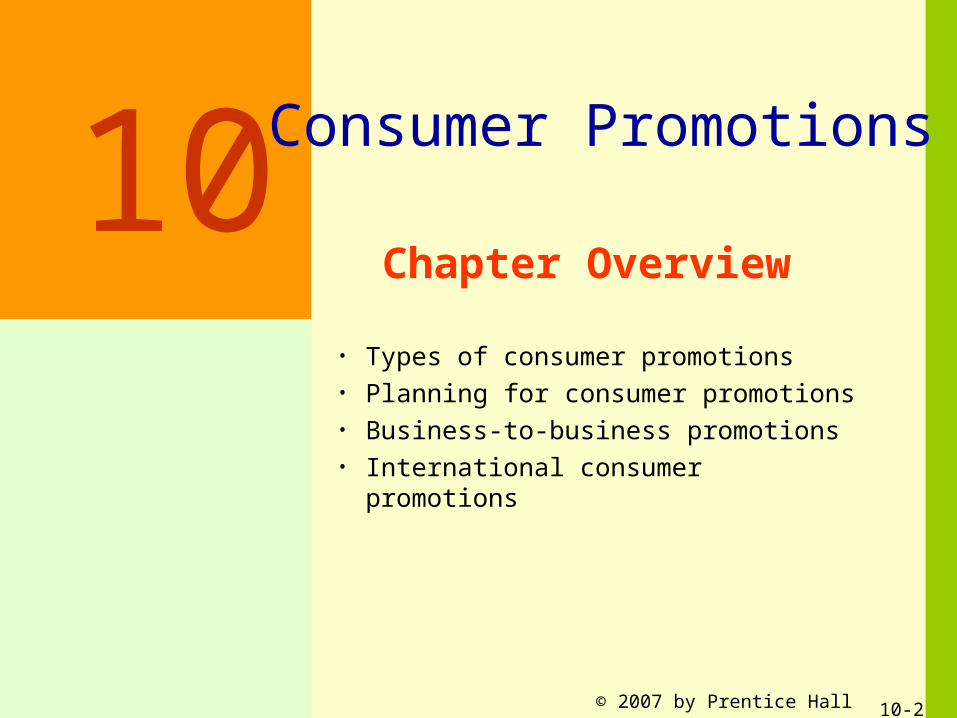
Chapter Overview
• Types of consumer promotions• Planning for consumer promotions• Business-to-business promotions• International consumer promotions
10 Consumer Promotions
© 2007 by Prentice Hall 10-3
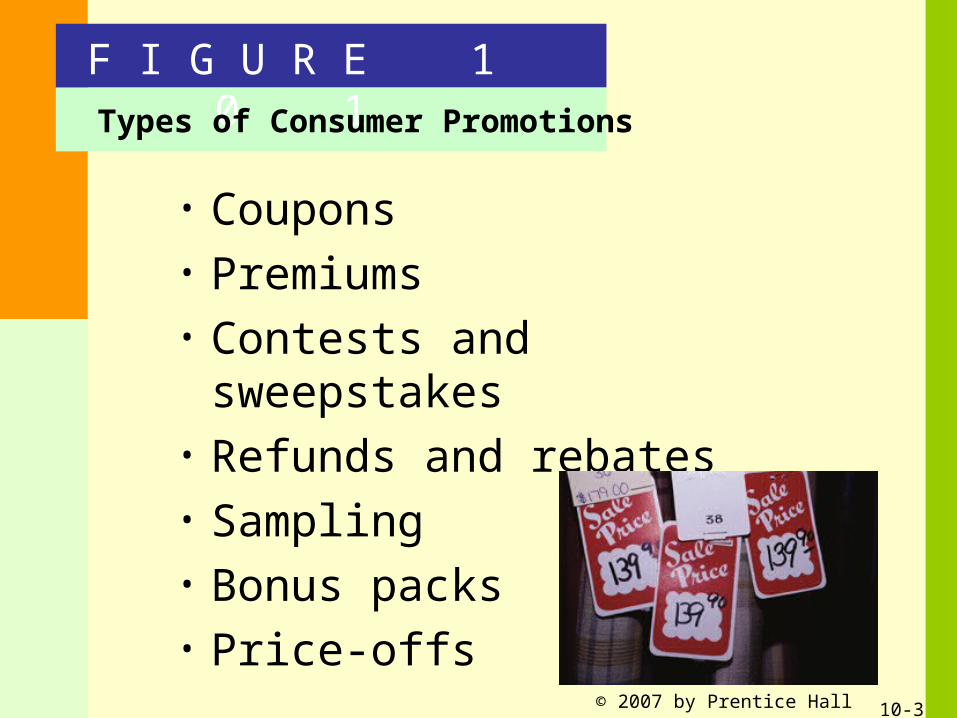
• Coupons• Premiums• Contests and sweepstakes• Refunds and rebates• Sampling• Bonus packs• Price-offs
F I G U R E 1 0 . 1Types of Consumer Promotions
© 2007 by Prentice Hall 10-4
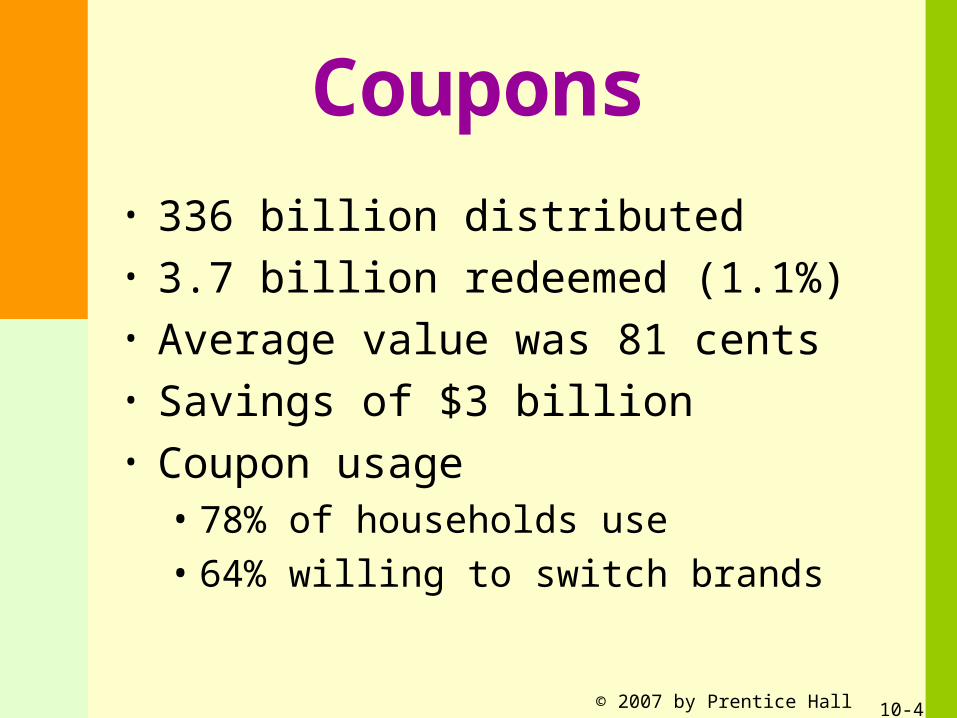
Coupons• 336 billion distributed• 3.7 billion redeemed (1.1%)• Average value was 81 cents• Savings of $3 billion• Coupon usage
• 78% of households use• 64% willing to switch brands
© 2007 by Prentice Hall 10-5
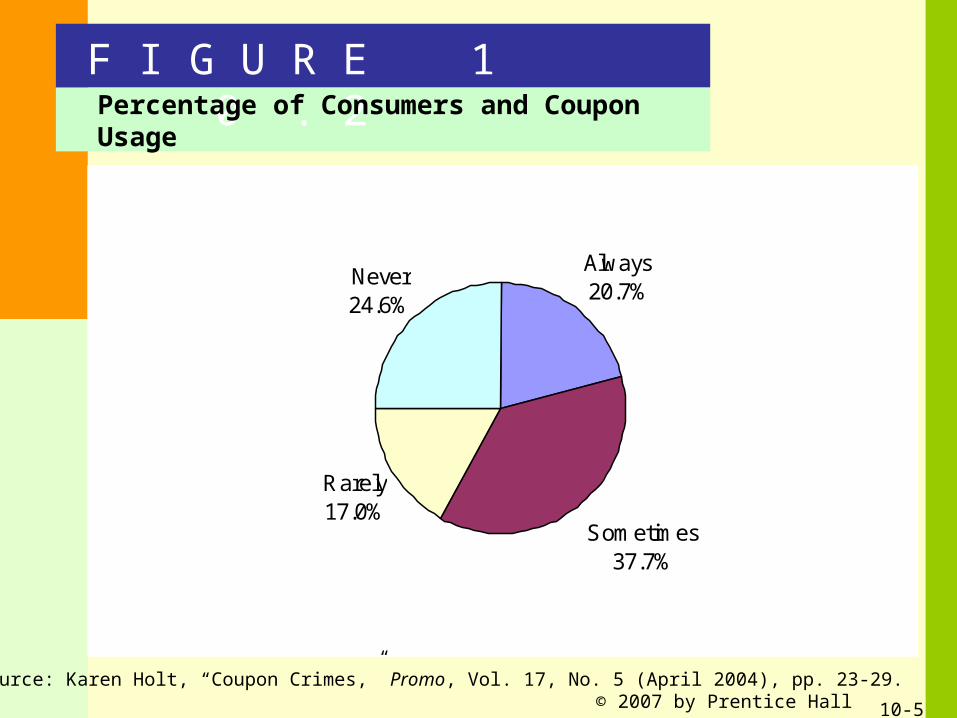
F I G U R E 1 0 . 2Percentage of Consumers and Coupon Usage
Always20.7%
Sometimes37.7%
Rarely17.0%
Never24.6%
Source: Karen Holt, “Coupon Crimes,” Promo, Vol. 17, No. 5 (April 2004), pp. 23-29.
© 2007 by Prentice Hall 10-6
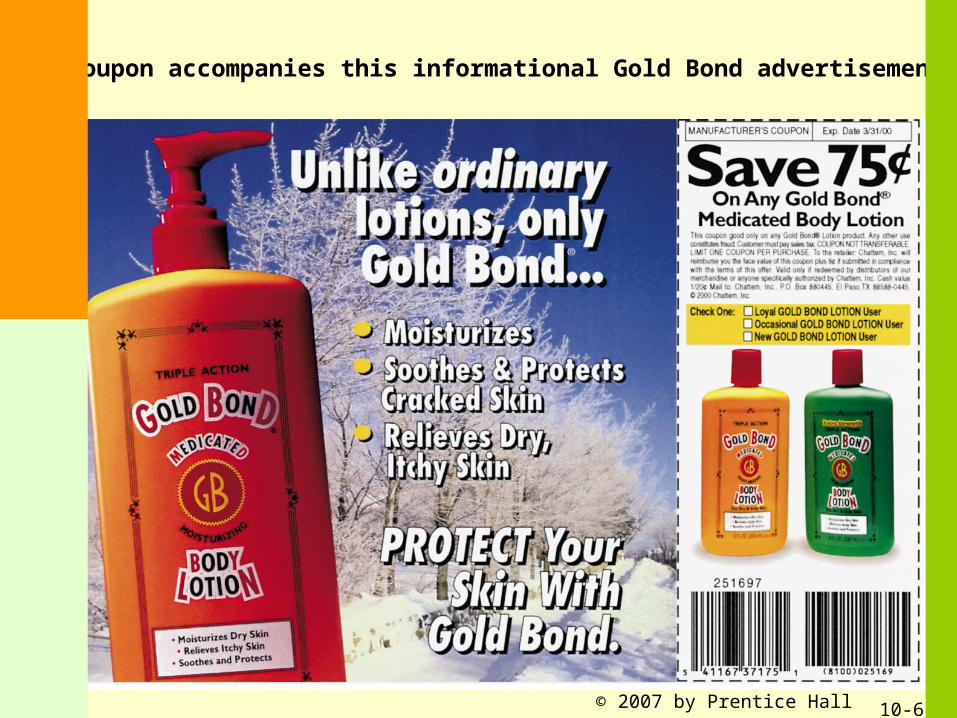
A coupon accompanies this informational Gold Bond advertisement.
© 2007 by Prentice Hall 10-7
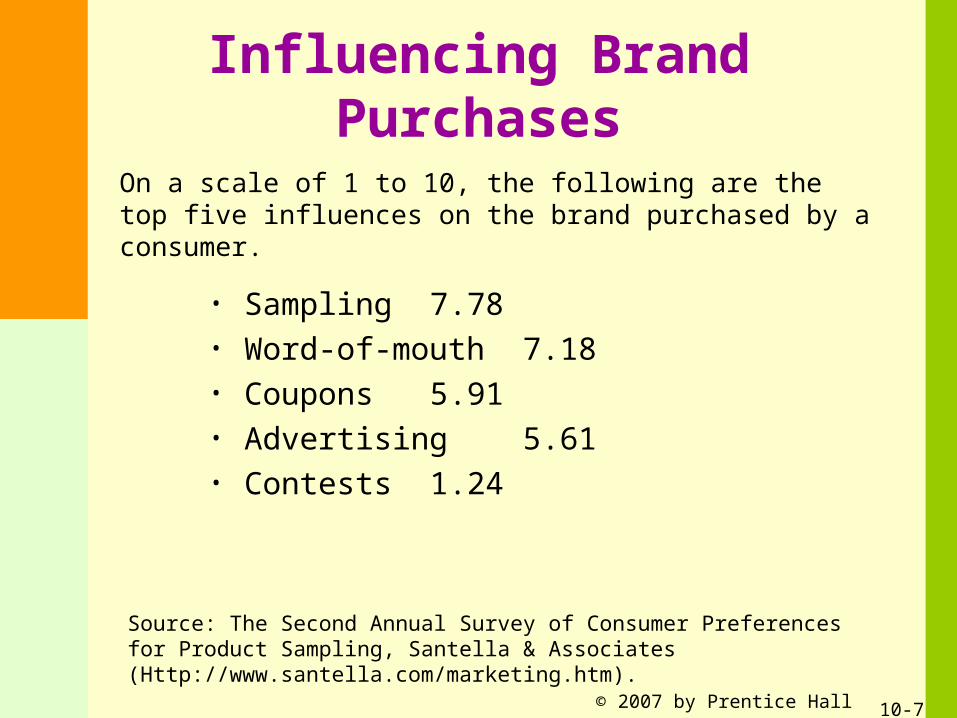
Influencing Brand Purchases
• Sampling 7.78• Word-of-mouth 7.18• Coupons 5.91• Advertising 5.61• Contests 1.24
On a scale of 1 to 10, the following are the top five influences on the brand purchased by a consumer.
Source: The Second Annual Survey of Consumer Preferences for Product Sampling, Santella & Associates (Http://www.santella.com/marketing.htm).
© 2007 by Prentice Hall 10-8
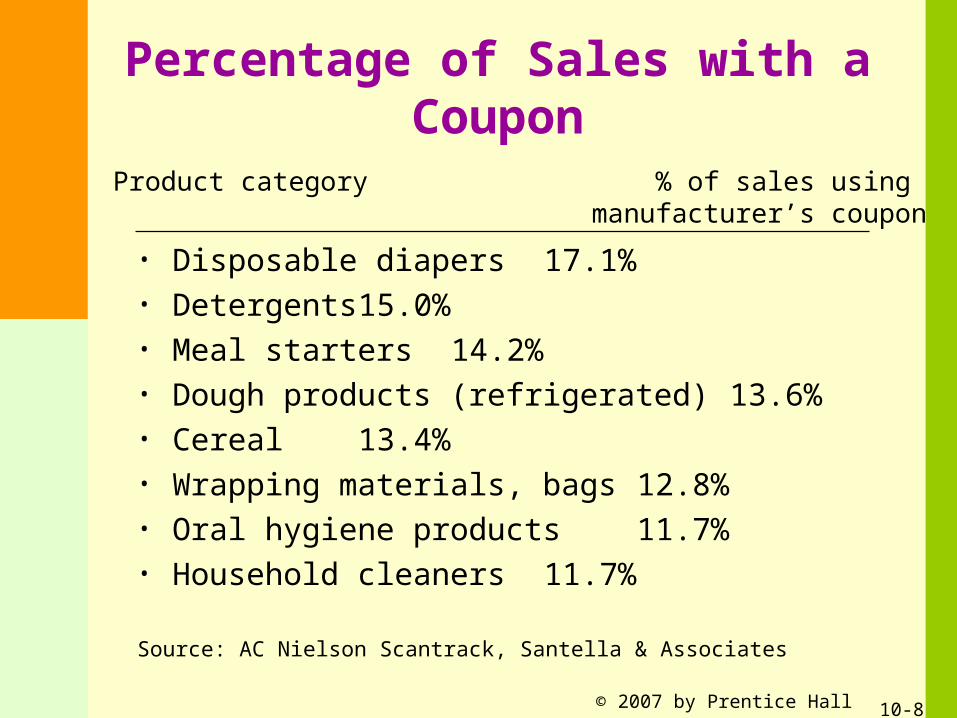
Percentage of Sales with a Coupon
• Disposable diapers 17.1%• Detergents 15.0%• Meal starters 14.2%• Dough products (refrigerated) 13.6%• Cereal 13.4%• Wrapping materials, bags 12.8%• Oral hygiene products 11.7%• Household cleaners 11.7%
Product category % of sales using manufacturer’s coupon
Source: AC Nielson Scantrack, Santella & Associates
© 2007 by Prentice Hall 10-9
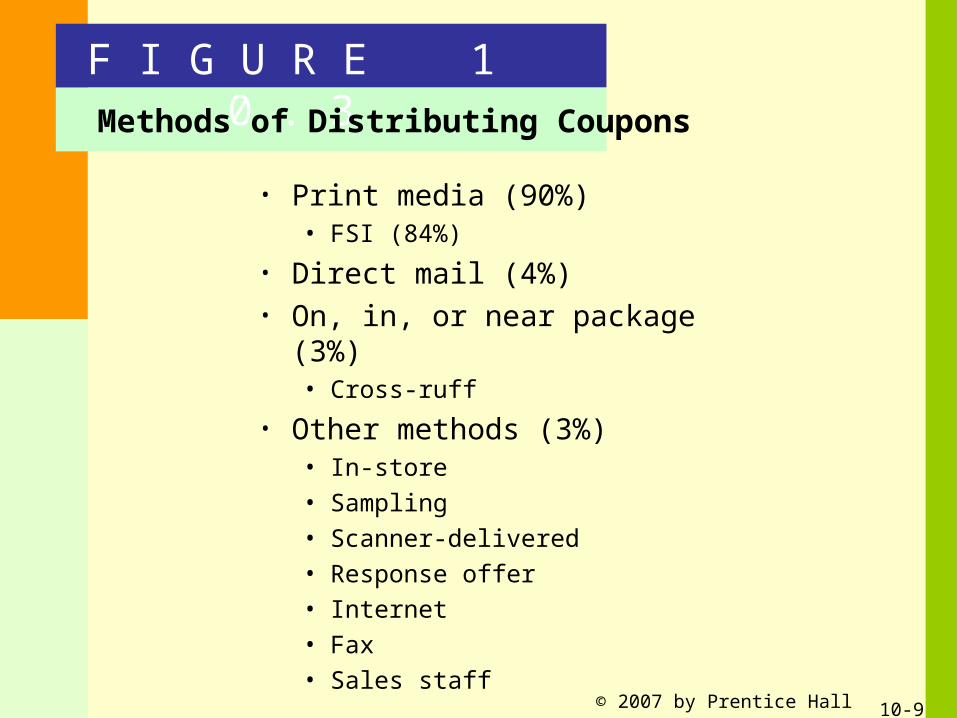
• Print media (90%)• FSI (84%)
• Direct mail (4%) • On, in, or near package (3%)
• Cross-ruff
• Other methods (3%)• In-store• Sampling• Scanner-delivered• Response offer• Internet• Fax• Sales staff
F I G U R E 1 0 . 3Methods of Distributing Coupons
© 2007 by Prentice Hall 10-10
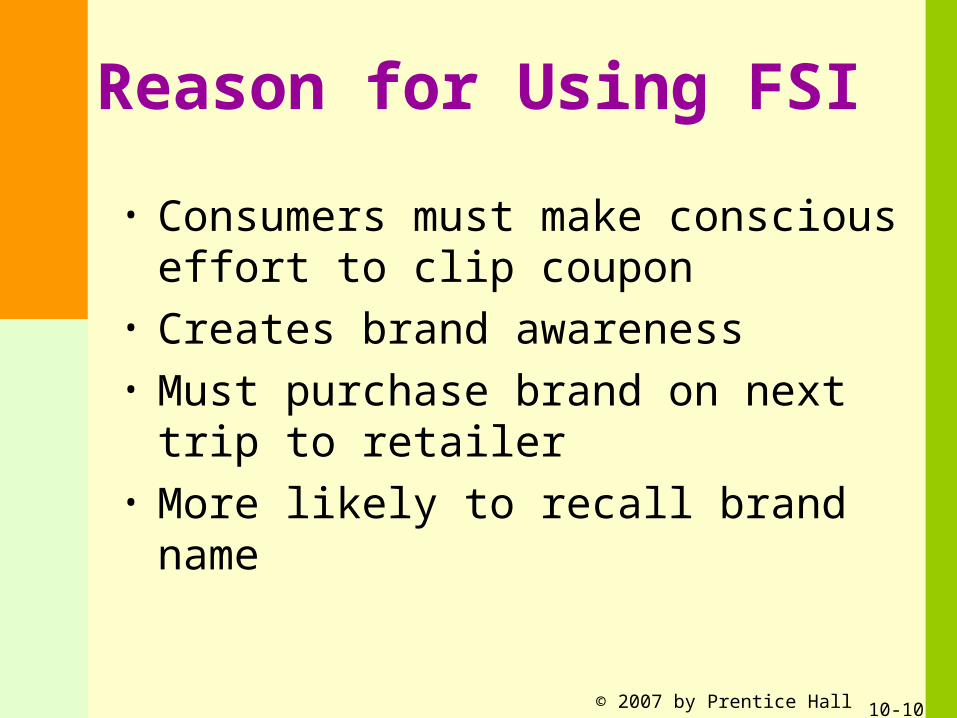
Reason for Using FSI
• Consumers must make conscious effort to clip coupon
• Creates brand awareness• Must purchase brand on next trip to
retailer• More likely to recall brand name
© 2007 by Prentice Hall 10-11
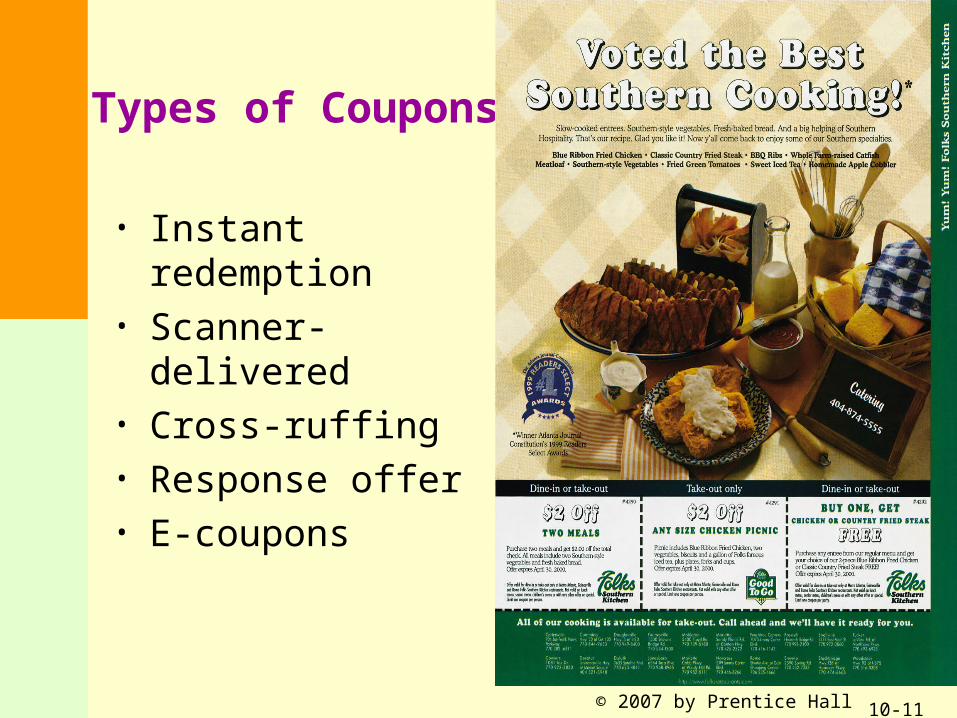
Types of Coupons
• Instant redemption• Scanner-delivered• Cross-ruffing• Response offer• E-coupons
© 2007 by Prentice Hall 10-12
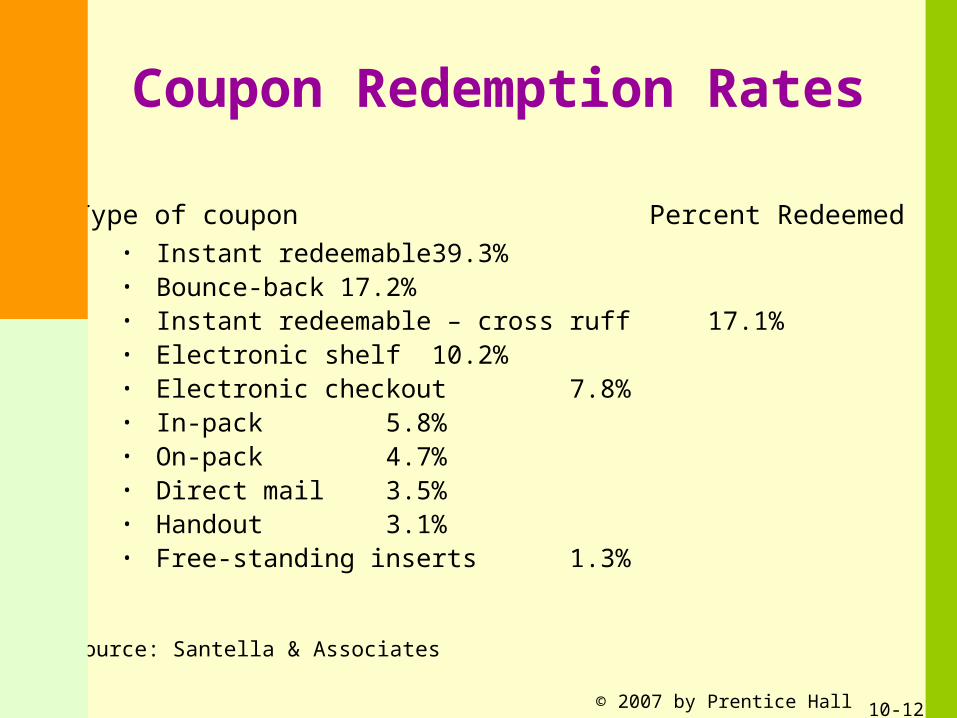
Coupon Redemption Rates
• Instant redeemable 39.3%• Bounce-back 17.2%• Instant redeemable – cross ruff 17.1%• Electronic shelf 10.2%• Electronic checkout 7.8%• In-pack 5.8%• On-pack 4.7%• Direct mail 3.5%• Handout 3.1%• Free-standing inserts 1.3%
Type of coupon Percent Redeemed
Source: Santella & Associates
© 2007 by Prentice Hall 10-13
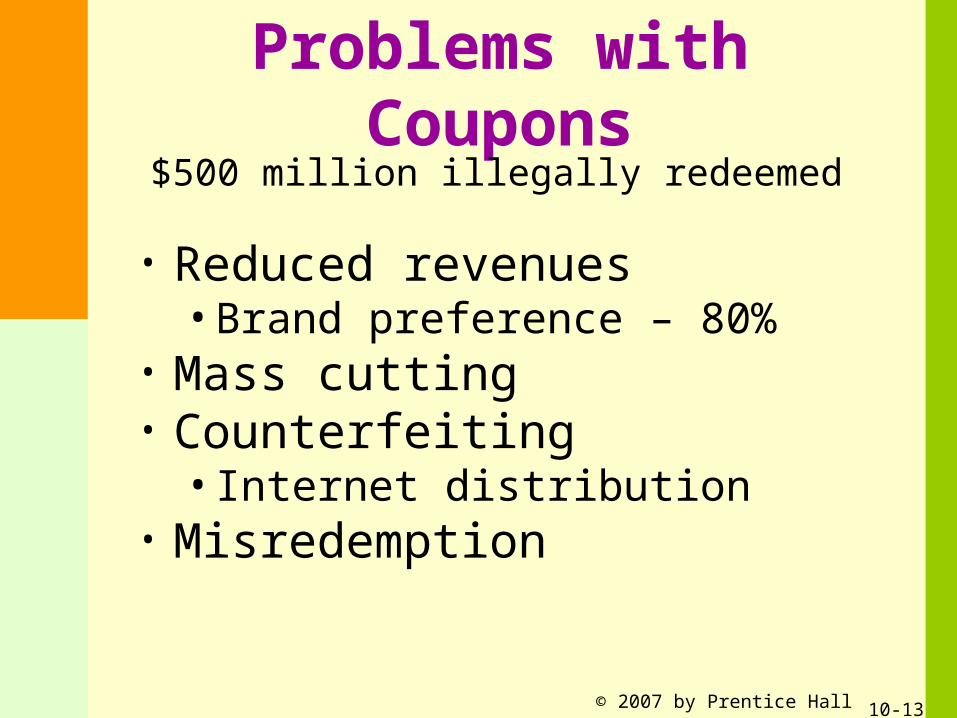
Problems with Coupons
• Reduced revenues• Brand preference – 80%
• Mass cutting• Counterfeiting
• Internet distribution• Misredemption
$500 million illegally redeemed
© 2007 by Prentice Hall 10-14
Factors Affecting Coupon Effectiveness
• Face value of coupon• Distribution method• Coupon for preferred brand or
brand in evoked set
© 2007 by Prentice Hall 10-15
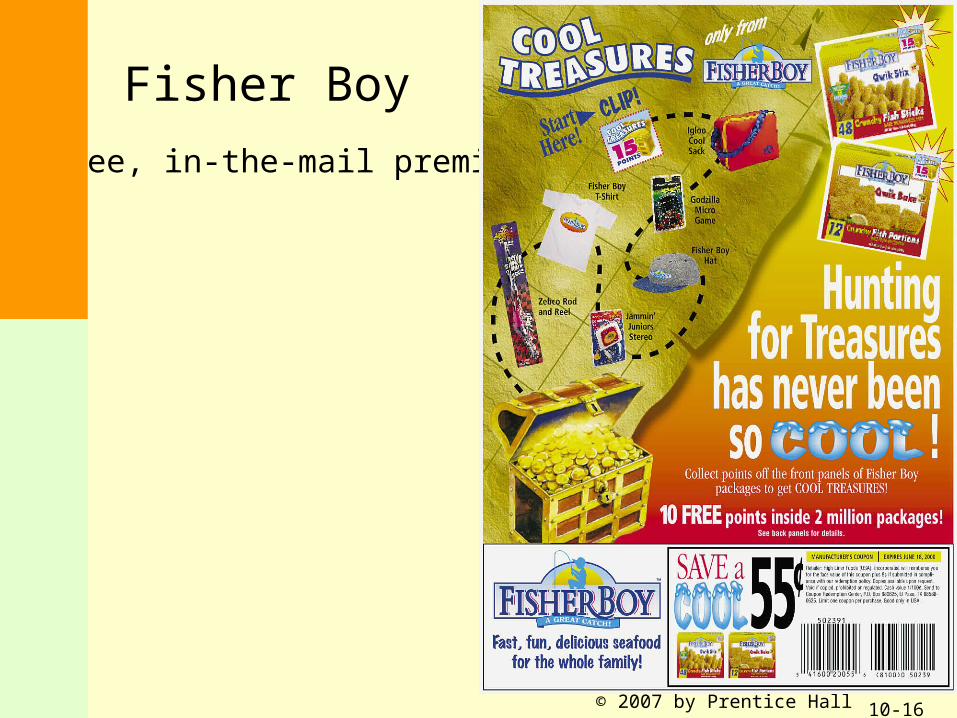
Types of Premiums
• Free-in-the-mail• In- or on-package• Store or manufacturer• Self-liquidating

© 2007 by Prentice Hall 10-17
Premium Offer
Click picture for video.
An ad by Haik Humble Eye Center offering a premium with the purchase of custom pair of eye glasses.
© 2007 by Prentice Hall 10-18
Problems with Premiums
• Time factor• Tend to have short life spans• Popularity important
• Cost• Related to interest in premium• Exclusive premiums
© 2007 by Prentice Hall 10-19
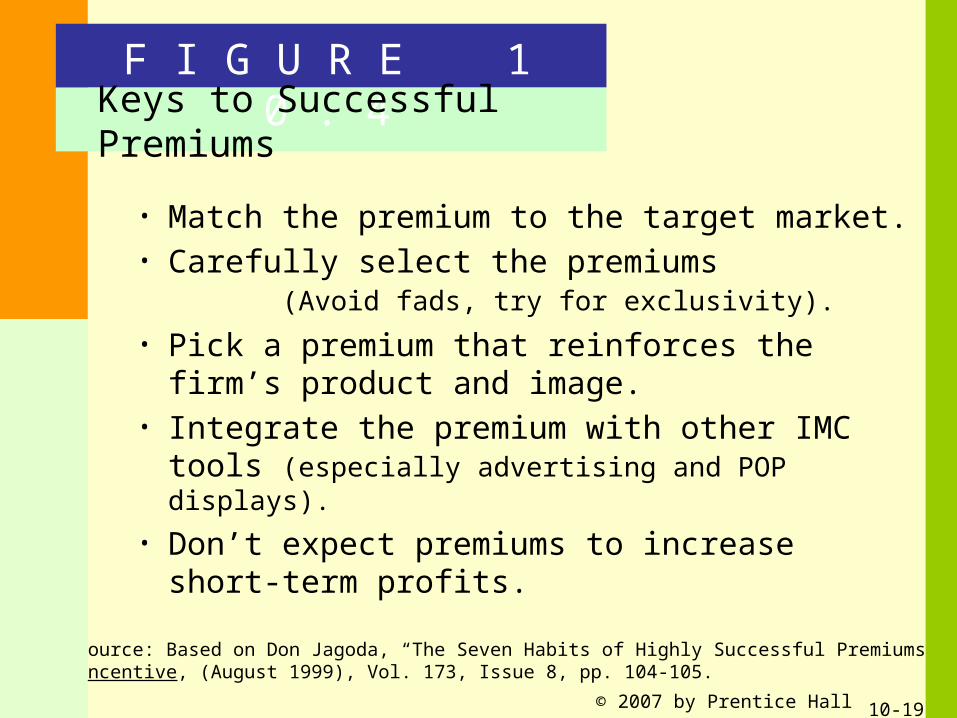
• Match the premium to the target market.• Carefully select the premiums
(Avoid fads, try for exclusivity).
• Pick a premium that reinforces the firm’s product and image.
• Integrate the premium with other IMC tools (especially advertising and POP displays).
• Don’t expect premiums to increase short-term profits.
Source: Based on Don Jagoda, “The Seven Habits of Highly Successful Premiums,”Incentive, (August 1999), Vol. 173, Issue 8, pp. 104-105.
F I G U R E 1 0 . 4
Keys to Successful Premiums
© 2007 by Prentice Hall 10-20
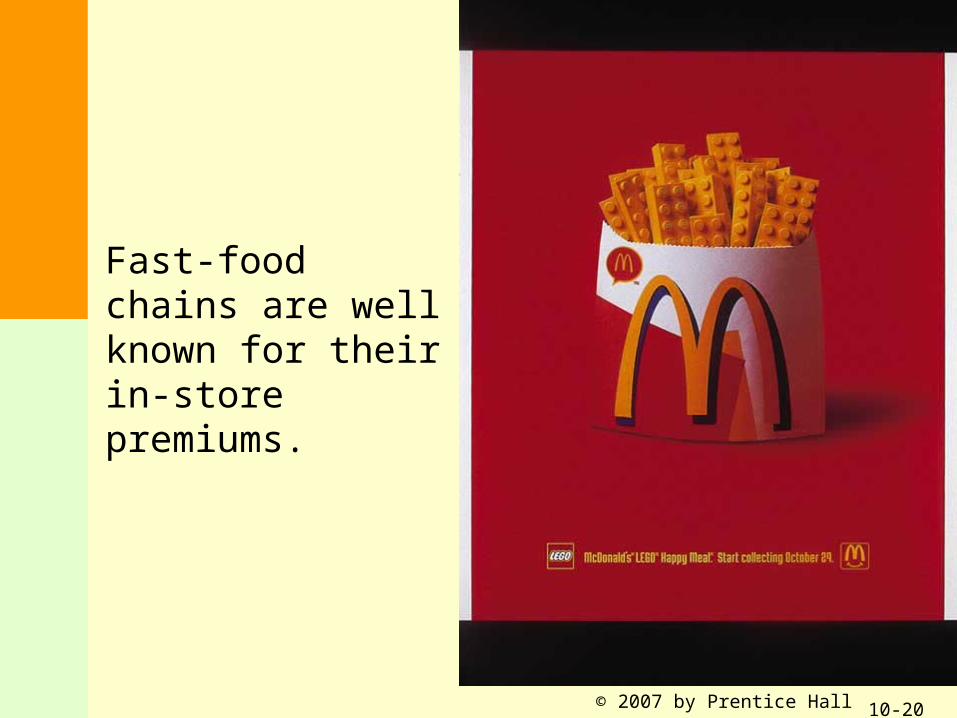
Fast-food chains are well known for their in-store premiums.
© 2007 by Prentice Hall 10-21
Contests and Sweepstakes
• Contests – require activity, skill• Can require purchase to enter
• Some states illegal
• Sweepstakes – random chance• Must publish odds of winning• Cannot require purchase
• Rewards• Extrinsic• Intrinsic
© 2007 by Prentice Hall 10-22
Contests and SweepstakesProblems
• Costs• Consumer indifference• Clutter
© 2007 by Prentice Hall 10-23
Creating SuccessfulContests and Sweepstakes
• Know the legal restrictions.• Find the right combination of prizes.• Consider extrinsic and intrinsic value.• Use special events or tie-ins with other
companies.• Use Internet.• Coordinate with POP displays and other
marketing tools.
© 2007 by Prentice Hall 10-24
Contests and SweepstakesGoals
• Encourage customer traffic• Increase brand awareness• Boost sales
© 2007 by Prentice Hall 10-25
Rebates and Refunds
• Refunds – soft goods• Rebates – hard goods• Redemption rates
• 30% overall
• 65% for rebates over $50
© 2007 by Prentice Hall 10-26
Rebate/Refund Programs
• Problems• Costs• Paperwork• Diminished effectiveness
• Creating effective programs• Visibility• Perceived newness• Impact
© 2007 by Prentice Hall 10-27
• In-store distribution• Direct sampling• Response sampling• Cross-ruff sampling• Media sampling• Professional sampling• Selective sampling
F I G U R E 1 0 . 5
Types of Sampling
© 2007 by Prentice Hall 10-28
Sampling Programs
• Target audience• Business-to-business• Women• Men
• FSI distribution• Internet-based response sampling
© 2007 by Prentice Hall 10-29
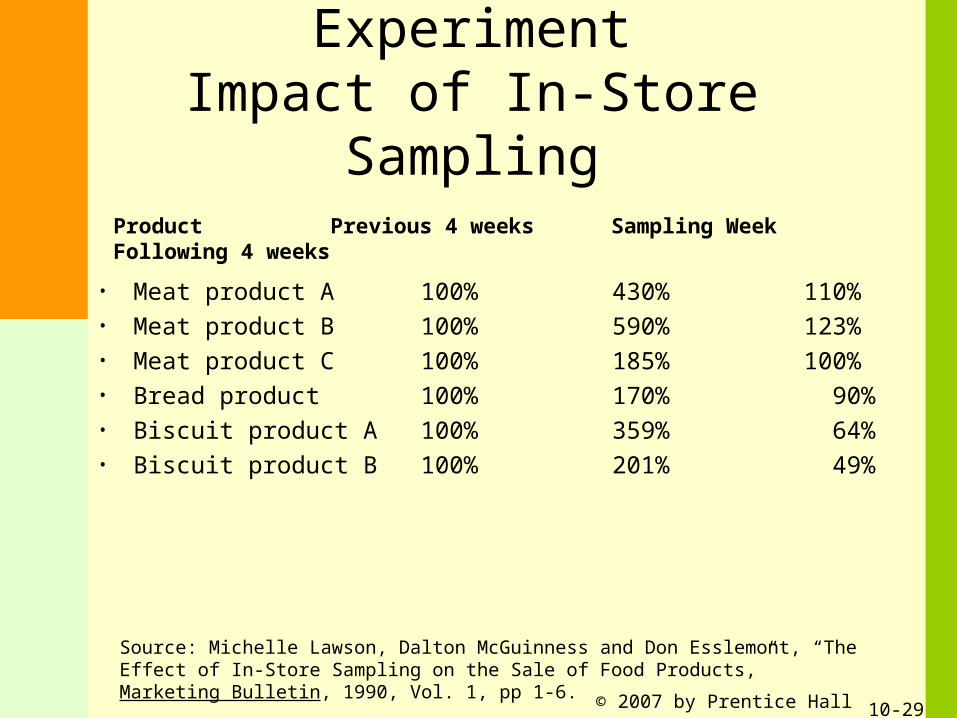
ExperimentImpact of In-Store Sampling
• Meat product A 100% 430% 110%• Meat product B 100% 590% 123%• Meat product C 100% 185% 100%• Bread product 100% 170% 90%• Biscuit product A 100% 359% 64%• Biscuit product B 100% 201% 49%
Product Previous 4 weeks Sampling Week Following 4 weeks
Source: Michelle Lawson, Dalton McGuinness and Don Esslemont, “The Effect of In-Store Sampling on the Sale of Food Products,” Marketing Bulletin, 1990, Vol. 1, pp 1-6.
© 2007 by Prentice Hall 10-30
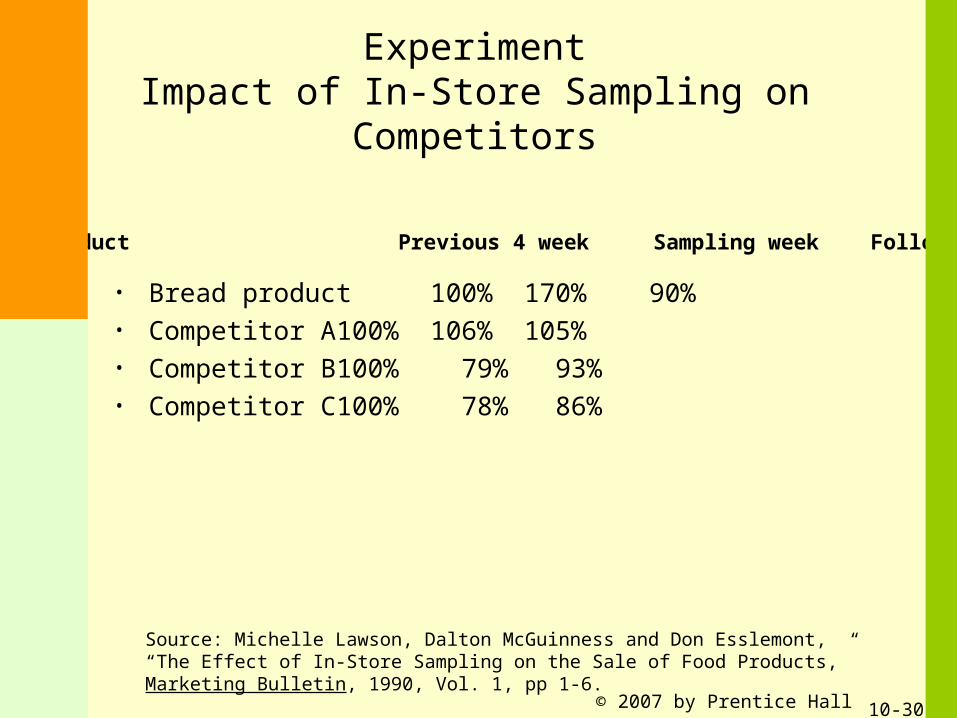
ExperimentImpact of In-Store Sampling on Competitors
• Bread product 100% 170% 90%• Competitor A 100% 106% 105%• Competitor B 100% 79% 93%• Competitor C 100% 78% 86%
Product Previous 4 week Sampling week Following 4 weeks
Source: Michelle Lawson, Dalton McGuinness and Don Esslemont, “The Effect of In-Store Sampling on the Sale of Food Products,” Marketing Bulletin, 1990, Vol. 1, pp 1-6.
© 2007 by Prentice Hall 10-31
Sampling Programs
• Problems• Cost• Distribution
• Effective sampling• Component of IMC plan• Stimulate trial usage• Target audience of sample
© 2007 by Prentice Hall 10-32
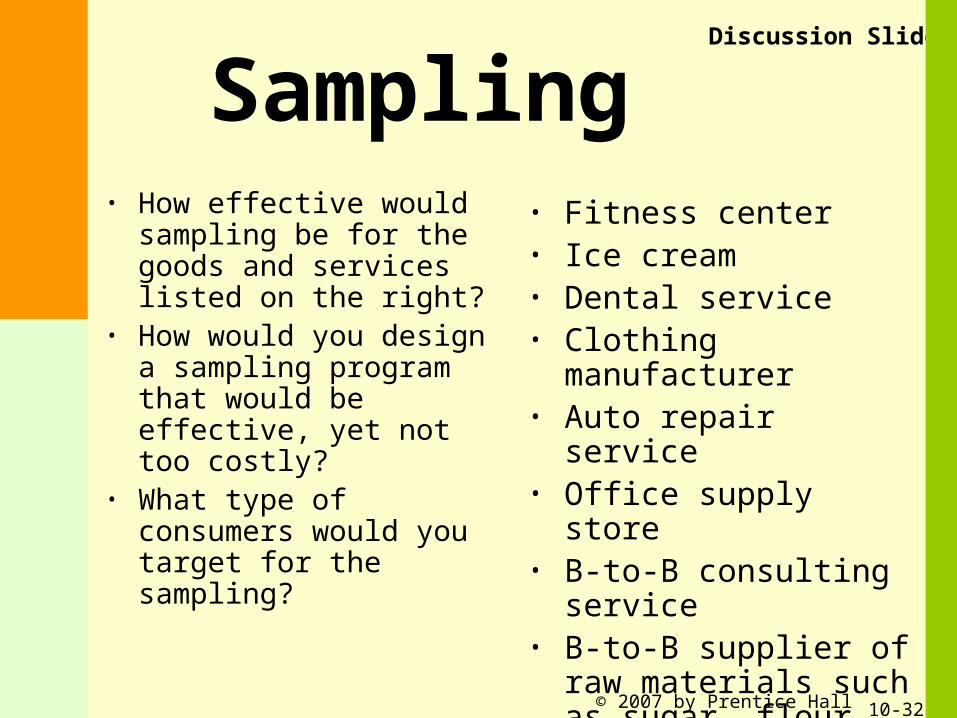
Sampling• How effective would
sampling be for the goods and services listed on the right?
• How would you design a sampling program that would be effective, yet not too costly?
• What type of consumers would you target for the sampling?
• Fitness center• Ice cream• Dental service• Clothing manufacturer• Auto repair service• Office supply store• B-to-B consulting service• B-to-B supplier of raw
materials such as sugar, flour, etc., to bakeries
Discussion Slide
© 2007 by Prentice Hall 10-33
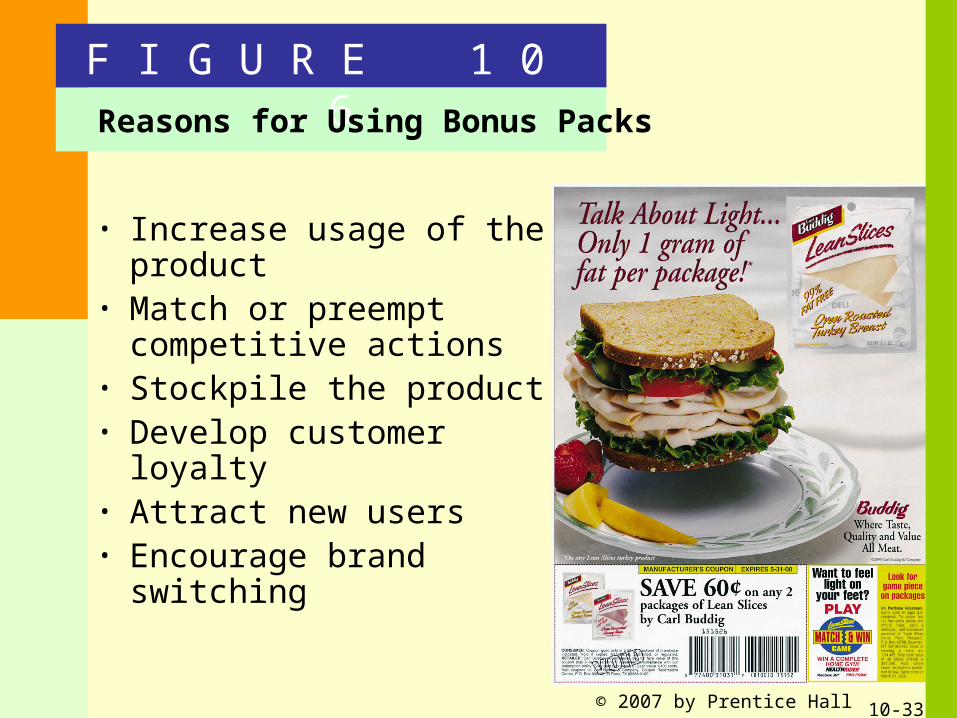
• Increase usage of the product
• Match or preempt competitive actions
• Stockpile the product• Develop customer loyalty• Attract new users• Encourage brand
switching
F I G U R E 1 0 . 6Reasons for Using Bonus Packs
© 2007 by Prentice Hall 10-34
Bonus Packs• Bonuses range from 20% - 100%• 30% bonus most common• Used by current customers• Brand switching
• if used by consumer previously
© 2007 by Prentice Hall 10-35
Bonus Packs• Problems
• Size of bonus pack• Too small – Too large
• Cost of bonus• Cash flow due to stockpiling
• Effective bonus packs• Brand switching, stockpiling, lower unit costs• Manufacturers• Retailers• Customers
© 2007 by Prentice Hall 10-36
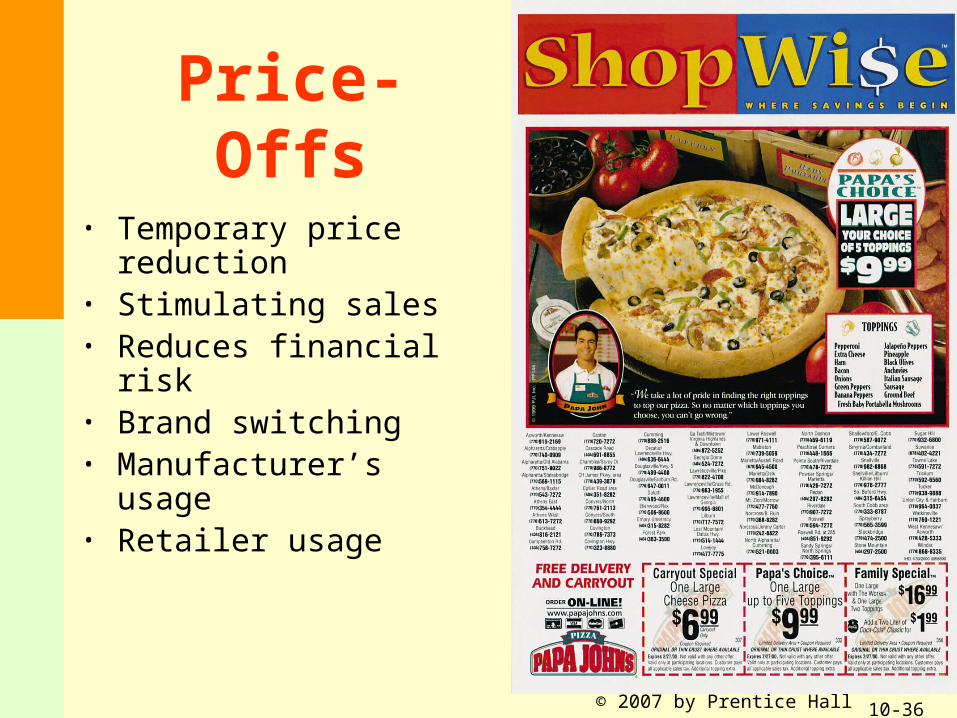
Price-Offs
• Temporary price reduction• Stimulating sales• Reduces financial risk• Brand switching• Manufacturer’s usage• Retailer usage
© 2007 by Prentice Hall 10-37
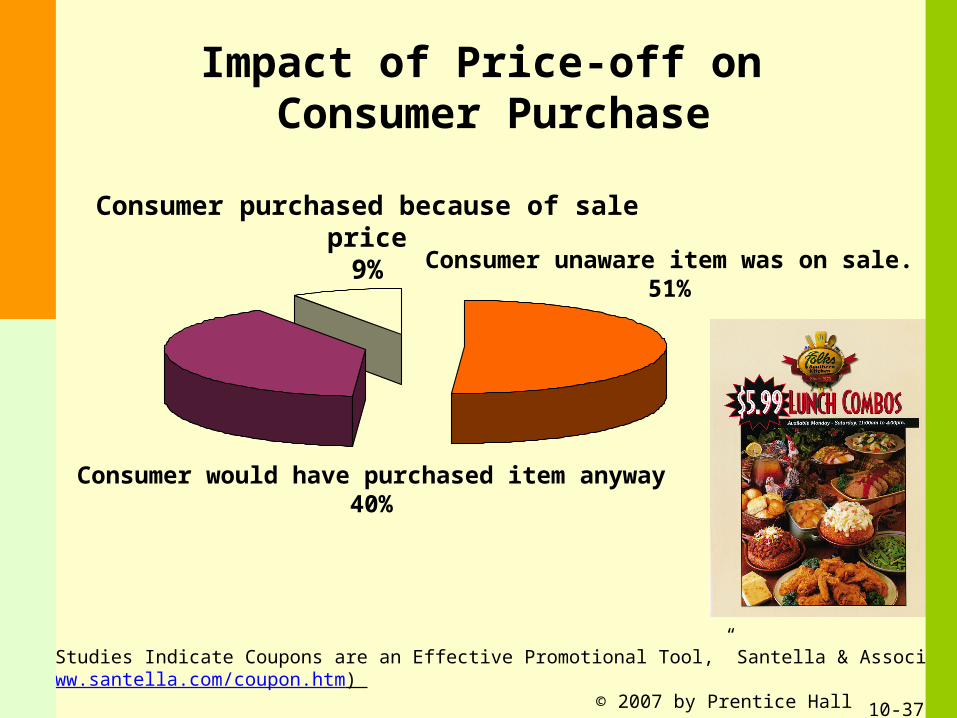
Impact of Price-off on Consumer Purchase
Source: “Studies Indicate Coupons are an Effective Promotional Tool,” Santella & Associates(http://www.santella.com/coupon.htm)
Consumer unaware item was on sale.51%
Consumer purchased because of sale price9%
Consumer would have purchased item anyway40%
© 2007 by Prentice Hall 10-38
Price-OffsProblems
• Increase sales, but decrease profits• 20% increase in sales to offset a 5%
price reduction• Consumers become more price
sensitive• 25% of consumers base purchase
decision on price• Competitive pressure to use price-offs
© 2007 by Prentice Hall 10-39
Price-OffsEffective Use
• Increase store traffic• Generate sales• Work best with higher markup items• Reasons for success
• Consumers view as monetary savings• Reward is immediate
© 2007 by Prentice Hall 10-40
Promotion Combinations
• Overlay• Intra-company tie-in• Inter-company tie-in
© 2007 by Prentice Hall 10-41
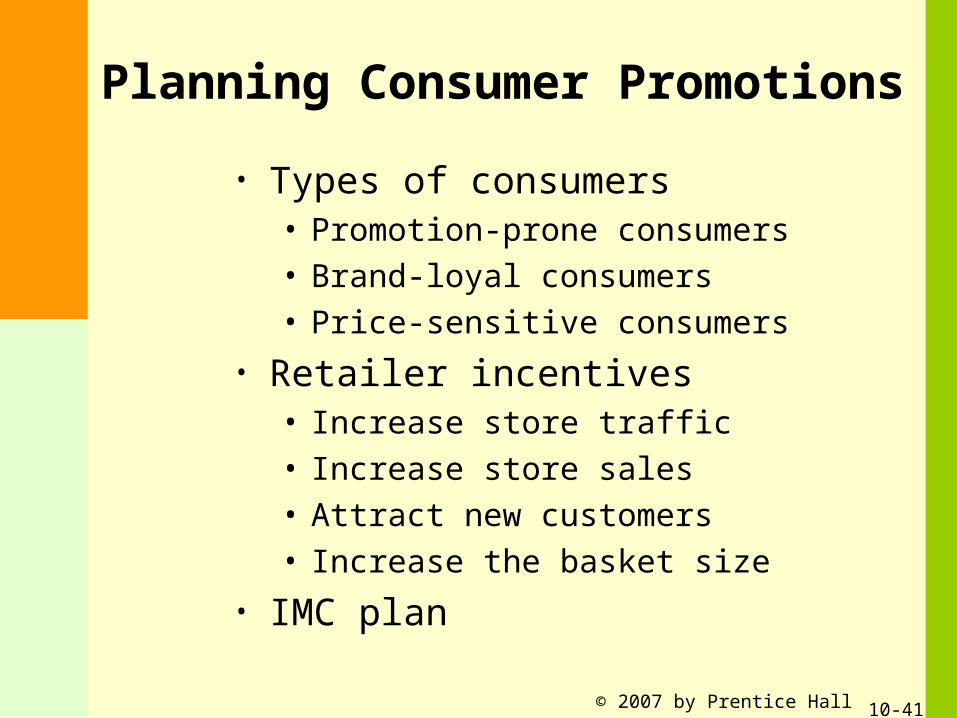
Planning Consumer Promotions
• Types of consumers• Promotion-prone consumers• Brand-loyal consumers• Price-sensitive consumers
• Retailer incentives• Increase store traffic• Increase store sales• Attract new customers• Increase the basket size
• IMC plan
© 2007 by Prentice Hall 10-42
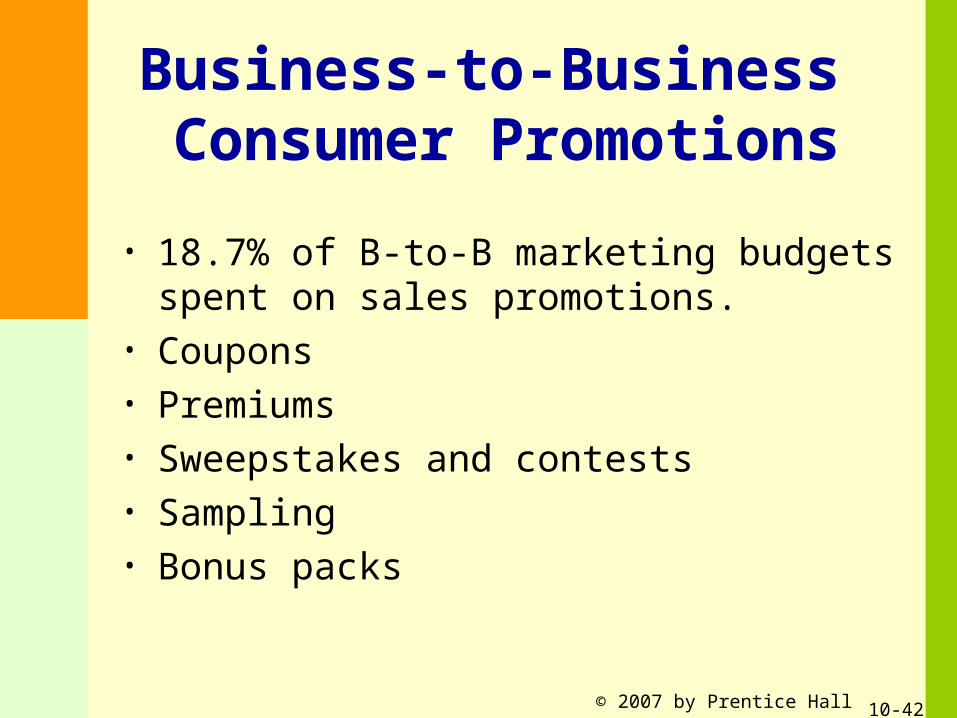
Business-to-Business Consumer Promotions
• 18.7% of B-to-B marketing budgets spent on sales promotions.
• Coupons• Premiums• Sweepstakes and contests• Sampling• Bonus packs
© 2007 by Prentice Hall 10-43
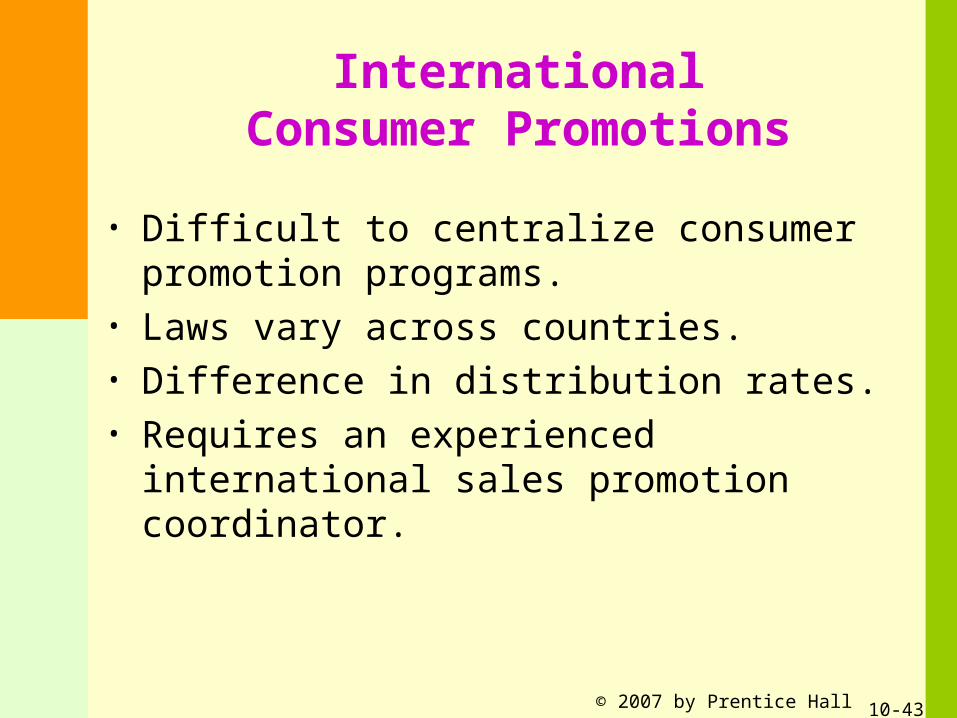
InternationalConsumer Promotions
• Difficult to centralize consumer promotion programs.
• Laws vary across countries.• Difference in distribution rates.• Requires an experienced international sales
promotion coordinator.
© 2007 by Prentice Hall 10-44
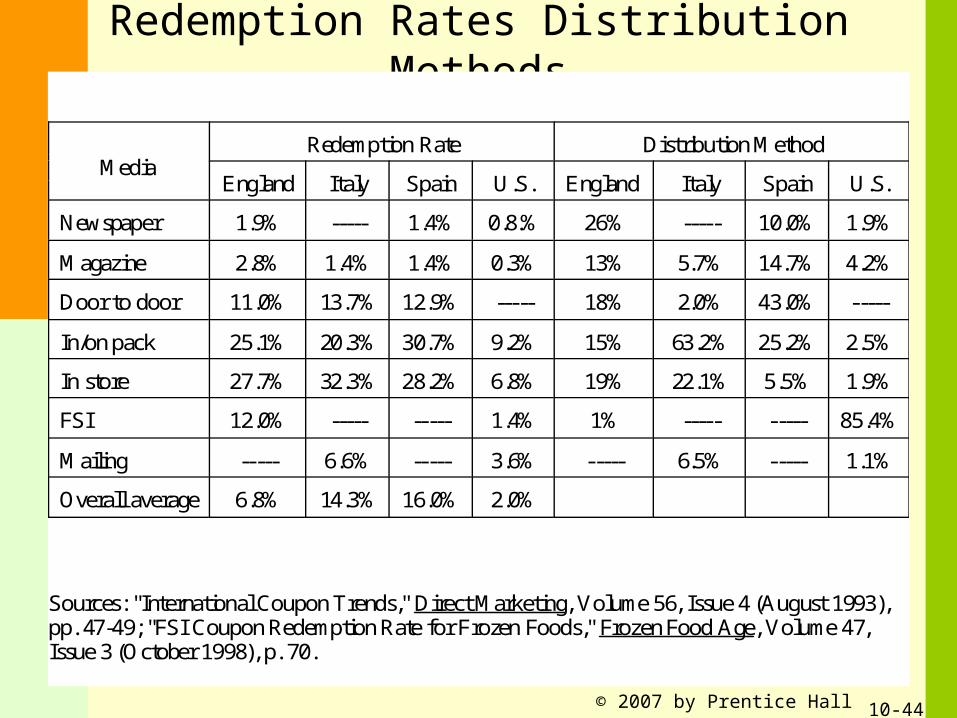
Redemption Rates Distribution Methods
Media Redemption Rate Distribution Method
England Italy Spain U.S. England Italy Spain U.S.
Newspaper 1.9% ----- 1.4% 0.8.% 26% ----- 10.0% 1.9%
Magazine 2.8% 1.4% 1.4% 0.3% 13% 5.7% 14.7% 4.2%
Door to door 11.0% 13.7% 12.9% ----- 18% 2.0% 43.0% -----
In/on pack 25.1% 20.3% 30.7% 9.2% 15% 63.2% 25.2% 2.5%
In store 27.7% 32.3% 28.2% 6.8% 19% 22.1% 5.5% 1.9%
FSI 12.0% ----- ----- 1.4% 1% ----- ----- 85.4%
Mailing ----- 6.6% ----- 3.6% ----- 6.5% ----- 1.1%
Overall average 6.8% 14.3% 16.0% 2.0%
Sources: "International Coupon Trends," Direct Marketing, Volume 56, Issue 4 (August 1993),pp. 47-49; "FSI Coupon Redemption Rate for Frozen Foods," Frozen Food Age, Volume 47,Issue 3 (October 1998), p. 70.