Embed Size (px)
Citation preview
© 2007 Thomson South-Western
11. THE TAX SYSTEM
© 2007 Thomson South-Western
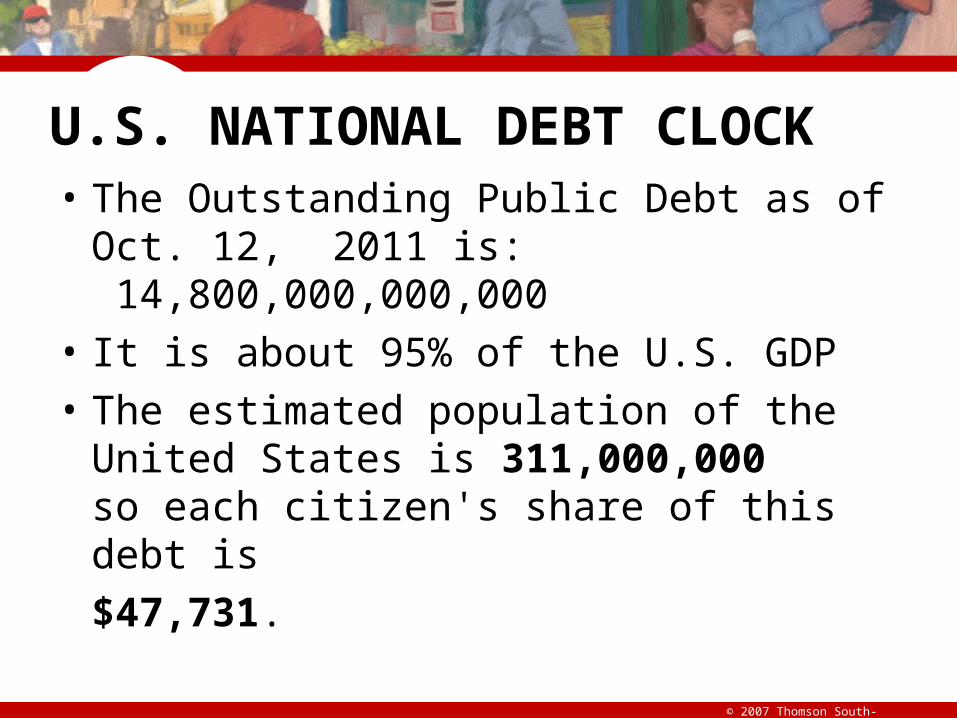
U.S. NATIONAL DEBT CLOCK• The Outstanding Public Debt as of Oct. 12,
2011 is: 14,800,000,000,000
• It is about 95% of the U.S. GDP
• The estimated population of the United States is 311,000,000so each citizen's share of this debt is
$47,731.
© 2007 Thomson South-Western
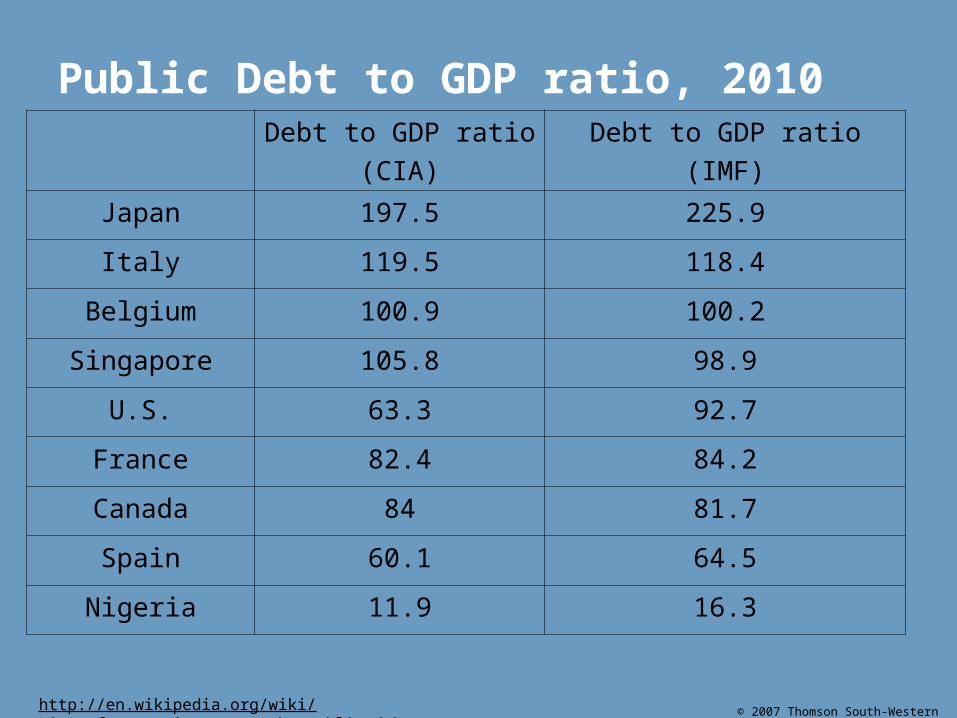
Public Debt to GDP ratio, 2010 Debt to GDP ratio
(CIA)
Debt to GDP ratio
(IMF)
Japan 197.5 225.9
Italy 119.5 118.4
Belgium 100.9 100.2
Singapore 105.8 98.9
U.S. 63.3 92.7
France 82.4 84.2
Canada 84 81.7
Spain 60.1 64.5
Nigeria 11.9 16.3
http://en.wikipedia.org/wiki/List_of_sovereign_states_by_public_debt
© 2007 Thomson South-Western
Difference between public debt and external debt
• Public debt: government’s liability including domestic and foreign ones
• External debt: foreign currency liability
• U.S. external debt = U.S. debt owned by foreign countries - dollar liability = ?
5
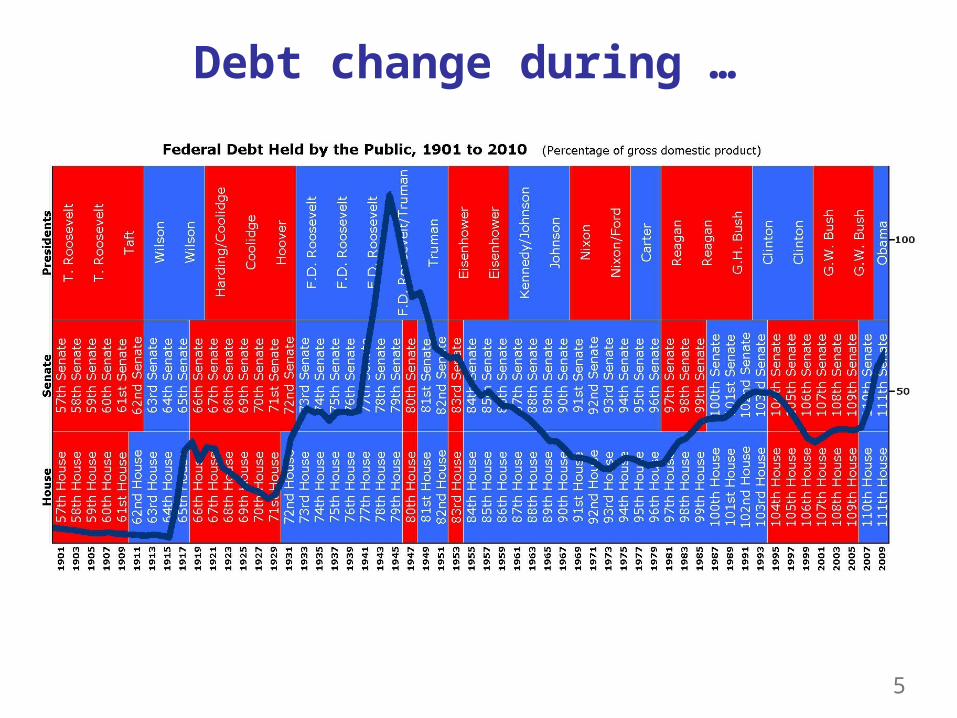
Debt change during …
© 2007 Thomson South-Western
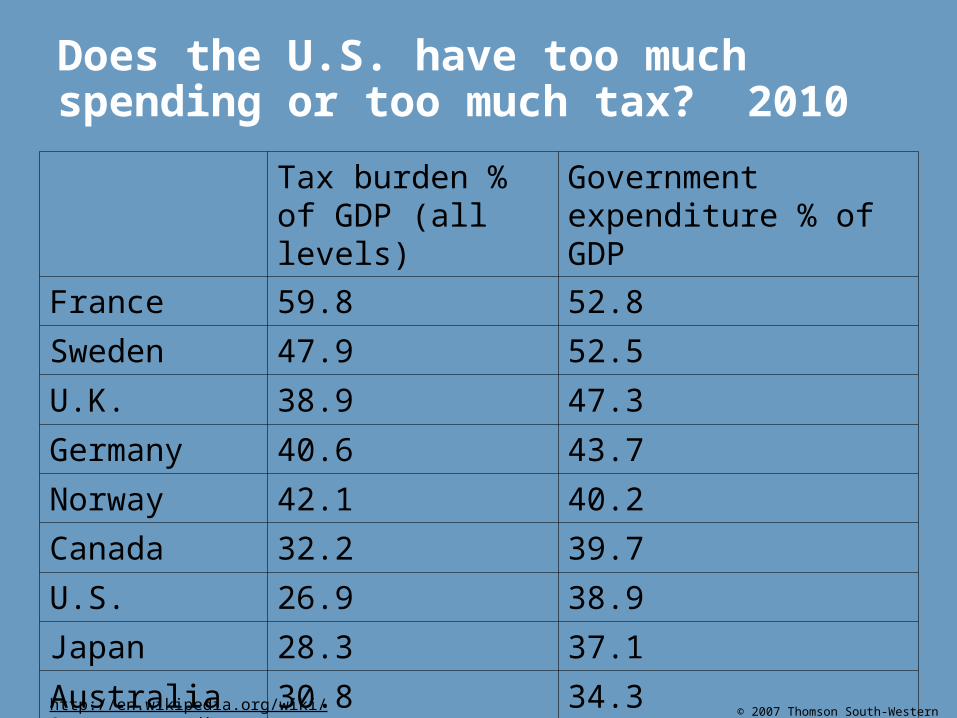
Does the U.S. have too much spending or too much tax? 2010
Tax burden % of GDP (all levels)
Government expenditure % of GDP
France 59.8 52.8
Sweden 47.9 52.5
U.K. 38.9 47.3
Germany 40.6 43.7
Norway 42.1 40.2
Canada 32.2 39.7
U.S. 26.9 38.9
Japan 28.3 37.1
Australia 30.8 34.3http://en.wikipedia.org/wiki/Government_spending
© 2007 Thomson South-Western
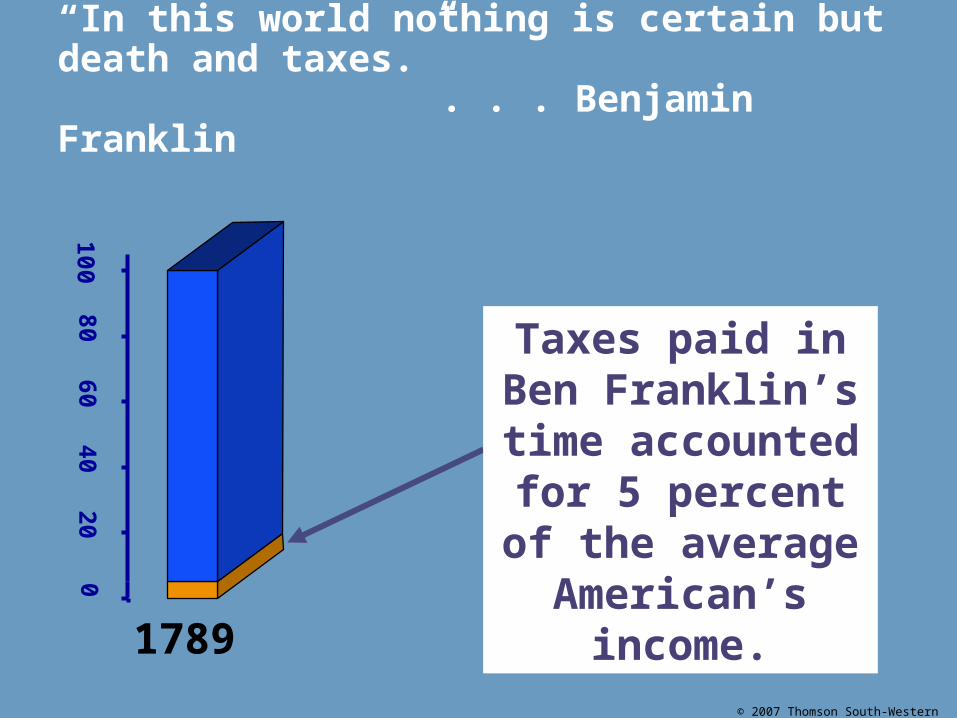
“In this world nothing is certain but death and taxes.”
. . . Benjamin Franklin
020
4060
80100
Taxes paid in Ben Franklin’s time accounted for 5 percent of the
average American’s
income.1789
© 2007 Thomson South-Western
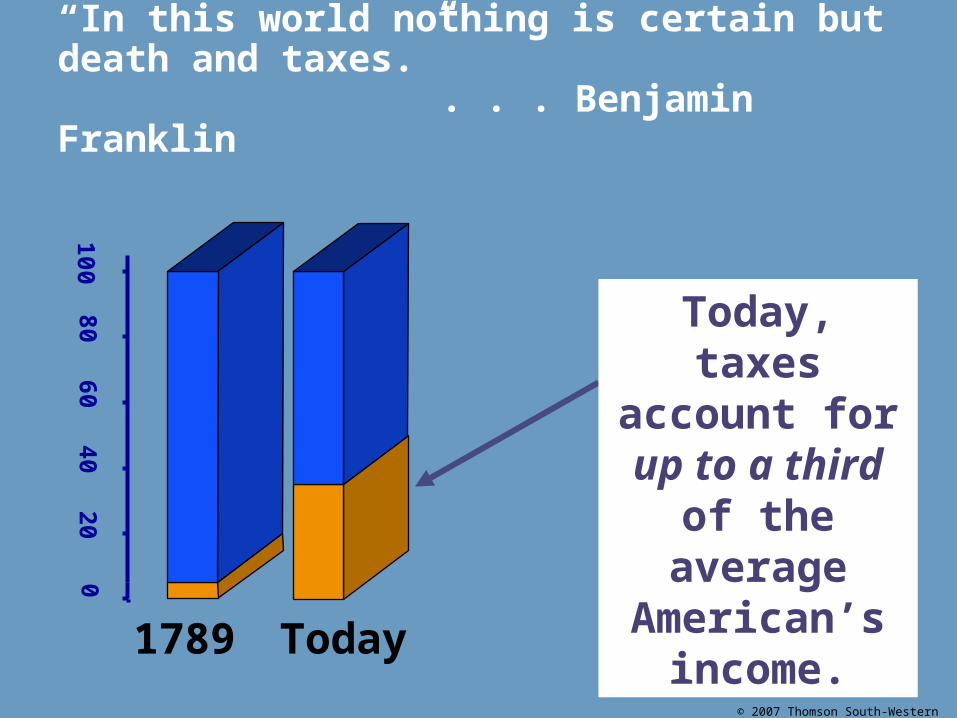
“In this world nothing is certain but death and taxes.”
. . . Benjamin Franklin
020
4060
80100
1789 Today
Today, taxes account for up
to a third of the average American’s
income.
© 2007 Thomson South-Western
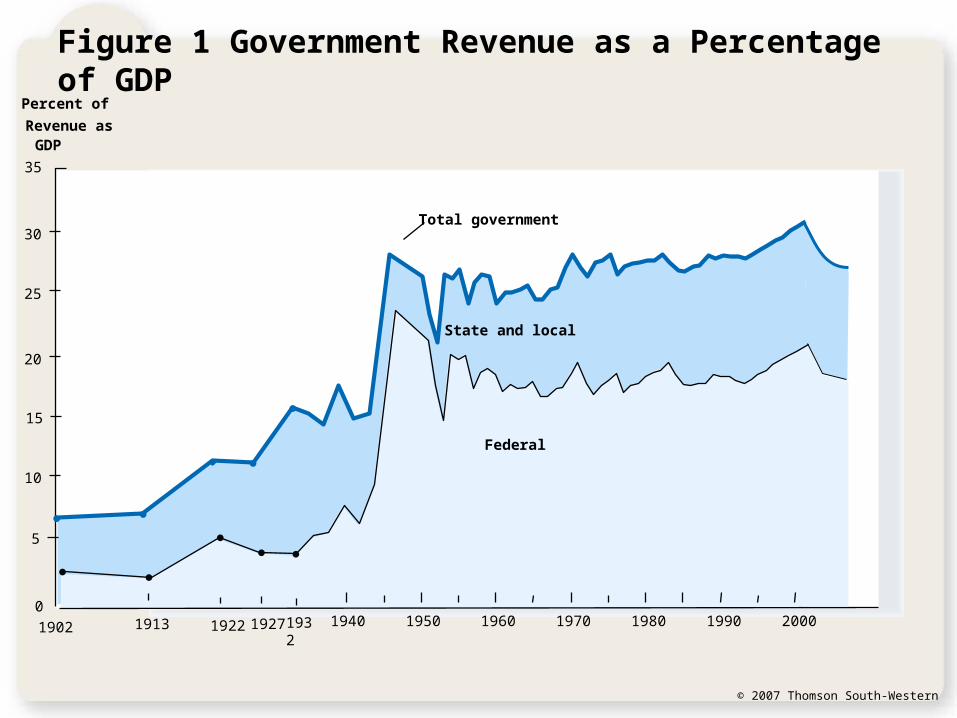
Figure 1 Government Revenue as a Percentage of GDP
State and local
Federal
0
Revenue as
Percent of
GDP
Total government
1902 1922 19271913 1932 1940 1970 1980 1990 20001950 1960
35
30
25
20
15
10
5
© 2007 Thomson South-Western
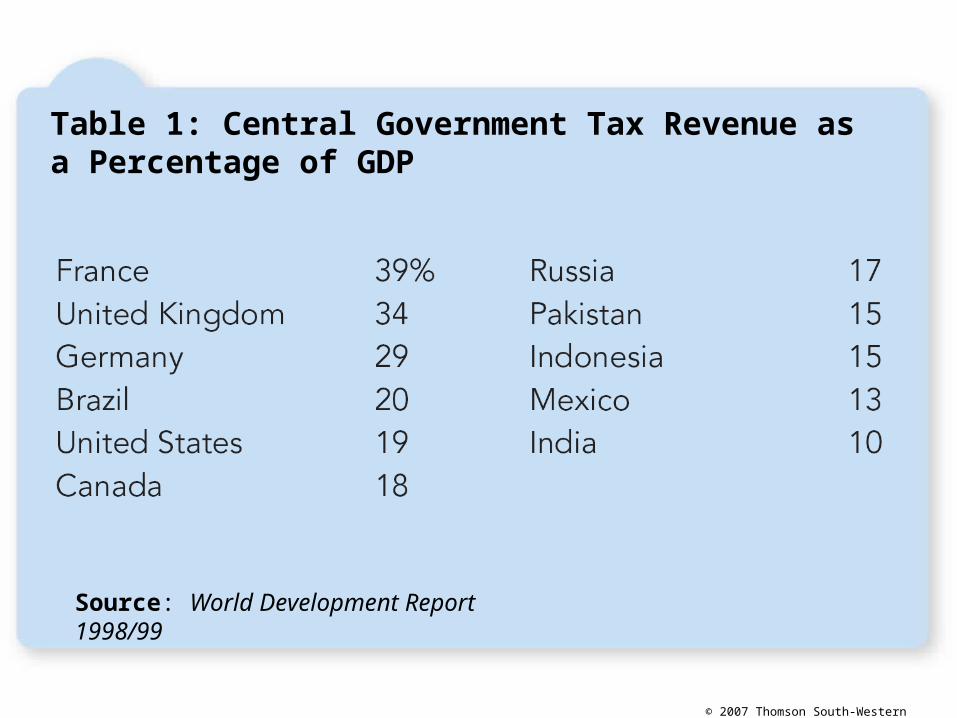
Table 1: Central Government Tax Revenue as a Percentage of GDP
Source: World Development Report 1998/99
© 2007 Thomson South-Western
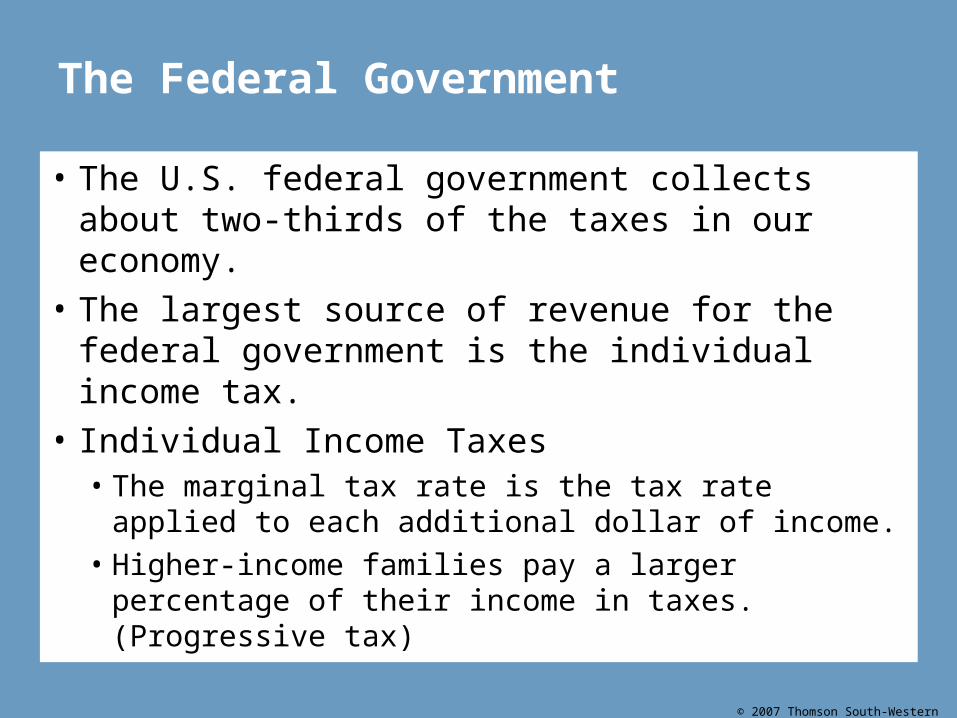
The Federal Government
• The U.S. federal government collects about two-thirds of the taxes in our economy.
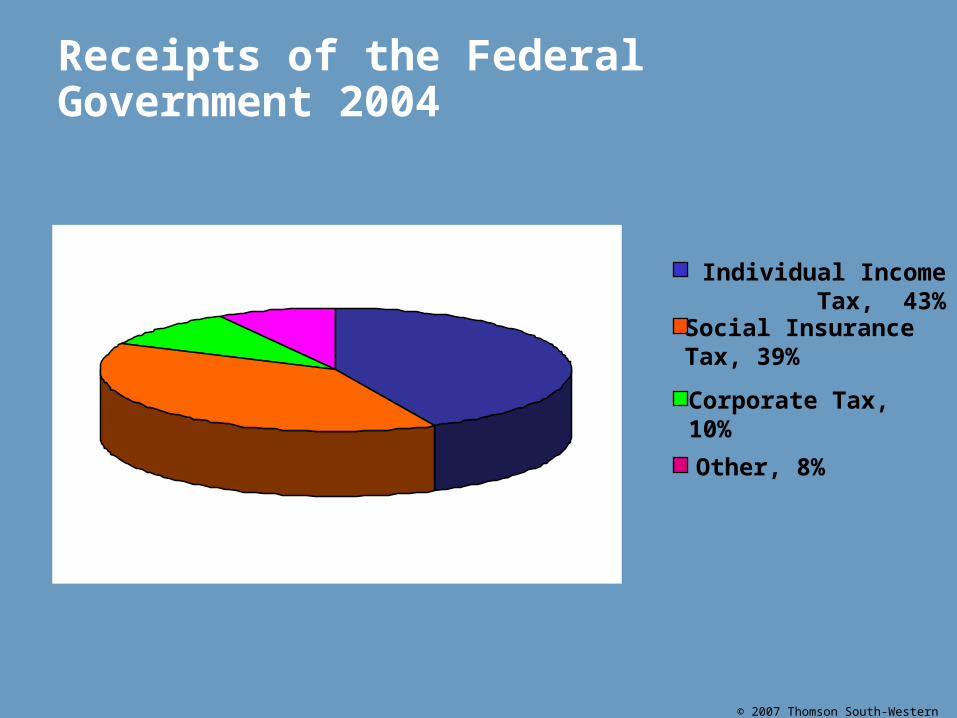
• The largest source of revenue for the federal government is the individual income tax.
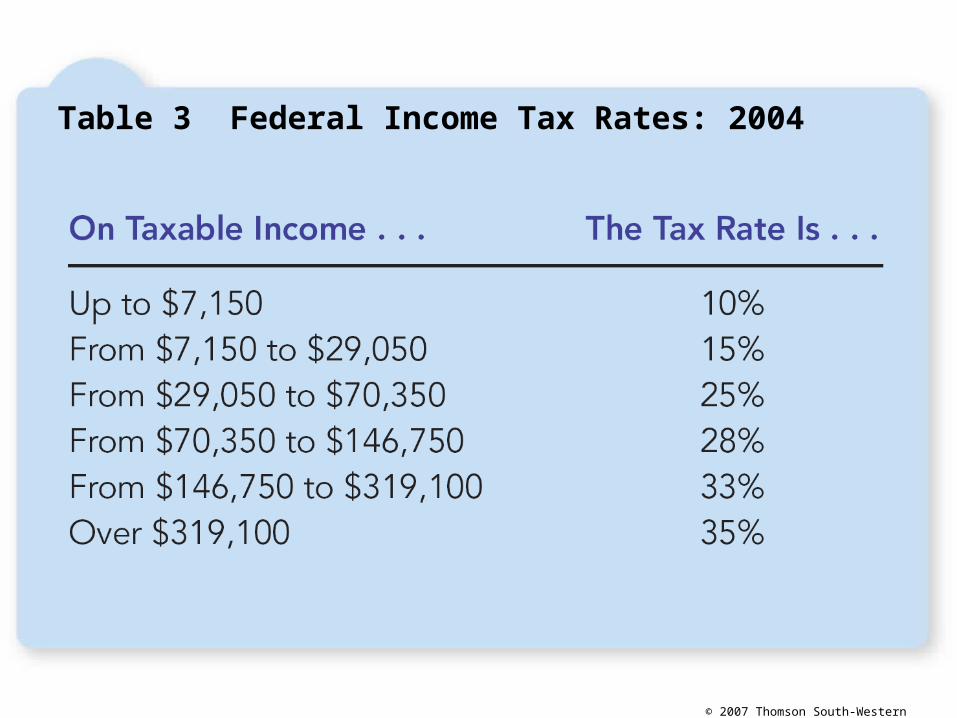
• Individual Income Taxes• The marginal tax rate is the tax rate applied to each
additional dollar of income.• Higher-income families pay a larger percentage of
their income in taxes. (Progressive tax)
© 2007 Thomson South-Western
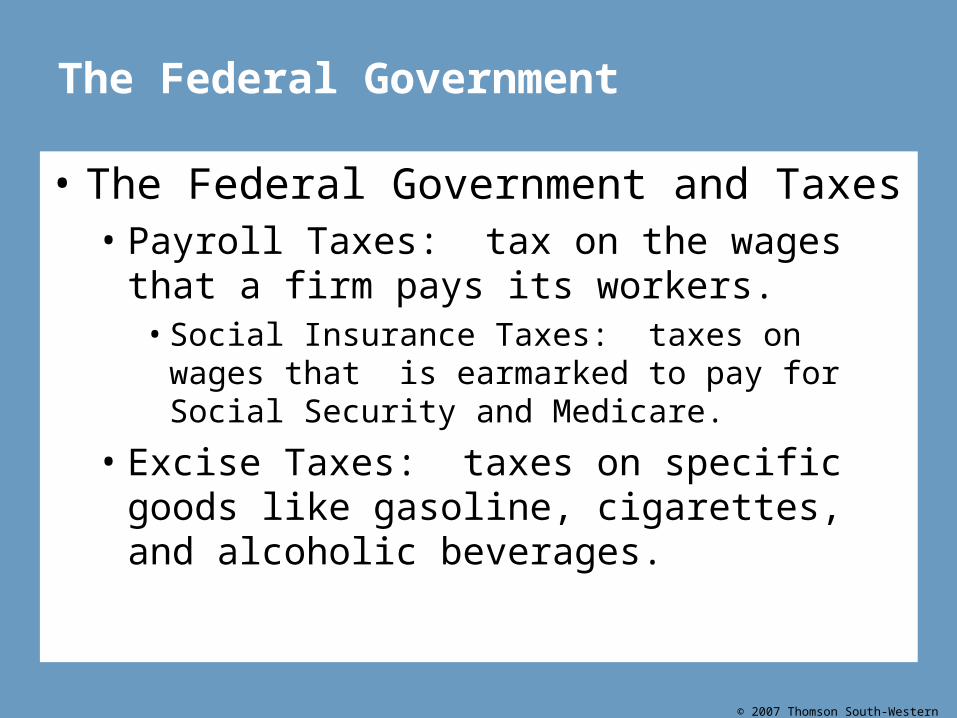
The Federal Government
• The Federal Government and Taxes • Payroll Taxes: tax on the wages that a firm pays its
workers.• Social Insurance Taxes: taxes on wages that is
earmarked to pay for Social Security and Medicare.
• Excise Taxes: taxes on specific goods like gasoline, cigarettes, and alcoholic beverages.
© 2007 Thomson South-Western
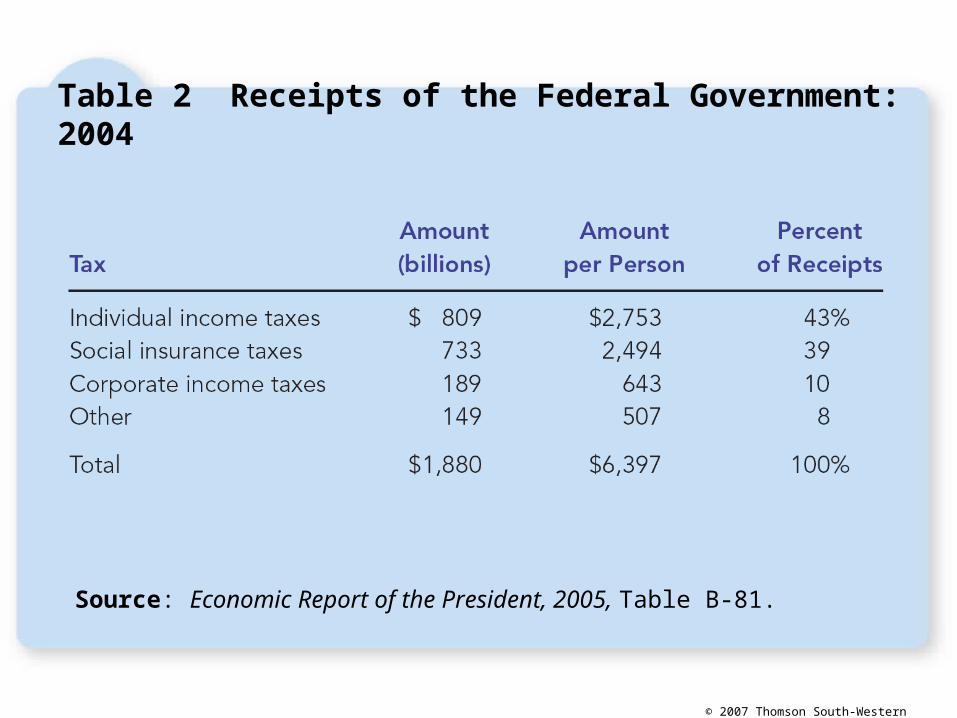
Source: Economic Report of the President, 2005, Table B-81.
Table 2 Receipts of the Federal Government: 2004
© 2007 Thomson South-Western
Receipts of the Federal Government 2004
Individual Income Tax, 43%
Social Insurance Tax, 39%
Corporate Tax, 10%
Other, 8%
© 2007 Thomson South-Western
Table 3 Federal Income Tax Rates: 2004
© 2007 Thomson South-Western
The Federal Government
• Federal Government Spending• Government spending includes transfer payments
and the purchase of public goods and services.• Transfer payments are government payments not made in
exchange for a good or a service.
• Transfer payments are the largest of the government’s expenditures.
© 2007 Thomson South-Western
The Federal Government
• Federal Government Spending• Expense Category:
• Social Security
• National Defense
• Income Security
• Net Interest
• Medicare
• Health
• Other
© 2007 Thomson South-Western
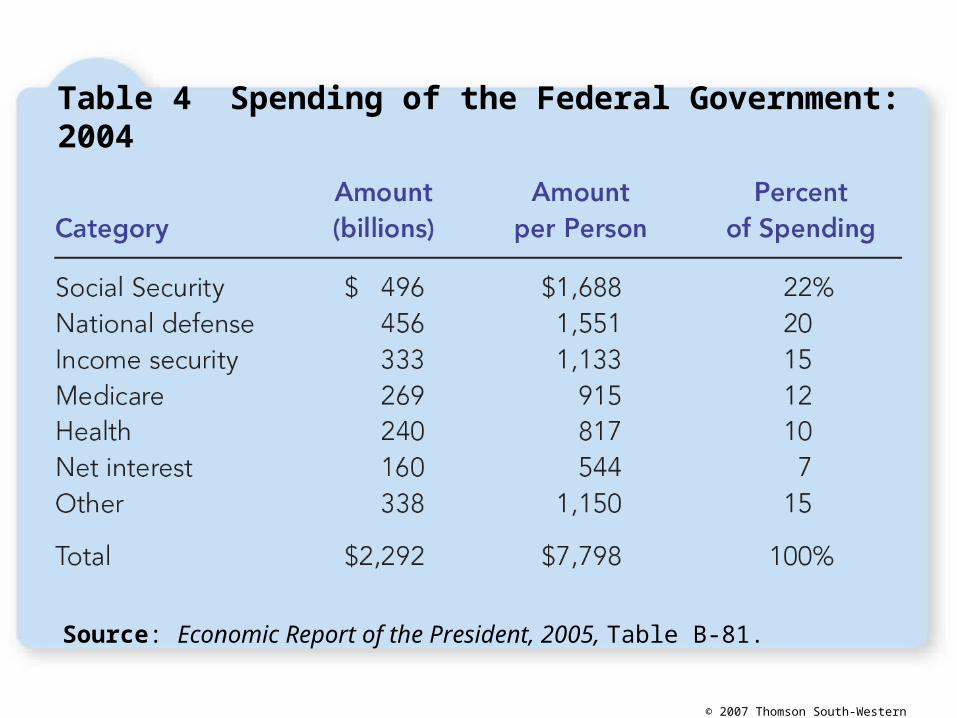
Table 4 Spending of the Federal Government: 2004
Source: Economic Report of the President, 2005, Table B-81.
© 2007 Thomson South-Western
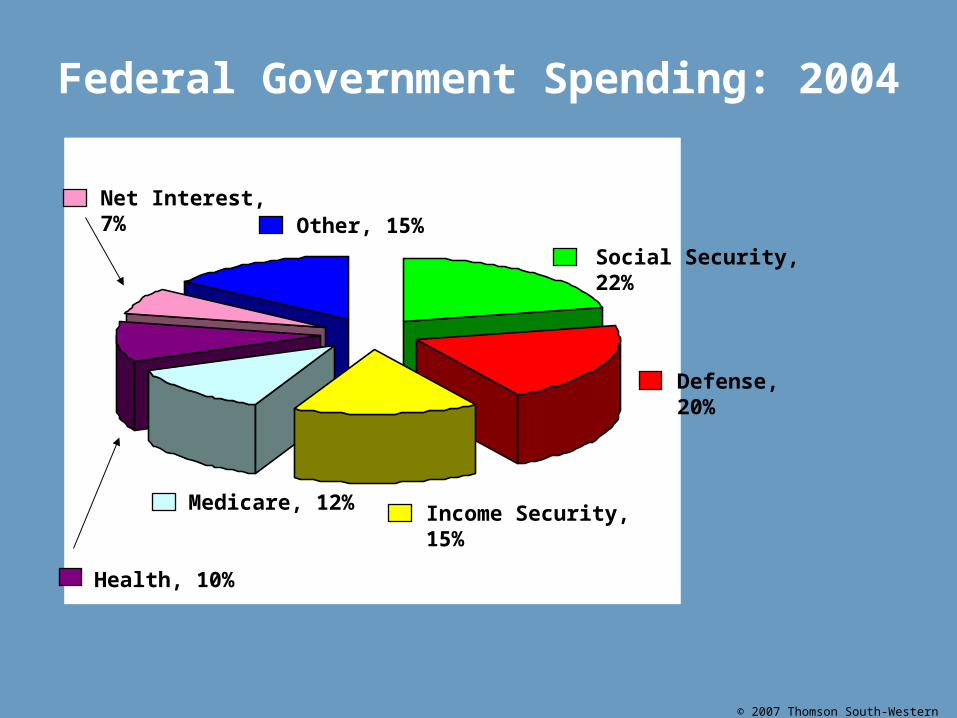
Federal Government Spending: 2004
Social Security, 22%
Defense, 20%
Income Security, 15%Medicare, 12%
Health, 10%
Net Interest, 7%Other, 15%
© 2007 Thomson South-Western
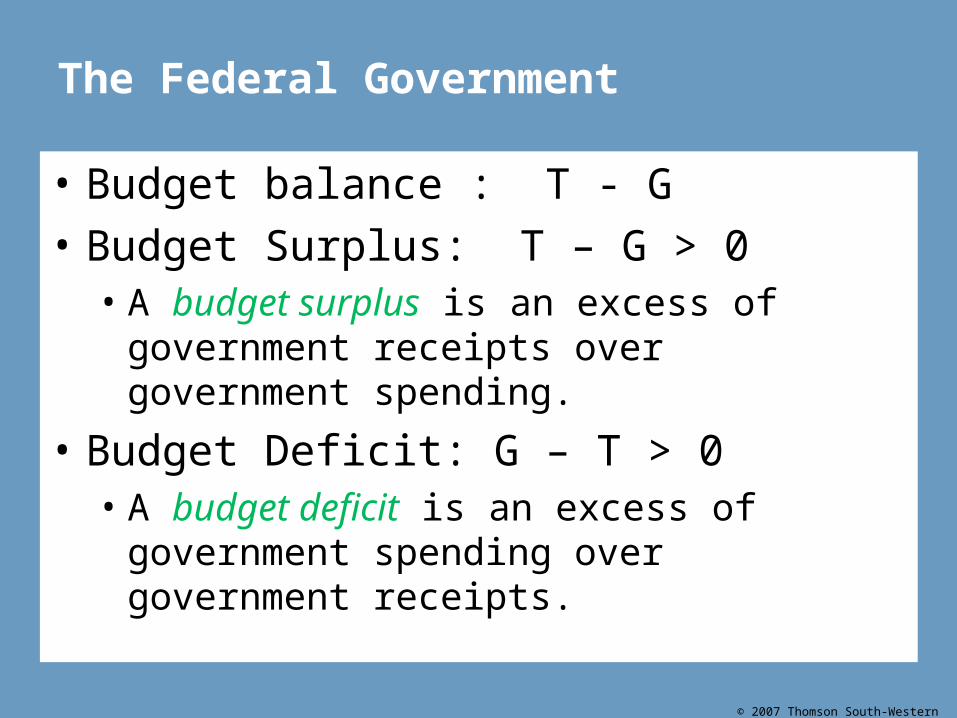
The Federal Government
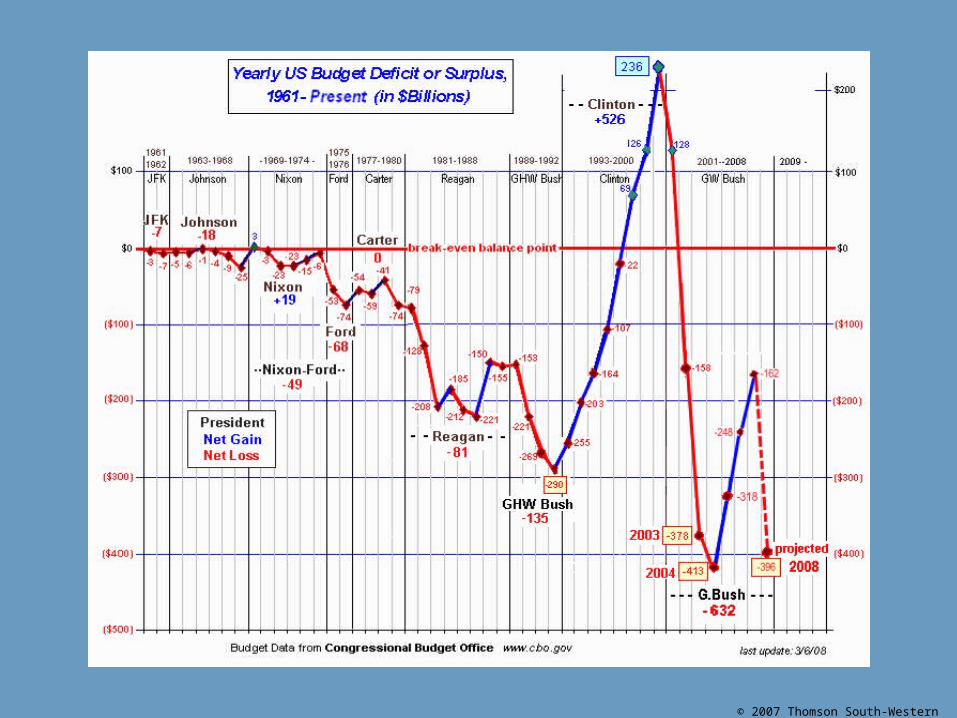
• Budget balance : T - G
• Budget Surplus: T – G > 0• A budget surplus is an excess of government
receipts over government spending.
• Budget Deficit: G – T > 0• A budget deficit is an excess of government
spending over government receipts.
© 2007 Thomson South-Western
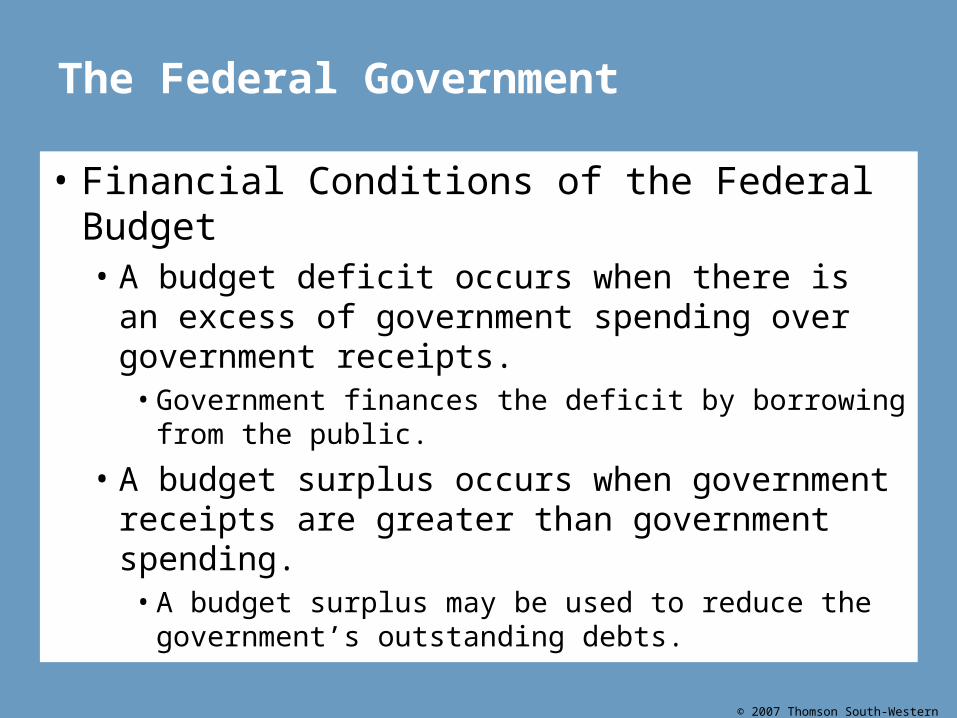
The Federal Government
• Financial Conditions of the Federal Budget• A budget deficit occurs when there is an excess of
government spending over government receipts.• Government finances the deficit by borrowing from the
public.
• A budget surplus occurs when government receipts are greater than government spending.
• A budget surplus may be used to reduce the government’s outstanding debts.
© 2007 Thomson South-Western
© 2007 Thomson South-Western
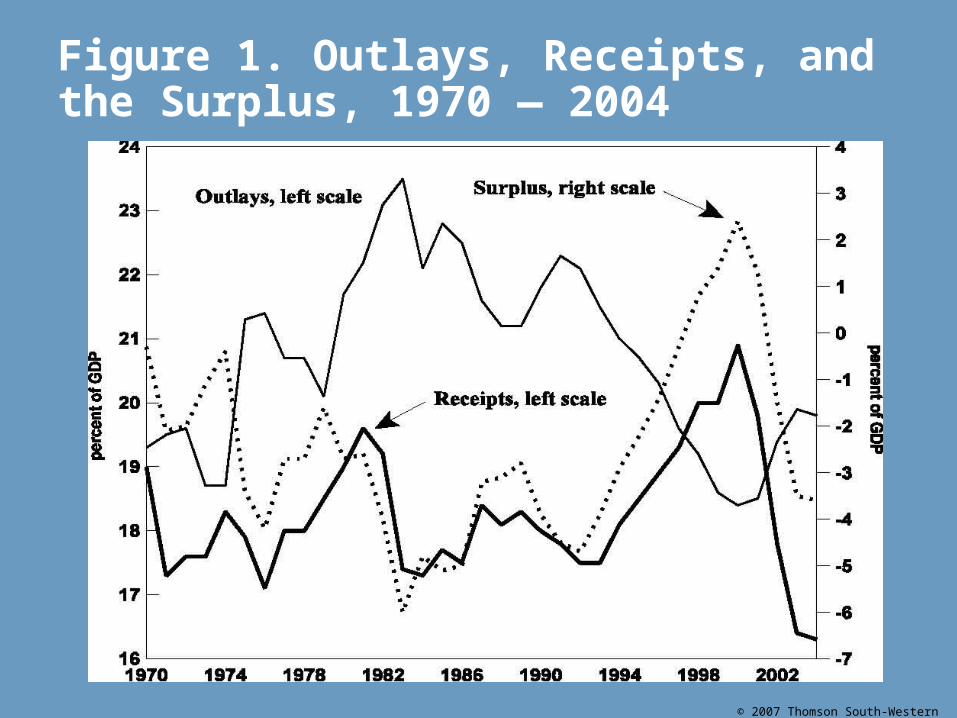
Figure 1. Outlays, Receipts, and the Surplus, 1970 — 2004
© 2007 Thomson South-Western
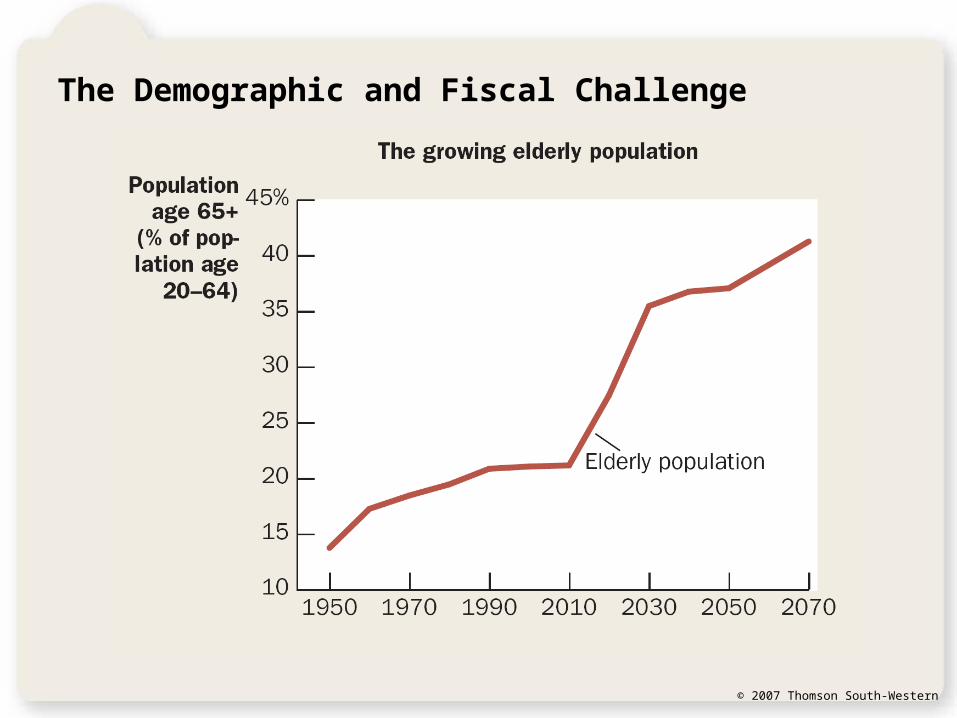
The Demographic and Fiscal Challenge
© 2007 Thomson South-Western
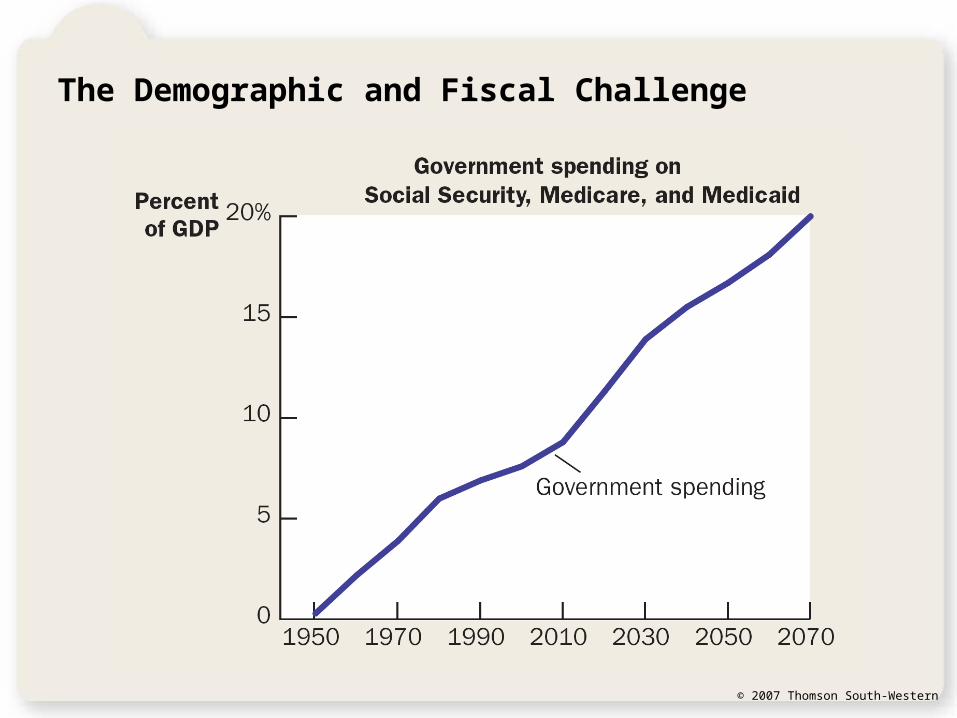
The Demographic and Fiscal Challenge
© 2007 Thomson South-Western
State and Local Government
• State and local governments collect about 40 percent of taxes paid.
© 2007 Thomson South-Western
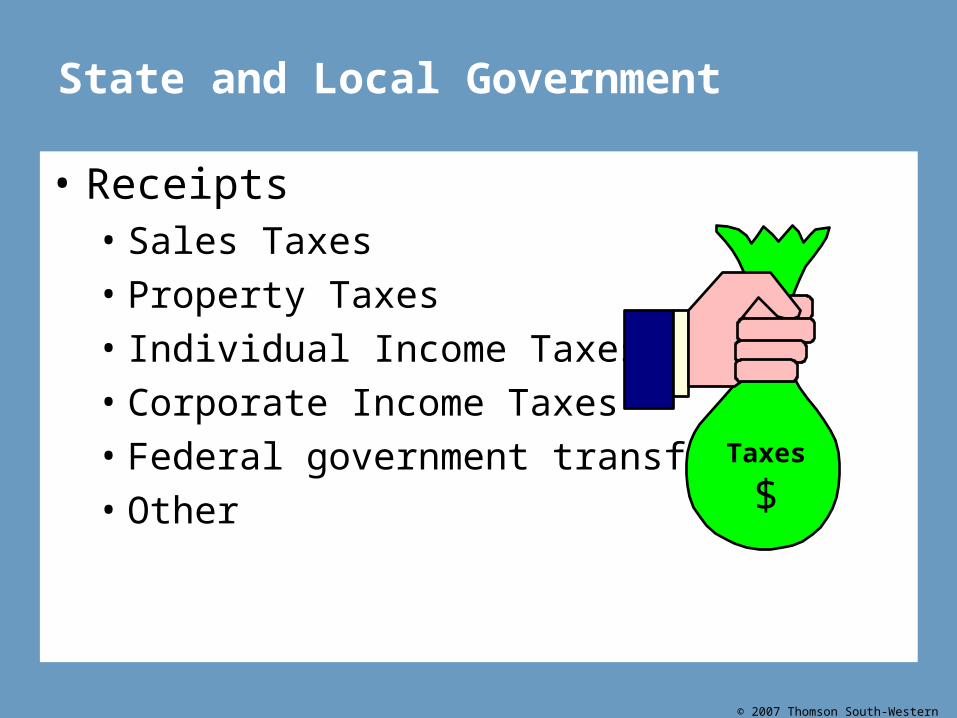
State and Local Government
• Receipts• Sales Taxes• Property Taxes• Individual Income Taxes• Corporate Income Taxes• Federal government transfer• Other
Taxes
$
© 2007 Thomson South-Western
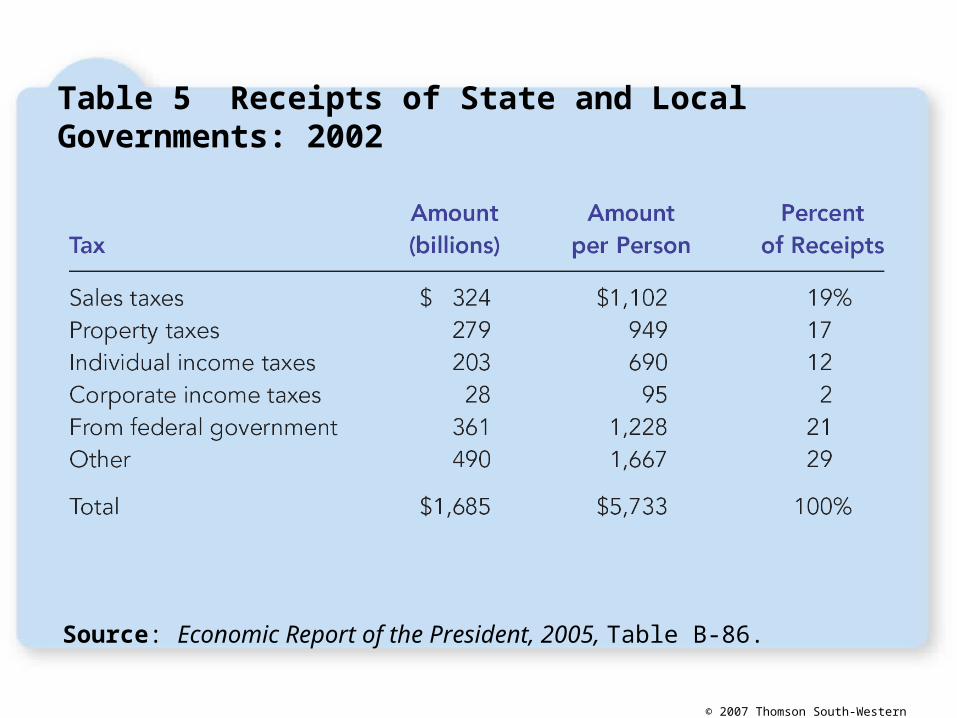
Source: Economic Report of the President, 2005, Table B-86.
Table 5 Receipts of State and Local Governments: 2002
© 2007 Thomson South-Western
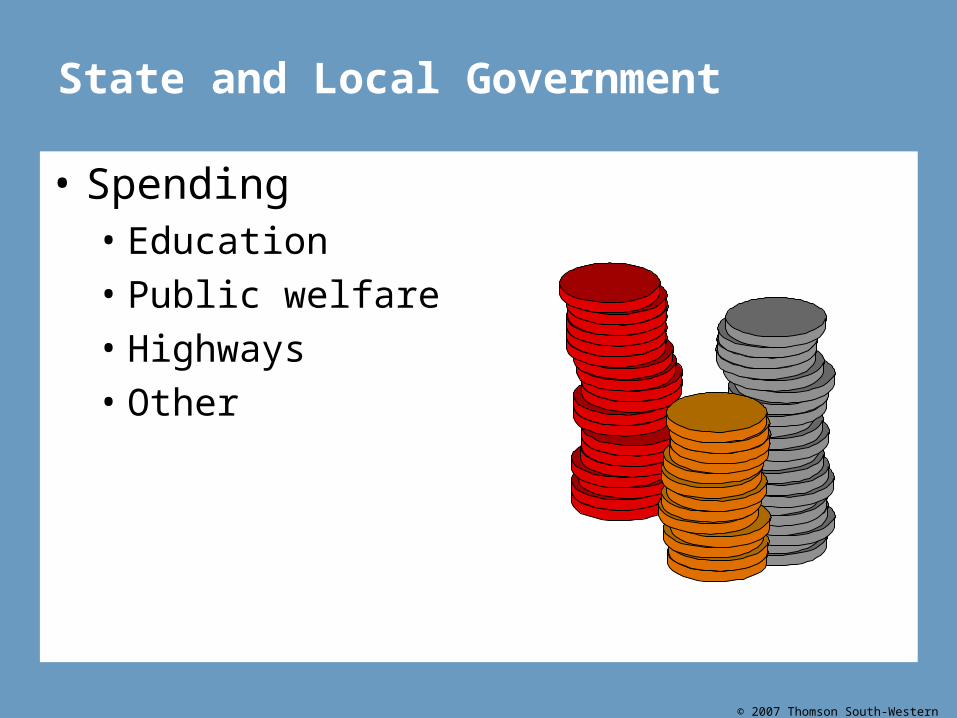
State and Local Government
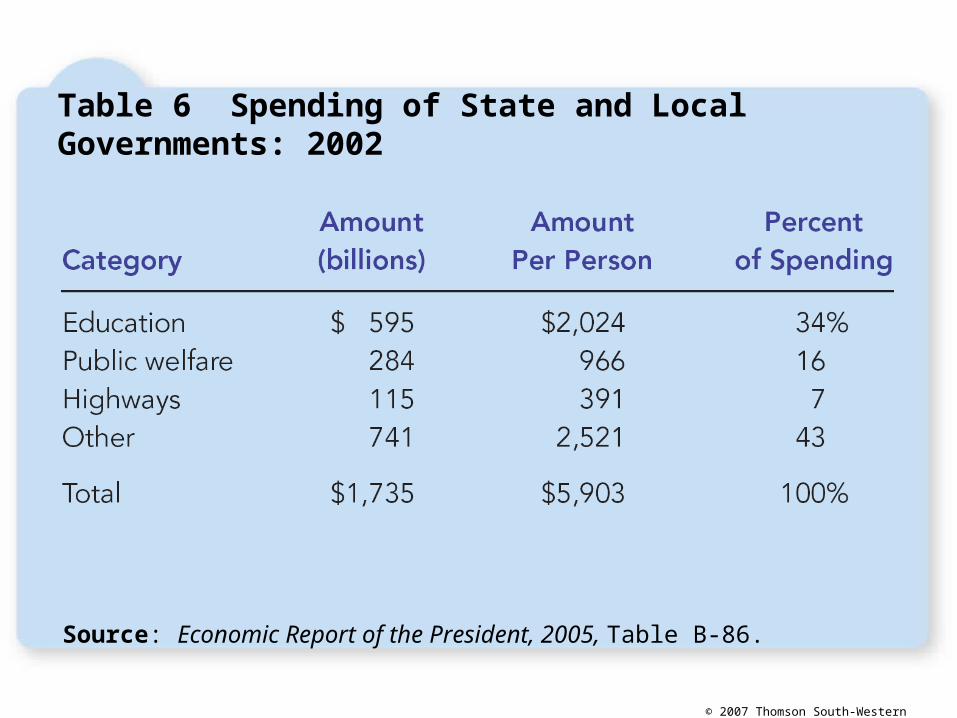
• Spending• Education• Public welfare• Highways• Other
© 2007 Thomson South-Western
Source: Economic Report of the President, 2005, Table B-86.
Table 6 Spending of State and Local Governments: 2002
© 2007 Thomson South-Western
TAXES AND EFFICIENCY• Policymakers have two objectives in designing
a tax system...– Efficiency – Equity
© 2007 Thomson South-Western
TAXES AND EFFICIENCY• One tax system is more efficient than another
if it raises the same amount of revenue at a smaller cost to taxpayers.
• An efficient tax system is one that imposes small deadweight losses and small administrative burdens.
© 2007 Thomson South-Western
TAXES AND EFFICIENCY • The Cost of Taxes to Taxpayers
– The tax payment itself– Deadweight losses– Administrative burdens
© 2007 Thomson South-Western
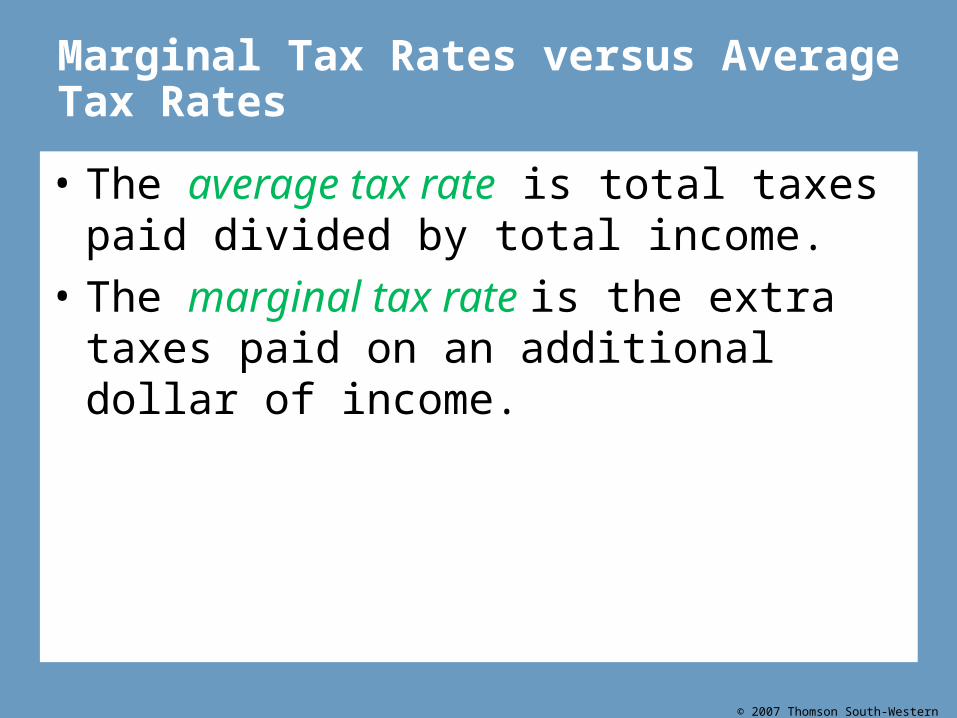
Marginal Tax Rates versus Average Tax Rates
• The average tax rate is total taxes paid divided by total income.
• The marginal tax rate is the extra taxes paid on an additional dollar of income.
© 2007 Thomson South-Western
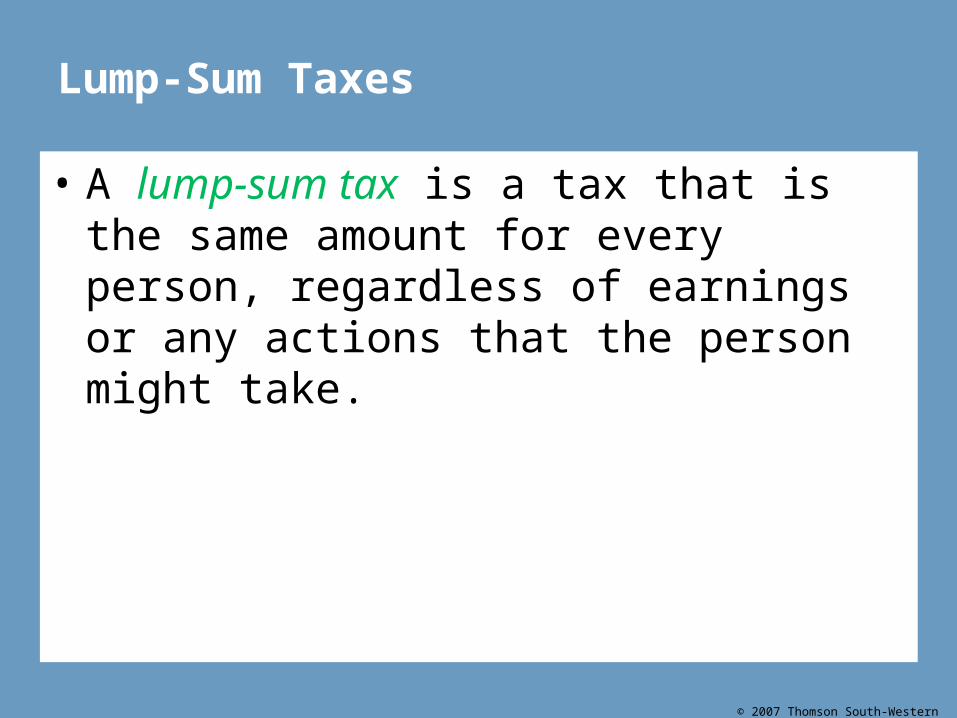
Lump-Sum Taxes
• A lump-sum tax is a tax that is the same amount for every person, regardless of earnings or any actions that the person might take.
© 2007 Thomson South-Western
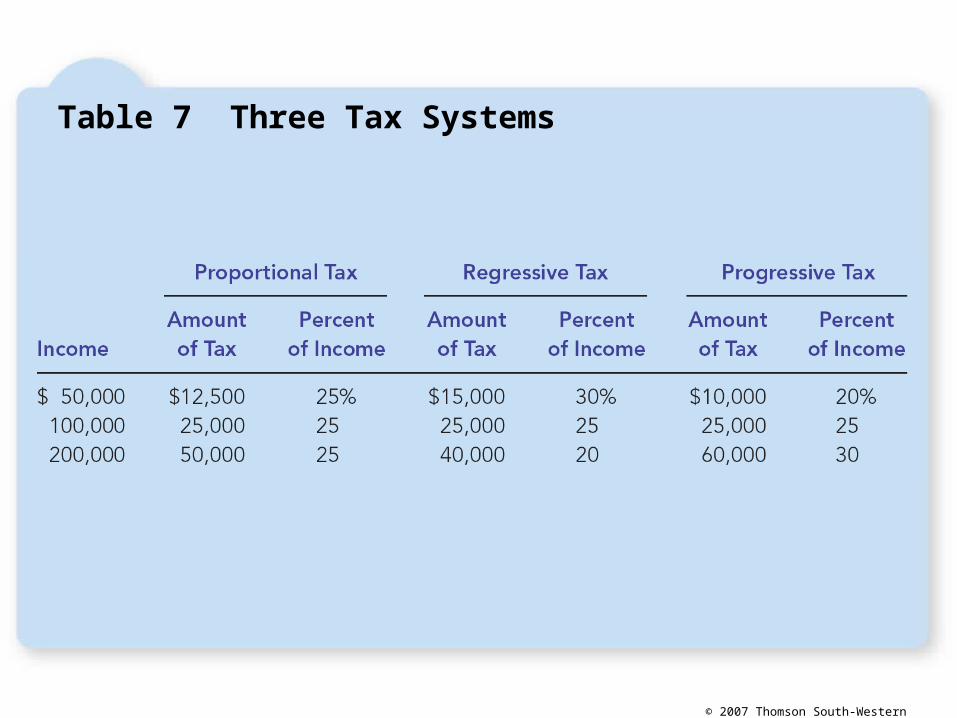
Table 7 Three Tax Systems
© 2007 Thomson South-Western
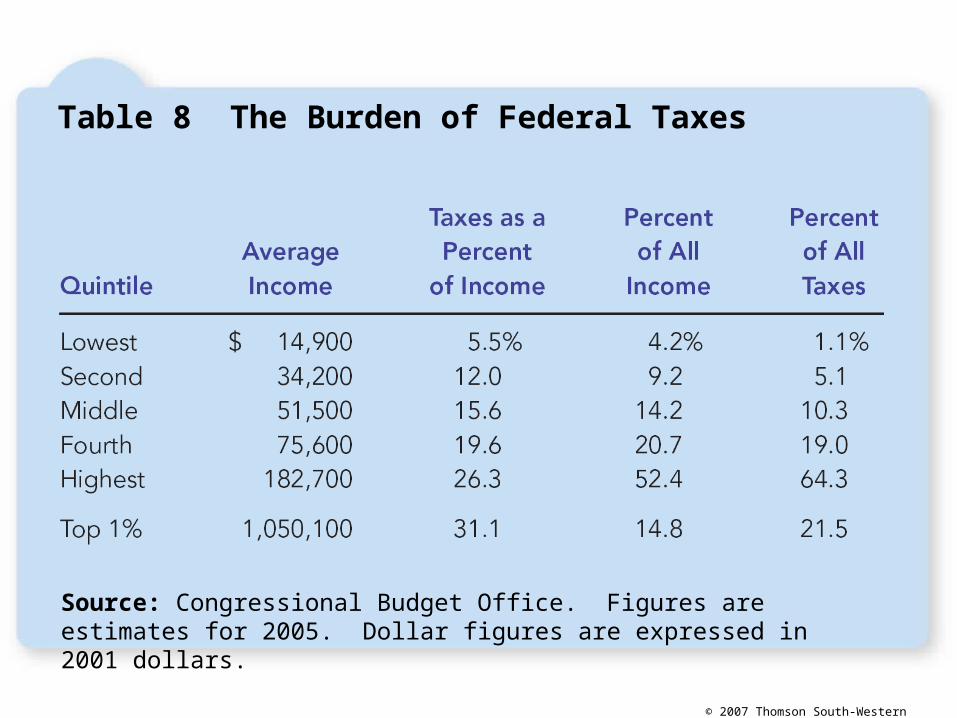
Source: Congressional Budget Office. Figures are estimates for 2005. Dollar figures are expressed in 2001 dollars.
Table 8 The Burden of Federal Taxes