Embed Size (px)
Citation preview

© 2008 Data Power Services, LLC By: Tom Taranto
2010 Energy ExpoHosted by
National GridNYSERDA
Reducing Compressed Air
Energy Cost
Using a Systems Approach
Tom Taranto
© 2008 Data Power Services, LLC By: Tom Taranto
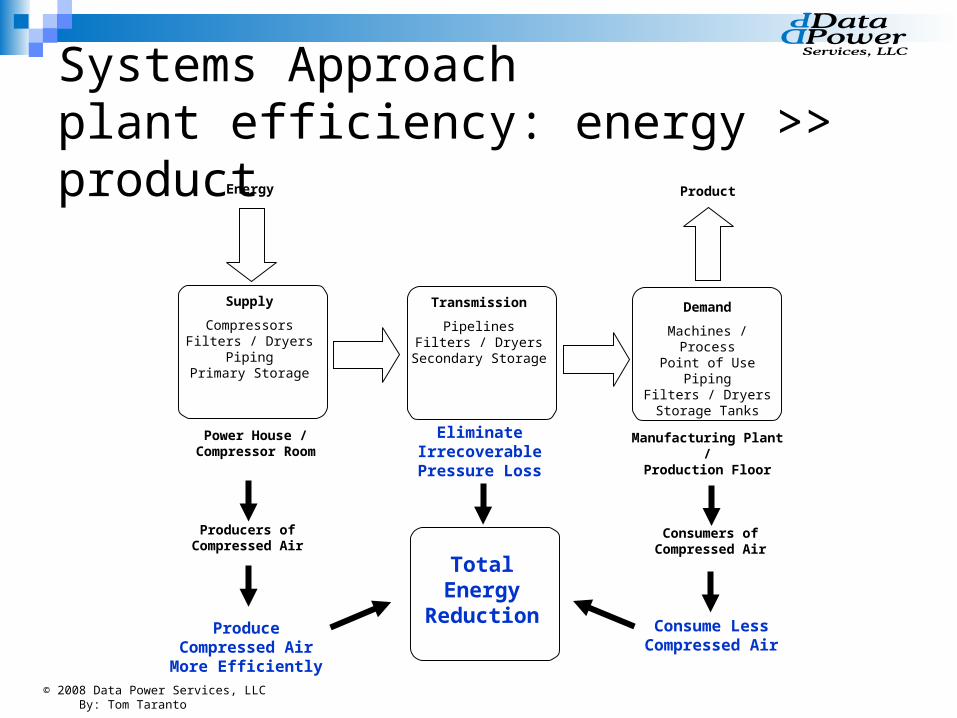
Systems Approach plant efficiency: energy >> product
Supply
CompressorsFilters / Dryers
PipingPrimary Storage
Transmission
PipelinesFilters / Dryers
Secondary Storage
Demand
Machines / ProcessPoint of Use Piping
Filters / DryersStorage Tanks
Energy Product
Power House / Compressor Room
Manufacturing Plant /Production Floor
Producers of Compressed Air
Consumers of Compressed Air
Produce Compressed Air More Efficiently
Consume Less Compressed Air
TotalEnergy
Reduction
Eliminate Irrecoverable
Pressure Loss

© 2008 Data Power Services, LLC By: Tom Taranto
Systems Approach cost of ownership
Equipment cost and maintenance cost represent only a small part of the total cost of operating a compressed air system.
Electrical cost usually exceeds 75% of the total operating expense.
Source: Compressed Air Challenge®
© 2008 Data Power Services, LLC By: Tom Taranto
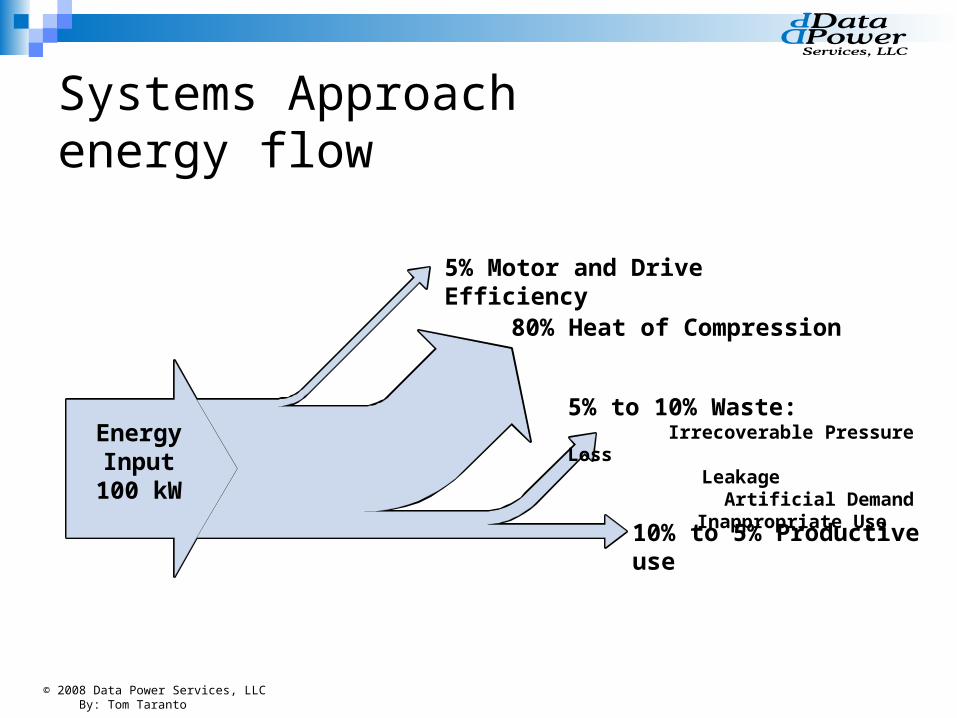
Systems Approach energy flow
Energy Input
100 kW
5% Motor and Drive Efficiency
80% Heat of Compression
5% to 10% Waste: Irrecoverable Pressure Loss Leakage Artificial Demand
Inappropriate Use
10% to 5% Productive use

© 2008 Data Power Services, LLC By: Tom Taranto
Systems Approach demand side energy reduction
50 % Productive Demand
5% Excessive Pressure
10% Inappropriate Use
15% Artificial Demand
20% Leakage Loss

© 2008 Data Power Services, LLC By: Tom Taranto
Reduce Air Demand
Improve Compressor
Control
Systems Approach
Reduce Air Demand
Reduce System Pressure
Improve Compressor Control

© 2008 Data Power Services, LLC By: Tom Taranto
Reducing Compressed Air Energy CostUsing a Systems Approach
Compressed Air Efficiency Services

© 2008 Data Power Services, LLC By: Tom Taranto
Assessment of the Market for Compressed Air Efficiency Services

© 2008 Data Power Services, LLC By: Tom Taranto
Assessment of the Market for Compressed Air Efficiency Services
Office of Industrial Technologies (2001) Office of Energy Efficiency and Renewable
Energy - U.S. Dept. of Energy Oak Ridge National Labs Motor Market
Assessment by XENERGY (1998) Pacific Gas & Electric “Compressed Air Market
Transformation Program” (1999)
© 2008 Data Power Services, LLC By: Tom Taranto
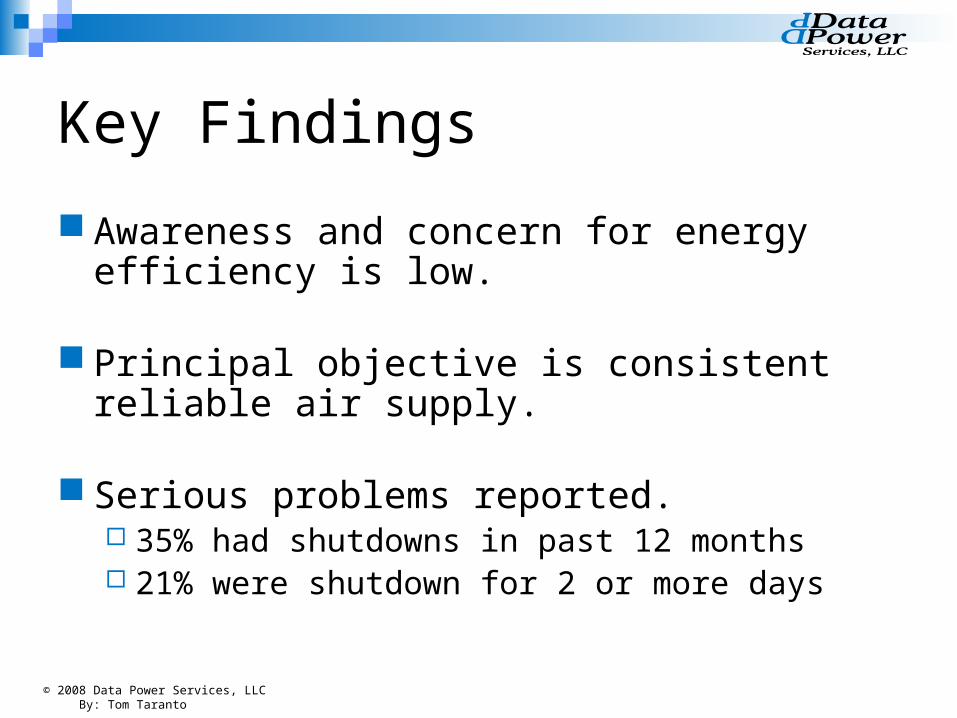
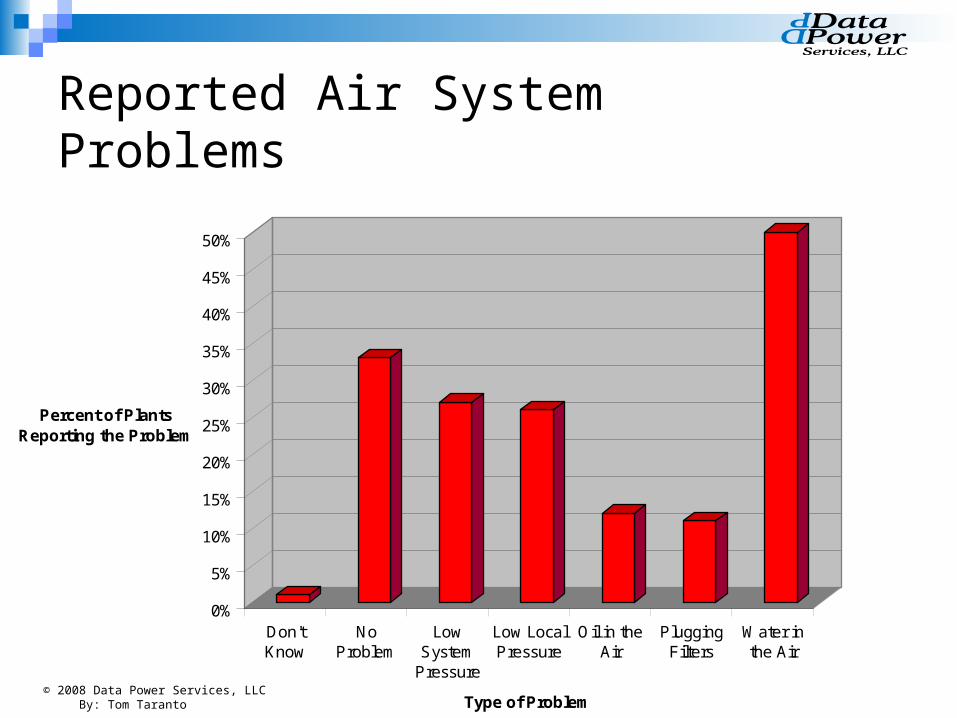
Key Findings
Awareness and concern for energy efficiency is low.
Principal objective is consistent reliable air supply.
Serious problems reported. 35% had shutdowns in past 12 months 21% were shutdown for 2 or more days
© 2008 Data Power Services, LLC By: Tom Taranto
0%
5%
10%
15%
20%
25%
30%
35%
40%
45%
50%
Percent of PlantsReporting the Problem
Don'tKnow
NoProblem
LowSystem
Pressure
Low LocalPressure
Oil in theAir
PluggingFilters
Water inthe Air
Type of Problem
Reported Air SystemProblems

© 2008 Data Power Services, LLC By: Tom Taranto
Summary
71% Consistent, Reliable Performance - primary objective.
Only 17% “mentioned” efficiency.
35% Have had serious problems this yr.
Apply the Systems Approach

© 2008 Data Power Services, LLC By: Tom Taranto
Reducing Compressed Air Energy CostUsing a Systems Approach
Identify Opportunities
© 2008 Data Power Services, LLC By: Tom Taranto
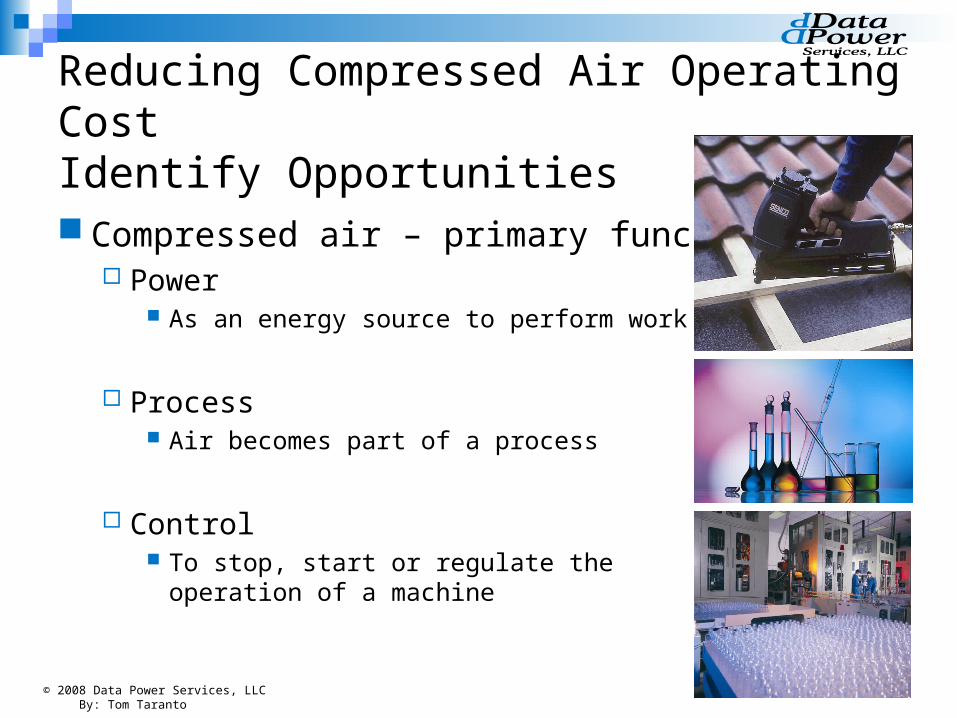
Reducing Compressed Air Operating CostIdentify Opportunities
Compressed air – primary functions Power
As an energy source to perform work
Process Air becomes part of a process
Control To stop, start or regulate the
operation of a machine
© 2008 Data Power Services, LLC By: Tom Taranto
Identify Opportunities highest priority
Reliability of the Production Process Deliver Energy to Production
Stakeholder’s needs Reliable production – no production outages Maintain product quality – minimum scrap and rework
Little energy concern if production is affected

© 2008 Data Power Services, LLC By: Tom Taranto
Identify Opportunities sustainable energy savings
Comprehensive solutions Improve critical production end use applications Eliminate irrecoverable pressure loss Provide compressed air energy storage Optimize compressor control
Solutions must be long term and reliable If production is interrupted the energy efficient solution will be
abandoned in favor of the previous more energy intensive operation.
Improving Performance Reducing Energy

© 2008 Data Power Services, LLC By: Tom Taranto
Reducing Compressed Air Energy CostUsing a Systems Approach
Improve PerformanceFix LeaksReduce System Pressure

© 2008 Data Power Services, LLC By: Tom Taranto
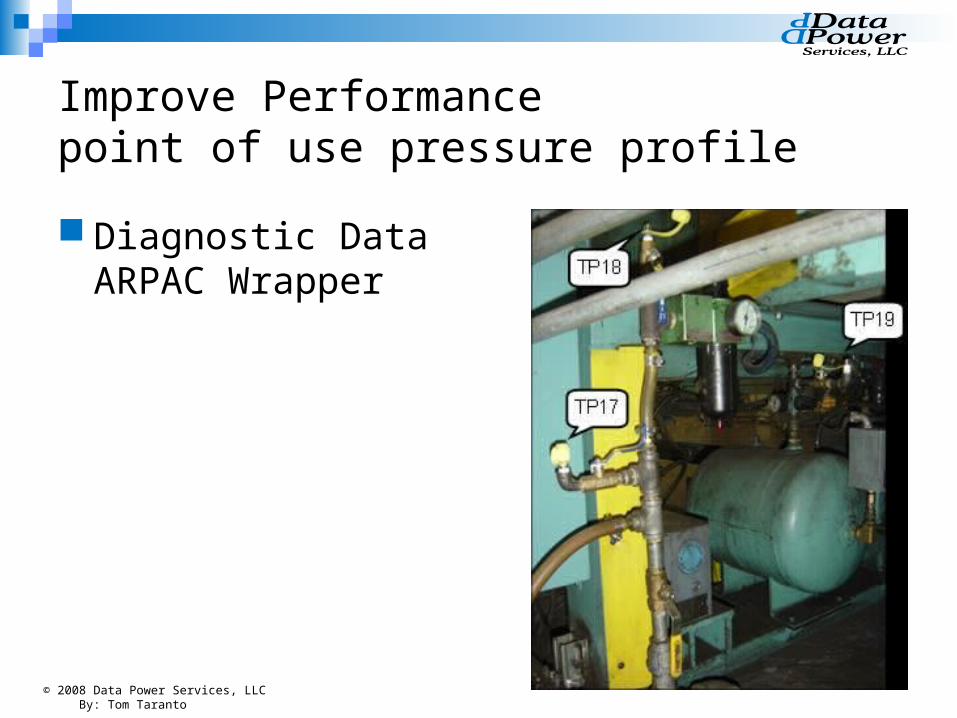
Improve Performancepoint of use pressure profile
Test Machine Flow Dynamic Demand What’s Wrong With This Picture?

© 2008 Data Power Services, LLC By: Tom Taranto
Improve Performancepoint of use pressure profile
Validate Perceived High Pressure Pressure Gauges – Mechanical Damping
Air System AuditPoint of Use (P5) Pressure @ Test Machine
74
79
84
89
94
99
104
11:05 11:10 11:15 11:20 11:25 11:30
Time of Day 11/13/92
Ave
rag
e P
ress
ure
(P
SIG
)
P3 Pressure P4 @ Test Area Average P5 Minimum P5

© 2008 Data Power Services, LLC By: Tom Taranto
Improve Performancepoint of use pressure profile
Air System AuditDamper Cylinder Performance
0
10
20
30
40
50
60
70
80
90
18:0
4:48
18:0
4:53
18:0
4:59
18:0
5:05
18:0
5:10
18:1
4:48
18:1
4:54
18:1
5:01
18:1
5:08
Pre
ssu
re (
PS
IG)
Rod End Cap End9/14/94
© 2008 Data Power Services, LLC By: Tom Taranto
Improve Performancepoint of use pressure profile
Diagnostic DataARPAC Wrapper

© 2008 Data Power Services, LLC By: Tom Taranto
Improve Performancepoint of use pressure profile
Diagnostic Data - ARPAC Wrapper

© 2008 Data Power Services, LLC By: Tom Taranto
Improve Performanceeliminate artificial demand
15% Artificial Demand Applying Pressure (PSIG) to an Orifice will
Increase Flow Rate (SCFM)

© 2008 Data Power Services, LLC By: Tom Taranto
Annual Cost of Compressed Air Leaks @ 100 PSIG
Hole Diameter
Leak Rate SCFM
Annual Air Waste MMcf
Cost @ $293 / MMcf
Cost @ $463 / MMcf
1/32" 0.99 0.48 MMcf $139 $220
1/16" 3.96 1.90 MMcf $557 $880
3/32" 8.91 4.28 MMcf $1,253 $1,981
1/8" 15.84 7.61 MMcf $2,228 $3,521
5/32" 24.76 11.88 MMcf $3,482 $5,502
3/16" 35.65 17.11 MMcf $5,014 $7,923
7/32" 48.52 23.29 MMcf $6,824 $10,784
1/4" 63.38 30.42 MMcf $8,913 $14,085
Coeff. = 0.61 @ 100 PSIG 8000 Hours / Year Operation
Annual Cost of Compressed Air Leaks @ 80 PSIG
Hole Diameter
Leak Rate SCFM
Annual Air Waste MMcf
Cost @ $293 / MMcf
Cost @ $463 / MMcf
1/32" 0.82 0.39 MMcf $115 $182
1/16" 3.27 1.57 MMcf $460 $727
3/32" 7.36 3.53 MMcf $1,035 $1,635
1/8" 13.08 6.28 MMcf $1,840 $2,907
5/32" 20.44 9.81 MMcf $2,875 $4,543
3/16" 29.43 14.13 MMcf $4,140 $6,541
7/32" 40.06 19.23 MMcf $5,634 $8,903
1/4" 52.33 25.12 MMcf $7,359 $11,629
Coeff. = 0.61 @ 80 PSIG 8000 Hours / Year Operation
Improve Performancereduce leakage 20% Leakage Loss
Establish Leak Repair Priority Leak Repair is Most Effective if Pressure is Controlled
© 2008 Data Power Services, LLC By: Tom Taranto
Reduce Pressure optimize the pressure profile
Demand side target pressure – lowest optimum pressure to support manufacturing Eliminate artificial demand Reduce compressor power 1% per 2 psig
Identify perceived high pressure demand – they prevent system pressure from being reduced. Validate the need for high pressure Check for piping restrictions Determine the present operating pressure (at the point of use)

© 2008 Data Power Services, LLC By: Tom Taranto
Reduce Pressure optimize the pressure profile
If the need for high pressure is valid – do not let a small percentage of air demand cause the entire system to operate at high pressure.
Consider other ways to serve the high pressure need
Consider air amplifiers or booster compressors
Consider a separate dedicated compressed air system

© 2008 Data Power Services, LLC By: Tom Taranto
Reducing Compressed Air Energy CostUsing a Systems Approach
Inappropriate Use of
Compressed Air
19

© 2008 Data Power Services, LLC By: Tom Taranto
Inappropriate Useof compressed air
Compressed Air is Expensive and Inefficient $250 to $500 per Million Cubic Feet (MMCF) 80% to 85% of energy is waste heat 1 hp air motor requires 7 to 8 Hp at compressor 8 hp / 100 cfm – low pressure blower 23 hp / 100 cfm – 100 psig compressor Alternate sources are frequently 1/3 the energy cost of
compressed air Review Applications and Consider Alternative
Energy Sources
19

© 2008 Data Power Services, LLC By: Tom Taranto
Inappropriate Useof compressed air
Abandoned & Malfunctioning Equipment
20

© 2008 Data Power Services, LLC By: Tom Taranto
Inappropriate Useof compressed air
Air Powered Vacuum – 25 hp
21
© 2008 Data Power Services, LLC By: Tom Taranto
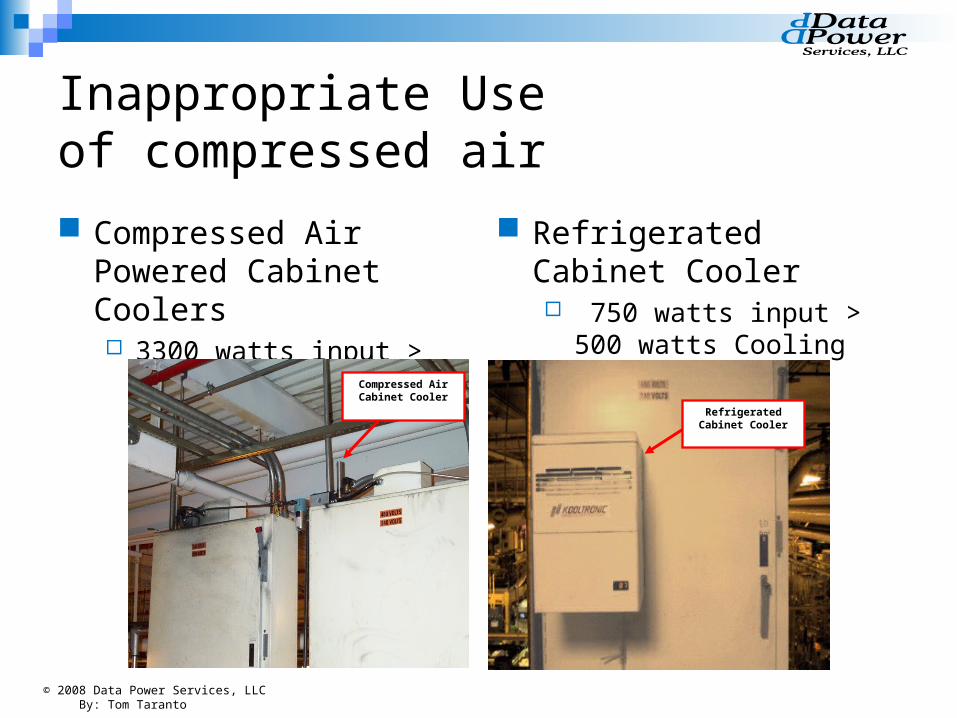
Inappropriate Useof compressed air
Compressed Air Powered Cabinet Coolers 3300 watts input > 500
watts Cooling
Refrigerated Cabinet Cooler 750 watts input > 500
watts CoolingCompressed Air Cabinet Cooler
Refrigerated Cabinet Cooler
22
© 2008 Data Power Services, LLC By: Tom Taranto
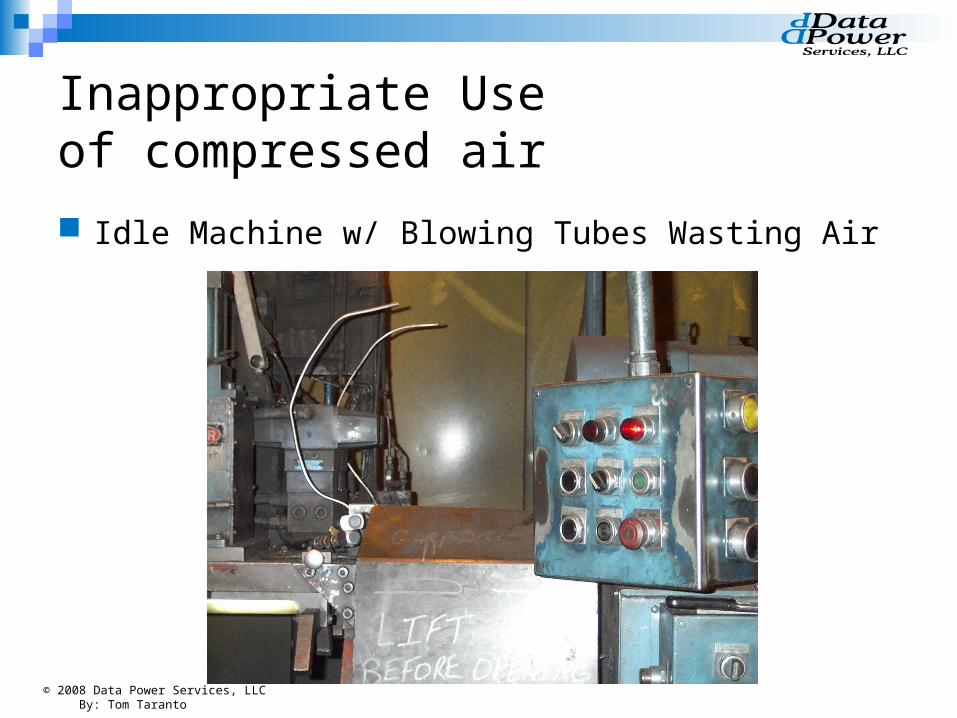
Inappropriate Useof compressed air
Idle Machine w/ Blowing Tubes Wasting Air
23

© 2008 Data Power Services, LLC By: Tom Taranto
Inappropriate Useof compressed air
Air Operated Reciprocating Pump
24
© 2008 Data Power Services, LLC By: Tom Taranto
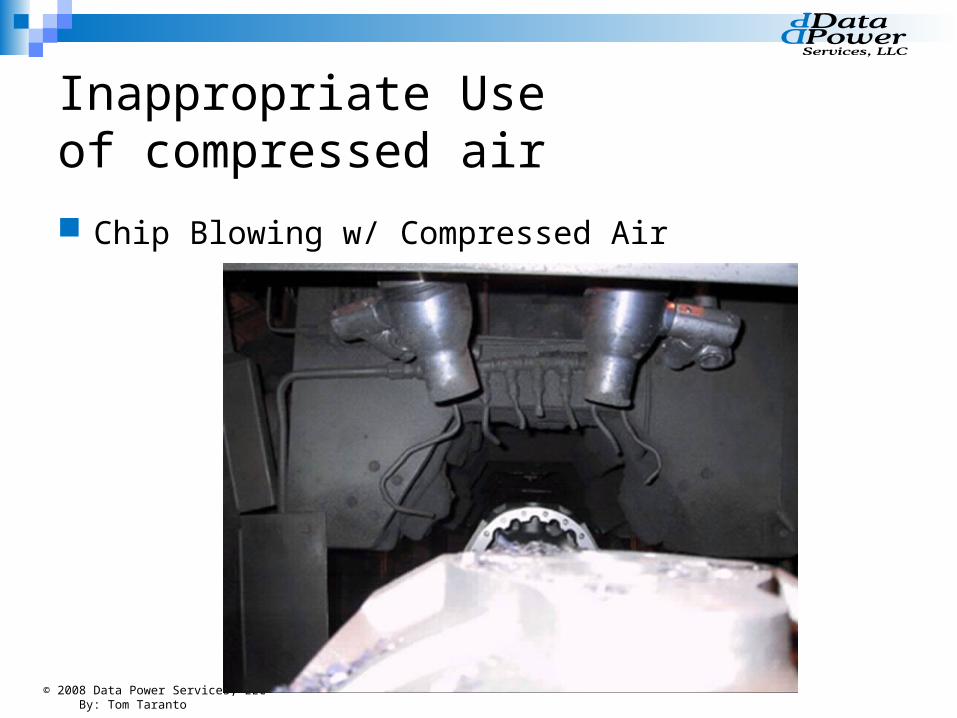
Inappropriate Useof compressed air
Chip Blowing w/ Compressed Air
25

© 2008 Data Power Services, LLC By: Tom Taranto
Inappropriate Useof compressed air
Air Motors Driving Ink Pumps
26
© 2008 Data Power Services, LLC By: Tom Taranto
Inappropriate Useof compressed air
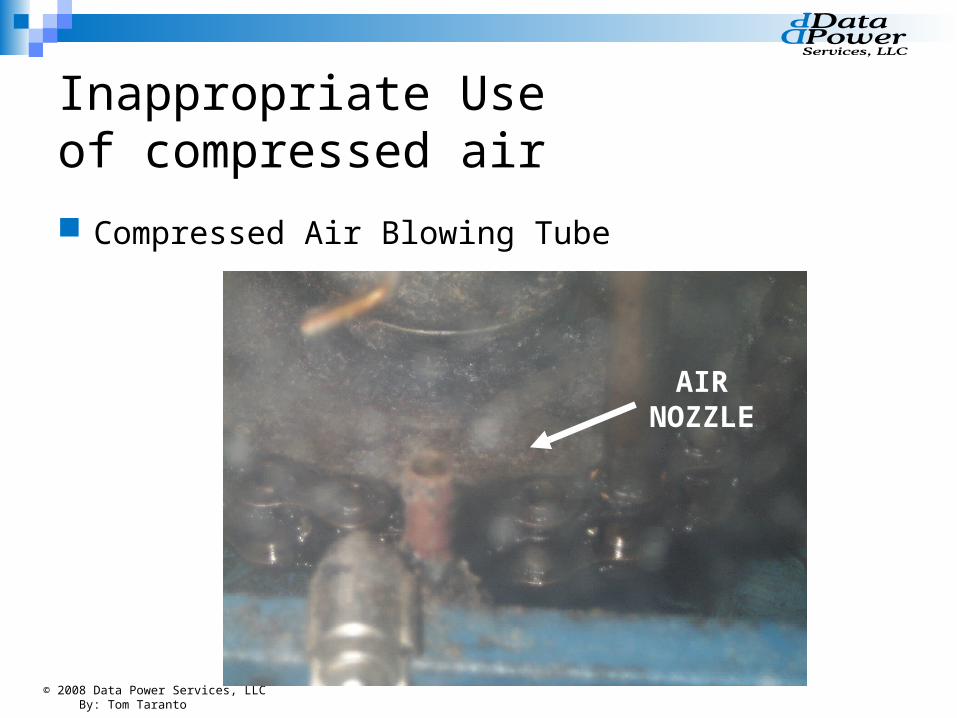
Compressed Air Blowing Tube
AIRNOZZLE
27
© 2008 Data Power Services, LLC By: Tom Taranto
Inappropriate Useof compressed air
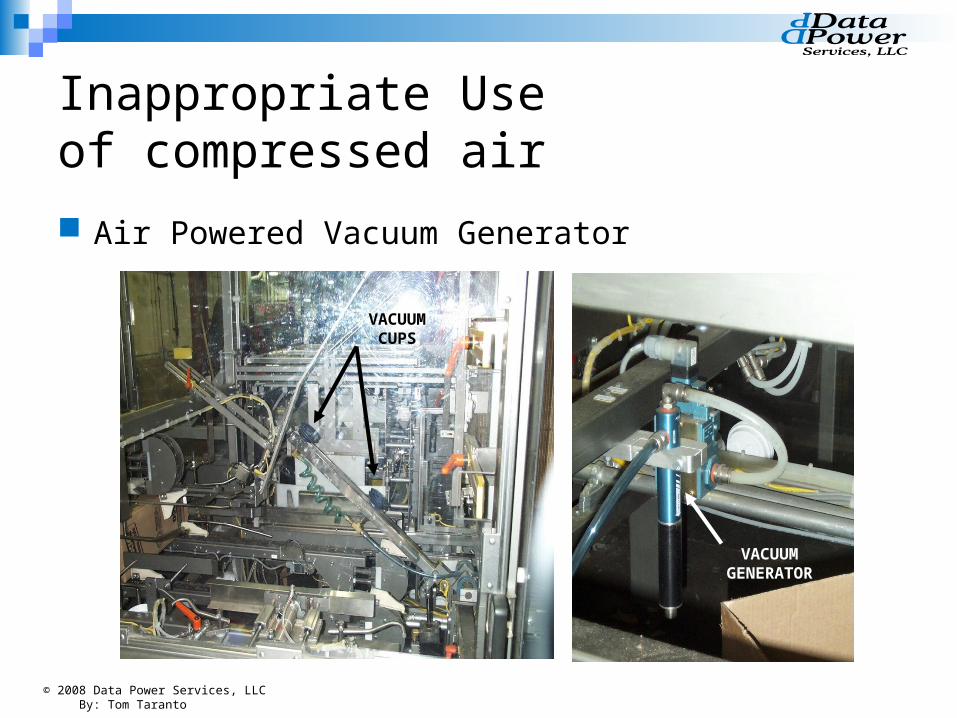
Air Powered Vacuum Generator
VACUUMGENERATOR
VACUUMCUPS
28

© 2008 Data Power Services, LLC By: Tom Taranto
Inappropriate Useof compressed air
KEY Points – Inappropriate Air Use Compressed air is expensive and due waste heat at the
compressor, an inefficient power source. Using high pressure 100 psig air (23 Hp/100 cfm) for low
pressure 8 psig requirements (8 Hp/100 cfm) is inefficient. Review applications to investigate a more direct conversion of
energy supply (electricity) to the application requirements. Abandoned and malfunctioning equipment should be
eliminated or repaired. Air powered vacuums should be replaced with electric models
if possible.
28

© 2008 Data Power Services, LLC By: Tom Taranto
Inappropriate Useof compressed air
KEY Points – Inappropriate Air Use Air powered cabinet coolers use 70% to 80% more energy than
small refrigeration units. Idle equipment should have compressed air automatically shut
off whenever possible. Air operated piston pumps should be replaced with electric
pumps if possible. Chip blowing applications can often use low pressure blowers
and delivery devices.
29

© 2008 Data Power Services, LLC By: Tom Taranto
Reducing Compressed Air Energy CostUsing a Systems Approach
Monitor & Maintain System Efficiency

© 2008 Data Power Services, LLC By: Tom Taranto
Monitor & Maintain System Efficiencymanagement information
Cost of compressed air is derived from reliably measured performance data.
Energy performance and cost are reported to management.
Compressed air demand of production operations is documented through airflow measurement and recording.
The consistent, reliable, supply of compressed air is achieved. Performance measurement information shows corrective measures to optimize performance.
Unscheduled downtime is minimized or eliminated.
40

© 2008 Data Power Services, LLC By: Tom Taranto
Monitor & Maintain System Efficiencymanagement information
Compressed Air Flow Measurement
34

© 2008 Data Power Services, LLC By: Tom Taranto
Monitor & Maintain System Efficiencymanagement information
36
Operating Profile Statistics Daily Profile Annual Profile Air Demand Profile24 hrs / day 3.45 MMCF / Day 1,256 MMCF / Year 2,395 scfm Avg. Airflow
7 days / week 15,142 kWH / Day 5,511,790 kWH / Year 3,201 scfm Max. Hourly Avg.52 weeks / year $1,211.19 / Day $440,943 Annual Cost 780 scfm Min. Hourly Avg.
Power Cost $50.47 / Hour (average) $351.07 / MMCF 3,667 scfm Max. Peak$0.0800 / kWH 631 kWH (average) $184.11 per cfm / yr. 36 scfm Min. Valley
Hourof theDay
Average Airflow (scfm)
Running Capacity
(cfm)
TotalPower(kWh)
OperatingCost
($ / hr.)
CompressedAir Cost$ / MMCF
CompressedAir Cost
$ / scfm / yr
SpecificPower
(kW/100 cfm)
SpecificPower
(bHp/100 cfm)
AveragePressure
(psig)0:00 1,586 4470 566.9 $45.35 $477.00 $250.02 35.7 47.9 113.81:00 3,189 4470 740.0 $59.20 $309.00 $161.97 23.2 31.1 114.82:00 2,150 4470 631.8 $50.55 $392.00 $205.47 29.4 39.4 114.13:00 2,051 4470 627.4 $50.19 $408.00 $213.86 30.6 41.0 114.24:00 3,120 4470 739.9 $59.19 $316.00 $165.63 23.7 31.8 114.95:00 780 4470 441.2 $35.30 $754.00 $395.22 56.6 75.9 114.66:00 2,404 4470 655.2 $52.42 $363.00 $190.27 27.3 36.6 113.67:00 3,108 4470 755.3 $60.42 $324.00 $169.83 24.3 32.6 115.08:00 2,830 5460 717.8 $57.42 $338.00 $177.17 25.4 34.1 114.09:00 1,739 5460 571.5 $45.72 $438.00 $229.58 32.9 44.1 112.2
10:00 2,659 5460 741.8 $59.35 $372.00 $194.99 27.9 37.4 113.211:00 3,012 5460 771.3 $61.70 $341.00 $178.74 25.6 34.3 115.112:00 2,832 4360 639.2 $51.13 $301.00 $157.77 22.6 30.3 114.013:00 1,779 4360 510.7 $40.86 $383.00 $200.75 28.7 38.5 112.014:00 2,951 4360 641.0 $51.28 $290.00 $152.01 21.7 29.1 114.315:00 3,201 4360 673.4 $53.87 $280.00 $146.76 21.0 28.2 114.916:00 2,876 4360 670.7 $53.65 $311.00 $163.01 23.3 31.2 113.417:00 2,601 4360 642.6 $51.41 $329.00 $172.45 24.7 33.1 112.918:00 2,642 4360 642.7 $51.42 $324.00 $169.83 24.3 32.6 112.919:00 2,171 4360 590.5 $47.24 $363.00 $190.27 27.2 36.5 112.920:00 3,117 4360 694.2 $55.53 $297.00 $155.68 22.3 29.9 114.521:00 965 4360 441.2 $35.29 $610.00 $319.74 45.7 61.3 110.522:00 2,035 4360 541.8 $43.34 $355.00 $186.08 26.6 35.7 112.623:00 1,682 4360 494.3 $39.54 $392.00 $205.47 29.4 39.4 112.7
NOTE: Minimum Maximum
ConservAIR ® Technologies, LLP COMPRESSED AIR SYSTEM MANAGEMENT… IT'S ALL WE DO © 2005 All Rights Reserved
Plant Air System AuditCompressed Air System Operating Profile on Thursday 11/11/2004

© 2008 Data Power Services, LLC By: Tom Taranto
Reducing Compressed Air Energy CostUsing a Systems Approach
Summary:
2010 Energy ExpoHosted by:
National Grid & NYSERDA
© 2008 Data Power Services, LLC By: Tom Taranto
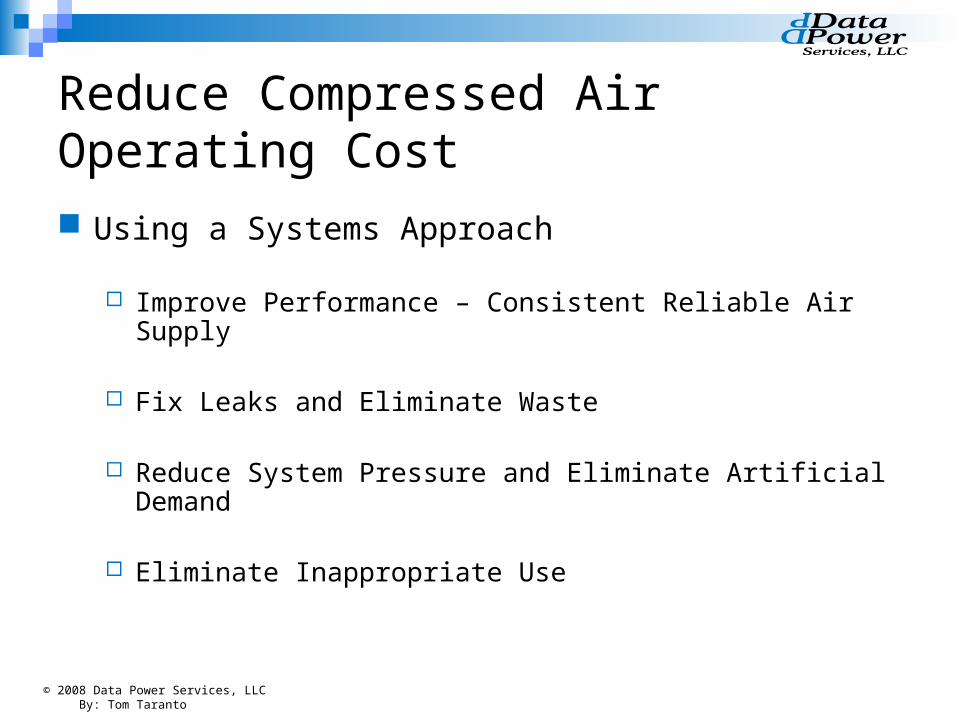
Reduce Compressed AirOperating Cost
Using a Systems Approach
Improve Performance – Consistent Reliable Air Supply
Fix Leaks and Eliminate Waste
Reduce System Pressure and Eliminate Artificial Demand
Eliminate Inappropriate Use
© 2008 Data Power Services, LLC By: Tom Taranto
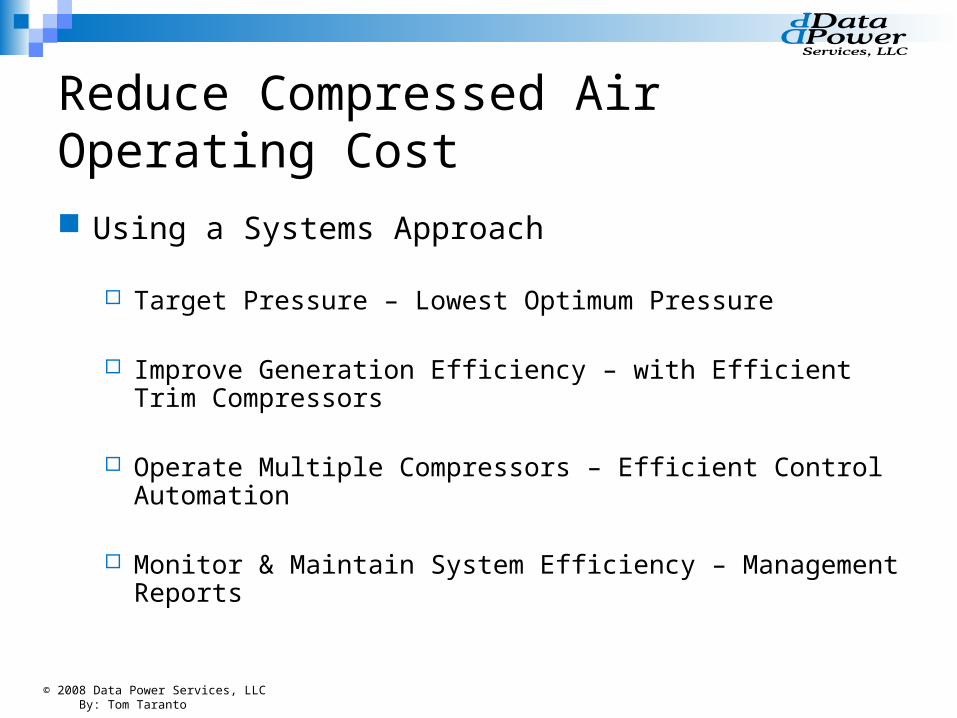
Reduce Compressed AirOperating Cost
Using a Systems Approach
Target Pressure – Lowest Optimum Pressure
Improve Generation Efficiency – with Efficient Trim Compressors
Operate Multiple Compressors – Efficient Control Automation
Monitor & Maintain System Efficiency – Management Reports
© 2008 Data Power Services, LLC By: Tom Taranto
Reducing Compressed Air Energy CostUsing a Systems Approach
2010 Energy ExpoHosted by:
National Grid & NYSERDA
© 2008 Data Power Services, LLC By: Tom Taranto
Reducing Compressed Air Energy CostUsing a Systems Approach
2010 Energy ExpoHosted by:
National Grid & NYSERDA