Embed Size (px)
Citation preview
© 2010 AirAdvice, Inc.
Walk a Mile in a Building Owner’s Shoes

© 2010 AirAdvice, Inc.
“Seek first to understand, then to be understood”Stephen Covey
The Seven Habits of Highly Effective People
© 2010 AirAdvice, Inc.
Agenda
• Energy demographics and commercial building markets• Ownership structures and motivations• How to make (or not make) money in commercial real estate
– Property valuation– Economic drivers
• Lease types and the behaviors they drive• Events that create action• Strategies for success

4© 2010 AirAdvice, Inc.
98% 58%
Energy Demographics
0
500
1,000
1,500
2,000
2,500
3,000
Lessthan 5k
5k to10k
10k to25k
25k to50k
50k to100k
100k to200k
200k to500k
Over500k
Building Size (sq. ft.)
No
. o
f B
ldg
s (t
ho
usa
nd
s)
0%
20%
40%
60%
80%
100%
Cu
mu
lati
ve E
ner
gy
Use
(%
of
To
tal)
Cumulative Energy Use No. of Bldgs
Source: Commercial Buildings Energy Consumption Survey (CBECS)

© 2010 AirAdvice, Inc.
Commercial Buildings Markets
0100200300400500600700800900
Office
Servic
e
War
ehou
se
Resta
uran
ts
Retail
Schoo
ls
Religi
ous W
orsh
ip
Public
Mall
s
Hotels
Med
ical O
ffice
Other
Hospi
tals
Nu
mb
er
of
Bu
ild
ing
s (
k)
0
50
100
150
200
250
300
Av
era
ge
Siz
e (
k s
f)
Number of Buildings Average Size
Source: Commercial Buildings Energy Consumption Survey (CBECS)

© 2010 AirAdvice, Inc.
% of Total Floorspace
Warehouse15%
Restaurants4%
Retail6%Schools
14%
Religious Worship
5%
Public7%
Service6%
Office18%
Malls10%
Hotels7%
Other3% Hospitals
3%
Medical Office2%
Source: Commercial Buildings Energy Consumption Survey (CBECS)
© 2010 AirAdvice, Inc.
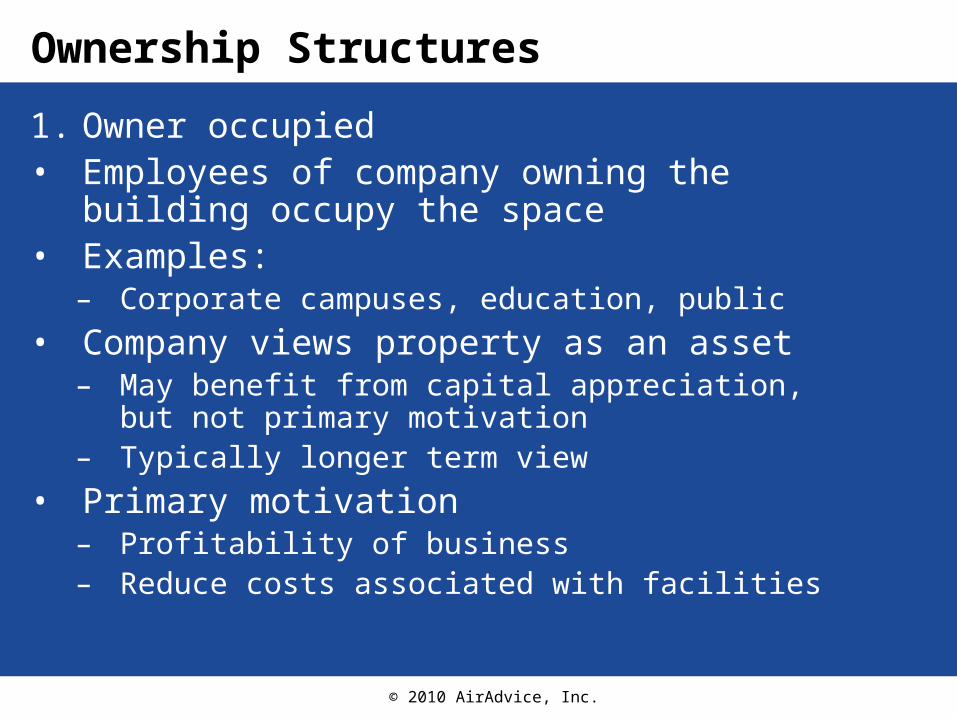
Ownership Structures
1. Owner occupied• Employees of company owning the building
occupy the space• Examples:
– Corporate campuses, education, public
• Company views property as an asset– May benefit from capital appreciation, but not
primary motivation– Typically longer term view
• Primary motivation– Profitability of business– Reduce costs associated with facilities

© 2010 AirAdvice, Inc.
Ownership Structures
2. Investor Owned• Building owner leases space to other
companies, who occupy the space• Company views property as a “box of
leases”– Return on investment is primary motivation– May have very short term investment horizon
• Examples:– Office buildings, warehouses, retail
© 2010 AirAdvice, Inc.
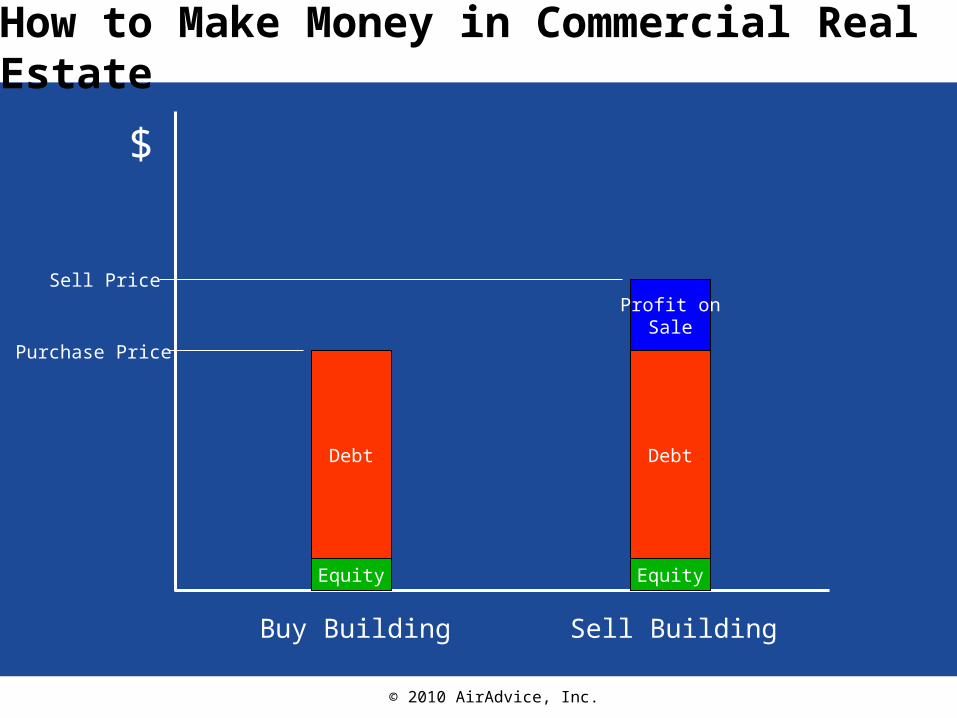
How to Make Money in Commercial Real Estate
Equity
Debt
$
Buy Building
Purchase Price
Sell Building
Equity
Debt
Sell PriceProfit on
Sale
© 2010 AirAdvice, Inc.
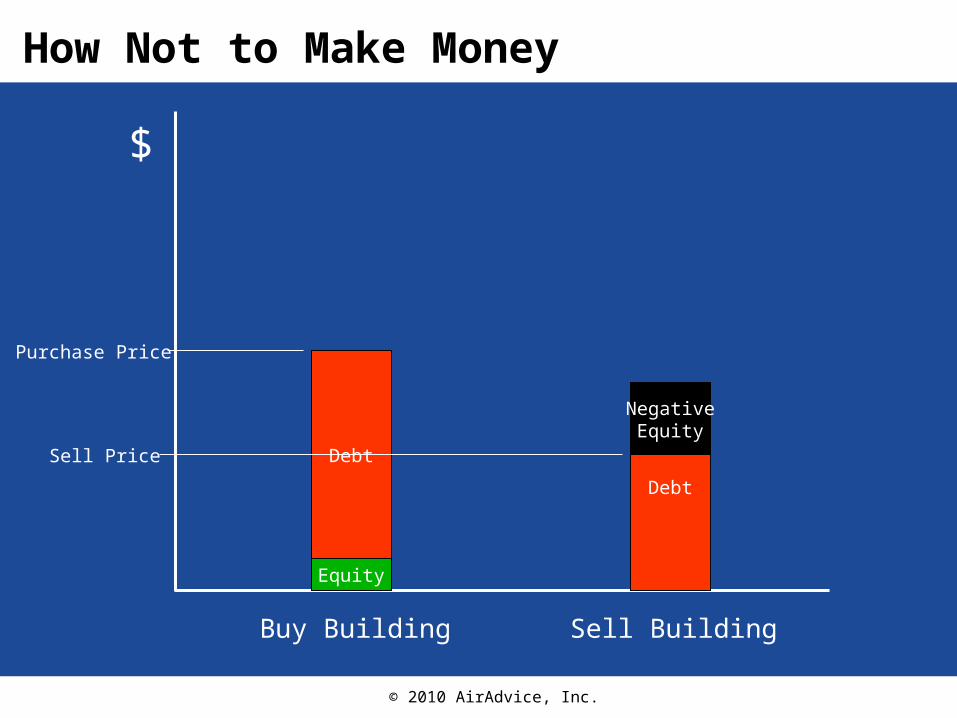
How Not to Make Money
Equity
Debt
$
Buy Building
Purchase Price
Sell Building
Equity
Debt
Sell Price
NegativeEquity
© 2010 AirAdvice, Inc.
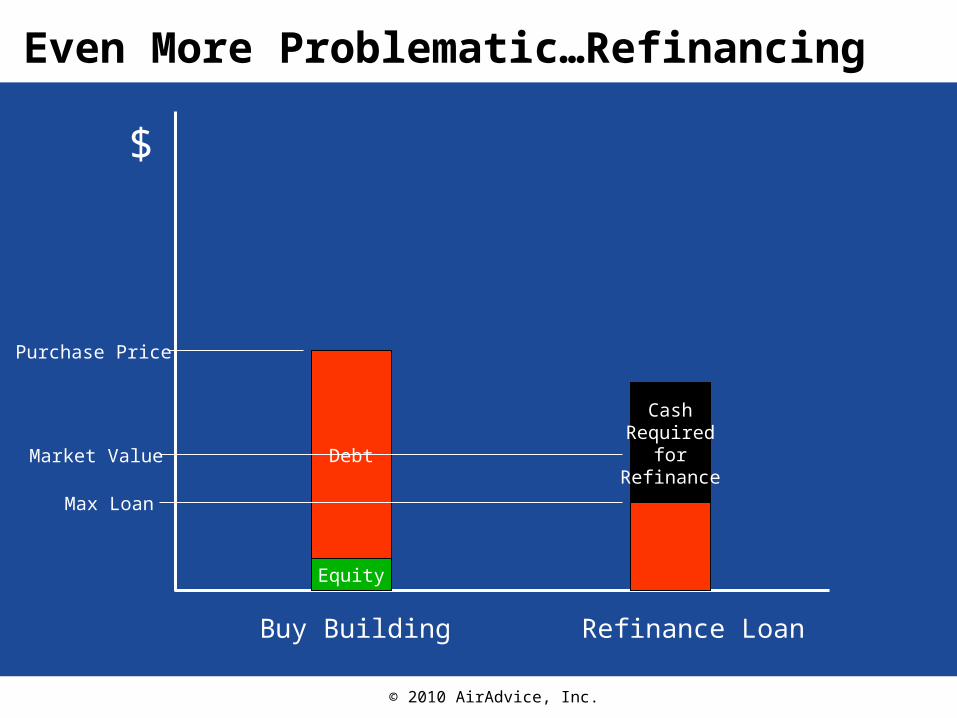
Even More Problematic…Refinancing
$
Equity
Debt
Buy Building
Purchase Price
Refinance Loan
Equity
Debt
Market Value
CashRequired
forRefinance
Max Loan
© 2010 AirAdvice, Inc.
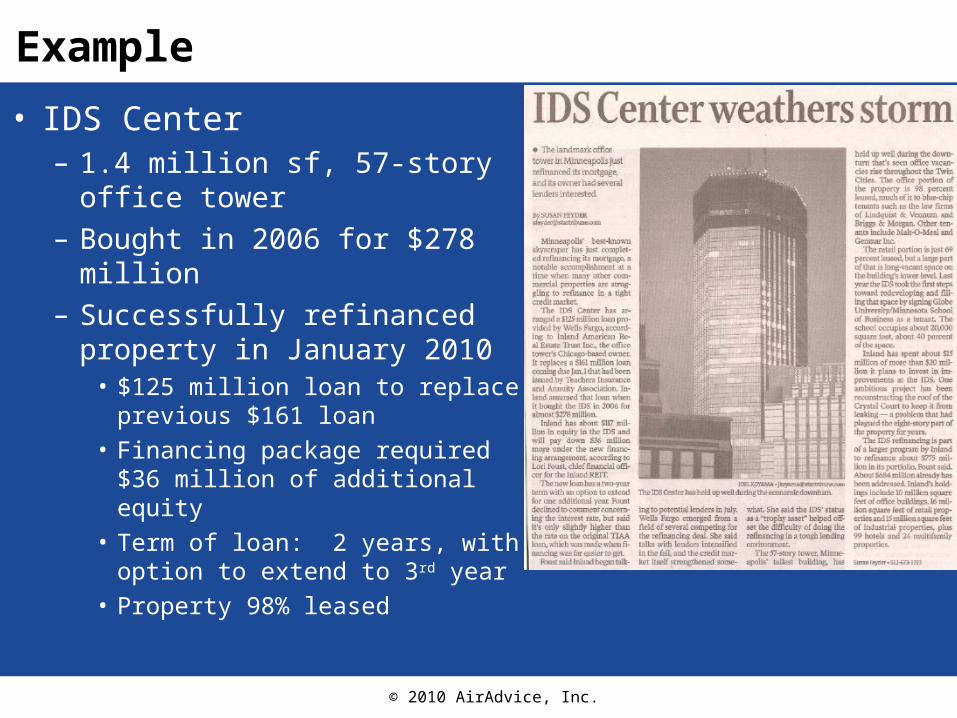
Example
• IDS Center– 1.4 million sf, 57-story office
tower– Bought in 2006 for $278
million– Successfully refinanced
property in January 2010• $125 million loan to replace
previous $161 loan• Financing package required $36
million of additional equity• Term of loan: 2 years, with
option to extend to 3rd year• Property 98% leased

© 2010 AirAdvice, Inc.
Distressed Commercial Properties
• Between 2010 and 2014, $770 billion in commercial loans will be on properties in a negative equity position
Source: Foresight Analytics
0%
10%
20%
30%
40%
50%
60%
70%
2010 2011 2012 2013 2014
% o
f L
oa
ns
Ma
turi
ng
in
N
eg
ati
ve
Eq
uit
y P
os
itio
n
0
0
0
1
1
1
1
© 2010 AirAdvice, Inc.
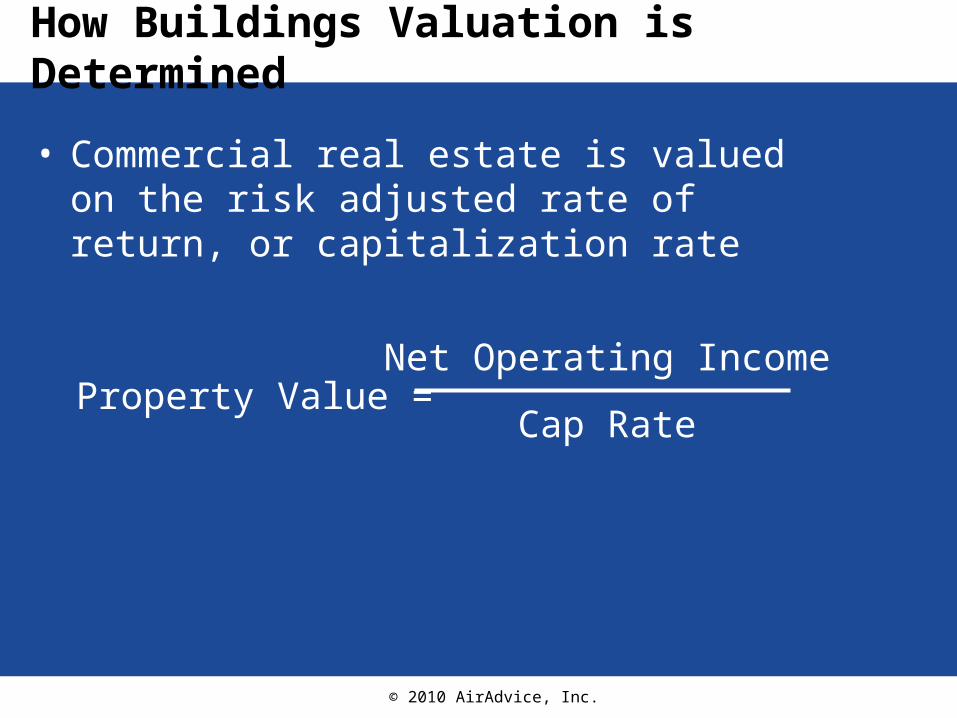
How Buildings Valuation is Determined
• Commercial real estate is valued on the risk adjusted rate of return, or capitalization rate
Property Value = Net Operating Income
Cap Rate
© 2010 AirAdvice, Inc.
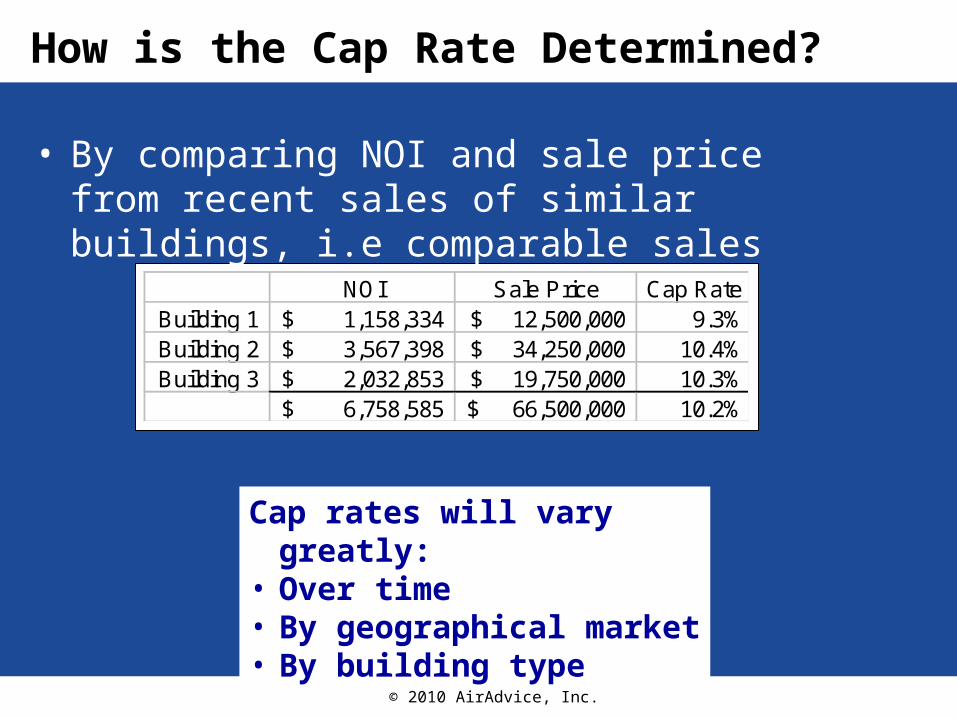
How is the Cap Rate Determined?
• By comparing NOI and sale price from recent sales of similar buildings, i.e comparable sales
NOI Sale Price Cap RateBuilding 1 1,158,334$ 12,500,000$ 9.3%Building 2 3,567,398$ 34,250,000$ 10.4%Building 3 2,032,853$ 19,750,000$ 10.3%
6,758,585$ 66,500,000$ 10.2%
Cap rates will vary greatly:• Over time• By geographical market• By building type

© 2010 AirAdvice, Inc.
Net Operating Income
Net Operating Income = Revenue – Operating Expenses
• Revenue Lease payments Other fees
• Operating Expenses Management / leasing fees Insurance Janitorial Taxes Utilities

© 2010 AirAdvice, Inc.
Where We’re Headed…• “Energy use is the single
largest operating expense in commercial office buildings, representing approximately one-third of typical operating budgets”

© 2010 AirAdvice, Inc.
Energy Savings Drive Higher Asset Value
Building A Building BGross operating income:
Rents 7,038,822$ 7,038,822$ Fees 129,584$ 129,584$
7,168,406$ 7,168,406$ Operating expenses:
Management fees 703,882 703,882$ Insurance 633,494 633,494$ Janitorial 985,435 985,435$
Taxes 1,055,823 1,055,823$ Utilities 1,407,764 1,126,212$
4,786,399 4,504,846
Net Operating Income 2,382,007$ 2,663,560$
Cap Rate 8% 8%
Asset Value 29,775,088$ 33,294,499$
20% lower utilities
$3.4 million higher asset value

© 2010 AirAdvice, Inc.
Turn Price Pressure into Gain
$-
$5,000
$10,000
$15,000
$20,000
Sa
vin
gs
Example:• 100,000 sf
building• $2 per sf in
energy costs• $10,000 cost
of PM agreement
Scenario 210% Reduction Energy Costs
50% Increase in PM Price
Scenario 110% Reduction
in PM Price
© 2010 AirAdvice, Inc.
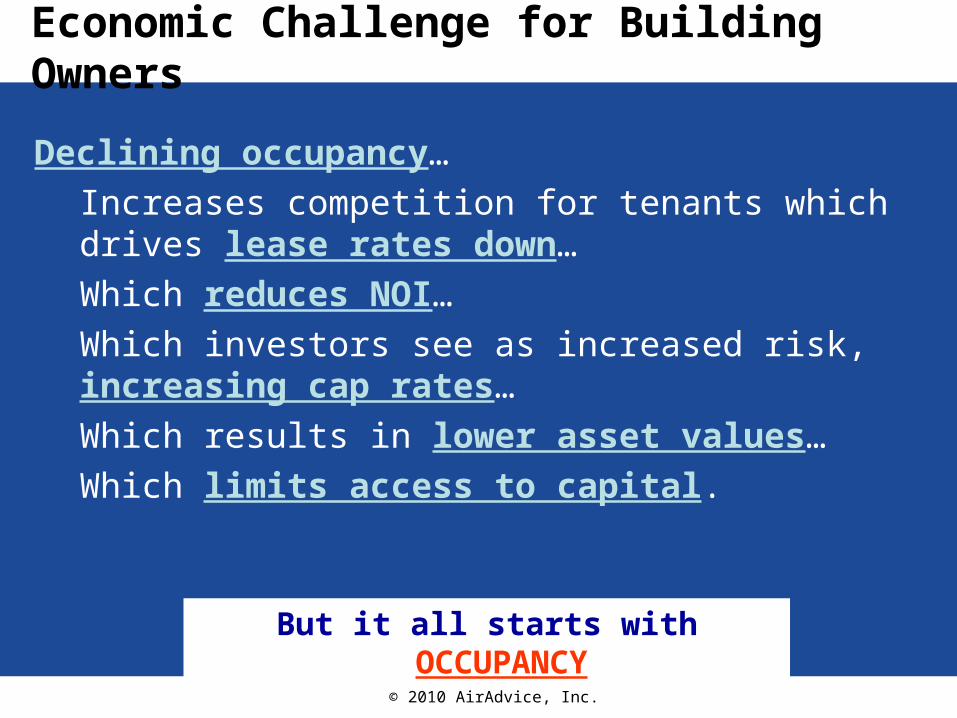
Economic Challenge for Building Owners
Declining occupancy…
Increases competition for tenants which drives lease rates down…
Which reduces NOI…
Which investors see as increased risk, increasing cap rates…
Which results in lower asset values…
Which limits access to capital.
But it all starts with OCCUPANCY

© 2010 AirAdvice, Inc.
Common Lease Types
Lease Type Description Impact of Operating Expenses on NOI
Gross or full service
• Landlord pays all capital and operating expenses
• Lower operating expenses result in higher NOI
Net • Landlord pays capital expenses
• Tenant pays operating expenses
• No direct impact on NOI
Full service w/ base year expenses
• Landlord pays capital expenses and operating expenses up to “base year” amount
• Tenant pays operating expenses above base year amount
• If operating expenses near base year, lower operating expenses can result in higher NOI

© 2010 AirAdvice, Inc.
Behaviors Determined by Lease Type
Gross Lease
Year 1 Year 2
$2.00 persf $1.50 per
sf
$0.50 toLandlord
Net Lease
Year 1 Year 2
$2.00 persf $1.50 per
sf
$0.50 toTenant
Gross Lease w/ Base Year
Year 1 Year 2
$2.00 persf $1.50 per
sf
$1.90Base Year
$0.10 toTenant $0.40 to
Landlord
Landlord generally
motivated to reduce operating
expenses
Landlord may not be motivated
to reduce operating expenses
Motivation depends on
relationship of current
expenses to base year

© 2010 AirAdvice, Inc.
Must Understand Who Pays and Who Benefits
Owner Occupied
Space
Leased Space
Net Lease Gross Lease
Owner Tenant Owner Tenant
Who Pays:
Operating Expenses
Capital Expenses
X
X X
X X
X
Who Directly Benefits: X X X
Benefits Accrue to Owner
Benefits Accrue to Owner
Benefits Accrue to Tenant
© 2010 AirAdvice, Inc.
Pass Throughs
• A common lease clause, even in net leases, allows the building owner to recover capital costs from the tenants for improvements that reduce operating expenses
© 2010 AirAdvice, Inc.
Events that Drive Action
© 2010 AirAdvice, Inc.
Lease Renewal
• Buyer’s market• Building owners are willing to invest for the
benefit of tenant as a retention tool
© 2010 AirAdvice, Inc.
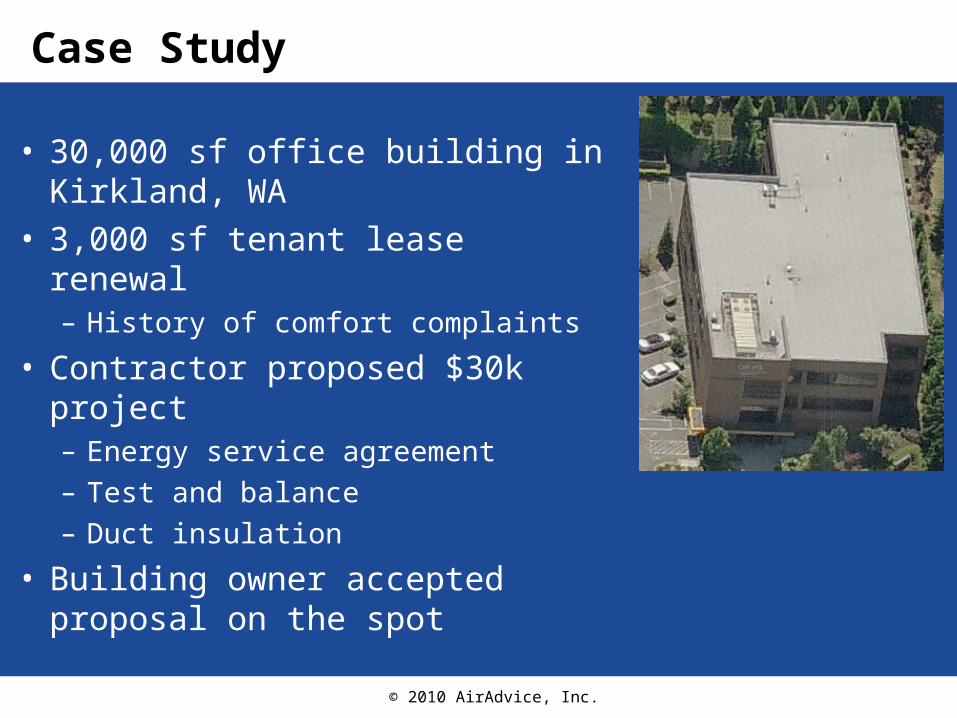
Case Study
• 30,000 sf office building in Kirkland, WA
• 3,000 sf tenant lease renewal– History of comfort complaints
• Contractor proposed $30k project– Energy service agreement– Test and balance– Duct insulation
• Building owner accepted proposal on the spot

© 2010 AirAdvice, Inc.
Case Study
• What’s at risk?– 3,000 sf x $30 per sf = $90,000 per
year in rent– 7 year lease = $630,000 of
guaranteed revenue
• If tenant leaves?– Minimum 6 to 9 months of lost rent =
$45,000 to $67,500
Building owner’s perspective:$30,000 to solve problem doesn’t seem so bad

© 2010 AirAdvice, Inc.
Sale or Refinance of Building
• Building finances will be heavily scrutinized– Revenues– Operating expenses– Cash flow– Condition of systems
• 1-2 years leading up to event is prime time for action

© 2010 AirAdvice, Inc.
Property Condition Assessment (PCA)
• Evaluation of major systems in building– Roof, parking lots, mechanical
• Lenders may require cash escrow for items found deficient– Immediate lump-sum reserve– Ongoing monthly reserves above NOI line
• Replacement of major systems prior to refinancing can be cash flow positive

© 2010 AirAdvice, Inc.
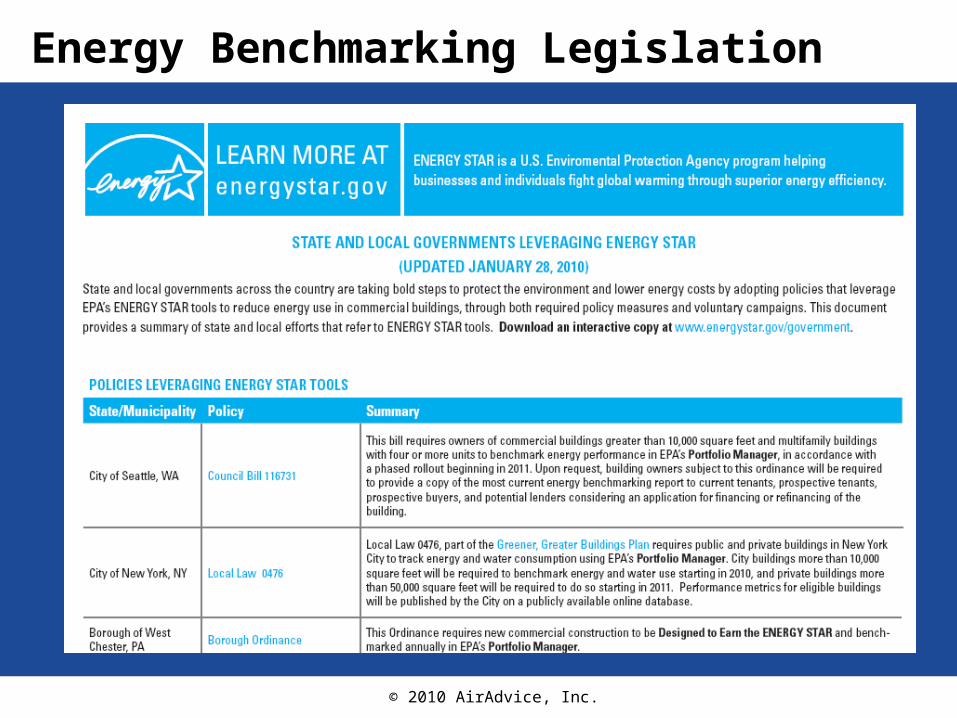
Energy Benchmarking Legislation
• Legislation requires benchmarking:– Sale of building– Refinancing of building– Lease of building to single
tenant
• Most notable legislation passed in:– State of California– State of Washington– New York City– Washington, DC
© 2010 AirAdvice, Inc.
Energy Benchmarking Legislation
© 2010 AirAdvice, Inc.
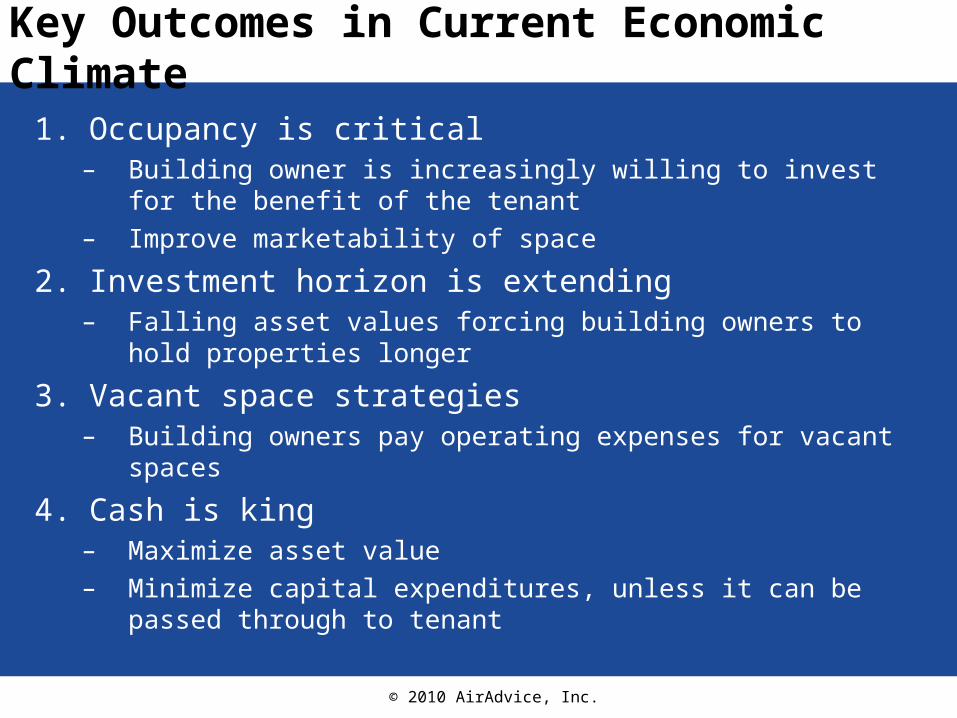
Key Outcomes in Current Economic Climate
1. Occupancy is critical– Building owner is increasingly willing to invest for the benefit of the
tenant– Improve marketability of space
2. Investment horizon is extending– Falling asset values forcing building owners to hold properties
longer
3. Vacant space strategies– Building owners pay operating expenses for vacant spaces
4. Cash is king– Maximize asset value– Minimize capital expenditures, unless it can be passed through to
tenant

© 2010 AirAdvice, Inc.
Strategies for Success

© 2010 AirAdvice, Inc.
Strategies for Success
1. Sell to the right level– Financial decision makers,
not building operator
• When meeting:– Above ground is good– Below ground is bad
Bad Good

© 2010 AirAdvice, Inc.
Tips for Selling to the Right Level
• Ask financially based questions• If your contact doesn’t know the answer, ask
them to who would– Gain a warm introduction to financial decision
maker

© 2010 AirAdvice, Inc.
Target the Correct Decision Making Level
% of Time Goal
Position What Motivates Them Why Talk to Them
10% 20%CFO / COO / Controller
• Overall operating cost and corporate objectives
• Needed to approve decision• Can direct activities
20% 30% VP Finance, VP Operations, VP Facilities
• Reducing operating costs (management pressure)
• Decision maker for service (but not final say on capital expenditures)
60% 45%
Facilities or Plant Manager / Director
or Property Manager
• Happy tenants• Looking good to their
owners
• Can influence decisions• Partner with them to go
upstairs• In the loop w/ current service
provider
10% 5%Building Engineer/Operator
• Minimizing downtime• Reduced complaints
• Close to mechanical equipment
• Need to win them over• May have veto power
© 2010 AirAdvice, Inc.
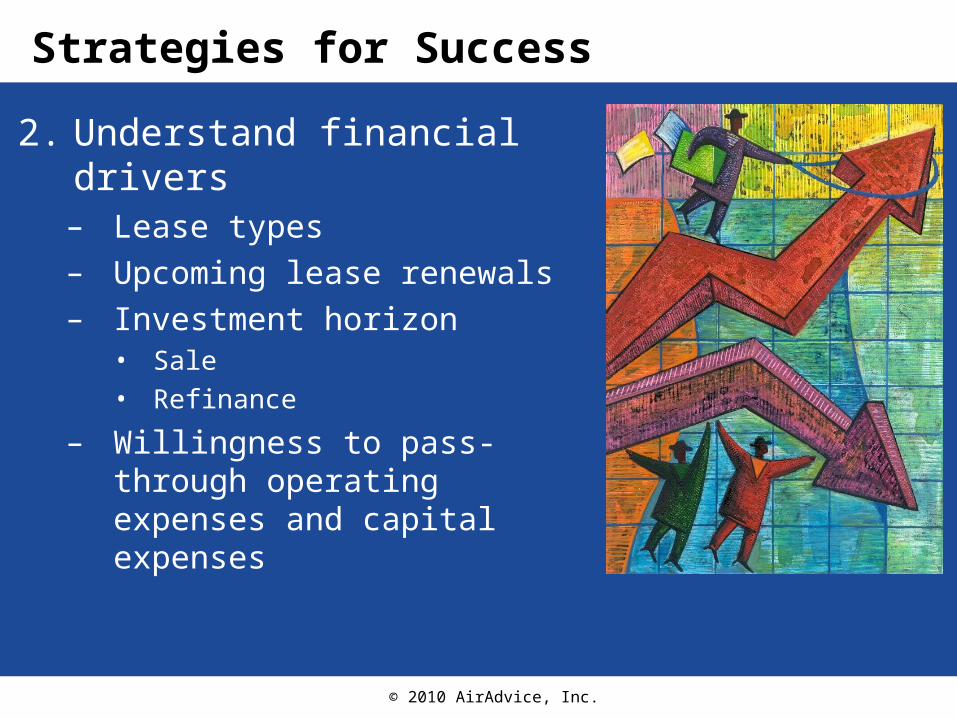
Strategies for Success
2. Understand financial drivers– Lease types– Upcoming lease renewals– Investment horizon
• Sale• Refinance
– Willingness to pass-through operating expenses and capital expenses
© 2010 AirAdvice, Inc.
Strategies for Success
3. Change the buying criteria– Offer something different
© 2010 AirAdvice, Inc.
Change the Buying Criteria
• Current – Price of maintenance agreement or project
• New:– Impact to NOI– Impact to asset value– Impact to broader portfolio financial metrics
© 2010 AirAdvice, Inc.
Strategies for Success
4. Key off action-driving events– Lease renewal– Sale / refinance of building– Energy benchmarking
legislation
© 2010 AirAdvice, Inc.
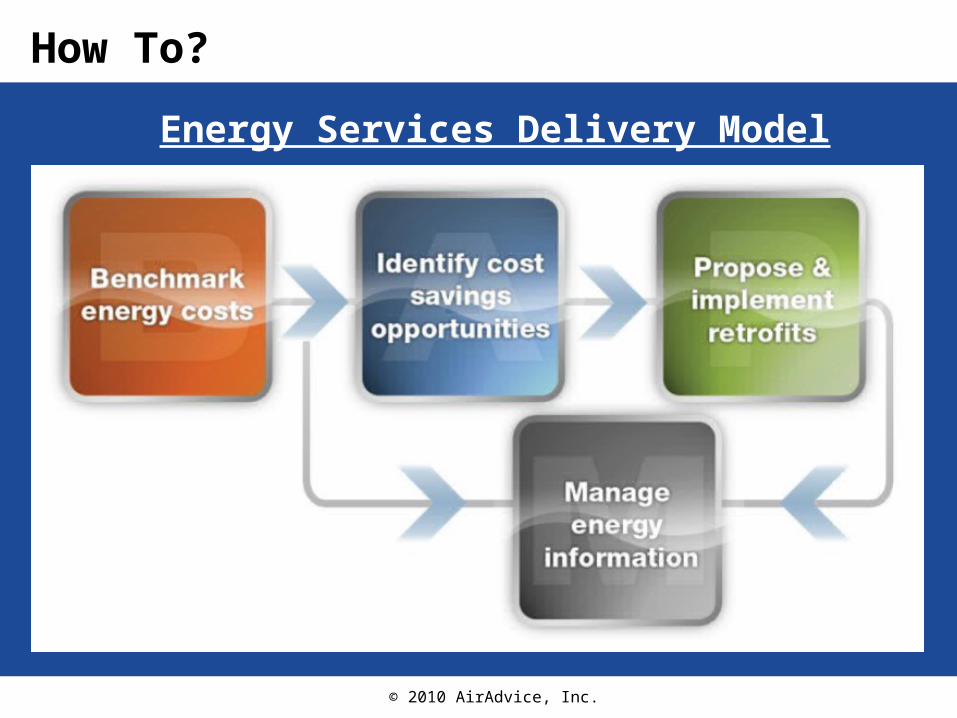
How To?
Energy Services Delivery Model
© 2010 AirAdvice, Inc.
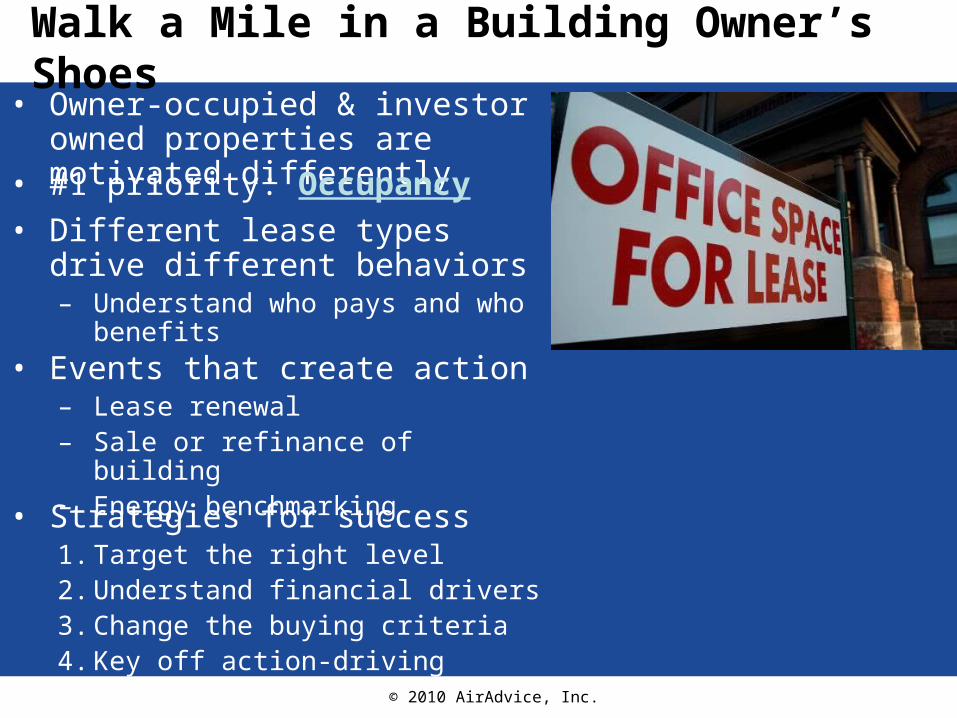
Walk a Mile in a Building Owner’s Shoes• Owner-occupied & investor owned
properties are motivated differently• #1 priority: Occupancy
• Different lease types drive different behaviors– Understand who pays and who
benefits• Events that create action
– Lease renewal– Sale or refinance of building– Energy benchmarking
• Strategies for success1. Target the right level2. Understand financial drivers3. Change the buying criteria4. Key off action-driving events

© 2010 AirAdvice, Inc.
Questions
? ? ?
?
?
?? ?


![Walk a mile in His/Her shoes€¦ · Walk a mile in His/Her shoes [PICK ONE] a collection of short fictional stories Written by: Madyson Smith Senior Communication Honors Major Texas](https://img.pdfslide.net/doc/110x75/5fdc34dd13f54c41bb4d9d99/walk-a-mile-in-hisher-shoes-walk-a-mile-in-hisher-shoes-pick-one-a-collection.jpg)