Embed Size (px)
Citation preview
©2010 American Institutes for Research®
April 8, 2011
Presenters
Jenny Scala & Lindsay Fryer
National High School Center
High School Improvement and theEarly Warning System (EWS)
Implementation Process and Tool v2.0
www.betterhighschools.org
©2010 American Institutes for Research®
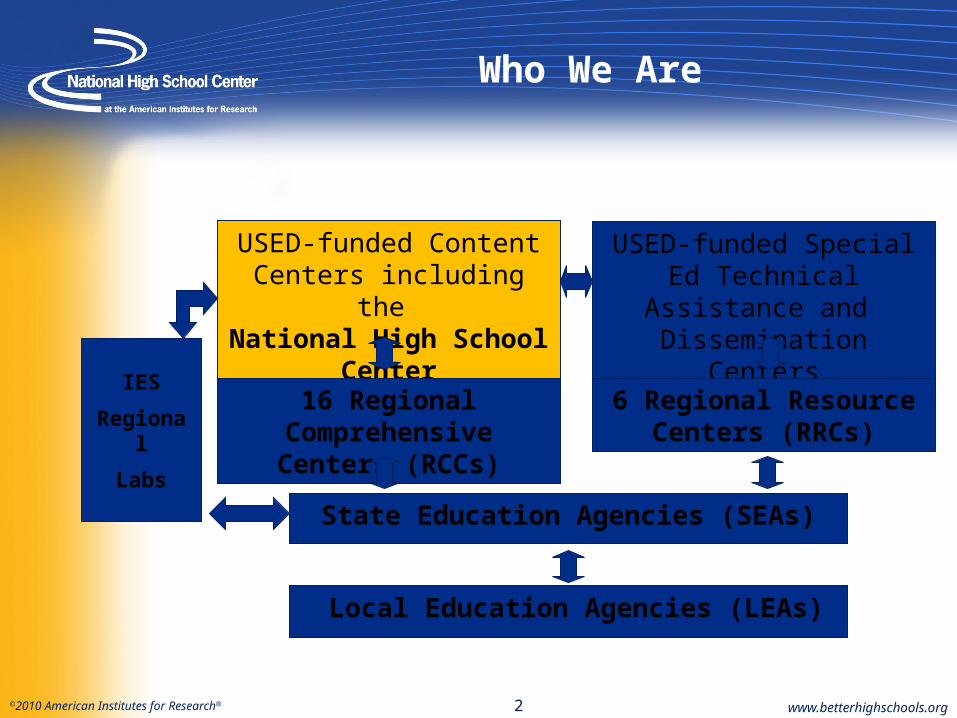
Who We Are
USED-funded Content Centers including the
National High School Center
State Education Agencies (SEAs)
Local Education Agencies (LEAs)
IES
Regional
Labs
16 Regional Comprehensive Centers (RCCs)
USED-funded Special Ed Technical Assistance and
Dissemination Centers
6 Regional Resource Centers (RRCs)
www.betterhighschools.org2
©2010 American Institutes for Research® 3
Agenda
• Discuss the Eight Elements of High School Improvement and A Self- Assessment: A Coherent Approach to High School Improvement
• High school improvement activity
• Provide an overview of the background and research base for early warning systems
• Key features of the Early Warning System (EWS) Tool v2.0
• Introduce the 7-step Early Warning System implementation process
• Demonstrate the EWS Tool v2.0
• Discuss EWS and high school improvement
• Break
• Case Study Activity
www.betterhighschools.org
©2010 American Institutes for Research® www.betterhighschools.org
High School Improvement

©2010 American Institutes for Research® 5 www.betterhighschools.org
Nine Characteristics of High-Performing High Schools
• Clear and Shared Focus
• High Standards and Expectations for All Students
• Effective School Leadership
• High Levels of Collaboration and Communication
• Curriculum, Instruction and Assessments Aligned with State Standards
• Frequent Monitoring of Learning and Teaching
• Focused Professional Development
• Supportive Learning Environment
©2010 American Institutes for Research® www.betterhighschools.org
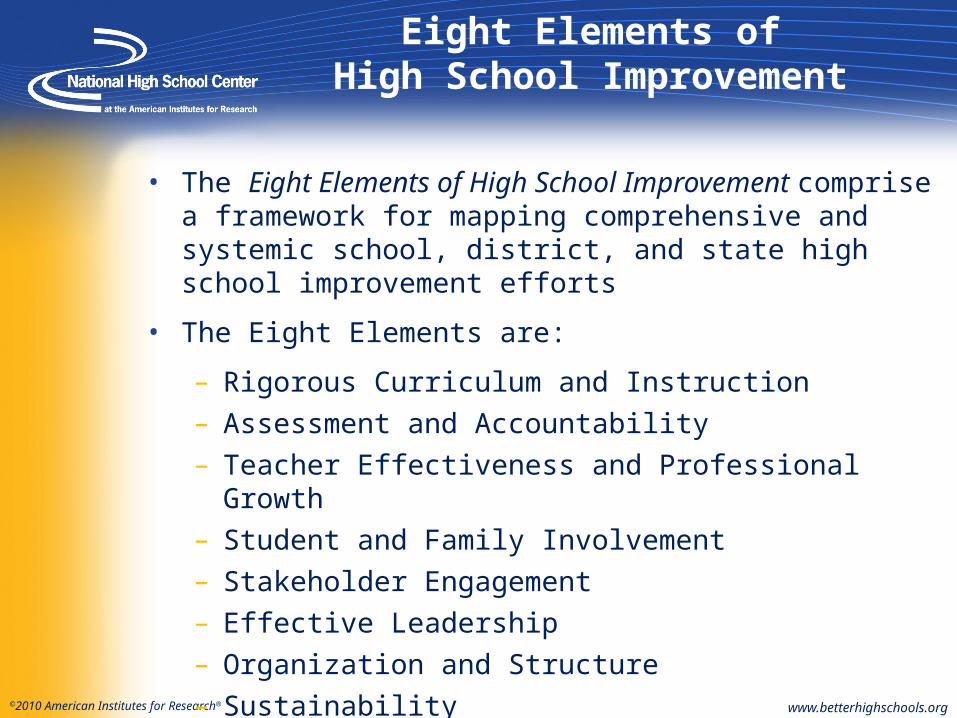
Eight Elements ofHigh School Improvement
• The Eight Elements of High School Improvement comprise a framework for mapping comprehensive and systemic school, district, and state high school improvement efforts
• The Eight Elements are:
– Rigorous Curriculum and Instruction
– Assessment and Accountability
– Teacher Effectiveness and Professional Growth
– Student and Family Involvement
– Stakeholder Engagement
– Effective Leadership
– Organization and Structure
– Sustainability

©2010 American Institutes for Research® 7 www.betterhighschools.org
The Eight Elements
• Each of the Eight Elements is broken into subcategories to improve users’ ability to address high school improvement issues
• For example, each element is organized in the following manner:
Element• Areas of Focus
• Indicators of Effectiveness

©2010 American Institutes for Research® 8 www.betterhighschools.org
Eight Elements Self-Assessment
• The National High School Center developed an online self-assessment tool using the Eight Elements and accompanying indicators
• A Self-Assessment: A Coherent Approach to High School Improvement:
– Users rate themselves on their schools’ implementation of each of the Eight Element indicators
– Results allow users to see where they need to focus high school improvement efforts and next steps to take to begin with these efforts

©2010 American Institutes for Research® 9 www.betterhighschools.org
Features of the Self-Assessment Tool
• The tool has:
– A cumulative rating system to assess the degree of implementation of each indicator, focus area, and element.
– Printable reports that highlight the level of implementation for each element and focus area
– Printable summary reports that provide an overall look at the degree of implementation of the Eight Elements
– The ability to save self-assessment data so users can update reports as school improvement efforts are implemented
©2010 American Institutes for Research® www.betterhighschools.org
Demonstration ofA Self-Assessment: A Coherent
Approach to High School Improvement
©2010 American Institutes for Research® www.betterhighschools.org
High School Improvement Activity
©2010 American Institutes for Research® 12 www.betterhighschools.org
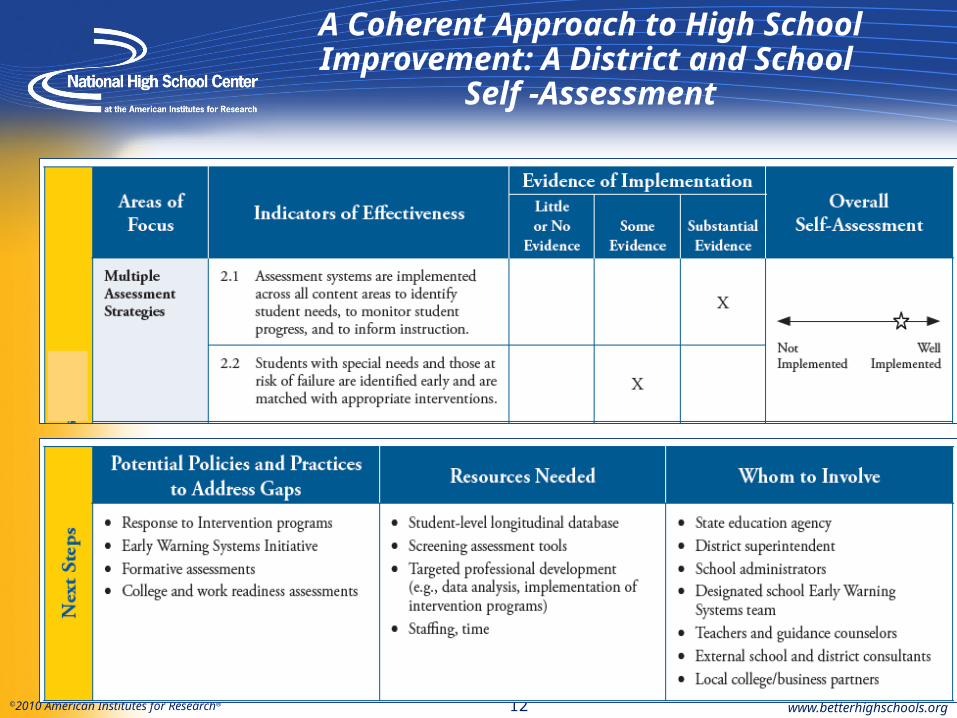
A Coherent Approach to High School Improvement: A District and School
Self -Assessment

©2010 American Institutes for Research® 13 www.betterhighschools.org
High School Improvement Activity
• Using the paper and pencil version of the online self-assessment (which we’ve distributed), examine the indicators to find areas where you school should begin efforts.
• Plan next steps in addressing these areas:
– What policies or practices can be used to address these areas of need?
– What resources are needed for this work?
– Whom should we involve to do the work?

©2010 American Institutes for Research® www.betterhighschools.org
Early Warning System (EWS) Tool v2.0
Background and Research

©2010 American Institutes for Research®
Sobering Statistics…
• Nearly one-third of all high school students leave the public school system before graduating
• 1.2 million students drop out of high school each year – that’s 12 million over the next decade
• 7,000 students drop out of high school every day
• 15% of the high schools in the U.S. produce 50% of our dropouts – schools Balfanz and Legters call “dropout factories”
Balfanz, R. and Legters, N. (2006, July 12). The graduation rate crisis we know and what can be done about it. Retrieved online from http://web.jhu.edu/CSOS/graduationgap/edweek/Crisis_Commentary.pdf
www.betterhighschools.org15
©2010 American Institutes for Research®
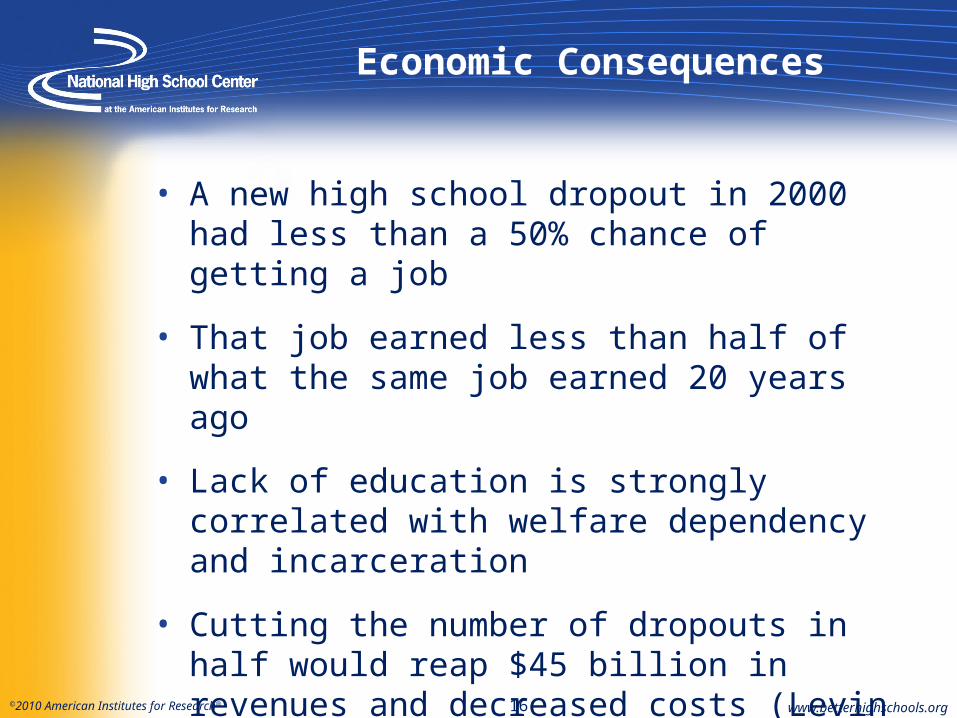
Economic Consequences
• A new high school dropout in 2000 had less than a 50% chance of getting a job
• That job earned less than half of what the same job earned 20 years ago
• Lack of education is strongly correlated with welfare dependency and incarceration
• Cutting the number of dropouts in half would reap $45 billion in revenues and decreased costs (Levin et al., 2007)
www.betterhighschools.org16
©2010 American Institutes for Research® 17
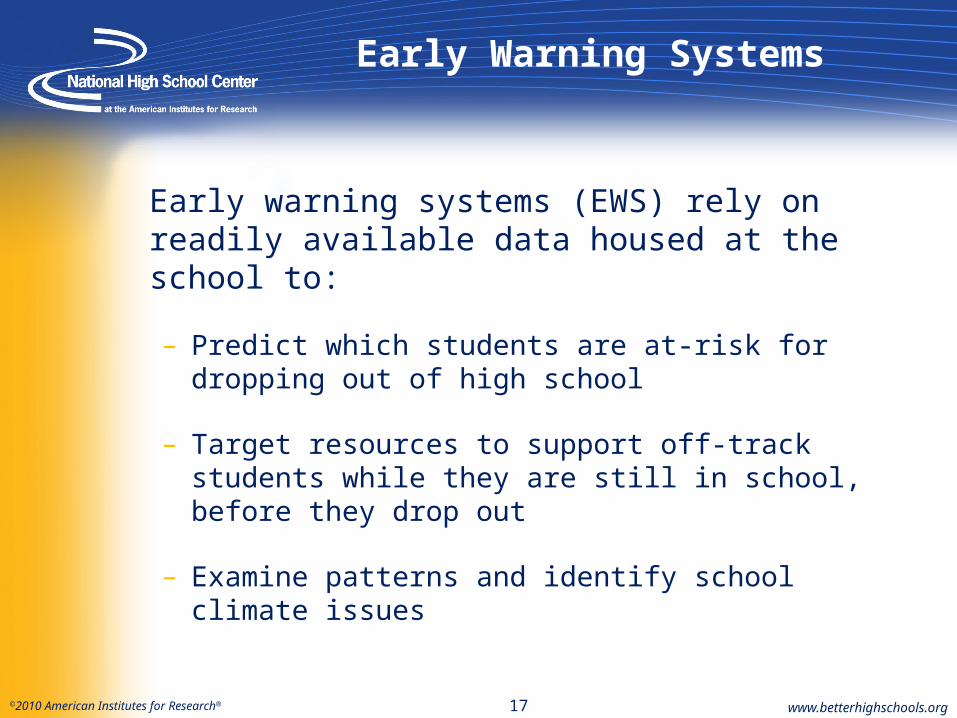
Early Warning Systems
Early warning systems (EWS) rely on readily available data housed at the school to:
– Predict which students are at-risk for dropping out of high school
– Target resources to support off-track students while they are still in school, before they drop out
– Examine patterns and identify school climate issues
www.betterhighschools.org

©2010 American Institutes for Research® 18
9th Grade is a Critical Year
• Ninth grade is a “make or break year”
– More students fail 9th grade than any other high school grade
– A disproportionate number of students who are held back in 9th grade subsequently drop out
• Monitoring students’ progress throughout 9th grade—and even during the first semester—provides powerful indicators that can predict whether students will complete high school:
– Engagement
– Course performance
– Chicago’s “On-Track” Indicator (CCSR End-of-Year)
www.betterhighschools.org

©2010 American Institutes for Research® 19
Key Indicators
Engagement
• Attendance/absenteeism
Course Performance
• Course grades
• Number of credits earned
CCSR End-of-Year Indicator
• Core course performance & accumulated credits
www.betterhighschools.org
Research from several U.S. school districts provides a strong foundation for defining 9th grade warning signs that students might drop out, but local adaptation is key.

©2010 American Institutes for Research® 20
“High-Yield” Academic Indicators: Attendance
www.betterhighschools.org
0-4 5-9 10-14 15-19 20-24 25-29 30-34 35-39 40+0%
20%
40%
60%
80%
100%87%
63%
41%
21%
9%5% 2% 1% 0%
Four-Year Graduation Rates for CPS Students Entering High School in 2001, by 9th Grade Absences (Allensworth & Easton, 2007)
Days Absent Per Semester (Course Cutting Counted as Partial Days)
Perc
ent G
radu
ated
in F
our Y
ears

©2010 American Institutes for Research® 21
“High-Yield” Academic Indicators: Course Failures
www.betterhighschools.org
0 1 2 3 4 5 6 7 8 More than 8
0%
20%
40%
60%
80%
100%
85%
70%
55%
42%33%
25%
13% 11%7%
2%
Four-Year Graduation Rates for CPS Students Entering High School in 2001, by Freshman Course Failures (Allensworth & Easton, 2007)
Semester Course Failures
Perc
ent G
radu
ated
in F
our Y
ears
©2010 American Institutes for Research® 22
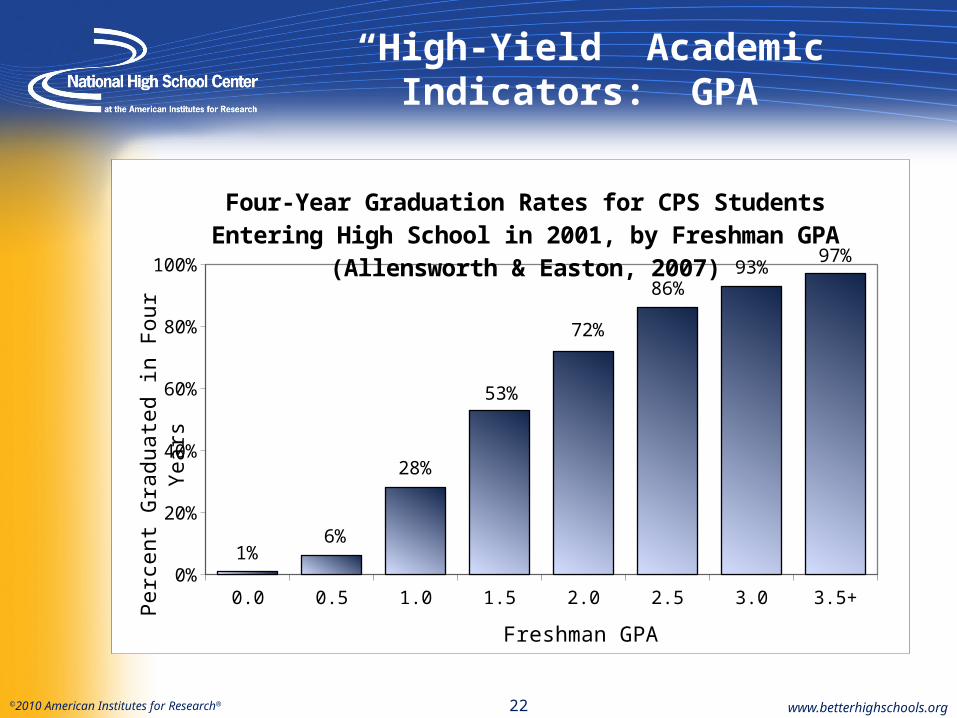
“High-Yield” Academic Indicators: GPA
www.betterhighschools.org
0.0 0.5 1.0 1.5 2.0 2.5 3.0 3.5+0%
20%
40%
60%
80%
100%
1%6%
28%
53%
72%
86%93%
97%
Four-Year Graduation Rates for CPS Students Entering High School in 2001, by Freshman GPA (Allensworth & Easton, 2007)
Freshman GPA
Perc
ent G
radu
ated
in F
our Y
ears
©2010 American Institutes for Research®
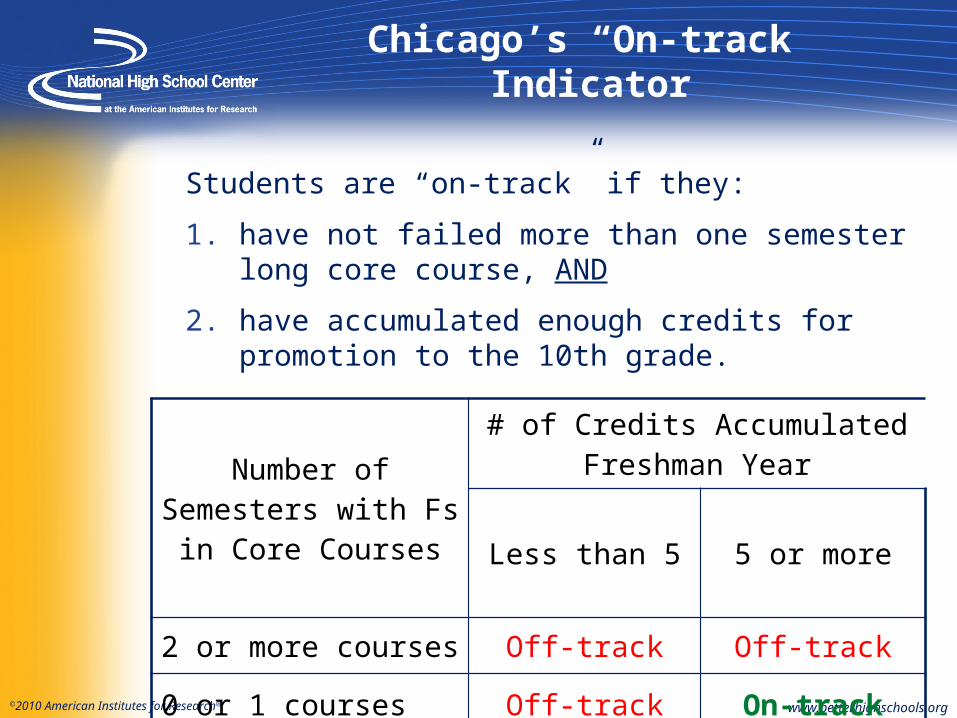
Chicago’s “On-track” Indicator
Students are “on-track” if they:
1. have not failed more than one semester long core course, AND
2. have accumulated enough credits for promotion to the 10th grade.
www.betterhighschools.org
Number of Semesters with Fs in Core
Courses
# of Credits Accumulated Freshman Year
Less than 5 5 or more
2 or more courses Off-track Off-track
0 or 1 courses Off-track On-track

©2010 American Institutes for Research®
CCSR End of Year Indicator
www.betterhighschools.org
Source: Allensworth & Easton (2005)
©2010 American Institutes for Research® 25
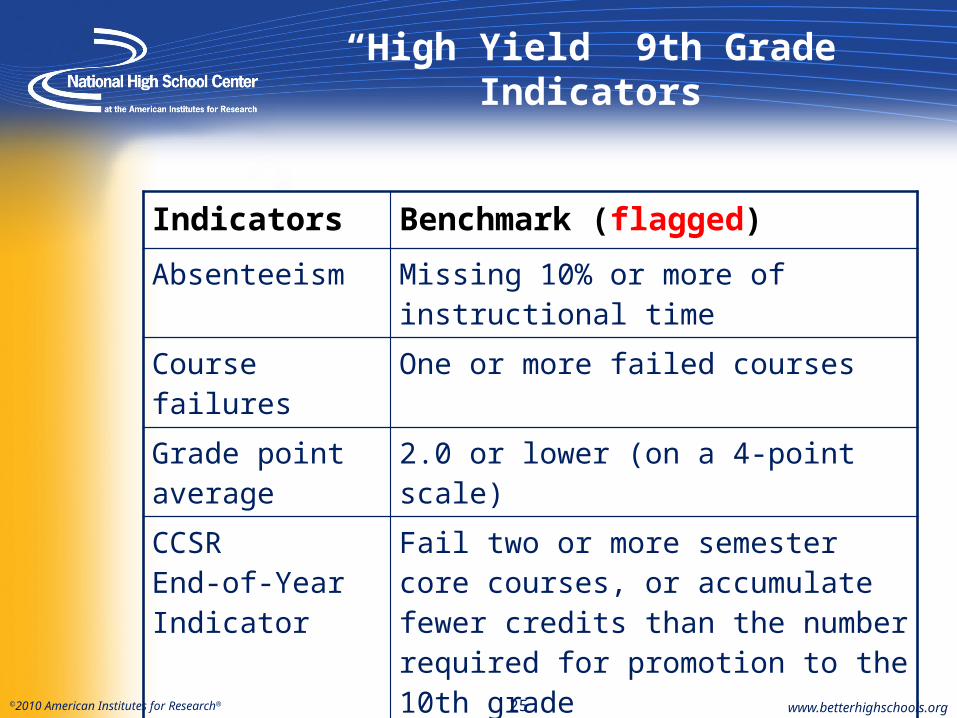
“High Yield” 9th Grade Indicators
Indicators Benchmark (flagged)
Absenteeism Missing 10% or more of instructional time
Course failures One or more failed courses
Grade point average
2.0 or lower (on a 4-point scale)
CCSREnd-of-Year Indicator
Fail two or more semester core courses, or accumulate fewer credits than the number required for promotion to the 10th grade
www.betterhighschools.org

©2010 American Institutes for Research® www.betterhighschools.org
EWS Tool v2.0 Features
26
©2010 American Institutes for Research® 27
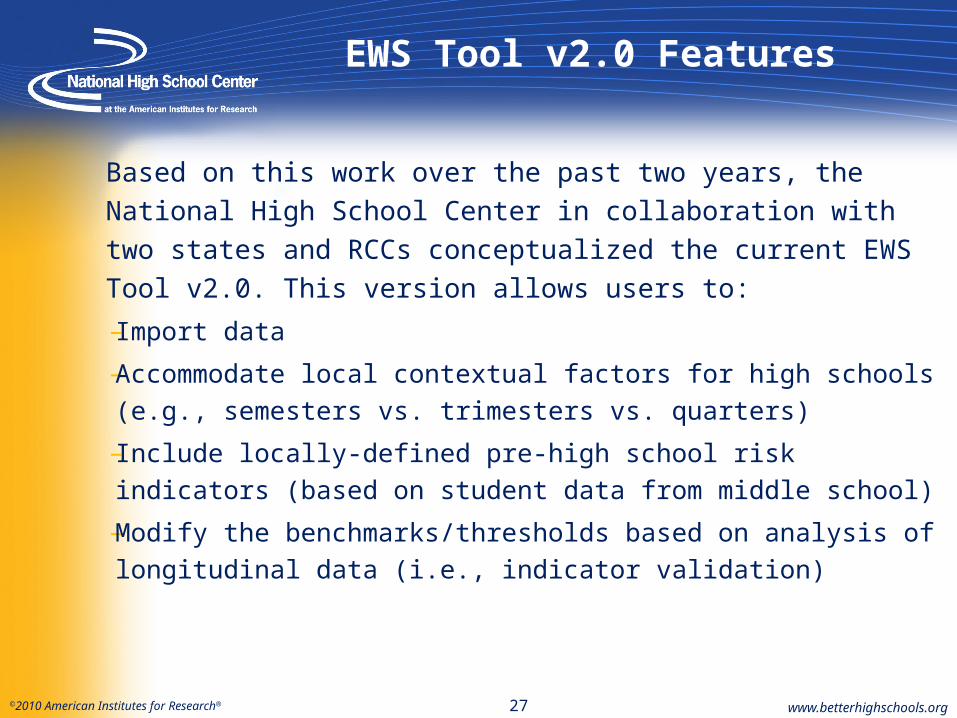
EWS Tool v2.0 Features
Based on this work over the past two years, the National
High School Center in collaboration with two states and
RCCs conceptualized the current EWS Tool v2.0. This
version allows users to:
– Import data
– Accommodate local contextual factors for high schools
(e.g., semesters vs. trimesters vs. quarters)
– Include locally-defined pre-high school risk indicators
(based on student data from middle school)
– Modify the benchmarks/thresholds based on analysis of
longitudinal data (i.e., indicator validation)
www.betterhighschools.org

©2010 American Institutes for Research® 28
VEWS Tool Features
Features, continued:
– House an inventory of dropout prevention interventions
– Assign students to intervention programs and monitor student response and progress in the interventions over the course of the school year
– Create pre-set school-level summary reports, detailed student-level reports, and individual student reports
– Create customized student-level reports
www.betterhighschools.org
©2010 American Institutes for Research®
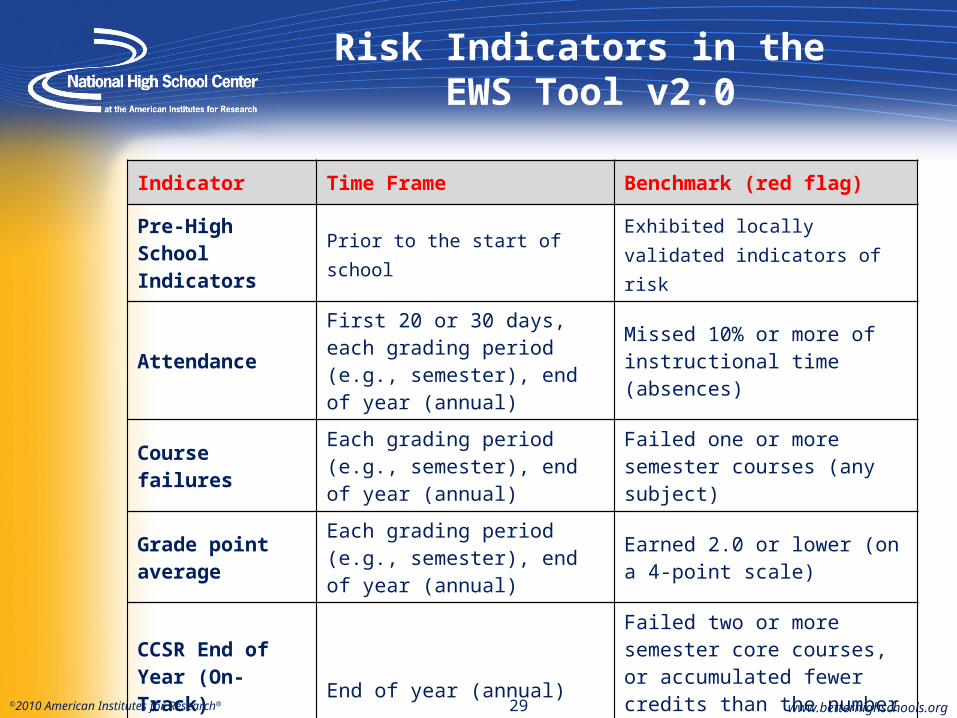
Risk Indicators in the EWS Tool v2.0
29 www.betterhighschools.org
Indicator Time Frame Benchmark (red flag)
Pre-High School Indicators Prior to the start of school
Exhibited locally validated indicators of risk
Attendance
First 20 or 30 days, each grading period (e.g., semester), end of year (annual)
Missed 10% or more of instructional time (absences)
Course failuresEach grading period (e.g., semester), end of year (annual)
Failed one or more semester courses (any subject)
Grade point average
Each grading period (e.g., semester), end of year (annual)
Earned 2.0 or lower (on a 4-point scale)
CCSR End of Year (On-Track) indicator
End of year (annual)
Failed two or more semester core courses, or accumulated fewer credits than the number required for promotion to the next grade
©2010 American Institutes for Research® www.betterhighschools.org
The EWS Implementation Process
©2010 American Institutes for Research® 31 www.betterhighschools.org
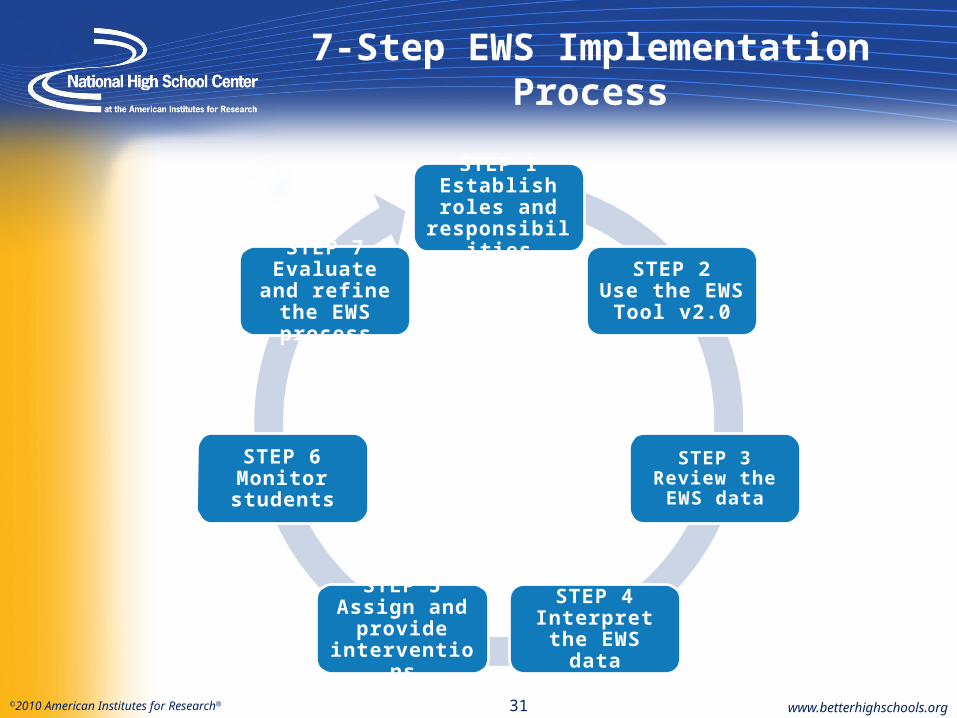
7-Step EWS Implementation Process
STEP 1Establish roles
and responsibilities
STEP 2Use the EWS Tool
v2.0
STEP 3Review the EWS
data
STEP 4Interpret the EWS
data
STEP 5Assign and
provide interventions
STEP 6Monitor students
STEP 7Evaluate and
refine the EWS process

©2010 American Institutes for Research®
Step One: Establish Roles and Responsibilities
• EWS teams need to include individuals who have:
– Authority to make decisions
– Knowledge of diverse students
– Expertise to manage and analyze data
• EWS team are required to:
– Meet regularly
– Communicate EWS/dropout prevention issues to
groups/individuals outside of the team
– Solicit feedback from stakeholders (leaders, staff,
students, parents)
– Monitor students’ progress32 www.betterhighschools.org
©2010 American Institutes for Research®
Step Two:Use the EWS Tool v2.0
• In order to be used as an effective tool to support EWS team work:
– Data must be regularly entered/imported throughout the school year
– At least one individual should be responsible for ensuring the EWS tool is loaded with the latest data
– EWS Team members must be trained to understand the use of the tool
– Reports must be used to make decisions about students
– Students must be assigned to interventions and progress monitored
www.betterhighschools.org

©2010 American Institutes for Research®
Step Three: Review EWS Data
• EWS data are reviewed and monitored to identify students at risk for dropping out and to understand patterns in student engagement and academic performance
• Questions to ask about EWS data:
– Student-level patterns: What do your data tell you about individual students who are at-risk?
– School-level patterns: What do your data tell you about how the school is doing?
• Are students who were flagged from the beginning remaining “off-track” through the year?
• Are students who were flagged at one reporting period back “on-track” at the next?
www.betterhighschools.org

©2010 American Institutes for Research®
Step Four: Interpret EWS Data
• The EWS team must look BEYOND the indicators and dig deeper into reasons for student disengagement with school and academic failure
– Indicators are just observable symptoms, not root causes
– It is important to examine additional data from a variety of sources not included in the tool (e.g., talking to classroom teachers, parents, individual students, other adults in the school)
• Looking at data beyond those in the EWS Tool can help identify individual and common needs among groups of students and raise new questions for understanding students’ reasons for being off-track for graduation
www.betterhighschools.org
©2010 American Institutes for Research®
Step Four: Interpret EWS Data (cont.)
• Understanding characteristics of students at-risk of dropout is important because:
– Decisions to persist or drop out are affected by multiple contextual factors - family, school, neighborhood, peers
– Personal and school factors contribute to success or failure during the freshman year
– Attendance and course performance problems are distinct indicators in the EWS but are highly interrelated, and both can signal disengagement
– Student background characteristics are less important in explaining failures than behaviors in high school
www.betterhighschools.org

©2010 American Institutes for Research®
Step Five:Assign and Provide Interventions
• The EWS team matches individual students to specific interventions after having gathered information about:
– Potential root causes for individual flagged students
– The available dropout prevention and academic and behavioral support programs in the school, district, and community
• A tiered approach can be used to match students to interventions based on their individual needs
37 www.betterhighschools.org
©2010 American Institutes for Research®
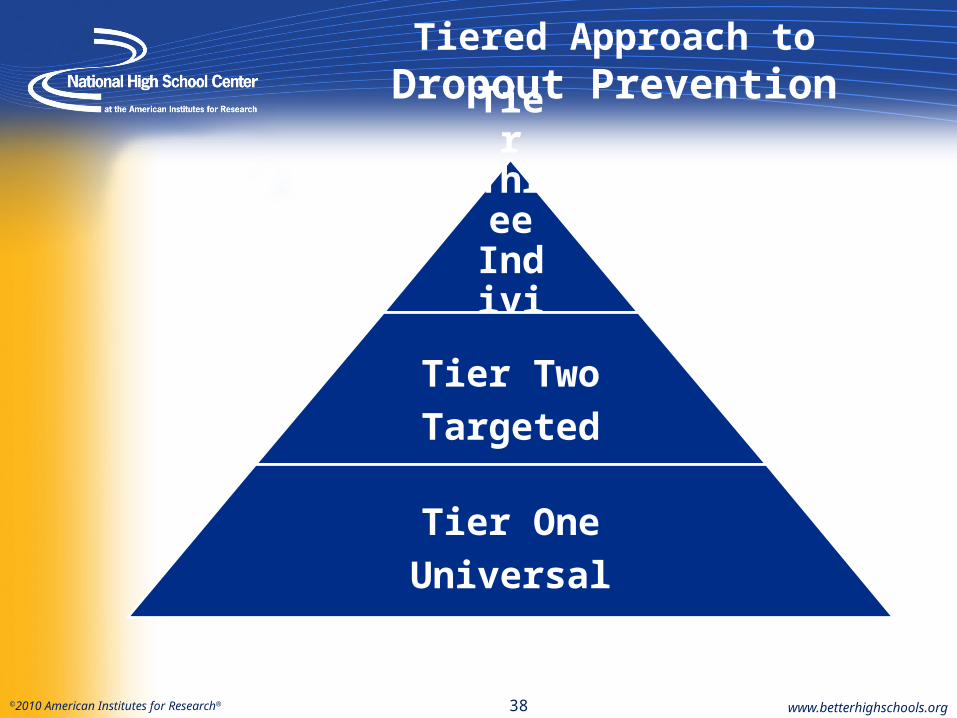
Tiered Approach toDropout Prevention
Tier Three Individualized
Tier Two
Targeted
Tier One
Universal
www.betterhighschools.org38
©2010 American Institutes for Research®
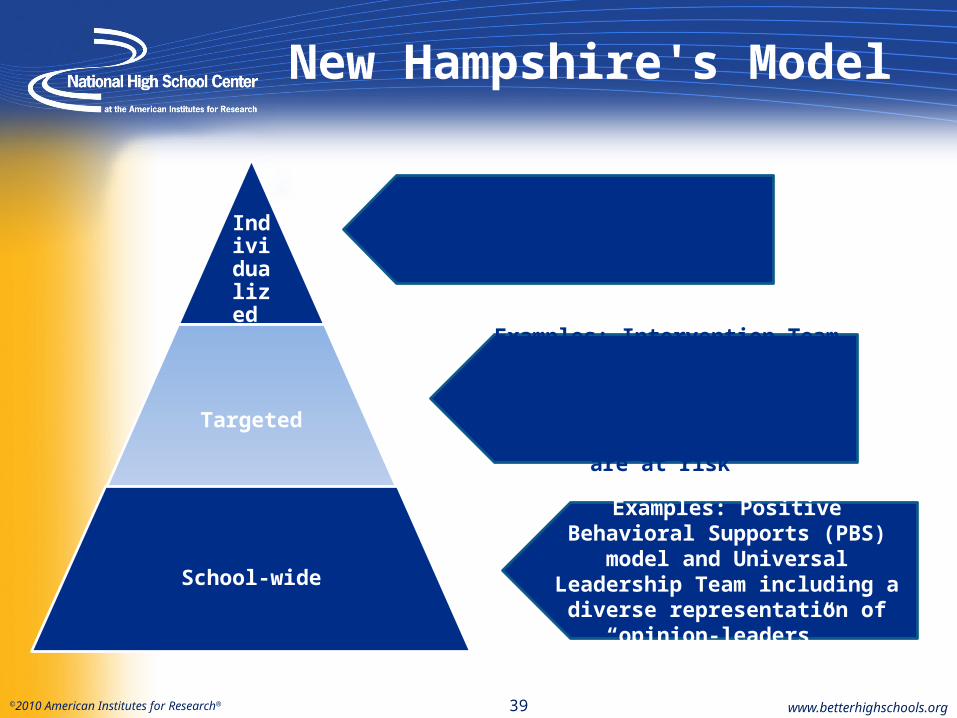
New Hampshire's Model
www.betterhighschools.org
Examples: Positive Behavioral Supports (PBS) model and Universal Leadership Team
including a diverse representation of “opinion-leaders”
Examples: Intervention Team of specialists and administrators will
focus on students who exhibit challenging behaviors and who are
at risk
Examples: RENEW (Rehabilitation, Empowerment, Natural supports, Education and Work) facilitators
Individualized
Targeted
School-wide
39
©2010 American Institutes for Research®
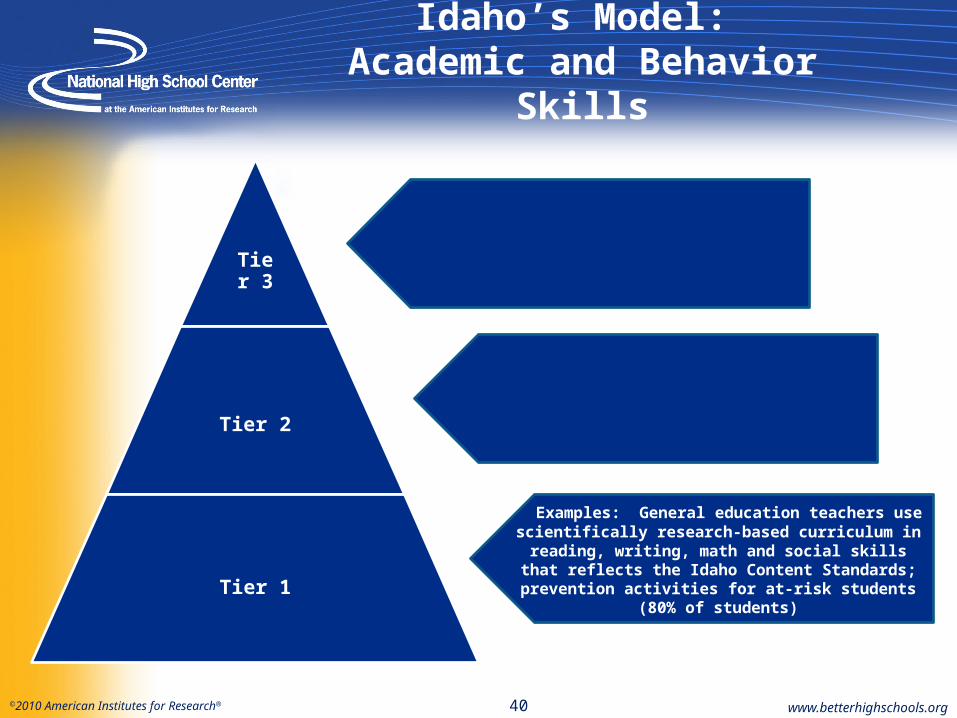
Idaho’s Model: Academic and Behavior Skills
www.betterhighschools.org
Examples: General education teachers use scientifically research-based curriculum in reading, writing, math and social skills that
reflects the Idaho Content Standards; prevention activities for at-risk students (80% of students)
Examples: General education instruction with additional intervention (increased time, immediate
corrective feedback, point system, varied class size) in or out of the classroom, conducted by
trained and supervised personnel (15% of students)
Examples: Intensified intervention with individual student goals in mind; perhaps specialized services, such as remediation programs, Special Education, or those for
accelerated learners (5% of students)Tier 3
Tier 2
Tier 1
40

©2010 American Institutes for Research®
Example Programs that incorporate this strategy:
America’s Choice
First Things First
School Development Program
Talent Development High School
Example Programs that incorporate this strategy:
America’s Choice
Talent Development High School
Step Five (cont.):Assign and Provide Interventions
• Focus on achievement in core courses • Content recovery courses• Tutoring as an academic support • Tiered approaches• Attendance and behavior monitors• Advisories and team teaching• Counseling and mentoring• Small learning communities and school within a
school for greater personalization• Partnerships between high schools and feeder
middle schools• Ninth grade transition programs• Support for students with disabilities outside
of school• Career and college awareness• Family engagement• Community engagement
Example Programs that incorporate this strategy:
America’s Choice
Check and Connect
Coca-Cola VYP
Interpersonal Relations Personal Growth Class
NGP
Quantum Opportunities Program
School Development Program
Talent Development High School
Twelve Together
Example Programs that incorporate this strategy:
Academic Literacy Program
Positive Behavioral Interventions and Supports (PBIS)
Rehabilitation, Empowerment, National supports, Education, and Work (RENEW)
RTI
Strategic Instruction Model
Example Programs that incorporate this strategy:
ALAS
Check and Connect
Coca-Cola VYP
Interpersonal Relations Personal Growth Class
PBIS
Project COFFEE
Talent Development High School
Teen Outreach Program
Example Programs that incorporate this strategy:
Middle College High School
NGP
STEP
Example Programs that incorporate this strategy:
ALAS
Check and Connect
First Things First
Interpersonal Relations Personal Growth Class
Project COFFEE
Twelve Together
Example Programs that incorporate this strategy:
Career Academies
First Things First
Middle College High School
NGP
Project COFFEE
Talent Development High School
Example Programs that incorporate this strategy:
Project GRAD
Example Programs that incorporate this strategy:
Career Academies
Ninth Grade Success Academies
STEP
Example Programs that incorporate this strategy:
Check and Connect
PBIS
Example Programs that incorporate this strategy:
Career Academies
Learning to Work Program (NYC)
Lifelong Options Program (LOP)
Middle College High School
Project COFFEE
RENEW
Twelve Together
Example Programs that incorporate this strategy:
ALAS
First Things First
Support Center for Adolescent Mothers (Family Growth Center)
NGP
Talent Development High School
Example programs using these types of strategies:
• ALAS• America’s Choice• Career Academies• Check and Connect• Support Center for Adolescent
Mothers (Family Growth Center)
• Middle College High School• NGP• Quantum Opportunities
Program• Teen Outreach Program
41
©2010 American Institutes for Research®
Step Six: Monitor Students and Interventions
• The EWS team monitors students who are participating in interventions to:
– Make necessary midcourse corrections by identifying students’ whose needs are not being met
– Identify new interventions that will to meet students’ needs
– Use data to monitor the effectiveness of interventions offered
• Increase knowledge about the general effectiveness of interventions
• Improve the matching of students to interventions
– Communicate with families and appropriate stakeholders and solicit their involvement in the monitoring process
42 www.betterhighschools.org
©2010 American Institutes for Research®
Step Seven: Evaluate and Refine the EWS Process
• Refine the EWS Implementation Process
– During the school year
– At the end of a school year
• Identify short- and long-term needs and solutions
– Student needs
– Organizational needs (school and/or division)
www.betterhighschools.org43
©2010 American Institutes for Research®
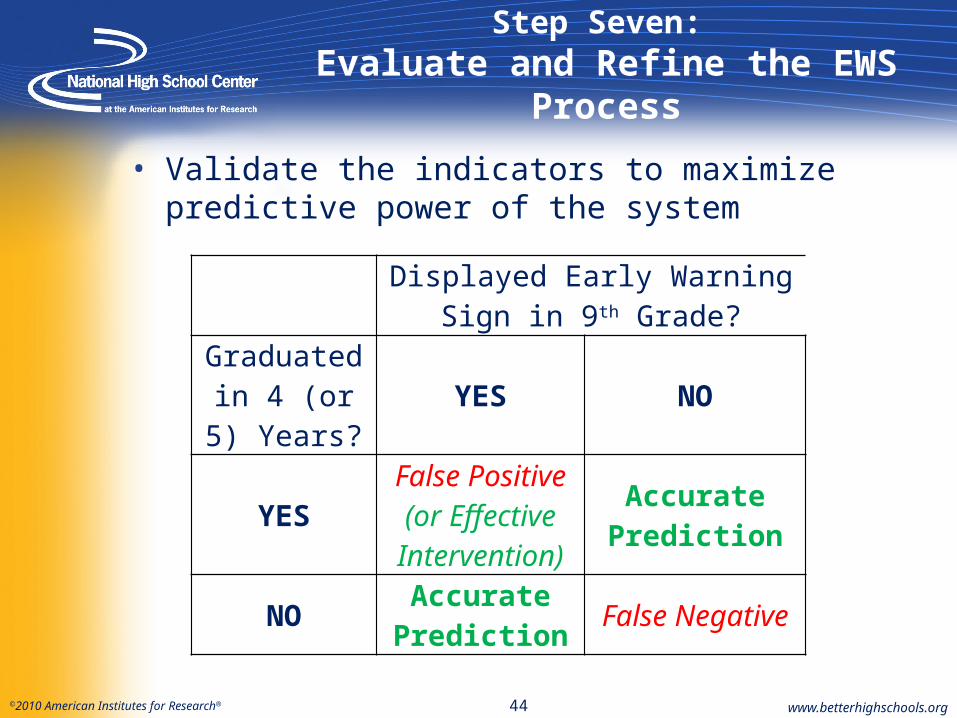
Step Seven: Evaluate and Refine the EWS Process
• Validate the indicators to maximize predictive power of the system
www.betterhighschools.org
Displayed Early Warning Sign in 9th Grade?
Graduated in 4 (or 5) Years?
YES NO
YESFalse Positive(or EffectiveIntervention)
AccuratePrediction
NOAccurate
PredictionFalse Negative
44
©2010 American Institutes for Research®
EWS Tool v2.0 Demonstration
www.betterhighschools.org
©2010 American Institutes for Research® www.betterhighschools.org
EWS Tool v2.0 and High School Improvement
©2010 American Institutes for Research® 47 www.betterhighschools.org
Identifying School Improvement Issues
• How can the EWS Tool v2.0 support high school improvement efforts?
– The Tool helps provides data/evidence of areas of need
• EWS student level reports
• EWS school level reports
©2010 American Institutes for Research® 48 www.betterhighschools.org
EXAMPLEEWS Implementation Process
• EWS Implementation Guide Example
– Step 7: Evaluate and refine the EWS process
• Guiding Questions - Longer-Term Question:
• Do the EWS data reveal systemic problems in the district or school (e.g., risk factors that are prevalent from year to year, feeder patterns, schools with persistent problems, groups of students who are consistently identified)?
• How can the EWS Tool v2.0 reports be used to identify areas of need?
©2010 American Institutes for Research® 49 www.betterhighschools.org
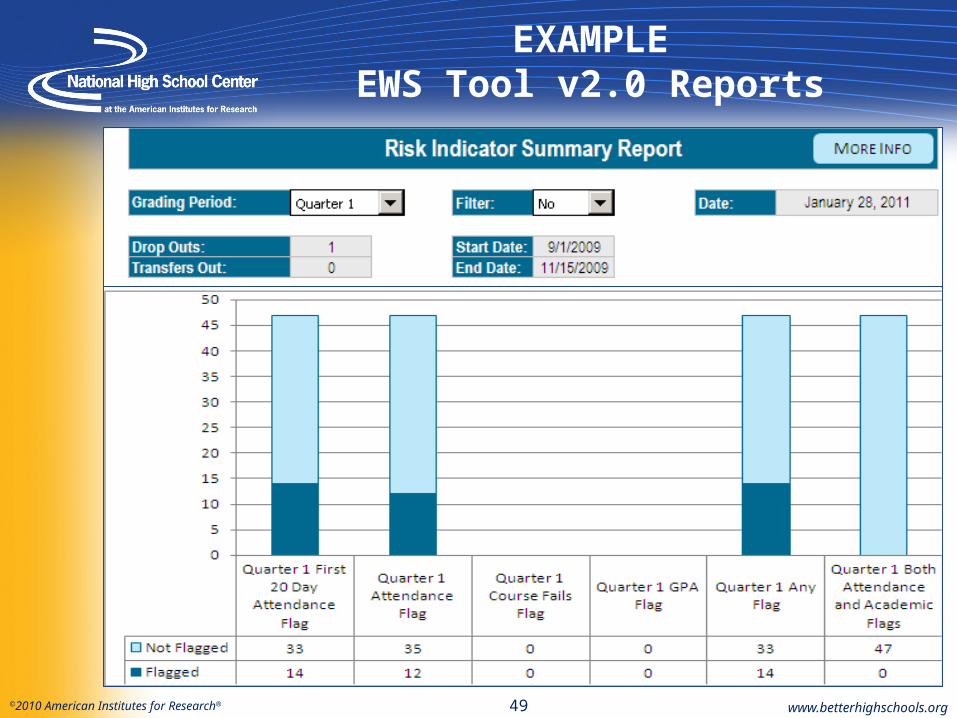
EXAMPLEEWS Tool v2.0 Reports
©2010 American Institutes for Research® 50 www.betterhighschools.org
EXAMPLEIdentified Issues
• Areas of need
– Many students are falling off-track for graduation after only the first quarter of 9th grade, flagged for attendance indicators
– Students are not engaged into school when they enter high school, therefore they are not attending.
– Students are not being supported as they transition from middle grades to high school
©2010 American Institutes for Research® 51 www.betterhighschools.org
EXAMPLEPossible Solutions and Next Steps
• Possible solutions and next steps
– Implement a transition intervention in your school to engage all students from middle grades to high school.
– Keep track of interventions and students assigned to interventions using the EWS Tool v2.0
– Monitor over time if students are getting back on track for graduation through this intervention using the EWS Tool v2.0

©2010 American Institutes for Research® 52 www.betterhighschools.org
EXAMPLEMonitoring Transition Services
©2010 American Institutes for Research® 53 www.betterhighschools.org
Other Tool Features
• The Tool can also sort data by subgroups of students
– Students with Disabilities
– English Language Learners
– Economically Disadvantaged Students
• The user can run reports filtering by demographics to view if different subgroups of students need specific supports

©2010 American Institutes for Research® 54 www.betterhighschools.org
Self-Assessment and EWS
• Self-Assessment and EWS Tool v2.0
– The EWS Tool v2.0 provides supporting evidence, through the reports, for user ratings on some of the self-assessment indicators
– EWS Tool v2.0 reports allow users to track performance over time (after self-assessment baseline) to see if schools are improving on some identified areas of need
©2010 American Institutes for Research® 55 www.betterhighschools.org
For More Information
• National High School Center Products http://www.betterhighschools.org
• EWS Page: http://betterhighschools.org/ews.asp
• EWS Tool v2.0
• EWS Implementation Guide
• EWS Tool v2.0 Technical Manual
• Various other supporting materials
• Sample data, source file templates, dropout prevention briefs
• A Self-Assessment: A Coherent Approach to High School Improvement (Online self-assessment)
• A Coherent Approach to High School Improvement: A District and School Self-Assessment http://betterhighschools.org/pubs/documents/EightElementsSelfAssessmentTool.pdf
©2010 American Institutes for Research® www.betterhighschools.org
Break
©2010 American Institutes for Research® www.betterhighschools.org
Case Study Activity


![VULCAN HIGH SPEED DEEP FAT FRYER (ELECTRIC) › vulcan-website...Vulcan catering equipment (ptY)ltD [ 2 ] VULCAN HIGH SPEED DEEP FAT FRYER (ELECTRIC) GENERAL DATA: MANUFACTURER: Vulcan](https://img.pdfslide.net/doc/110x75/60c05ae5c355355f26327394/vulcan-high-speed-deep-fat-fryer-electric-a-vulcan-website-vulcan-catering.jpg)