Embed Size (px)
Citation preview

© 2010
Public Health Module
VenueDate
Unit: Public Health Aspects of Coronary Heart Disease

LTPHN/KK/AD © 2010
Introduction to public health
WB6
2

LTPHN/KK/AD © 2010
What is health?WB6
WHO Definition ‘a state of complete physical, mental and social well-being and not merely the absence of disease or infirmity’
Antonovosky: Salutogenic model ‘sense of coherence’
Seedhouse and Duncan: Achievement of potential
Empirical Lack of health
3

LTPHN/KK/AD © 2010
What is public health?WB7
‘the science and art of preventing disease, prolonging life and promoting health through the organized efforts of society’
C.E.A. Winslow, 1920
4

5 LTPHN/KK/AD © 2010
The Wider Determinants of Health
Source: Dahlgreen and Whitehead, G and Whitehead M (1991)
WB7

6 LTPHN/KK/AD © 2010
The Challenge for Public HealthWB7

LTPHN/KK/AD © 2010
Statistical description of nation’s healthWB8
Census data
Health Inequalities data
Infant Mortality Rates
7

LTPHN/KK/AD © 2010
• Coronary heart disease (CHD) is a condition in which there is inadequate supply of blood and oxygen to a portion of the myocardium
• common cause is atherosclerotic disease of a coronary artery (or arteries) due to build-up of plaque in the inner lining of an artery
• CHD manifests as sudden cardiac collapse
• Acute coronary syndromes (acute myocardial infarction (MI) and unstable angina)
• Exertional angina
• Heart failure
WB9Part 1: Introduction to CHD
8

WB10Global CHD
9 LTPHN/KK/AD © 2010

Global CHD: Cause of deathWB11
10 LTPHN/KK/AD © 2010
WB11
11 LTPHN/KK/AD © 2010

WB10
Q 1. How would you explain a higher CHD death rate and CHD burden in low and middle income countries?
Global trends in CHD
12 LTPHN/KK/AD © 2010

• CHD is the most common single cause of death in UK (both men and women)
• UK has one of the highest death rates from CHD in the world• A decline in CHD mortality since the 1970s
• 45% of this reduction from improvement in treatment• 55% from reduction in risk factors (stopping smoking and control
of hypertension) • Large regional, socio-economic and ethnic differences in CHD morbidity
and mortality • Low socio-economic groups, South Asian population and
Northern regions of the UK have been shown to have greater risk of CHD
Global trends in CHD
13 LTPHN/KK/AD © 2010

WB12
Q2: What effect will adverse trends in risk behaviours have on CHD mortality rates?
14 LTPHN/KK/AD © 2010

• Individual• Premature death (death before 75 years)• Disability• Loss of independence• Loss of earnings• Health related quality of life
• Summary measure
WB13
Impact of CHD
15 LTPHN/KK/AD © 2010
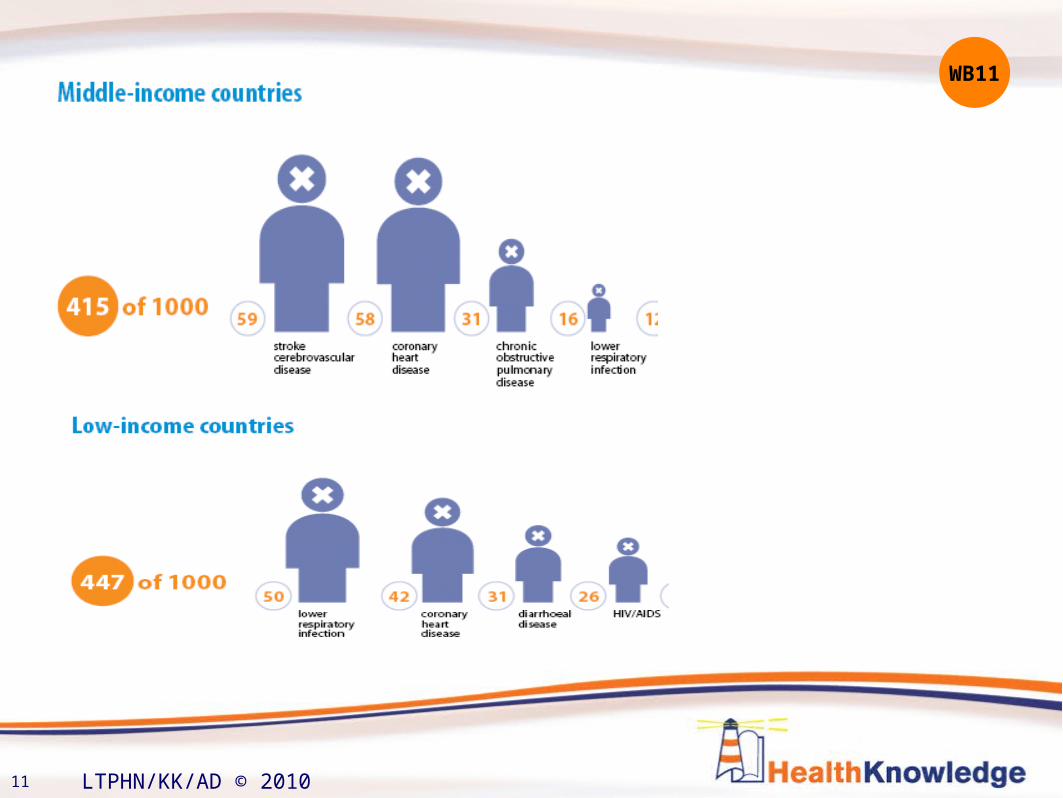
• Society• Informal care costs• Loss in economy• Costs to
healthcare system
Health care costs of CHD, 2006, UK
WB13Impact of CHD
16 LTPHN/KK/AD © 2010

Q3. Why is CHD a major public health concern
WB15CHD and Public Health
17 LTPHN/KK/AD © 2010

Fixed factors:• Increasing age
• Male sex
• Familial (including race, genetics)
Modifiable risk factors• Tobacco smoke
• High blood cholesterol
• Obesity
• High blood pressure
• Diabetes mellitus
• Psychosocial wellbeing
• Physical inactivity and overweight
• Alcohol
• Daily consumption of fruit and vegetables
WB15
Part 2: Risk factors for CHD
18 LTPHN/KK/AD © 2010

• Population based surveys Health survey for England Welsh Health Survey Scottish Health Survey • Representative• Rely upon individuals correctly recalling and reporting
information about their lifestyles
Q4. What are the strengths and limitations of using health surveys?
WB17
Data sources for risk factors
19 LTPHN/KK/AD © 2010
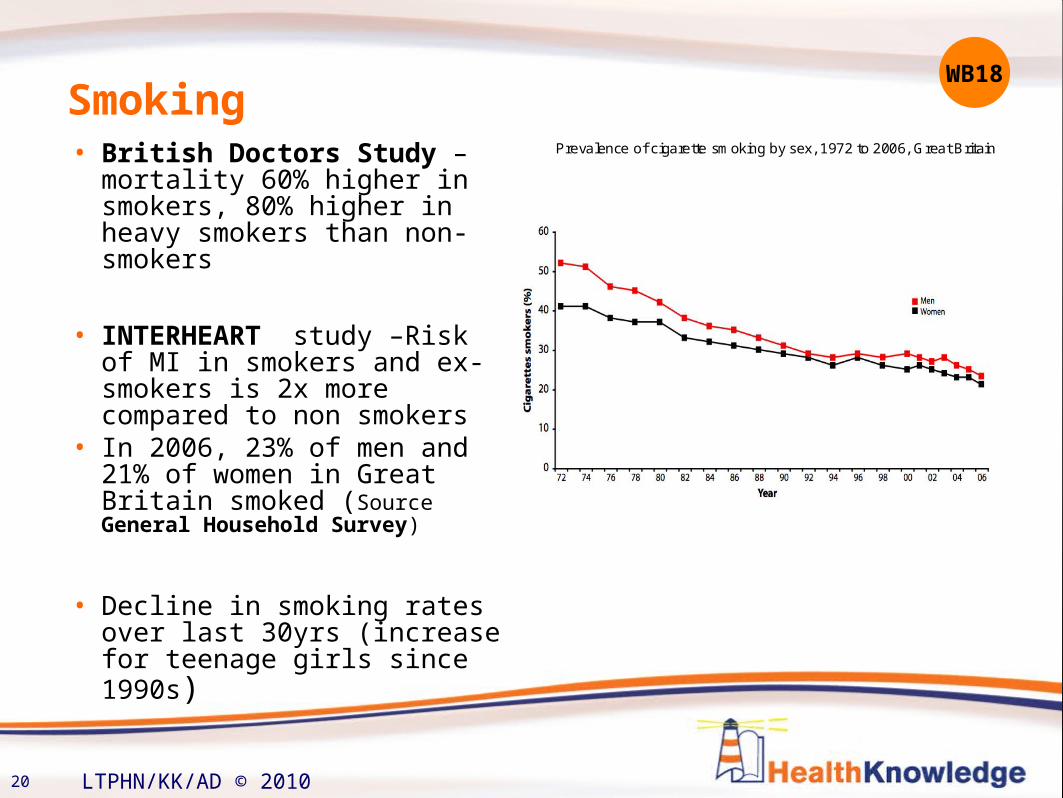
• British Doctors Study – mortality 60% higher in smokers, 80% higher in heavy smokers than non-smokers
• INTERHEART study –Risk of MI in smokers and ex-smokers is 2x more compared to non smokers
• In 2006, 23% of men and 21% of women in Great Britain smoked (Source General Household Survey)
• Decline in smoking rates over last 30yrs (increase for teenage girls since 1990s)
Prevalence of cigarette smoking by sex, 1972 to 2006, Great Britain
WB18Smoking
20 LTPHN/KK/AD © 2010

• Smoking rates vary by age
• Smoking rates higher in Scotland compared to rest of UK
• More prevalent among manual social groups
• Smoking rates vary between ethnic groups in the UK
Cigarette smoking by sex and socio-economic classifi cation, adults aged 16 and over 2006, GreatBritain
Smoking
21 LTPHN/KK/AD © 2010

• Low levels of High-density lipoprotein cholesterol (HDL-C) are associated with increased risk of CHD. Guidelines on HDL-C recommend treatment for those with concentrations below 1.0mmol/l
• Framingham heart study - The lower the high-density lipoprotein cholesterol (HDL-C) and higher low-density lipoprotein cholesterol (LDL-C) levels , the greater is the likelihood of developing CHD
Prospective Studies Collaboration
• Prospective Studies Collaboration – 1 mmol/L lower total cholesterol was associated with about a half , a third and a sixth lower IHD mortality in both sexes at ages 40-49, 50-69 & 70-89,
respectively
WB20High Cholesterol
22 LTPHN/KK/AD © 2010

• Total blood cholesterol levels in the UK are around average for Europe but high by international standards, particularly in women
• In England the prevalence of raised total cholesterol is decreasing for men and women
• Rates of low HDL-cholesterol are much higher in men than women – over five times higher overall
• The Whitehall II study- low HDL- cholesterol levels vary with income; those with higher incomes are less likely to have levels of HDL-cholesterol below 1.0mmol/l
WB22
High Cholesterol
23 LTPHN/KK/AD © 2010

The WHO Report 2002 • ~ over 7% of all disease burden in developed countries caused by raised
body mass index (BMI)• ~a third of CHD and ischaemic stroke and almost 60% of hypertensive
disease in developed countries was due to overweight
INTERHEART• ~63% of heart attacks in Western Europe due to abdominal obesity • abdominal obesity doubles the risk of a heart attack compared to
those without
In England in 2006 (joint health surveys):• 43% of men and 32% of women were overweight (a BMI of 25-30 kg/m2)• 24% of men and 24% of women were obese (a BMI of more than
30 kg/m2)• 32% of men and 41% of women had central obesity
WB23Overweight and Obesity
24 LTPHN/KK/AD © 2010

• WHO SuRF Report 2 - prevalence of overweight and obesity in the UK is among the highest in Europe
• Overweight and obesity including central obesity- increases with age• Prevalence is high in low income & in Black Afro-Caribbean groups
Overweight and obesity are increasing rapidly
Rates of obesity among womenare rising faster in the North thanthe South of England.
Foresight project -predict 60% of the UK adult population could be obese by 2050
Prevalence of obesity by sex, adults aged 16 and over, 1994 to 2006, England
Source: data:Joint Health Surveys Unit (2008) Health Survey for England 2006. Cardiovascular disease and risk factors. The Information Centre: Leeds. Chart: BHF www.heartstat.org
WB24Overweight/Obesity
25 LTPHN/KK/AD © 2010

Q5a: Is there a UK policy to reduce smoking?Q5b: Is there a UK policy to improve cholesterol?Q5c: Is there a UK policy to reduce obesity?
20-27
26 LTPHN/KK/AD © 2010

• Risk of CHD is directly related to both systolic and diastolic blood pressure levels.
• Definition: Systolic blood pressure greater than or equal to 140mmHg, and / or diastolic blood pressure greater than or equal to 90mmHg
• Recommendations for BP no greater than 130mmHg / 80mmHg for diabetes or chronic renal failure
• Threshold for drug treatment : Sustained levels of systolic blood pressure greater than or equal to 160mmHg, and / or diastolic blood pressure greater than or equal to 100mmHg
• Prevalence of hypertension increases with age
• In UK more prevalent amongst Black-Caribbean group
Evidence:
PSC:
• Each 20mmHg increase in usual systolic blood pressure, or 10mmHg increase in usual diastolic blood pressure, doubles the risk of death from CHD
The World Health Report 2002:
• ~11% of all disease burden in developed countries is caused by raised blood pressure
• over 50% of CHD is due to systolic blood pressure levels in excess of the theoretical minimum (115mmHg)
INTERHEART study:
• Around 22% of heart attacks in Western Europe and 25% of heart attacks in Central and Eastern Europe were due to a history of high blood pressure
WB28
Hypertension
27 LTPHN/KK/AD © 2010

• Type I (insulin-dependent) and Type 2 (non-insulin-dependent)- associated with increased risk of CHD
• Other types : gestational diabetes (marker of greater risk of developing Type 2 diabetes in later life)
• Diabetes mellitus is diagnosed by:• Fasting plasma glucose greater
than or equal to 7.0 mmol/L
or• 2-hour plasma glucose (following
a 75 g glucose load) greater than or equal to 11.1 mmol/L
Any patient with insulin resistance has numerous reasons to be at very high risk for atherosclerosis
Diabetes
28 LTPHN/KK/AD © 2010

MRFIT - • Presence of diabetes equivalent to the
presence of 2–3 risk factors • Magnifies the effect of other risk factors
for CHD
Other studies:• Framingham Study - Men with Type 2
diabetes have a 2-4 fold greater annual risk of CHD / 3-5 fold higher risk in women
• INTERHEART study - 15% of heart attacks in Western Europe due to diagnosed diabetes
people with diagnosed diabetes are at 3 times the risk of a heart attack compared to those without
WB30Diabetes - evidence
29 LTPHN/KK/AD © 2010

• Diabetes - common non-communicable disease globally
• Developed countries currently have higher rates than developing countries UK is average for developed countries .
• 3.1% of men and 1.5% of women aged 35 and over have undiagnosed diabetes – (HSE 2003)
• Diabetes increases with age
• High prevalence of diagnosed diabetes: Black Caribbean and South Asian
Source: Joint Health Surveys Unit (2008) Health Survey for England 2006. Cardiovascular disease and risk factors. The Information Centre: Leeds.
Prevalence of diagnosed diabetes in adults, 1991 to 2006, England
Prevalence rates of diabetes is increasing- since 1991 more than doubled
WB31Diabetes
30 LTPHN/KK/AD © 2010

Four different types of psychosocial factor have been found to be most consistently associated with an increased risk of CHD:
• work stress• lack of social support• depression (including anxiety)• personality (particularly hostility)
Among South Asians, the distribution of psychosocial factorsfound to be consistent with ethnic differences in coronary rates.South Asians report high GHQ12 scores.
WB32Psychosocial well-being
31 LTPHN/KK/AD © 2010

WB32
Q7. How do you think psychosocial well-being can effect CHD risk?
32 LTPHN/KK/AD © 2010
• People who are physically active have a lower risk of CHD -maximum benefit with regular and aerobic activity
• WHO 2002 Report > 20% of CHD in developed countries was due to physical inactivity
• Evidence from observational studies: • Regular physical activity reduces risk of CHD associated with overweight
or obesity• Active obese individuals have lower morbidity and mortality than normal
weight individuals • Physical activity levels are low in the UK & below the EU average. • ~ one third of English adults are inactive (participate in less than one
occasion of 30 minutes activity a week)
WB33
Physical inactivity
33 LTPHN/KK/AD © 2010

WB35
Q8. What factors are likely to influence levels of activities from an individual and wider society perspective?
34 LTPHN/KK/AD © 2010

• High levels of intake – particularly in ‘binges’ – the risk of CHD is increased Moderate alcohol consumption reduces the risk of CVD
• WHO Report 2002 - 2% of CHD developed countries is due to alcohol
• From late 1950s alcohol consumption increasing steadily, more than doubling
• Government advises between 2-3 units a day for women and 3-4 for men
• 40% of men and 33% of women consume more than recommended amount in England 2006
• The prevalence of binge drinking was highest in the 16 to 24 years age group
• Adults from each minority ethnic group were less likely to drink alcohol than the general population - except for the Irish who drink beyond recommended levels
WB36
Alcohol
35 LTPHN/KK/AD © 2010

• Evidence is fairly consistent that childhood socioeconomic position (often measured as parents’ occupation or education) is also inversely associated with CHD
• Cumulative exposure to socioeconomic disadvantage across the life course may be inversely associated with CHD; the mechanisms are not fully clear
WB39
Early Life course
36 LTPHN/KK/AD © 2010

WB40
Exercise I:
What are the key patterns in CHD risk factors by age, sex, ethnicity, deprivation and region? Why is it important to understand differences in risk factors between groups? What do trends in the levels of alcohol, smoking and obesity suggest for future levels of CHD?
37 LTPHN/KK/AD © 2010

• CHD is a preventable disease. About half of the decline in CHD mortality is due to lifestyle changes and half due to better treatment and care
• Two approaches for the practical management of risk factors (Rose, 1989)• Population approach• High risk approach
WB41
Part 3: Prevention
38 LTPHN/KK/AD © 2010

WB42
Population and High Risk Strategy
39 LTPHN/KK/AD © 2010

WB42
Q 12. What are the ethical considerations in a population based approach?
40 LTPHN/KK/AD © 2010

• Efficacy: The extent to which a specific intervention produces a beneficial result under ideal conditions. Ideally, the calculation of efficacy is based on the results of a randomised controlled trial.i.e. Whether a treatment can work under ideal (e.g. RCT) circumstances (compared with effectiveness which is examined in routine circumstances)
• Effectiveness: A measure of the extent to which a specific intervention when used in the field in routine circumstances, does what it is intended to do for a specified population. This is a measure of the extent to which a health care intervention fulfils its objectives.e.g. The degree to which a treatment or programme works in an everyday service setting rather than a research environment
WB42Efficacy and effectiveness
41 LTPHN/KK/AD © 2010

WB43
Q13. Why might the efficacy and effectiveness for an intervention differ?
42 LTPHN/KK/AD © 2010

• Primary prevention : Prevents the disease from occurring in those at risk. An example of primary prevention of CHD would be to provide smoking cessation advise to an individual with no history of CHD
• Secondary prevention: Aims to identity high risk individuals in a population and prevent disease progression i.e. from angina to MI or death. An example would be the provision of lipid lowering medications to those with a history of CHD
• Tertiary prevention: Aims to prevent the recurrence of a MI. An example would be revascularisation after a MI for severe cases of CHD
WB44Levels of prevention
43 LTPHN/KK/AD © 2010

Adapted from: George A. Mensah, William H. Dietz, Virginia B. Harris, Rosemarie Henson, Darwin R. Labarthe, Frank Vinicor, Howell Wechsler.Prevention and Control of Coronary Heart Disease and Stroke—Nomenclature for Prevention Approaches in Public Health: A Statement for Public HealthPractice from the Centers for Disease Control and Prevention American Journal of Preventive Medicine, Volume 29, Issue 5, Supplement 1, December2005, Pages 152-157
WB44Prevention and Management
44 LTPHN/KK/AD © 2010

A population wide approach may include
• Integrated national policies• health promotion campaigns (e.g. Change4 life see http://www.nhs.uk/Change4life) or • disease prevention interventions (e.g. legislation to reduce the level of salt in processed food)
• Health promotion can be defined as the process of enabling people to increase control over their health and its determinants, and thereby improve their health (WHO 2005)
The overall objective should be to make it easy for the population to make healthy choices related to diet, physical activity and avoidance of tobacco.
WB45Population wide approach
45 LTPHN/KK/AD © 2010

WB45
46 LTPHN/KK/AD © 2010

WB46
Q14. Discuss the rationale for preventative interventions targeted at: a) high risk groupsb) the whole population
47 LTPHN/KK/AD © 2010

Promote healthy eating:
Agricultural subsidies for fruits and vegetables
Food pricing and availability
Labelling of food
School health education
Promote physical activity
Public transport
Pedestrian- and cyclist friendly road planning
Reduce smoking
Tobacco control measures (prohibition of advertising /ban in public spaces)
Smoking cessation services
Prevention of sudden death by CHD
Availability of automatic external defibrilliators in public places – stations, shopping centres, airport
WB45Effective Health Promotion Policies
48 LTPHN/KK/AD © 2010

• Primary prevention involves high risk approach
• No national policy for cardiovascular screening of the healthy population in primary care
• High risk patients are being detected through new patient checks and opportunistic screening
• Essential that the high-risk approach is complemented by population-wide public health strategies
• Public health approaches can effectively slow down the development of atherosclerosis and reduce incidence of CVD
• Population-wide strategies will also support lifestyle modification in those at high risk
WB45Primary Prevention
49 LTPHN/KK/AD © 2010

Joint British Societies charts assess the ten-year risk of CVD in three age
categories and recommend that CVD prevention in clinical practice should
focus equally on: • people with established atherosclerotic CVD• people with diabetes • apparently healthy individuals at high risk (CVD risk of > =20% over 10
years) of developing symptomatic atherosclerotic disease
Inappropriate in certain patients such as: • smoking status which should reflect lifetime risk and not just current use• premature menopause
Risk estimates have not been validated in ethnic minorities.
WB47Risk Prediction tools
50 LTPHN/KK/AD © 2010

Source: Cardiovascular disease prevention. Translating evidence into action. Geneva, World Health Organization, 2005.
WB48Intensity of Intervention should be proportional to risk
51 LTPHN/KK/AD © 2010
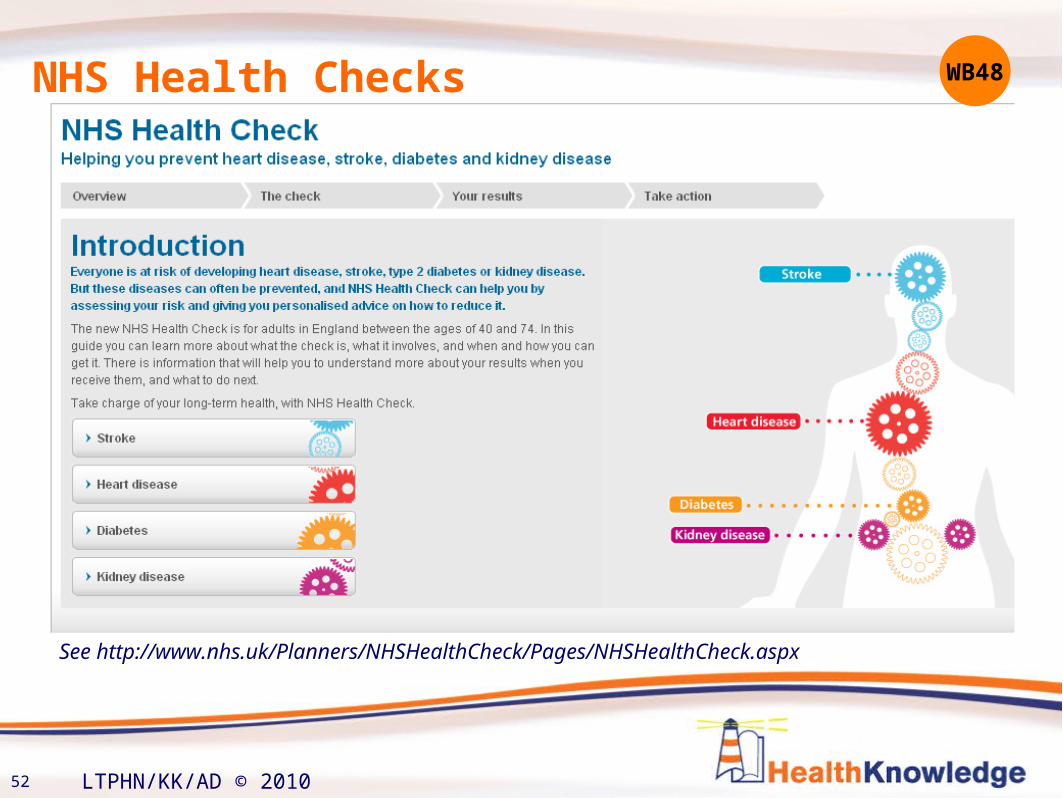
See http://www.nhs.uk/Planners/NHSHealthCheck/Pages/NHSHealthCheck.aspx
WB48NHS Health Checks
52 LTPHN/KK/AD © 2010

Promote physical activityEncouraged to take at least 30 minutes of moderate physical activity (e.g. brisk walking) a day
Smoking statusNonsmokers should be encouraged not to start smoking Smokers encouraged to quit smoking and other forms of tobacco be advised to stopRisk >20% nicotine replacement and /or nortriptyline or amfebutamone
(bupropion) to motivated smokers who fail to quit with counselling
Overweight and obesity Encouraged to reduce total fat and saturated fat, salt intakeIncreased range of fruits and vegetables as well as whole grains and pulses Increase physical activity
WB48
Effective policies – Primary Prevention
53 LTPHN/KK/AD © 2010

• Alcohol - Reduce alcohol intake to recommended levels
• Hypertension - Threshold for treatment: 160/100 mm Hg, or less if target organ damage and specific lifestyle advice
• Serum cholesterol - All individuals with total cholesterol at or above 8 mmol/l (320 mg/dl), should be advised to follow a lipid lowering diet and given a statin to lower the risk of cardiovascular disease
• Diabetes/plasma glucose - Individuals with persistent fasting blood glucose >6 mmol/l despite diet control should be given metformin
• Risk is 30% or more - Antiplatelet : low dose aspirin recommended
WB48Effective policies – Primary Prevention
54 LTPHN/KK/AD © 2010

• Risk charts not necessary to make treatment decisions in people with established cardiovascular disease - as these patients are at very high risk of developing recurrent cardiovascular events
• Intensive life style advice (as in primary prevention) should be given simultaneously with drug treatment
• Following an MI drugs recommended to reduce further attacks and mortality:• Ace inhibitors (to lower high BP)• Beta blocker (to lower high BP)• Antiplatelets (reduce clotting)• statin (to reduce cholesterol)• antihypertensive (to lower high BP)• anti glycaemic (to manage high blood glucose)
WB49Secondary prevention
55

CABG Should be considered as an adjunct to optimal medical treatment including aspirin, lipid lowering treatment, ACE inhibitors and beta-blockers) in those patients at moderate and high risk who are considered likely to have left main stem or triple vessel disease.
PTCAShould be considered for relief of anginal symptoms in patients with refractory angina who are already receiving optimal medical treatment.
WB50Tertiary Prevention
56 LTPHN/KK/AD © 2010

Exercise 2:Using the evidence provided in the workbook, work out a 10 point action plan to reduce the risk of CHD in your local area
WB52
57 LTPHN/KK/AD © 2010

• Coronary Heart Disease is a major public health issue. It is responsible for much of the global burden of disease and is the UK’s biggest killer
• It has substantial impact of the health and well-being of patients
• Costs include the individual patient, family and other carers, NHS and the wider economy
• Much of CHD mortality and morbidity is preventable
• All health professionals have opportunities to support and promote effective preventive interventions
• Tackling the determinants and risk factors for CHD will also impact on other major diseases, such as stroke and type 2 diabetes
WB53Summary
58 LTPHN/KK/AD © 2010

Statistics on: Morbidity – incidence, prevalence, trends Mortality
Part 4: Statistics on CHD
59 LTPHN/KK/AD © 2010

Morbidity is state of being diseased
Two key measures of morbidity:
Incidence is an estimate of risk of developing disease and useful for looking at causes or determinants of disease
• e.g. the incidence of new cases of CHD in a population
Prevalence indicates amount of illness requiring care and is useful in health service planning
• e.g. the proportion of the population with a history of CHD
Sources of morbidity data include:• Hospitals• Primary care• Self reported surveys • Health Survey for England and the General Household Survey suggest
morbidity, particularly in older age groups, appears to be rising
Morbidity
60 LTPHN/KK/AD © 2010

Estimated incidence of CHD per year in UK by gender
Source:BHF statistics estimates based on 2006 CHD mortality data (MI), 2006 UK population estimates - Scottish Continuous Morbidity Study data & (angina), TheHillingdonHeart Failure Study
Incidence (new cases)
61 LTPHN/KK/AD © 2010

Source:BHF statistics estimates based on 2006 CHD mortality data (MI), 2006 UK population estimates - Scottish Continuous Morbidity Study data & (angina), TheHillingdonHeart Failure Study
Estimated incidence of CHD per year in the UK by gender
Incidence (new cases)
62 LTPHN/KK/AD © 2010

0.0
1.0
2.0
3.0
4.0
5.0
6.0
7.0
8.0
1994 1998 2003 2006
Pre
va
len
ce
(%
)
Men
Women
Estimated prevalence of CHD per year in the UK by gender
Prevalence
63 LTPHN/KK/AD © 2010

Q 17. What is the weakness of using self reported diagnosis to determine prevalence?
64 LTPHN/KK/AD © 2010

Prevalence men Total
Myocardial infarction(age 35yrs +)
970000 439000 1.4 million
Angina(35yr +)
1132000 849000 1.98 million
CHD* 1.5 million 1 million 2.5 million
Estimated prevalence of myocardial infarction, angina andheart failure by gender, 2006
Source: BHF www.heartstats.orgEstimates are derived from applying age-specifi c rates to the UK population estimates for 2006,*from self reported doctor diagnosed CHD (angina or heartattack)
Prevalence (existing cases)
65 LTPHN/KK/AD © 2010

Estimated prevalence of CHD per year in the UK by age group among men.
0
5
10
15
20
25
30
35
1994 1998 2003 2006
Pre
va
len
ce
(%
)35-44yrs 45-54yrs
55-64yrs 65-74yrs
75+yrs
Prevalence (existing cases)
66
66
LTPHN/KK/AD © 2010

Prevalence of disease 2006/07, England, Wales and Scotland.
Prevalence
67 LTPHN/KK/AD © 2010

Change in incidence of myocardial infarction, adults aged between 30 and 69, between 1966 and 1996,UK studies compared
Trends in morbidity
68 LTPHN/KK/AD © 2010

Q18. Comment on the regional and gender differences in incidence trends in the table above.
Q19. What drives trends in incidence?
69 LTPHN/KK/AD © 2010
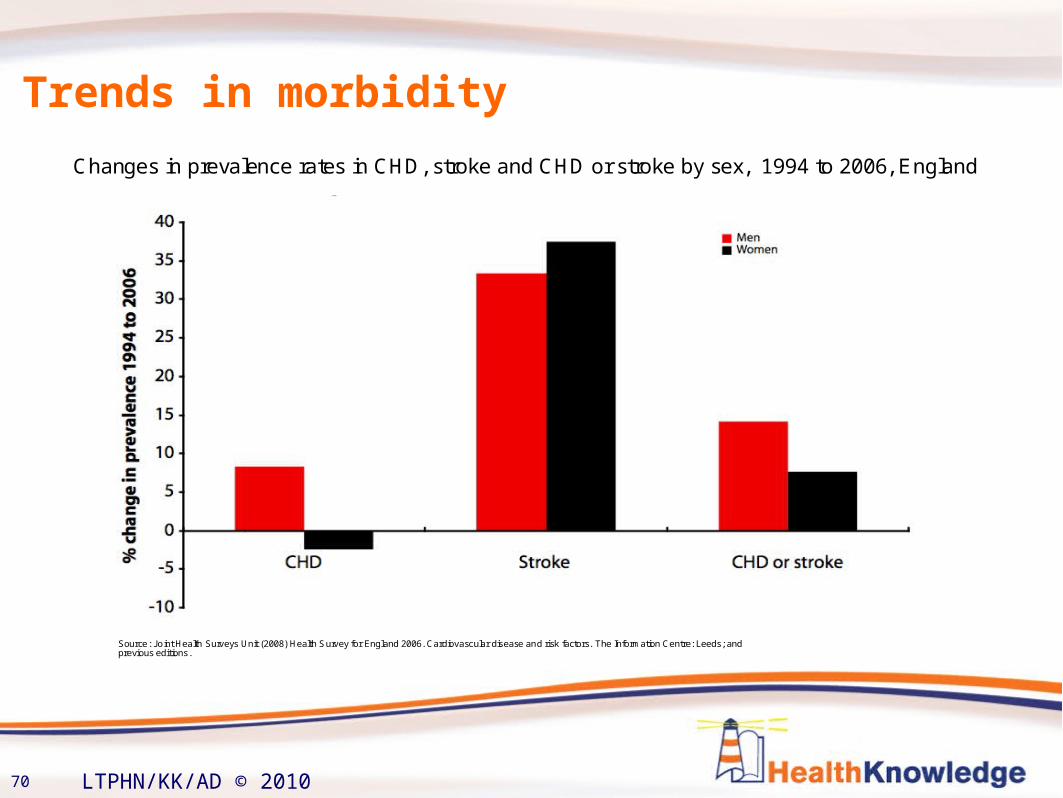
Changes in prevalence rates in CHD, stroke and CHD or stroke by sex, 1994 to 2006, England
Source: Joint Health Surveys Unit (2008) Health Survey for England 2006. Cardiovascular disease and risk factors. The Information Centre: Leeds; andprevious editions.
Trends in morbidity
70 LTPHN/KK/AD © 2010

Q 20. By looking at the source of prevalence do you think this may be a true reflection? Q 21. What effect do you think upward trends in the prevalence of obesity will have on the incidence and prevalence of CHD? Q22. What is the public health importance of increasing prevalence?
71 LTPHN/KK/AD © 2010

• The WHO MONICA project - incidence rates in the two UK populations included in the study, Belfast and Glasgow, were among the highest in the world, particularly in women
• The incidence rate of CHD is higher in men and increases with age
• Incidence of MI in women increases significantly after menopause
• Prevalence of all CHD:• Higher in the North of England and in Wales
• Higher in lower socio-economic groups
• High in South Asian men
Morbidity - inequalities
72 LTPHN/KK/AD © 2010

• Mortality is the number of deaths in a population in a given period
• Crude mortality which is expressed as the number of deaths per 1,000 population at risk of dying during a period • easy to calculate• difficult to compare across studies as differences may reflect the age
structure of the population
• Specific mortality estimates calculate the number of deaths in a population by subgroup (expressed as per 1,000 population) such as age or sex specific mortality • allows comparisons of subgroups and to identify those most at risk
• Standardised mortality ratios• This allows direct comparison of mortality experience between two
populations by taking into account the different age structures
• Data source: Death certificates
Mortality
73 LTPHN/KK/AD © 2010

Deaths by cause, men, 2006, United Kingdom Deaths by cause, women, 2006, UK
Source: data: England and Wales, Office for National Statistics (2008) Deaths registered by cause and area of residence, personal communication. Scotland, General Register Office (2008) Deaths registered by cause and area of residence, personal communication. Northern Ireland, Statistics and Research Agency (2008) Deaths registerted by cause and area of residence, personal communicationcharts: BHF
Mortality
74 LTPHN/KK/AD © 2010

Age specific death rates from CHD, men, 1968 to 2006 in UK plotted as a percentage of the rate in 1968
Age specific death rates from CHD, women, 1968 to 2006 in UK plotted as a percentage of the rate in 1968
Trends – Age specific mortality rates
75 LTPHN/KK/AD © 2010

Since the 1970s the premature death rate has fallen across all social groupsfor both men and women.
Mortality rate has fallen faster in non-manual workers than in manual workers, that is the difference in death rates increased between these groups.
Mortality rates from CHD by social class, men and women aged 35 to 64, 1978 to 1998, England and Wales
Source: Data from 1993/96 from Offi ce for National Statistics (2003) Trends in social class differences in mortality by cause, 1986 to 2000. The Stationery Offi ce: London. Chart:BHF
Trends - SES
76 LTPHN/KK/AD © 2010

Q23. What could be possible explanations for the positive relationship between deaths from circulatory diseases and levels of deprivation?
Q24. How could these differences be addressed?
77 LTPHN/KK/AD © 2010

• Decline in CHD mortality in men and women since late 1970s
• But CHD mortality in the UK is still amongst the highest in Western Europe
• In recent years slower decline in younger age groups
• May reflect attitudes to risk behaviour change among younger populations – young people continuing to smoke, drink heavily and higher prevalence of obesity
Mortality trends
78 LTPHN/KK/AD © 2010

Death rates are higher:
• Scotland than the South of England
• Manual workers than in non-manual workers
• Ethnic groups- South Asia
• During winter period- excess winter mortality
Mortality - inequalities
79 LTPHN/KK/AD © 2010

Q25. Discuss possible reasons for inequality in CHD mortality among South Asians
80 LTPHN/KK/AD © 2010

Q 26. What could be possible explanations for different rates of decline in CHD mortality in different developed countries?
81 LTPHN/KK/AD © 2010