Embed Size (px)
Citation preview

© 2013 Commonwealth Corporation 1
Closing the Massachusetts Skills Gap:Recommendations and Action Steps
April 24, 2013

© 2013 Commonwealth Corporation 2
Education & Health Services and Professional & Business Services are much larger sectors of
employment in the state.
MA - Q4 2001 MA - Q4 2011 US - Q4 2001 US - Q4 20110%
10%
20%
30%
40%
50%
60%
70%
80%
90%
100%
23.1%27.2%
19.7%24.3%
19.5%18.3%
21.6%20.7%
14.5%15.2%
13.2%13.6%
8.5%9.8%
9.3%10.5%
11.4%7.9%
13.3%9.1%
7.0% 6.5% 5.9% 5.9%
4.3% 4.3% 5.3% 3.5%3.5% 4.1% 3.3% 5.8%
4.75% 3.91% 5.37% 4.50%
Employment Distribution by Supersector, Q4 2001 - 2011
Information
Construction
Other services
Government
Financial Activities
Manufacturing
Leisure & Hospitality
Professional & Business Services
Trade, Transportation & Utilities
Education & Health Services

© 2013 Commonwealth Corporation 3
Utilities
Arts, Entertainment, & Recreation
Management of Companies & Enterprises
Information
Transportation & Warehousing
Construction
Wholesale Trade
Other Services
Government
Administrative & Support Services
Financial Activites
Professional & Technical Services
Manufacturing
Accommodation & Food Services
Educational Services
Retail Trade
Health Care & Social Assistance
0% 10% 20% 30% 40% 50% 60% 70% 80% 90% 100%
31.9%
29.2%
4.7%
18.1%
45.5%
56.5%
38.0%
47.5%
20.2%
46.7%
16.6%
8.0%
37.3%
52.9%
11.7%
42.1%
23.0%
35.4%
27.1%
34.7%
25.8%
35.8%
27.6%
28.4%
26.6%
31.2%
26.8%
26.3%
15.9%
23.8%
30.4%
15.5%
33.1%
33.2%
32.7%
43.8%
60.6%
56.1%
18.7%
16.0%
33.7%
25.9%
48.6%
26.5%
57.1%
76.1%
38.8%
16.7%
72.7%
24.8%
43.8%
Educational Attainment of Employees by Major Industry in Massachusetts, 2008-2010
High School Degree or Less
Some College or Associate's Degree
Bachelor's Degree or Higher

© 2013 Commonwealth Corporation 4
Massachusetts is growing more slowly than the nation; Central Mass & Southeast are the fastest
growing regions.

© 2013 Commonwealth Corporation 5
Population growth in Massachusetts is driven by immigration & growth in diversity.
2000 2008-2010 Absolute Change
Percent Change
Annual Growth Rate
Total Population 6,131,752 6,275,646 143,894 2.35% 0.26%Nativity
Native Born 5,241,790 5,183,529 -58,261 -1.11% -0.12%Immigrant 889,962 1,092,117 202,155 22.72% 2.30%Race/Ethnicity White, non-Hispanic 5,026,398 4,827,483 -198,915 -3.96% -0.45%Black, non-Hispanic 300,758 381,488 80,730 26.84% 2.68%Asian, non-Hispanic 225,949 332,793 106,844 47.29% 4.40%Hispanic 412,496 588,635 176,139 42.70% 4.03%Other race, non-Hispanic 166,151 145,247 -20,904 -12.58% -1.48%
Population Characteristics, 2000 to 2008-2010
© 2013 Commonwealth Corporation 6
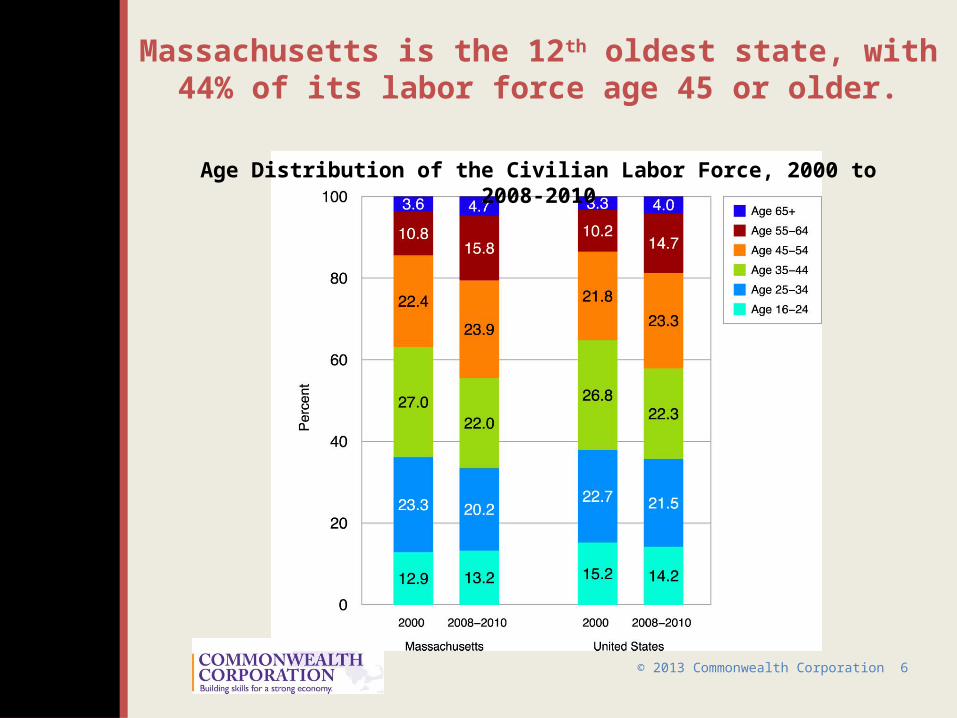
Massachusetts is the 12th oldest state, with 44% of its labor force age 45 or older.
Age Distribution of the Civilian Labor Force, 2000 to 2008-2010

© 2013 Commonwealth Corporation 7
Massachusetts is the most well-educated state in the nation; 41% have Bachelor’s Degree or higher.
Educational Attainment of the Labor Force, 2000 to 2008-2010

© 2013 Commonwealth Corporation 8
Less than High School
High School
Some College, no degree
Associate's Degree
Bachelor's Degree
Master's Degree or more
-3.0% -2.0% -1.0% 0.0% 1.0% 2.0% 3.0%
-2.2%
0.6%
0.7%
1.0%
2.0%
2.4%
The largest growth in educational attainment of the labor force is Master’s Degree or higher.
Growth in Educational Attainment, 2000 to 2008-2010

© 2013 Commonwealth Corporation 9
Massachusetts lags in growth in post-secondary completions in the US; faster growth in Central
Mass, Southeast, and Northeast.
Massach
usetts
United States
Berkshire
Boston/M
etro North
Cape & Isl
ands
Central M
ass
Northeast
Metro South/W
est
Pioneer Valle
y
Southeast-2.0%
0.0%
2.0%
4.0%
6.0%
8.0%
10.0% Annual Growth in Completions, 2000-2010
Certificates
Associate's Degrees
Bachelor's Degrees

© 2013 Commonwealth Corporation 10
Massachusetts also lags US growth in full-time enrollments in two- and four-year institutions.
Less
than Two-Year Insti
tutions
Two-year Insti
tutions
Four-Year In
stitutions
0
2
4
6
8
10
1210.1
3.12.1
5.8
4.1 3.5
MAUS

© 2013 Commonwealth Corporation 11
Massachusetts lags US in growth of part-time enrollments in two-year and declined in four-year
institutions.
-4.0
-3.0
-2.0
-1.0
0.0
1.0
2.0
3.0
4.0
5.0
6.0 5.7
1.4
-3.3
1.31.9
3.5
MAUS

© 2013 Commonwealth Corporation 12
Increasing alignment of fields of study for Associate’s Degree completions in Central Mass,
Southeast & Boston/MetroNorth.
Berkshire
Boston/M
etro North
Cape & Islands
Central M
ass
Metro South W
est
Northeast
Pioneer Valley
Southeast0%
10%
20%
30%
40%
50%
60%
70%
80%
90%
100%
56.6%
18.3%
34.5%
18.1%26.0%
31.2%39.2%
26.3%
17.3%
29.1%
28.5%
35.6% 16.1%
22.9%16.8%
31.7%
7.5%
17.6%
7.6%
10.5% 31.8%13.6% 10.2%
14.0%
15.0%
15.8%13.2%
20.6%12.4%
15.0% 16.8%16.8%
2.0%
11.4% 4.9% 7.1% 9.0%6.9% 9.8%
5.0%Science & Mathematics
Legal
Other
Education
Engineering & Computer Sciences
Business
Services
Health Sciences
Arts, Humanities, & Social Sciences
Associate’s Degree Completions by Field of Study, 2010

© 2013 Commonwealth Corporation 13
In the past decade employment opportunities have grown, almost exclusively, for workers with a
college degree.
Less than high school
High school graduate
Some Collge, no degree
Associate's degree
Bachelor's degree
Master's degree or more
-7.0% -6.0% -5.0% -4.0% -3.0% -2.0% -1.0% 0.0% 1.0% 2.0% 3.0%
Southeast
Pioneer Valley
Northeast
Metro South/West
Central Mass
Cape & Islands
Boston/Metro North
Berkshire
Annual Growth in the Employed by Education, 2000 to 2008-2010

© 2013 Commonwealth Corporation 14
Workers with a high school diploma or less are disproportionately unemployed.
Educational Attainment of Civilian Labor Force & Unemployed, 2008-2010

© 2013 Commonwealth Corporation 15
Young Workers, 16-24 are also disproportionately unemployed.
Age of Civilian Labor Force & Unemployed, 2008-2010

© 2013 Commonwealth Corporation 16
Key Findings: Context
• Massachusetts continues to concentrate jobs in industries & occupations that require post-secondary education
• Large and well-educated baby boomer generation reaching retirement age – significant replacement challenges
• Labor force growth is highly depend on immigration & labor force is becoming more diverse

© 2013 Commonwealth Corporation 17
Key Findings: Challenges• Young workers 16-24 face significant challenges in
connecting to the job market due to limited work experience & “try-out” employment opportunities
• Workers with a high school diploma or less make up half of the unemployed but one-third of the labor force as a result of increasing skill requirements
• While alignment of associate’s degrees have improved in some regions of the state, still room to improve in other regions
• Part-time enrollments in bachelor’s degree programs have declined leaving limited access to ongoing skill upgrade & credential attainment for working adults

© 2013 Commonwealth Corporation 18
Strengthen the job seeking skills, retention skills & work experience for young workers.
• Strengthen the connection of institutions and organizations that serve teens and young adults to local employers
• Develop capacity of these institutions to prepare young workers with the skills that they need to find and retain work
• Partner with employers to Increase work experiences and internship opportunities for high school and college students.

© 2013 Commonwealth Corporation 19
Increase the scale & intensity of programs that develop literacy & numeracy skills & credentials of
adults.
• Expand the scale, flexibility and intensity of programs that support the development of critical literacy and numeracy skills, including efforts underway to align ABE and GED programs with community college entry requirements,
• Increase contextualized basic education and ESOL programs,
• Deploy technology to increase scale and enhance offerings for lower skilled workers.

© 2013 Commonwealth Corporation 20
Continue to improve the alignment of education & workforce services with the dynamic skill
needs of industry.
• Provide flexible, modular and competency-based programs to support talent pipelines and career pathways for jobs in demand.
• Strengthen regional sector partnerships and state industry clusters to identify and address changing skill requirements of industry and increasing credentials necessary to find and retain employment.

© 2013 Commonwealth Corporation 21
Craft more effective and accessible educational models that support ongoing skill development
and lifelong learning.
• Partner with businesses to invest in the ongoing skill development & educational attainment of incumbent workers
• Influence the development of Massive Open Online Courses to meet ongoing skill needs of adult workers
• Advance innovations in knowledge and skill transfer from employees who are nearing retirement to succeeding generations of workers