Embed Size (px)
Citation preview

© 2014 THE EDUCATION TRUST
Where Are We? Why Does it Matter?California State University Leaders
Long Beach, CAOctober, 2014
Copyright 2014 The Education Trust
Access to Success in America:

© 2014 THE EDUCATION TRUST
America: Two Powerful Stories

© 2014 THE EDUCATION TRUST
1. Land of Opportunity:
Work hard, and you can become anything you want to be.

© 2014 THE EDUCATION TRUST
2. Generational Advancement:
Through hard work, each generation of parents can assure a better life — and better education — for their children.

© 2014 THE EDUCATION TRUST
These stories animated hopes and dreams of people here at home
And drew countless immigrants to our shores

© 2014 THE EDUCATION TRUST
Yes, America was often intolerant…
And they knew the “Dream” was a work in progress.
© 2014 THE EDUCATION TRUST
We were:
• The first to provide universal high school;• The first to build public universities;• The first to build community colleges;• The first to broaden access to college, through
GI Bill, Pell Grants, …

© 2014 THE EDUCATION TRUST
1920 1940 1960
1980 2000 2012
Percent of U.S. adults with a high school diploma

© 2014 THE EDUCATION TRUST
Percent of U.S. adults with a B.A. or more
4%
1920
6%
1940
11%
1960
23%
1980
29%
2000
33%
2012

© 2014 THE EDUCATION TRUST
Progress was painfully slow, especially for people of color.
But year by year, decade by decade…

© 2014 THE EDUCATION TRUST
Percent of U.S. adults with a high school diploma, by race 192019401960198020002012

© 2014 THE EDUCATION TRUST
Percent of U.S. adults with a B.A. or more, by race
192019401960198020002012
© 2014 THE EDUCATION TRUST© 2014 THE EDUCATION TRUST
Then, beginning in the eighties, inequality started growing again.

© 2014 THE EDUCATION TRUST© 2014 THE EDUCATION TRUST
In the past four years alone, 95% of all income gains have gone to the
top 1%.
Source: Stiglitz, “Inequality is a Choice,” New York Times, October 13, 2013.

© 2014 THE EDUCATION TRUST© 2014 THE EDUCATION TRUST
In 2012:
• In 2012, the top 5% of Americans took home 22% of the nation’s income; the top .1% took home 11%.
• And the bottom 20% took home just 3%.
Source: DeNavas-Walt, Proctor, & Smith, “Income, Poverty, and Health Insurance Coverage in the United States: 2012,” U.S Census Bureau, September 2013; Stiglitz, “Inequality is a Choice,” New York Times, October 13, 2013.

© 2014 THE EDUCATION TRUST© 2014 THE EDUCATION TRUST
Chile
Mex
icoUni
ted
Stat
esTu
rkey
Israe
l
Italy
Esto
nia
Spain
Irelan
dGr
eece
Polan
dSw
itzer
land
Belgi
umCa
nada
Slove
nia
Hung
ary
Aust
riaGe
rman
yFin
land
Norw
aySw
eden
0.00
0.10
0.20
0.30
0.40
0.50
0.60
0.70
0.80
0.90
1.00
Gin
i Coe
ffici
ent
Note: Gini coefficient ranges from 0 to 1, where 0 indicates total income equality and 1 indicates total income inequality.
Instead of being the most equal, the U.S. has the third highest income inequality among OECD
nations.
United States
Source: United Nations, U.N. data, http://data.un.org/DocumentData.aspx?q=gini&id=271: 2011

© 2014 THE EDUCATION TRUST
Median Wealth of White Families
20 X that of African Americans
18 X that of Latinos
Source: Rakesh Kochhar, Richard Fry, and Paul Taylor, “Twenty-to-One: Wealth Gaps Rise to Record Highs Between Whites, Blacks, and Hispanics,” Pew Social & Demographic Trends, 2011.
© 2014 THE EDUCATION TRUST© 2014 THE EDUCATION TRUST
Not just wages and wealth, but social mobility as well.

© 2014 THE EDUCATION TRUST© 2014 THE EDUCATION TRUST
U.S. intergenerational mobility was increasing until 1980, but has sharply declined since.
Source: Daniel Aaronson and Bhashkar Mazumder. Intergenerational Economic Mobility in the U.S.,1940 to 2000. Federal Reserve Bank of Chicago WP 2005-12: Dec. 2005.
1950 1960 1970 1980 1990 20000
0.2
0.4
0.6
0.4 0.35 0.34 0.330000000000007
0.46
0.580000000000001
Earn
ings
Ela
stici
ty
The falling elasticity meant increased economic mobility until 1980. Since then, the elasticity has risen, and mobility has slowed.
© 2014 THE EDUCATION TRUST
Source:
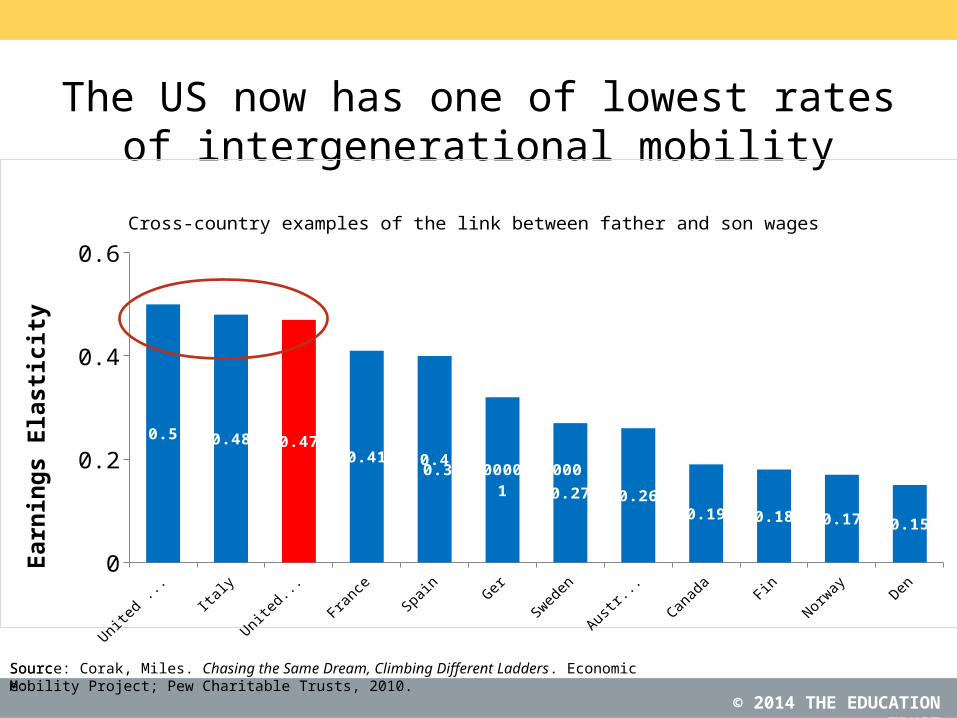
The US now has one of lowest rates of intergenerational mobility
United Kingdom
Italy United States
France Spain Germany Sweden Australia Canada Finland Norway Denmark0
0.2
0.4
0.6
0.5 0.48 0.470.41 0.4
0.3200000000000010.27 0.26
0.19 0.18 0.17 0.15
Earn
ings
Ela
stici
ty
Cross-country examples of the link between father and son wages
Source: Corak, Miles. Chasing the Same Dream, Climbing Different Ladders. Economic Mobility Project; Pew Charitable Trusts, 2010.

© 2014 THE EDUCATION TRUST
At macro level, better and more equal education is not the only answer.
But at the individual level, it really is.

© 2014 THE EDUCATION TRUST
Overwhelming message about what matters in turning this
around?
Education. “Among those who have finished four years of college, there is no
racial gap in economic mobility. Both whites and blacks experience very
high rates.”Source: Upward Intergenerational Mobility in the US. PewTrusts.

© 2014 THE EDUCATION TRUST
College Grads Earn More
Source: College Board, Education Pays, 2013, Figure 1.1: Median Earnings and Tax Payments of Full-Time Year-Round Workers Ages 25 and Older, by Education Level, 2011
$-
$20,000
$40,000
$60,000
$80,000
$100,000
$21,000 $29,000 $32,900 $36,200 $45,100
$55,200 $70,700 $78,800
$4,100 $6,400
$7,500 $8,600
$11,400 $14,800
$20,300 $23,400
Taxes Paid After-Tax Earnings
Education Level
Med
ian
Earn
ings
($)
$25,100$35,400
$40,400 $44,800
$56,500
$70,000
$91,000$102,200

© 2014 THE EDUCATION TRUST© 2014 THE EDUCATION TRUST
College Grads Less Likely to be Unemployed
Less than high school diploma
High school grad-uate
Some college or associate's degree
Bachelor's degree or higher
0.0%
5.0%
10.0%
15.0%
20.0%
25.0%
30.0%
14.3%
9.6%8.2%
4.3%
Unemployment Rate (August 2011)
Source: U.S. Bureau of Labor Statistics, Table A-4, http://www.bls.gov/news.release/empsit.t04htm

© 2014 THE EDUCATION TRUST
They also stand out on the other things we value.

© 2014 THE EDUCATION TRUST
College graduates more likely to vote
Less than high school
High school/GED Some college/as-sociate's degree
Bachelor's degree or higher
0%
20%
40%
60%
80%
100%
23%29%
50%
60%
Percent of US Citizens Aged 18-24 Who Voted in the 2012 Presiden-tial Election by Education Level
Source: Education Pays 2013, The College Board Note: Data include both those who are and are not registered to vote.

© 2014 THE EDUCATION TRUST© 2014 THE EDUCATION TRUST
Less than high school
High school Some college or associate's degree
Bachelor's degree or higher
0%
20%
40%
60%
80%
100%
9%17%
29%
42%
Percent of Adults 25 and Over Who Volunteered in 2012 by Education Level
Note: Data represent percentage of total population that reported volunteering from September 2008 to September 2009
College graduates more likely to volunteer
Source: Education Pays 2013, The College Board
© 2014 THE EDUCATION TRUST
Source:
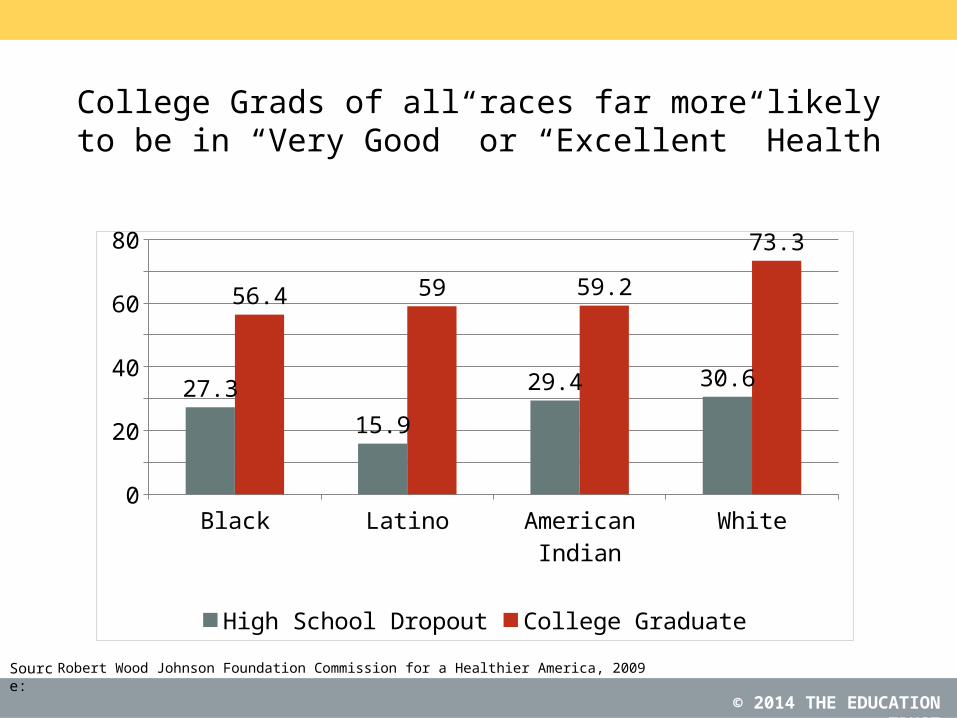
College Grads of all races far more likely to be in “Very Good” or “Excellent” Health
Black Latino American Indian White0
10
20
30
40
50
60
70
80
27.3
15.9
29.4 30.6
56.4 59 59.2
73.3
High School Dropout College Graduate
Robert Wood Johnson Foundation Commission for a Healthier America, 2009

© 2014 THE EDUCATION TRUST© 2014 THE EDUCATION TRUST
High school or less Some college Bachelor's degree Advanced degree0%
20%
40%
60%
80%
100%
37%45%
54%60%
Percentage of respondents reporting themselves to be in excellent mental health
Source: Gallup, “Strong Relationship Between Income and Mental Health” (2007)
College Grads Even Have Better Mental Health

© 2014 THE EDUCATION TRUST
What schools and colleges do, in other words, is hugely important to our economy, our
democracy, and our society.
© 2014 THE EDUCATION TRUST© 2014 THE EDUCATION TRUST
There is one road up, and that road runs through us.

© 2014 THE EDUCATION TRUST© 2014 THE EDUCATION TRUST
So, how are we doing?

© 2014 THE EDUCATION TRUST
Over past 30 years, we’ve made a lot of progress on the
access side.
n/a
© 2014 THE EDUCATION TRUST
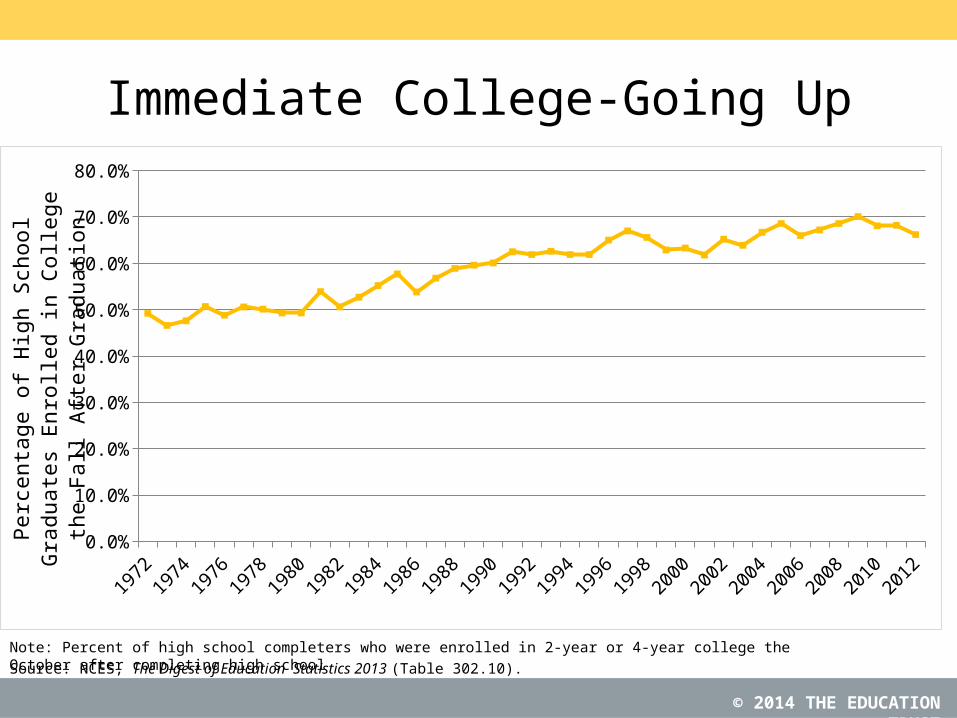
Immediate College-Going Up
Source: NCES, The Digest of Education Statistics 2013 (Table 302.10).Note: Percent of high school completers who were enrolled in 2-year or 4-year college the October after completing high school
19721974
19761978
19801982
19841986
19881990
19921994
19961998
20002002
20042006
20082010
20120.0%
10.0%
20.0%
30.0%
40.0%
50.0%
60.0%
70.0%
80.0%
Perc
enta
ge o
f Hig
h Sc
hool
Gra
duat
es E
n-ro
lled
in C
olle
ge th
e Fa
ll Aft
er G
radu
ation

© 2014 THE EDUCATION TRUST
College-going is up for all groups.
NCES, The Condition of Education 2010 (Table A-20-3) and The Condition of Education 2011 (Table A-21-2).

© 2014 THE EDUCATION TRUST
Immediate College-Going Increasing for All Racial/Ethnic Groups: 1972 to 2012
Note: Percent of high school completers who were enrolled in college the October after completing high schoolSource: NCES, The Digest of Education Statistics 2013 (Table 302.20).
19721974
19761978
19801982
19841986
19881990
19921994
19961998
20002002
20042006
20082010
20120%
10%
20%
30%
40%
50%
60%
70%
80%
African American Latino White
Perc
enta
ge o
f Hig
h Sc
hool
Gra
duat
es E
n-ro
lled
in C
olle
ge th
e Fa
ll Aft
er G
radu
ation

© 2014 THE EDUCATION TRUST
College-Going Generally Increasing for All Income Groups
Source: NCES, The Condition of Education 2010 (Table A-20-1) and The Digest of Education Statistics 2013 (Table 302.30).Note: Percent of high school completers who were enrolled in college the October after completing high school
19721974
19761978
19801982
19841986
19881990
19921994
19961998
20002002
20042006
20082010
20120%
10%
20%
30%
40%
50%
60%
70%
80%
90%
Low-Income High-Income
Perc
enta
ge o
f Hig
h Sc
hool
Gra
duat
es E
n-ro
lled
in C
olle
ge th
e Fa
ll Aft
er G
radu
ation

© 2014 THE EDUCATION TRUST
But though college going up for low-income
students…

© 2014 THE EDUCATION TRUST
Low-Income Students Today Still Not Reaching the College-going Rate for High-Income Students
in 1972…
Note: Data for black, Hispanic, and low-income represent two-year moving average because of small sample sizes.Source: NCES, The Condition of Education 2010 (Table A-20-1) and The Digest of Education Statistics 2013 (Table 302.30)
Low Income High Income
23%
64%
52%
82%
Percentage of high school graduates immediately enrolling in college, 1972-2012
19722012

© 2014 THE EDUCATION TRUST
But access isn’t the only issue:
There’s a question of access to what…

© 2014 THE EDUCATION TRUST
Low-Income Students and Students of Color Twice as Likely to Enter For-profit Colleges
Non-Pell recipient
Pell recipient
American Indian
Hispanic
Black
White
Asian
0% 10% 20% 30% 40% 50% 60% 70% 80% 90% 100%
8
20
10
12
18
7
5
38
35
44
45
39
36
38
37
32
33
31
30
40
43
16
13
10
12
13
16
14
1
1
2
1
1
1
1
For Profit Public 2-Year Public 4-Year Private 4-Year OtherEd Trust analysis of IPEDS Fall enrollment, Fall 2012 (by race) and IPEDS Student Financial Aid survey,
2011-12 (by Pell recipient status). 41

© 2014 THE EDUCATION TRUST
IPEDS Enrollment Fall 2011 First Look (December 2012); Majority staff calculation of data provided by U.S. Department of Education, 2008-09 in “Emerging Risk?: An Overview of Growth, Spending, Student Debt and Unanswered Questions in For-Profit Higher Education.” Senate HELP Committee. 24 June 2010 (page 4); and Ed Trust analysis of FY 2009 data in “Institutional Default Rate Comparison of FY 2007, 2008, and 2009 Cohort Default Rates.” http://www.gao.gov/new.items/d114.pdf (page 8)
Access to what?For-profit college companies 11% of enrollments 24% of Pell Grants and
federal student loan dollars Lowest degree completion rates of any 4-year sector 48% of federal student
loan defaults

© 2014 THE EDUCATION TRUST
And what about graduation in colleges more generally?

© 2014 THE EDUCATION TRUST
Black, Latino, and American Indian Freshmen Complete College at Lower Rates Than Other Students
6 -year bachelor’s completion rates for first-time, full-time freshmen,Fall 2006 cohort at 4-year institutions
Source: NCES (December 2013). Enrollment in Postsecondary Institutions, Fall 2012; Financial Statistics, Fiscal Year 2012; and Graduation Rates, Selected Cohorts, 2004-2009, First Look (Provisional Data) Table 3.
White Black Latino Asian American Indian0
10
20
30
40
50
60
70
80
63%
40%52%
71%
40%Gra
duati
on R
ates
(%) Overall rate: 59%

© 2014 THE EDUCATION TRUST
Graduation rates at public community colleges
White Black Latino Asian American Indian
0
10
20
30
40
50
60
70
80
90
100
24%13% 18%
28%18%
Gra
duati
on R
ates
(%)
3 - year completion rates (associate degrees and certificates) for first-time, full-time freshmen,
Fall 2009 cohort at public two-year institutions
Overall rate: 21.2%
Source: NCES (Dec. 2013). First Look: Enrollment in Postsecondary Institutions, Fall 2012; Financial Statistics, Fiscal Year 2012; and Graduation Rates, Selected Cohorts, 2004-2009, First Look (Provisional Data) Table 3.

© 2014 THE EDUCATION TRUST
Chance of attaining a bachelor’s degree
within six years, among students who aspire to a
Bachelors degree and begin at community college?
n/a

© 2014 THE EDUCATION TRUST
Series10
10
20
30
40
50
60
70
80
90
100
14%
Bach
elor
’s A
ttai
nmen
t Rat
e (%
)
Only 14 percent.
Percent of students who started at a community college intending to earn a Bachelor’s in 2003 and
earned a BA degree by 2009
Source: U.S. Department of Education, National Center for Education Statistics, 2003-04 Beginning Postsecondary Students Longitudinal Study, First Follow-up (BPS:04/06).

© 2014 THE EDUCATION TRUST
Add it all up…

© 2014 THE EDUCATION TRUST
Different groups of young Americans obtain degrees at
very different rates.
n/a
© 2014 THE EDUCATION TRUST
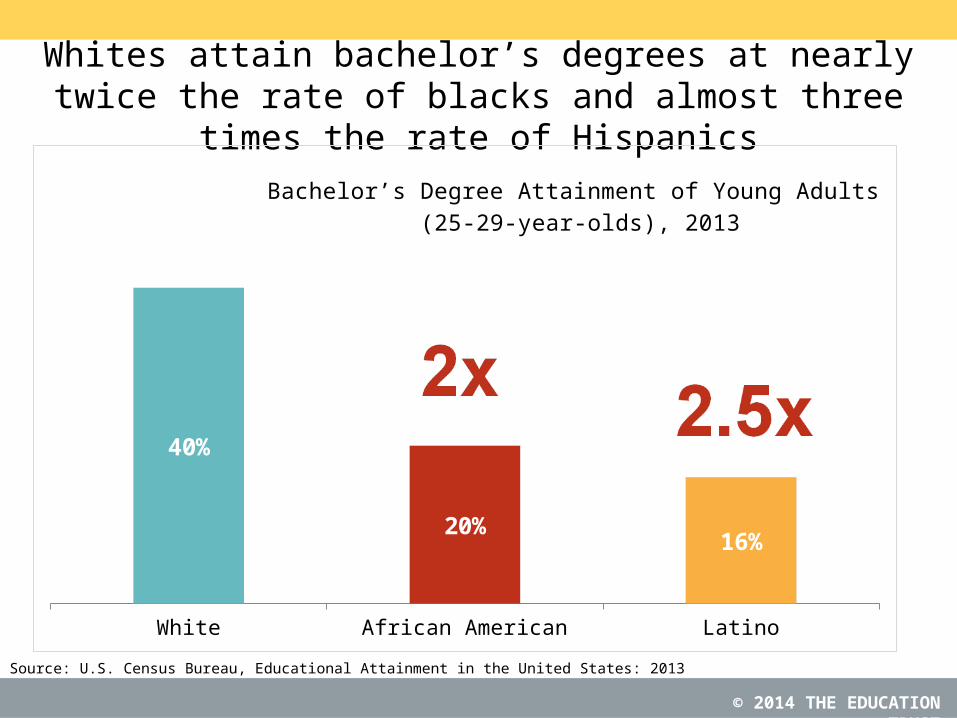
Whites attain bachelor’s degrees at nearly twice the rate of blacks and almost three times the rate of Hispanics
Source: U.S. Census Bureau, Educational Attainment in the United States: 2013
White African American Latino
40%
20%16%
Bachelor’s Degree Attainment of Young Adults (25-29-year-olds), 2013

© 2014 THE EDUCATION TRUST
Young adults from high-income families are 7 times more likely to earn bachelor’s degrees by age 24
Highest income quartile Lowest income quartile0%
20%
40%
60%
80%
100%
79%
11%
Perc
ent w
ith B
ache
lor’
s D
egre
e by
Age
24
7xTom Mortenson, Bachelor’s Degree Attainment by age 24 by Family Income Quartiles, 1970 to 2010, Postsecondary Education Opportunity, 2012.

© 2014 THE EDUCATION TRUST
These rates threaten health of our democracy.
But even for those who don’t care much about that, they are particularly worrisome, given which groups are growing…and which
aren’t.

© 2014 THE EDUCATION TRUST
Changing demographics demand greater focus on underrepresented populations.
-5,516
2,312
31,337
4,431669
-9%
15%
137%
96%
50%
Projected Popula-tion Growth, Ages 20-24, 2010-2050
Note: Projected Population Growth, Ages 0-24, 2010-2050 Source: National Population Projections, U.S. Census Bureau. Released 2008; NCHEMS ,Adding It Up, 2007
Population Increase, Ages 0-24, (in thousands)
Percentage Increase, Ages 0-24,

© 2014 THE EDUCATION TRUST
Not surprisingly, our international lead is slipping away

© 2014 THE EDUCATION TRUST© 2014 THE EDUCATION TRUST
Cana
daJa
pan
Israe
lUn
ited
Stat
esKo
rea
Unite
d Ki
ngdo
mNe
w Zeal
and
Finla
ndAu
stral
iaNo
rway
Irela
ndLu
xem
bour
gEs
toni
aSw
itzer
land
Swed
enBe
lgiu
mIce
land
Denm
ark
Neth
erla
nds
Spai
nOEC
D av
erag
eFr
ance
Chile
Germ
any
Gree
ceSlo
veni
aPo
land
Hung
ary
Austr
iaSlo
vak R
epub
licCz
ech
Repu
blic
Mex
icoPo
rtuga
lIta
lyTu
rkey
Braz
il
0%
20%
40%
60%
80%
100%
42%
32%
Percentage of residents aged 25-64 with a postsecondary degree
Note: Adults with a postsecondary degree include those who have completed either a tertiary-type B program (programs that last for at least two years, are skill-based, and prepare students for direct entry into the labor market) or a tertiary-type A program (programs that last at least three, but usually four, years, are largely theory-based, and provide qualifications for entry into highly-skilled professions or advanced research programs)
Source: Organisation for Economic Co-operation and Development, Education at a Glance 2013 (2011 data).
We’re relatively strong in educational attainment
United States
OECD Average

© 2014 THE EDUCATION TRUST© 2014 THE EDUCATION TRUST
Kore
aJa
pan
Cana
daIre
land
Unite
d Ki
ngdo
mNo
rway
Luxe
mbo
urg
New Ze
alan
dIsr
ael
Austr
alia
Unite
d St
ates
Fran
ceSw
eden
Belg
ium
Chile
Switz
erla
ndNe
ther
land
sFin
land
Icela
ndPo
land
Spai
nEs
toni
aOEC
D av
erag
eDe
nmar
kSlo
veni
aGr
eece
Hung
ary
Germ
any
Portu
gal
Slova
k Rep
ublic
Czec
h Re
publ
icM
exico
Austr
iaIta
lyTu
rkey
0%
20%
40%
60%
80%
100%
43%39%
Percentage of residents aged 25-34 with a postsecondary degree
Source: Organisation for Economic Co-operation and Development, Education at a Glance 2013 (2011 data).
Note: Adults with a postsecondary degree include those who have completed either a tertiary-type B program (programs that last for at least two years, are skill-based, and prepare students for direct entry into the labor market) or a tertiary-type A program (programs that last at least three, but usually four, years, are largely theory-based, and provide qualifications for entry into highly-skilled professions or advanced research programs)
United States OECD Average
Our world standing drops to 11th for younger adults

© 2014 THE EDUCATION TRUST© 2014 THE EDUCATION TRUST
Kore
aPo
land
Fran
ceIre
land
Chile
Luxe
mbo
urg
Portu
gal
Norw
aySp
ain
Belg
ium
Swed
enSlo
veni
aJa
pan
Unite
d Ki
ngdo
mNe
ther
land
sOEC
D av
erag
eCa
nada
Austr
alia
Slova
k Rep
ublic
Italy
Turk
eyGr
eece
Hung
ary
New Ze
alan
dSw
itzer
land
Czec
h Re
publ
icDe
nmar
kIce
land
Mex
icoUn
ited
Stat
esAu
stria
Finla
ndIsr
ael
Germ
any
Esto
nia
0%
20%
40%
60%
80%
100%
10%2%
Difference in percentage of residents aged 45-54 and those aged 25-34 with a postsecondary degree
Note: Adults with a postsecondary degree include those who have completed either a tertiary-type B program (programs that last for at least two years, are skill-based, and prepare students for direct entry into the labor market) or a tertiary-type A program (programs that last at least three, but usually four, years, are largely theory-based, and provide qualifications for entry into highly-skilled professions or advanced research programs)
Source: Organisation for Economic Co-operation and Development, Education at a Glance 2012 (2010 data).
OECD Average United States
We’re near the bottom in intergenerational progress

© 2014 THE EDUCATION TRUST
California?

© 2014 THE EDUCATION TRUST
Adults Ages 25-64 with at least a Bachelor’s Degree, 2011:California Slightly Above National Average
Mas
sach
usett
sCo
nnec
ticut
Colo
rado
Virg
inia
New Yo
rkRh
ode I
sland
Was
hing
ton
Calif
orni
aUta
hHa
waii US
Penn
sylva
nia
North
Dak
ota
Iow
aW
iscon
sinSo
uth
Dako
taTe
xas
Florid
aAl
aska
New M
exico
Tenn
esse
eIn
dian
aAl
abam
aNev
ada
Arka
nsas
Wes
t Virg
inia
0%
10%
20%
30%
40%
50%
60%
70%
80%
90%
100%
29.9%
Perc
ent w
ith B
ache
lor’
s Deg
ree
U.S. Census Bureau, 2011 American Community Survey data from NCHEMS Information Center.
© 2014 THE EDUCATION TRUST
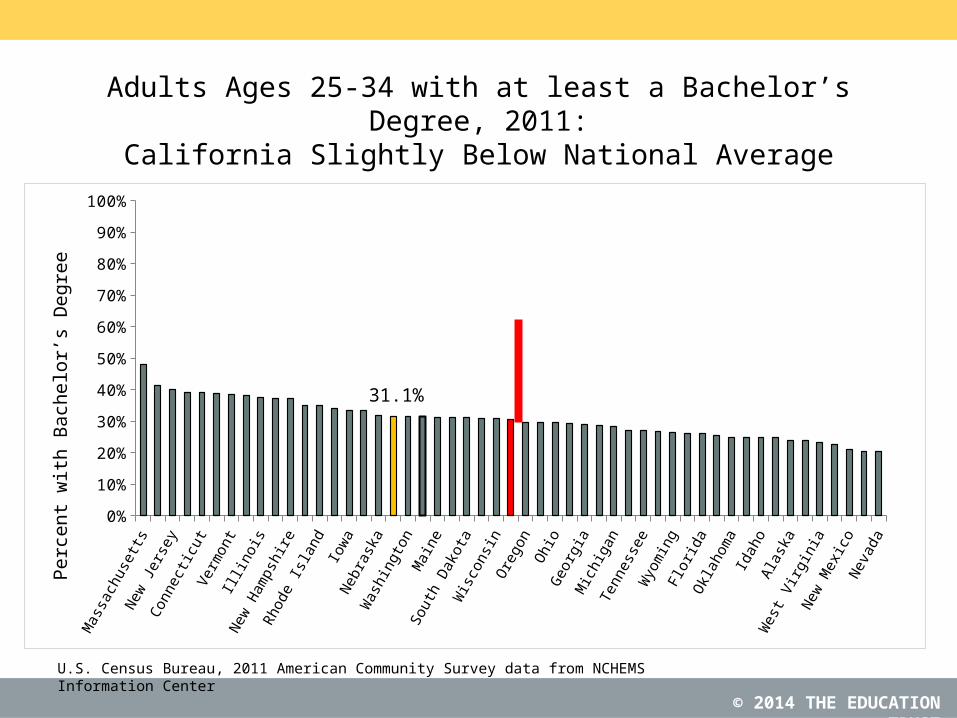
Adults Ages 25-34 with at least a Bachelor’s Degree, 2011:California Slightly Below National Average
Mas
sach
usett
sNew
Jers
eyCo
nnec
ticut
Verm
ont
Illino
isNew
Ham
pshi
reRh
ode I
sland
Iow
aNeb
rask
aW
ashi
ngto
nM
aine
Sout
h Da
kota
Wisc
onsin
Orego
nOhi
oGe
orgia
Mich
igan
Tenn
esse
eW
yom
ing
Florid
aOkla
hom
aId
aho
Alas
kaW
est V
irgin
iaNew
Mex
icoNev
ada
0%
10%
20%
30%
40%
50%
60%
70%
80%
90%
100%
31.1%
Perc
ent w
ith B
ache
lor’
s Deg
ree
U.S. Census Bureau, 2011 American Community Survey data from NCHEMS Information Center

© 2014 THE EDUCATION TRUST
Average Annual Percent of Adults 25-64 with at Least a Bachelor’s Degree, 2008-2010:
California 5th Largest Gap between URM and Whites
Colo
rado
Conn
ectic
utCa
lifor
nia
Arizo
naNew
York
Nebra
ska
Mon
tana
Kans
asId
aho
Mas
sach
usett
sM
aryla
ndNew
Jers
eyGe
orgia
Miss
issip
piW
iscon
sinNev
ada
Min
neso
taFlo
rida
Delaw
are
North
Dak
ota
Tenn
esse
eM
issou
riIn
dian
aM
aine
Verm
ont
New H
amps
hire
-5%
0%
5%
10%
15%
20%
25%
30%
11.7%
Perc
enta
ge P
oint
Gap
, Whi
te-M
inor
ity
2008-2010 Three-Year American Community Survey (ACS) data from NCHEMS Information Center.

© 2014 THE EDUCATION TRUST
WHAT’S GOING ON?
Many in higher education would like to believe that these patterns are mostly a function of lousy high schools and stingy
federal and state policymakers.

© 2014 THE EDUCATION TRUST
They are not all wrong.

© 2014 THE EDUCATION TRUST
© 2014 THE EDUCATION TRUST
Low Income and Minority Students Continue to be Clustered in Schools
where we spend less…

© 2014 THE EDUCATION TRUST
Source:
National Inequities in State and Local Revenue Per Student
GapHigh Poverty vs. Low Poverty Districts
–$773 per student
High Minority vs. Low Minority Districts
–$1,122 per student
Education Trust analyses based on U.S. Dept of Education and U.S. Census Bureau data for 2005-06

© 2014 THE EDUCATION TRUST
…expect less

© 2014 THE EDUCATION TRUST
Source:
Students in Poor Schools Receive ‘A’s for Work That Would Earn ‘Cs’ in Affluent Schools
A B C D0
10
20
30
40
50
60
70
80
90
100
87
56
41
21
35 34
22
11
Seventh Grade Math
Low-poverty schoolsHigh-poverty schools
Perc
entil
e –
CTBS
4
Prospects (ABT Associates, 1993), in “Prospects: Final Report on Student Outcomes”, PES, DOE, 1997

© 2014 THE EDUCATION TRUST
…teach them less

© 2014 THE EDUCATION TRUST© 2014 THE EDUCATION TRUST
African American Latino White Asian0%
20%
40%
60%
80%
100%
35%
68%63%
94%
Perc
enta
ge o
f stu
dent
s who
wer
e in
the
top
two
quin
-til
es o
f mat
h pe
rfor
man
ce in
fift
h gr
ade
and
in a
lgeb
ra
in e
ight
h gr
ade
Source: NCES, “Eighth-Grade Algebra: Findings from the Eighth-Grade Round of the Early Childhood Longitudinal Study, Kindergarten Class of 1998-99 (ECLS-K)” (2010).
Even African-American students with high math performance in fifth grade are unlikely
to be placed in algebra in eighth grade

© 2014 THE EDUCATION TRUST
Students of color are less likely to attend high schools that offer calculus.
Schools with the Most Black and Latino Students
Schools with the Fewest Black and Latino Students
0% 10% 20% 30% 40% 50% 60%
29%
55%
Source: U.S. Department of Education Office for Civil Rights , Civil Rights Data Collection
Percent of Schools Offering Calculus
© 2014 THE EDUCATION TRUST
…and assign them our least qualified teachers.

© 2014 THE EDUCATION TRUST
Source:
Core classes in high-poverty and high-minority secondary schools are more likely to be taught by out-of-field teachers
0%
5%
10%
15%
20%
25%
30%
35%
40%
45%
50%
41%
30%
17% 16%
Perc
enta
ge o
f Cla
sses
Tau
ght b
y Te
ache
rs
With
Nei
ther
Cer
tifica
tion
nor M
ajor
The Education Trust, Core Problems: Out-of-Field Teaching Persists in Key Academic Courses and High-Poverty Schools, (2008)
Note: Data are for secondary-level core academic classes (Math, Science, Social Studies, English) across United States.High-poverty ≥75% of students eligible for free/reduced-price lunch. Low-poverty school ≤15% of students eligible. High-minority ≥ 75% students non-white. Low-minority ≤ 10% students non-white.
High Poverty
Low Poverty
High Minority
Low Minority

© 2014 THE EDUCATION TRUST
Source:
Students at high-minority schools are more likely to be taught by novice teachers
Low Minority High Minority0%
10%
20%
30%
40%
50%
13%
22%
Perc
enta
ge o
f Nov
ice
Teac
hers
Analysis of 2003-2004 Schools and Staffing Survey data by Richard Ingersoll, University of Pennsylvania (2007)
Note: Novice teachers are those with three years or fewer experience. High-minority ≥ 75% students non-white. Low-minority ≤ 10% students non-white.
© 2014 THE EDUCATION TRUST
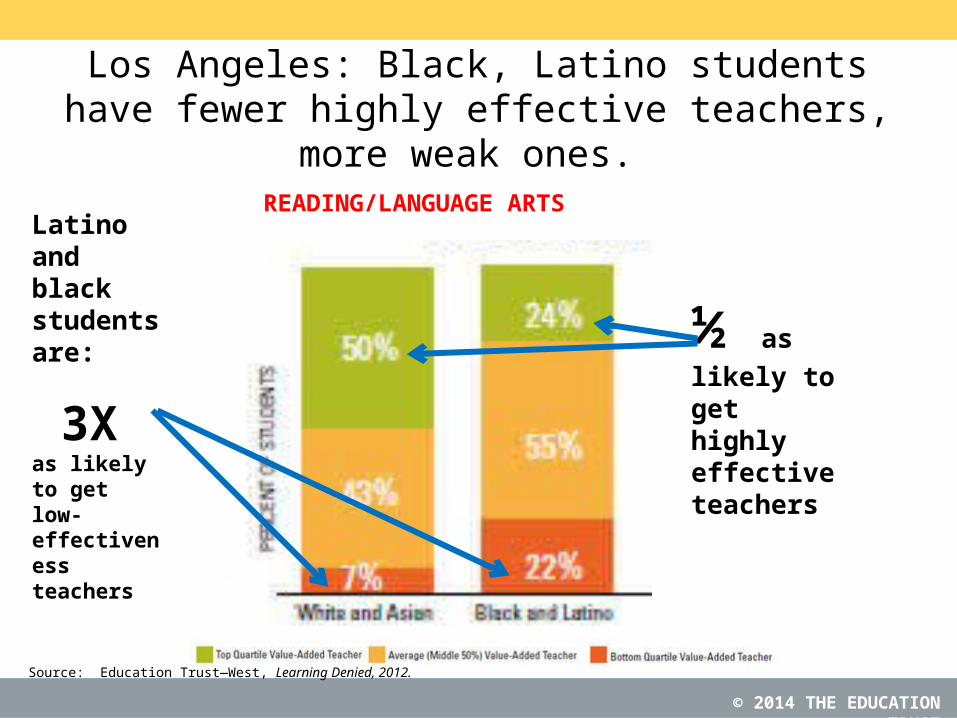
Los Angeles: Black, Latino students have fewer highly effective teachers, more weak
ones.
Latino and black students are:
3X as
likely to get low- effectiveness teachers
½ as
likely to get highly effective teachers
READING/LANGUAGE ARTS
Source: Education Trust—West, Learning Denied, 2012.
© 2014 THE EDUCATION TRUST

© 2014 THE EDUCATION TRUST
Source:
Since 1999, large gains for all groups of students,
especially students of color
1971* 1975* 1980* 1984* 1988* 1990* 1992* 1994* 1996* 1999* 2004 2008 2012150
160
170
180
190
200
210
220
230
240
250
9 Year Olds – NAEP LTT Reading
African American Latino White
Aver
age
Scal
e Sc
ore
*Denotes previous assessment formatNational Center for Education Statistics, “The Nation's Report Card: Trends in Academic Progress 2012”

© 2014 THE EDUCATION TRUST
Source:
Since 1999, performance rising for all groups of students
1973* 1978* 1982* 1986* 1990* 1992* 1994* 1996* 1999* 2004 2008 2012160
170
180
190
200
210
220
230
240
250
260
9 Year Olds – NAEP LTT Math
African American Latino White
Aver
age
Scal
e Sc
ore
*Denotes previous assessment formatNational Center for Education Statistics, “The Nation's Report Card: Trends in Academic Progress 2012”

© 2014 THE EDUCATION TRUST
© 2014 THE EDUCATION TRUST
Source:
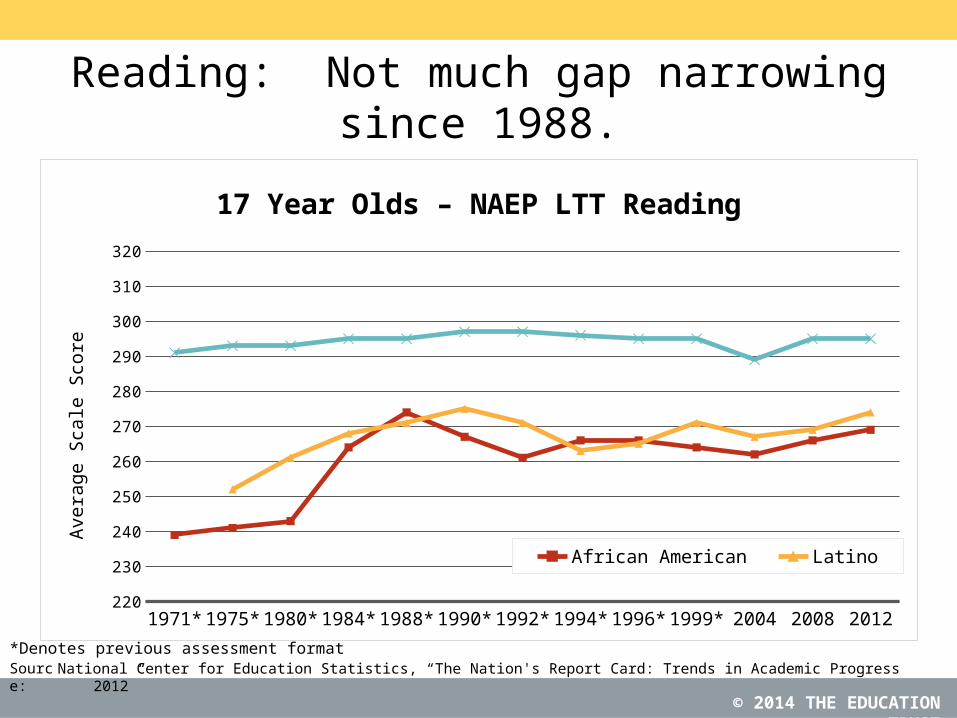
Reading: Not much gap narrowing since 1988.
1971* 1975* 1980* 1984* 1988* 1990* 1992* 1994* 1996* 1999* 2004 2008 2012220
230
240
250
260
270
280
290
300
310
320
17 Year Olds – NAEP LTT Reading
African American Latino White
Aver
age
Scal
e Sc
ore
*Denotes previous assessment formatNational Center for Education Statistics, “The Nation's Report Card: Trends in Academic Progress 2012”

© 2014 THE EDUCATION TRUST
Source:
Math: Not much gap closing since 1990.
1973* 1978* 1982* 1986* 1990* 1992* 1994* 1996* 1999* 2004 2008 2012240
250
260
270
280
290
300
310
320
330
340
17 Year Olds – NAEP LTT Math
African American Latino White
Aver
age
Scal
e Sc
ore
*Denotes previous assessment formatNational Center for Education Statistics, “The Nation's Report Card: Trends in Academic Progress 2012”

© 2014 THE EDUCATION TRUST

© 2014 THE EDUCATION TRUST
So, too, are misguided government aid policies

© 2014 THE EDUCATION TRUST
College costs have increased at 4.5 times the rate of inflation
College Tuition and Fees
Medical Care
Median Family Income
Consumer Price Index
0%
100%
200%
300%
400%
500%
600%
570%
300%
146% 125%
Perc
ent G
row
th R
ate
Curr
ent D
olla
rs, 1
982-
2011
Source: Bureau of Labor Statistics, Annual Average CPI Index, 2011: http://www.bls.gov/cpi/cpid11av.pdf; Census Bureau, Income, Poverty, and Health Insurance Coverage in the United States: 2012; Table F-6.

© 2014 THE EDUCATION TRUST
Federal Pell Grants have failed to keep pace with rising college costs
Public 2-Year Public 4-Year Private 4-Year0%
20%
40%
60%
80%
100% 99%
77%
36%
52%
31%
14%
1979-80 2012-1385
Total Cost of Attendance Covered by Maximum Pell Grant Award
American Council on Education (2007). “ Status Report on the Pell Grant Program, 2007” and College Board, Trends in Student Aid, 2013.

© 2014 THE EDUCATION TRUST
Why? Not because we’re not spending a lot more on student
aid.But, rather, because we’ve changed
who gets those dollars.

© 2014 THE EDUCATION TRUST
The College Board, Trends in Student Aid 2013.
Evan as many in Washington claim that the estimated $32.3 billion spent on the Pell
Grant program in 2012 is “unsustainable”…

© 2014 THE EDUCATION TRUST
$21 billion in federal dollars were diverted in FY13 to education tax benefits,
many of which benefit institutions or wealthier students.
Source: Fiscal Year 2014 Analytical Perspectives, Budget of the U.S. Government, Office of Management and Budget, Table 16-1. Estimates of Total Income Tax Expenditures for Fiscal Years 2012-2018.

© 2014 THE EDUCATION TRUST
51% of savings from tuition tax credits go to middle- and upper-income families
49%51%
Distribution of Education Tax Credits by Adjusted Gross Income
Low-income ($0-49,999)
Middle and upper-income ($50,000+)
Source: The College Board, Trends in Student Aid 2013.

© 2014 THE EDUCATION TRUST
88% of savings from tuition tax deductions go to middle- and upper-income families
12%
88%
Distribution of Tax Deduction Savings by Adjusted Gross Income
Low-income ($0-49,999)
Middle and upper-income ($50,000+)
Note: Percentages may not add to 100% because of rounding.Source: The College Board, Trends in Student Aid 2013.

© 2014 THE EDUCATION TRUST
Pattern is the same at state level, even in tough times.
Source: Trends in Student Aid 2010, The College Board

© 2014 THE EDUCATION TRUST
Non-need-based grant aid now represents more than a quarter of all state grant aid
Source: The College Board, Trends in Student Aid 2013.
2010-11
92-93 93-94 94-95 95-96 96-97 97-98 98-99 99-00 00-01 01-02 02-03 03-04 04-05 05-06 06-07 07-08 08-09 09-10 10-11 11-120%
10%
20%
30%
40%
50%
60%
70%
80%
90%
100%90% 90%
87% 86% 85% 83% 81%78% 76% 76% 77% 74% 73% 72% 72% 72% 72% 72% 71%
74%
10% 10%13% 14% 15% 17% 19%
22% 24% 24% 23% 26% 27% 28% 28% 28% 28% 28% 29%26%
Need-Based and Non-Need-Based State Grants per Full-Time Equivalent (FTE) Un-dergraduate Student, 1992-93 to 2011-12
Percentage Need-Based Percentage Non-Need-Based

© 2014 THE EDUCATION TRUST
Big Effects, too, from State Disinvestment in Public Higher Education.
© 2014 THE EDUCATION TRUST
We start out by spending less per student in the institutions
serving students with the biggest needs. Then, over the past few
years, we just cut mercilessly from there.

© 2014 THE EDUCATION TRUST
So yes, government policy is part of the problem, too.

© 2014 THE EDUCATION TRUST
But colleges and universities are not
unimportant actors in this drama of shrinking opportunity, either.
96

© 2014 THE EDUCATION TRUST
For one thing, the shifts away from poor students in institutional aid money are MORE PRONOUNCED than the shifts in government aid.

© 2014 THE EDUCATION TRUST98
In 2011, four-year public and private nonprofit colleges
spent over $21 billion on grant aid.
Education Trust analysis of NPSAS:12 using PowerStats. Results based on full-time, full-year, one-institution dependent undergraduates.

© 2014 THE EDUCATION TRUST99
But, they spent a lot of aid on students who didn’t need it…
Education Trust analysis of NPSAS:12 using PowerStats. Results based on full-time, full-year, one-institution dependent undergraduates.

© 2014 THE EDUCATION TRUST
Public 4-year colleges used to spend more than twice as much on needy students, but now spend more on wealthy students
1995 2012$0
$100
$200
$300
$400
$500
$600
$700
$800
$900
$1,000
$340
$809
$124
$869
Lowest income quintile Highest income quintile
Insti
tutio
nal G
rant
Aid
at P
ublic
4-Y
ear
Insti
tutio
ns, 1
995-
2012
(in
mill
ions
)
Education Trust analysis of NPSAS:96, NPSAS:08, NPSAS:12 using PowerStats. Results based on full-time, full-year, one-institution dependent undergraduates.

© 2014 THE EDUCATION TRUST
1995 2012$0
$500
$1,000
$1,500
$2,000
$2,500
$3,000
$3,500
$4,000
$4,500
$721
$2,625
$605
$4,042
Lowest income quintile Highest income quintile
Insti
tutio
nal G
rant
Aid
at P
rivat
e N
FP
4-Ye
ar In
stitu
tions
, 199
5-20
12 (m
illio
ns)
Private nonprofit 4-year colleges used to spend more on low-income students, but now spend nearly twice as much on wealthy students
Education Trust analysis of NPSAS:96, NPSAS:08, NPSAS:12 using PowerStats. Results based on full-time, full-year, one-institution dependent undergraduates.

© 2014 THE EDUCATION TRUST
Source:
Low-income students must devote an amount equivalent to 76% of their family income
towards college costsFamily Income Percentile
Average Income
Average Cost of
Attendance
Average Expected
Family Contribution
(EFC)
Average Grant
Aid
Average Unmet Need After EFC and
Grant Aid
Average % of Income Required
to Pay Out-of-Pocket Expenses
21 – 40% $36,205 $29,345 $2,138 $12,246 $15,006 46%
61 – 80% $97,733 $30,719 $16,259 $6,842 $9,465 25%
Source: Education Trust analysis of NPSAS:12 using PowerStats, http://nces.ed.gov/datalab/. Results based on full-time, full-year, one-institution dependent undergraduates at public and private nonprofit four-year colleges
0 – 20% $12,783 $27,428 $13,565
41 – 60% $65,204 $29,804 $8,465
81 – 100% $185,819 $34,370 $6,041
$276 $13,591 76%
$8,059 $13,689 33%
$35,925 $5,281 17%

© 2014 THE EDUCATION TRUST
So it’s not all about the students or about government. What colleges do is important in who comes…and
who doesn’t.

© 2014 THE EDUCATION TRUST
Moreover, what colleges do also turns out to be very important in
whether students graduate or not.

© 2014 THE EDUCATION TRUST
Warning: I’m going to focus for the next
few minutes on IPEDS grad rates. Yes, we know those don’t tell us everything. But they do tell us
how we are doing with the easiest of our students.
n/a

© 2014 THE EDUCATION TRUST
College Completion Rates:4-Year Colleges
Fewer than 4 in 10 (38%) entering full-time freshmen obtain a bachelor’s degree from the same institution within 4 years.
Within six years of entry, that proportion rises to just under 6 in 10 (58%).
If you go beyond IPEDS, and look at graduation from ANY institution, number grows to about two-thirds.
Source: NCES (December 2013). Enrollment in Postsecondary Institutions, Fall 2012; Financial Statistics, Fiscal Year 2012; and Graduation Rates, Selected Cohorts, 2004-2009, First Look (Provisional Data) Table 4.

© 2014 THE EDUCATION TRUST
Source:
Many Four-Year Colleges Have Very High Graduation Rates and Many, Very Low
Ed Trust analysis of IPEDS Graduation Rates
0-5% 5-10% 10-15% 15-20% 20-25% 25-30% 30-35% 35-40% 40-45% 45-50% 50-55% 55-60% 60-65% 65-70% 70-75% 75-80% 80-85% 85-90% 90-95% 95-100%
100%+0
50
100
150
200
250
Distribution of Graduation Rates (2012)6-year bachelor's completion rates for first-time, full-time freshmen,
Fall 2006 cohort at 4-year institutions
Series1

© 2014 THE EDUCATION TRUST
Some of these differences are clearly attributable to differences in
student preparation and/or institutional mission.
n/a

© 2014 THE EDUCATION TRUST
Indeed, with enough data on both institutions and students, we can find a way to “explain” 70-80% of the variance among
institutions.
Source: Ed Trust analysis of College Results Online dataset 2011.

© 2014 THE EDUCATION TRUST
EdTrust experience:“Our graduation rates are about the same as other institutions that serve similar students.”
n/a

© 2014 THE EDUCATION TRUST
But…when you dig underneath the averages, one thing is very
clear:
Some colleges are far more successful than their students’
“stats” would suggest.Ed Trust analysis of College Results Online dataset

© 2014 THE EDUCATION TRUST
College Results Onlinewww.collegeresults.org

© 2014 THE EDUCATION TRUST
Research InstitutionsSimilar Students, Different Results
MedianSAT Size % Pell % URM
Overall Grad Rate
URM Grad Rate
Penn StateUniversity
1,195 37,763 16% 8.6% 86.7% 74.6 %
Indiana University
1,170 31,427 21% 8.0% 72.0% 52.1%
University of Minnesota
1,245 30,656 23% 7.6% 70.2% 44.4%
Purdue University
1,165 30,812 21% 6.9% 68.1% 54.1%
Source: College Results Online, 2013: www.collegeresults.org.

© 2014 THE EDUCATION TRUST
Research InstitutionsSimilar Students, Different Results
MedianSAT Size % Pell % URM
Overall Grad Rate
URM Grad Rate
Florida State University 1,185 29,291 28% 25.2% 73.8% 71%
University of Arizona 1,085 28,174 32% 23.8% 61.4% 53.1%
Source: College Results Online, 2013: www.collegeresults.org.

© 2014 THE EDUCATION TRUST
Masters Institutions – LargeSimilar Students, Different Results
MedianSAT Size % Pell
Overall Graduation
Rate
University of Northern Iowa 1,070 10,716 25% 66.7%
Montclair State University 1,010 12,975 37% 62.3%
EasternIllinois University 990 9,287 39% 59.3%
University of Wisconsin Whitewater 1,050 9,685 30% 53.9%
Source: College Results Online, 2013: www.collegeresults.org.

© 2014 THE EDUCATION TRUST
Historically Black CollegesSimilar Students, Different Results
MedianSAT Size % Pell
Overall Graduation Rate
Elizabeth City University 835 3,020 80% 43.7%
Delaware State University 875 3,167 59% 34.6%
Norfolk State University 865 5,373 65% 33.2%
University of ArkansasPine Bluff
780 3,096 82% 23%
Coppin State University 855 2,832 70% 14.7%
Source: College Results Online, 2013: www.collegeresults.org.

© 2014 THE EDUCATION TRUST© 2014 THE EDUCATION TRUST
Some making fast progress in improving success for students of
color, some have closed gaps entirely.

© 2014 THE EDUCATION TRUST
Source:
Biggest Gainers in Success for Latino Students: Public Colleges and Universities
Advancing to Completion, 2012, The Education Trust.

© 2014 THE EDUCATION TRUST
Source:
Biggest Gainers in Success for Black Students: Public Colleges and Universities
Advancing to Completion, 2012, The Education Trust.

© 2014 THE EDUCATION TRUST
Source:
Universities with No Black/White Graduation Rate Gaps
Advancing to Completion, 2012, The Education Trust.

© 2014 THE EDUCATION TRUST
Bottom Line:
So yes, we have to keep working to improve our high schools;
And yes, government has to do its part; But we’ve got to focus on changing what our
colleges do, too.

© 2014 THE EDUCATION TRUST
…and that includes the CSU.

© 2014 THE EDUCATION TRUST
Source:
So far…• Big efforts on the access side have yielded
real results, with the system as a whole—and most campuses—looking more like the young people of California;
• Still can’t take your eye off the access side, because those numbers can easily slip—and because some campuses aren’t even close to doing their share;

© 2014 THE EDUCATION TRUST
Source:
• Through your Graduation Rate Initiative, you also made real strides—again, on most campuses—in improving student success.
• Overall success rates on most campuses still don’t match those of top peers and while success rates improved for all groups of students, gaps between groups did not narrow.

© 2014 THE EDUCATION TRUST
What can we learn from the fastest
gainers?
n/a

© 2014 THE EDUCATION TRUST
1. Their leaders make sure student success is a campus-
wide priority.
n/a

© 2014 THE EDUCATION TRUST
Improving student success isn’t all—or even mostly—about
programs.It’s about institutional culture that
values success and that accepts responsibility.
n/a

© 2014 THE EDUCATION TRUST
Successful leaders honor and tap into institutional culture to privilege student success

© 2014 THE EDUCATION TRUST
In fact, successful leaders consistently treat faculty as
problem solvers, not as problems to be solved.

© 2014 THE EDUCATION TRUST
2. They look at their data…and act.
Use of disaggregated data to spot problems and frame action is
pervasive.
n/a
© 2014 THE EDUCATION TRUST
Successful institutions don’t just aim at the final goal—graduation—they concentrate on each step
along the way, especially the early ones.
n/a
© 2014 THE EDUCATION TRUST
Keeping your eyes on both retention and credit
accumulation

© 2014 THE EDUCATION TRUST
First-Year Retention vs. Credit Accumulation The Silent Retention Problem
Fall ’00 Fall ’01 Fall ’02 Fall ’03 Fall ’04 Fall ’05 Fall ’06 Fall ’07 Fall ‘08 0%
10%
20%
30%
40%
50%
60%
70%
80%
90%
100%
80% 82% 81% 83% 80% 81% 82% 83% 83%
22%27% 28%
33% 35%39%
49%
62%67%
% Retained % Retained and SophomoreGeorgia State University.
© 2014 THE EDUCATION TRUST
PS. Don’t just LOOK at your data. The ACT part is really important.
Just having data doesn’t accomplish
anything. Completion is about creating accountability for acting on
those data.

© 2014 THE EDUCATION TRUST
3. Where can the data take you? Successful institutions create clear, structured pathways to
success.
n/a

© 2014 THE EDUCATION TRUST© 2014 THE EDUCATION TRUST
136
FLORIDA STATE ACADEMIC MAP

© 2014 THE EDUCATION TRUST
4. They take on Introductory and Developmental Classes
n/a
© 2014 THE EDUCATION TRUST© 2014THE EDUCATION TRUST
Source:
Promising Approaches• Course Redesign;• Corequisite Remediation: Instead of placing
students with weaker skills in separate Developmental courses, place into regular courses that:– Have built in supports on the side; – Include paired developmental course; or,– Meet 5 days/week.
• Linked pathways in Math, including Carnegie’s STATWAY and Dana Center’s MATHWAY.

© 2014 THE EDUCATION TRUST
5. Where else can the data take you? Successful institutions
don’t hesitate to demand, require.
n/a
© 2014 THE EDUCATION TRUST
A lot of institutions know what works. And more and more of
them are advising students to do those things.
But it turns out that “students don’t do optional.”

© 2014 THE EDUCATION TRUST
6. They bring back the ones they lose.

© 2014 THE EDUCATION TRUST© 2014 The Education Trust
It’s really not about boldness of reform.It’s about intentionality and quality of execution.
© 2014 THE EDUCATION TRUST
In other words, what institutions do to help their students succeed matters.
A lot.

© 2014 THE EDUCATION TRUST
Washington, D.C. Metro Detroit, MI
202/293-1217 734/619-8009
Download this presentation on our website
www.edtrust.org
Oakland, CA
510/465-6444