Embed Size (px)
Citation preview
© 2015 Electric Power Research Institute, Inc. All rights reserved.
Matthew RylanderEPRI
April 20, 2015
Streamlined Method for Determining
Distribution System Hosting Capacity
2© 2015 Electric Power Research Institute, Inc. All rights reserved.
Overview
Streamlined Method to Analyze Feeder Hosting Capacity for Distributed Generation–Why do we need it?–How does it work?
3© 2015 Electric Power Research Institute, Inc. All rights reserved.
Why do we need a Streamlined Method? PV Growth
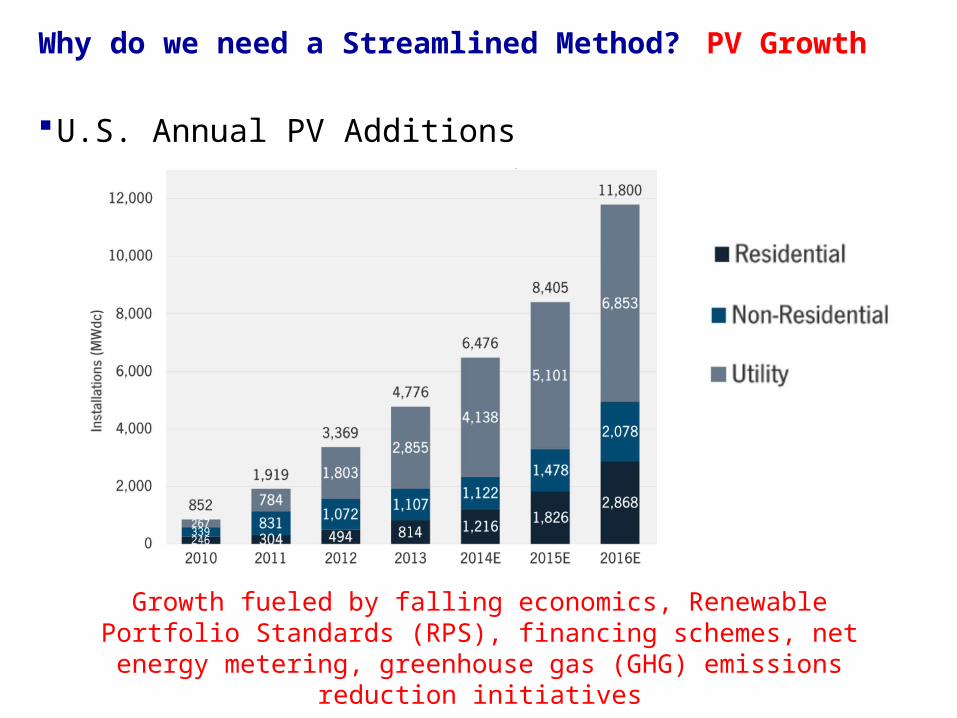
U.S. Annual PV Additions
Growth fueled by falling economics, Renewable Portfolio Standards (RPS), financing schemes, net energy metering,
greenhouse gas (GHG) emissions reduction initiatives
4© 2015 Electric Power Research Institute, Inc. All rights reserved.
Why do we need a Streamlined Method? Analysis
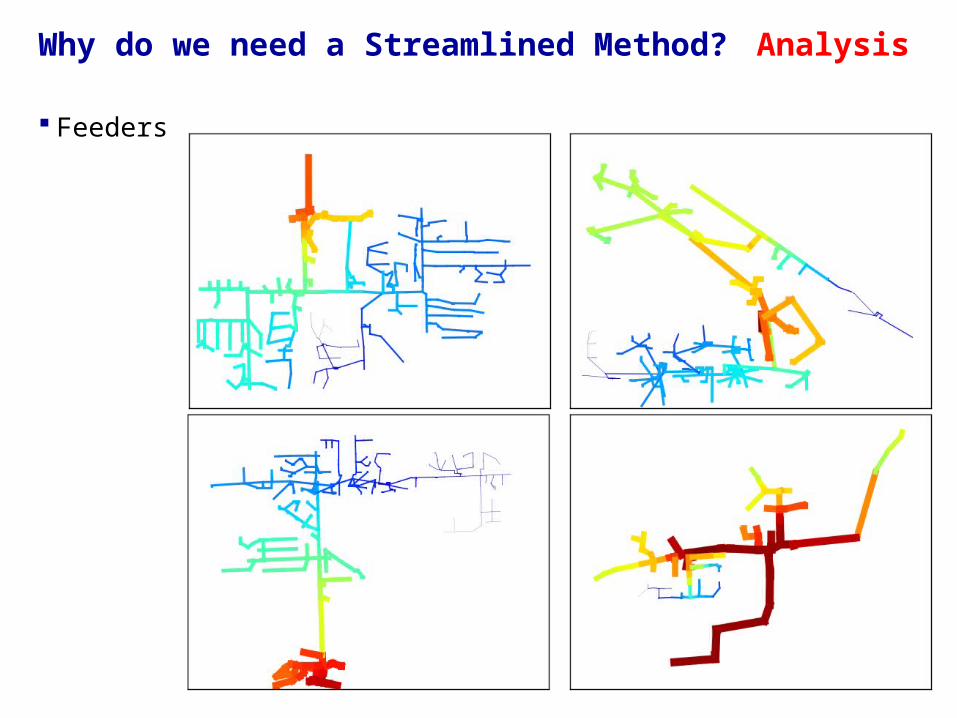
Feeders
5© 2015 Electric Power Research Institute, Inc. All rights reserved.
Why do we need a Streamlined Method? Analysis
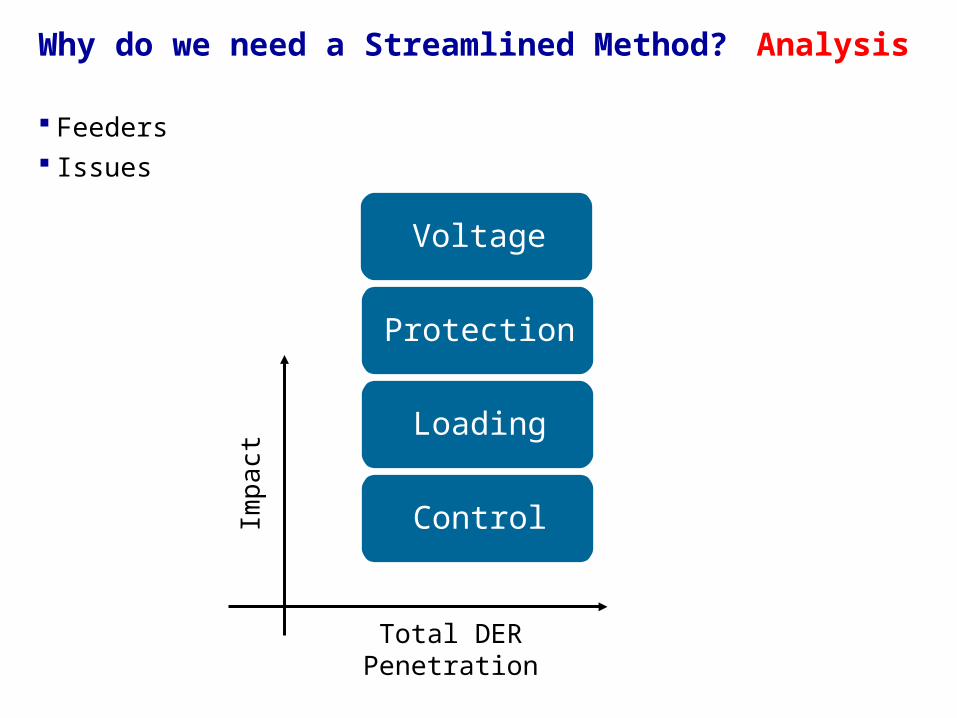
Voltage
Protection
Loading
Control
Feeders Issues
Imp
act
Total DER Penetration
6© 2015 Electric Power Research Institute, Inc. All rights reserved.
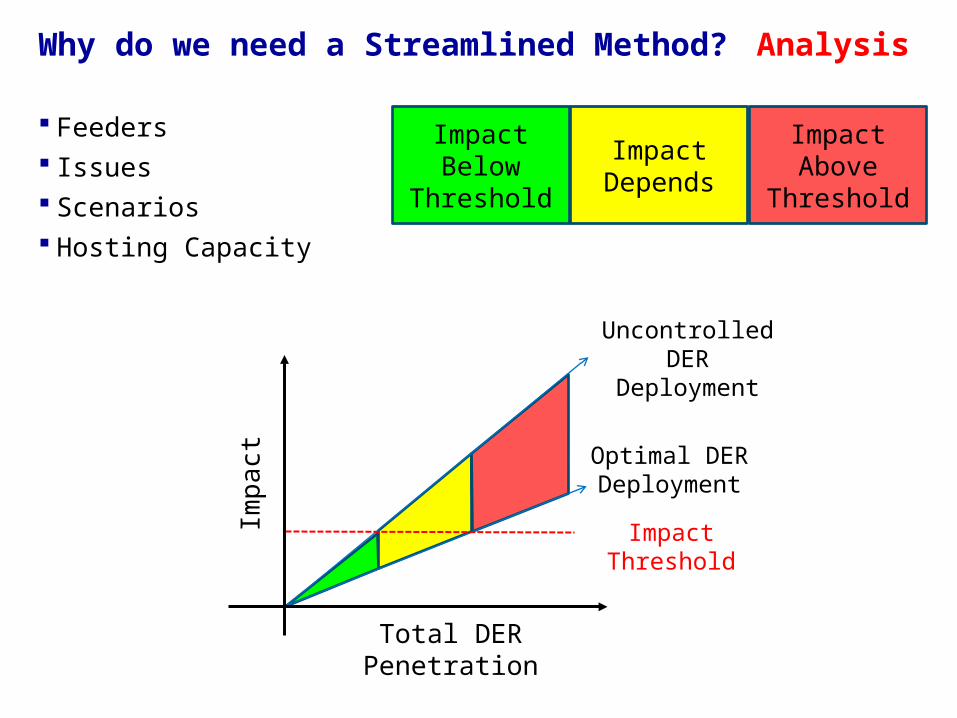
Why do we need a Streamlined Method? Analysis
Feeders Issues Scenarios Hosting Capacity
Imp
act
Total DER Penetration
UncontrolledDER Deployment
Impact Threshold
Optimal DER Deployment
Impact Below
Threshold
Impact Depends
Impact Above
Threshold

7© 2015 Electric Power Research Institute, Inc. All rights reserved.
Why do we need a Streamlined Method? Analysis
Feeders Issues Scenarios Hosting Capacity
Feeders with Similar
Characteristics
Impact Below
Threshold
Impact Depends
Impact Above
Threshold
8© 2015 Electric Power Research Institute, Inc. All rights reserved.
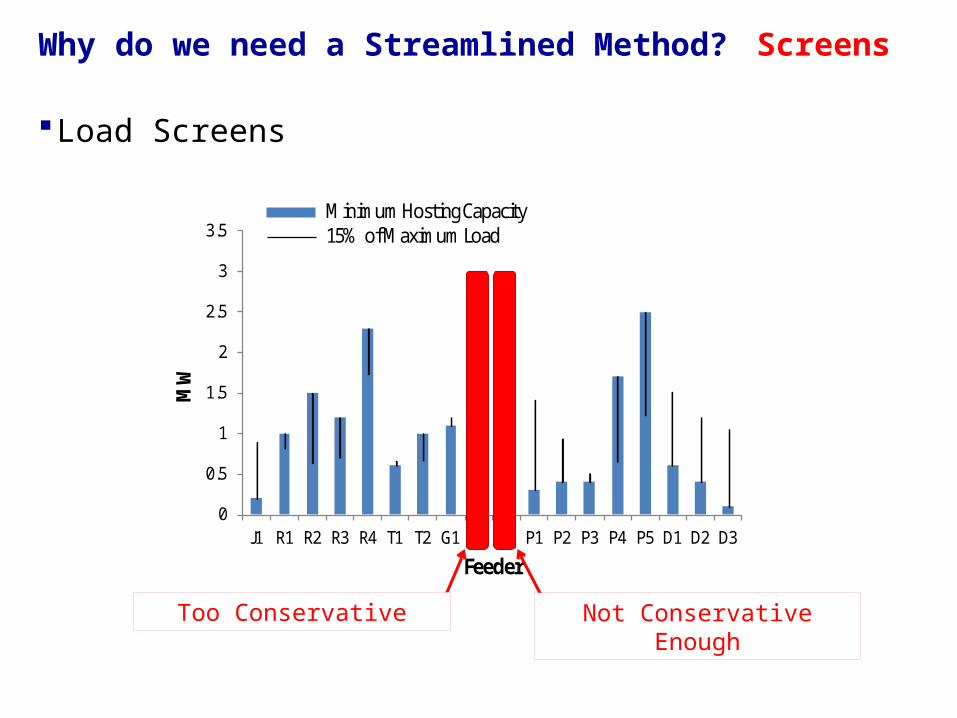
Load Screens
0
0.5
1
1.5
2
2.5
3
3.5
J1 R1 R2 R3 R4 T1 T2 G1 G2 G3 P1 P2 P3 P4 P5 D1 D2 D3
MW
Feeder
Minimum Hosting Capacity15% of Maximum Load
Too Conservative
Why do we need a Streamlined Method? Screens
Not Conservative Enough

9© 2015 Electric Power Research Institute, Inc. All rights reserved.
What type of Streamlined Method is needed?
• Capture unique feeder-specific responsesGranular
• As distribution feeders changeRepeatable
• System-wide assessmentScalable
• Clear and open methods for analysisTransparent
• Validated techniquesProven
• Utilize readily available utility data and toolsAvailable
EPRI’s Streamlined Hosting Capacity
10© 2015 Electric Power Research Institute, Inc. All rights reserved.
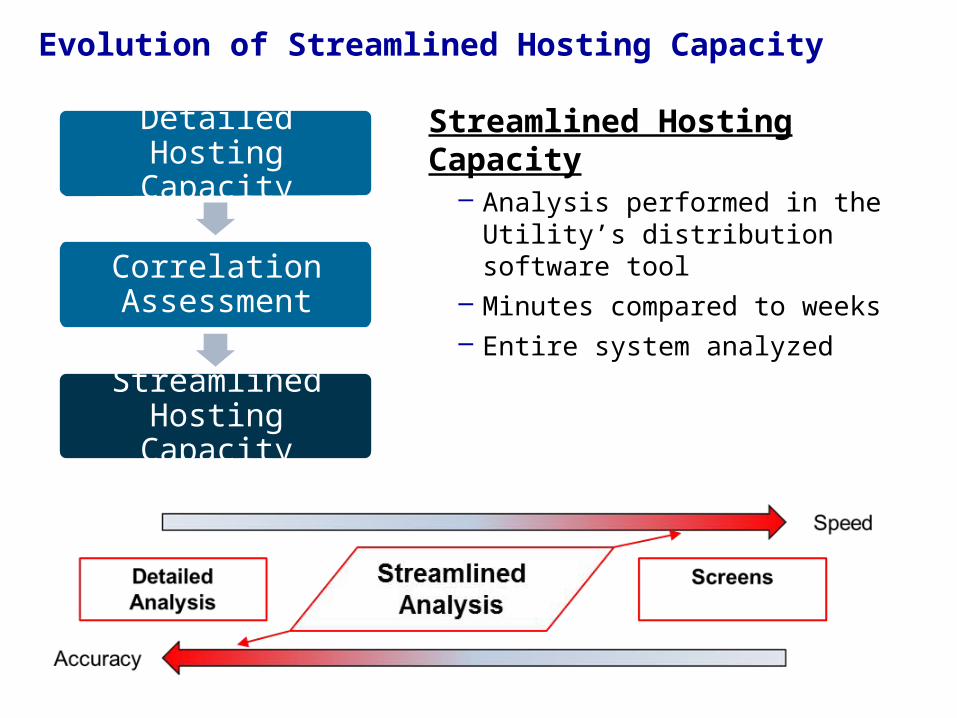
Evolution of Streamlined Hosting Capacity
Streamlined Hosting Capacity– Analysis performed in the Utility’s
distribution software tool– Minutes compared to weeks– Entire system analyzed
Detailed Hosting Capacity
Correlation Assessment
Streamlined Hosting Capacity
11© 2015 Electric Power Research Institute, Inc. All rights reserved.
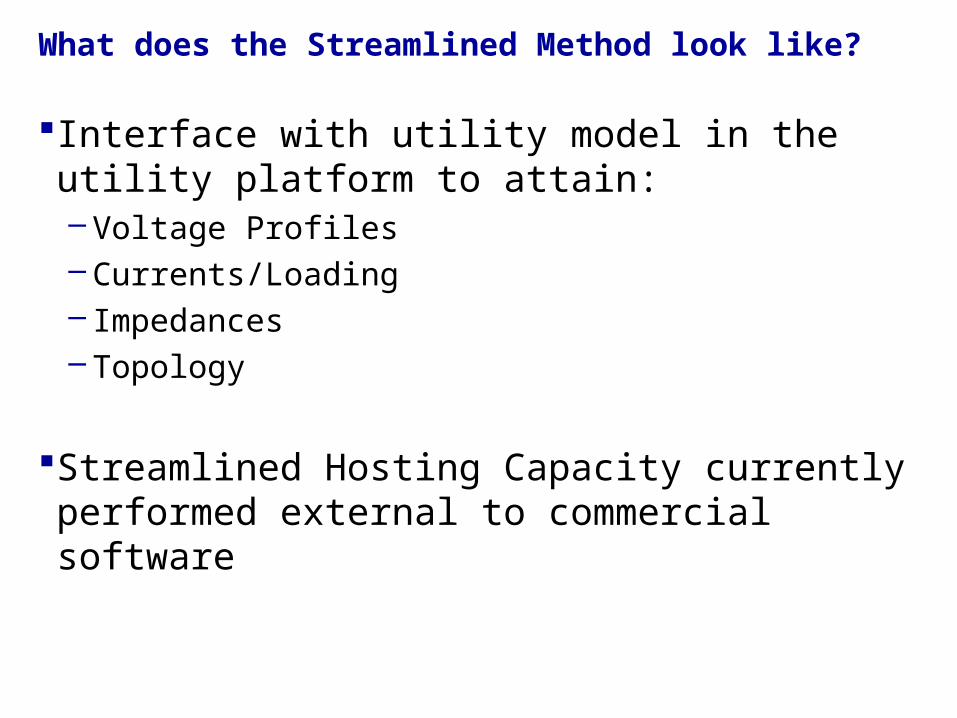
What does the Streamlined Method look like?
Interface with utility model in the utility platform to attain:– Voltage Profiles– Currents/Loading– Impedances– Topology
Streamlined Hosting Capacity currently performed external to commercial software
12© 2015 Electric Power Research Institute, Inc. All rights reserved.
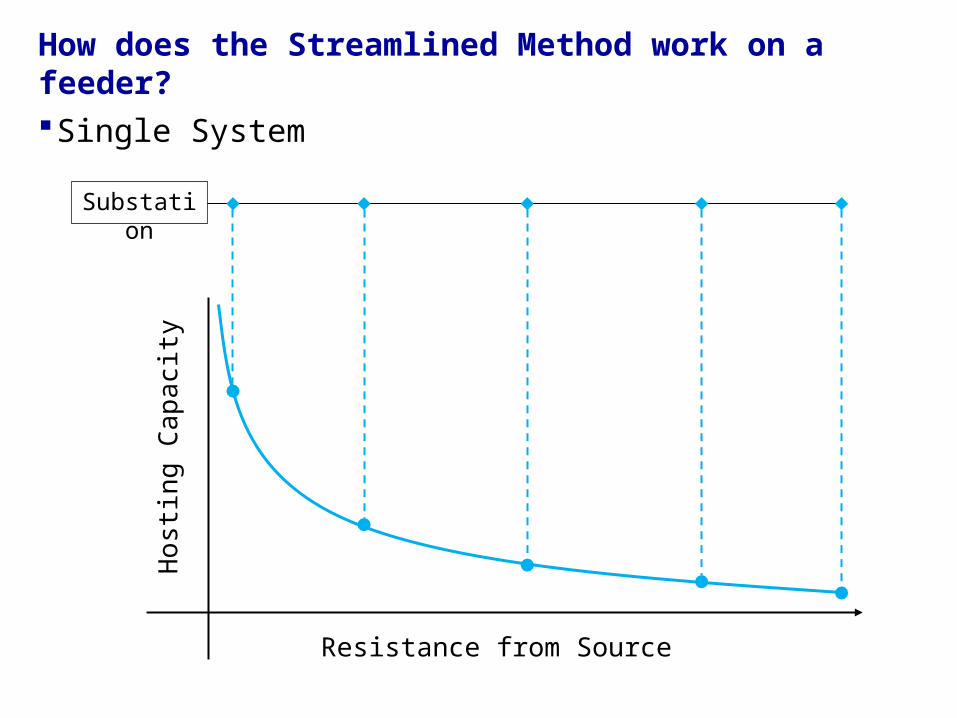
How does the Streamlined Method work on a feeder?
Single System
Resistance from Source
SubstationH
ost
ing
Ca
pac
ity
13© 2015 Electric Power Research Institute, Inc. All rights reserved.
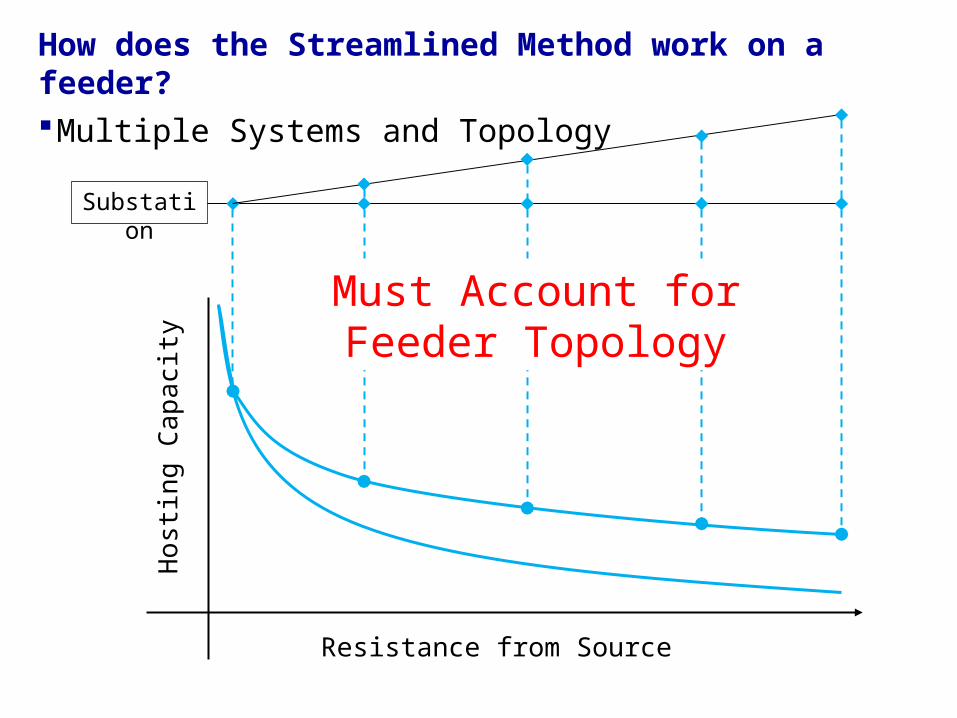
How does the Streamlined Method work on a feeder?
Multiple Systems and Topology
Resistance from Source
SubstationH
ost
ing
Ca
pac
ity
Must Account for Feeder Topology
14© 2015 Electric Power Research Institute, Inc. All rights reserved.
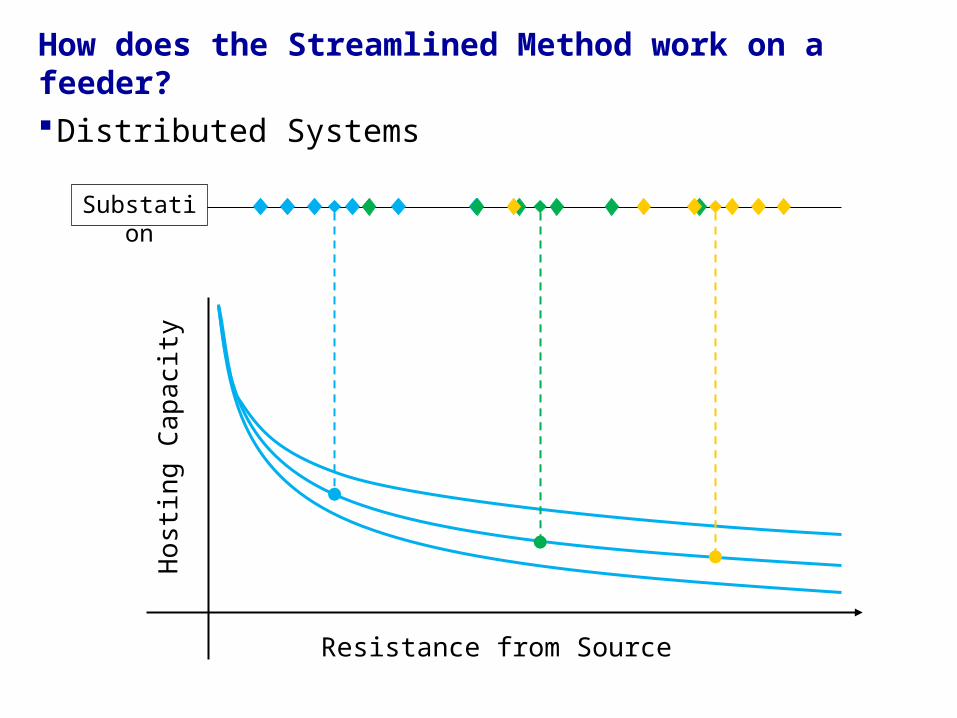
How does the Streamlined Method work on a feeder?
Distributed Systems
Resistance from Source
Substation
Ho
stin
g C
ap
acity
15© 2015 Electric Power Research Institute, Inc. All rights reserved.
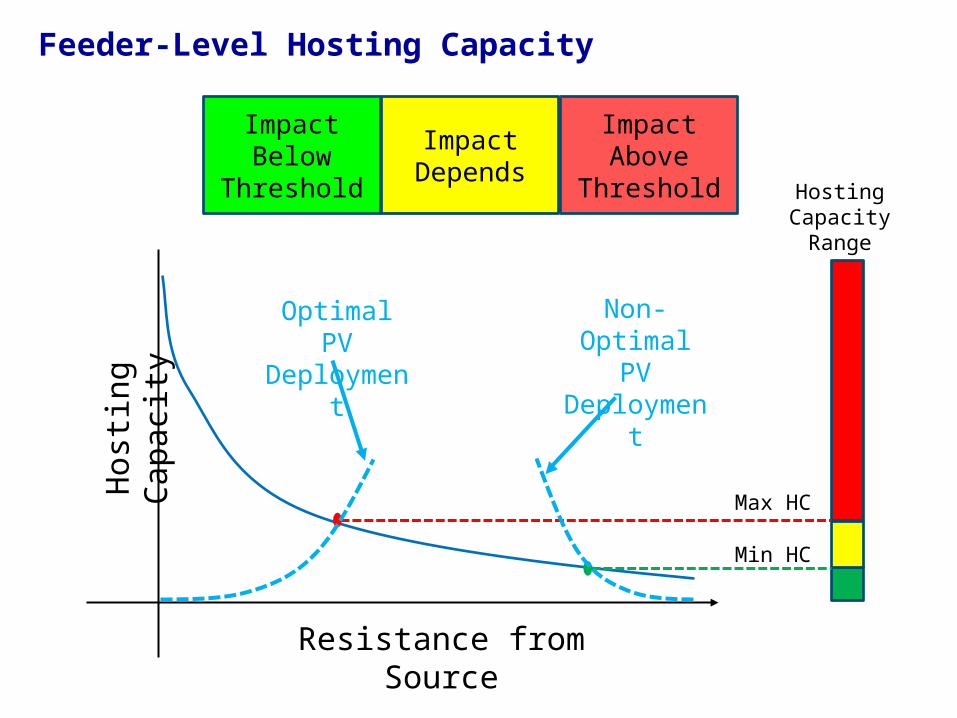
Feeder-Level Hosting Capacity
Resistance from Source
Hos
ting
Cap
acity
Optimal PV Deployment
Hosting Capacity Range
Non-Optimal PV Deployment
Max HC
Min HC
Impact Below
Threshold
Impact Depends
Impact Above
Threshold
16© 2015 Electric Power Research Institute, Inc. All rights reserved.
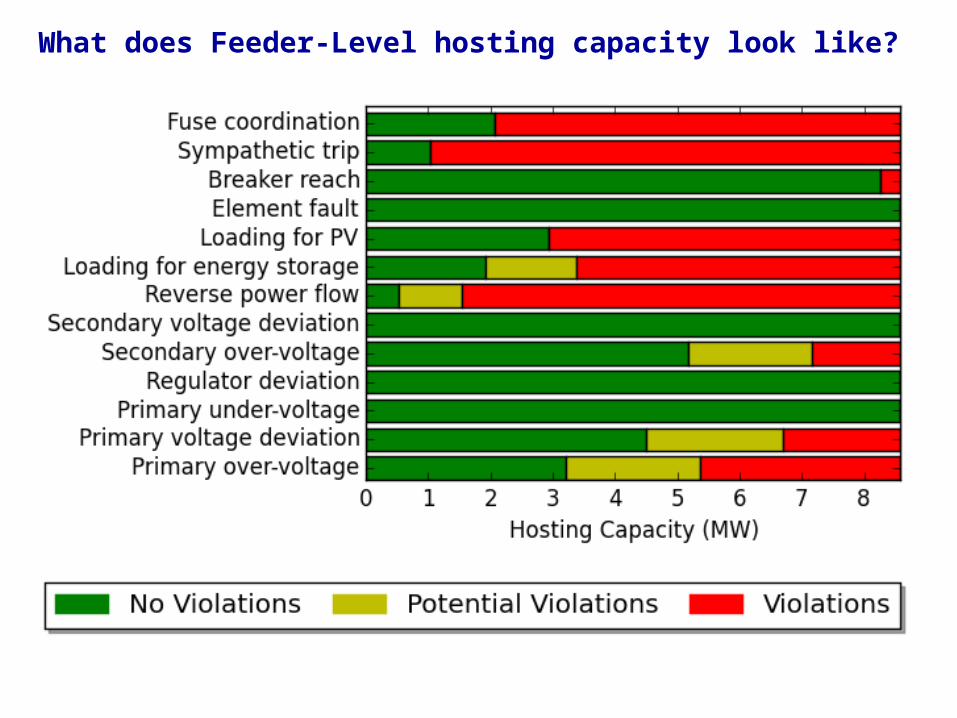
What does Feeder-Level hosting capacity look like?

17© 2015 Electric Power Research Institute, Inc. All rights reserved.
Outcomes of the Streamlined Hosting Capacity Analysis
This is not a replacement for detailed studies but it does provide guidance to when detailed studies are necessary
Questions Answered– Where is the “optimal” location for DER?– How much aggregate DER can a feeder
host?– When my feeder changes, how is
hosting capacity impacted?– What is the aggregate level of DER that
can be accommodated at the substation level?
– What amount of DER can be accommodated across my entire system?
– What are the range of issues for accommodating DER across the entire distribution system?
=
Feeder Level
Feeder Level
Feeder Level
Substation Level
Overvoltage
ThermalLoading
RelayCoordination
VoltageFluctuations
RelayDesensitization

18© 2015 Electric Power Research Institute, Inc. All rights reserved.
Final Thoughts…
PV is comingNeed efficient methods to plan for it
Methods will continue to evolve– Consideration of existing distributed energy resources– Inclusion of other types of distributed energy resources– Advanced inverter capabilities

19© 2015 Electric Power Research Institute, Inc. All rights reserved.
Together…Shaping the Future of Electricity
20© 2015 Electric Power Research Institute, Inc. All rights reserved.
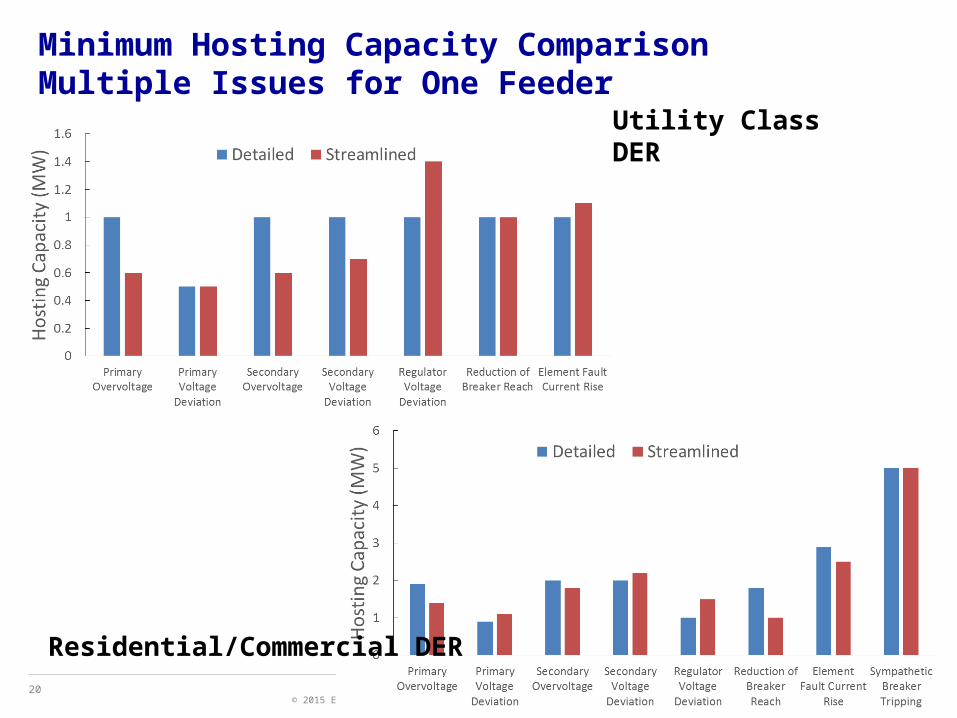
Minimum Hosting Capacity ComparisonMultiple Issues for One Feeder
Utility Class DER
Residential/Commercial DER
21© 2015 Electric Power Research Institute, Inc. All rights reserved.
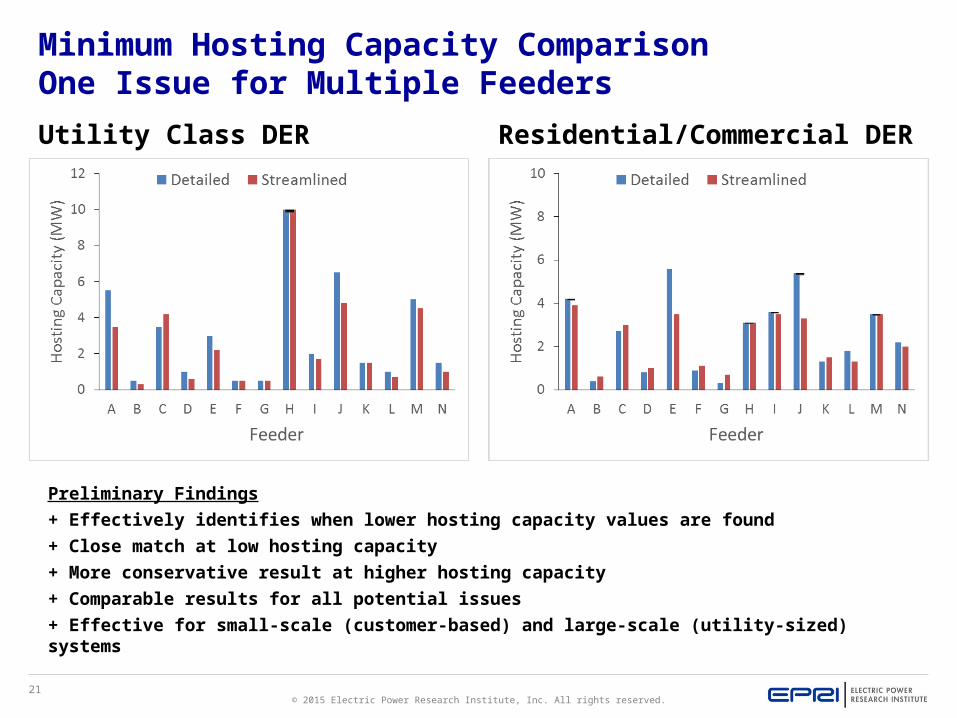
Minimum Hosting Capacity ComparisonOne Issue for Multiple Feeders
Utility Class DER Residential/Commercial DER
Preliminary Findings
+ Effectively identifies when lower hosting capacity values are found
+ Close match at low hosting capacity
+ More conservative result at higher hosting capacity
+ Comparable results for all potential issues
+ Effective for small-scale (customer-based) and large-scale (utility-sized) systems
22© 2015 Electric Power Research Institute, Inc. All rights reserved.
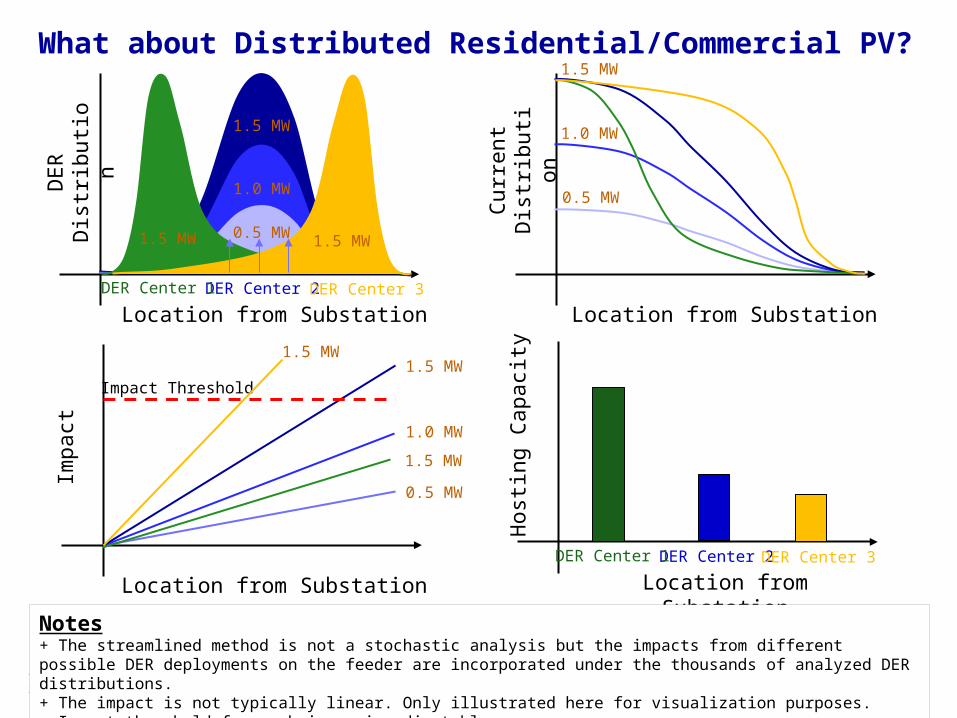
What about Distributed Residential/Commercial PV?
Location from Substation
Cur
rent
D
istr
ibut
ion
Location from Substation
DE
R
Dis
trib
utio
n
Location from Substation
Impa
ct
0.5 MW
1.0 MW
1.5 MW
0.5 MW
1.0 MW
1.5 MWImpact Threshold
0.5 MW
1.0 MW
1.5 MW
Location from Substation
Hos
ting
Cap
acity
DER Center 2DER Center 1 DER Center 3
1.5 MW 1.5 MW
1.5 MW
1.5 MW
DER Center 2DER Center 1 DER Center 3
Notes+ The streamlined method is not a stochastic analysis but the impacts from different possible DER deployments on the feeder are incorporated under the thousands of analyzed DER distributions. + The impact is not typically linear. Only illustrated here for visualization purposes. + Impact threshold for each issue is adjustable.
23© 2015 Electric Power Research Institute, Inc. All rights reserved.
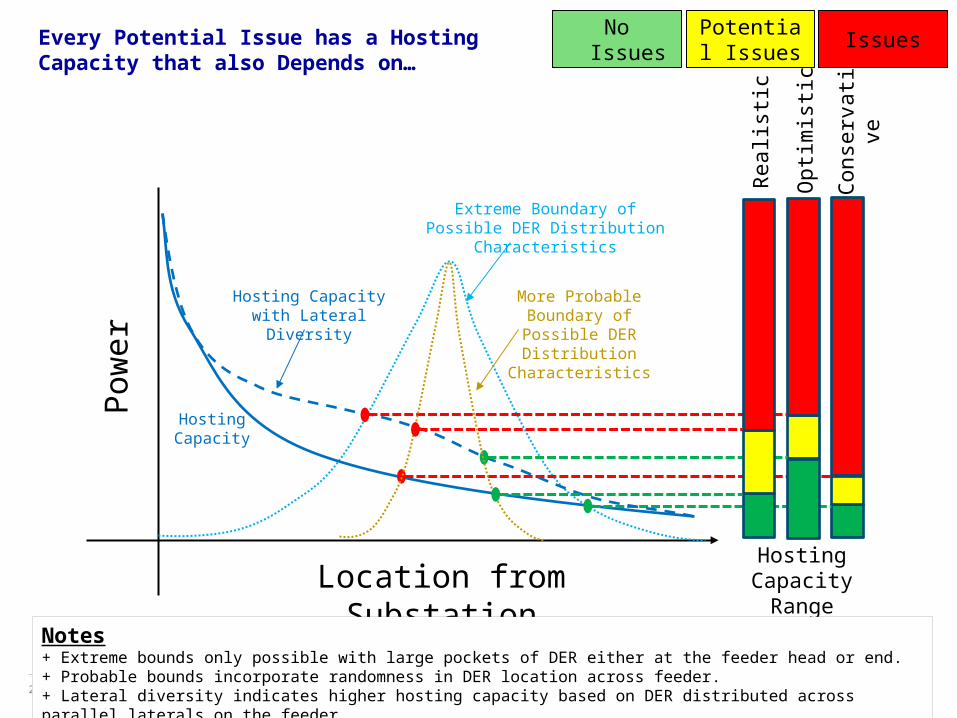
Every Potential Issue has a Hosting Capacity that also Depends on…
Location from Substation
Pow
er
Extreme Boundary of Possible DER Distribution Characteristics
Hosting Capacity
Hosting Capacity with Lateral Diversity
More Probable Boundary of Possible DER
Distribution Characteristics
Con
serv
ativ
e
Hosting Capacity Range
Opt
imis
tic
Rea
listic
Notes+ Extreme bounds only possible with large pockets of DER either at the feeder head or end. + Probable bounds incorporate randomness in DER location across feeder. + Lateral diversity indicates higher hosting capacity based on DER distributed across parallel laterals on the feeder.
No IssuesPotential Issues
Issues

![Rylander Theatre Marketing & Development Strategies & · PDF file[ RYLANDER THEATRE MARKETING & DEVELOPMENT STRATEGIES & TACTICS] Archway Partnership, UGA School of Public and](https://img.pdfslide.net/doc/110x75/5a78d8a57f8b9ae6228dd471/rylander-theatre-marketing-development-strategies-rylander-theatre-marketing.jpg)