Embed Size (px)
Citation preview

E L A S T I C I T Y5CHAPTER
SLIDES CREATED BY ERIC CHIANG
CHAPTER 5 SLIDE 1
DEDI
57/D
REAM
STIM
E.CO
M
Understand the concept of elasticity and why percentages are used to measure it.
Describe the difference between elastic and inelastic demand.
Compute price elasticities of supply and demand.
Describe the relationship between total revenue and price elasticity of demand.
Describe cross elasticity of demand and use this concept to define substitutes and complements.
CHAPTER OBJECTIVES
CHAPTER 5 SLIDE 2
Use income elasticity of demand to define normal, inferior, and luxury goods.
Describe the determinants of elasticity. Use the concept of price elasticity of supply to
measure the relationship between changes in product price and quantity supplied.
Describe the time periods economists use to study elasticity, and describe the variables companies can change during these periods.
Describe the relationship between elasticity and the burden and incidence of taxes.
CHAPTER OBJECTIVES
CHAPTER 5 SLIDE 3

ELASTICITY MEASURES THE RESPONSIVENESS OF ONE VARIABLE TO CHANGES IN ANOTHER.
CHAPTER 5 SLIDE 4
10% PRICE
EAST
PHOT
O/AG
E FO
TOST
OCK
CHAPTER 5 SLIDE 5
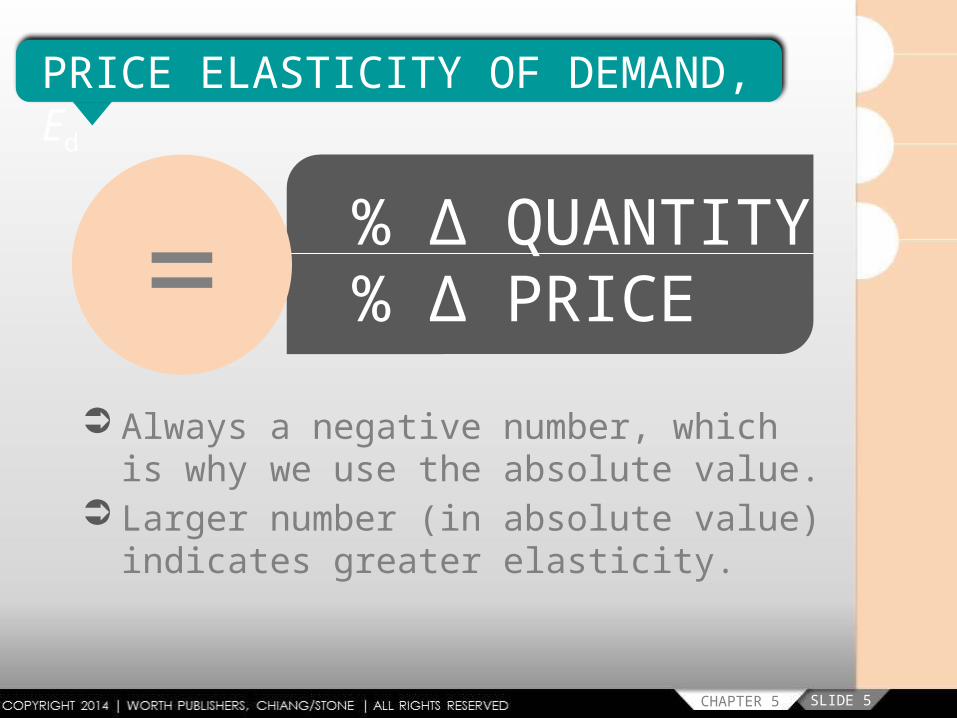
% Δ QUANTITY% Δ PRICE=
PRICE ELASTICITY OF DEMAND, Ed
Always a negative number, which is why we use the absolute value.
Larger number (in absolute value) indicates greater elasticity.
CHAPTER 5 SLIDE 6
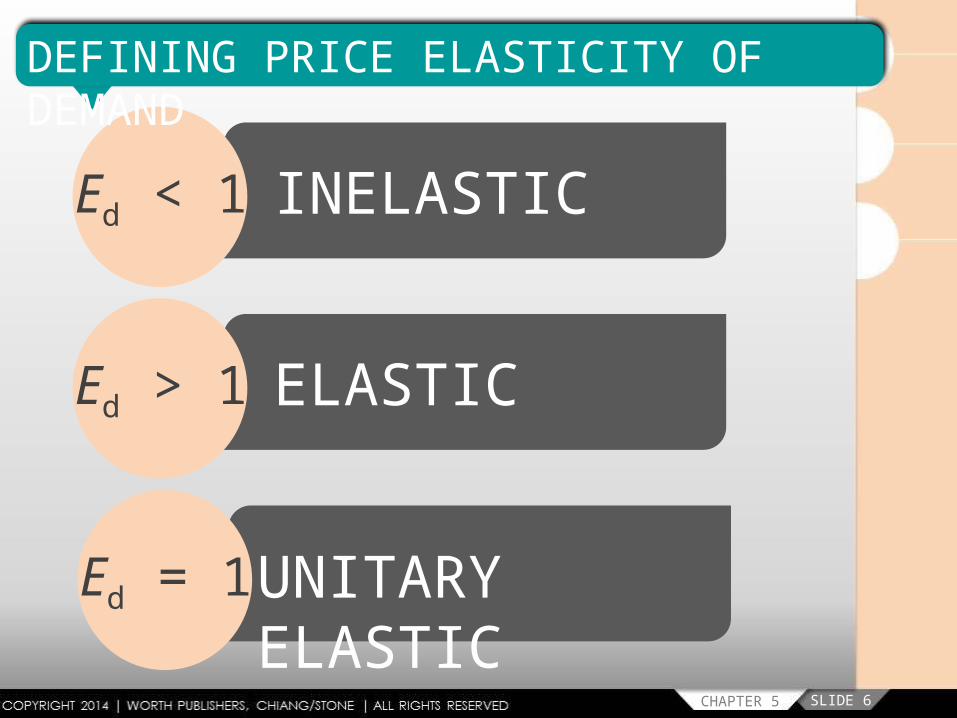
Ed < 1 INELASTIC
Ed > 1 ELASTIC
Ed = 1UNITARY ELASTIC
DEFINING PRICE ELASTICITY OF DEMAND

DEMAND FOR ELASTIC GOODS IS SENSITIVE TO PRICE CHANGES.
CHAPTER 5 SLIDE 7
HUPE
N/DR
EAM
STIM
E.CO
M

DEMAND FOR INELASTIC GOODS IS LESS SENSITIVE TO PRICE CHANGES.
CHAPTER 5 SLIDE 8
JOHN
FOTO
/DRE
AMST
IME.
COM
PRIC
E
QUANTITY
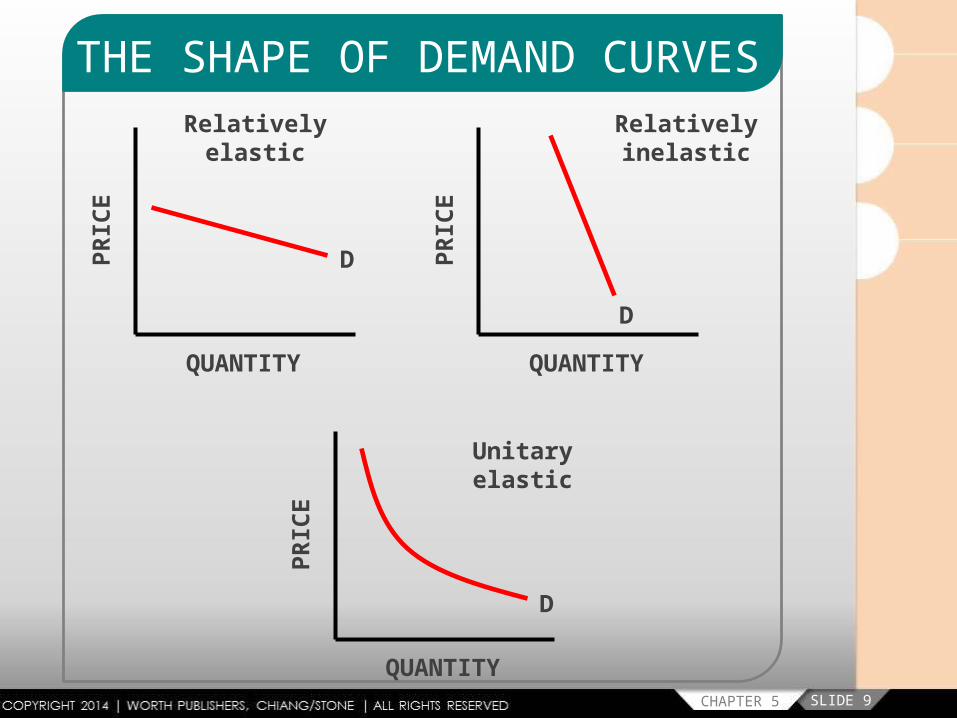
THE SHAPE OF DEMAND CURVES
CHAPTER 5 SLIDE 9
D
Relatively elastic
PRIC
E
QUANTITY
DPR
ICE
QUANTITY
D
Unitary elastic
Relatively inelastic
PRIC
E
QUANTITY
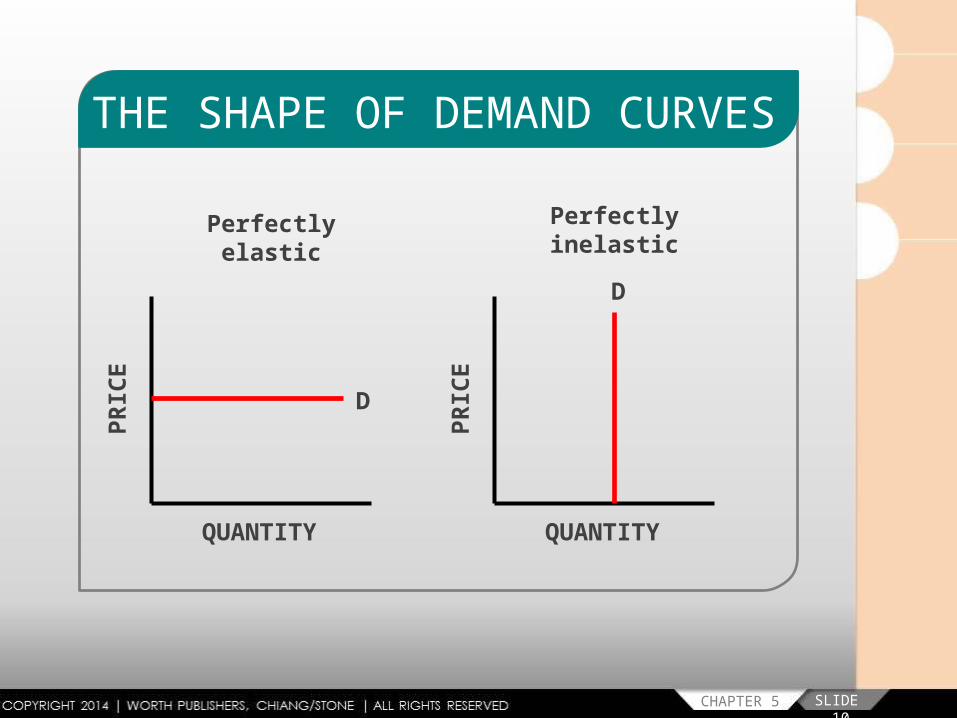
THE SHAPE OF DEMAND CURVES
CHAPTER 5 SLIDE 10
D
Perfectly elastic
PRIC
E
QUANTITY
D
Perfectly inelastic
DETERMINANTS OF ELASTICITY
CHAPTER 5 SLIDE 11
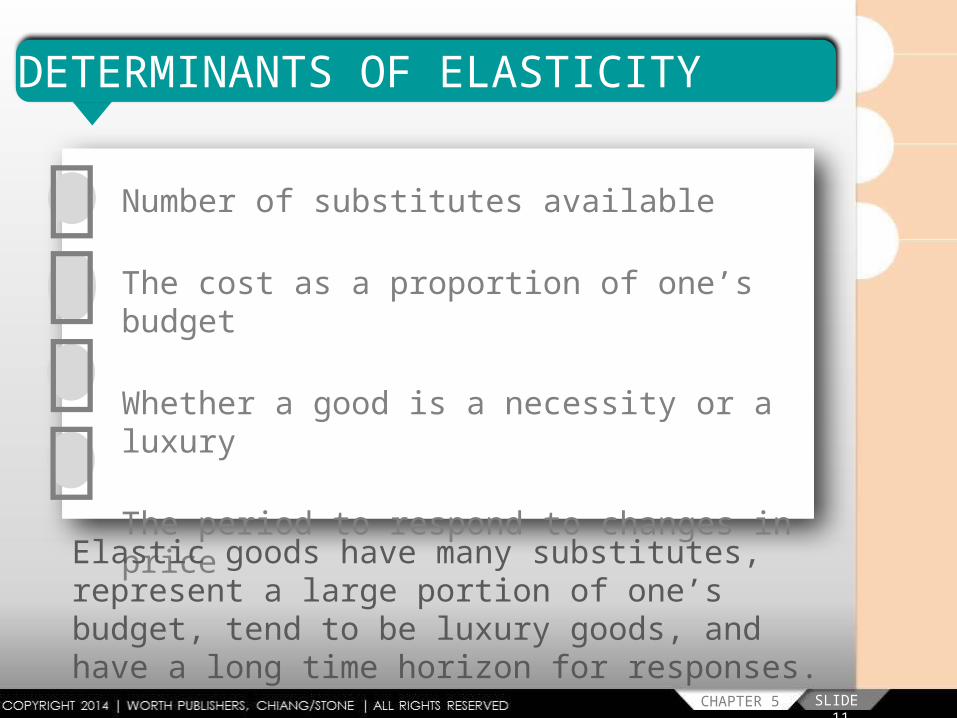
Number of substitutes available
The cost as a proportion of one’s budget
Whether a good is a necessity or a luxury
The period to respond to changes in price
Elastic goods have many substitutes, represent a large portion of one’s budget, tend to be luxury goods, and have a long time horizon for responses.
THE MIDPOINT METHOD ALLOWS PERCENTAGE CHANGES TO BE THE SAME REGARDLESS OF THE DIRECTION OF THE CHANGE.
CHAPTER 5 SLIDE 12
MAG
ICTO
RCH/
IKON
IMAG
ES/C
ORBI
S
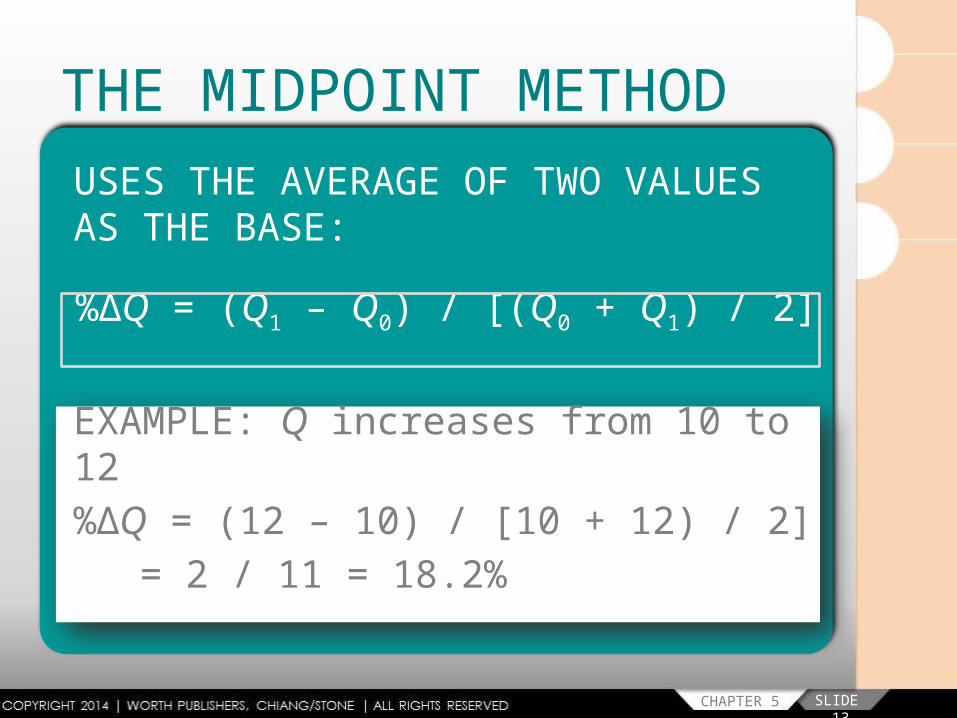
THE MIDPOINT METHODUSES THE AVERAGE OF TWO VALUES AS THE BASE:
%ΔQ = (Q1 – Q0) / [(Q0 + Q1) / 2]
EXAMPLE: Q increases from 10 to 12%ΔQ = (12 – 10) / [10 + 12) / 2]
= 2 / 11 = 18.2%
CHAPTER 5 SLIDE 13
ELASTICITY AND TOTAL REVENUE
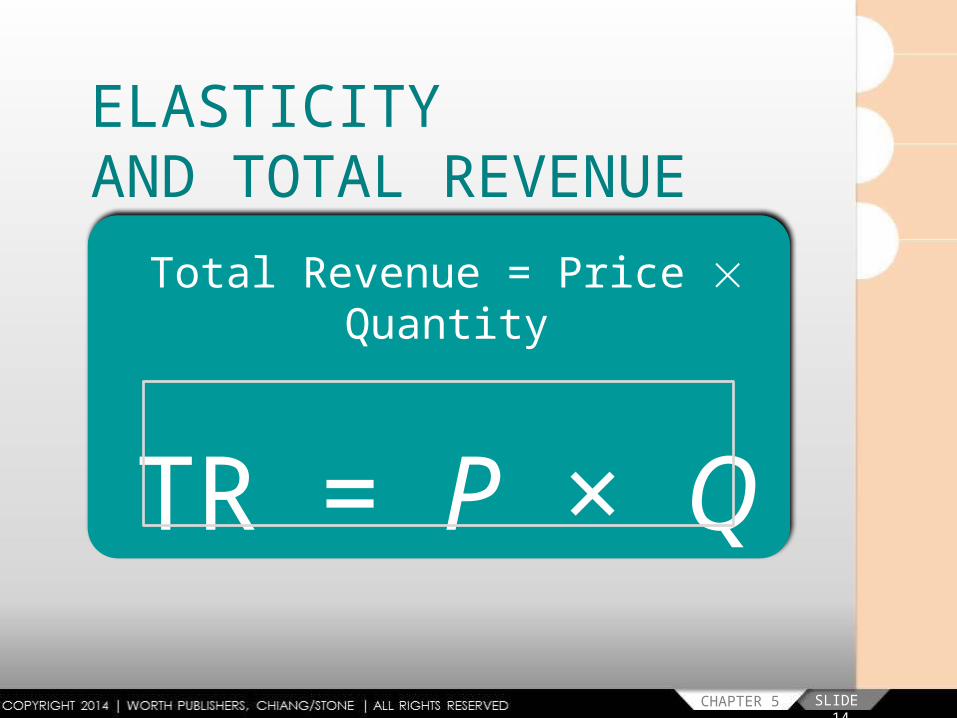
Total Revenue = Price Quantity
TR = P × Q
CHAPTER 5 SLIDE 14
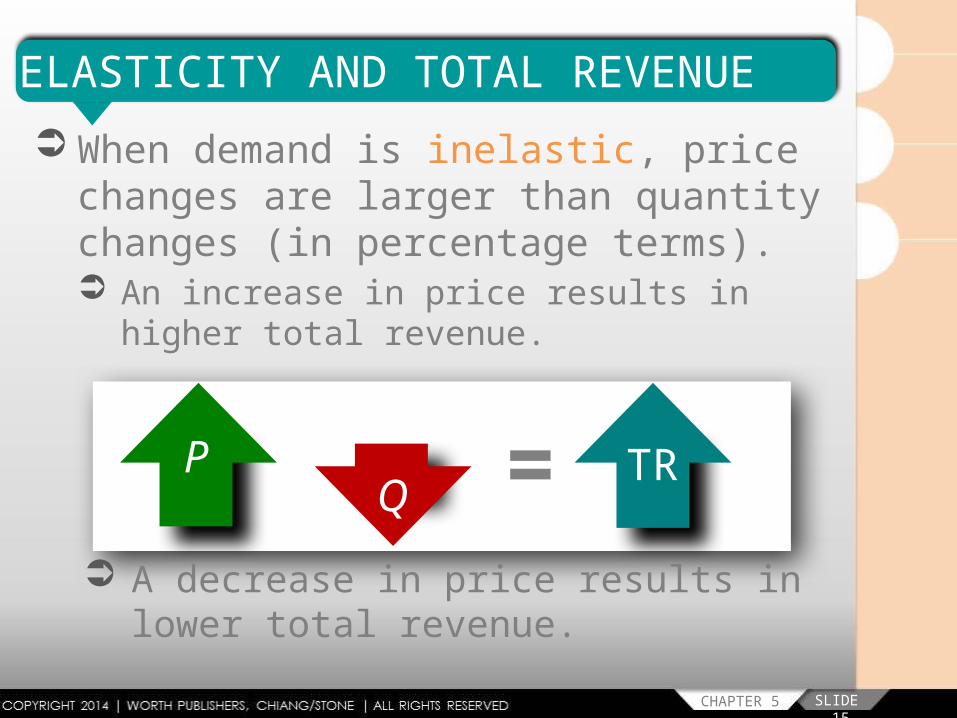
When demand is inelastic, price changes are larger than quantity changes (in percentage terms). An increase in price results in higher total
revenue.
ELASTICITY AND TOTAL REVENUE
CHAPTER 5 SLIDE 15
= A decrease in price results in lower total
revenue.
PQ TR
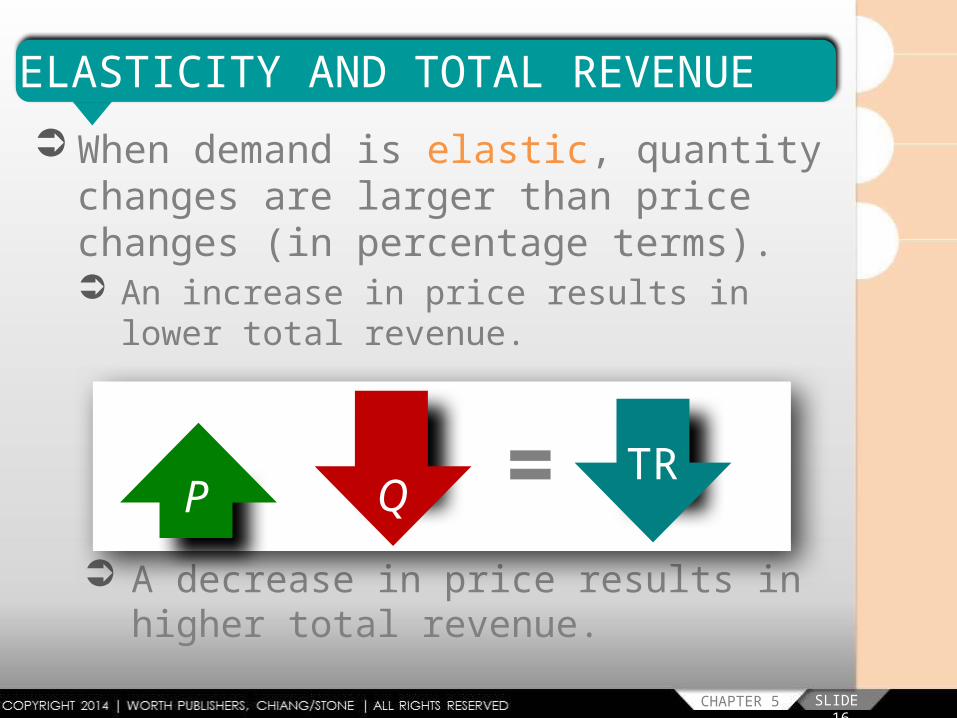
ELASTICITY AND TOTAL REVENUE When demand is elastic, quantity
changes are larger than price changes (in percentage terms). An increase in price results in lower total
revenue.
CHAPTER 5 SLIDE 16
A decrease in price results in higher total revenue.
=P QTR
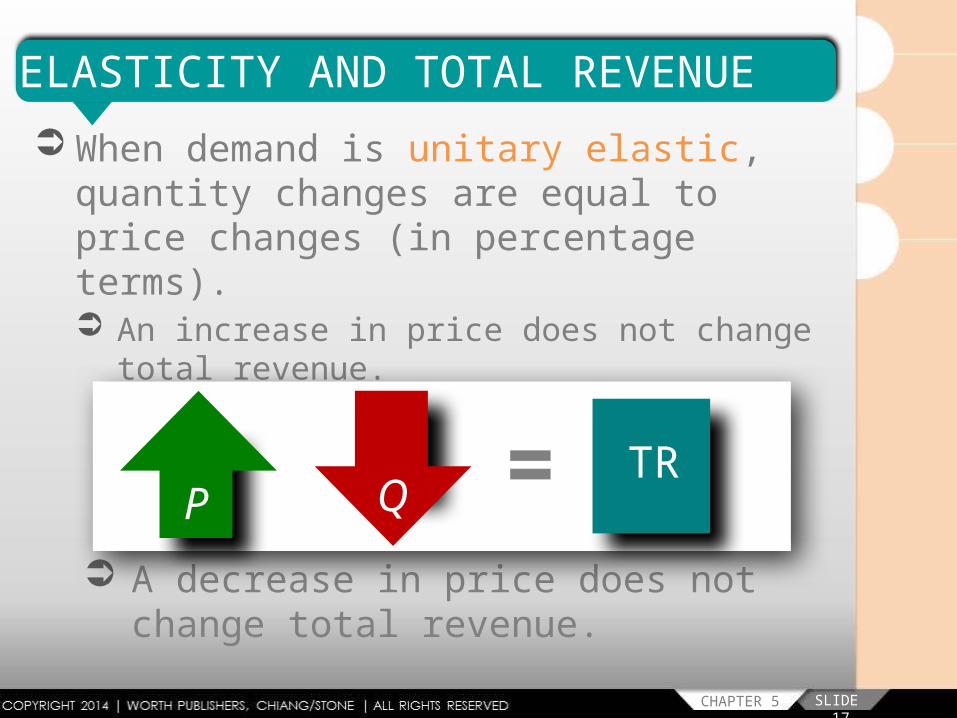
ELASTICITY AND TOTAL REVENUE When demand is unitary elastic,
quantity changes are equal to price changes (in percentage terms). An increase in price does not change total
revenue.
CHAPTER 5 SLIDE 17
A decrease in price does not change total revenue.
=P QTR
4
3
2
1
100
PRIC
E ($
)
QUANTITY
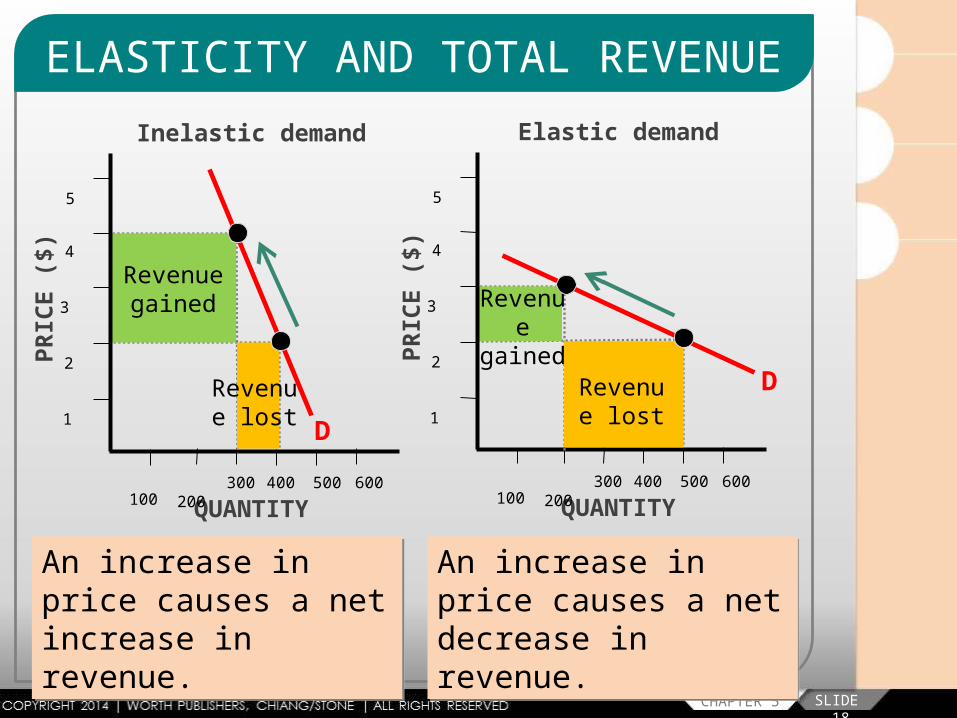
ELASTICITY AND TOTAL REVENUE
CHAPTER 5 SLIDE 18
5
An increase in price causes a net increase in revenue.
300 400 500 600 200
An increase in price causes a net decrease in revenue.
D
Revenue gained
Revenue lost
Inelastic demand
4
3
2
1
100
PRIC
E ($
)
QUANTITY
5
300 400 500 600 200
DRevenue lost
Elastic demand
Revenue gained
8
6
4
2
20
PRIC
E ($
)
QUANTITY
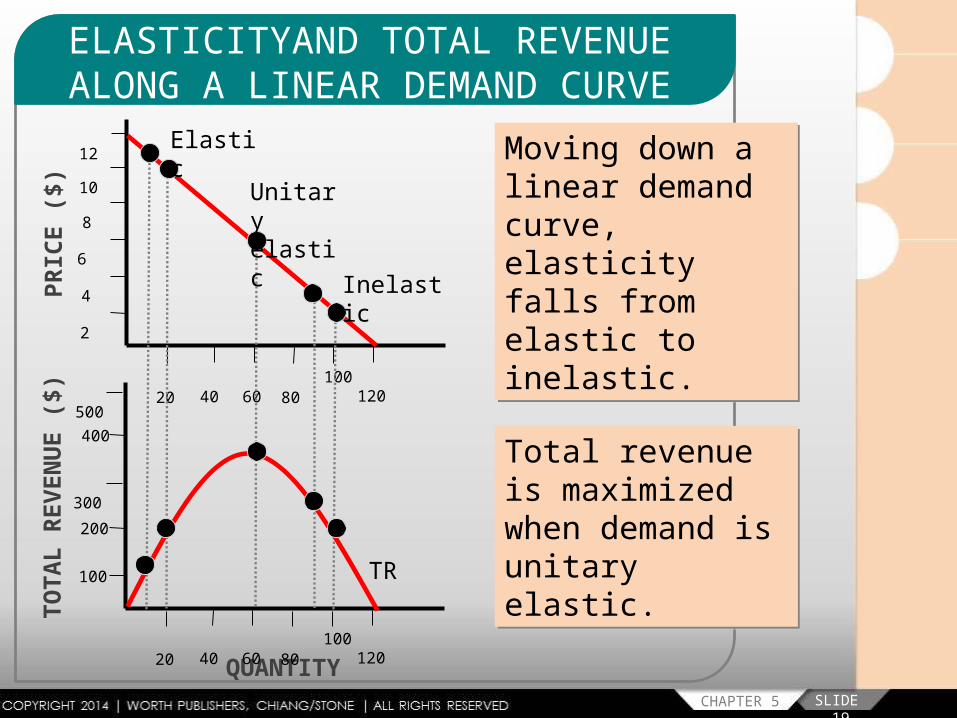
ELASTICITYAND TOTAL REVENUE ALONG A LINEAR DEMAND CURVE
Total revenue is maximized when demand is unitary elastic.
CHAPTER 5 SLIDE 19
10
12 Moving down a linear demand curve, elasticity falls from elastic to inelastic.
60 80 100 120 40
400
300
200
100
TOTA
L R
EVEN
UE
($)
500
Elastic
Unitary elastic
Inelastic
TR
20 60 80 100 120 40
CHAPTER 5 SLIDE 20
OTHER ELASTICITIES OF DEMAND
PRICE
INCOME
CROSS

CROSS ELASTICITY OF DEMANDRESPONSIVENESS OF DEMAND FOR ONE GOOD TO CHANGES IN THE PRICE OF ANOTHER GOOD
CHAPTER 5 SLIDE 21
UPPE
RCUT
IMAG
ES/A
LAM
Y
CHAPTER 5 SLIDE 22
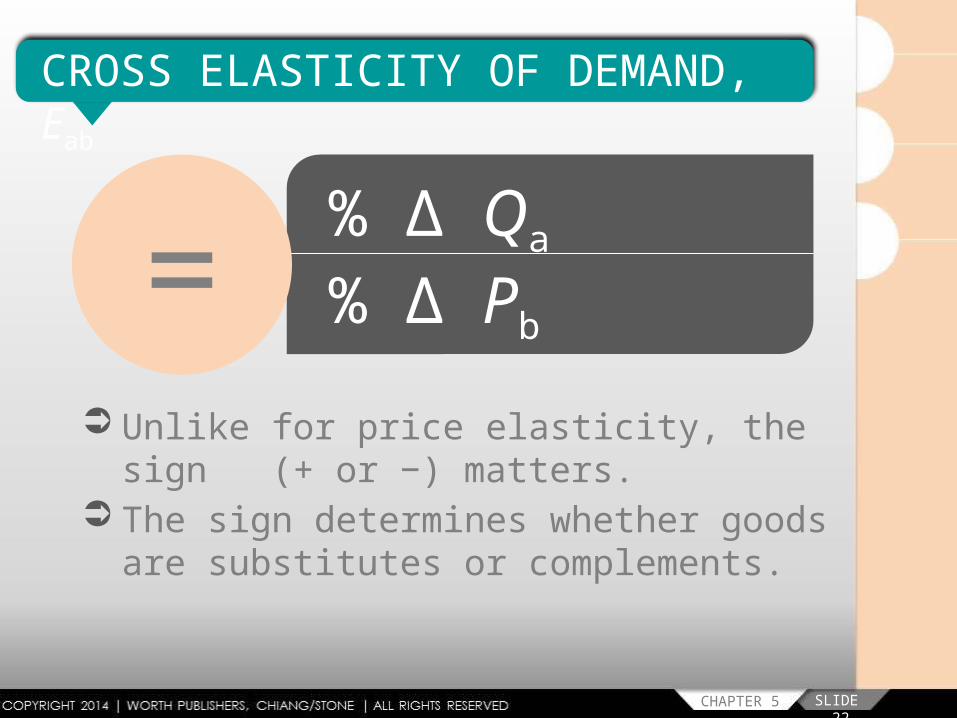
% Δ Qa% Δ Pb=
CROSS ELASTICITY OF DEMAND, Eab
Unlike for price elasticity, the sign (+ or −) matters.
The sign determines whether goods are substitutes or complements.
CHAPTER 5 SLIDE 23
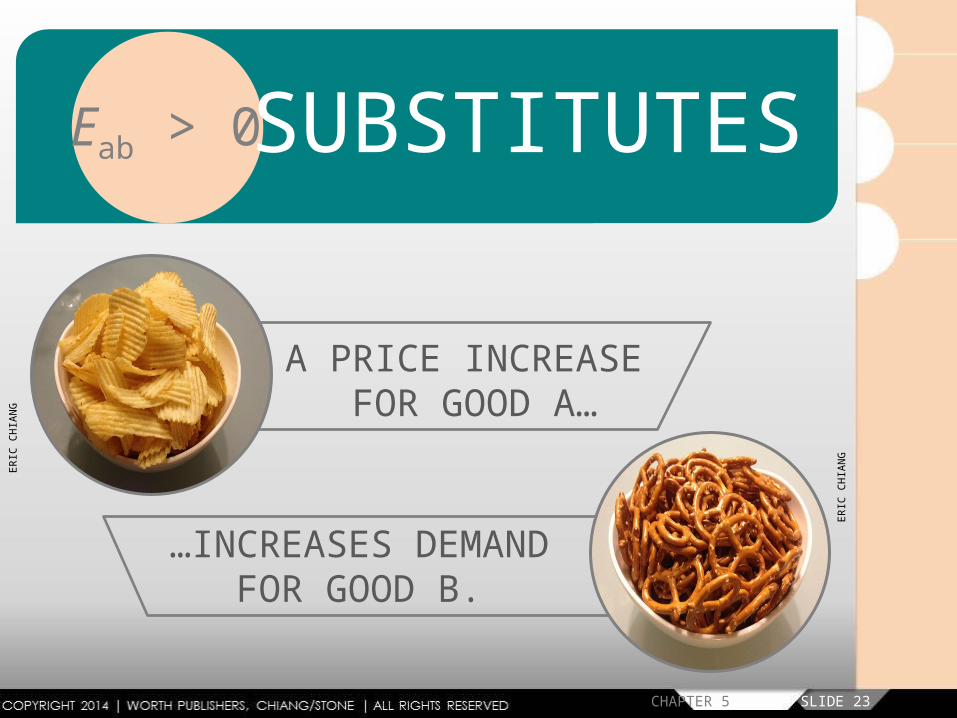
A PRICE INCREASE FOR GOOD A…
…INCREASES DEMANDFOR GOOD B.
Eab > 0SUBSTITUTES
ERIC
CHI
ANG
ERIC
CHI
ANG
CHAPTER 5 SLIDE 24
+
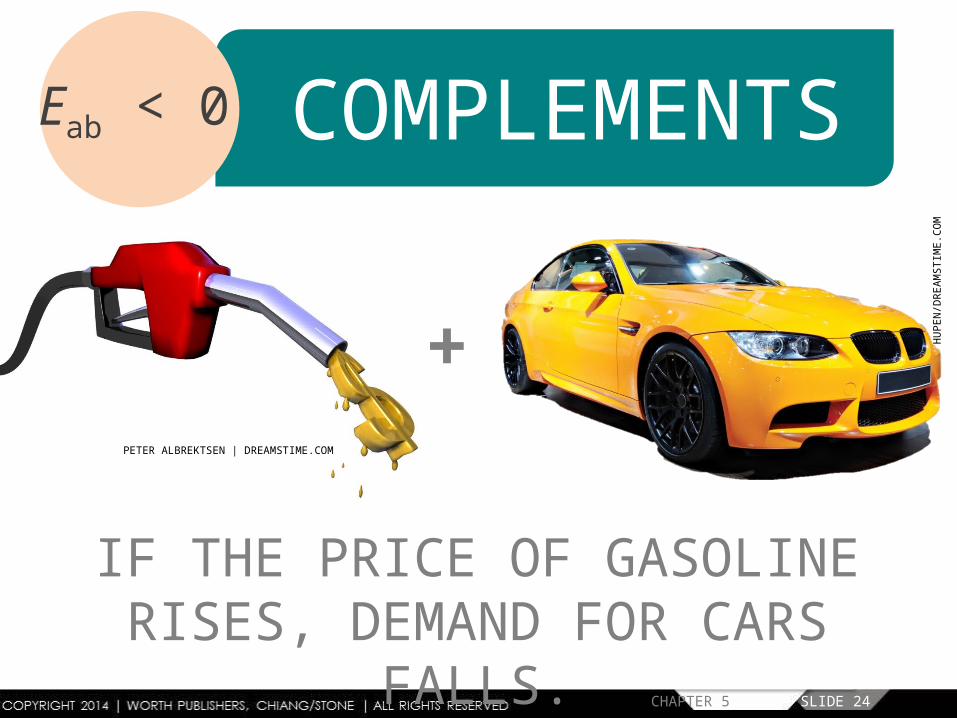
IF THE PRICE OF GASOLINE RISES, DEMAND FOR CARS
FALLS.
Eab < 0 COMPLEMENTS
PETER ALBREKTSEN | DREAMSTIME.COM
HUPE
N/DR
EAM
STIM
E.CO
M

INCOME ELASTICITY
CHAPTER 5 SLIDE 25
MEASURES CONSUMERS’ RESPONSIVENESS TO CHANGES IN INCOME
AXX-
STUD
IO/S
HUTT
ERST
OCK
CHAPTER 5 SLIDE 26
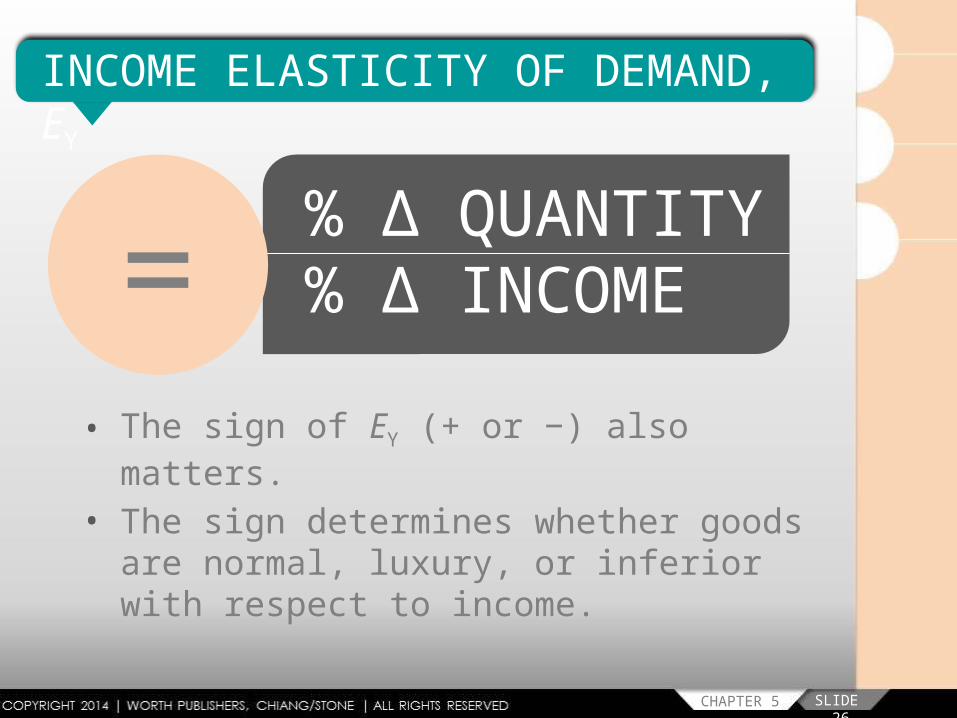
% Δ QUANTITY% Δ INCOME=
INCOME ELASTICITY OF DEMAND, EY
• The sign of EY (+ or −) also matters.• The sign determines whether goods
are normal, luxury, or inferior with respect to income.

CHAPTER 5 SLIDE 27
AS INCOME RISES, CONSUMERS BUY MORE NORMAL GOODS.
AS INCOME FALLS, CONSUMERS BUY FEWER NORMAL GOODS.
0 < EY < 1
NORMAL GOODS
ERIC
CHI
ANG

CHAPTER 5 SLIDE 28
EY > 1
LUXURY GOODS
AS INCOME RISES, PURCHASES OF LUXURY GOODS RISE BY MORE THAN THE CHANGE IN INCOME.
DANI
EL G
ILBE
Y/DR
EAM
STIM
E.CO
M
CHAPTER 5 SLIDE 29
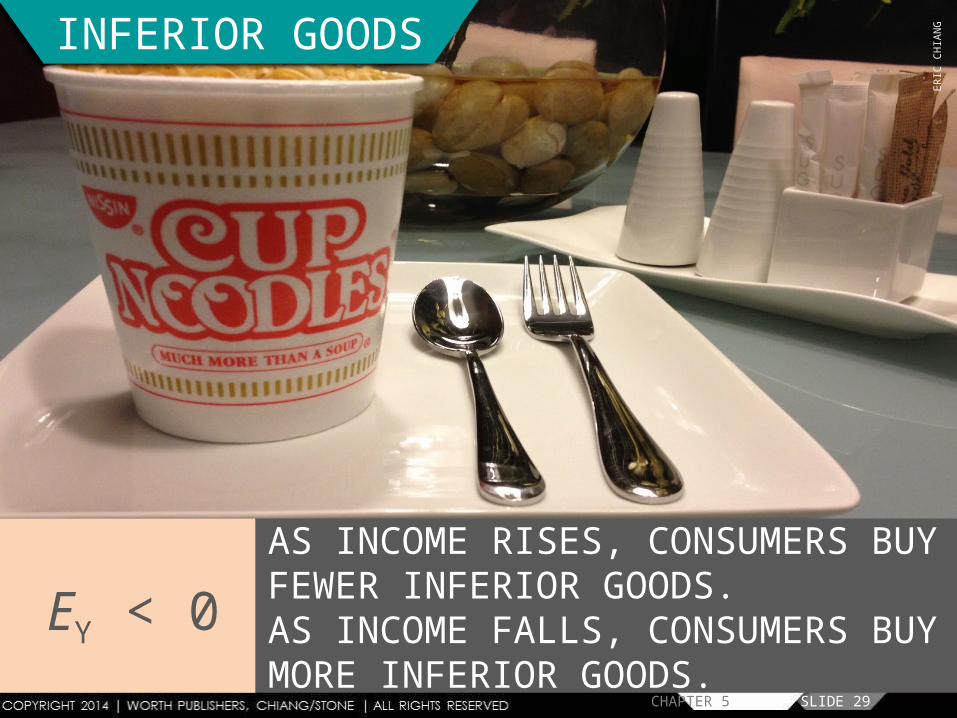
EY < 0
INFERIOR GOODS
AS INCOME RISES, CONSUMERS BUY FEWER INFERIOR GOODS.AS INCOME FALLS, CONSUMERS BUY MORE INFERIOR GOODS.
ERIC
CHI
ANG

ELASTICITY OF SUPPLY MEASURES RESPONSIVENESS OF SUPPLIERS TO CHANGES IN PRICE.
CHAPTER 5 SLIDE 30
ERIC
CHI
ANG
CHAPTER 5 SLIDE 31
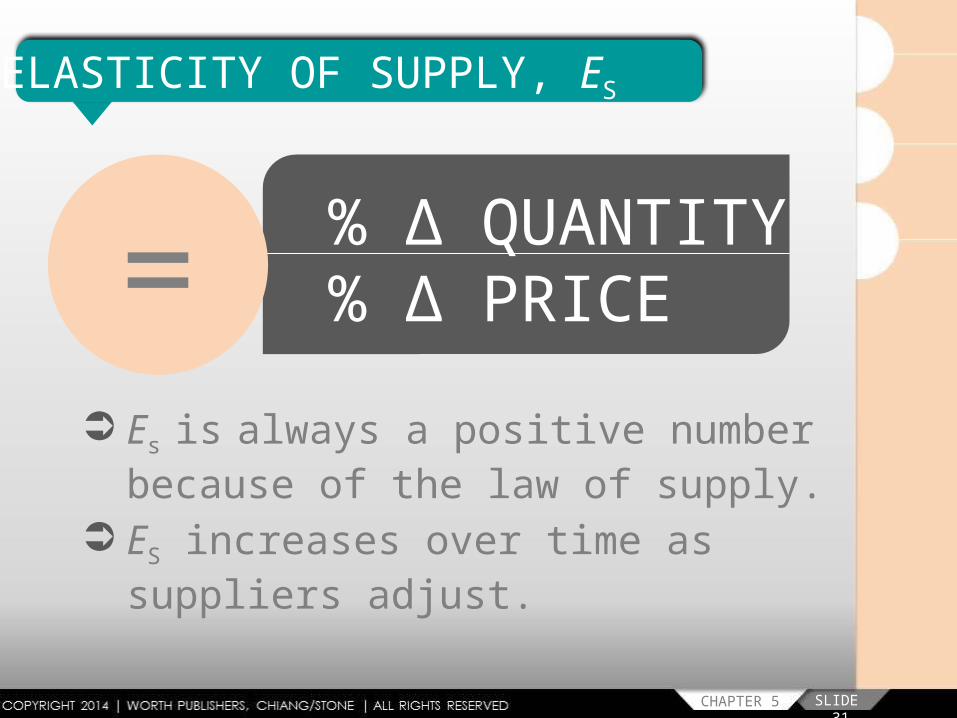
% Δ QUANTITY% Δ PRICE=
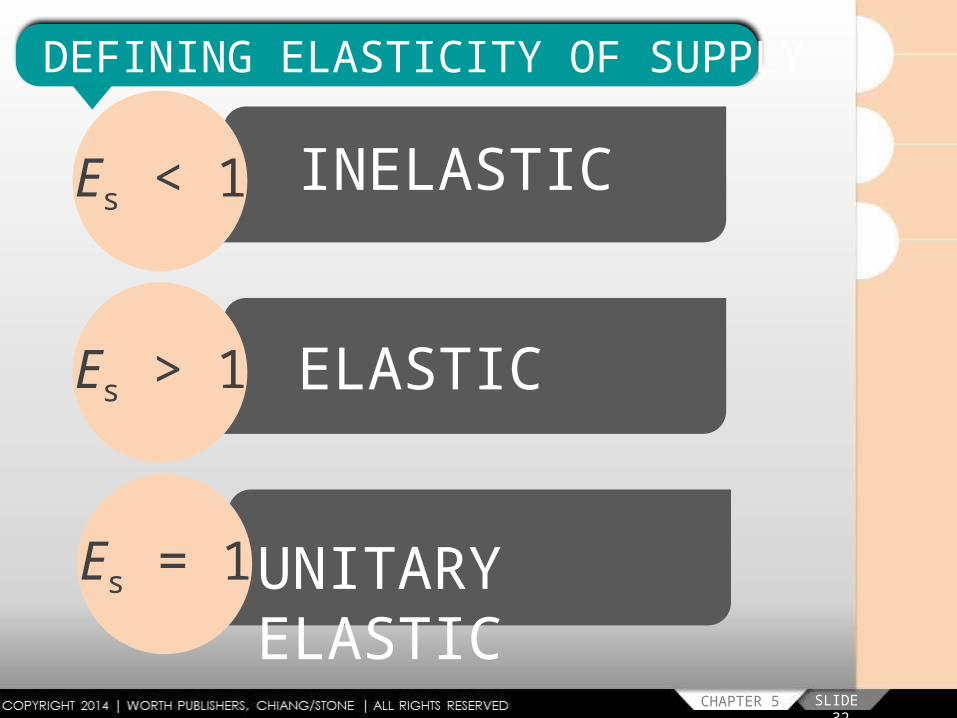
ELASTICITY OF SUPPLY, ES
Es is always a positive number because of the law of supply.
ES increases over time as suppliers adjust.
CHAPTER 5 SLIDE 32
Es < 1 INELASTIC
Es > 1 ELASTIC
Es = 1 UNITARY ELASTIC
DEFINING ELASTICITY OF SUPPLY
ELASTICITY OF SUPPLY RISES OVER TIME AS BUSINESSES ADJUST PRODUCTION. CHAPTER 5 SLIDE 33
KRIS
TRI
PPLA
AR/T
RIPL
AAR
KRIS
TOFF
ER/S
IPA/N
EWSC
OM
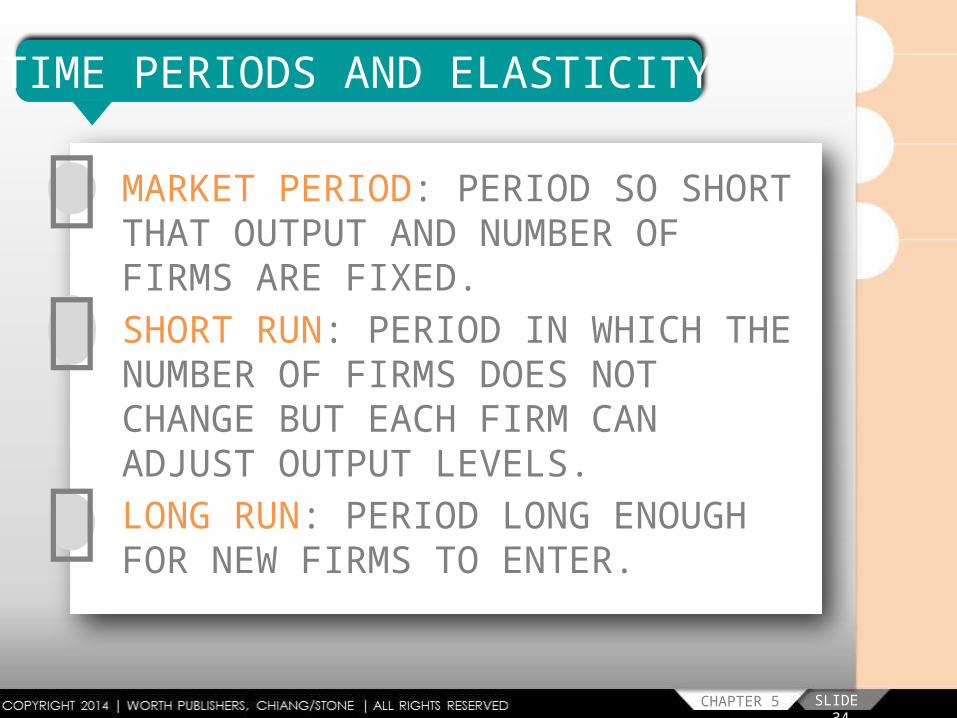
TIME PERIODS AND ELASTICITY
MARKET PERIOD: PERIOD SO SHORT THAT OUTPUT AND NUMBER OF FIRMS ARE FIXED.SHORT RUN: PERIOD IN WHICH THE NUMBER OF FIRMS DOES NOT CHANGE BUT EACH FIRM CAN ADJUST OUTPUT LEVELS.LONG RUN: PERIOD LONG ENOUGH FOR NEW FIRMS TO ENTER.
CHAPTER 5 SLIDE 34
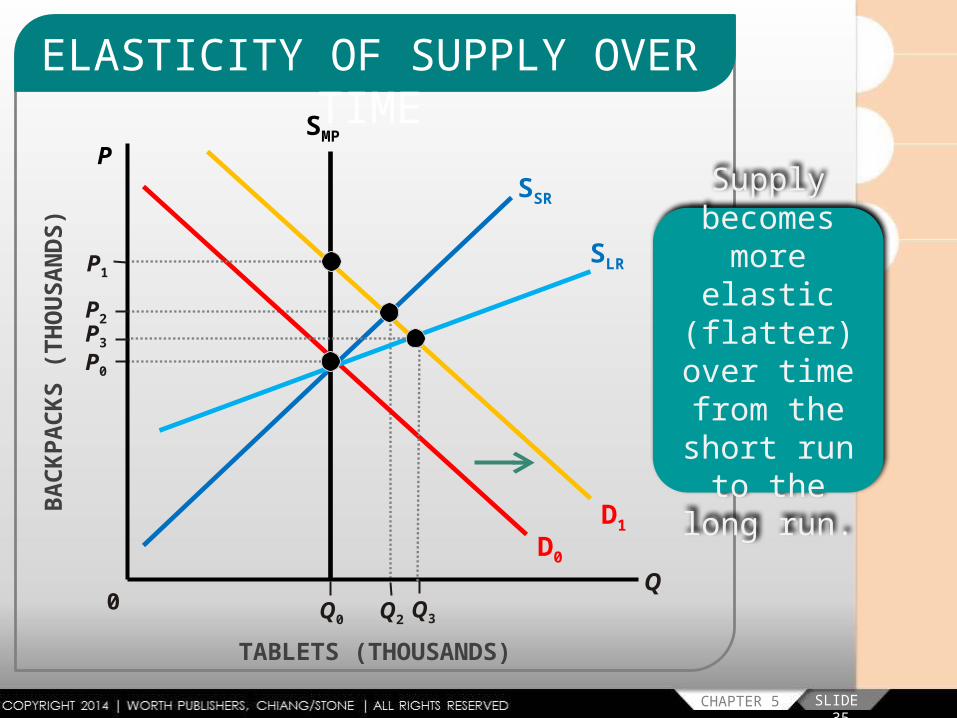
ELASTICITY OF SUPPLY OVER TIME
P0
0 Q0
Q
PSSR
D0
Supply becomes
more elastic (flatter) over time from the short run to the long run.
CHAPTER 5 SLIDE 35
BA
CK
PAC
KS
(TH
OU
SAN
DS)
TABLETS (THOUSANDS)
SLR
SMP
D1
Q2
Q3
P3 P2 P1
CHAPTER 5 SLIDE 36
DESCRIBES WHO BEARS THE ECONOMIC BURDEN OF A TAX AND IS INFLUENCED BY ELASTICITY
INCIDENCE OF A TAX JA
MES
NAZ
Z/CO
RBIS
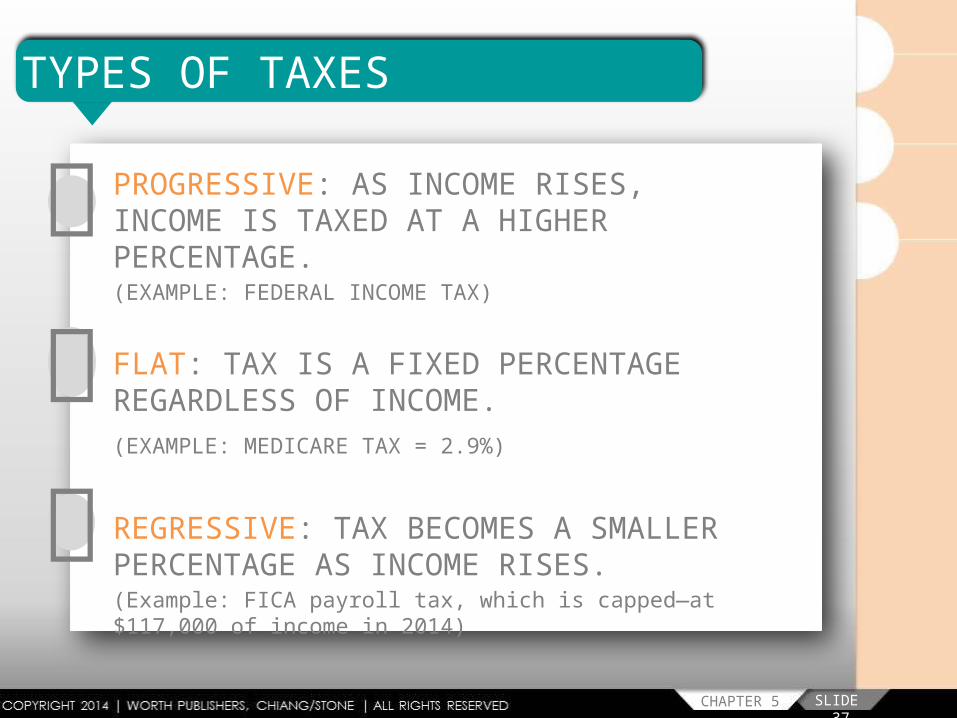
TYPES OF TAXES
PROGRESSIVE: AS INCOME RISES, INCOME IS TAXED AT A HIGHER PERCENTAGE.(EXAMPLE: FEDERAL INCOME TAX)
FLAT: TAX IS A FIXED PERCENTAGE REGARDLESS OF INCOME.(EXAMPLE: MEDICARE TAX = 2.9%)
REGRESSIVE: TAX BECOMES A SMALLER PERCENTAGE AS INCOME RISES. (Example: FICA payroll tax, which is capped—at $117,000 of income in 2014)
CHAPTER 5 SLIDE 37
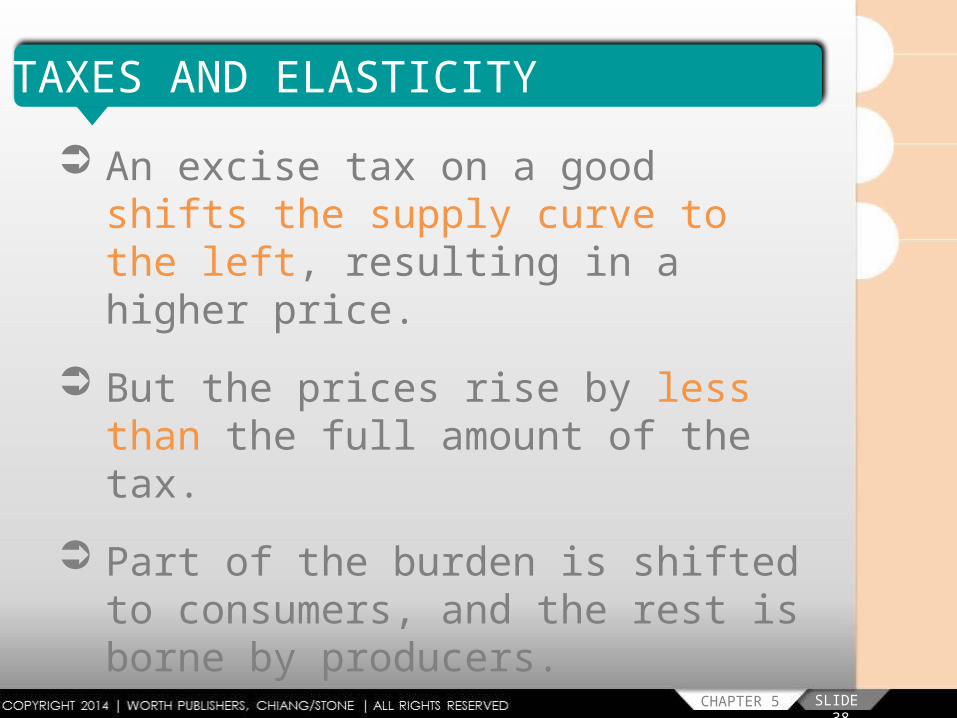
TAXES AND ELASTICITY An excise tax on a good shifts the
supply curve to the left, resulting in a higher price.
But the prices rise by less than the full amount of the tax.
Part of the burden is shifted to consumers, and the rest is borne by producers.
CHAPTER 5 SLIDE 38
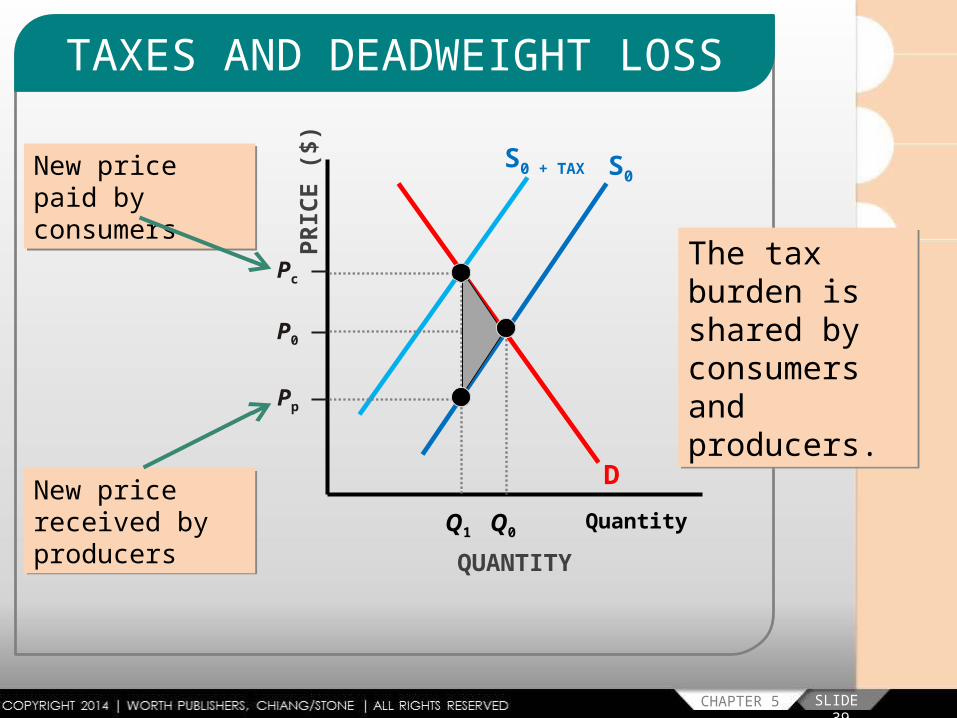
TAXES AND DEADWEIGHT LOSS
CHAPTER 5 SLIDE 39
QuantityQ1 Q0
S0 + TAX S0
D
The tax burden is shared by consumers and producers.
New price paid by consumers
New price received by producers
PRIC
E ($
)
QUANTITY
P0
Pc
Pp
DEADWEIGHT LOSSTHE LOSS IN CONSUMER AND PRODUCER SURPLUS BECAUSE SOME TRANSACTIONS CANNOT
BE MADE AND THEREFORE THEIR VALUE TO SOCIETY IS
LOST.
CHAPTER 5 SLIDE 40
ELASTICITY AND DEADWEIGHT LOSS
CHAPTER 5 SLIDE 41
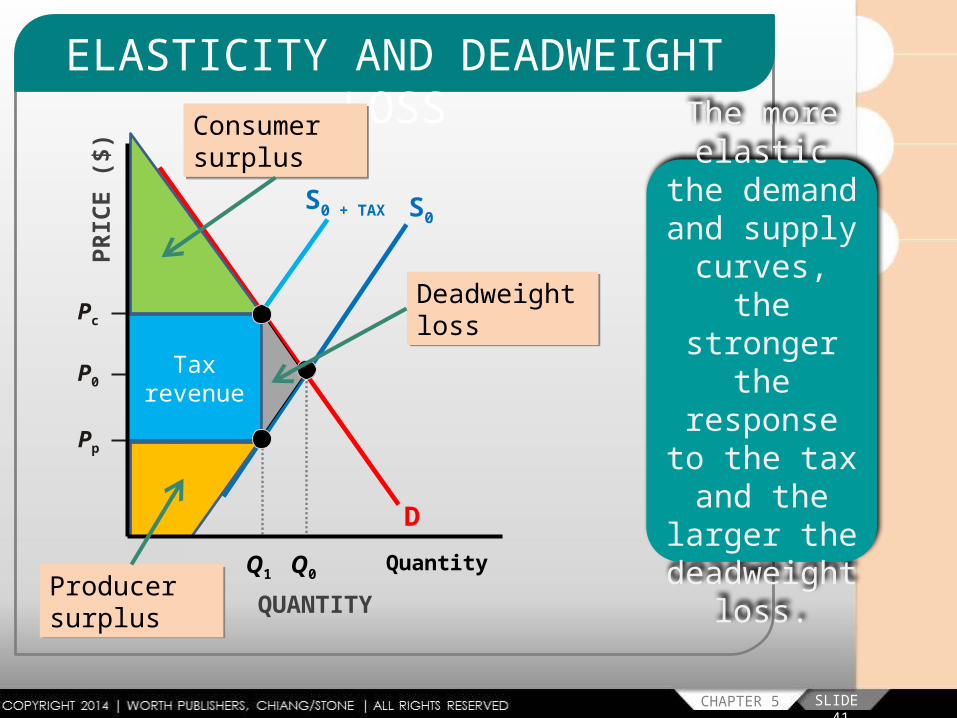
QuantityQ1 Q0
S0 + TAX S0
D
Deadweight loss
PRIC
E ($
)
QUANTITY
P0
Pc
Pp
Tax revenue
The more elastic the
demand and supply curves, the stronger the response to the tax and the larger the deadweight
loss.
Consumer surplus
Producer surplus
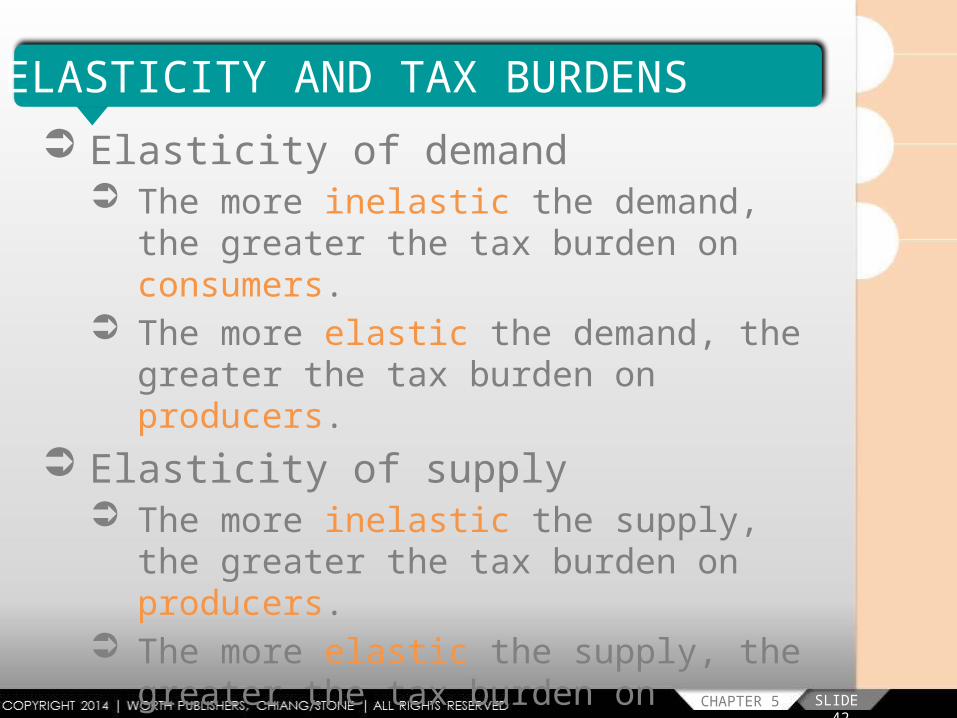
ELASTICITY AND TAX BURDENS Elasticity of demand
The more inelastic the demand, the greater the tax burden on consumers.
The more elastic the demand, the greater the tax burden on producers.
Elasticity of supply The more inelastic the supply, the greater
the tax burden on producers. The more elastic the supply, the greater the
tax burden on consumers.
CHAPTER 5 SLIDE 42
KEY CONCEPTS
CHAPTER 5 SLIDE 43
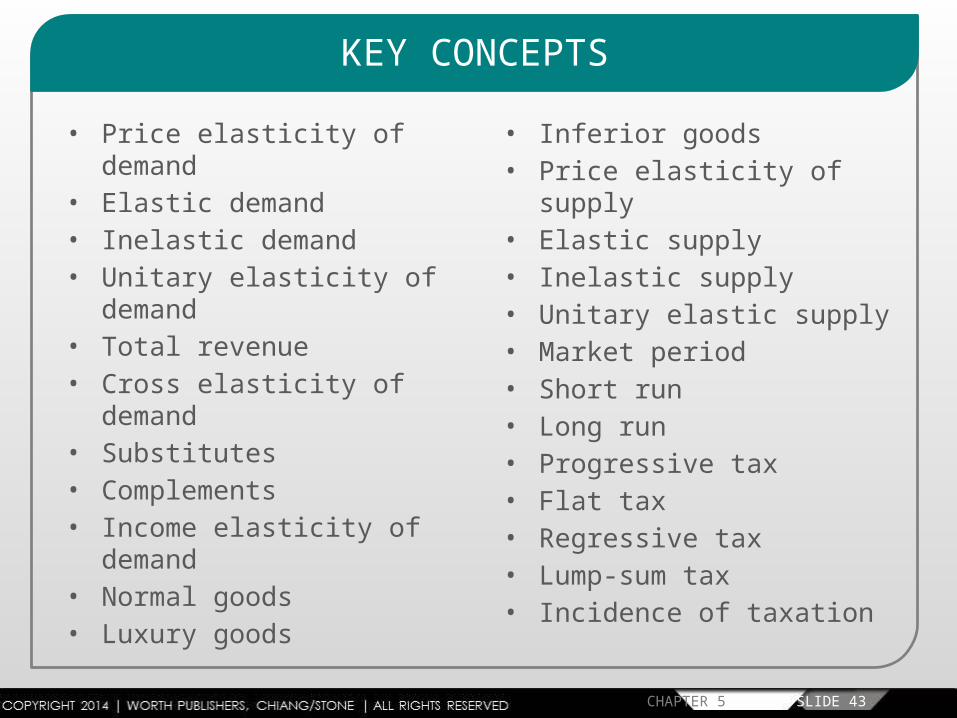
• Price elasticity of demand• Elastic demand• Inelastic demand• Unitary elasticity of demand• Total revenue• Cross elasticity of demand• Substitutes• Complements• Income elasticity of demand• Normal goods• Luxury goods• Inferior goods• Price elasticity of supply• Elastic supply
• Inelastic supply• Unitary elastic supply• Market period• Short run• Long run• Progressive tax• Flat tax• Regressive tax• Lump-sum tax• Incidence of taxation
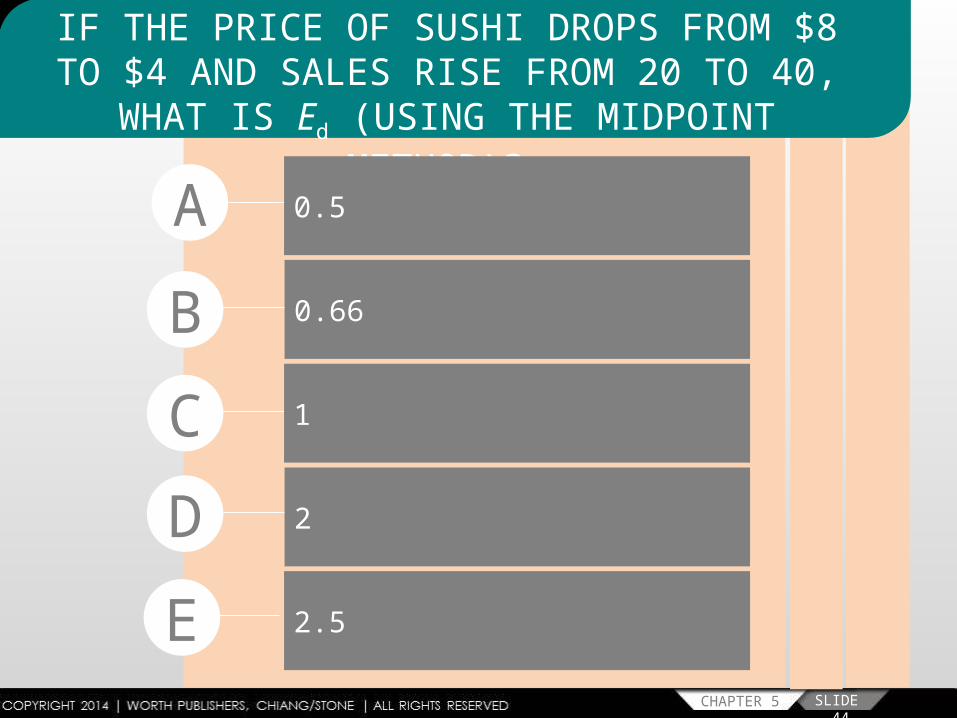
IF THE PRICE OF SUSHI DROPS FROM $8 TO $4 AND SALES RISE FROM 20 TO 40, WHAT
IS Ed (USING THE MIDPOINT METHOD)?
BC
A 0.5
0.66
1
DE
2
2.5
CHAPTER 5 SLIDE 44
CHAPTER 5 SLIDE 45
10% PRICE
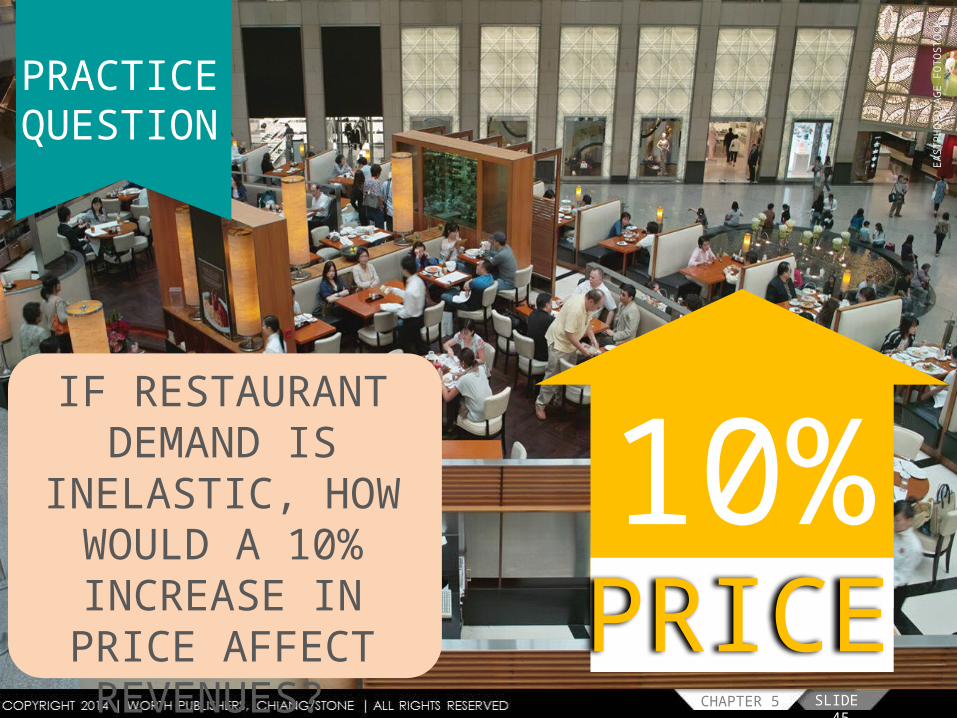
PRACTICE QUESTION
IF RESTAURANT DEMAND IS
INELASTIC, HOW WOULD A 10% INCREASE IN
PRICE AFFECT REVENUES?
EAST
PHOT
O/AG
E FO
TOST
OCK

IF YOUR SALARY INCREASES BY 30% AND IN RESPONSE YOU INCREASE YOUR CLOTHING PURCHASES BY 20%, INCOME ELASTICITY EQUALS ___ AND CLOTHING IS ___.
BC
A 0.67; A NORMAL GOOD
0.67; AN INFERIOR GOOD
1.5; A NORMAL GOOD
D 1.5; A LUXURY GOOD
CHAPTER 5 SLIDE 46

WHY DO OFFICE SUPPLY STORES OFFER DISCOUNTS ON INELASTIC
GOODS SUCH AS PEN AND PAPER AT THE START OF EACH SCHOOL TERM?
PRACTICE QUESTION
CHAPTER 5 SLIDE 47
BARB
ARA
HELG
ASON
/DRE
AMST
IME.
COM
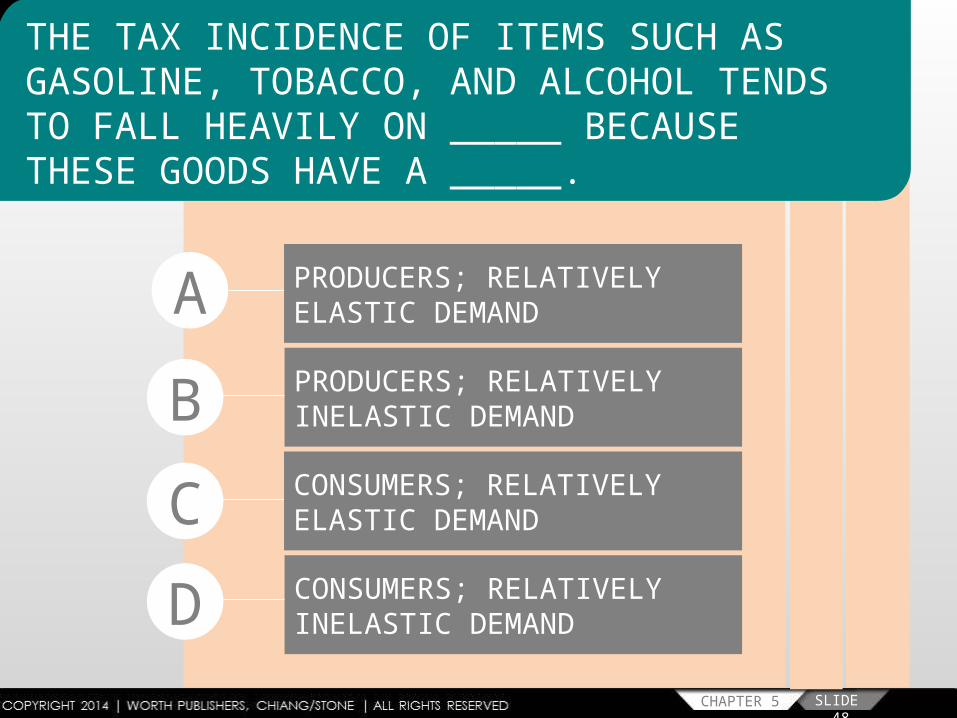
THE TAX INCIDENCE OF ITEMS SUCH AS GASOLINE, TOBACCO, AND ALCOHOL TENDS TO FALL HEAVILY ON _____ BECAUSE THESE GOODS HAVE A _____.
BC
A PRODUCERS; RELATIVELY ELASTIC DEMAND
PRODUCERS; RELATIVELY INELASTIC DEMAND
CONSUMERS; RELATIVELY ELASTIC DEMAND
D CONSUMERS; RELATIVELY INELASTIC DEMAND
CHAPTER 5 SLIDE 48

CHAPTER 5 SLIDE 49
THE END OFSLIDES CREATED BY ERIC CHIANG 5CHAPTER