Embed Size (px)
Citation preview
$
Case Study Farm for Today’s Workshop
Bob BattelExtension Agriculture Agent
Calhoun and Branch Counties
$
Case Study “Game”Case Study “Game”
• Case farm
• How the game works
• Today, we’ll pretend its my farm and you are running it for me
$
Case Farm Plan Case Farm Plan
• Resource base:– 2,000 Acres (900 owned, 1100 cash rented)
– 6,000 Hours (including $25,000 hired)
– 60,000 bu of “flexible” on farm storage
• “Expected” acreage and yield:– 1,000 acres 128.5 bu Corn
– 1,000 acres 43.0 bu Soybeans
$
Decision times:Decision times:• Pre-plant
• Late spring / early summer
• Harvest
• Post Harvest– All grain is priced, there is no decision

$
What Information Do You Have What Information Do You Have To Start The Planning To Start The Planning
Process?Process?
$
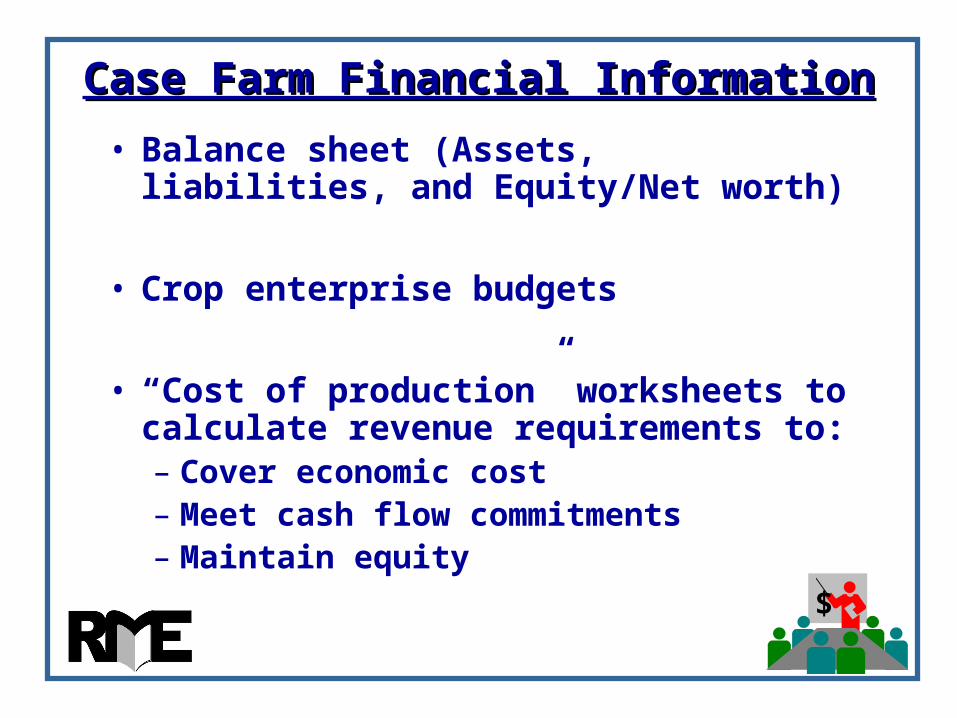
Case Farm Financial InformationCase Farm Financial Information
• Balance sheet (Assets, liabilities, and Equity/Net worth)
• Crop enterprise budgets
• “Cost of production” worksheets to calculate revenue requirements to:– Cover economic cost– Meet cash flow commitments– Maintain equity
$
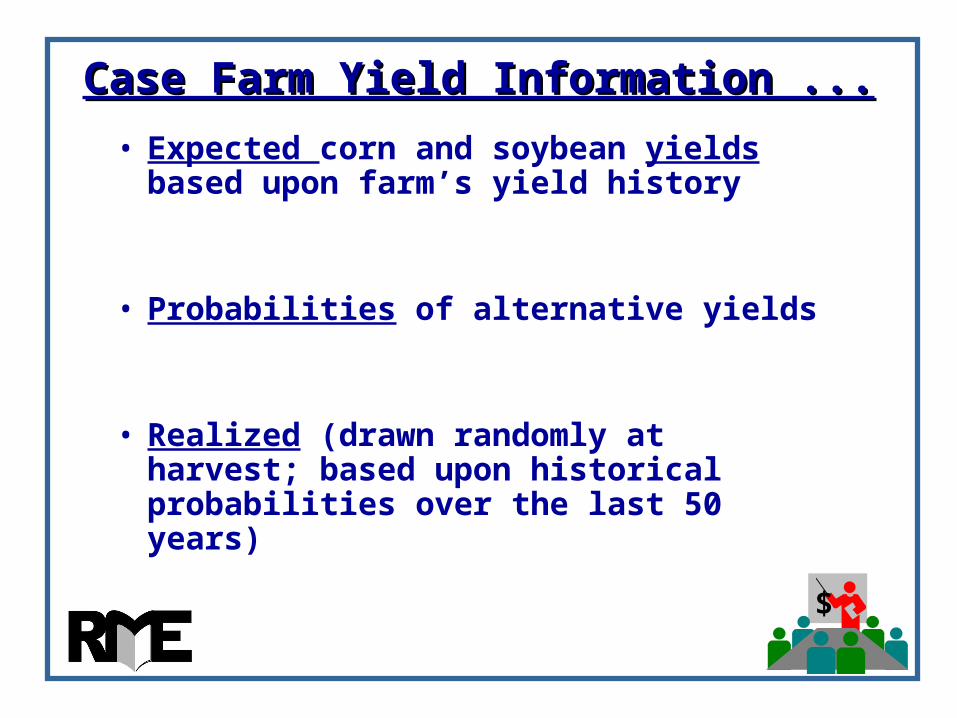
Case Farm Yield Information ...Case Farm Yield Information ...
• Expected corn and soybean yields based upon farm’s yield history
• Probabilities of alternative yields
• Realized (drawn randomly at harvest; based upon historical probabilities over the last 50 years)
$
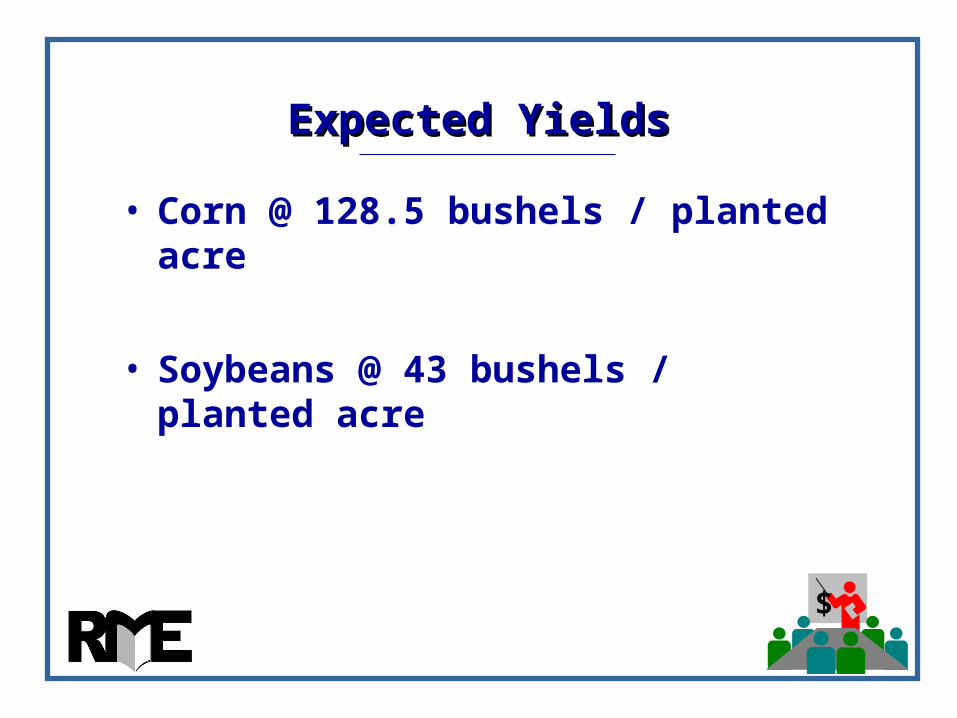
Expected YieldsExpected Yields
• Corn @ 128.5 bushels / planted acre
• Soybeans @ 43 bushels / planted acre
$
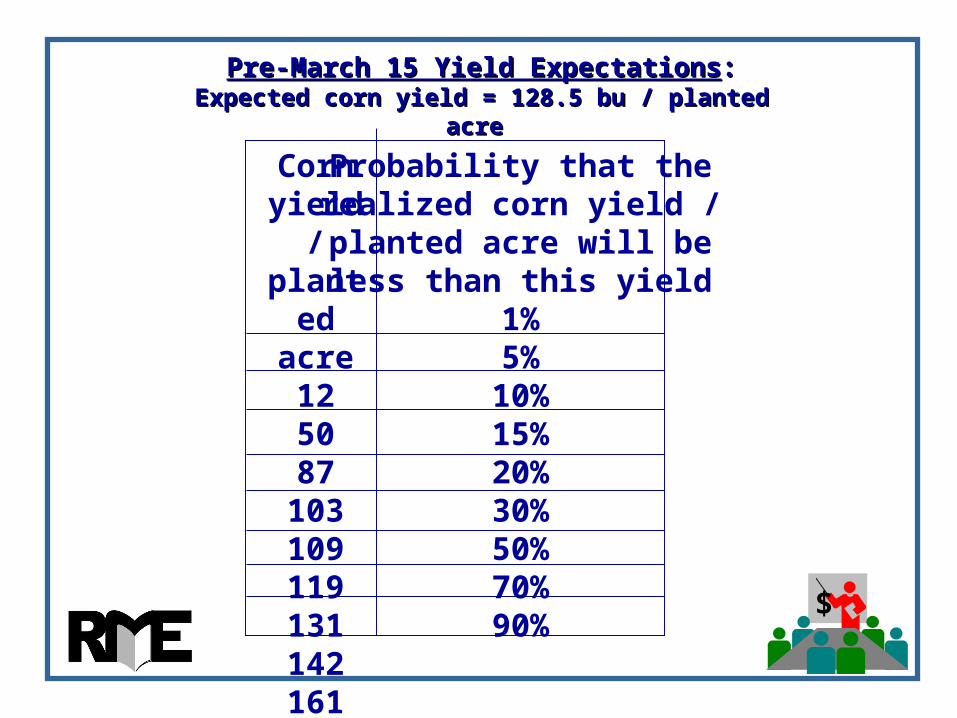
Pre-March 15 Yield ExpectationsPre-March 15 Yield Expectations:: Expected corn yield = 128.5 bu / planted acre Expected corn yield = 128.5 bu / planted acre
Cornyield/
plantedacre125087103109119131142161
Probability that therealized corn yield /planted acre will beless than this yield
1%5%
10%15%20%30%50%70%90%
$
Case Farm Price Information ...Case Farm Price Information ...
• Harvest contract corn and soybean prices prior to planting (based upon futures market)

$
Pre-March 15 pricesPre-March 15 prices::Dec CBOT Dec CBOT corncorn @ $2.50/bu @ $2.50/buHarvest basis @ $0.40/buHarvest basis @ $0.40/bu
=Cash forward contract @ $2.10/bu=Cash forward contract @ $2.10/bu
Price
$1.85$2.04$2.19$2.32$2.45$2.59$2.75$2.95$3.24
Probability that therealized CBOT
corn futures price atmaturity will be
less than this price10%20%30%40%50%60%70%80%90%
$
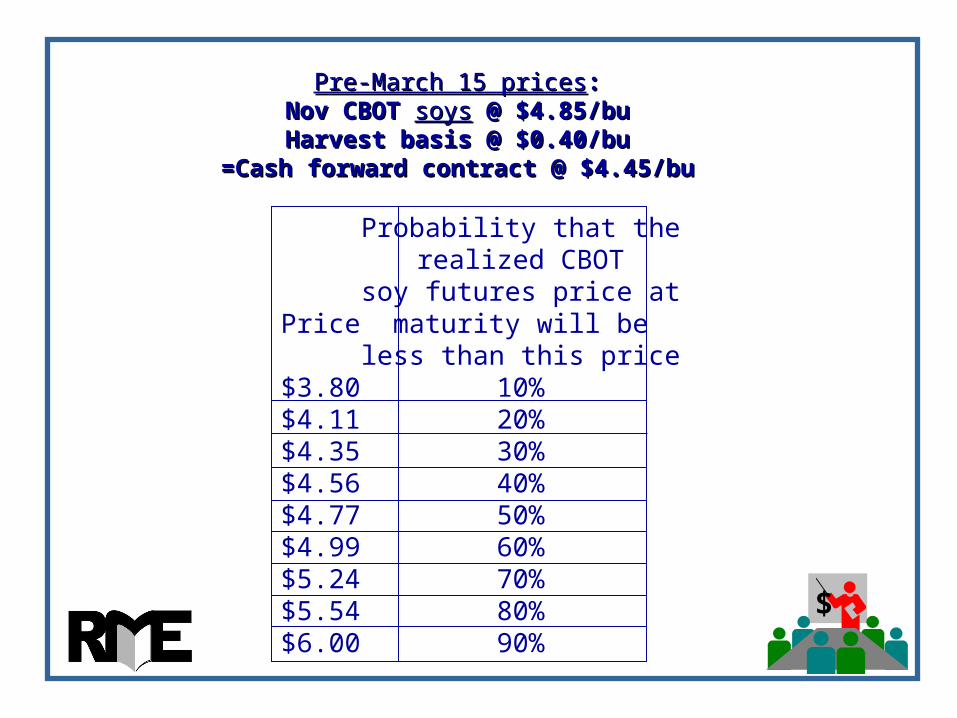
Pre-March 15 pricesPre-March 15 prices::Nov CBOT Nov CBOT soyssoys @ $4.85/bu @ $4.85/buHarvest basis @ $0.40/buHarvest basis @ $0.40/bu
=Cash forward contract @ $4.45/bu=Cash forward contract @ $4.45/bu
Price
$3.80$4.11$4.35$4.56$4.77$4.99$5.24$5.54$6.00
Probability that therealized CBOT
soy futures price atmaturity will be
less than this price10%20%30%40%50%60%70%80%90%
$
Case Farm Price Information ...Case Farm Price Information ...
• Harvest delivery contract price offers after planting & before harvest (drawn randomly)
• Realized harvest price (drawn randomly)
$
Case Farm Price Information ...Case Farm Price Information ...
• Feb delivery contract price offers @ harvest (drawn randomly … given harvest price)
• Realized Feb price (drawn randomly)
$
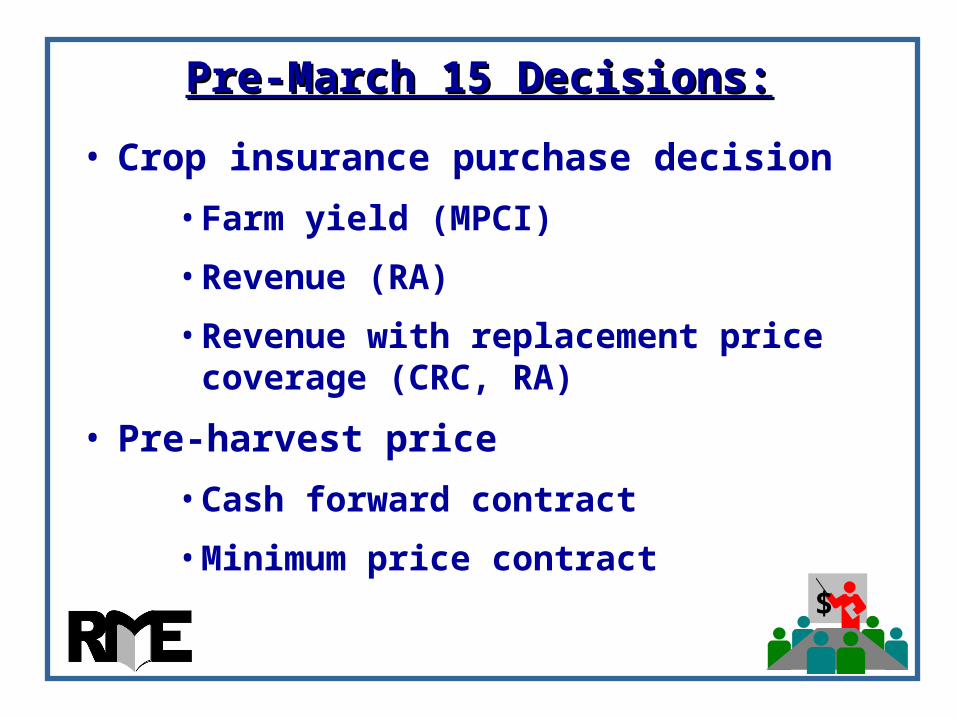
Pre-March 15 Decisions:Pre-March 15 Decisions:
• Crop insurance purchase decision
• Farm yield (MPCI)
• Revenue (RA)
• Revenue with replacement price coverage (CRC, RA)
• Pre-harvest price
• Cash forward contract
• Minimum price contract
$
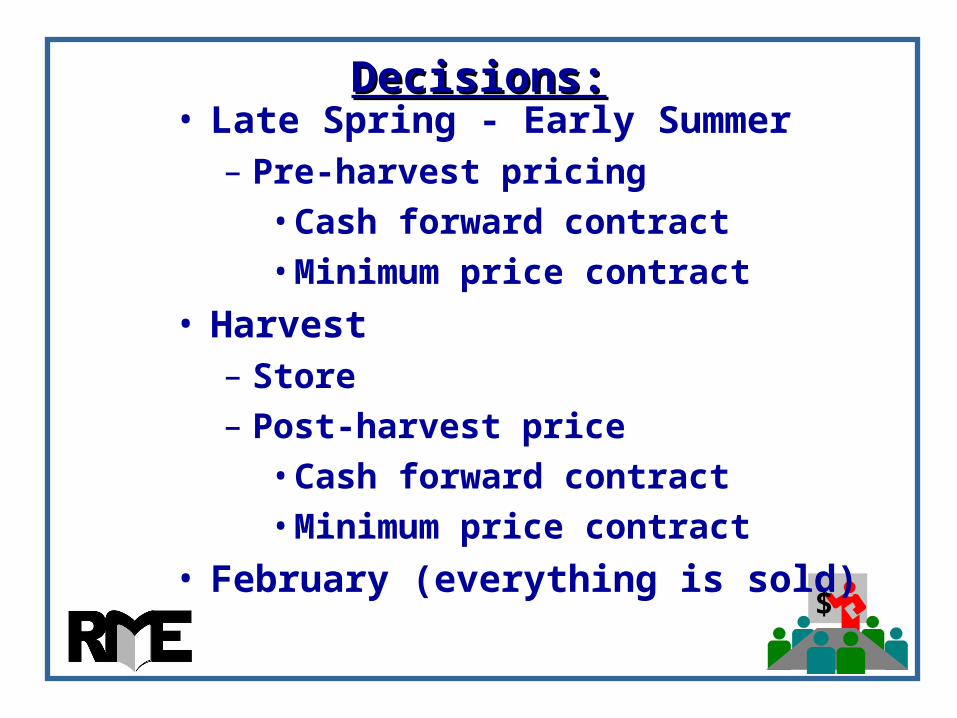
Decisions:Decisions:• Late Spring - Early Summer
– Pre-harvest pricing
• Cash forward contract
• Minimum price contract
• Harvest– Store
– Post-harvest price
• Cash forward contract
• Minimum price contract
• February (everything is sold)
$
Other Key Features of GameOther Key Features of Game
• Each team gets the same contract offer prices for corn and soybeans, for harvest delivery, for the pre-March 15 period.
$
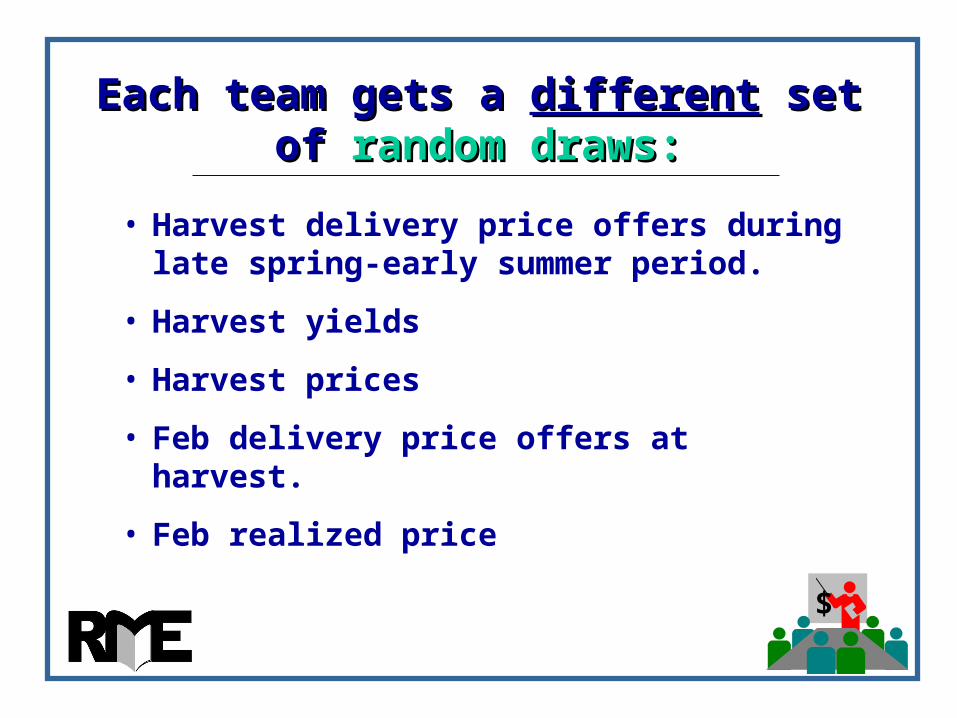
Each team gets a Each team gets a differentdifferent set of set of random draws:random draws:
• Harvest delivery price offers during late spring-early summer period.
• Harvest yields
• Harvest prices
• Feb delivery price offers at harvest.
• Feb realized price

$
Where do prices and yields come from?Where do prices and yields come from?• Yields are based on individual farm
historical yields over the last 50 years (adjusted to current technology)
• Prices are based on option market information and last 25 years of history of price changes between:– planting and harvest
– harvest and post-harvest

$
Chances of alternative corn yields: a review Chances of alternative corn yields: a review of the last 50 yearsof the last 50 years
0%
2%
4%
6%
8%
10%
12%
14%
16%
18%
20%
10 28 46 64 82 100 118 136 154 172
Yield/planted acre
Ch
an
ces
in 1
00
$
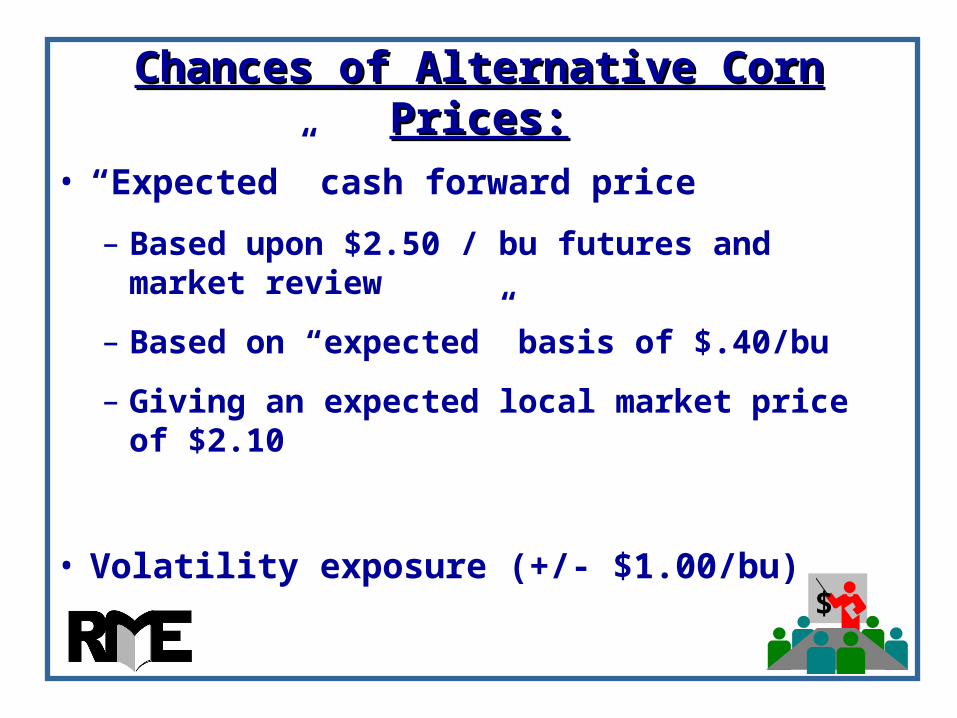
Chances of Alternative Corn Prices:Chances of Alternative Corn Prices:
• “Expected” cash forward price
– Based upon $2.50 / bu futures and market review
– Based on “expected” basis of $.40/bu
– Giving an expected local market price of $2.10
• Volatility exposure (+/- $1.00/bu)
$
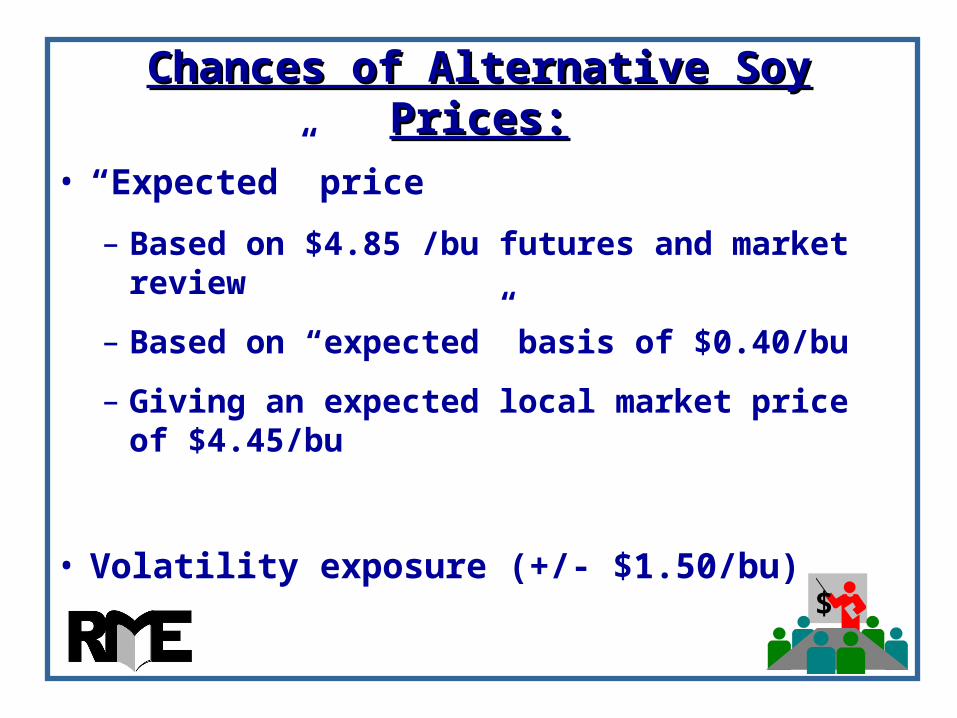
Chances of Alternative Soy Prices:Chances of Alternative Soy Prices:
• “Expected” price
– Based on $4.85 /bu futures and market review
– Based on “expected” basis of $0.40/bu
– Giving an expected local market price of $4.45/bu
• Volatility exposure (+/- $1.50/bu)
$
Stop!Stop!
• Do you have your:
– FINPACK Financial Information?
– Cost of production worksheets?
• Do you have the envelope containing your “to be discovered” offer and realized prices and realized yields?
• DO NOT OPEN !