Embed Size (px)
Citation preview

PROBABILITY AND STATISTICS
BS-338

Probability and Statistics
Catalogue No: BS-338
Credit Hours: 3
Text Book: Advanced Engineering
Mathematics by E.Kreyszig
Reference Books
Probability and Statistics by Murray R. Speigel
Probability and Statistics for Engineers and
Scientists by Walpole

Course Objectives
To teach students basics of
Probability and Statistics with
applications related to
different disciplines of
engineering.

Course Outcomes
Present sample data and extract its important features
Understand different discrete and continuous probability distributions
Estimate different population parameters on the basis of samples
Implement quality control measures

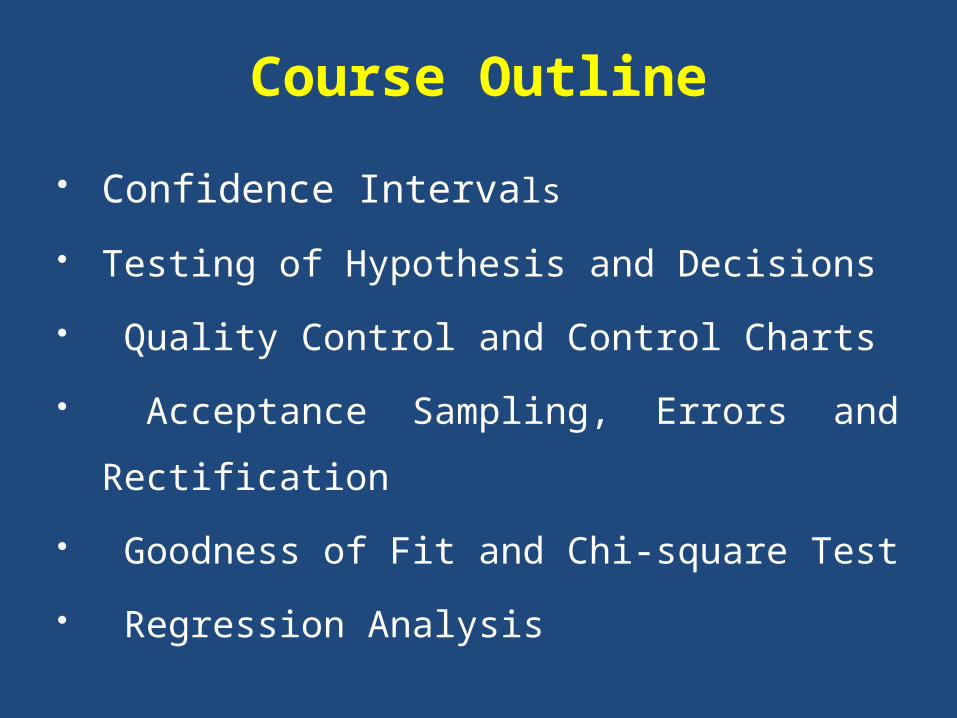
Course Outline
Graphical Representation of Data: Stem-
and-Leaf Plot, Histogram, and Boxplot
Mean, Standard Deviation, Variance
Sample Space, Experiment Outcomes,
Sampling, and Set theory
Introduction to theory of Probability, and
Conditional Probability
Permutations and Combinations

Course Outline Random Variables and Probability
Distributions Mean and Variance of a Distribution,
Expectation, Moments Binomial, Poisson, Hypergeometric
and Normal distributions Distributions of several Random
Variables Random Sampling Point Estimation of Parameters
Course Outline
Confidence Intervals
Testing of Hypothesis and Decisions
Quality Control and Control Charts
Acceptance Sampling, Errors and
Rectification
Goodness of Fit and Chi-square Test
Regression Analysis

Probability
A probability provides a quantatative description of the likely occurrence of a particular event.

StatisticsStatistics is a discipline that allows researchers to evaluate conclusions derived from sample data. In practice, statistics refers to a scientific approach used to: Collect Data Interpret and Analyze Data Assess the Reliability of Conclusions based
on Sample Data

Descriptive Statistics
Collection, Organization, Summarization and Presentation of Data
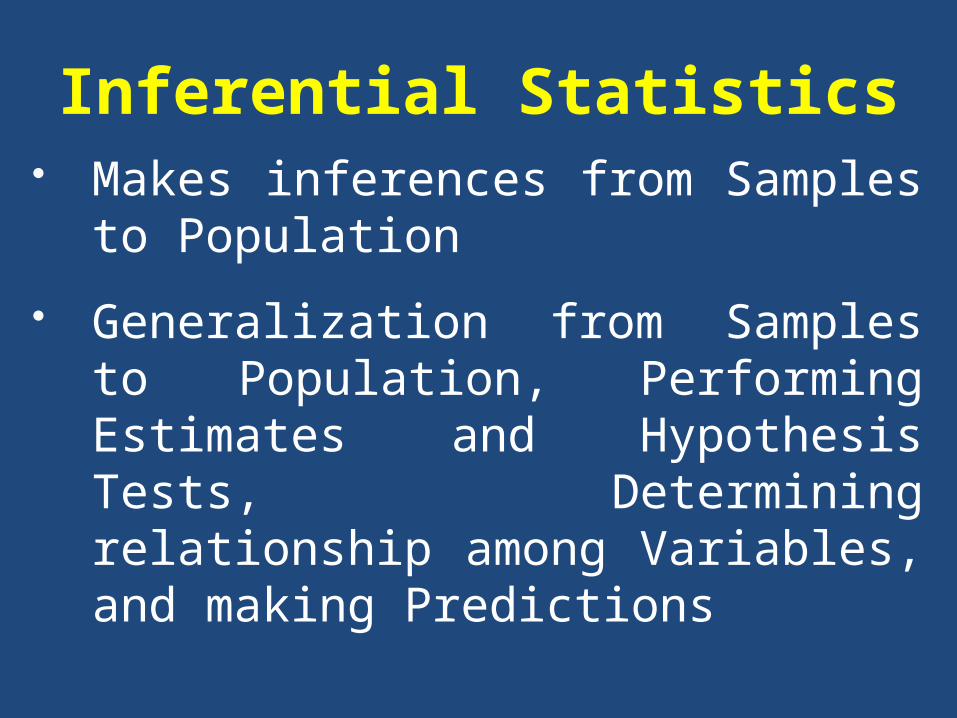
Inferential Statistics Makes inferences from Samples
to Population
Generalization from Samples to Population, Performing Estimates and Hypothesis Tests, Determining relationship among Variables, and making Predictions


Variable
A variable is an attribute that
describes a person, place, thing,
or idea
The value of the variable can
"vary" from one entity to another

Qualitative vs Quantitative Variables
Qualitative variables take on values that are names or labels. The colour of a ball (e.g., red, green, blue)
Quantitative variables are numeric. They represent a measurable quantity. For example, population of a city

Discrete vs Continuous Variables
Quantitative variables can be further
classified as discrete or continuous.
If a variable can take on any value
between its minimum value and its
maximum value, it is called a
continuous variable; otherwise, it is
called a discrete variable.

Univariate vs Bivariate Data
Univariate Data. A study that looks at only one variable, is said that we are working with univariate data.
Bivariate Data. A study that examines the relationship between two variables, is said working with bivariate data.

ProblemWhich of the following statements are true? I. All variables can be classified as
quantitative or categorical variables. II. Categorical variables can be continuous variables. III. Quantitative variables can be discrete variables.
(A) I only (B) II only (C) III only (D) I and II (E) I and III
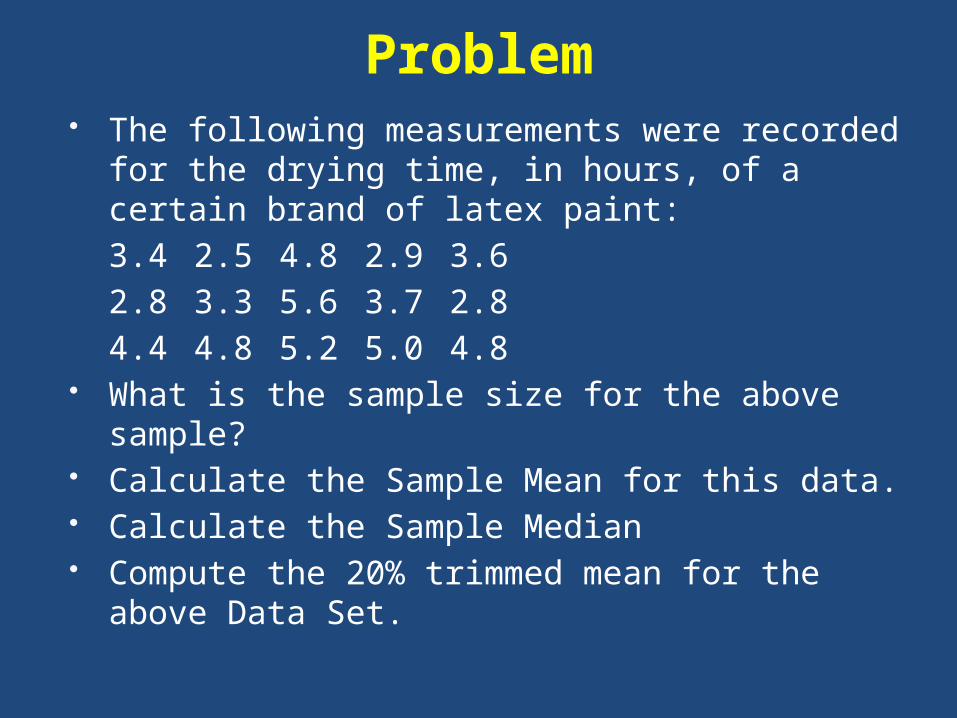
Problem The following measurements were
recorded for the drying time, in hours, of a certain brand of latex paint:3.4 2.5 4.8 2.9 3.62.8 3.3 5.6 3.7 2.84.4 4.8 5.2 5.0 4.8
What is the sample size for the above sample?
Calculate the Sample Mean for this data. Calculate the Sample Median Compute the 20% trimmed mean for the
above Data Set.

Categorical Frequency Distribution
Twenty Five soldiers were given a blood test to determine their blood type. The data set is:A B B AB OO O B AB BB B O A AA O O O ABAB A O B A

Grouped Frequency Distribution
Carbon Content [%] of coal
89 90 89 84 8088 90 89 88 9085 87 86 82 8576 89 87 86 86
Find the Range of above Data Set. Formulate Frequency Distribution Table. Represent the Data by a Histogram.

Problem Find the Variance and Standard Deviation for
the Data Set: 10 60 50 30 40 20
Steps to calculate Variance and Standard Deviation Find the Mean Subtract the Mean from each Data Value Square each result Find sum of squares Divide sum by N to get the Variance (291.7) Take Square Root, to find Standard Deviation
(17.1)

Problem
Draw a Stem-and-Leaf Plot and Box-
and-Whisker Plot for the following
set of values:12, 13, 21, 27, 33, 34, 35, 37, 40, 40, 41

Problem Set 24.1Question 7
Represent the data by a Stem-and-Leaf Plot, a Histogram and a Boxplot:
Reaction Time [sec] of an automatic switch: 2.3 2.2 2.4 2.5 2.3 2.3 2.4 2.1
2.52.4 2.6 2.3 2.5 2.1 2.4 2.2 2.3 2.5 2.4 2.4

Problem
Find the Mean and Compare it with Median.
Find the Standard Deviation and Compare it with the Interquartile Range:
2.3 2.2 2.4 2.5 2.3 2.3 2.4 2.1 2.52.4 2.6 2.3 2.5 2.1 2.4 2.2
2.3 2.5 2.4 2.4
Problem
Complete a stem-and-leaf plot for the following list of values:
100, 110, 120, 130, 130, 150, 160, 170, 170, 190, 110, 230, 240, 260, 270, 270, 280. 290, 290

QUIZ # 1DE-32(B) – 17 SEP 2012
The following measurements were recorded for the drying time, in hours, of a certain brand of latex paint:3.4 2.5 4.8 2.9 3.62.8 3.3 5.6 3.7 2.84.4 4.8 5.2 5.0 4.8
Represent the data by a Stem-and-Leaf Plot, and a Boxplot. (Marks: 2 +3)

QUIZ # 1DE-32(A) – 18 SEP 2012
The following measurements were recorded for the drying time, in hours, of a certain brand of latex paint:3.4 2.5 4.8 2.9 3.62.8 3.3 5.6 3.7 2.84.4 4.8 5.2 5.0 4.8
Make a Frequency Distribution Table and represent the data by a Boxplot. (Rows 1, 3, 5)
Find the Standard Deviation and Compare it with the Interquartile Range. Also graph its Stem-and-Leaf plot. (Rows 2, 4, 6)
(Marks: 2 +3)