Embed Size (px)
Citation preview
ARTICLE IN PRESS
JOURNAL OFFOOD COMPOSITION
AND ANALYSIS
Journal of Food Composition and Analysis 18 (2005) 691–698
0889-1575/$ -
doi:10.1016/j.
�Correspon
E-mail add
www.elsevier.com/locate/jfca
Original Article
(+)-Catechin and (�)-epicatechin in Bulgarian fruits
Silvia Tsanova-Savova, Fany Ribarova�, Maria Gerova
Department of Food Chemistry, National Center of Hygiene, Medical Ecology and Nutrition, 15 D. Nestorov Blvd.,
Sofia 1431, Bulgaria
Received 16 June 2003; received in revised form 26 January 2004; accepted 14 June 2004
Abstract
Fifteen different fruits were analyzed. (+)-Catechin and (�)-epicatechin were determined with RP-HPLC and fluorescence detection. The LOD and LOQ are 0.1 and 0.3mg/kg fresh weight, respectively. Theuncertainty of determination is �Du ¼ �0:3mg=kg for (+)-catechin and �Du ¼ �0:8mg=kg for (+)-epicatechin.
(+)-Catechin content in Bulgarian fruits varies from 108.3mg/kg in black grape to 3.7mg/kg in pears.(�)-Epicatechin range is from o0.3mg/kg in fig to 87.0mg/kg in black grape. The catechins content inBulgarian fruits are topped by black grape and apricot, 195.3 and 156.0mg/kg, respectively. The data willbe included in the National Food Composition Table and could be used in regional network databasesystems for exchange of data.r 2004 Elsevier Inc. All rights reserved.
Keywords: (+)-Catechin; (�)-Epicatechin; Fruits; HPLC; Database
1. Introduction
Plant foods have been subjected recently to extensive research in order to analyze the widespectrum of biologically active substances they contain. Among these compounds are catechins,one of the six classes of flavonoids. Their main representatives are (+)-catechin, (�)-epicatechin,and their esters with gallic acid. Catechins display a number of biological activities including
see front matter r 2004 Elsevier Inc. All rights reserved.
jfca.2004.06.008
ding author. Tel.: +359-2-58-12-238; fax: +359-2-958-1277.
ress: [email protected] (F. Ribarova).
ARTICLE IN PRESS
S. Tsanova-Savova et al. / Journal of Food Composition and Analysis 18 (2005) 691–698692
antioxidant and free radical scavenger activity (Terao et al., 1994; Plumb et al., 1998; Wolfe et al.,2003). Other authors have stressed their role in reducing tumor development and growth (Gali etal., 1994; Okabe et al., 1999) and inhibiting platelet aggregation (Chang and Hsu, 1989), ordetermined their antibacterial and angioprotective properties (Vennat et al., 1988), and ability toinduce selectively Phase I and II metabolic enzymes (Sohn et al., 1994; Bu-Abbas et al., 1995). It iswell known that green and black tea are very rich in catechins, with a content of up to 35% of dryweight in green tea (Balentine et al., 1997). The data for catechins composition in other naturalplant foods and beverages are still limited and sporadic. According to the literature data catechinsare found mainly in fruits and hardly even traces could be found in vegetables (Oszmianski andLee, 1990; Amiot et al., 1995; Risch and Herrmann, 1988; Arts et al., 2000; de Pascual-Teresa etal., 2000). It is important to point out that gallic esters are found in significant amounts in tea andgrape, and in trace amounts in other fruits (Rice-Evans et al., 1996; Arts et al., 2000; de Pascual-Teresa et al., 2000).
Food composition data are essential for the preparation of nutritional programs and policies,as well as for healthy diet prescriptions. In addition, there is a growing demand for high-qualityfood composition data in order to ensure accuracy in establishing the relationship between dietand health. Although, the primary objective of food databases is to provide information about thenutrient content of foods, nowadays it is important to have more data for biologically activesubstances like catechins. In March 2003, the US Department of Agriculture released a foodcomposition table listing flavonoid content of selected foods (Web site: http://www.nal.usda.gov/fnic/foodcomp) (US Department of Agriculture, Agricultural Research Service, Beltsville HumanNutrition Research Center, Nutrient Data Laboratory, 2003). In this food composition table, thevalues for catechins content in fruits have been borrowed from the results of Arts et al., 2000. Theother literature data do not match the criteria for data quality, regarding the origin and number ofsamples or analytical techniques used (Holden et al., 2002). The actuality of the problem and thelack of high-quality data for catechins in foods give us a ground to study the determination of thecontent of main catechins in Bulgarian fruits—(+)-catechin and (�)-epicatechin. Bulgaria is atraditional fruit producing country and fruit consumption constitutes a significant share in thenational diet. We will compare the obtained results with those found in the literature sincecatechins content could be influenced by fruits variety, ripening stage, and growth conditions(Burda et al., 1990; Kennedy et al., 2001). In order to obtain representative and accurate data thestudy design will be focused on sampling plan and precision of analytical determination.
2. Materials and methods
2.1. Materials
Fifteen different fruits from four plant families were analyzed for (+)-catechin and (�)-epicatechin content; they are listed in Table 1. The sampling plan included specification of originof samples, specification of number of samples and information concerning sample handling. Theorigin of samples was defined according to the Bulgarian agricultural statistics of the Ministry ofAgriculture and Forests (web site: http://www.mzgar.governmet.bg). The country has beendivided into six regions namely Northwest, Central North, Northeast, Southeast, Central South,
ARTICLE IN PRESS
Table 1
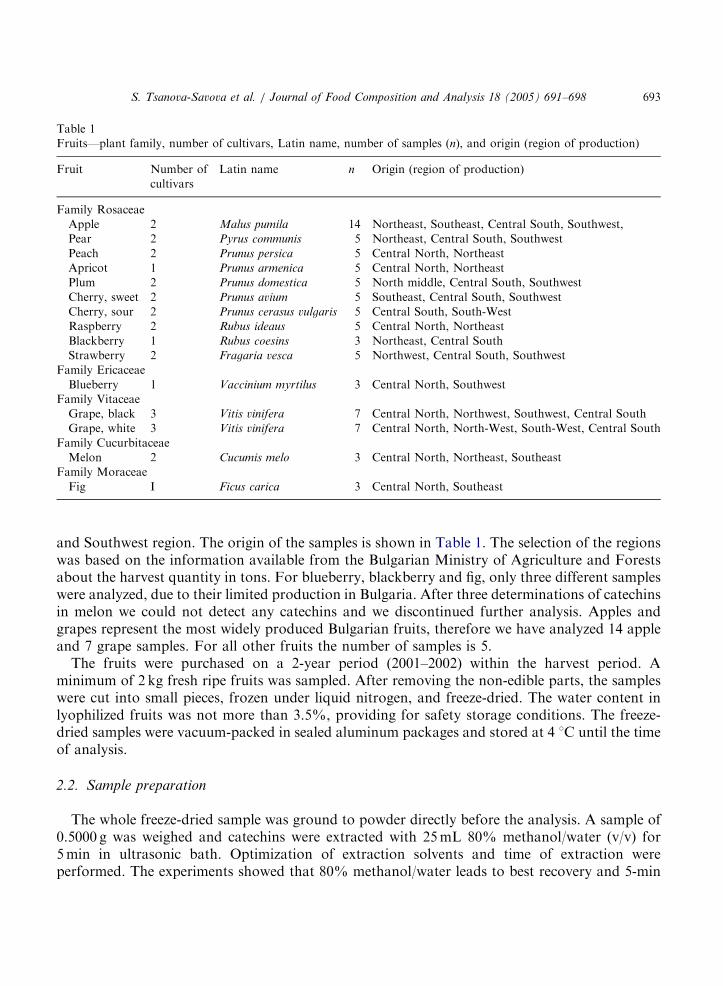
Fruits—plant family, number of cultivars, Latin name, number of samples (n), and origin (region of production)
Fruit Number of
cultivars
Latin name n Origin (region of production)
Family Rosaceae
Apple 2 Malus pumila 14 Northeast, Southeast, Central South, Southwest,
Pear 2 Pyrus communis 5 Northeast, Central South, Southwest
Peach 2 Prunus persica 5 Central North, Northeast
Apricot 1 Prunus armenica 5 Central North, Northeast
Plum 2 Prunus domestica 5 North middle, Central South, Southwest
Cherry, sweet 2 Prunus avium 5 Southeast, Central South, Southwest
Cherry, sour 2 Prunus cerasus vulgaris 5 Central South, South-West
Raspberry 2 Rubus ideaus 5 Central North, Northeast
Blackberry 1 Rubus coesins 3 Northeast, Central South
Strawberry 2 Fragaria vesca 5 Northwest, Central South, Southwest
Family Ericaceae
Blueberry 1 Vaccinium myrtilus 3 Central North, Southwest
Family Vitaceae
Grape, black 3 Vitis vinifera 7 Central North, Northwest, Southwest, Central South
Grape, white 3 Vitis vinifera 7 Central North, North-West, South-West, Central South
Family Cucurbitaceae
Melon 2 Cucumis melo 3 Central North, Northeast, Southeast
Family Moraceae
Fig I Ficus carica 3 Central North, Southeast
S. Tsanova-Savova et al. / Journal of Food Composition and Analysis 18 (2005) 691–698 693
and Southwest region. The origin of the samples is shown in Table 1. The selection of the regionswas based on the information available from the Bulgarian Ministry of Agriculture and Forestsabout the harvest quantity in tons. For blueberry, blackberry and fig, only three different sampleswere analyzed, due to their limited production in Bulgaria. After three determinations of catechinsin melon we could not detect any catechins and we discontinued further analysis. Apples andgrapes represent the most widely produced Bulgarian fruits, therefore we have analyzed 14 appleand 7 grape samples. For all other fruits the number of samples is 5.
The fruits were purchased on a 2-year period (2001–2002) within the harvest period. Aminimum of 2 kg fresh ripe fruits was sampled. After removing the non-edible parts, the sampleswere cut into small pieces, frozen under liquid nitrogen, and freeze-dried. The water content inlyophilized fruits was not more than 3.5%, providing for safety storage conditions. The freeze-dried samples were vacuum-packed in sealed aluminum packages and stored at 4 1C until the timeof analysis.
2.2. Sample preparation
The whole freeze-dried sample was ground to powder directly before the analysis. A sample of0.5000 g was weighed and catechins were extracted with 25mL 80% methanol/water (v/v) for5min in ultrasonic bath. Optimization of extraction solvents and time of extraction wereperformed. The experiments showed that 80% methanol/water leads to best recovery and 5-min
ARTICLE IN PRESS
S. Tsanova-Savova et al. / Journal of Food Composition and Analysis 18 (2005) 691–698694
extraction in ultrasonic bath is equivalent to 1 h in a mechanical shaker. After extraction thevolume was made up to 50mL with water. Aliquot of 2mL was ultra-centrifugated for 5min at14 000 rpm. The supernatant was filtered over a 0.45 Nylon membrane filter (Millipore), and 20mLwas injected onto liquid chromatograph.
2.3. High-performance liquid chromatography
Hewlett–Packard liquid chromatograph equipped with HP pump 1050, thermostat HP 1100,Rheodyne 750 injector, and fluorescence detector HP 1100 was used. Data analyses wereperformed using ChemStation software (Agilent Technology). Reverse-phase separation wascarried out at 30 1C using Alltima C18 column (100� 4.6mm2 i.d.; 3mm), equipped with aprecolumn Alltima C18 (Alltech Associates, Inc.). An 12-min isocratic elution was performedusing mobile phase of 9% acetonitrile in 2% acetic acid with flow rate of 1mL/min. Detection wascarried out using fluorescence detector set at lEX=280 nm and lEM=315nm. Catechins werequantified by external standard method. Plotting concentration (mg/mL) to peak area set up thecalibration graphs. The working calibration solutions were prepared by dilution of stock solutionsin 40% methanol.
Reagents: (+)-Catechin and (�)-epicatechin were purchased from Sigma Chem.Co.
3. Results and discussion
3.1. Validation of analytical method
The HPLC method for determination of catechins was validated and used for quantitativedetermination of (+)-catechin and (�)-epicatechin in fruits. The working concentration rangewas 0.2–15mg/mL. Within this interval the calibration curves were linear with correlationcoefficient 40.99. The limit of detection of the method was 0.1mg/kg fresh weight and limit ofquantification was 0.3mg/kg fresh weight. The repeatability of the method was estimated bycalculating relative standard deviation (R.S.D.%) for six determinations of apricot within one day.R.S.D. for (+)-catechin was 1.8% and for (�)-epicatechin was 1.4%. The uncertainty of analyticalresults was estimated after analysis on 10 replicates of apricot within 5 days: �x � Du ¼
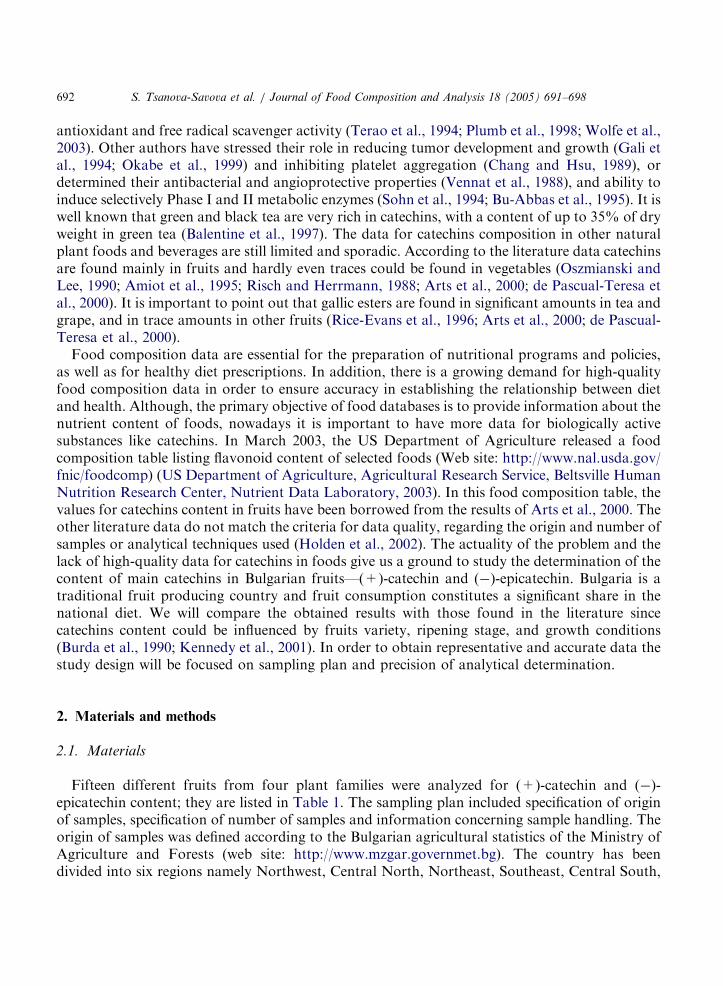
27:4� 0:3mg=kg for (+)-catechin and �x � Du ¼ 90:1� 0:8mg=kg for (�)-epicatechin (ISO/IEC,17025,1999). The analytical recovery was 106.7% R.S.D.=6.1%, n=3) and 92.9% (RSD=7.5%,n=3) for (+)-catechin and (�)-epicatechin, respectively. The recovery was determined bycomparing catechins levels in apples with those in apples spiked with known amount of standardcompounds. Standards—100% of original levels in apples—were added before the addition of theextraction solvent. The stability of the samples was approximately 24 h. After 30 h storage at �181C, the results were approximately 20% lower, depending on the fruit matrix. All samples wereanalyzed in duplicate and when the difference between results was more than 10%, the analyseswere repeated. The identification of (+)-catechin and (�)-epicatechin was done matching theretention times of peaks in chromatograms with those of the pure standard solutions. We considerthat fluorescence detection enables sufficient selectivity for determination, but however for some
ARTICLE IN PRESS
0 2 4 6 8 10 12 14
LU
0
20
40
60
80
100
120
140
160
180
FLD1 A, Ex=280, Em=315 (MART0054.D)
epicatechin
catechin
0 2 4 6 8 10 12
LU
16
18
20
22
24
26
28
FLD1 A, Ex=280, Em=315 (MART0048.D)
catechin
epicatechin
14
5.7
83
10.9
97
Standard solution 0.2 µg/mL
10.8
25
7.86
5
5.71
9
Blueberry(a) (b)
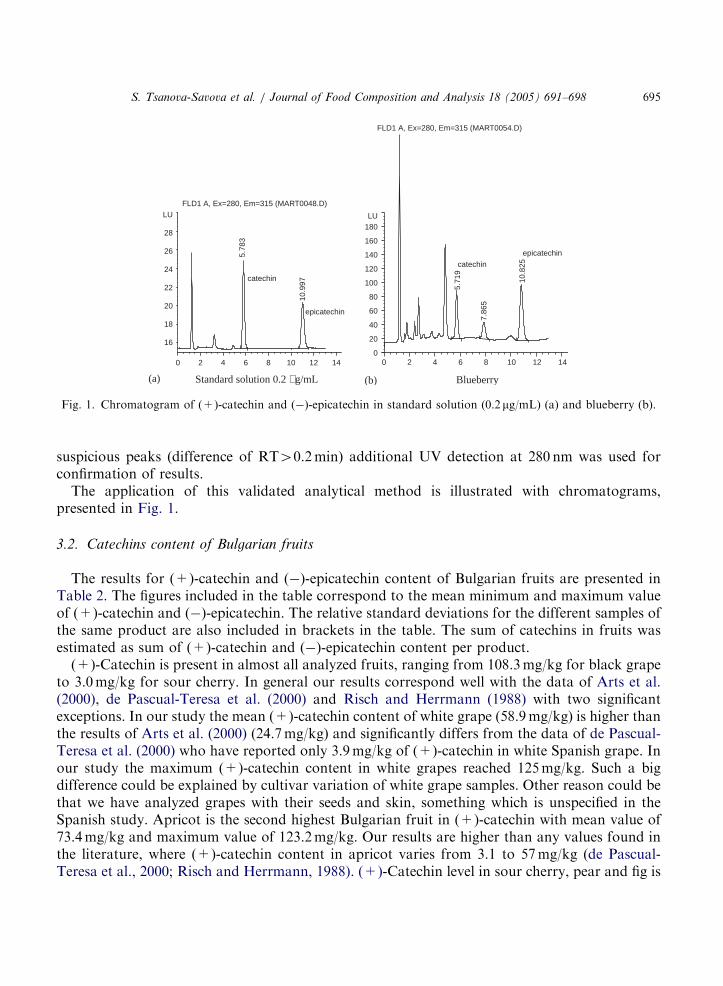
Fig. 1. Chromatogram of (+)-catechin and (�)-epicatechin in standard solution (0.2 mg/mL) (a) and blueberry (b).
S. Tsanova-Savova et al. / Journal of Food Composition and Analysis 18 (2005) 691–698 695
suspicious peaks (difference of RT40.2min) additional UV detection at 280 nm was used forconfirmation of results.
The application of this validated analytical method is illustrated with chromatograms,presented in Fig. 1.
3.2. Catechins content of Bulgarian fruits
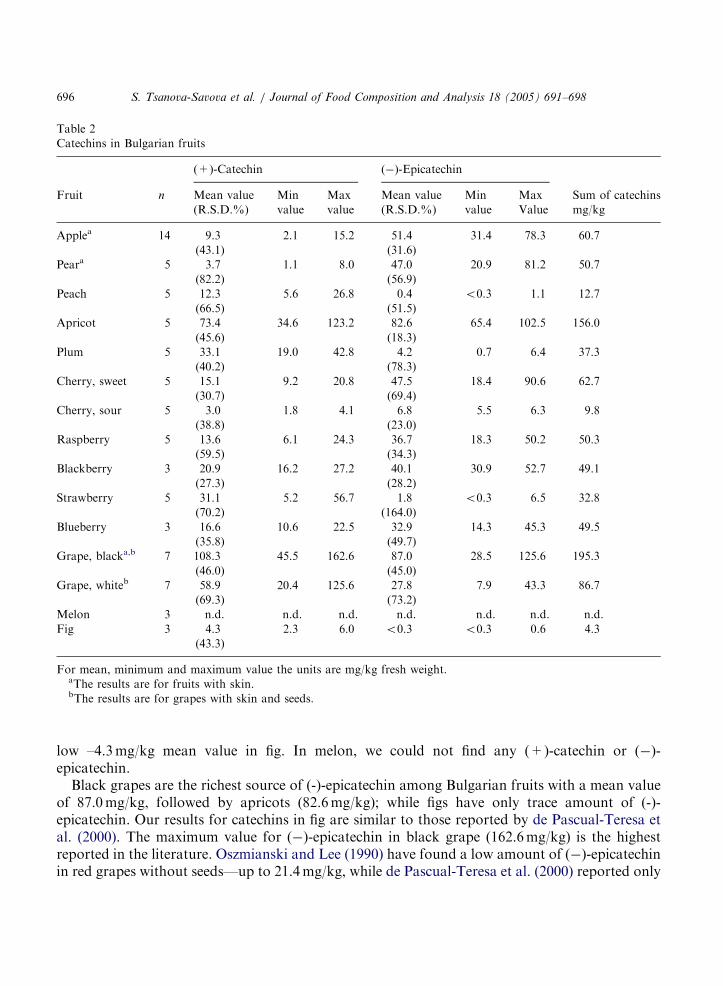
The results for (+)-catechin and (�)-epicatechin content of Bulgarian fruits are presented inTable 2. The figures included in the table correspond to the mean minimum and maximum valueof (+)-catechin and (�)-epicatechin. The relative standard deviations for the different samples ofthe same product are also included in brackets in the table. The sum of catechins in fruits wasestimated as sum of (+)-catechin and (�)-epicatechin content per product.
(+)-Catechin is present in almost all analyzed fruits, ranging from 108.3mg/kg for black grapeto 3.0mg/kg for sour cherry. In general our results correspond well with the data of Arts et al.(2000), de Pascual-Teresa et al. (2000) and Risch and Herrmann (1988) with two significantexceptions. In our study the mean (+)-catechin content of white grape (58.9mg/kg) is higher thanthe results of Arts et al. (2000) (24.7mg/kg) and significantly differs from the data of de Pascual-Teresa et al. (2000) who have reported only 3.9mg/kg of (+)-catechin in white Spanish grape. Inour study the maximum (+)-catechin content in white grapes reached 125mg/kg. Such a bigdifference could be explained by cultivar variation of white grape samples. Other reason could bethat we have analyzed grapes with their seeds and skin, something which is unspecified in theSpanish study. Apricot is the second highest Bulgarian fruit in (+)-catechin with mean value of73.4mg/kg and maximum value of 123.2mg/kg. Our results are higher than any values found inthe literature, where (+)-catechin content in apricot varies from 3.1 to 57mg/kg (de Pascual-Teresa et al., 2000; Risch and Herrmann, 1988). (+)-Catechin level in sour cherry, pear and fig is
ARTICLE IN PRESS
Table 2
Catechins in Bulgarian fruits
(+)-Catechin (�)-Epicatechin
Fruit n Mean value Min Max Mean value Min Max Sum of catechins
(R.S.D.%) value value (R.S.D.%) value Value mg/kg
Applea 14 9.3 2.1 15.2 51.4 31.4 78.3 60.7
(43.1) (31.6)
Peara 5 3.7 1.1 8.0 47.0 20.9 81.2 50.7
(82.2) (56.9)
Peach 5 12.3 5.6 26.8 0.4 o0.3 1.1 12.7
(66.5) (51.5)
Apricot 5 73.4 34.6 123.2 82.6 65.4 102.5 156.0
(45.6) (18.3)
Plum 5 33.1 19.0 42.8 4.2 0.7 6.4 37.3
(40.2) (78.3)
Cherry, sweet 5 15.1 9.2 20.8 47.5 18.4 90.6 62.7
(30.7) (69.4)
Cherry, sour 5 3.0 1.8 4.1 6.8 5.5 6.3 9.8
(38.8) (23.0)
Raspberry 5 13.6 6.1 24.3 36.7 18.3 50.2 50.3
(59.5) (34.3)
Blackberry 3 20.9 16.2 27.2 40.1 30.9 52.7 49.1
(27.3) (28.2)
Strawberry 5 31.1 5.2 56.7 1.8 o0.3 6.5 32.8
(70.2) (164.0)
Blueberry 3 16.6 10.6 22.5 32.9 14.3 45.3 49.5
(35.8) (49.7)
Grape, blacka,b 7 108.3 45.5 162.6 87.0 28.5 125.6 195.3
(46.0) (45.0)
Grape, whiteb 7 58.9 20.4 125.6 27.8 7.9 43.3 86.7
(69.3) (73.2)
Melon 3 n.d. n.d. n.d. n.d. n.d. n.d. n.d.
Fig 3 4.3 2.3 6.0 o0.3 o0.3 0.6 4.3
(43.3)
For mean, minimum and maximum value the units are mg/kg fresh weight.aThe results are for fruits with skin.bThe results are for grapes with skin and seeds.
S. Tsanova-Savova et al. / Journal of Food Composition and Analysis 18 (2005) 691–698696
low –4.3mg/kg mean value in fig. In melon, we could not find any (+)-catechin or (�)-epicatechin.
Black grapes are the richest source of (-)-epicatechin among Bulgarian fruits with a mean valueof 87.0mg/kg, followed by apricots (82.6mg/kg); while figs have only trace amount of (-)-epicatechin. Our results for catechins in fig are similar to those reported by de Pascual-Teresa etal. (2000). The maximum value for (�)-epicatechin in black grape (162.6mg/kg) is the highestreported in the literature. Oszmianski and Lee (1990) have found a low amount of (�)-epicatechinin red grapes without seeds—up to 21.4mg/kg, while de Pascual-Teresa et al. (2000) reported only

ARTICLE IN PRESS
S. Tsanova-Savova et al. / Journal of Food Composition and Analysis 18 (2005) 691–698 697
7.0mg/kg. The result for (�)-epicatechin in white grape, due to the above-mentioned reasons, ishigh (27.8mg/kg), while the literature data vary from 0.7 to10.2mg/kg (de Pascual-Teresa et al.,2000; Arts et al., 2000). Despite their high (+)-catechin content, peaches, strawberries and plumsare very poor in (�)-epicatechin 0.4 and 1.7, and 4.2mg/kg, respectively. Our data for (-)-epicatechin in Bulgarian apples, sweet cherry, raspberry, and blackberry are more than two timeslower than those in the Dutch study (Arts et al., 2000), but higher than those reported in Germanand Spanish studies (Risch and Herrmann, 1988; de Pascual-Teresa et al., 2000).
The great variation of data for (+)-catechin and (�)-epicatechin content in fruits determinehigh R.S.D.% values (440%). Therefore in databases for catechins content in foods it is preferablealong with mean values to present information about the minimum and maximum values.
Due to the big differences between maximum and minimum values for (+)-catechin and (�)-epicatechin found in Bulgarian fruits it is difficult to propose a significant classification of fruits.Statistical estimation of two-sided confidence interval (P=95%) of sum of catechins studied wasdone (data not shown here). According to the statistical analysis we can state that black grape(195.3mg/kg) and apricot (156.0mg/kg) are the richest sources of catechins among Bulgarianfruits. In the Dutch study the highest catechins levels were found in black grape (203.9mg/kg),blackberry (187.4mg/kg), sweet cherry (117.1mg/kg) and apricot (110.1mg/kg) (Arts et al., 2000).Our results for cherries and especially blackberries are lower in comparison with those in theDutch study, but are close to the values in the Spanish study (de Pascual-Teresa et al., 2000). Fig,sour cherry and peach are the poorest sources of catechins. For all other fruits the differences intheir catechins composition are not statistically significant.
4. Conclusion
Our study presents a validated analytical method for quantitative determination of (+)-catechin and (�)-epicatechin in fruits. We have analyzed 15 different Bulgarian fruits for theircatechins content. The obtained data are representative for the fruits of the country. The samplingplan was carefully designed, taking into account the origin of the fruits, the number of samplesand the sample handling. Our data will be included in the National Food Composition Table andprobably will find a place in the International Food Composition Database. The data will behelpful for epidemiologists, nutritionists, dieticians, agro- and food-technologists and could beused in regional network database systems for exchange of data.
References
Amiot, M., Tacchini, M., Aubert, S., Oleszek, W., 1995. Influence of cultivar, maturity stage, and storage conditions on
phenolic composition and enzymatic browning of pear fruits. Journal of the Agricultural Food Chemistry 43,
1132–1137.
Arts, I., van de Putte, B., Hollman, P., 2000. Catechin contents of foods commonly consumed in The Netherlands. 1.
Fruits, Vegetables, Staple Foods, and Processed foods. Journal of the Agricultural Food Chemistry 48, 1746–1751.
Balentine, D.A., Wisseman, S.A., Bouwens, L., 1997. The chemistry of tea flavonoids. Critical Reviews of Food Science
and Nutrition 37, 693–704.
ARTICLE IN PRESS
S. Tsanova-Savova et al. / Journal of Food Composition and Analysis 18 (2005) 691–698698
Burda, S., Oleszek, W., Lee, C., 1990. Phenolic compounds and their changes in apples during maturation and cold
storage. Journal of the Agricultural Food Chemistry 38, 945–948.
Bu-Abbas, A., Clifford, M., Joanides, C., Walker, R., 1995. Stimulation of rat hepatic UDP-glucuronosyl transferase
activity following treatment with green tea. Food and Chemical Toxicology 33, 27–30.
Chang, W.C., Hsu, F.L., 1989. Inhibition of platelet aggregation and arachidonate metabolism on platelets by
procyanidins. Prostaglandins, Leucotrienes Essential Fatty Acids 38, 181–188.
de Pascual-Teresa, S., Santos-Buelga, C., Rivas-Gonzalo, J., 2000. Quantitative analysis of flavan-3-ols in Spanish
foodstuffs and beverages. Journal of the Agricultural Food Chemistry 48, 5331–5337.
Gali, H.U., Perchellet, E.M., Gao, X.M., Karchesy, J.J., Perchellet, J.P., 1994. Comparison of the inhibitory effects of
monomeric, dimeric and trimeric procyanidins on the biochemical markers in skin tumor promotion in mouse
epidemics in vivo. Plant Medicine 60, 239–245.
Holden, J., Bhagwat, S., Patterson, K., 2002. Development of a multi-nutrient data quality evaluation system. Journal
of the Food Composition Analysis 15, 339–348.
ISO/IEC 17025:1999. General Requirements for the Competence of Calibration and Testing Laboratories. ISO,
Geneva, Switzerland.
Kennedy, J., Hayasaka, Y., Vidal, S., Waters, E., Jones, G., 2001. Composition of grape skin proantocyanidins at
different stages of berry development. Journal of the Agricultural Food Chemistry 49, 5348–5355.
Okabe, S., Ochiai, Y., Aida, M., Park, K., Kim, S., Nomura, T., Suganuma, M., Fujiki, H., 1999. Mechanistic aspects
of green tea as a cancer preventive: effect of components on human stomach cancer cell lines. Japanese Journal of
Cancer Research 90, 733–739.
Oszmianski, J., Lee, C., 1990. Isolation and HPLC determination of phenolic compounds in red grapes. American
Journal of Enalogy and Viticulture 41, 204–206.
Plumb, G.W., de Pascual-Teresa, S., Santos-Buelga, C., Cheynier, V., Williamson, G., 1998. Antioxidant properties of
catechins and proantocyanodins: effect of polymerization, galloylation and glycosilation. Free Radical Research 29,
351–358.
Rice-Evans, C.A., Miller, N.J., Paganga, G., 1996. Structure-antioxidant activity relationships of flavonoids and
phenolic acids. Free Radical Biology and Medicine 20, 933–956.
Risch, B., Herrmann, K., 1988. Die Gehalte an Hydroxyzimtsaure-Verbindungen und Catechinen in Kern und
Steinobst. Zeitschrift fur Lebensmittel-untersuchung und-Forschung 186, 225–230.
Sohn, O., Surace, A., Fiala, E., Richie, J., Colosimo, S., Zang, E., Weisburger, J., 1994. Effects of green and black tea
on hepatic xenobiotic metabolizing systems in the male F344 rat. Xenobiotica 24, 119–127.
Terao, J., Piskula, M., Yao, Q., 1994. Protective effect of epicatechin, epicatechin gallate and quercetin on lipid
peroxidation in phospholipid bilayers. Archieves of Biochemistry and Biophysics 308, 278–284.
US Department of Agriculture, Agricultural Research Service, Beltsville Human Nutrition Research Center, Nutrient
Data Laboratory, March 2003. USDA Database for the flavonoid content of selected foods. From the World Wide
Web: http://www.nal.usda.gov/fnic/foodcomp.
Vennat, B., Pourrat, A., Puorrat, H., Gross, D., Bastide, P., Bastide, J., 1988. Procyanidins from the roots of Fragaria
vesca: characterization and pharmacological approach. Chemical & Pharmaceutical Bulletin 36, 828–833.
Wolfe, K., Wu, X., Liu, R.H., 2003. Antioxidant activity of apple peels. Journal of Agricultural Food Chemistry 51
609–614.


![An Intracellular Laccase Is Responsible for Epicatechin-Mediated ... · An Intracellular Laccase Is Responsible for Epicatechin-Mediated Anthocyanin Degradation in Litchi Fruit Pericarp1[OPEN]](https://img.pdfslide.net/doc/110x75/5e40fd7c7264f80c8d618288/an-intracellular-laccase-is-responsible-for-epicatechin-mediated-an-intracellular.jpg)