Embed Size (px)
Citation preview
Chapter 6 Water Quality
Groundwater Quality
Why Chemistry?
Together with flow characteristics and quantification of water resources, water quality is
amongst the most important issues of sustainable water resource use. Water quality is
examined through detailed chemical analyses of a wide range of parameters. Such
analyses can answer questions about the origin of the water, the presence of contaminants,
and the degradation processes at work.
The interpretation of chemical characteristics of the water quality of the Longaví River
Basin was difficult because of several reasons: (1) No data about surface water quality
could be obtained and only limited data on the groundwater was available. The
groundwater analysis was based on 22 water samples from 18 wells, which represents only
a small portion of the total study area. (2) The samples were not taken on the same day as
should be the case for an aquifer characterisation. Instead, the samples were taken between
1995 and 2002, always on the occasion of well construction. (3) Not all important
parameters were measured.
Ion Balance
The first step of the water analysis was an assessment of the quality of the data, which was
accomplished by calculating the balance of positive and negative ions. Water fulfills the
principle of electroneutrality and is therefore always uncharged. The level of error in the
data was calculated using the following formula (Appelo et al., 1996):
100 balance ion of Error ∗Σ+Σ
Σ−Σ=
anionscations
anionscations
An error of up to ±3 % is tolerable, while every water sample with a calculated error
outside this range should be measured again. Approximately one third of the measured
water samples were within this range (see Appendix III). This indicates that around two-
thirds of the samples have serious measuring or sampling errors, which means that the
resultant data quality is insufficient for chemical modelling or for drawing simple
conclusions about water quality.
Chapter 6 Water Quality
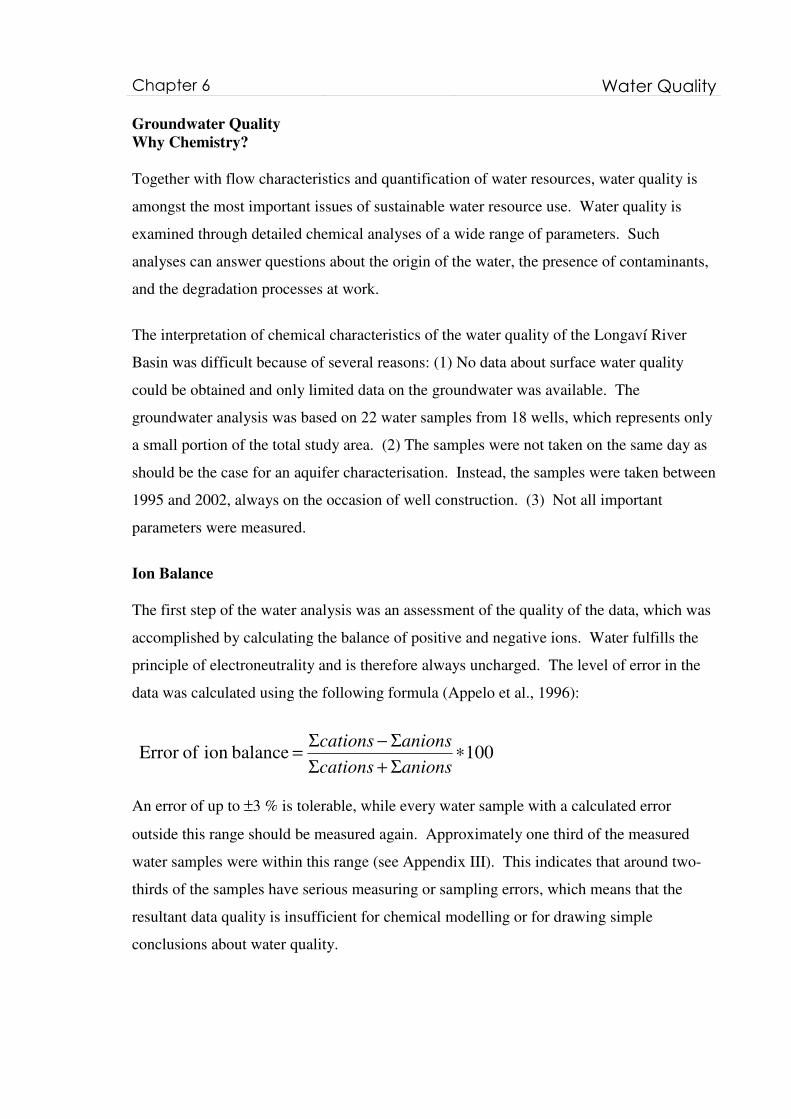
Figure 13. Piper diagram. Composition of water samples according to their major cations and
anions. Only those water samples whose error of ion balance was within ±10 % are plotted.
Major Cations and Anions
The main constituents of groundwater are positively and negatively charged ions, usually
present at concentrations of mg L-1
(Table 4). Particular ions and cations are extremely
important in the assessment of water that is to be used for human consumption or for
irrigation. Major cations such as Na+, K
+, Ca
2+, and Mg
2+ and major anions such as HCO3
-, CO3
2-, SO4
2- and Cl
- were plotted in a hydrochemical trilinear diagram, also known as a
Piper diagram (Piper, 1944) (Figure 13). The ion compositions were plotted for all water
samples with an error of ion balance within the ±10 % range.
Chapter 6 Water Quality
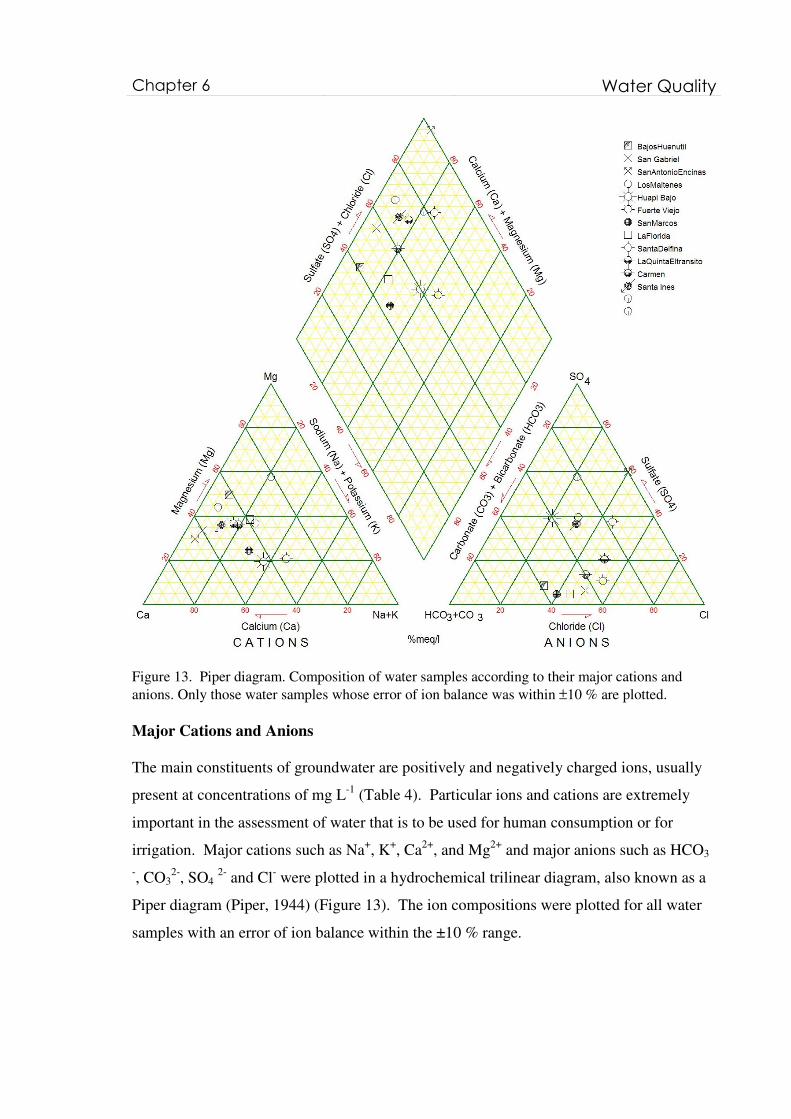
Figure 14. Distribution of chloride concentrations in mg L-1
in the Longaví River Basin.
In Figure 13, the triangle on the left side presents cation composition, while the triangle on
the right side presents anion composition. The rectangular diagram shows both anions and
cations. This plotting procedure assists in the classification of groundwater by its ion
ratios.
The combined rectangular cation-anion diagram shows high calcium and magnesium
contents, ranging from 60 to 95 %. The majority of the samples also have sulphate-
chloride contents above 60 %. According to the Piper classification scheme, the
groundwater is a Ca2+
- Mg2+
- SO4 2-
- Cl- - water. The high proportions of calcium,
magnesium, sulphate and chloride can be an indication of agricultural influences on the
groundwater, as waters with such characteristics are often found in agricultural regions.
The chloride concentrations vary between 2.5 and 12.5 mg L-1
(Figure 14), with the highest
concentrations being found in the Santa Delfina and La Quinta – El Transito wells. High
chloride concentrations can be also be the result of salt depositions, seawater, rainwater
and household sewage. The first two factors can be ruled out and rainwater has a similar
Chapter 6 Water Quality
effect on the entire study area. Therefore, elevated chloride concentrations may be an
indication of sewage contamination or due to agriculture.
Water quality
The Chilean laws on drinking water (Chilean Norm 409) were used as guidelines for
assessing groundwater quality because they are stricter then the laws concerning irrigation
water (Chilean Norm 1.333). All attributes regulated by law are listed in Annex I & II,
along with their acceptable concentration limits.
Electrical Conductivity
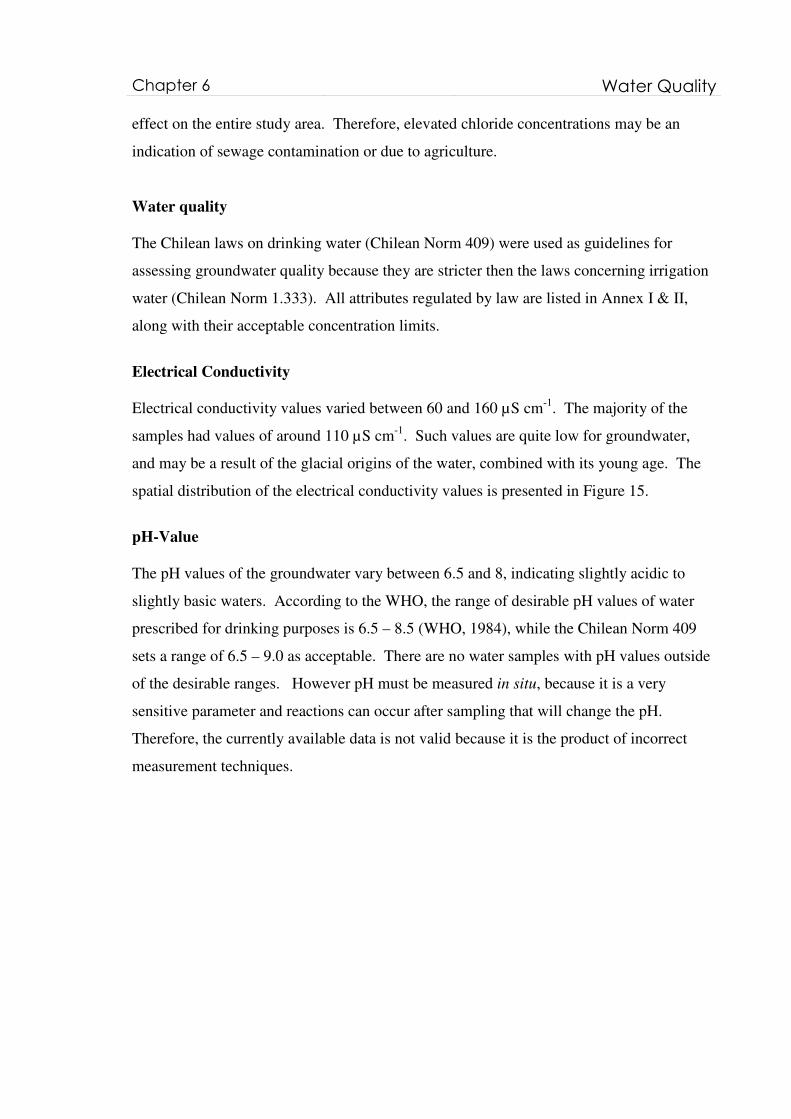
Electrical conductivity values varied between 60 and 160 µS cm-1
. The majority of the
samples had values of around 110 µS cm-1
. Such values are quite low for groundwater,
and may be a result of the glacial origins of the water, combined with its young age. The
spatial distribution of the electrical conductivity values is presented in Figure 15.
pH-Value
The pH values of the groundwater vary between 6.5 and 8, indicating slightly acidic to
slightly basic waters. According to the WHO, the range of desirable pH values of water
prescribed for drinking purposes is 6.5 – 8.5 (WHO, 1984), while the Chilean Norm 409
sets a range of 6.5 – 9.0 as acceptable. There are no water samples with pH values outside
of the desirable ranges. However pH must be measured in situ, because it is a very
sensitive parameter and reactions can occur after sampling that will change the pH.
Therefore, the currently available data is not valid because it is the product of incorrect
measurement techniques.
Chapter 6 Water Quality
Figure 15. Electrical conductivity in µS cm
-1 in the Longaví River Basin.
Redox
Oxidation and reduction (redox) reactions play an important role in the geochemical
processes in groundwater. Redox reactions are defined as reactions in which electrons are
transferred from an electron donor to an electron acceptor, which in groundwater
commonly are minerals, organic matter or inorganic ions. They determine the mobility of
many inorganic compounds, including biologically important elements such as nitrogen
and sulphur. In addition, redox conditions govern the biological degradation of complex
hydrocarbon contaminants.
Chapter 6 Water Quality
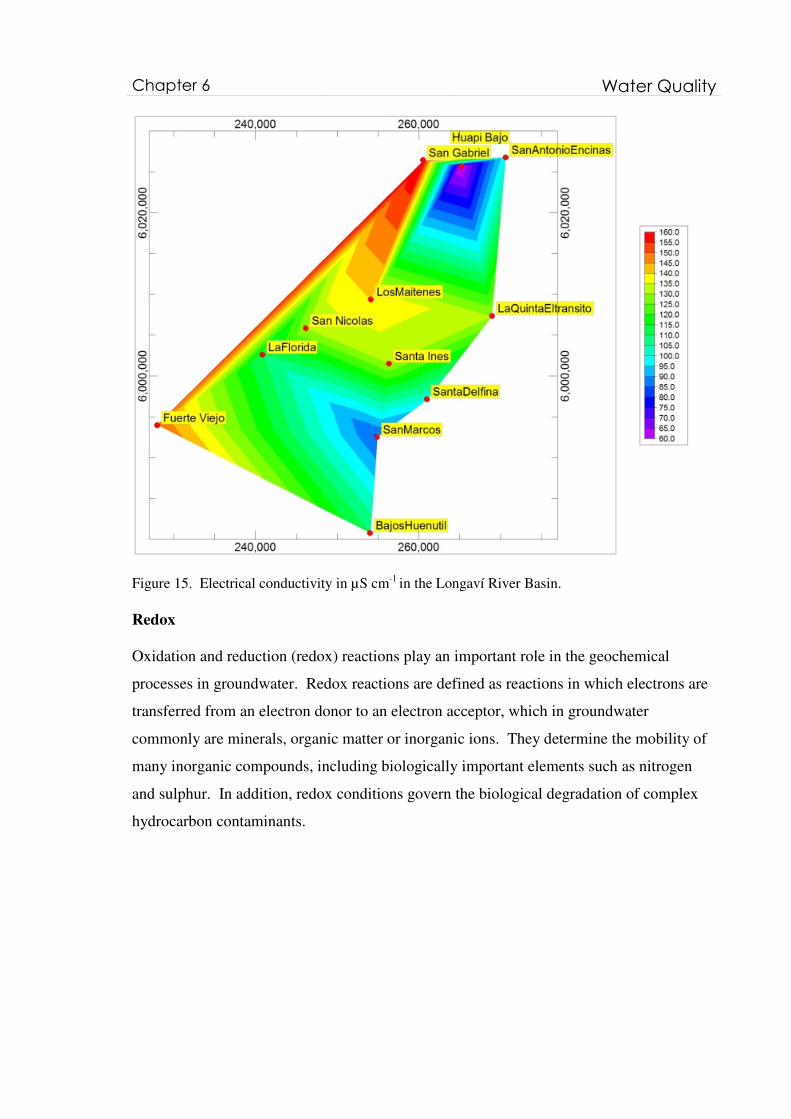
Figure 16. Distribution of iron concentrations [mg L
-1].
Although redox potential is one of the most important parameters needed to determine and
predict chemical processes occurring in groundwater, it cannot be measured directly. The
redox potential of groundwater is usually composed of the redox potentials of various
redox couples. Typically, these redox couples are not in a state of thermodynamic
equilibrium because of:
• the movement of groundwater
• biological activity
• electrochemical reactions at exposed mineral surfaces
• slow reaction rates (some reactions require 10 to 1000 years to reach
equilibrium)
Therefore, the redox potential can be calculated using the relative concentrations and redox
potentials of the most important redox species of a groundwater. Because of the fact that
the available chemical data does not include in situ measurements of dissolved oxygen,
which is the best parameter to determine the redox conditions of a system, iron
concentrations were used instead, as they are always an indication of reducing
environments in natural settings.
Chapter 6 Water Quality
Ideally, iron contents measured in the water samples are Fe2+
, which is the reduced state of
iron. Under natural conditions, oxidized iron (Fe3+
) is not present as a dissolved ion
because it precipitates and forms minerals such as iron carbonate. Even at high
concentrations, iron is not considered a contaminant because it has no negative effect on
the human body. Nevertheless, iron concentrations must be monitored because high
concentrations give an unpleasant taste to water and negatively affect well infrastructure by
clogging and corroding well filters.
The iron concentrations compiled from the well records are presented in Figure 16. The
highest concentration, which was in excess of 3 mg L-1
, was found at the Lomas de Polcura
well, in the eastern part of the study area. The presence of Fe2+
in the water samples
reveals that the aquifer is anoxic in some zones. This is not surprising as natural water
bodies are generally stratified, with an oxic layer lying above a middle zone of
progressively decreasing dissolved oxygen content and a totally anoxic layer at the bottom.
Whether the anoxic conditions reflect the natural situation of the aquifers or are the result
of contamination should be investigated. In order to draw further conclusions about
chemical and biological processes occurring in the ground water, the depth of the interface
between the oxic and anoxic water layers must be determined. This is only possible with a
depth profile of dissolved oxygen concentrations measured in situ.
Nutrients
Nutrient analyses consist of the measurement of the concentration of different forms of
nitrogen and phosphorus in ground and surface water. These compounds are a concern in
surface water because of eutrophication and in drinking water because of human health.
For example, nitrate is known to cause methemoglobinemia (blue-baby syndrome) in
infants. Special attention has been paid to nitrate contamination in the Longaví Basin.
While nitrates can enter ground and surface waters from a variety of sources, the two most
important origins are mineral fertilizer and liquid manure. Ammonia nitrogen, applied to
the surface in the form of fertilizers or leaked into the aquifers and canals from latrines, is
usually converted to nitrate by nitrification (Freeze and Cherry, 1979).
Chapter 6 Water Quality
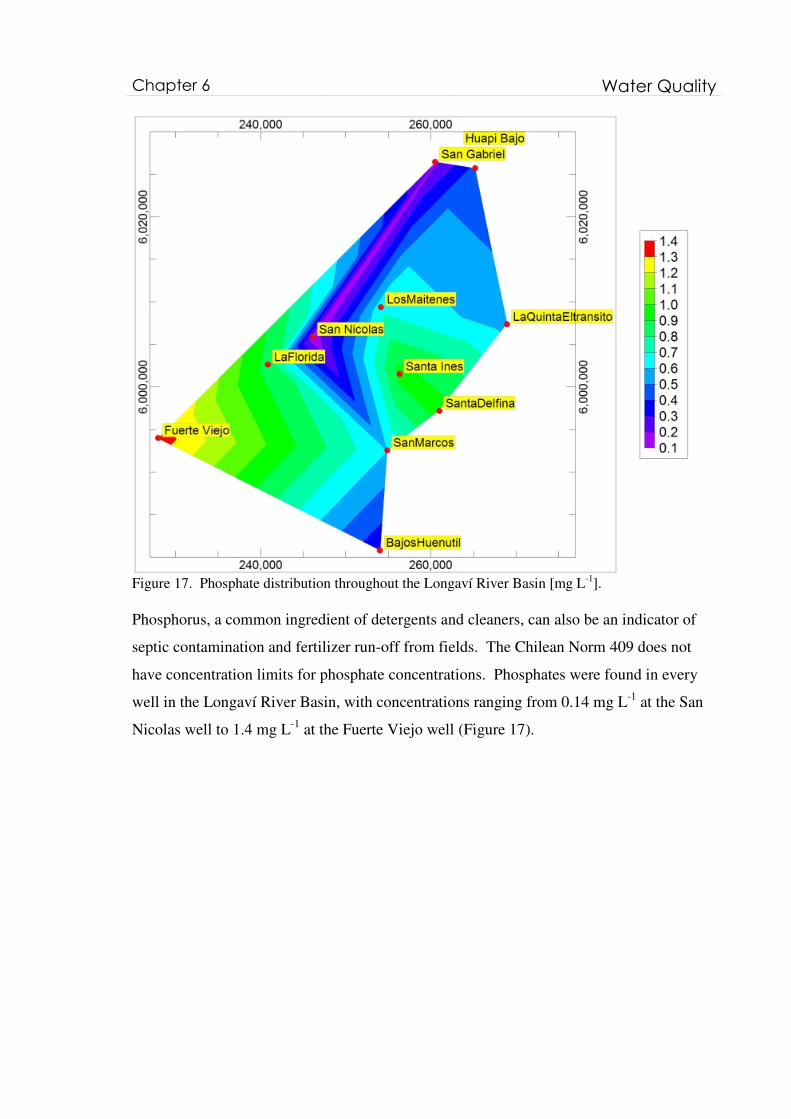
Figure 17. Phosphate distribution throughout the Longaví River Basin [mg L
-1].
Phosphorus, a common ingredient of detergents and cleaners, can also be an indicator of
septic contamination and fertilizer run-off from fields. The Chilean Norm 409 does not
have concentration limits for phosphate concentrations. Phosphates were found in every
well in the Longaví River Basin, with concentrations ranging from 0.14 mg L-1
at the San
Nicolas well to 1.4 mg L-1
at the Fuerte Viejo well (Figure 17).
Chapter 6 Water Quality
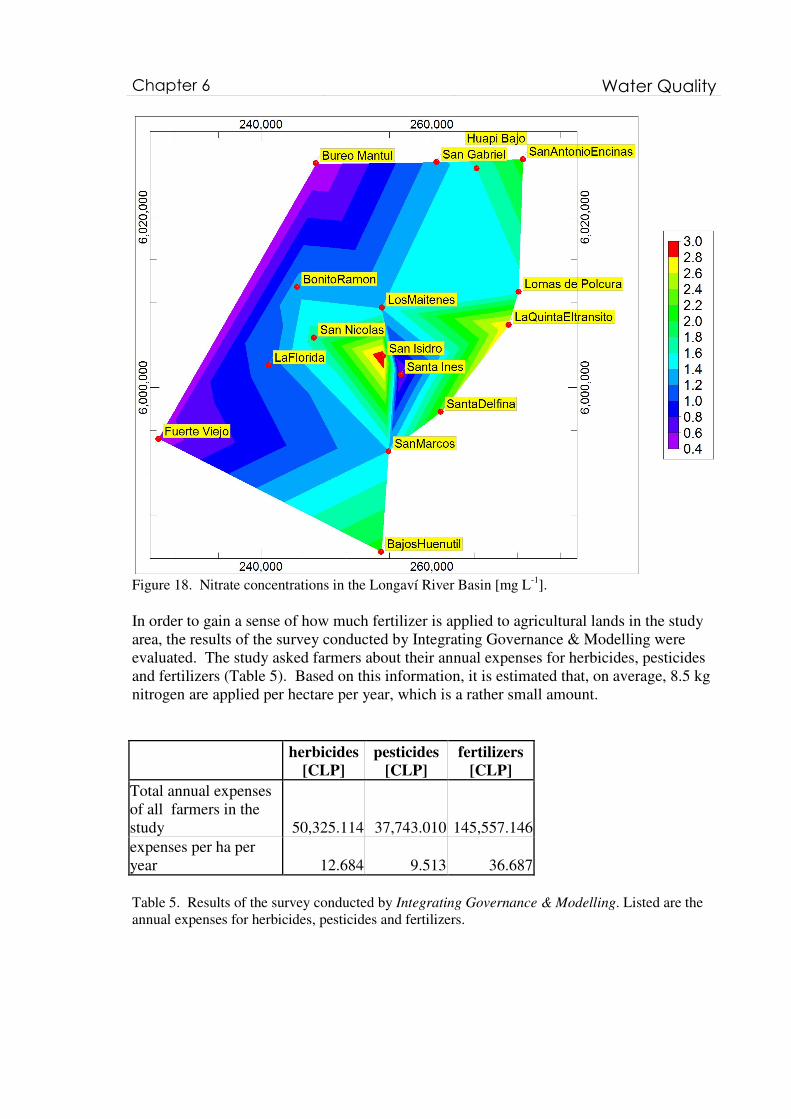
Figure 18. Nitrate concentrations in the Longaví River Basin [mg L
-1].
In order to gain a sense of how much fertilizer is applied to agricultural lands in the study
area, the results of the survey conducted by Integrating Governance & Modelling were
evaluated. The study asked farmers about their annual expenses for herbicides, pesticides
and fertilizers (Table 5). Based on this information, it is estimated that, on average, 8.5 kg
nitrogen are applied per hectare per year, which is a rather small amount.
herbicides
[CLP]
pesticides
[CLP]
fertilizers
[CLP]
Total annual expenses
of all farmers in the
study 50,325.114 37,743.010 145,557.146
expenses per ha per
year 12.684 9.513 36.687
Table 5. Results of the survey conducted by Integrating Governance & Modelling. Listed are the
annual expenses for herbicides, pesticides and fertilizers.
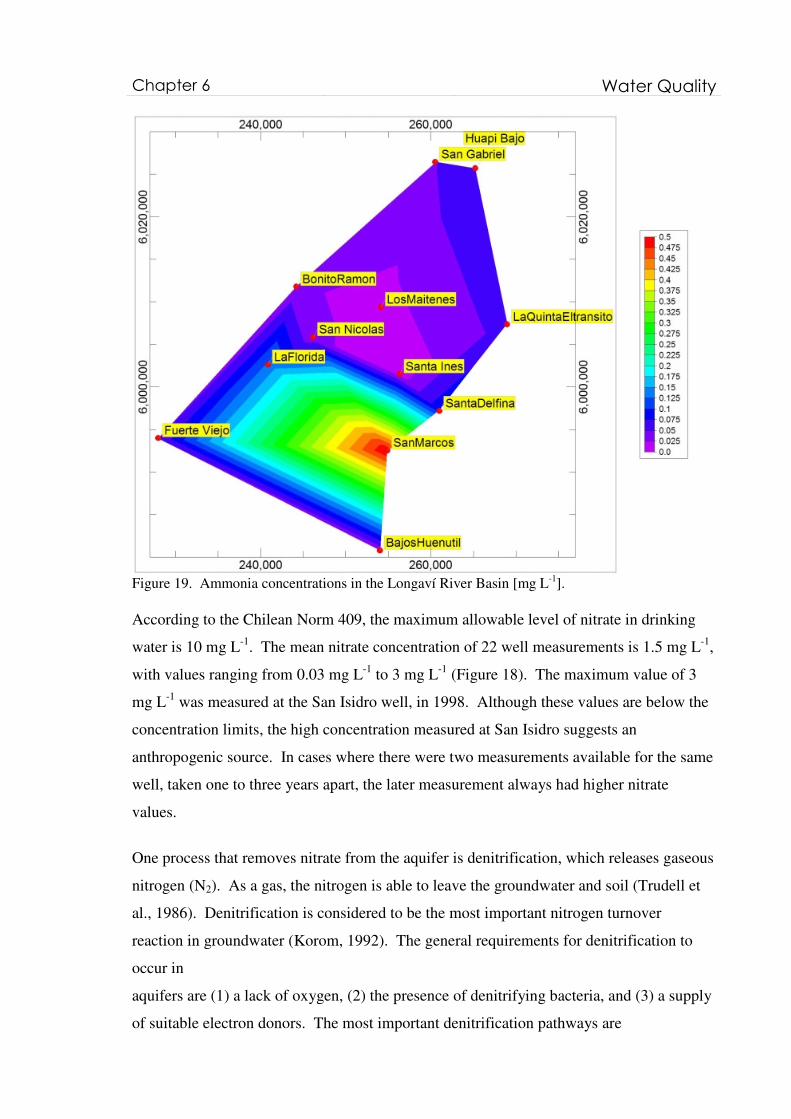
Chapter 6 Water Quality
Figure 19. Ammonia concentrations in the Longaví River Basin [mg L
-1].
According to the Chilean Norm 409, the maximum allowable level of nitrate in drinking
water is 10 mg L-1
. The mean nitrate concentration of 22 well measurements is 1.5 mg L-1
,
with values ranging from 0.03 mg L-1
to 3 mg L-1
(Figure 18). The maximum value of 3
mg L-1
was measured at the San Isidro well, in 1998. Although these values are below the
concentration limits, the high concentration measured at San Isidro suggests an
anthropogenic source. In cases where there were two measurements available for the same
well, taken one to three years apart, the later measurement always had higher nitrate
values.
One process that removes nitrate from the aquifer is denitrification, which releases gaseous
nitrogen (N2). As a gas, the nitrogen is able to leave the groundwater and soil (Trudell et
al., 1986). Denitrification is considered to be the most important nitrogen turnover
reaction in groundwater (Korom, 1992). The general requirements for denitrification to
occur in
aquifers are (1) a lack of oxygen, (2) the presence of denitrifying bacteria, and (3) a supply
of suitable electron donors. The most important denitrification pathways are
Chapter 6 Water Quality
(1) organo-heterotrophic denitrification:
5CH2O + 4NO3- ⇒ 2N2 + 4HCO3
- + CO2 + 3H2O,
where organic substances serve as electron donors, and
(2) litho-autotrophic denitrification:
5FeS2 + 15NO3- + 5H2O ⇒ 7.5N2 + 5FeOOH + 10SO4
2- + 5H
+,
where pyrite (FeS2) is the most common source of reduced sulphur (Kölle, et al., 1983).
Unfortunately, there is currently no data available regarding the occurrence of pyrite within
aquifer sediments, nor about the amount of total organic carbon (TOC) in the groundwater.
Nevertheless, lacustrine sediments, as described in the Fan of Pyroclastic, can contain
pyrite and the occurrence of bacteria in the groundwater (see Chapter 6.10) is an indication
of organic contamination, which suggests that organic carbon is present. Therefore, it is
very probable that both of the above mentioned degradation processes occur in the study
area, even though this cannot be proven with the available data.
Oxygen is always preferred over nitrate for the degradation of organic carbon; thus,
aerobic conditions limit the denitrification reaction. Only after all oxygen has been
consumed, will nitrate act as the electron acceptor. Together, the sequential oxidation of
pyrite and organic matter and groundwater flow leads to a distinct zonation of
hydrogeochemical conditions within an aquifer. As discussed by Postma et al. (1991), the
degree of zonation is dependent on rates of reactions, the amounts of reactive substances
present and the characteristics of the groundwater flow.
The data suggests that there was no nitrate or phosphate contamination of groundwater
when the wells were drilled between 1996 and 2001. However, low nutrient values can
also be the result of effective degradation processes and these processes can suddenly stop
due to a change in the redox environment or a lack of suitable electron donors.
Furthermore, there is no information about the current situation. It is assumed that within
the last years the nitrate load has increased significantly and that this process will continue.
To predict nitrate load in the future, the following data is needed:
• in situ depth profiles of oxygen concentration
Chapter 6 Water Quality
• pyrite occurrence in the sediments
• TOC concentrations in the groundwater
• better quantification of fertilizer use
Heavy Metals and Detergents
All water samples were scentless and insipid. Cadmium and mercury were not detected in
any of the samples. Arsenic was observed in one sample, from the La Florida well, at a
low concentration of 2 µg L-1
. The maximum chrome concentration found was 5 times
lower than the maximum acceptable limit of 50 µg L-1
. Half of the samples contained
copper, ranging in concentration from 2 up to 30 µg L-1
. Zinc was found in almost all the
samples; the highest concentration, 760 µg L-1
, was measured in the Santa Ines well.
(Appendix IV).
Detergents were found at low concentrations in two samples, Bureo Mantul and San
Antonio Encinas (Appendix IV).
Pesticides and Herbicides
No data was obtained about the occurrence or concentrations of pesticides and herbicides
in the groundwater of the study area. However, the area is primarily an agricultural region
and therefore it is probable that pesticides and herbicides are present in the groundwater.
Analyses should be carried out to measure the presence and concentration of pesticides and
metabolites. As there are a wide variety of herbicides and pesticides available on the
market several criteria can be used to select the particular substances that are to be
monitored. They include the following:
• degradation pathway and associated rates
• rate of application in the study area
• extent of time the substance has been in use
• water solubility
Metabolites that are known or suspected of being very stable under the chemical conditions
existent in the groundwater of the area should also be monitored.
Biological studies as a proxy for faecal groundwater pollution
Bacteriological content is one of the most important aspects of drinking and irrigation
water quality because the most common and widespread health risks associated with
Chapter 6 Water Quality
drinking water are the bacterial contaminations resulting either directly or indirectly from
human or animal excreta. Diarrhoea, cramps, nausea and vomiting are some of the health
problems caused by contamination. There are a variety of bacteria, parasites, and viruses
which can cause immediate health problems when ingested by humans through drinking
water. Testing for each of these agents is difficult and expensive. Therefore, total
coliform levels are measured. Although coliforms are a group of bacteria, most of which
are harmless, the presence of any coliform bacteria in water suggests that there may be
disease-causing agents in the water. Total coliform bacteria may occur naturally in soils or
may be the result of human or animal waste. Escherichia coli (E. coli), a typical faecal
coliform, is selected as an indicator for faecal contamination. Wild and domestic animals
might contribute faecal coliforms to surface waters.
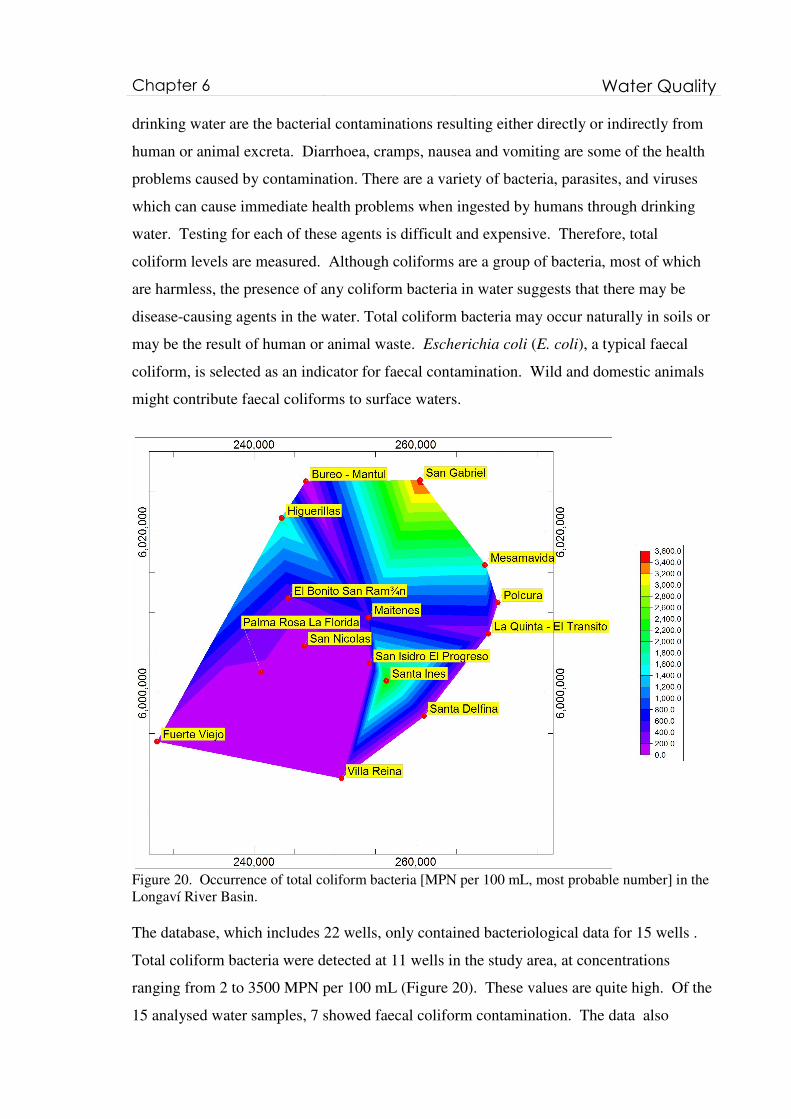
Figure 20. Occurrence of total coliform bacteria [MPN per 100 mL, most probable number] in the
Longaví River Basin.
The database, which includes 22 wells, only contained bacteriological data for 15 wells .
Total coliform bacteria were detected at 11 wells in the study area, at concentrations
ranging from 2 to 3500 MPN per 100 mL (Figure 20). These values are quite high. Of the
15 analysed water samples, 7 showed faecal coliform contamination. The data also
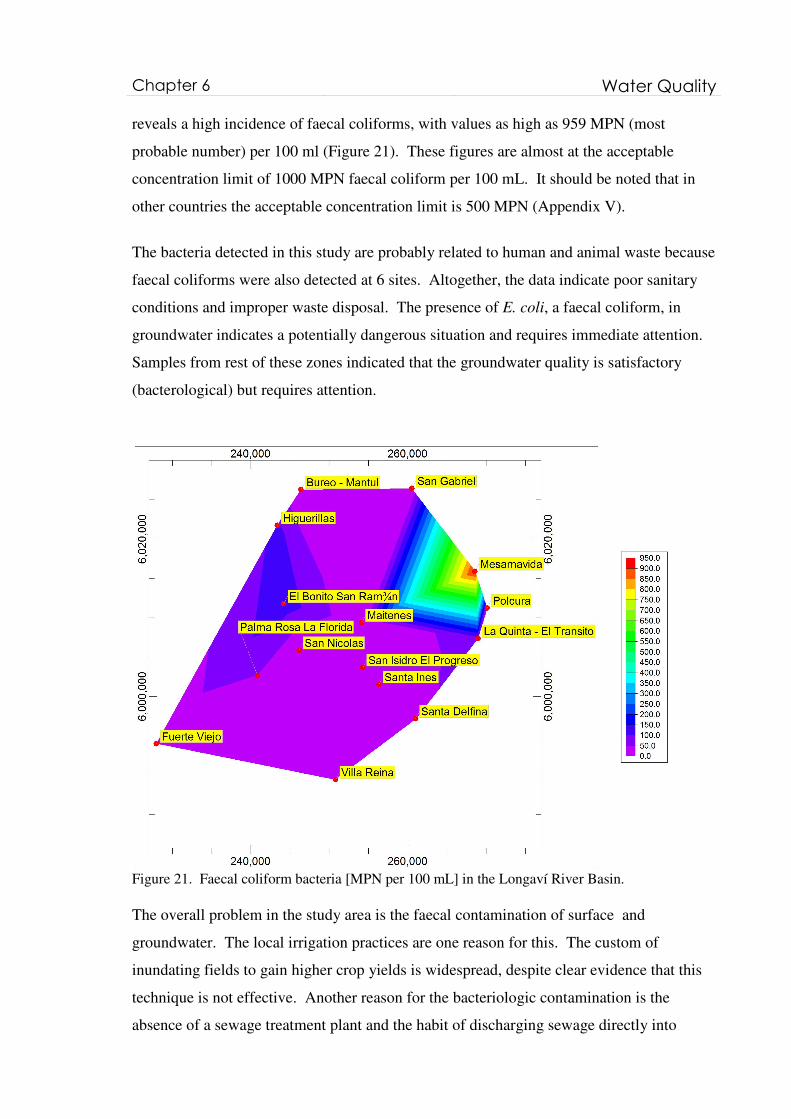
Chapter 6 Water Quality
reveals a high incidence of faecal coliforms, with values as high as 959 MPN (most
probable number) per 100 ml (Figure 21). These figures are almost at the acceptable
concentration limit of 1000 MPN faecal coliform per 100 mL. It should be noted that in
other countries the acceptable concentration limit is 500 MPN (Appendix V).
The bacteria detected in this study are probably related to human and animal waste because
faecal coliforms were also detected at 6 sites. Altogether, the data indicate poor sanitary
conditions and improper waste disposal. The presence of E. coli, a faecal coliform, in
groundwater indicates a potentially dangerous situation and requires immediate attention.
Samples from rest of these zones indicated that the groundwater quality is satisfactory
(bacterological) but requires attention.
Figure 21. Faecal coliform bacteria [MPN per 100 mL] in the Longaví River Basin.
The overall problem in the study area is the faecal contamination of surface and
groundwater. The local irrigation practices are one reason for this. The custom of
inundating fields to gain higher crop yields is widespread, despite clear evidence that this
technique is not effective. Another reason for the bacteriologic contamination is the
absence of a sewage treatment plant and the habit of discharging sewage directly into
Chapter 6 Water Quality
surface waters. During heavy rainfalls, which are common in this area during harvest and
wintertime, badly- or unsealed cloacae spill faecal matter, which spreads on the ground's
surface and is washed into surface waters. Most homes in the area are not connected to
sanitary sewage systems and are therefore a probable widespread source of groundwater
contamination.
Analyses of groundwater samples from the study area indicate that more than 50 % of the
wells showed a significant number of total coliform bacteria. This highlights the need for a
sustainable utilization and management of water resources. More attention and proper
sanitation and waste disposal systems are needed to maintain the quality of groundwater of
the Longaví River Basin.


![cations Supporting information anions and organic · Supporting information Efficient modulation of photoluminescence by hydrogen bonding interactions among inorganic [MnBr4]2-anions](https://img.pdfslide.net/doc/110x75/5f8c419e2fd7220f220cd9f4/cations-supporting-information-anions-and-supporting-information-efficient-modulation.jpg)