Embed Size (px)
Citation preview

* *
* *
* C H A P T E R N O . 7 . *
* AN ANALYTICAL STUDY OF THE * * *
* ACCOUNTS (STUDY YEAR 1 9 9 0 ) . * •X *

121
C H A P T E R - 7.
An Analytical Study of The Accounts
(Study Year 1990)
The year 1990 is taken for analytical study of
the accounts of the Public Distribution System accounts of
the Akola district. In this chapter the cost of the
essential commodities supplied through the public
districtuion system is taken. The variation from January
to December is comparitively studied and an average cost
is derived from it. The total supply of the all the
commodities and its cost is also tharoughty analysed in
relation to the turnover of the commodities in every month
of the every year. The total cost payment of all the
commodities is studied comparatively with every item. In
the content of other items payment of each item is in the
form of cash payment by cheque, partical payment is
studied thoroughly and its accounting is taken for study.
The accounts system is then examined analytically and
critically to asses the soundness of the system.
The audit reports of the essential commodities
by the public distribution system authority is taken for
analytical study and on the basis of its analysis the
variation of the public distribution system is tested.
Finally the turnover in money, goods, labour is
comparitively and individually in detail. This chapter
will enlighten the economic process and its accounting,
auditing and it willprove the viability of the public
distribution system.
122
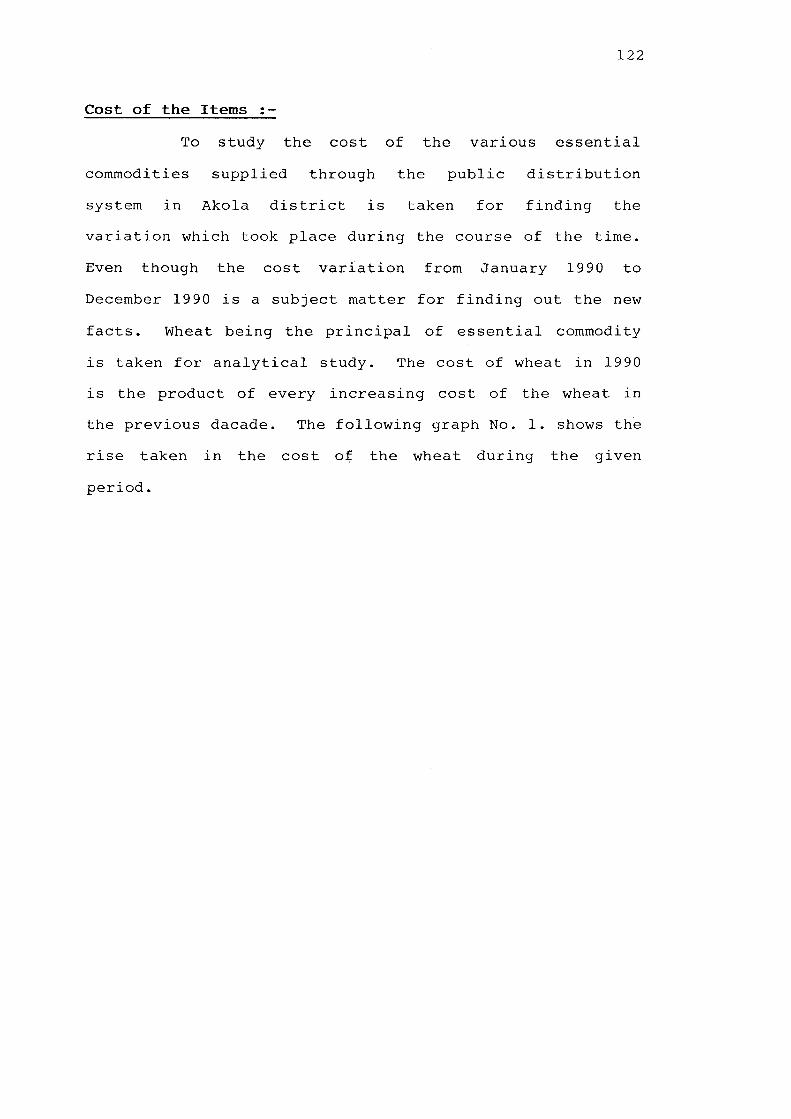
Cost of the Items :-
To study the cost of the various essential
commodities supplied through the public distribution
system in Akola district is taken for finding the
variation which took place during the course of the time.
Even though the cost variation from January 1990 to
December 1990 is a subject matter for finding out the new
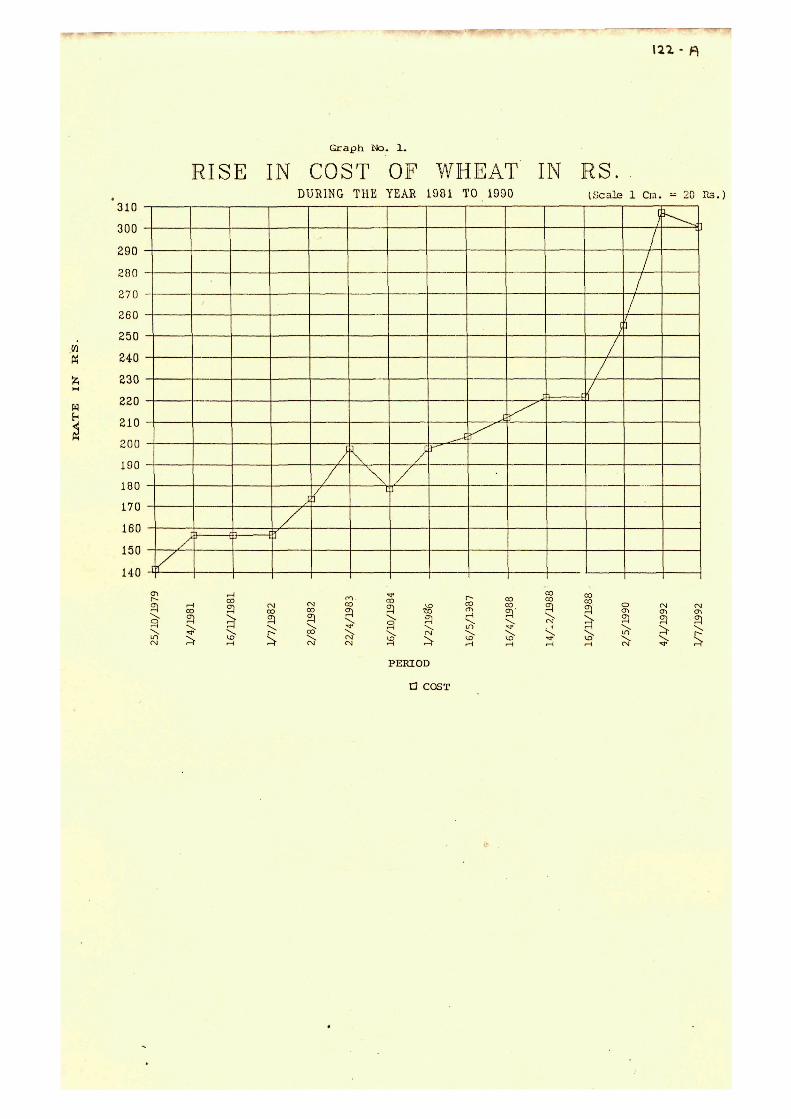
facts. Wheat being the principal of essential commodity
is taken for analytical study. The cost of wheat in 1990
is the product of every increasing cost of the wheat in
the previous dacade. The following graph No. 1. shows the
rise taken in the cost of the wheat during the given
period.
\2^^ R
Graph Ho. 1.
310
300
290
280
270
260
250
240
230
220
210
200
190
180
170
160
150
140
RISE IN COST OF WHEAT IN RS DURING THE YEAR 1981 TO 1990 UScalfi 1 Cw. 20 R3.)
/
/
^
/ J'
, /
/ /
V \
t
A /
1
^ - f
r"
i 1 F
ir"
^ " ^ • f 1
1
CO
Tj-
>
^ ^ \> rA
CO CO
9 2̂ 9
M
\ "^
9 \ f N
;>
PERIOD
a COST
9' 9

123
During 1990 the total cost of wheat supplied in
the Akola district was 8,23,750 lakhs. This amount was
send to the Divisional Headquarter.
District authorities of the Akola district
supplied the rice costing Rs. 19,33,750 to the fair price
shops of the Akola district.
The consumers of the Akold district purchased
Jowar from the Fair Price Shops of the Akola district
costing Rs. 53,64,000/- only.
The sugar supplied by the District Public
Distribution on System to the ration card holders of the
district amounts to Rs. 82,37,250/- only.
The cost of the edible oil supplied through the
Public Distribution System was worth of 2,49,78,480/- Rs.
only.
The total cost of the supplied wheat by the
District Public Distribution System authority in 1990 was
Eighty two billion four hundred sixty three million three
hundred thirteen thousand four hundred eighty only in
number that is 82,46,33,13,480/- Rs. only.
In 1981 the cost of the wheat stabilised at the
cost of rupees 156.70 per quintal. In the year 1982 the
rise in the cost of wheat was Rs. 164 per quintal. Again
the cost was increased by Rs. 24.20 per quintal in 1983 to
1984. The cost of wheat per quintal decreased by 19.30.
In 1986 again the cost of wheat stabiised at Rs. 187.70 per
quintal.

124
On 1st. May 1987 the cost of wheat crosed
Rs. 200/- mark and it continously increased thereafter that
is 202 to 221 and then in 1990 it stabilised at Rs. 254.80
per quintal. Table No. 27. gives the cost of the wheat
since 1979 to 1992.
Table No. 27.
The cost of the Wheat in Rupees.
Sr.No. Date & Year
1) 25 October 1979
2) 1 April 1981
3) 16 November 1981
4) 1 July 1982
5) 1 August 1982
6) 22 April 1983
7) 16 October 1984
8) 1 February 1986
9) 1 May 1987
10) 16 February 1988
11) 1 April 1988
12) 16 December 1988
13) 2 May 1990
14) 4 January 1992
15) 1 July 1992
In -godown issue rate in Quintal
141.10
156.70
156.70
157.10
173.50
197.70
178.40
197.70
202.40
212.10
221.70
221.80
254.80
306.60
300.40
Retail rate per kilo
1.45
1.61
1.62
1.63
1.80
2.05
1.85
2.05
2.10
2.20
2.30
2.35
2.70
3.25
3.25

125
From the above table it became very clear that
on 1st. April 1981 to 2nd. May 1990 the cost of the wheat
increased from Rs. 156 to 264 per quintal the difference in
the cost of wheat per quintalwas Rs. 98. Which is 60% of
the cost of the wheat in 1981.
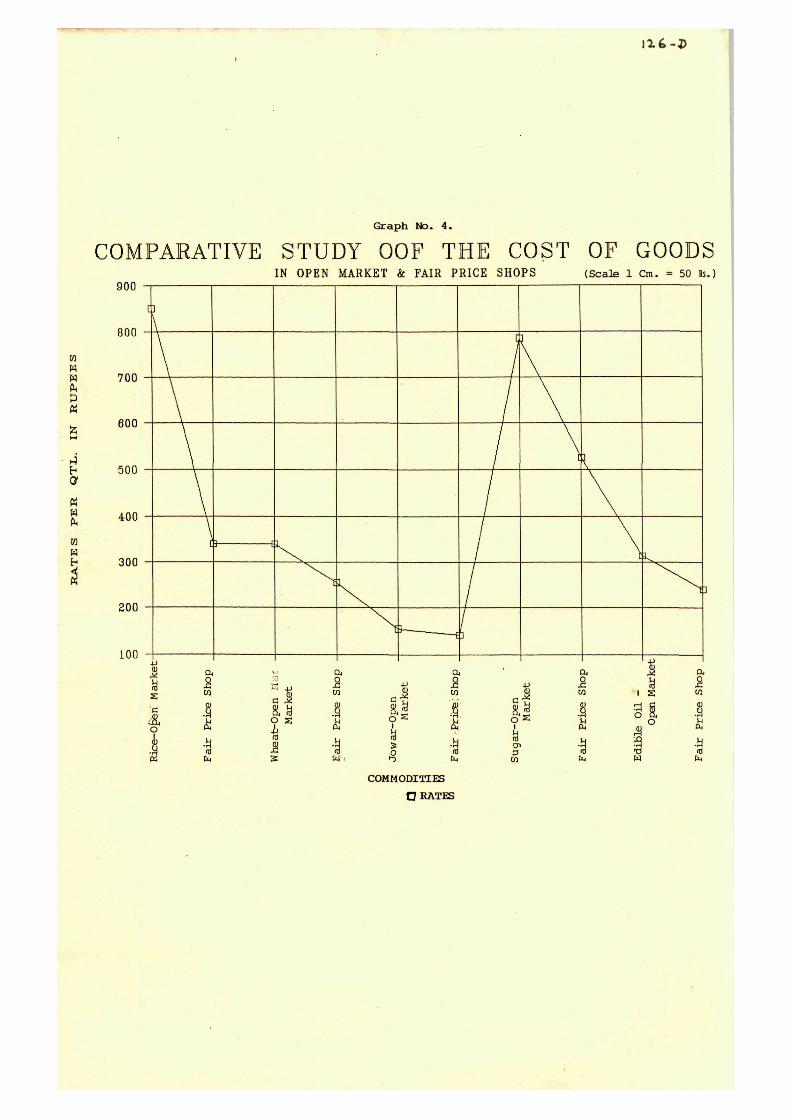
The rate of opened market for the essential
commodities are given in the table No. 28 and than
presented in the graph No. 2. And the cost of the
essential commodities in the Fair Price Shops as on 3rd
August 1990 is given in the graph No. 3.

las-B
G r a p h No. 2 .
OPEN MARKET RATES OF
w N N h P
« N
A.
M
100 -
\
ESSENTIAL COMMODITIES A3
[ ^ _ , •( \
\ >
- -
ON 0 3 / 0 0 / 9 0
r--^'\
(Sca le 1 Cm.=
\1 \
1 k .
50 Rs.)
A
If
•XJ (0 E n) ta
c c x: u
•̂ 3 J
•ij
w
c (0
>
„H
c rd > i
r~\
(0 ^ J > a1
a! K
COMMODITIES
<D •r) la n o
I ;,! o 1 ^
a KATli
c ni Vl
O m o
• ' ; 1 o

I I S - C
Graph No. 3 .
RATES OF ESSENTIAL COMMODITIES IN
w
» ft, P
a «
w
550
500
450
400
350
300
250
200
a
FAIR PRICE SHOP AS ON 0 3 / 0 8 / 9 0 (Sacalfi 1 Cm.= 50 Rs.)
e 3
QJ
s
3 CO
.̂ ?i s
rH D «
IS
y ? • S tn 0 i-i
en 3 (Q
•g 1 *H "o H

126
Table No. 28.
Open Market rate of the essential commodity on 3-8-90.
Sr.-No.
Item Wholesale rate per Quintal
Retail rate Kilogram.
1) Rice
a) Basmati
b) Chinner
c) Luchi
2) Wheat
a) Sarbeti
b) Lokwan
c) Kalyan
3) Jowar
a) Hybreed
b) Govran
4 ) Bajari.
a)
5) Ghana - Dal
6) Tur - Dal
7) Udidh - Dal
8) Sugar
9) Gur
a) Gaoran
b) Ankapalli
10) Groundnut oil
11) Musterd oil
12) Refined oil
830-850 9.00
600 7.00
425-430 5.00
330-340 3.50
310-320 3.30
290-315 3.25
140-155
170-200
175-185
965
1110-1250
750-800
775-785
1.55 - 1.65
1.90 - 2.15
2.00
10.50
12.50 - 13.50
9.00 - 9.50
8.00
450-500
625
314
275
268
5.00 -
6.50 -
34.00
28.00
27.00
- 5.50
- 7.00
n^-j>
Graph No. 4.
COMPARATIVE STUDY OOF THE COST OF GOODS
m
P
n H
900
800
700
600
500
400
IS s :c o
& CO
a,
•U fd
IN OPEN MARKET & FAIR PRICE SHOPS
o s i Id
a,
(1)
* -a 0 "' 1^ bi
COMMODITIES
ORATES
J en P
(Scale 1 Cm. = 50 Rs.)
a, en
(1)
« pi.
o
.51
s tn o

127
2. 3.
13) Karadi oil
14) Vanaspati (15 Kg.)
15) Tea
16) Salt
17) Onion
18) Potatoes
19) Dry chilly
20) Washing Soap
200
560
900
72-
180
190
1150
38
•75
28.00
37.00
58.00 -
1.00
2.50 -
3.00
12.00
3.50
- 60.00
- 3.00
The consumer of the Fair Price Shop had to pay
lesser amount for essential commodities than the consumer
of openmarket, but the quality of goods differs. The
Fair Price Shops consumer received inferior quality of
goods.
The comparision between the cost given in Graph
No. 2. and Graph No. 3 is given for easy understanding.
In Graph No. 4 to distinguish them qualitabively
quantatively.

128
Total Supply and Cost :-
The supply of essential commodities through
Public Distribution System is not constant. To study the
variation in the supply of the essential commodities, the
supply of wheat, rice, sugar and edible oil are taken and
studied. Since 1986 to 1990. The supply of wheat and
rice in 1986 to 1990 is given in the Graph No. 5 likev/ise
the supply of sugar, edible oil is given in the following
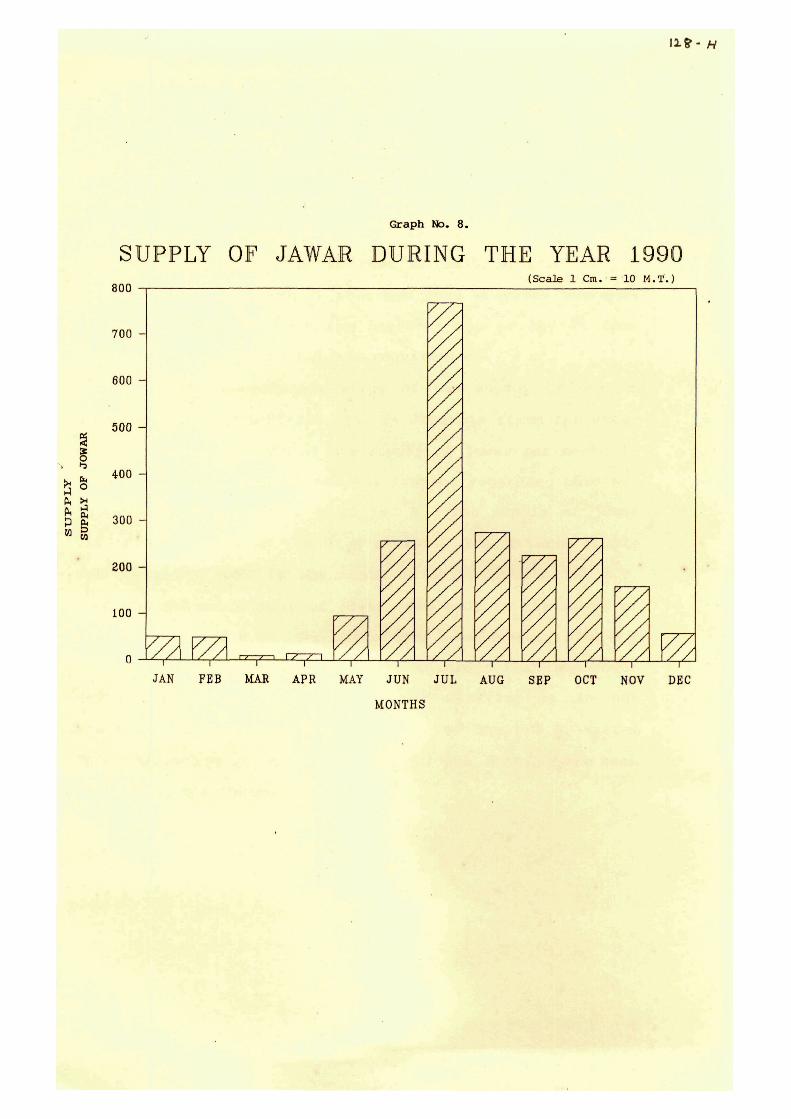
Graph No. 6 and Graph No. 7 to study the fluctuation month
wise, the supply of Jowar in the months of 1990 is taken
and presented in the Graph No. 8.

128- £
2„
m
1-1 0 A, A A* H
w
Graph No. 5 .
SUPPLY OF WHEAT AND RICE
4-5
40 -
3b -
30 -
25 -
20 -
15 -
10 -
5 -
n 1
^
-X^ 1
/ /
V
DURING
y//
/ / /
1
r 1986 TO 1990
1 1
/ .
(Scale 1 Cm. = 1000 M.T.)
V^ 1 1
/ / /
1
^
y/^ 1
1986 1986
1̂ i
1987 1987
s
1988 1988 1989
1̂'
1989
1̂
1990 1990
s
COMMODITIES

»28-F
>̂ 0
D ^
to
Graph No. 6.
SUPPLY OF SUGAR DURING 1986 TO 1990 (Scale 1 Cm. = 1000 M.T.)
120 -
HO -1
100 -
90 -
80 -
70 -
60 -
50 -
40 -
30 -
20 -
10 -
0 -
gg%
s /vy/z^ /vy/v /y^yx" 'V////
/M
^
/ / /
• / /
VA
4̂
VA / / /
< ^
y///A
/ / / / / /
V///A
S / y y ^ /v//^ /vyyy 'VV///
W/. 1986. 1987. 1988
YEARS
1989. 1990.

i2«-Q
Graph No. 7 .
SUPPLY OF EDIBLE OIL
H
i i h O
0< B< D CO
O K O.D
3 -
2.5 -
2 -
1.5 -
1 -
0.5 -
n u
/ ^
^
/ y / /
/ / /
vyy w,
/ /
DURING 1986 TO 1990
' / / / / /
/ / "^ / /
y ^ V////
1
/ / /
(Sca l e 1 Citi
/ / / /
w / / / /
1
^
= 1000 M
//A
\
.T.)
/ /
V/ 1986 1987 1988 1990
YEARS
I1&- H
G r a p h No. 8 .
SUPPLY OF JAWAR DURING THE YEAR 1990
g
800
700 -
600
500 -
400
300
200 -
100 -
(Sca l e 1 Cm. = 10 M.T. )
I ^ y I \ y / \ j ^ 1 I p I I I p . — J . . — . — . - ^ — p — • • • |- •—-^-t—•—"—r
JAN FEB MAR APR MAY JUN JUL AUG SEP OCT NOV DEC
MONTHS

129 The comparative study of the edible oil supplied
from 1986 to 1990 is given in graph No. 9 from the study
of graph No. 9 maximum metric tones of oil was supplied in
1986 and minimum quantity was supllied by in 1990. The
difference between them is that of 1821 M.T. of edible
oil. This figure reveals thetruth that whenever there is
a short supply of wheat the customer has to buy it from
the open market to fulfil his requirement.
The comparative study of the supply of one of
the essential commodities that is Jowar is taken for study
to find out varitions in the supply of jowar per month in
the year 1990. The statistical figures regarding this are
given in the following graph No. 9. The supply of jowar
is totally based on the crop season. The maximum supply
of jowar was made in the month of July that is 768 M.T.
and the minimum supply of jowar was made in the month of
March that is 8 M.T. The difference between two 13760 M.T
This fluctuations makes it clear that the jowar
even though the main crop of the district it is not
comsumed evenly throughout the year and the P.D.S. system
also doesn't give any importance to the continueous even
supply to the customer.

130
By analysing graph No. 10 the researcher finds
out the following facts that is the supply of rise varies
from year to year. It was maximum in 1989 and minimum in
1990, the difference between them was of 6450 M.T. This
shows that the supply of rise is not made as per the
requirement of the cardholder but it is based on the
availability of the rice with the Food Corporation of
India.
Wheat is the most essential commodity to be
supplied to the customers of Fair Price Shop. But even in
this commidity the variation in its supply astonishes the
researcher.
In the year 1987 the supply was 40500 M.T. to
the supply of 21475 M.T. in 1986. The difference in these
two is 19,025 M.T. the difference in the supply of wheat
shows that the customer of Fair Price Shop can not depend
on them for the supply of wheat as such he will have by it
whenever it is not available in the Fair Price shop from
the open market.
The supply of sugar is made from the levy and
the sugar acquired from the open market. The variation in
the supply of sugar from year to year. The maximum suply
was made in 1986 that is 1,13,878 M.T. and the minumum
supply was made in 1990 that is 1,07,500 M.T. The
difference between them is that of 6,378 M.T. The
comparision can be easily understood by stating graph No.10
9'

/ 3 6 - 1
M 0
Graph No. 9.
TOTAL COST OF SUPPLIED WHEAT,JAWAR, SUGAR,EDIBLE OIL & RICE IN 1990 (Scale 1 Cm.= 10,00,000 Rs.)
yu
80 -
70 -
60 -
50 -
40 -
30 -
20 -
10 -
0 - / / / / / / \ V7
/ / /
' ̂
VA
v/ A
///
V/
• / /
^ VA
4^ JAWAR SUGAR RICE
COMMODITIES
EDIBLE OIL WHEAT

131
System of Payment :-
Once the cost of the item is decided by the
government, the purchaser has to pay the cost of the total
commodity in the prescribed proformas or in the given mode
of payment. The supply of commodities and its payments is
as per the chart given below:-
Chart No. 17.
Supply of Commodities and it' s Payments.
Purchases from Food Corporation
of India
CENTRAL GOVERNMENT
STATE GOVERNMENT
cultivators &
from open
Market.
M CD •H +j •H
o
o o
o
a a, CO
DIVISION
DISTRICT
TREASURY
Bo
n tr (D a ^T* en
e°
n H QJ H i r t cn
riff h 0 C
i£3
rr n or
I—' OJ 3 cn
*x) OJ
<̂ 3 ro 3 r t
!_,. 3
n OJ 0) 3-
TEHSIL
CARD HOLDER Jc • Jr • o •
CUSTOMER
132
The above chart indicates that the supply of
goods is from top to bottom and its payment is always from
bottom to top.
The payments of the item are payed differently
at the different levels as shows in the chart No.-17.
the Fair Price Shops card-holder is a customer
and hepays in cash what so ever he buys form the related
Fair Price Shops as per the cost fixed by the Government
from time to time.
The authorised Fair Price Shop owners purchased
their commodity at a given rate through chalan from the
Food Corporation of India. The cost given in the chalan
is to be paid in cash in the treasury, Akola. There after
it is official transaction of payment up to the top.
Sometimes the payment is made through drafts or cheques.
The daily transactions of the payments of the commodityat
treasury level is maintained. The treasury submits the
cash and accounts to the divisional headquarters of the
Amravati division on fortnightly. The division submits
the accounts and payment officially to the state
Government on the monthly bases. The state Government
makes money from other transactions related to it on
fiscal bases. At the Government level that is Central
Government and state Government makes the payment to the
food corporation of India in cash. Likewise the payment
from bottom to top is carried out regularly.

133
Accounting system ;-
The accounting in Public Distribution System
scheme is done as per Food Manual of the Government of
Maharashtra. For this purpose there is an accounts branch
in the District supply office headed by a senior
accountant who belongs to Maharashtrsa. Finance & Accounts
service of Government of Maharashtra.
Accounting under Public Distribution System is
commerical nature and double entry book keeping. There
are prescribed register as per Food Manual such as in
Daybook, cashbook, FLA II, PLA 'g' classified abstract
registers etc. The entries in these registers are based
on the monthly prescribed returns received from the
Government on the monthly prescribed returns received from
the Government godowns through Tahasildar of the district
and also the figures which are shown in the monthly
returns in monthly returns by the Tehsildar dully rec
onciled with the order and treasury Personal Led(-.er
Accounts passbook etnd initial transaction maintained by
the accounts branch of District Supply Office.
All the transaction under Public Distribution
System should have the double effect so that ary mistake
of mioclassif ication or omni&:(;ri is noticed j rnmodiately,
under double entry book keeping accountinc^ is divicec: ; r:
four parts such as Persons] Account, Ecal Account,
Mominator Fictitious Account, Goods Account, Credit Account
Asset Account, Liability Account, Capital-Account.

134
(a) There is a personal ledger account in the name
of collector which is controlled by the treasury of
Accountant General.
(b) There are two type of payment, one is direct payment
to party and another is drawn self by District Supply
Office and then paid to party in another district.
(c) Drawl from Personal Ledger Accounts,'Government Capital
Account' is only by issuing Personal Ledger Accounts
cheques to treasury for payment.
(d) If a cheque drawn by District Supply Office for
payment of telephone, electricity, water bills to
Tehsildar or transport and labour contract or of
supplier of the district Akola and the cheque is
issued and the receipt is acquired, the amount is
entered in the cash book of District supply Officer.
The purpose of issuing cheque is mentioned. The
account of cost of the foodgrains required to be paid
to the Food Corporation of India or other
district suppliers is specified. Then District
Supply Office has to draw the cheque on self account
the Demand draft is issued to the cerncerned party.
Then all the entries regarding the payment is filled
in the accounts book. Straight and horizental
totalling art is carried out for the cross checking
and then entries in the cashbook and ledger are
totalled again for verification. This is called
cross checking.
135
The District Supply Office has to submit
monthly and yearly account to the financial advisor and
deputy secretary, Food and civil supplies department of
government of Maharashtra. In the form of dully
undersigned by District Supply Office, Akola.
1) Store and stock account.
2) Cash Account.
3) Caomplied Account.
4) Suspense Account.
5) Profit and Loss Account.
Once the District Supply Office, Akola submits
all the accounts to the higher authorities and receive
its receipt. Accounting procedure at district level is
complete.
Auditing :-
Mere scruting of bills at the time of payment
is not an audit. Therefore the audit of District Supply
Office transaction is done by the Audit party of Finance
Advisor & District Supply Officer, Bombay. Audit party
from Finance Advisor and Deputy Secretary and Accounts
General has performed the yearly audit of District
Supply Officer's account periodically on percentage
basis as possed audit by selecting one month's
transaction.
The audit party has to see and judge whether
the claimants are genuine or not whether the District
Supply Office is competant for sanctioning claims which
deal with the withdrawl of the amount whether the

136
withdrawl is propered that is or ruled and prescribed is
fully observed or not whether the payment has been paid
properly, whether accounting has been done as per the
rules and whether receipt acknowledgement are proper or
not. Then further recounting of all the accounts is
verified. The audit party then certifies it with the
auditing certificate signed by the Chief Auditor. And
thus the auditing procedure is complete.
If certain drawbacks are found while auditing,
then the auditor follows the following procedure :-
As per audit objection and observation, the
mistakes shall be complied by taking suitable action as
per rule and order. For example :-
If some of the money transactions made are
more than that of financial power of the District Supply
Office or Collector, that transaction is required,
retrospective sanction from higher and compitent
authority. Over payment will be recovered from the
receiptents.
The audit party prepare the audit report far
the concerned period. Then the audit report is issued
by the District Supply Office under the signature of
Accounts Officer of Finance Advisor and Deputy
Secretary, Bombay for compliance within one month from
the date of receipt.

137
Total Turnover :-
As explained earlier that the accounting
system in Public Distribution System is in double entry
book-keeping, there is no profit making tendency of the
Government. These are number of commodities which are
covered under the Act of essential commodity Act of
India. The turnover of money labour etc. by Public
Distribution System in Akola District is given below.
A) Money:-
The State Government has placed the certain
errors of Rupees at the disposal of the collector by
spending the personal ledger account in the name of the
collector. The Government has authorised the collector
to delegate his drawing disbursing power under the
Public Distribution System to the District Supply
Officer due to his busy schedule.
The Tehsildar under the control of the
collector, collected the money from the local Fair Price
Shop dealser and credites it in the treasury under Major
head Personal Ledger Account, 4408 - Capital out lay on
Food? the District Supply Office who is under delegated
power of the collector. Studies the credit draws the
ammount from treasury by issuing the Personal Ledger
Account cheque. The yearly receipt and payment under
the Personal Ledger Accounts for the year 1989-90 was
14,07,15,631, 14,71,43,779 respectively. It's break up
into the monthly tornover is shown in the Annexture
No. 1.

138
Annexture No. 1•
Monthly receipt of Payment from Personal Ledger Account
For 1989 - 90.
Month Receipt Payment
April 1989 1,56,49,418.30 99,79,250
May 1989 88,20,390.00 94,97,140
June 1989 95,93,278.00 1,32,49,822
July 1989 85,96,909.00 1,61,75,992
August 1989 70,44,179.00 91,62,938
September 1989 70,11,570.00 1,16,07,709
October 1989 1,55,32,811.00 1,09,29,114
November 1989 1,12,40,139.00 1,17,52,095
December 1989 1,49,80,497.00 1,14,23,954
January 1990 1,54,10,594.00 2,57,86,381
February 1990 1,36,26,986.00 1,05,20,449
March 1990 1,32,68,860.00 70,58,929
Total 14,07,15,631.00 14,71,43,779
B) Goods :-
The tornover of Goods under Public Distribution
System is mainly based on the Wheat, Rice Supplied by the
Food Corporation Of India, oil from Government of
Maharashtra through Food and Civil Supply Department and
sugar from the sugar factory. Recently the Government of

139
Maharashtra has introduced other essential commodities in
Public Distribution System such as. Soap, Machis, Dal,
Rova, Ata & Maidha etc.
Details of Turnover of the goods under Public
Distribution System are as follows:-
1) Wheat and Rice :-
Monthly quota of wheat and rice has been fixed
by the state Government of the District on the basis of
units of ration cards of the district. An information
regarding wheat and rice quota is given by the state
Government. The District Supply Office draws the ammount
from the treasury for the purchases of the wheat and rice.
The District Supply Office draws Demand Draft in favour of
Food Corporation of India and sends it along with the
order to local depot of Food Corporation of India. As per
order, the whear and the rice are issued by the Depot and
onward sold to the Fair Price Shop on payment made into
treasury by them through challans.
2) Oil and Dal ;-
These items have been supplied from the Food and
Civil Supply Department of the District and gets the
payment by telegraphic transfer from the Personal Ledger
Account of Collector.
3) Sugar :-
There are authorised nominees for the sale
purchase of sugar from the sugar factory on the
authorisation of the Government on the basis of monthly
quota. First the nominee have to credit the Ammount at

140
the ex-factory rate into the challan officer, which he get
the sugar quota from the sugar factory on the basis of the
permit issued by the District Supply Office.
Subsidies rates are fixed by the Government
under the Public Distribution System. The difference
between Exfactory rate and selling rate is term as rebate
to the nominees.
Turnover for the year 1989 to 1990 on account
of sugar was 4,65,900-17-650 Qnt. Rs. Rs. 13,20,10,529.
Details of monthly break up of sugar. Turnover is shown
in Annexture No. 2.
Annexture No. 2•
Monthly Turnover of the Goods.
Year Items Receipt Quantity Value Issue - Value Quantity
1989 Wheat 321114-21-650 Q. 65507300 315461-00-000 66126948
Rice 128955-42-000 Q. 42120712 76268-00-000 37075849
Oil 15830-54-000 Q. 24392517 15558-35-000 25549971
465900-17-650 132010529

141
C) Labour :-
Every year under the Public Distribution System
the turnover of Labour is studied at the level of
Government godowns situated in the Tehsil, Collector
appoints a labour contractor for each godowns. The coolie
charges are fixed by the Government. In special situation
the Government has authorised the Public Distribution
System staff to fix the rate of physical labourers as per
the local situation.
The labour contractor has to work as per
instructions of the Godown keeper for loading, unloading,
checking, stacking etc. As per the works up the labour
contractor has to submit the monthly coolie bills through
the godown keeper and Tehsildar. On certification of the
labour work bill by the Tehsildar, the District Supply
Office makes the payment to the labour contractor, after
verification of the labour bill with the extract of labour
Register yearly payment 1980-90 per bags comes to
Rs. 4,06,864/- the monthly brack up is shown in Annexture
No. 3.
Annexture No. 3.
Yearly turnover (Handling) of foodqrain bags with Coolie
charges for the year 1989-90.
Year Handling of num.ber Hamali charges lems. of bags.. Govt. Labour contrac-Godowns tor
1989-90 47,086 bags. 4,06,844 Wheat
Rice
Jowar

142
D) Transportation :-
The Government has to make available the
foodgrain in Taluka godown for distribution through Fair
Price Shops under the Public Distribution System. For
this purpose transport of foodgrain within the District
and ouL of the District are necessary. For this work, the
collector is authorised by the Government to appoint a
transport contractor by inviting open tenders on
transportation rates.
Transportation bills submitted to the District
Supply Office by the transoprt contractor is checked on
the transport passes in which loading and receiving
weights. The loss of grain in transit is derieved and the
charges of transoprt action are paid to the transport
contractor. In 1990 the turnover of foodgrains amount
23,18,167 bags and its transportation charges are Rs.
2,31,816/-. The monthly transportation of foodgrain from
the main godown, Akola to the Tehsils is given in
Annexture No. 4.
Annexture No. 4 .
Number of foodgrain bags transported within District from
Akola Headquarter to the various Government Godowns in the
District during 1989-90.
Year No.of bags Tranport Cost of transportation
1989-90 15,18,167 23,18,167

143
E) Other :-
There are various kinds of receipt and
expenditure takes place in the transaction under Public
Distribution System which are to be shown as a part of
trading account such as
a) 1) Sale of Old grains.
2) Security deprecation .
3) Labour charges received from Transport
Contractor.
4) Road shortage received from Transport contractor,
5) Cost of Ration cards sold etc.
b) 1) Payment of Godown rent.
2) Payment of advertisement.
3) Payment towards cost of stationary-
4) Payment telephone, electricity, Water charges of
godown.
5) Payment towards tarpolin, Fumigation, Pestisides
etc.
c) 1) Payment to Food Corporation of India A/c. of
foodgrains received.
2) Payment of Finance Advisor and Deputy Secretary
In Government of Bombay.
3) Receipt from other District and states on amount
of grain exported.
4) Recovery payment from advances from Parties and
godown etc.

144
The analytical study presented in this chapter
will give a clearcut understanding for the comparative
study with Amravati, Buldhana and yeotmal districts and
will be benificial for giving the interpretation of the
new facts discovered during the detail and in depth study.