Embed Size (px)
Citation preview
/0 .I.:29/9 A-IO. .:2:.3 '(
.. CIVIL ENGINEERING STUDIES . c'JD' ~CTURAL RESEARCH SERIES NO. 237
PRIVATE COMMUNICATION NOT FOR PUBLICATION Metz Reference Room
Civil Engineering Department BI06 C. E. Building University of Illinois Urbana" Illinois 61801
A STUDY OF STRESS RELAXATION
IN PRESTRESSING REINFORCEMENT
By-
D. D. MAGURA :'~'
M. A. SOZEN
c. P. SIESS
Issued as a Part
of the
ELEVENTH PROGRESS REPORT
of the
INVESTIGATION OF PRESTRESSED REINFORCED CONCRETE
FOR HIGHWAY BRIDGES
UNIVERSITY OF ILLINOIS
URBANA, J.l.LlNOIS
SEPTEMBER 1962


A STUDY OF STRESS RELAXATION IN
PRESTRESSING REINFORCEMENT
by
Do Do Magura M. A. Sozen C. P. Siess
Prepared as a Part of an Investigation Conducted by
'IRE ENGINEERING EXPERIMENT STATION UNIVERSITY OF ILLINOIS
In Cooperation with THE DIVISION OF HIGHWAYS
STATE OF ILLINOIS and
U.S. DEPARTMENT OF COMMERCE BUREAU OF PUBLIC ROADS
Project IHR-10 :J~.~I~:r:ION OF PRESTRESSED REINFORCED CONCRETE
FOR HIGHWAY BRIDGES
Urbana} Illinois September 1962

-iii-
TABLE OF CONTENTS
1. INTRODUCTION
101 Introductory Remarks l02 Object and Scope 103 Acknowledgmerittt
2 • METHODS OF STRESS MEASUREMENT'
2.1 Introductory Remarks 202 The Vibration Method 203 The Lever Method 204 The Balance Method 2.5 The Deflection Method
3 . SCOPE OF DATA
3.1 Test Duration 3.2 Type of Reinforcement 3.3 ~tial Stress 3.4 Prestretching
4. DISCUSSION OF DATA ON STRESS RELAXATION
1
1 2 2
5
5 5 5 6 6
7
7 7 9 9
11
4.1 Effect of Initial Stress 11 4.2 Effect of Prestretching 12 4.3 ~essions for Estimating the Amount of Stress Relaxation 15
5. BIELICGRA...PHY
TABLE
FIGURES
APPENDIX A: TESTS AT THE UNIVERSITY OF ILLINOIS
A.l O:ject A.2 Scope A.3 O~t~ne of Tests and Designation of Test Specimens A.4 Description of Wire Properties A.5 Test Equipment A.6 Test Procedure A.7 Test Results
TABT,ES
FIGURES
20
26
Aol
A.I A.I A.I Ao2 A.4 Ao6 Ao7
£I_a • .ioV/
!
-iv-
TABLE OF CONTENTS (Cant fdo)
APPENDIX B'~ TESTS AT VARIOUS L4.BORATORIES
Bol Bo2 Bo3 B.4 Bo5 Bo6 Bo7 BoB Bo9 B.lO Boll Bol2 B.I) Bol4 Bo15
TABLES
~ss Federal Testing Laboratory Dawance M'agnel de Strycker Spare Barmister Clark and Walley Gifford Burnheim C .. U oR. Dumas Kajfasz Levi Jevtic Kingham, Fisher and Viest
~
B.l
Bol B.l Bo2 Bo3 B.4 Bo4 Bo6 Bo7 B.B B.B Bo9 Bo9 B.Il Bo12 Bol3
-v-
LIST OF FIGURES
3.1 Frequency Distribution of Test Duration
3.2 Frequency Distribution of the Ratio of the Initial Stress to the Ool-percent Offset Stress
401 Effect of Initial Stress Level on Relaxation Loss; Data from Series SR100, Appendix A
4.2 Effect of Initial Stress Level on Relaxation Loss; Data from Series OT100, SR100, and OR200, Appendix A
4.3 Stress Relaxation Rate
4.4 Effect of Prestretching in Tests of Different Durations
4.5 Effect of Prestretching in Tests with Different Initial Stress Ratios
4.6 Variation of Stress with Time According to Equation 1
4.7 Comparison of the Remaining Stress After 50 Years Based on Equation 1 with the Initial Stress

10 INTRODUCTION
101 Introductory Remarks
Relaxation is defined as the loss of stress in a stressed material
held at.constant lengtha Another manifestation of the same basic phenomenonJ
creep is defined as the change in length 61 a ,material under stressa Since
no generally sa~isfactory relationship between creep and relaxation has been
developed} relaxation tests must be carried out whenever relaxation data are
requjredJ although creep tests are simpler to perform 0
Relaxation characteristics of prestressing reinforcement are of
interest in prestressed concrete construction, even though pure relaxation does
not exist under practical coridi tions 0 Creep and shrinkage of the concrete and
fluctuations in superimposed load change the length of the tendon 0 Nevertheless,
the tendon does not deform freely and th~ stress on it can changeo Thus) the
conditions are comparable more t~ a relaxation test than to a creep testo
The attitude toward the effect of relaxation has changed considerably
over the last two decadeso In the early days of design in prestressed concrete~
relaxation losses were considereu to be quite critical because they affected
the working stresses which governed the designo At the same time, it was thought
that the reinforcement reached a stable stress in a matter of a few weeks if not
hours and that the relaxation losses were limited to a very small fraction of
the initial stresso By the time it was established that relaxation losses
could amount to as much as 20 percent of the initial stress over a long period
of time, it was recognized that partial loss of prestress is not necessarily
accompanied by a loss in flexural strengtho

-2-
At ~resent, a knowledge of the losses resulting from relaxation
is required primarily in relation to the serviceability of a prestressed
member 0 In this respect, it should be mentioned that the critical quantity
is the remaining stress and not the losso The recognition of this fact
makes a considerable difference in the interpretation of the available test
data.
1.2 Object and Scope
The object of this report is to present and evaluate the results of
available relaxation tests with a view to th~ develo~ment of expressions for
estimating the effects of stress relaxation.
Appendix A presents. a detailed description of 57 tests carried out
at the University of Illinois.
Appendix B summarizes the results of 370 tests carried out in the
course of 15 investigations at different laboratorieso
The data from all 427 tests are disc~ssed in Chapters 3 and 4 of
the reporto
A bibliography on stress relaxation is provided in Chapter 5.
103 Ackno~ledgments
This study was carried out as a part of the research under the
Illinois Cooperative Highway Research Program Project IHR-IO, "Investigation
of Prestressed Reinforced Concrete for Highway Bridges." The work on the
project was conducted by the Department of Civil Engineering of the University
of Illinois in cooperation with the Division of Highways, State of Illinois,
and the Uo So Department of Commerce, Bureau of Public Roadso
-3-
On the part of the University, the work covered by this report was
carried out under the general administrative supervision of W .. Lo Everitt;
Dean of the College of Engineering, Ross J. Martin, Director of the Engineering
Experiment Station, No Me> Newmark, Head of the Department of Civil Engineering,
and Ellis Danner, Director of the Illinois Cooperative Highway Research Program
and Professor of Highway Engineeringo
On the part of the Di\Qsion of Highways of the State of Illinois;
the work was under the administrative direction of Ro Eo Bartelsmeyer, Chief
Highway Engineer, Theodore F 0 Morf, Engineer of Research and Planning, and
Wo Eo Chastain, Sre>, Engineer of Physical Researcho
The program of investigation has been guided by a Project Advisory
Committee consisting of the following~
Representing the Illinois Division of Highways
Wo Eo Chastain, Sro, Engineer of Physical Research; Illinois
Division of Highways
W. Jo Mackay; Bridge Section, Bureau of DeSign, Illinois
Division of Highways
C. E. Thunman; Jr .. , Bridge Section, Bureau of Design, Illinois
Division of Highways
Representing the Bureau of Public Roads
Harold Allen) Chief, Division of Physical Researchy Bureau of
Publi c Roads
E. L. Erickson) Chief, Bridge Division, Bureau of Public Roads
Representing the University of Illinois
Co Eo Kesler, Professor of Theoretical and Applied Mechanics
Narbey Khachaturian, Professor of Civil Engineering

-4-
Fred Kellam} Bridge Engineer) Bureau of Public Roads and George So
Vincent} Chief} Bridge Research Branch, Bureau of Public Roads} also partici
pated in the meetings of the Advisory Committee and contributed materially to
the guidance of the program.
The investigation was directed by Dro Co Po Siess, Professor of
Civil Engineering, as -Project Supervisor and as ex-officio chairman of the
Project Advisory CoIIlIIli ttee. Immediate supervision of the investigation was
provided by Dr. M. A. Sozen} Associate Professor of Civil Engineering, as
Project Investigator.
Garnett McLean) formerly Research Assistant in Civil Engineering,
developed the test equipment described in Appendix A under the supervision of
Dr 0 J. H 0 Appleton, ,formerly Research Associate in Civil Engineering.

-5-
20 METHODS OF STRESS MEASUREMENT
201 Introductory Remarks
In accordance with the definition of relaxation loss, a relaxation
test requires equipment which will determine the stress in the specimen while
keeping the strain constanto The necessity for long durations of tests under
controlled environment puts practical limits on the si.ze of the specimen and
related equipmento These criteria have been satisfied or nearly satisfied by
various investigators using different methods. These methods can be categorized
in four groups and are described briefly in the following sectionso
2.2 The Vibration Method
The vibration method involves the determination of the stress in
the wire by measuring its frequency of lateral vibrationo It was used first
by Dawance [1948].
The measured frequency of vibration is converted to stress with the ~
use of a calibration for a given mode of' vibration obtained prior to the
relaxation test. This method makes it possible to use rather short lengths of
specimens since the stress is measured without any appreciab~e movement of the
anchorages 0 Wires with a length to diameter ratio of approximately 200 have
been used in testso
One application of the vibration method is described in detail in
Appendix A.
2D3 The Lever Method
Some investigators sfxessei the wires through 8. lever system which
made it possible to use relatively small weights to develop the necessary
-6-
stress in the wire. The length of the specimen was maintained constant by
removing the weights as it became necessary.
Variations of this system were used by Bannister [1953], the C.U.Ro
[1958]J Kajfasz [1958] and others.
204 The Balance Method
The characteristic of this method is the determination of the stress
in the wire by balancing, temporarily, the tension in the wi~e by a known force. ,
One end of the wire is gripped and pulled until the reaction of the near
anchorage is zero. The measured force corresponding to this condition is the
tension in the wireo
Magnel [1948] and Spare [1952] used this method with different
mechanical arrangements.
Closely allied to this method is the one involving direct measurement
of the force (Base [1958] and Kingham [1961]) with the use of a dyn~meterin
series with the wireo To give an indication of the change in stress, the dyna-
mometer has to deform. However" this deformation can be arranged to be small
in relation to the length of the specimen so·that the change in stra.in is very
small.
2.5 The Deflection Method
The deflection method} used by Gifford [1953], involved the determina-
tion of the stress in the wire by measuring its lateral deflection at mid-length
under a know.n 10000 The relation between the force in the wire and the lateral
deflection was derived assuming that the w~re segments were straight and the
angle they made with the horizontal was small 0 (The lateral deflection was
about 0.25 ino for specimens 2l0-ino long.)

-7-
3 0 SCOPE OF DATA
301 Test Duration
Despite early impressions to the contrary, one conclusion that
many investigators have come to is that the phenomenon of relaxation is not
shortli ved 0 It appears from the available evidence that relaxation may
continue indefinitely although at a diminishing rateo Consequently: the
significance of a given test depends directly on its durationo
As indicated in Chapter 1, this report draws information from 427
individual tests, an impressive numbero However, the impact of this number
reduces greatly when the durations of these tests are consideredo Figure 301
shows the number of tests for different test durations grouped in half-year
intervalse Only 20 percent of the 427 tests exceeded a duration of one-half
year. A total o~ 36 tests exceeded a duration of 3 years and only 15 tests
exceeded 6 years. Of these 15 tests, 8 were reported by Levi [1958] and
7 are described :~ Appendix A of this reporto .
It is hoped that a breakthrough will be made in the technique of
relaxatio:: tes:.z ':j. :'he achievement of a reliable understanding of the time
temperature ~=:.e~a:::o::. Long-time losses at working stress and temperature
levels codd~)e e s:.::-.a. t-ed closely by short-time tests under tJigh temperatures
andlor stresses. ~:;\{~V'er) the final confirmation of any such procedure may
have to a\o/8.i.: ~:.e de· .. elopment of long-time data under ordinary conditions 0
3.2 T"jpe of Reo:.:-..! .J~2e:::.ent
All tests discussed in this report have been carried out on cold
drawn wire which is produced from billets of high-carbon steel usually in
-8-
three steps ~ hot-rolling" lead patenting" and cold-drawing 0 Billets are
first hot-rolled into rodsG To give them the ductility and strength required
in the cold-drawing process" they are heated to a temperature sufficient to
transform the grain structure of the steel and then cooled in a lead bath to
arrest the grain structure in the sorbi tic stage G Following this process,
the rods are drawn through dies of successively smaller size to the desired
diameter 0 The drawing operation tends to decrease the ductility and increase
the strength of the wireo
Frequently" the wire is subjected to further treatment to produce
additional changes of the physical propertieso The most common tTeatments
employed are: stress-relieving, oil tempering" and straightening 0
Stress-relieving is a controlled time-temperature heat~treatment
process. It consists of immersing the wire for a short period of time in a
a a lead bath at temperatures of 500 F to lOOO F; the time and temperature being
varied to produce the desired resultso The process produces a wire with
increased elastic limit and ductility over the as-drawn wirec
Oil tempering is a heat-treatment process similar to stress~relie\Qngo
The wire is heated to the appropriate temperature and quenched in an oil batho
The temperature is varied depending on the wire used and the desired resultso
The elastic limit is increased by this process, but the ductility remains low 0
Drawn wire retains a high degree of curvature when wound on a reel
directly from the wire drawing block 0 The radius of curvature is small making
the wire difficult to handle. Therefore, it is mechanically straightened to
increase the free radiuso Wire which has been heat-treated generally has a
larger free radius greater than as-drawn wire since the heat-treating equipment
uses larger diameter reelso Because the free radius is sufficiently large"
heat-treated wire is not usually straightened.
-9-
The tests described were made on ~res subjected to various types of
treatment subsequent to drawing. The pertinent information, wherever available.,
is given in detail in Appendices A and B. About three-fourths of the total
number of tests were conducted on ~re in the as-drawn conditiono
3.3 Initial Stress
The absolute value of the initial stress is not significant in
studying data from wires having different stress-strain characteristics. The
ratio of the initial stress to the O.l-percent offset stress was chosen as a
comparison index in this study.
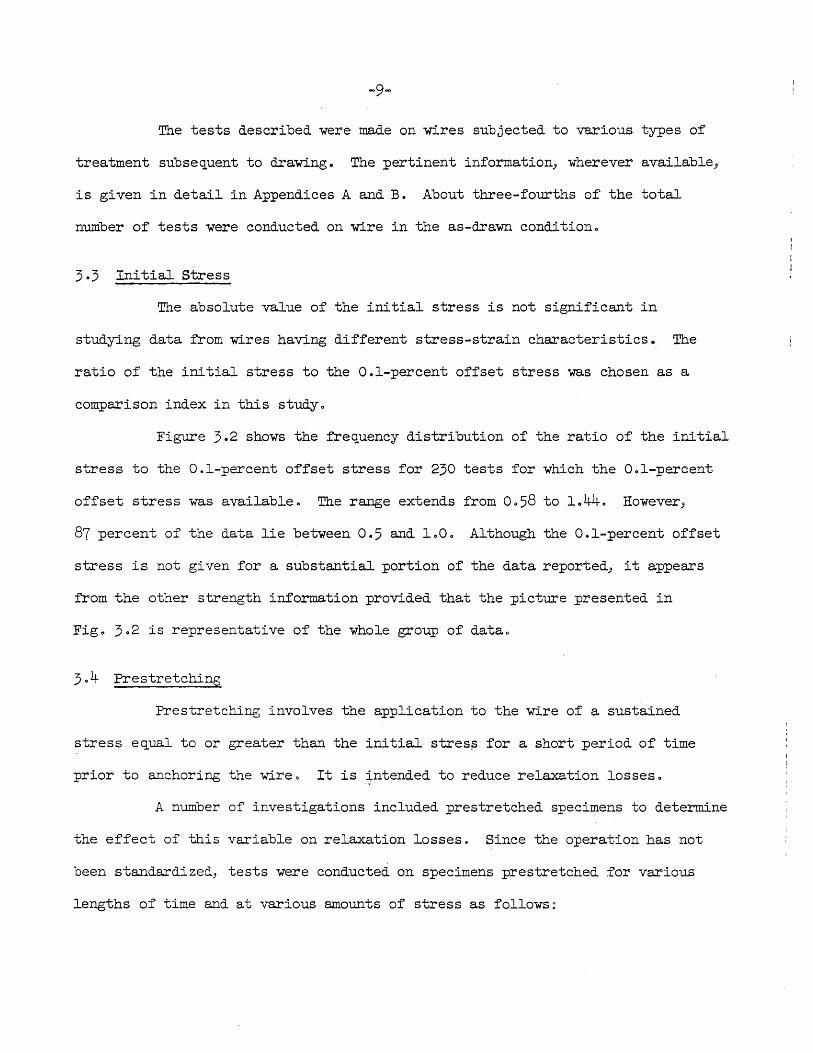
Figure 3.2 shows the frequency distribution of the ratio of the initial
stress to the Oel-percent offset stress for 230 tests for which the Ool-percent
offset stress was availableo The range extends from 0058 to 1.44. However,
87 percent of the data lie between 0.5 and 1000 Although the O.l-percent offset
stress is not given for a substantial portion of the data reported, it appears
from the other strength information provided that the picture presented in
Fig. 302 is representative of the whole group of datao
304 Prestretching
Prestretching involves the application to the wire of a sustained
stress equal to or greater than the initial- stresp for a short period of time
prior to anchoring the wireo It is intended to reduce relaxation losses.
A number of investigations included prestretched specimens to determine
the effect of this variable on relaxation losses. Since the operation has not
been standardized) tests were conducted on specimens prestretched for various
lengths of time and at various amounts of stress as follows~

-10-
No. of Prestretched Source Stress Time Specimens
Dumas 0 to 50% above initial stress 2 minutes 20
Kajfasz 10% above initial stress 10 minutes 11
Gifford 12 ksi above initial stress 10 minutes 5
Appendix A 10% above initial stress 10 or 15 minutes 16 52
Tests were conducted on prestretched wires with non-prestretched
companion specimens to allow eValuation of the effect of prestretching on
relaxation losses.
-11-
4.. DISCUSSION OF DATA ON STRESS RELAXATION
401 Effect of Initial Stress
To illustrate the effect of initial stress on relaxation losses,
the data from Series SR100 reported in Appendix A are plotted in Figo 4 .. 1.
The loss is shown as a function of the initial stresso All data refer to
the same type of wire 0
The curve in Figo 401, drawn merely to show the trend, indicates
that as· the initial stress increases, the loss increases at an increasing
rate. Thi s trend was representative of all available test results ..
As mentioned earlier, it is not possible to compare data from
different types or even shipments of wire on the basis of the parameters
used in Fig. L.l. In work related to creep of metals, the ratio of the
initial stress to the yield stress is often used as an index value for com
paring data fro~ metals having different yield stresses and subjected to
different stresses. Since creep and relaxation must result from the same
basic mecha:~s=J :t was assumed in this study that the ratio of the initial
stress to ~~e ~~eld stress is a critical parameter affecting relaxation ..
For s:eels used in the tests, there was no definite yield pointo
Hence, t~s ~~ ~o be defined arbitrarily and was chosen as the stress
correspon~~~ ~ the Ool-percent offseto The choice was influenced by the
facts that (a) =Jch of the available data had been reported in terms of
this defi~t:o~, (b) it gave an early indication of inelastic action' as
compared with the 0.2-percent offset stress or the stress at one-percent
strain, and (c) for heat-treated wire used in the Vo So the difference
between the Ool-percent offset stress and the stress at one-percent strain
is usually less than 10 percent (See Table Aol, Appendix A)o

-12-
Figure 402 shows the data from tests on three different types of
wire reported in Appendix Ao The loss is plotted as a ratio of the initial
stress (the loss ratio). The abscissas represent ratios of the initial
stress to the Ool-percent offset stress, (the initial stress ratio) 0 Three
significant and general trends are indicated: For initial stress ratios less
than about one half, relaxation losses are insignificant. The loss ratio
increases at an increasing rate with the initial stress ratio although it
can be represented closely by a straight line. Loss ratios are different
for different types of wire.
The effect of initial stress on the rate of relaxation loss ~an
be studied with the help of Fig. Ao3 through A.12 in Appendix Ao The-slopes
of the curves in these figures change little with timeo The relaxation rate
increases ~th the initial stress ratio approximately in direct proportion to
the total loss expected. Figure 403 is a plot of the ratio of the relaxation
loss to the total measured loss versus time for seven specimens (OR210J 307-P,
308, 309-P, 310, 403-P, and 405) for which measurements beyond 50)000 hours
were available. These specimens developed about three-quarters of the total
loss (50,000 hours) in one year. There was no effect of the initial stress
ratio on this proportiono
402 Effect of Prestretching
The term prestretching is used in this report to denote the operation
in which the stress in the wire is increased to a level equal to or higher than
the intended initial stress, held at that level for a short period of timey
and then anchored at the intended initial stresso This operation has been
claimed to reduce relaxation losses considerably 0

-13~
On the basis of what is known about time-dependent phenomena in
materials under stress, it can be reasoned that prestretching will reduce
relaxation losseso Consider the time-dependent deformations for a'material
put under a constant stress at time t 0 If this material is put in service o
at a later time tl
, the effective time-dependent deformation can be considered
to be that occurring after time tlo This is similar to the manner in which
prestretching reduces relaxation losso In effect, the loss that would have
occurred during the period of prestretching is subtracted from the total loss
that would have occurred otherwiseo
The fact that the stress is increased to a higher level could be
quite significant if the desired initial stress itself had not been quite
high 0 With the practical levels of initial stress on the order of 75 percent
of the strength of the steel, it is not feasible to prestretch it by more
than about 15 percent above the desired initial stresso Hence) the overstress
should have little effect on the results of the operation 0 Almost the same
effect could be achieved by holding the stress at the desired level for a
length of timeo However) under practical conditions it may be easier to
overstress the wire to a certain level and avoid the necessity to maintain
the stress at a constant level during the prestretching periodo
Thus, the reduction in relaxation loss resulting from prestretching
should be approximately equal to the loss occurring over the period of pre-
stretChing 0 The rate of relaxation loss with time is quite high immediately
after streSSing 0 However, it is not so high as to make this an appreciable
effect in the long run if the prestretching period is limited to a matter of
minutes.

-14-
The average ratio of the loss occurring over the first 15 minutes
to that occurring at six years for four specimens tested at the University
of Illinois (Appendix A) is 5 percento Had these specimens been prestretched
for 15 minutes, it is conceivable that the measured loss would be less by
that amount which would not be sufficient to yield conclusive evidence in
relation to the experimental scattero
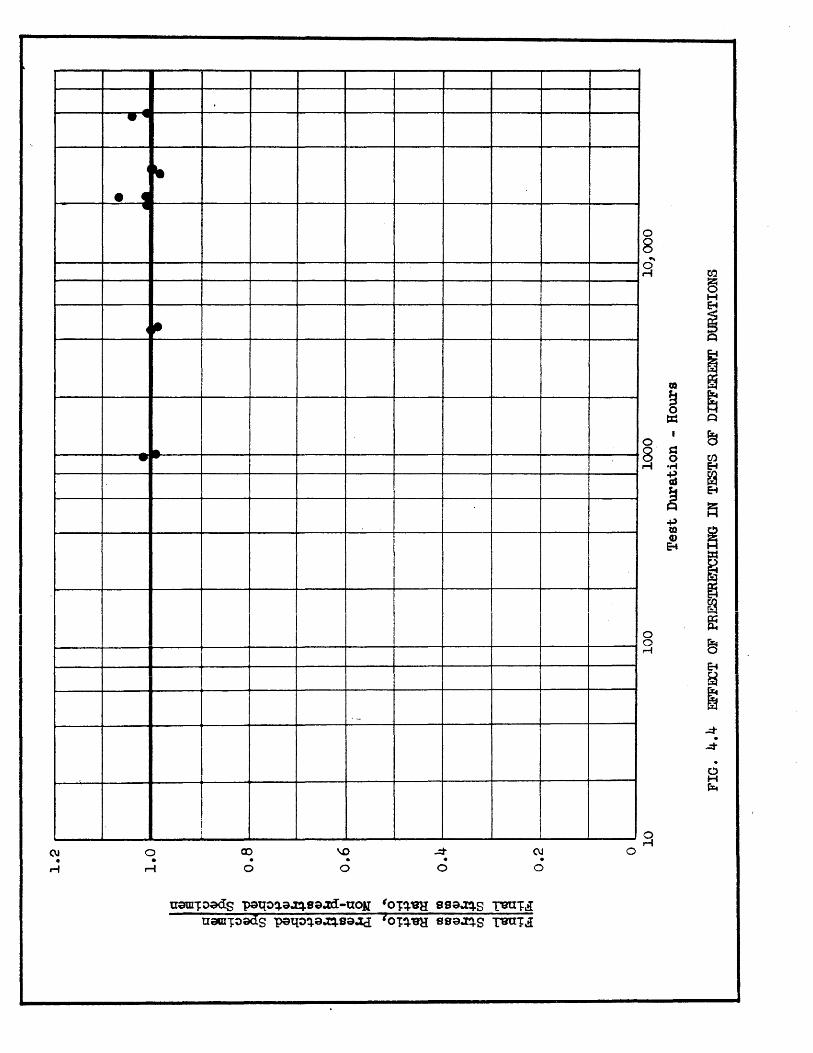
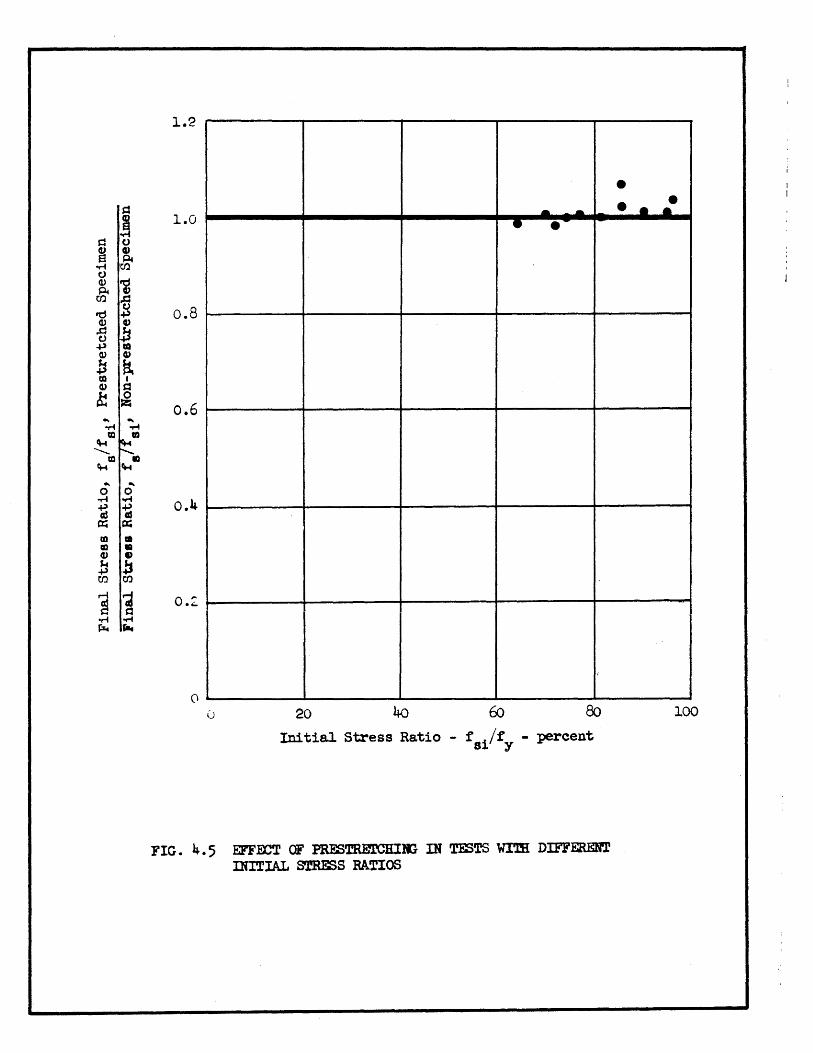
A direct comparison of the effect of prestretching on the relaxation
losses of specimens under test for a reasonably long duration of time can be
made with the use of data provided by Gifford [1953] and in Appendix Ao
Gifford reports test results on five pairs of specimens, each pair
consisting of one prestretched and one non-prestretched specimen at the same
level of initial stresso The test duration was 10,080 hours and the ratio
of the initial stress to the Ool-percent offset stress of the wire ranged
from 0050 to 00980 Data on these specimens are provided in Table B.8,
Appendix Bo
A measure of the efficiency of the operation is the
ratio
Final stress, prestretched specimen / Final stress, non-pre stretched specimen Initial stress, prestretched specimen Initial stress, non-prestretched specimen
The average value of this ratio for the five pairs reported by Gifford was
10002 percent with a range of .. 99 to 102 percent 0 In terms of the remaining
stress in the wire, prestretching for a short period of time (2 mino) did not
appear to be worthwhileo
The efficiency ratio described above is plotted against the logarithm
of time in Figo 404 and against the initial stress ratio in Figo 405 for
~15-
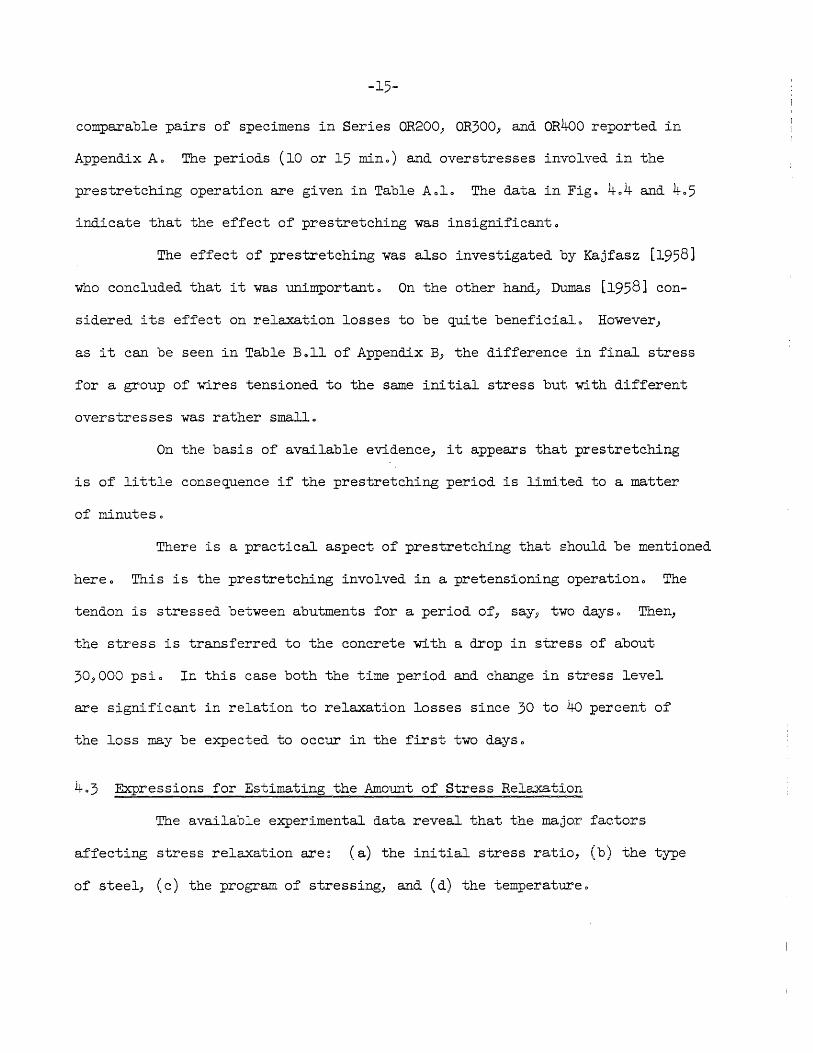
comparable pairs of specimens in Series OR200, OR300, and OR40o reported in
Appendix Ao The periods (10 or 15 mino) and overstresses involved in the
prestretching operation are given in Table Aolo The data in Figs 404 and 405
indicate that the effect of prestretching was insignificanto
The effect of prestretching was also investigated by Kajfasz [1958]
who concluded that it was unimportanto On the other hand,? Dumas [1958] con
sidered its effect on relaxation losses to be quite beneficialo However,
as it can be seen in Table Boll of Appendix BJ the difference in final stress
for a group of wires tensioned to the same initial stress but with different
overstresses was rather smallo
On the basis of available evidence, it appears that prestretching
is of little consequence if the prestretching period is limited to a matter
of minuteso
There is a practical aspect of pre stretching that should be mentioned
here 0 This is the prestretching involved in a pretensioning operationo The
tendon is stressed between abutments for a period ofJ saYJ two days 0 Then,
the stress is transferred to the concrete ~th a drop in stress of about
30)000 psio In this case both the time period and change in stress level
are significant in relation to relaxation losses since 30 to 40 percent of
the loss may be expected to occur in the first two dayso
403 Expressions for Estimating the Amount of Stress Relaxation
The available experimental data reveal that the major factors
affecting stress relaxation are~ (a) the initial stress ratio, (b) the type
of steelJ (c) the program of stressing, and (d) the temperatureo

-l6-
As discussed in Section 4.l) the influence of the initial stress
ratio (the ratio of the initial stress to the uyield ff stresE!) is significant
and this variable must be considered in any expression developed to predict
the effect of stress relaxationo
The relaxation losses measured in tests on steels of different
type have been observed to be different even when all other variables were
ostensibly the sameo Since it is beyond the scope of this study to relate
relaxation losses to the microscopic structure of the material j two courses
of action may be followed~ to derive different expressions for particular
types of steel or to use a general expression on the basis of all data
considered. The first alternative is undesirable not only because it
eliminates the general objective of obtaining a useable method for estimating
the effects of stress relaxation but also because limiting a certain expression
to a certain type of steel would not fulfill the desired end; test results on
specimens from different heats of the same type of steel have indicated
different relaxation losseso ConsequentlYJ it was decided to ignore this
variable in the expressions to predict the effect of relaxation losses}
with the understanding that the definition of the initial stress ratio would
take into account part of the effect of the type of steelo
MOst of the effect of the program of stressing can be anticipated
using a simple relation between relaxation loss and timeo Therefore] a
special parameter was not included for this effect in the expression for
relaxation losseso
The temperature can have a critical effect on relaxation if it is
abnormally high 0 Schwier [l958] found that an increase in temperature from
-17-
720F to 2120F magnified relaxation losses eight timeso However) under ordinary
working conditions this variable may be ignored 0
It should be pointed out at this stage of the discussion that the
quanti ty sought is the remaining stress in the wire and not the relaxation
losso This is quite critical in the interpretation of the datao The relative
scatter in the relaxation loss data is considerable 0 However, the corresponding
relati ve scatter in the value of the remaining stress is much smaller 0 A
relative error of 100 percent in relaxation loss may represent a relative
error of only two percent in the remaining stresso
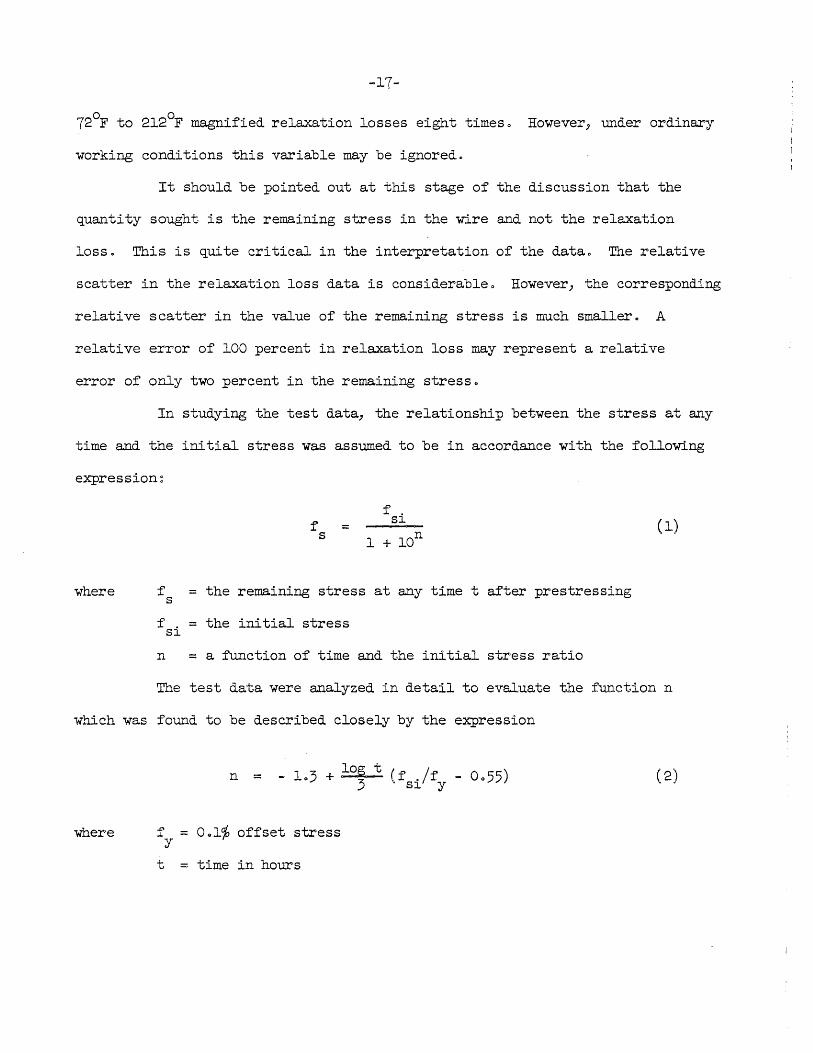
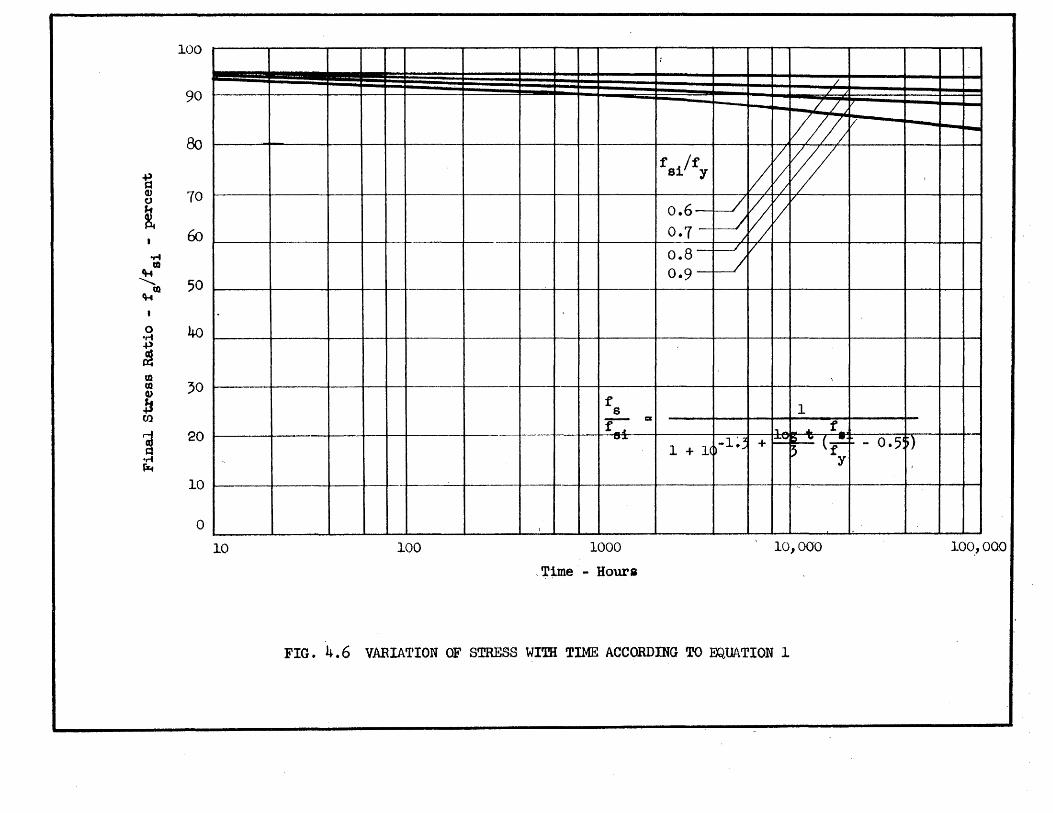
In studying the test data, the relationShip between the stress at any
time and the initial stress was assumed to be in accordance with the following
expression~
where
f = s
f . s~
f = the remaining stress at any time t after prestressing s
f . = the initial stress S~
n = a function of time and the initial stress ratio
(1)
The test data were analyzed in detail to evaluate the function n
which was found to be described closely by the expression
where
n = log t (/ ) - 103 + 3 ~f. f - 0055 S~ y
f = 001% offset stress y
t = time in hours
( 2)

-18-
The variations of stress with time as indicated by Eq. 1 and 2 are
shown in Fig" 4,,6 for different values of the initial stress ratioo After
100)000 hours (about ll~ years) the stress is predicted to be 94 percent of
the initial for an initial stress ratio of 006 and about 83 percent of the
initial for an initial stress ratio of Oo9~ The shape of the curves indicate
the half -life (time at reaching of half the initial stress) to occur far in
the future" According to Eqo 1 and 2, the half life would be reached in 106
years for a wire having an initial stress ratio of 0,,90
The curves in Fig ..• 4.6 suggest that a linear approximation could be
used to predict the stress satisfactorily up to a time of about 50 years at
the practical levels of prestress" The follOwing expression relating the
logarithm of time to ·the ratio f If . linearly was derived from the datao s Sl
f s ~ =
Sl
1 _ log t (fSi _ 0055) 10 f
Y
The stresses calculated on the basis of Eqo 1-2 and 3 are compared
with results from tests with durations of greater than one year in Table 4010
Although the test results refer to wires manufactured using different techniquesJ
the comparison is favorableo For Eqo 1, the mean ratio of the measured to
computed stress is 1.01) the standard deviation 0.10 and the range 0092 to 10160
For Eq. 3) the mean ratio is also 1001, the standard deviation 0013; and the
range 0.92 to 1.16. On the basis of these comparisons) it appears that Eqo ~2
or Eq. 3 may be used to estimate the effect of relaxation on prestress" It is
not strictly justifiable to project the conclusions from the test data to longer
durations and to different conditionso However, the use of Eq" 1 or 3 should
represent a better estimate than the use of a flat percentage.
-19-
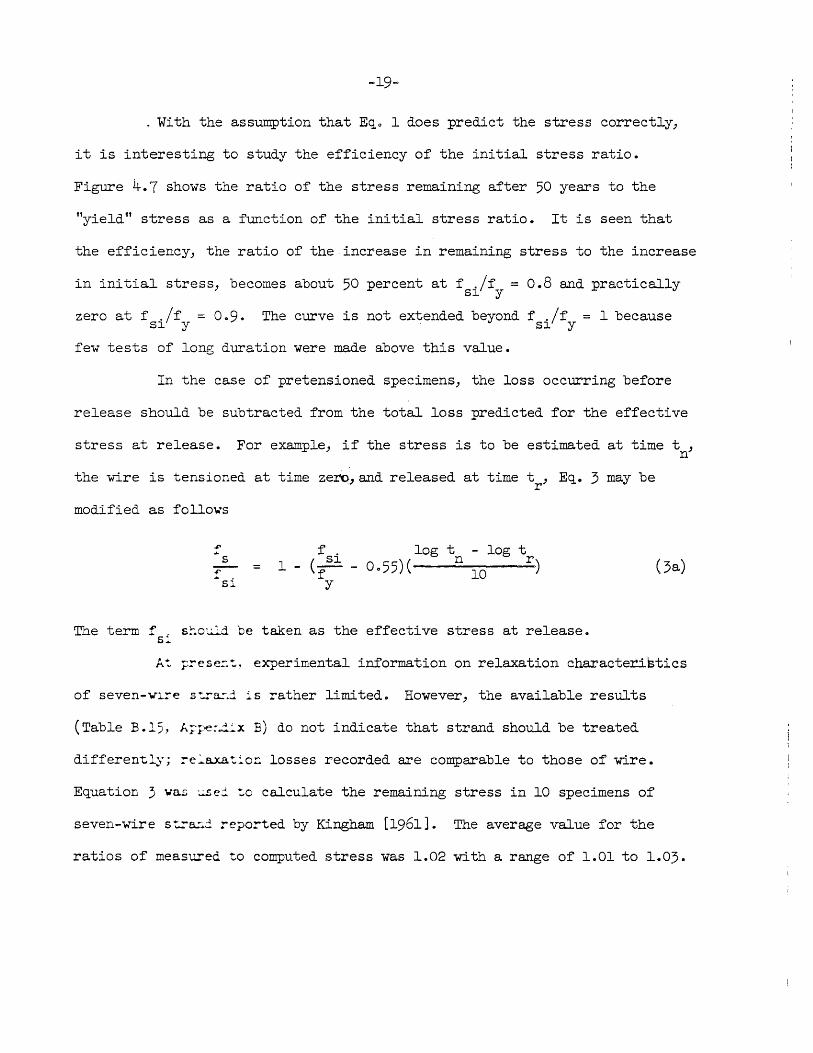
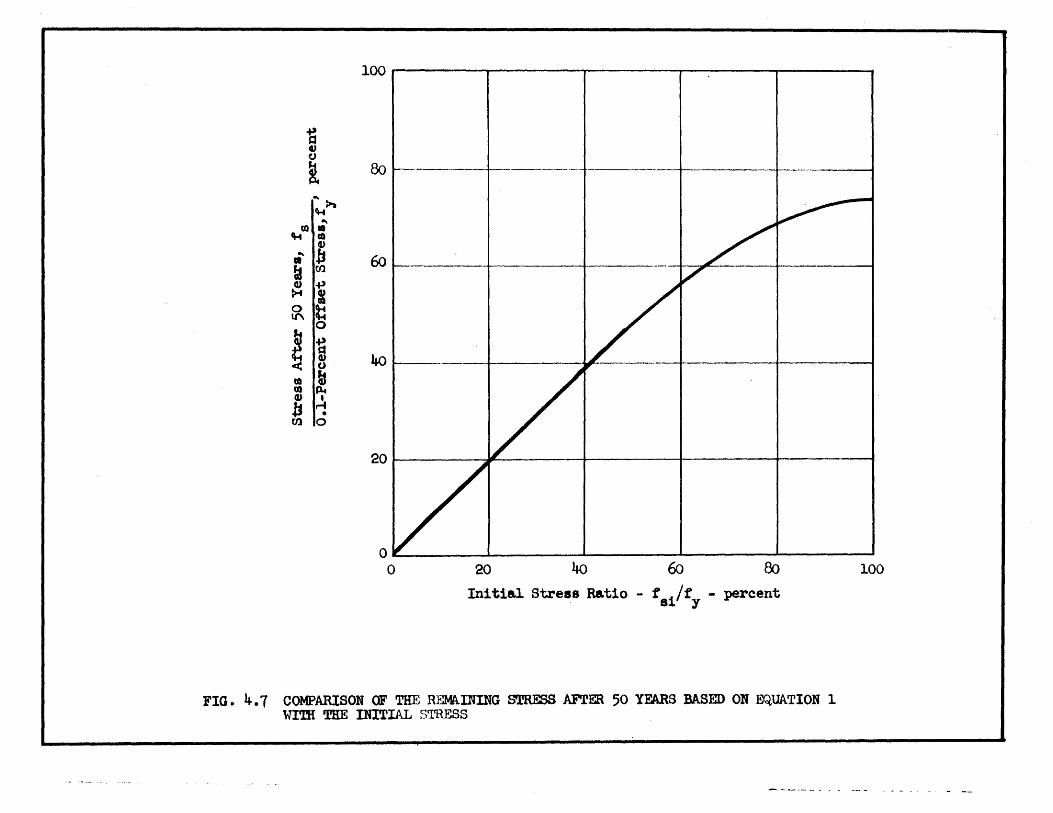
. With the assumption that E~o 1 does predict the stress correctly,
it is interesting to study the efficiency of the initial stress ratio.
Figure 4.7 shows the ratio of the stress remaining after 50 years to the
"yield tf stress as a function of the initial stress ratio. It is seen that
the efficiency, the ratio of the increase in remaining stress to the increase
in initial stress, becomes about 50 percent at f ./f = 0.8 and practically Sl y
zero at f ./f = 009. The curve is not ex~ended beyond f ./f = 1 because Sl y Sl Y
few tests of long duration were made above this value.
In the case of pretensioned specimens, the loss occurring before
release should be subtracted from the total loss predicted for the effective
stress at release. For example, if the stress is to be estimated at time t , n
the wire is tensioned at time zero,and released at time t , E~. 3 may be r
modified as follo~s
s ~
"'si =
f . log t - log t 1 - (fSl - 0055)( n 10 r)
y
The term s!J.o~d be taken as the effective stress at release ..
(3a)
At ;:=-ese::~, experimental information on relaxation characteti~tics
of seven-.r ... ::-e s:.:-a:-. .:! is rather limited. However, the available results
(Table B.l5, A;~~:~~x B) do not indicate that strand should be treated
differen~ly; ::-e:a.x.a ~':'or: losses recorded are comparable to those of wire.
Equation 3 va..:; -~e::!. :'0 calculate the remaining stress in 10 specimens of
seven-wire s :.:-a.:-..:! !'"eported by Kingham [1961]. The average value for the
ratios of measured to computed stress was 1.02 with a range of 1.01 to l.03.
Relaxation
1946
1948
1948
1948
1951
1951
1951
1952
1952
1953
1953
1953
5 0 BIBLIOGRAPHY
Ros, Mo R 0 ~ nVorgespannter Beton, It Report No e 155, Eidgenossische Materielprufungs und Versuch sanstalt fur Industrie, Bauwesen und Gewerbe (EMPA), Zurich 0 (March, 1946) 0
Dawance, Go~ "Une Nouvelle Methode pour L'Etude de la Relaxation des Fils D'Aciero u Annales de L~Institut Technique due Batiment et des Travaux PubliCS, Paris 0 (February, 1948) 0
deStrycker, R 0 ~ "Le Fluage et la Relaxation a Froid des Fils d'Acier Trefileso fl Revue Metallurgie Volo 45, Noo 10 (October, 1948)0
Magnel, Go~ "Creep of Steel and Concrete in Relation to Prestressed Concrete, If American Concrete Institute, Volo 19, Noo 60 (February, 1948)0
Rainieri, G e ~ ffProve di Fluage e di Rilassemento a Freddo su Acciai ad Elevato Limite di Snervamentooi! Construzioni Metalliche, Noo 5 (1949) 0
deStrycker, Ro~ fiLe Comportment sous Tension des Armatures pour Beton Precontrainteo lY International Congress on Prestressed Concrete, Ghent 0 (1951) 0
deStrycker, Ro ~ i~luage et Relaxation des Fils Trefileso iI Revue Metallurgieo Volo 480 Noo 11 (November, 1951)0
Simon, J 0 and Xercavins, P 0 ~ WiLe Caractere Conventionnel. de la Limite d ~ elastici te dans les Aciers durs de Precontrainte 0 "
International Congress on Prestressed Concrete, Ghent 0 (1951) 0
Laravoire, L 0 ~ HUn Nouveau Produi t Siderurgiq,ue Francais~le fils Machine 1en Acier Traite~pour Beton Precontrainto~g Travauxo Noo 217 (November, 1952) 0
Spare, GoT 0 ~ BiCreep and Relaxation of High Strength Steel Wires at Room Temperatures 0 ss Wire and Wire Products 0 (OctoberJ 1952) 0
Bannister, J .. Lo ~ HCold Drawn Prestressing Wire, Ii The Structural Engineer, Volo 310 Noo 8 (August, 1953) 0
Campus, F 0 and deStrycker, R 0 ~ flComptes Rendus de Rechercp.ec- 9U
Ltlnstitute pour L~Encouragement de la Recherche Scientifique dons L~Industrie et Agriculture, Brussels 0 Noo 11 (July, 1953) 0
Clark, NoW 0 B 0 and Walley, F 0 ~ "Creep of High~Tensi1e Steel Wire 0 Ii Proceedings of Institution of Civil Engineers 0 Part I .. Volo 2, No. 20 (March, 1953)0
1953
1953
1953
1954
1954
1954
1954
1955
1956
1957
1958
1958
1958
-21-
deStrycker, R.: ilDiscussion of a Paper by Clark and Walley 0 ft
Proceedings of Institution of Civil Engineers. Part 10 Volo 2, Noo 2 (March, 1953) 0
Gifford, F 0 W 0 U "Creep Tests on Prestressing Steel. 11 Magazine of Concrete Research. Cement and Concrete Association, Vol. 15, No. 14 (December, 1953) ~
Guyon, Yo: "Prestressed Concrete, tI John Wiley and Sons. NeW York. (1953) 0
.. ~ B1irnheim, H.: nUber das Kriechen von Hochfesten Stahldrahten bei Raumtemperatur 0 If Der Bauingenieur 0 Volo 29, No.. 1 (January, 1954).
Levi, Fo: till Problema Degli Acciai per Cemento Armato Precompreso." Giornale del Genio Civile Vol. 92, No. 4 (April, 1954) No. 10 (October, 1954).
McLean, Go: f~ Study of the Effects of Time-Dependent Variables in Prestressed Concrete, " M.S. TheSiS, University of Illinois~ Urbana, Illinois. (June, 1954)0
Spare, Go T.~ I1Prestressing Wires - Stress-Relaxation and StressCorrosion Up to Date 0 rt Wire and Wire Products' Volo 29, Noo 12 (December, 1954). .
Gouvis, No Ao~ "Time-Dependent Effects in Prestressed Concrete" M.So TheSiS, University of Illinois. Urbana, Illinois 0 (1955)0
McLean, G. and Siess, Co Po~ HRelaxation of High-Tensile-Strength Steel Wire for Use in Prestressed Concrete U Civil Engineering Studies. Structural Research Series No. 117, University of Illinois) Urbana, Illinois. (January, 1956)0
Dawance, G. and Chagneau, A.~ "Measured Loss in Prestress"iI Supplement to Annales de L~Institut Technique du Batiment et des Travaux Publics Volo 10, Noo 120, Paris 0 (December, 1957)0
Bate) S. C. C.~ "The Properties, Testing, and Specification of Steel for Prestressed Concrete, Ii RILEM Symposium on Special Reinforcements for Reinforced Concrete and on PrestreSSing Reinforcements 0 Liege, Belgium 0 (1958).
Commissie voor Uitvoering von Research (C.U.R.)~ 9iOnderzoek von Hoogwaardig Betonstaal voor Voorgespannel Beton 0 if Rapport No. 14 (1958).
Dumas, Fo~ tiThe Necessity for the Use of the Highest Class Materials in Prestressed Concrete Constructiong~ RlLEM Symposium on Special Reinforcements for Reinforced Concrete and on PrestreSSing Reinforcementso Liege, Belgium.. (1958).

1958
1958
1958
1958
1958
1958
1959
1959
1961
-22-
Finsterwalder, U 0 ~ ilErgebnis'se von Kriech-und Schwindmessungen on Spannbetonbauteno U Beton-und Stahlbetonbauo 53 (1958)0
Kajfasz j So~ "Some Relaxation Tests on Prestressing Wireo fl
Magazine of Concrete Research (London) Vol. 10, No. 30 (November) 1958)0
Kil1ick, H 0 So and Bannister, J 0 L 0 ~ g'Characteristics of Prestressing Tendons ft RlLEM Symposium on Special Reinforcements for Reinforced Concrete and on Prestressing Reinforcementso Liege, Belgium 0 (1958) 0
Levi, F 0 ~ "Tests of Steel for Prestressed Concrete f~ Proceedings Second Congress of Federation Internationale de la Precontrainteo Amsterdam 0 (1958)0
Levi, F 0: fiLe Probleme des Aciers de Precontrainte en Italie 0 f! Third Congress of the Federation de la Precontrainteo Berlin 0
(1958) ..
Schwier, F.: '\Tires and Bars for Prestressed Concrete 0 U RILEM Symposium on Special Reinforcements for Reinforced Concrete and on Prestressing Reinforcementso Liege, Belgium. (l958)0
Jevtic, D.: uRelaxation, Creep, Fatigue Tests and Tests of Behavior a~ High Temperatures of Steel Wires for Prestressed Concrete." RILEM Bulletin Noo 40 (October" 1959) 0
Stussi, F.: flOn the Relaxation of Steel Wires" International Asso:iation for Bridge and Structural Engineering; Publications. Vo:'. 19 (1959).
K.:.r'..e:--a:-, R. I., Fisher, Jo Wo, and Viest,.9 10 M.~ uCreep arid S:-:~::..t:B€e of Concrete in Outdoor ExposU!"e and Relaxation of P!'es::-ess:'ng Steel) ~1 Special Report 66.7 AASHO Roa.d. Test Technical S~a~~ Pa?C~s) Ottawa, Illo (1961)0

-23-
Creep
1926 Welter, Go~ Z Metallkunde 18 (1926).
1928 Welter, G.,~ Z Metallkunde 20 (1928)0
1948 Magnel, Go~ "Creep of Steel and Concrete in Relation to Prestressed Concrete 0 " American Concrete Instituteo Volo 19 Noo 6. (February, 1948) 0
1950 Janiche j W 0 and Thiel, G., ~ "Kriechen von Stahl unter Statischer Beanspruchung bei Raumtemperaturo ll Arch 0 Eisenhutenwo 21 Volo 3/4 (1950)0
1951 Everling, WoO., ~ Discussion on "Steel Wire for Prestressed Concrete 0 " Proceedings of First Uo S. Conference on Prestressed Concrete, MoleTo (August, 1951)0
1951 Godfrey, Ho 3.: "Steel Wire for Prestressed Concrete H Proceedings of First Uo So Conference on Prestressed Concrete, MoloTo (August, 1951).
1952 Schwier, F 0 ~ "Staldrahte fur Spannbeton 0 " Beton und Stahlbetonbau, Vol. 470 (September) 1952).
1952 Spare, Go To~ ItCreep and Relaxation of High Strength Steel Wires at Room Temperatures 0 H Wire and Wire Products 0 (November, 1952) 0
1958 Canta, G. M.~ "Some Creep Tests on Steels for Prestressed Concrete 0 " Proceedings of 2nd Congress of Federation Internationale de la Precontrainte 0 Amsterdam 0 (1958) 0
1959 BroW4, W. F., Manson, So So, Sachs, Go, and Sessler, 30 G.~ 'tL:. terature Surveys on Influence of Stress Concentrations at Elevated Temperatures and the Effects of Nonsteady Load and Te::perature Conditions on the Creep of Metals oil American Society for Testing Materialso Special Technical ~~blication Noo 260 (1959)0

-24-
Mechanics of Creep
1949 Stanford, Eo Go: uThe Creep of Metals and Alloys 0 U Temple Press. London (1951)0
1950 Freudenthal, A. M.: liThe Inelastic Behavior of Engineering Materials and Structures. U John Wiley and Sons.., Inc. New York (1950)0
1951 Rotherham, L. A.: uCreep of Metals. U Institute of Physics. London. (1951) 0 .
1954 "Proceedings for Short Course on Mechanics of Creep. U Conducted by Pennsylvania State Universityo Edited by Joseph Marin, Professor and Head, Department of Engineering Mechanics. (1954) 0
1955 Spa.th, W.: ''Fliessen und Kriechen der Metalle." MetallVerlag. Berlin. (1955).
1957 "Creep and Recovery 0 It A Seminar on Creep and Recovery of Metals Held During the 38th National Metal Congress and Exposition. Cleveland. (October 1956). Sponsored by the American Society for Metals. Cleveland, Ohio. (1957).
1957 "Creep and Fracture of Metals at High Temperatures. V! Proceedings of a Symposium held at the National Physical Laboratory. (1954) 0
Philosophical Library. New Yorko (1957) 0
1959 Finnie, Io and Heller, Wo Ro: uCreep of Engineering Materials.!! McGraw-Hill. New Yorko (1959).

-25-
Correlation of Creep to Relaxation
1936
1937
1951
Soderburg, Co R .. : "The Interpretation of Creep Tests for Machine Design." Transactions of American Society of Mechanical Engineers. Vol 0 58 (1936) 0 -
Davenport, C. C.: tiThe Interpretation of Creep Tests for Machine Design." Transactions of American Society of Mechanical Engineers. Vol. 59 (1937) 0
Popov, E. P .. : "Correlation of Tension Creep Tests with Relaxation Tests. fI Transactions of American Society of Mechanical Engineers. Journal of Applied Mechanics .. Volo 69 (1947) ..
Roberts, I.: "Correlation of Tension Creep Tests "With Relaxation Tests. " Transactions of American Society of Mechanical Engineers. Journal of Applied Mechanics. Vol. 71 (1949)0
Roberts, I.: "Prediction of Relaxation of Metals from Creep Data." Proceedings of American Society for Testing Materials. (1951) 0
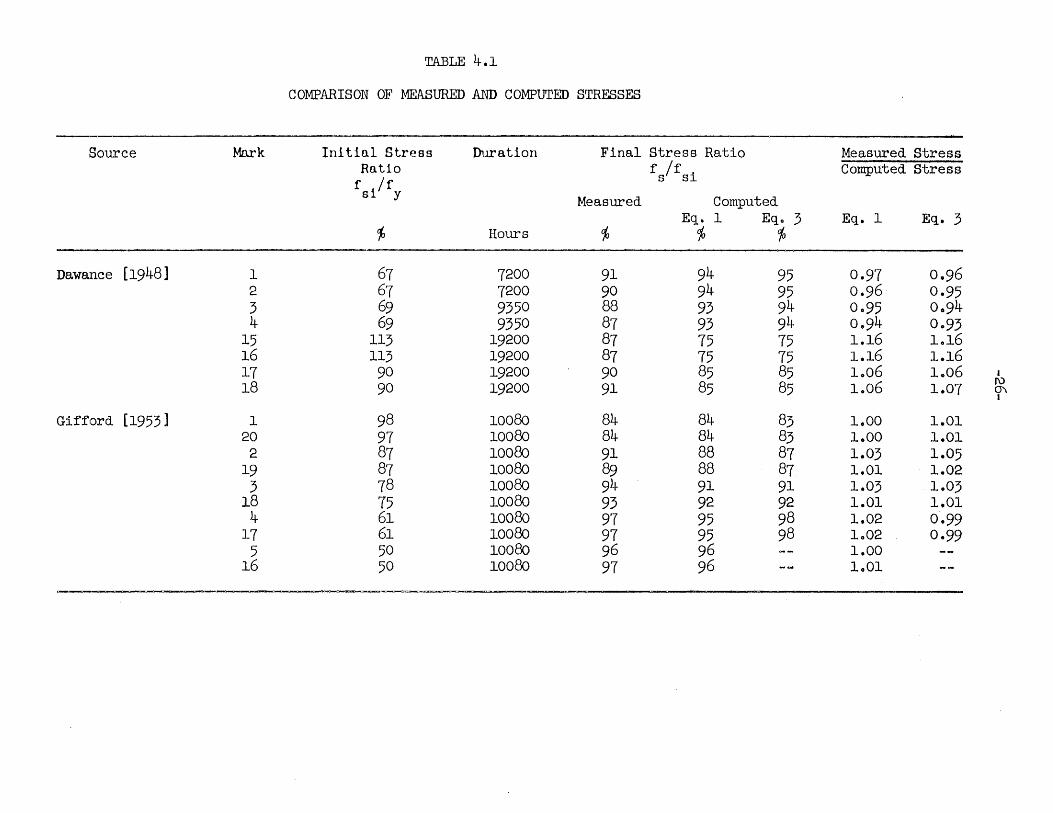
TABLE 4.1
COMPARISON OF MEA.SURED AND COMPUTED STRESSES
;Source Mark Initial Stress Duration Final Stress Ratio Measured Stress Ratio f If i Computed Stress
f iff s s
s y Measured Computed Eq. 1 Eqo 3 Eq. 1 Eq. 3
~ Hours ~ % %
Dawance [1948] 1 67 7200 91 94 95 0.97 0.96 2 67 7200 90 94 95 0.96 0.95 3 69 9350 88 93 94 0095 0094 4 69 9350 87 93 94 0094 0·93
15 113 19200 87 75 75 1.16 1016 16 113 19200 87 75 75 1.16 1.16 17 90 19200 90 85 85 1006 1.06 I
18 90 19200 91 85 85 1.06 1.07 f\) 0\ I
Gifford [1953] 1 98 10080 84 84 83 1.00 1.01 20 97 10080 84 84 83 1.00 1.01 2 87 10080 91 88 87 1.03 1.05
19 87 10080 89 88 87 1.01 1.02 3 78 10080 94 91 91 1.03 1.03
18 75 10080 93 92 92 1.01 1.01 4 61 10080 97 95 98 1.02 0.99
17 61 10080 97 95 98 1.02 0·99 5 50 10080 96 96 1.00
16 50 10080 97 96 1.01
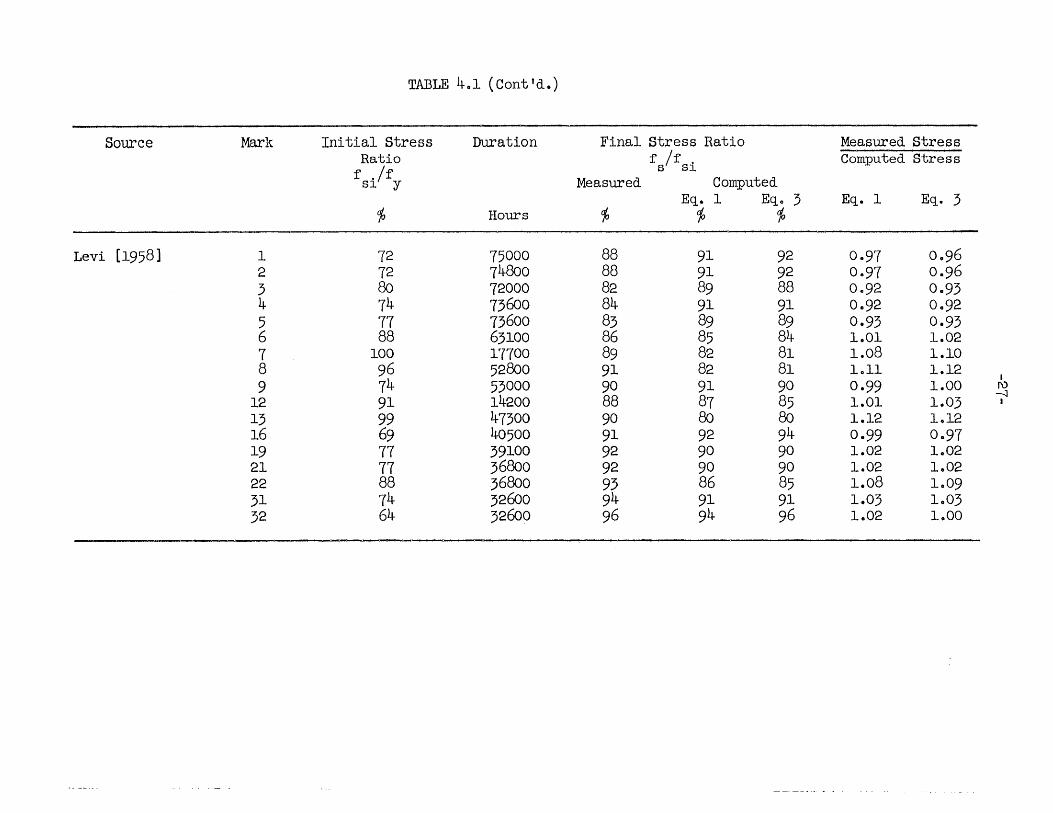
TABLE 4.1 (Cont'd.)
Source Mark Initial stress Duration Final stress Ratio Measured stress Ratio f If . Computed Stress
f ./f s Sl
Sl Y Measured Computed Eq. 1 Eqo 3 Eq. 1 Eq. 3
% Hours % % %
Levi [1958] 1 72 75000 88 91 92 0·97 0.96 2 72 74800 88 91 92 0·97 0.96 3 80 72000 82 89 88 0·92 0.93 4 74 73600 84 91 91 0.92 0·92 5 77 73600 83 89 89 0.93 0.93 6 88 63100 86 85 84 1.01 1.02 7 100 17700 89 82 81 1.08 1.10 8 96 52800 91 82 81 loll 1.12
I
9 74 53000 90 91 90 0.99 1.00 (\) -...J
12 91 14200 88 87 85 1.01 1.03 I
13 99 47300 90 80 80 1.12 1.12 16 69 40500 91 92 94 0·99 0.97 19 77 39100 92 90 90 1.02 1.02 21 77 36800 92 90 90 1.02 1.02 22 88 36800 93 86 85 1.08 1.09 31 74 32600 94 91 91 1.03 1.03 32 64 32600 96 94 96 1.02 1.00

TABLE 4.1 (Cont'd.)
Source Mark Initial Stress Duration Final Stress Ratio Measured Stress Ratio f If . Computed Stress
f ./f s Sl
Sl Y Measured Computed Eqo 1 Eq. 3 Eq. 1 Eq. 3
% Hours % % %
Appendix A OTI01 69 20000 90 93 94 0.97 0.96 OTI02 78 20000 87 90 90 0.97 0.97 OTI03 83 20000 83 89 88 0.93 0.94 OTI04 88 20000 86 87 86 0.99 -1.00
OR210 85 20000 90 88 87 1.02 1.03
OR303-P 72 20000 95 92 93 1.03 1.02 OR304 72 20000 96 92 93 1.04 1.03 I
OR305 81 20000 93 90 89 1.03 1.04 I\) OJ
OR306-p 81 20000 93 90 89 1.03 1.04 I
OR307-P 97 20000 89 83 82 1.07 1008 OR308 95 20000 86 85 83 1.01 1.04 OR309-P 90 20000 88 86 85 1.02 1.03 OR310 90 20000 88 86 85 1.02 1003
OR401-P 95 20000 88 85 83 1.03 1.06 OR 402 94 20000 88 85 83 1.03 1.06 OR403-P 84 20000 89 88 88 1.01 1.01 OR404 85 20000 84 88 87 0.95 0097 OR405 85 20000 88 88 87 1.00 1.01 NRI01 58 20000 92 95 98 0.97 0.94 NRI02 66 20000 90 93 95 0·97 0095 NRI03 77 20000 86 91 91 0·95 0·95 NRI04 84 200.00 84 88 88 0.95 0.95 NRI05 88 20000 83 87 86 0.,95 0.96

400
300
200
100
a o 1 2 3 4 6 7 8 9 10
Test Duration - Years
FIG. 3.1 ~~ DISTRIBTJrION OF TEST DURATION

~r-----------------------------------------~
30
10
0'------o 1.0
Initial Stress Ratio - f ./f S~ Y
FIG. 3.2 ~UENCY DISTRIBUTION OF THE INITIAL STRESS RATIO

50
40
vi • ~ 30
til
~ 1%1
~ ~
20
fIl fA
.9
10
o
; VI
/ - -
o 40 80 120 160 200
Initial Stress - ksi
FIG. 4.1 EFFJoc:T OF INITIAL STRESS LEVEL ON REIAXATION LOSS Data from Series SR1OO, Appendix A
240 280

§ H
c.Q
~ to U2 4)
§ b rJl
Cit ~
.,.. ~
co ~ aa .3
25rl --------r--------r--------.--------,--------~--------~------~
20rl ------~r_------~------~--------~------~--------~------~
15
10
5 I
20
I I SRIOO
OT1OO
/1 00200 r •
40 60 80 100
Initial Stress Ratio - f Ilf - percent s y
FIG. 4. 2 EFF~T OF INITIAL STRESS LEVEL ON RElAXATION LOSS Data from 'Series o.rlOO, SRlOO, and OR200, Appendix A
120 140

0.8 ~--~~--+-~~~~~---------+---------4--------~
o.6~~~--~--------~--------~---------+--------~
0.4~------------------~---------+---------4--------~
0.2 ~--------~---------+----------~--------4---------~
o~ ________ ~ ________ ~ __________ ~ ________ ~ ________ ~ o 10,000 20,000 30,000 40,000 50,000
Time - Hours
FIG. 4.:; RATE OF RELAXATION LOSS
.... .....
. ~ • --' •
~
ia .....
I I
(\I o • .
r-f M
I I I
. -
I !
ex:> \0 ..:r C\I . . . o o o
uamloadS ~~o~a~s~~-uOR IOl~9H 99~~S TUal~ UClmlOactS -paqo~a~sa.%cI IOl~'9H S8a~s tval~
. o
0
8 ... 0 M to
~ I-f
~ Q
CD ~ ~ ~ = ~
0 ~ 8 d
0 CJ) M or-f ~
~ &3
~ ~
t:i -+l
I
Ul
~ Q)
E-t
I ~
0 0 r" ....
r-f 6 E-t &i ~ ..=t . ..:t . 0 H ~
0 M o
d
! s:2 ()
~ GJ P4
or-I U) () Q) rg P4
U) .d rd $ Q) t)
.d () ..., U) Q) 4>
b f1 CD I Q) d
~ ~ .... .. .,.... "'P"4 to m
CH ..............
co ., ct-4 ct-4
.... .... 0 0 .,.... "'P"4
"liS ~ ~ ex; co .. m WI Q) t)
b b m en
a ~ .,.... "'P"4 ~ rae
1.2
1.0
0.8
0.6
0.4
o.z
o
- -• •
I
20 40 60 80
Initial Stress Ratio - f ilf - percent 8 y
FIG. 4. 5 EFF~ OF PRESTRm.'CHIln IN TESTS wrm DIFFERENT INITIAL ~s RATIOS
• • • • •
100
100 I 90
80
~ OJ 70 ()
8. 60
.,.. U»
tt-4 ........... 50 U» ~
0 40 ·rf +l
8! m to 30 G>
b CI.l
cd 20 ~ ·rf fzt
10
0
10
I
100
f s - 1:1 f .. .......
I
1000
,Time - Houra
1
r ilf s y
/ 0.6 /
0.7 I
0.8 /
/ 0.9
1 + l( p-1~ ..
/ /
//
V/// / 0/ ~ ~
~ / V
/ /
V
\
1 ,- .a. f
+ .... v ~ v (~
f5 f Y
,
10,000
FIG. 4.6 VARIATION OF STRESS WITH TIME ACCORDING TO EXtUA.TION 1
_ I
/ r-I
I
I
t - 0.5 ;)
I
100,,000
11 t) (J
~ ... ~
~ ~
co • CH dl 4)
~ b II
~ til
~ ..., Q) ClQ
0 t lI'\ 0
~ ~ Q) 0
ClQ It 02 fl.4 CD 1
b M •
{Jl 0
----~----~--_r~--~--~ 100 i
~--.
60
40
20
._--+-----
20 40 60 &l
Initial Stres8 Ratio - tilt - percent 8 y
100
FIG. 4. 7 COMPARISON OF THE REMA.INING STRESS AFTER 50 YEARS BASED ON ~UATION 1 wrm THE INITIAL STRESS


APPENDIX A
TESTS AT THE UNIVERSITY OF ILLINOIS
Aol Object
The object of the investigation at the Structural Research Laboratory
of the University of Illinois Civil Engineering Department was to study the
effects of time, level of initial stress, type of ~reJ and prestretching on
the relaxation losses of prestressing wireo
Ao2 Scope
A total of 57 specimens were tested, the longest reported test
duration being 7 years. All tests were carried out on approximately 3-ft
pieces of Oo2-ino prestressing wire.
The level of initial stress varied from 51 to 88.5 percent of the
tensile strength of the specimen 0
The prestressing wires tested were received from different manu
facturers and had been given different treatments as described in section Ao4.
To study the effects of prestretching, pairs of specimens were tested,
each pair at a given initial stress level. One of the wires of each pair was
prestretcbed to a stress 10 percent greater than the desired stress and held
there for 10 to 15 minutes before being anchored at the desired stresso
Ao3 Outline of Tests and Designation of Test Specimens
The test specimens were cut from ~re received from four different
manufacturers and were subjected to six different types of treatment as follows:

-A.2-
Number of Desi~ation Manufacturer Treatment S;Eecimens
SO AS&Wa Straightened, not stress-relieved 6
SR AS&W Straightened, stress relieved 8
OR AS&W and UWR b Stress relieved 32
NR AS&W Stress relieved 5
OT Wickwire Oil tempered 4
B Somerset c Special treatm~nt to reduce 2 relaxation loss
The NR wire is distinguished from the OR wire in that the NR wire
lies nearly straight when it is cut from the coil while the OR wire describes
an a:cc with a radius of curvature of approximately six feeto
In the designation of the test specimens, three numerals follow the
letters, eog.) SOlOlo The first numeral designates the coil from which the
specimen was cut, the remaining two numerals distinguish that particular
specimen from others cut from the same coilo The presence of a letter P
after the numerals indicates that the specimen has been prestretched, eog.)
A~4 Description cf Wire Properties
Specimens designated by the prefixes SO, SR, OR, and NR, with the
exception of series OR40o, were cut from wire manufactured by the American
Steel and Wire Division of the United states Steel Corporation. The wire was
d:rawn from bigh- car-bon open-hearth steel with the following ranges of chemical
analysis: Carbon, 0075-0.86 percent; ~~~aneSe, 0050-0.90 percent;
a
b
c
American Steel and Wire Division of United States Steel Coo
Union Wire Rope Corporation
Somerset Wire Company Ltd., U.K.

Silicon, 0.20 to 0027 percent; Phosphorus, 00045 per.~ent maximum, and
Sulphur, 0.050 percent maximum. The straight wire was straightened mechani-
cally. Stress-relieving was accomplished for types SR and OR by immersion
in hot lead at 800oF for a period of 5 to 15 sec.
The specimens of series OR40o were cut from 'Wire manufactured by
the Union Wire Rope Corporation of Kansas City, Missouri 0 This wire was
drawn from a heat with the following chemical analysi s : Carbon, 0 .85 percent;
Manganese, 0084 percent; Phosphorus, 00010 percent; Sulphur, 0.029 percent;
and Silicon, 0.018 percent. The wire was stress-relieved and not straightened.
The specimens of series OT were cut from straight oil-tempered wire
manufactured by the Wickwire Spencer Company.
The wire used in series B was manufactured specially to reduce
relaxation losses by the Somerset Wire Company Ltd. of the U.Ko The heat
analysis was approximately in the follOwing ranges: Carbon, 008 to 0.85
percent; Manganese, 006-0.8 percent; Sulphur, 0.05 percent maximum and
Phosphorus, 0.05 percent maximum.
The stress-strain curves based on 8-in. gage lengths for all of the
wires are shown in Fig 0 Aol. The diameter of the wire is indicated in each
figureD The tensile properties used in the study of the data are summarized
below 0
Series
SOlOO SR100 OT100 OR100 OR200 00300 OR40o OR500 NRlOO B100
Tensile Strength 001% ksi
244 240 214 250 264 255 266 264 25-$-234
Offset Stress Stress at 1% Strain ksi ksi
150 203 201 210 193·5 .,,,,0
.L>'U,
206 221 218 237 210 215 223 234 208 225 227 231 201 20405
-Ao4-
Ao5 Test Equi~ment
Because of the simplicity of the stressing frame and the small amount
of laboratory space required} the vibration technique used by Dawance (1948]
was ado~ted for the measurement of relaxation losseso The test ~rocedure is
described in section A.6o
Wire specimens were mounted in steel frames fabricated from 3-fto
lengths of 8 by 8-in. wide-flange beam sections 0 Plates 105 ino thick were
welded at the ends of the wide-.flange section to provide abutments for the
stressed wireso These end ~lates were drilled to accomodate four wires in
each test frame 0
In order to provide definite nodal points near the ends of the
s~ecimen when vibrated, quarter-inch screws were mounted in tap~ed holes in
the beam flanges (See Figo AoIO) so that these screws could be adjusted barely
to touch the wire.
Two types of anchorages were used to hold the stretched wires. For
s~ecimens with an initial stress up to about 70 ~ercent of the tensile strength
of the wires, threads were cut on the ends of the specimen and a hardened steel
nut was run over the threads to bear against the end plates of the test frame 0
For specimens with a...'1ini tial stress greater than about 70 percent of the
tensile strength of the wire} the anchoring grip consisted of three hardened
tapered wedges from a commercial 6 BWG-size Strandvise grip bearing on an
internally :tapered studo. Whenever this type of anchorage was used; o "OOOl=ino
Last-Word dial gages were mounted on the ends of the specimen (Fig" AoIO) to
measure slip at the anchorage" if any"
The wire was stressed by anchoring one end) and applying a force on
the other end with a center-hole hydraulic jack; a pull-rod bearing on the ram
was devised to grip the wire.. When the wire was stressed to the desired level,
anchorage was effected by turning the anchorage nut so that it made positive
contact with the bearing plate or by turning the stud against the bearing plate
so that the Strandvise grips locked the wire, -whichever the type of anchorage
used ..
The applied force was measured with a dynamometer incorporated in
the pull-rod. This dynamometer, equipped with SR-4 strain gages, was calibrated
at 10 lb per dial division on the strain indicator Which could be read reliably
to one-half dial division.
The electrical apparatus employed to vibrate the wire, to observe the
resonant vibration of the wire and to measure the frequency of vibration, is
shown schematically in Fig .. Ao2o
The main components of the electrical apparatus were ~
(1) An oscillator, with variable frequency output ..
(2) A frequency counter which counted the number of cycles in
10 seconds of the oscillator output, and hence gave the
oscillator frequency correct to 0.1 cycles per secondo
(3) An electromagnetic vibrator, fed by the oscillator through a
variable-output amplifiero The vibrator was mounted about
1/32-in. from the wire, at its roidpointo
(4) An ear-phone, mounted close to the wire to pick up the forced
vibration of the wire.
(5) A cathode-ray oscilloscope; the output of the oscillator was
fed directly into the horizontal deflecting plates, and the
current generated in the ear-phone by the vibrating wire was
fed into the vertical deflecting plateso

-A,,6-
When the oscillator frequency coincided with the natural frequency
of the wire, a ufigure eight If was obtained on the oscilloscope, since the
wire made one complete oscillation for both the positive and negative half-
cycles of the driving current.
The wire was vibrated in the third mode for two reasons~ (1) It
reduced the effects of uncertainties regarding the end conditions of the
wires, and (2) it raised the frequency of the wire to a pitch at which it
was audible, and hence the resonant frequency could be located approximately
by ear. Thus, the resonant position was indicated by three means~
(1) sound,
(2) appearance of a flfigure eight" on the oscilloscope) and
(3) reaching of the maximum vertical dimension of the figure on
the oscilloscope.
The maximum vertical dimension of the figure eight increased greatly at
resonance necessitating reduction in the amplification of the oscillator
output.
A.6 Test Pro2ed:..:e
The ~re:;'...;.e~::,· of vibration of a stressed string is given by the
expressior:
f ~~ 2L w
where f :; f:"e :;:...;.e:'.:y of lateral vibration
k = 2, 3, . · · · 00 ... ,
L = leDe~::' of string
T = force
-wIg = mass per unit length

-Ao 7-
Equation A.l was not directly applicable to the test conditions
because the wires had a finite, though small, bending stiffness and the test
frames were not absolutely rigid. However, a linear calibration could be
obtained between the stress in the wire and the square of the frequency for
a particular mode of vibrationo Ther'efore) the stress in the wires was
determined from individual calibrations 0 The calibration was obtained by
making several frequency measurements as the wire was stressed to the desired
level for series SOlOO, SR100, OR100, OR200) and OR300o Since it was felt
that this procedure might affect relaxation losses, the calibration was
obtained for the remai~;ng series from two cR.libration tests on identical
wire samples prior to the stressing of the actual test specimen in a particular
position in the test frameo
T~us, in some tests the desired level of stress was reached in five
increments, ~~th the frequency measured at each increment, while in others
the desired stress was reached on one increment. As soon as this stress was
reached ~~e ~~e ~as anchored and the third-mode frequency was reRn immediatelyc
This rea.d.i::lg vas taken to indicate the initial stress level in the wire 0, The
dial gages, if a.::y, were set as soon as the frequency reading was made 0
T~e .r~re was subsequently vibrated at suitable intervals of time to
obtain the s~ess in the wire and changes in the dial gage ~eadings, if any,
were noted. Several readings were taken in the first hour of test and later
at greate~ i~ter~~s of time, in accordance ~th the decreasing rate of relay~tiono
A.7 Test Results
The test results for the 57 specimens are reported in detail in
Fig. A.3 through A.12 and Tables Aol through Ao3 0

-Ao8-
The figures show the variation of stress with the logari·thm of time
for the ~uration of each test.
Table Aol lists some physicall'roperties of the wire along with the
initial and final stresses for each test. Table A.2 lists the stresses measured
at various times as indicated and Table A.3 gives the relaxation loss at those
times. These quantities are given as unit stresses and as ratios of the initial
stresses.
The test results are discussed in the report proper.
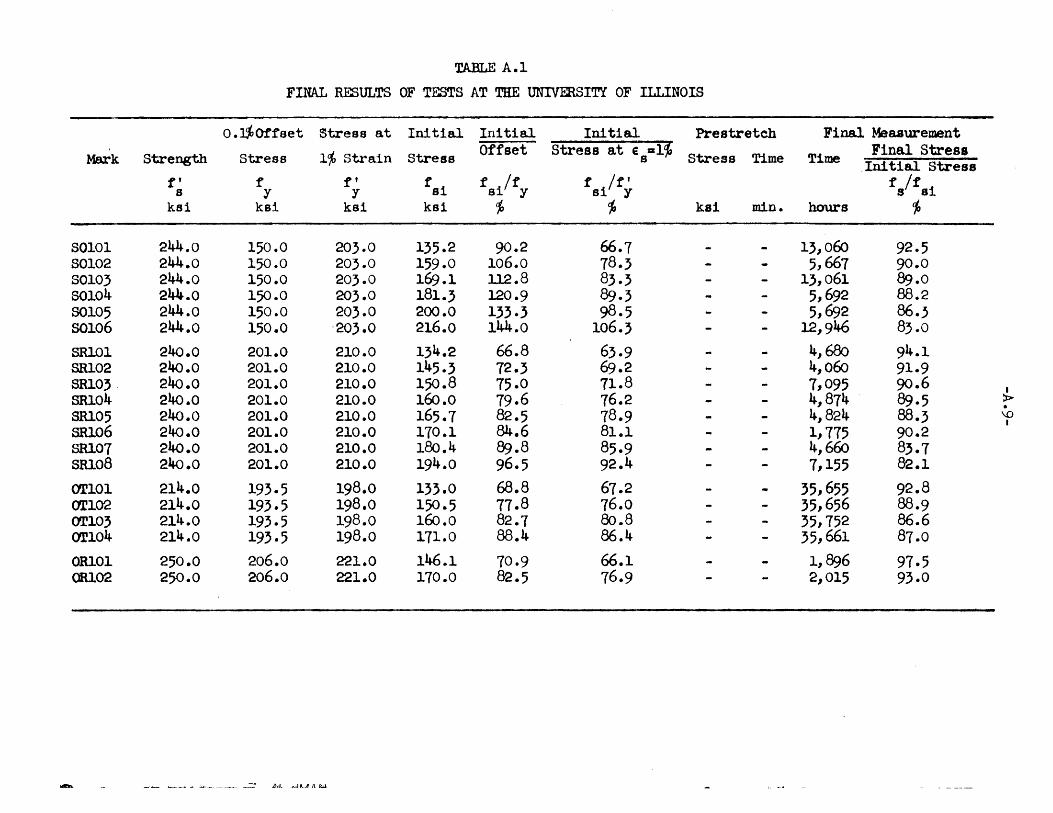
TABLE A.1
FINAL RESULTS OF TESTS AT THE UNIVERSITY OF ILLINOIS
o. u,Of'f'set Stress at Initial Initial Initial Prestreteh Final Measurement
Mark Strength Stres8 l~ Strain Stress Offset Stress at Es=l~ Stress Time Time Final Stress Initial Stress
f' f f' f'Si f ilf' f If" fs/fSi 8 y Y S Y si y kei ksi ksi ksi 10 ~ kai min. hours 'f,
SalOl 244.0 150.0 203.0 135.2 90.2 66.7 13,060 92.5 80102 244.0 150.0 203.0 159.0 106.0 18.3 5,661 90.0 S0103 244.0 150.0 203·0 169.1 112.8 83.3 13,061 89.0 50104 244.0 150.0 203.0 181.3 120.9 89.3 5,692 88.2 80105 244.0 150.0 203.0 200.0 133.3 98.5 5,692 86.3 80106 244.0 150.0 '203.0 216.0 144.0 106.3 12,946 83.0 SRlOl 240.0 201.0 210.0 134.2 66.8 63.9 4,680 94.1 SRl02 240.0 201.0 210.0 145.3 12.3 69.2 4,060 91.9 SRl03 240.0 201.0 210.0 150.8 15.0 11.8 7,095 90.6 I
SRl04 240.0 201.0 210.0 160.0 79.6 16.2 4,814 89.5 » . SRl05 240.0 201.0 210.0 165.1 82.5 18.9 4,824 88.3 \0
I
SRl06 240.0 201.0 210.0 170.1 84.6 81.1 1,715 90·2 SlU01 240.0 201.0 210.0 1~.4 89.8 85.9 4,660 83.7 snoB 240.0 201.0 210.0 194.0 96.5 92.4 7,155 82.1
OT101 214.0 193.5 198.0 133.0 68.8 67.2 35,655 92.8 OT102 214.0 193.5 19B.O 150.5 77.B 76.0 35,656 88.9 OT103 214.0 193.5 198.0 160.0 82.7 80.8 35,752 86.6 OT104 214.0 193.5 198.0 111.0 88.4 86.4 35,661 87.0 0Rl01 250.0 206.0 221.0 146.1 70.9 66.1 1,896 97.5 0Rl02 250.0 206.0 221.0 110.0 82.5 76.9 2,015 93.0
- _'.L....- ~--.o....L .:.:.r..:~ __ ~_ _ Ji..£ ..vJUJt&oJ.

TABLE A.1 (Cont'd.)
o • Y/o Offset Stress at Initial Initial Initial Prestretch Final It.feaaurement
Mark Strength Stress 1~ Strain Stress Offset Stress at E .. 1~ Str Time Time lr1nal stress s ess lltli tlal Stres,; t' r f' fai f Ilf fit' ta/tsi 8 y Y s Y 01 Y ka1 kl1 kl1 kll ~ ~ kai min. hours 10
Cit201 264.0 218.0 2'7.0 1,6.0 62.4 57.4 4,604 97.8 OR202-P 264.0 218.0 2'7.0 142.7 65.4 60.~ 15~.1 15 il,948 96.~ OR20~ 264.0 218.0 2'7.0 151.8 69.6 64.1 11,9~4 95.9 OR204-P 264.0 218.0 2'7.0 152.8 10.1 64.5 165.2 15 1l~903 96.4 CIl205-P 264.0 218.0 237.0 161.0 7~.9 67.9 116.0 15 1,011 91.5 00206 264.0 218.0 231.0 161.8 74.,' 68.3 4,560 95.9 OR207 264.0 218.0 237.0 167.5 16.8 70.1 11,980 93.8 Clt208-p 264.0 218.0 231.0 168.5 11.3 ' 71.1 186.9 15 4,442 94.4 OR209-p 264.0 218.0 231.0 119.0 82.1 75..5 205·0 15 1,229 95.1 OR210 264.0 21.8.0 231.0 186.5 85.5 78.6 72,496 81.8 OR211-P 264.0 218.0 231.0 186.8 85.6 78.8 204.5 15 944- 96.5 I
OR2l2-P 264.0 218.0 231.0 194.0 89.0 81.9 220.1 15 4,310 92.3 ;t> • OR213 ... p 264.0 218.0 231.0 209.0 95.8 88.2 229·1 15 1,205 93·9 I-' 0
142.0 67.6 66.0 5,040 I
OR301-P 255.0 2l.O.0 215.0 153·5 10 97.5 OR302-P 255.0 210.0 215.0 145.0 69.0 61.4 158.5 10 5,040 95.9 OR303-P 255.0 210.0 215.0 151.0 71.9 70.2 161.5 10 28,201 94.2 00304 255.0 210.0 215.0 152.0 12.4 70.1 28,201 95.5 OR}o5 255.0 210.0 215.0 170.0 81.0 19.0 28,321 92·7 OO;o6-P 255.0 210.0 215.0 170.0 81.0 19·0 187.0 10 28,~21 92.6 OR301-P 255.0 210.0 215.0 202.7 96.6 94.4 224.4 10 58,984 88.6 OR308 255.0 210.0 215.0 200.0 95.2 93.0 60.064 85.4 OR309-P 255.0 210.0 215.0 190·0 . 90.5 88.4 207.5 10 59,716 86.0 00310 255.0 210.0 215.0 188.0 89.5 81.4 59,176 87.6
OR401-P 266 223 234 212.6 95.4 91.0 234.4 10 21,146 88.1 OR402 266 223 234 209.1 94.1 81.6 21,145 88.4 OR403"P 266 223 234 188.4 84.5 80.5 - 205.2 10 _ 59,148 89.2 00404 ' 266 223 234 189.0 84.8 80.8 21,743 84.6 00405 266 223 234 189.0 84.8 80.8 59,681 87.9

~LE A.l (Cont'd.)
O.~Offset stress ,at Initial Initial Initial Pre stretch Final Measurement
Mark strength Stress Ie;, Strain Stress Offset Stress at t zzliJ stress Time Time Final Strels s Ini t1al Stress f' r f' fsi f i/f f /f' ts/tsi s y y s '1 8i Y ksi kai kai kai 10 10 kai min. hours 10
OR501 264 208 225 143.4 69.0 63.8 8,944 96.3 00502 264 208 225 134.4 64.6 59.1 8,944- 96.5 NR101 255 227 231 132.0 58.1 57.1 35,822 94.3 NR102 255 227 231 149.0 65.6 64.5 35,819 90.7 NRl03' 255 227 231 175.0 77.1 75.7 35,821 86.5 NRI04 255 227 231 190.8 84~1 82.6 35,823 84.8 NRlO5 255 227 231 200.'0 88.1 86.5 35,826 85.1 BIOI 234 201 204.5 203.0 101 99.2 9,103 89.1 B102 234 201 204.5 180.1 89.6 88.2 8,135 95.7 .. » .
~ •
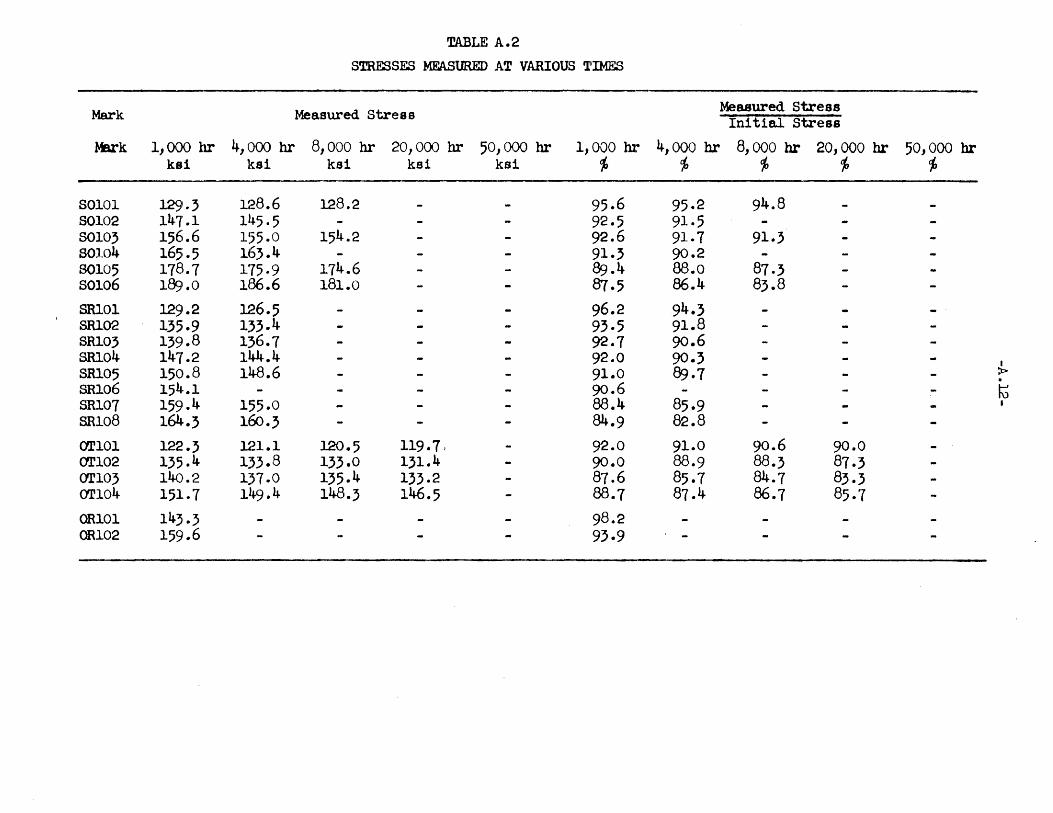
TABLE A.2 STRESSES MEASURED AT VARIOUS 'l'IMES
Mark Measured Stress Measured Stress Initial Stress
lerk 1,000 hr 4,000 hr 8,000 hr 20,000 hr 50,000 hr I, 000 lu~ 4,000 hr 8,000 hr 20,000 hr 50,000 hr kei ksi kai kai kai rf, 'fr, % cf, c;,
SOlO 1 129·3 D28.6 128.2 95.6 95·2 94.8 S0102 147.1 11l5.5 92.5 91.5 S0103 156.6 155.0 154.2 92.6 91.1 91.3 80104 165.5 163.4 91.3 90.2 80105 118.1 1'75 ·9 174.6 89.4 88.0 81.3 80106 189.0 1~36.6 181.0 87.5 86.4 83.8 SRl01 129.2 L~6.5 96.2 94.3 SRl02 135.9 133.4 93.5 91.8 SRlO; 139.8 136.7 92.1 90.6 SRl04 147.2 1J~.4 92.0 90.3 I
SRl05 150.B 1J~.6 91.0 &:).7 :t> . SRl06 154.1 90.6 h) SRl07 159.4 1~;5 .0 88.4 85.9 I
SR10B 164.3 160.3 84.9 82.8 OT101 122.3 lJ~1.1 120.5 119.7, 92.0 91.0 90.6 90·0 CYl'102 135.4 1~53 .8 133.0 131.4 90.0 88.9 88.3 87.3 OTI03 140.2 1~~7 .0 135.4 133.2 81.6 85.1 84.1 83.3 OTI04 151.1 149.4 148.3 146.5 88.1 87.4 86.1 85.7 0Rl01 143.3 98.2 00102 159.6 93.9
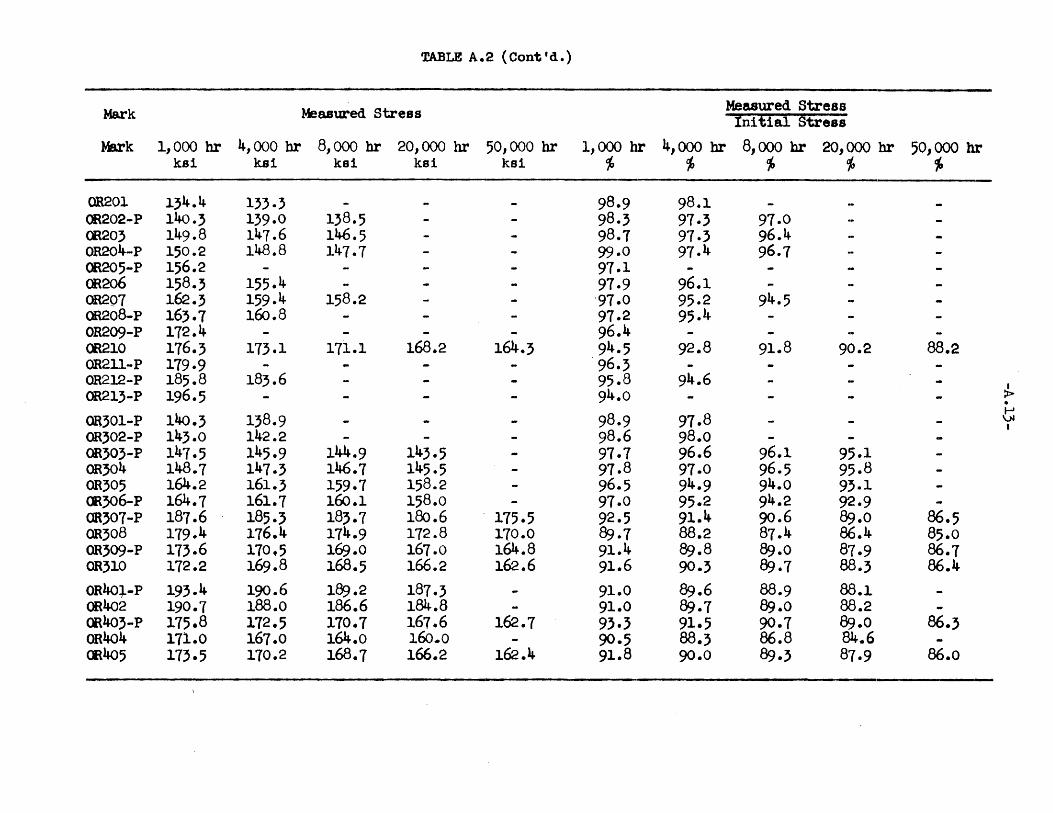
TABLE A.2 (Cont 'd.)
Mark Measured Stress Measured Stress Initial Stress
Mark 1,000 br 4,000 br 8,000 hr 20,000 hr 50,000 hr 1,000 hr 4, 000 hr 8,000 br 20,000 hr 50,000 hr ks1 ka1 ka1 ka1 ka1 ;,
'" c;, '10 '10
OR201 134.4 133·3 98.9 98.1 00202-P 140.3 139·0 138.5 98.3 97.3 97.0 <E203 149.8 147.6 146.5 98.1 97.3 96.4 0R204-p 150.2 148.8 147.7 99·0 97.4 96.1 00205-P 156.2 97.1 OR206 158., 155.4 97.9 96.1 OR207 162., 159.4 158.2 '97.0 95.2 94.5 OR208-P 163.7 160.8 91.2 95.4 OR209-P 172.4 96.4-00210 116.3 113.1 171.1 168.2 164.3 94.5 92.8 91.8 90.2 88.2 OR211-P 179·9 96.3 OR212-P 185.8 183.6 95.8 94.6 I
OR213-P 196.5 94.0 > . 140.3 138.9 98.9 97.8
I-' OR301-P \,)I
I OR302-P 143.0 142.2 98.6 98.0 OR303-P 147.5 145.9 144.9 143.5 91.7 96.6 96.1 95.1 OR}04 148.1 141.3 146.7 145.5 97.8 97.0 96.5 95.8 00305 164.2 161.3 159.7 158.2 96.5 94.9 94.0 93·1 <E3Q6-P 164.7 161.7 160.1 158.0 97.0 95.2 94.2 92.9 OR307-P 187.6 185.; 183.7 180.6 ' 175.5 92.5 91.4 90.6 89.0 86.5 OR308 119.4 176.4 174.9 172.8 170.0 eJ).1 88.2 81.4 86.4 85.0 OR309-P 173.6 110.5 169.0 167.0 164.8 91.4 89.8 89.0 87.9 86.1 OR310 172.2 169.8 168.5 166.2 162.6 91.6 90.3 &).7 88.3 86.4-OR40:).-p 193.4- 190.6 1&).2 187.3 91.0 89.6 88.9 88.1 00402 190.7 188.0 186.6 184.8 91.0 P$.7 P$.O 88.2 00403-P 175.8 172.5 170.7 167.6 162.7 93.3 91.5 90.1 89.0 86.3 OR 40 4 171.0 167.0 164.0 160.0 90.5 88.3 86.8 84.6 CE405 173.5 110.2 168.7 166.2 162.4- 91.8 90.0 89.3 87.9 86.0

TABLE A.2 (Cont'd.)
Mark Measured Stress Measured stress In! tlal Stress
Mark 1,0(>0 br 4,000 hr 8,000 hr 20,000 hr 50,000 hr 1,000 hr 4,000 hr 8, ()()() hr 20,000 hr 50,000 hr klli kai ksi ksi ksi 10 10 10 10 10
00501 139.6 138.9 138.5 91.2 96.7 96.5 00502 130.B 130.0 129.8 91.2 96.1 96.5 muOl. l22.4 122.0 121.1 121.4 92.8 92.4 92.2 92·0 NRI02 13~;. '1 135.2 135.0 133.9 91.1 90.1 90.5 89.9 NIUO} 15~).1 152.1 151.6 1~.9 88.6 81.3 86.1 85.1 ,NRl.o4 16~) .1 163.0 161.9 160.3 86.6 85.4 84.9 84.1 muo5 11~~. :4- 169.9 168.5 166.1 86.2 84.9 84.2 8}.0
B101 181~ •. :, 181.1 180.9 90.8 89.5 89.0 B102 111~ .6 172.9 112.4 96.9 96.0 95·1 I
!l> . ~ ..p-I

TABLE A.;
RELAXATION LOSS MEASURED AT VARIOUS TIMES
Mark Relaxation Loss Relaxation Lo8S
Initial stress
Mark 1,000 br 4,000 hr 8,000 hr 20,000 hr 50,000 hr 1,000 hr' 4,000 hr 8,000 hr 20,000 hr 50,000 hr ka1 kal kai ka1 kal ~ "P '10 ~ ~
S0101 5.9 6.6- 7.0 4.4- 4.9 5.2 SOl02 11.9 1~~ .5 7.5 8.5 S0103 12.5 14.1 14.9 7.4 8., 8.8 50104 15.8 17.9 8.7 9·9 80105 21.; 21".1 25.4 10.6 12.0 12.7 80106 27.0 29.4 35.0 12.5 13.6 16.2 SRlOI 5·0 7.1 ;.7 5.1 SRl02 9.4 11.9 6.5 8.2 SRl03 11.0 14.1 7.3 9.' SRl.04. 12.8 1~5 .6 8.0 9.8 I
SRlO5 14.9 1'7.1 9.0 11., » . SRl06 16.0 9.4 J--I
VI
2~5 .4 11.6 14.1 I SRl01 21.0 SRl08 29.7 33.1 15.3 17.4 OTI01 10.7 ~l.9 12.5 13.3 8.1 9.0 9.4 10.0 0Tl02 15.1 16.7 11.5 19.1 10.0 11.1 11.6 12.1 OT10; 19.8 2:3.0 24.6 26.8 12.4 14.4 15.4 16.7 OT104 19.3 21.6 22.7 24.5 1~.3 12.6 13·; 14.3
0Rl01 2.8 - 1.9 00102 10.4 6.1

TABLE A.3 (Cont'd.)
Mark Relaxation Loss Relaxation Loss Ini t1al Stress
Mark 1,000 hr 4,000 hr 8,000 hr 20,000 hr 50,000 hr 1,000 hI- 4,000 br 8,000 hr 20,000 br 50,000 hr ks:! ka1 kai kai ksi ~ ~ i ~ 10
00201 1.6 2.7 1.2 2.0 OR202-P 2.4 3·1 4.2 1.1 2.6 2.9 OR203 2.0 4.2 5.' 1.3 2.8 '.5 OR204-P 2.6 4.0 5.1 1.7 2.6 3.3 OR205-P 4.8 3·0 00206 3.5 6.4 2.2 4.0 OR207 5.2 8.1 9., ,.1 4.8 5.5 OR208-P 4.8 7.1 2.8 4.6 OR209-P 6.6 }.7 OR210 10.2 13.4 15.4 18.; 22.2 5.5 7.2 8.; 9.8 1l.9 OR211-P 6.9 ,.7 OR212-P 8.2 10.4 4.2 5.4 • » OR21;-P 12.5 6.0 •
I-' 0\
OR;Ol-P 1.7 3.1 1.2 2.2 • cm;02-P 2.0 2.8 1.4 1.9 OR30;-P 3.5 5.1 6.1 7.5 2.3 ;.; 4.0 5.0 OR;o4 3·3 4.1 5., 6.5 -. 2.2 ;.1 ;.5 4., OR305 5.8 8.1 10·3 11.8 3·, 5·1 6.1 6.9 OR306-p 5.; 8., 9·9 12.0 ,.1 4.8 5.8 7.1 OR301-P 15.1 11.4 19.0 22.1 27.2 7.4 8.6 9.4 10.9 13.4 OR308 20.6 23.6 25·1 21.2 ;0.0 10.3 il.8 12.5 13.6 15.0 OR;09-P 16.4 19.5 21.0 2;.0 25.2 8.6 10., il.O 12.1 13., OR310 15.8 18.2 19.5 21.8 25.4 8.4 9·1 10.4 11.6 13.5 OR401-P 19.2 22.0 2;.4 25.; 9.0 10., 11.0 1l.9 00402 19.0 21.1 2;.1 24.9 9·1 10.; il.O 11.9 OR40;-p 12.6 15.9 11.7 20.8 25.1 6.1 8.4 9.4 11.0 13.6 OR404 18.0 22.0 25.0 31.0 9.5 11.6 1;.2 16.4 OR 40 5 15·5 18.8 20.3 22.8 26.6 8.2 9.9 10.7 12.1 14.1

TABLE A.3 (Cont'd.)


300 r-- _____ r ____
t' • 264 k .1 tal. 2 44 ks1 f' • 240 kal
., 8 -
V ...... t' • 250 ka1
L .--
~ l----~,. ~ r; ;~-I( 8
V-- ~ --ff !---- ~~18 ~ 11
~7 ~--- 1-- >---- --r---'-- -----.----"-b
~1 f klJ1 1 '-206 k '" 201 k 193.5
1 r I,
,~ r-150 H .1 ij D 1/ /1
~ ~ J~ I
/J IJ ~oo!l ..... ~ O.1~ I
ott.a!; I I SOl po. I S!U no po _00 ~OO
.-.... ..... ~ .... I II" !.'I K I ,-- -- ~"'-
1/
li1~O ) I, .
I
1Di .. P.192' .192" J Dlaa 0.192' IJ D1a-P.192 t1 111m .. P.195" 0.01 i I
I
250
200
t' • 255 11 f!!-- ~ ksi I
• ~ ~! • 2
~ ~ tt • 266 11 ~ V ~t' ~ 255 t81 £1 • ~34 ke.
I~ • ~ a 8 -81 / I ~221 k 81
I
A 1~210 ~ ~1 ~ r' 208 lui /1 l' "201k; 11
II
1/ O.1~ lttaet II
QR3 00 OB~ 00 n em 500 qHRl po B10P
VI I I
D1a. P.196' f~ D1a-0.198' qD1~ P.196' ~ D1a-P.196' ~ D 1.-p.200" ---------.-~
L ______
Strain
FIG. A.1 S'l'RESS-STRAD CURVES

,-l_~M~lIFIER .
Last Word Gage
r-1
- - -- - .. ---- .. -- -- -. - -1---- -. --- - -.--.----.-
---------.1 i _ _. _ 1 __ Horizontal
Inout CATHODE RAY r FREa~ENCY- j
l. METER____ !oSCILLATOR l L ______ J ,------- . I OSCILLOSCOPE
Vertical Input
Vibrator ----------:"---
Pickup
FIG. A.2 SCHFltlATIC VIEW 01 TEST Sm'UP
~
ardened Steel Nut
"'-Threaded Hollow Stud
Threaded Anchor Sleeve
~8VF36 Beam
..-f til ~
. t
co tn Q)
!J CIl
220
200
180
160
140
120
100
80
60
40
20
0_ 10 100
Mark
--101
102
103
104
105
106
1000
Time - Hours
---
Initial Stress
ksi
135.2
159.0
169.1
181.3
200.0
216.0
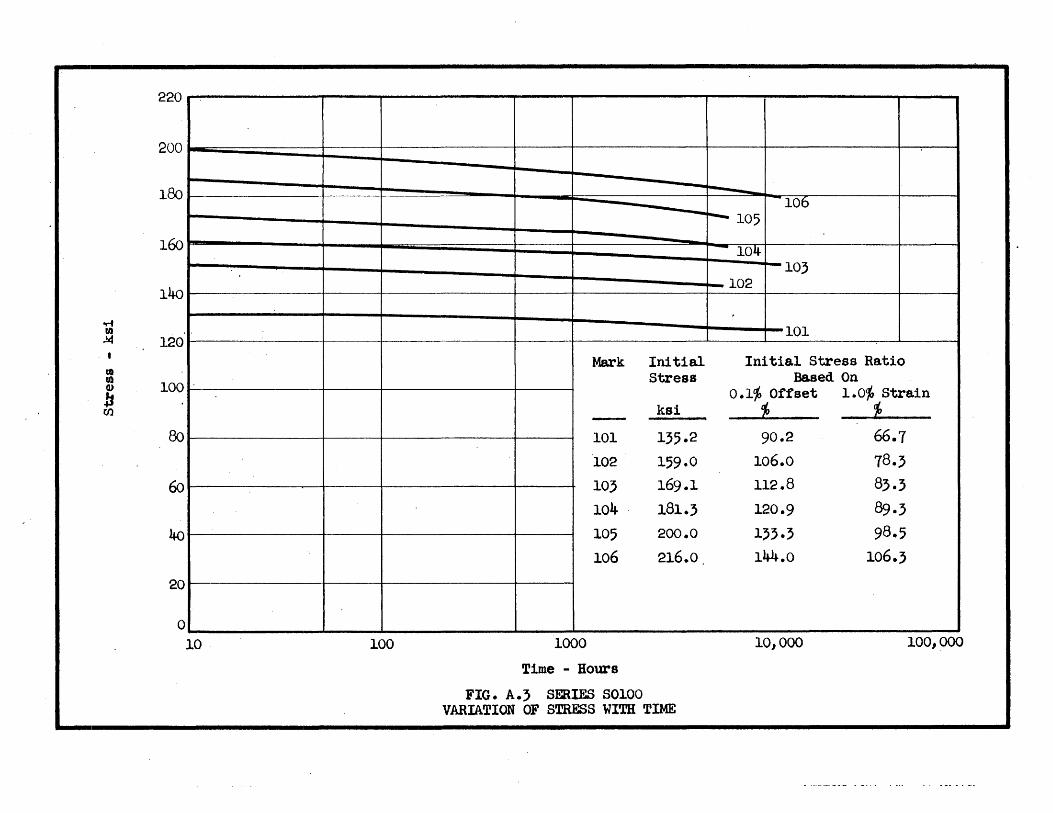
FIG. A. 3 SERIES S0100 VARIATION OF STRESS WITH TIME
----.. -106
~ 105
- 104 -103
102
101.
Initial Stress Ratio Based On
0.1% Offset 1.010 Strain ~ * 90.2 66.1
106.0 18.3 112.8 83.3
120.9 89.3
133.3 98.5
144.0 106.3
10,000 100,000

200
180 -
160
140
120 OM
~ 100
{Q to Ql
b 80 CIl
60
40
20 ~ ...
0
10 100
-106 ~~r 10~ 10 ~04
-Ie D -103 F-- 1101
Mark Initial Initial Stress Ratio
-101 102 103 104 105 106 101 108
1000
Time - Hours
stress
ksi
134.2 145.3 150.8 160.0 165.7 170.1
1tkJ.4 194.0
FIG. A. 4 SERIES SRI00 VARIATION OF STRESS WITH TIME
Based On 0.1;'· Offset 1. CJ1, Strain
~ cf,
66.8 . 63.9 12.; 69.2
15.0 , 11.8
79.6 16.2 82.5 '"(8.9 84.6 81.1 89.8 85.9 96.5 92.4
10,000 100,000

.,... ~
foG co OJ
.f1 (J)
220
200
180
160
140
120
100
80
60
40
20
o 10
-~----.-- ---- ~---- -------
100
.-
Mark Initial stress
kai -101 1".0 102 150.5
10, 160.0
104 171.0 ---------
1000
Time - Hours
FIG. A. 5. SERIES ar100 VARIATION OF STRESS WITH TIME
- 104-
_ 10, 102 101
Initial StreBs Ratio Based On
O.l~ Offset 1.\f1, Strain
'" A'
66.8 67.2
77.8 76.0
82.7 80.8 88.4 86.4-
10,000 100;000

...... - E
orf
J!}
aa to ~
b cil
220
200
180
160
140
120
II 100 I
80
60
40
20
o 10 100
Mark
-101
102
1000
Time - Hours
-102
101
Initial stress
ksi
146.1
110.0
FIG .. A.6 SFllIES ORlOO VARIATION OF STREES WITH TIME
Initial stress Ratio Based On
0.1'" Offset 1.CfI, strain 'f, ~
70.9 66.1
82.5 16.9
10,000 100,000

. - .
..... l!
to to Q)
.fj (Jl
220
200 "'"
"'" 180
.,
., "" 160 ,
140
120
100
80
60
40
20
"" o 10 100
213-P
211-P 209-P
205-P
Mark
-202-P 204-P
205-P 208-P
209-P 211-P 212-P
213-P
1000
Time - Hours
Initial. stress
kai
142.7 152.8 161.0
168.5 179.0 186.8
194.0 209.0
FIG. A. 7a smIES OR200 VARIATION OF STRESS WITH TIME
212-P
I I
208-P 204-P
202-P
Initial stress Ratio Based On
0.1'" Offset ~
1. <y,(, strain ~
65.4 60.3 70.1 64.5 I
I
73.9 67.9 I
77.3 71.1 82.1
i
75.5 85.6 78.8
89.0 81.9
95.8 88.2
10,000 100,000
. .. '

220
200
180
160
140
oM
~ 120
UI UI 100 (1)
Jj (Jl
80
60
40
20
o 10 100
- g06
~l
Mark Initial
-201 203
206 201 210
1000
Time - Hours
Stress
kal
136.0
151.8
161.8 161.5 186.5
FIG. A. 7b SEEIES OR200 V.ARIATION OF STRESS WITH TIME
-210 - 207 - '-203 j
i
I
Initial stress Ratio Based On
o.li Offset cj,
1.0'/0 Strain 'f,
62.4 57.4 69.6 64.1
74.3 68.3 76.8 10.1 85.5 78.6
10,000 100,000
i -- -
.,... U)
.!4
rIl (Il
OJ
b U,l
220 -
200
-lClO IIiiiiiiiiiiiii
-160
--l~fO
1~!0
100
00
60 !
I
lK)
~~o
o 10 100
---
Mark;
-302·,P 304 306-.p ;08
-- 310
1000
Time .. Hours
Initial stress
ka1
145.0 152.0 170.0 200.0 188.0
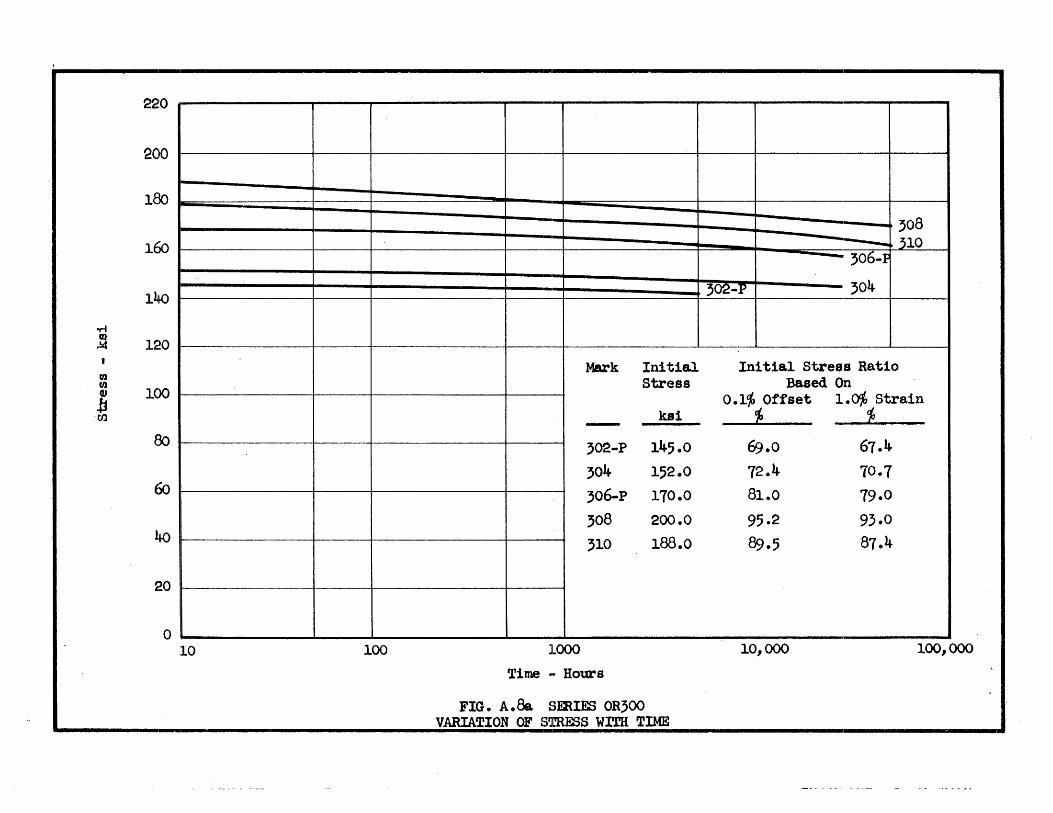
FIG. A. 8e. SEllIES OR300 • __ VARIATION OF STRESS wrm TIME
}08 - 310 -' 306-F
302-p 304
Init!al Stress Ratio Based On
0.1'10 Offset 1.fY/o Strain f, ~ -
69.0 67.4 72.4 70.7 81 .. 0 79.0
95·2 93.0 89.5 87.4
10,000 100,000
"J
220
200
180
160
140
'r'f
~ 120
m m 100 Q)
b (J)
80
60
40
20
o 10 100
----........... 307-P 309-P
-;05
303-P 301-P
Mark Initial Initial stress Ratio stress Based On
0.1% Offset 1.fYI, Strain
-301-P
303-P 305
307-P 309-P
1000 Time - Hours
kat
142.0
151.0 170.0
202.7 190.0
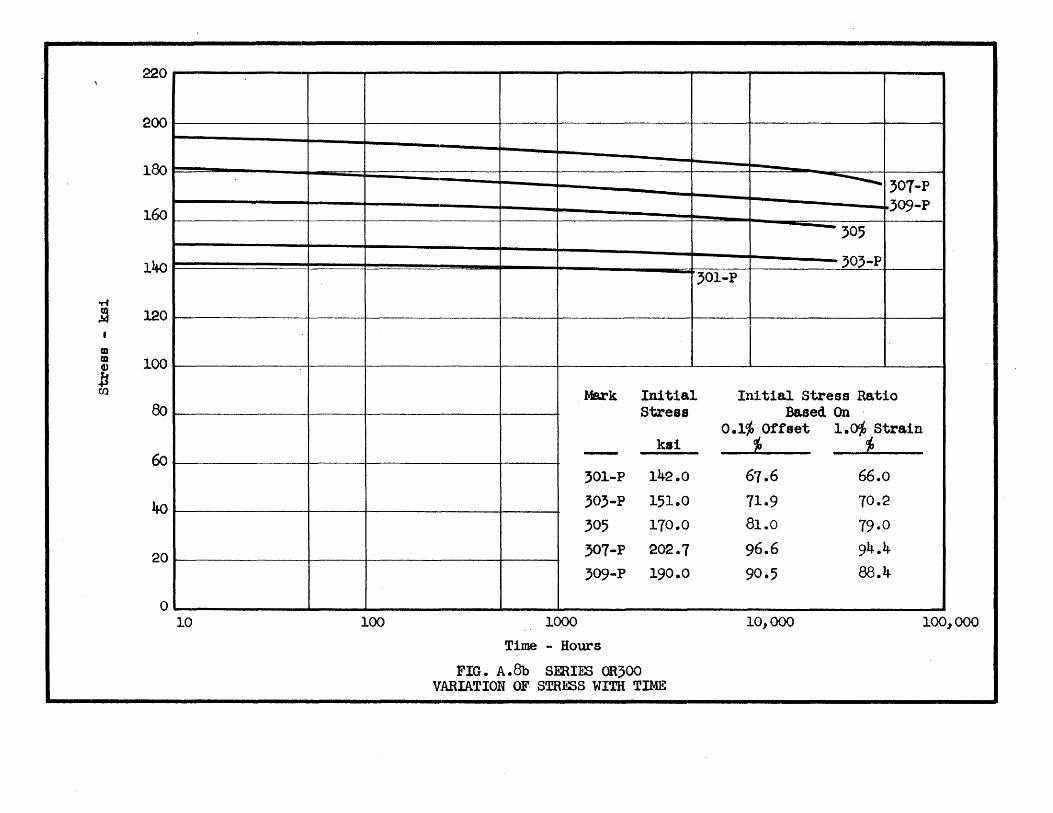
FIG. A.Bb SERlE:) OR300 VARIATION OF STRESS WITH TIME
% ;, 61.6 66.0
71.9 70.2 81.0 19.0 96.6 94.4
90.5 88.4
10,000 100,000
-220
200
leo
160 " -.--~~
140
oM
~ 120
• to Q) 100 11 [J)
80
60
40
20
o 10
--_ ....
100
--
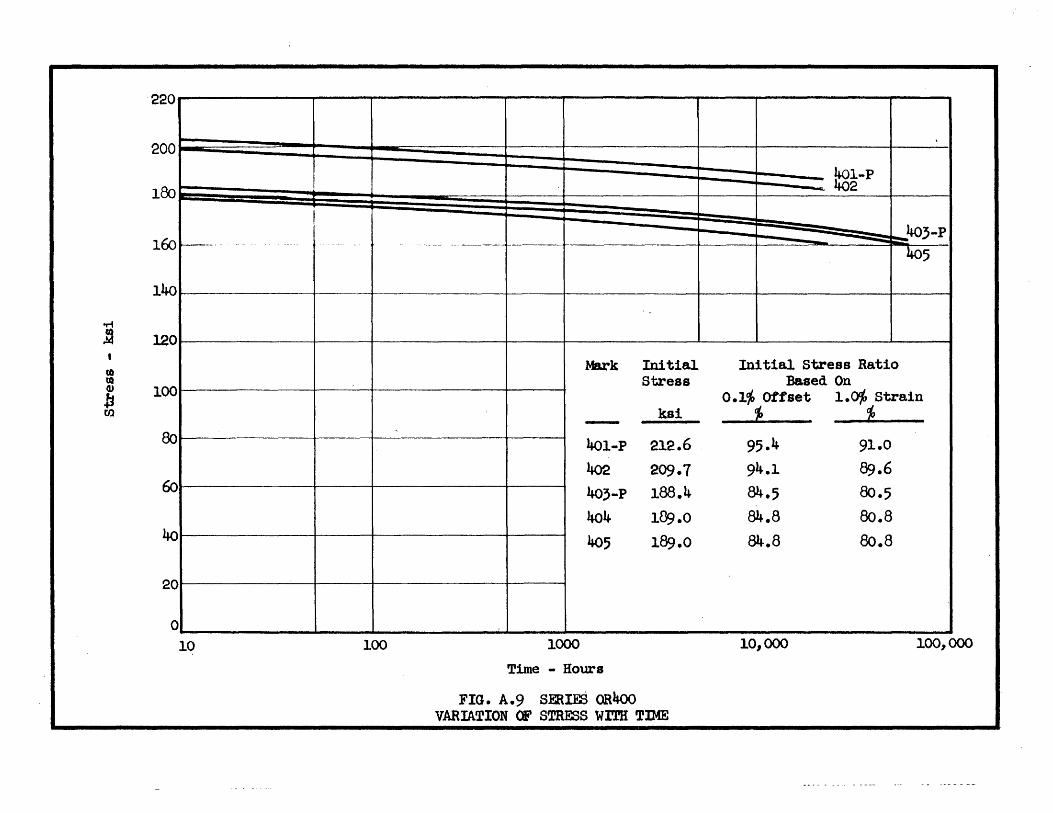
Mark
-401-P 402 403-P 404
405
-_ .. _--
1000
Time - Hours
- .
Initial stress
ksl
212.6 -
209.7 188.4 189.0 189.0
FIG. A.9 SERm 00400 VARIATION (8 STIm3S wrm TIME
_ ttg1-P _ 2
403-P - ....... \05
Initial stress Ratio Based On
0.1'/0 Offset 1. r:J1, strain ;, cJ,
95.4 91.0 94.1 89.6 84.5 80.5 84.8 80.8 84.8 80.8
10,000 100,000

• _I 1
.... ~
• IQ Q»
b en
220 -,
200
180
160
140 -, -, ]20
~OO -.
80
60
40
20
-, o 1.0
-
100
Mark
-501
502
1000
Time - Hours
Initial stre ••
01
14}.~
1}4.4
FIG. A .10 SmIE:) 00500 VARIATION ~ STRESS WITH TIME
- 501 502
Initial stre.. Ratio Based On
0.1;' Otfset 1.~ strain ;, j,
69.0 6}.8 64.6 59.1
10,000 100,000
. _, '

.,..
.= III • CD
b til
220
200
180
160 -140
120
100
80
60
40
20 L-...
o 10 100
---
Hark
--101
102 10;
104 105
1000
Time - Houris
Initial Strese
k81
132.0
149.0
115.0 190.8 200.0
FIG. A.ll SERIF.S NR100 VARIATION OF STRESS ,,,rm TIME
_105
104 I I
I
10; I
I -102 I
101 I
Initial Stl-e •• Ratio Baaed On
0.1; otteet 1.(Y/, Strain
1» " 58.1 51r .1
65.6 64.5 11.1 7~i.7
84.1 8f~.6
88.1 &:;.5
10,000 100,000

.,.. a! .!4
It at Q)
220
200
180
160
140
l20
100
~ 80
60
40
20
o 10
-- ----------r-------- _._-
100
Mark
-101
102
1000
Time - Hours -
FIG. A.12 SERIES B100 VARIA:HON OF STRESS wrm TIME
101
102
Initial Initial Stre8s Ratio Based On -
O.l~ Ott.et 1. rJ1, Strain kai cJ, cJ,
203.0 101.0 99·2 -180.1 89.6 88.2
10,000 100,000
APPENDIX B
TESTS AT VARIOUS LABORATORIES
The follo~ng sections contain brief summaries of research on
relaxation characteristics of prestressing reinforcement reported in the
literature. The data from each investigation are tabulated at the end of
this appendix.
Bel Swiss Federal Testing Laboratory - 1946
(a) Object and Scope
E.M.P.A. Report No. 155, a comprehensive report on prestressed
concrete, included results of relaxation tests on 0.126-in. diameter, cold
drawn Svedish wire. Three wires with tensile strength of 279 kSi, were
tested at initial stresses of 56, 66 and 76 percent of tensile strength for
periods of 11, 16 and 56 days, respectively.
(b) Results and Conclusions
At initial stress of 56, 66 and 76 percent of tensile strength,
losses, respectively, were 2.7, 5.0, and 9.3 percent of the initial stress.
It \laS observed that the relaxation loss increased ~th increase in initial
stress. It vas felt that the test periods were sufficiently long to observe
the to~ re~axation losso
B.2 Da~ce - 1948
(a) Object and Scope
The tests conducted by Dawance were carried out to determine the
relaxation characteristics of 0008-in., O.l-in. and Oo2-ino diameter cold
drawn wires. The initial stress on the O.l-in. diameter wire ranged from

67 to 113 percent of the 0.2 percent proof stress and the initial stress on
the O.2-ino diameter wire was varied between 0.62 and 1.17 of the 002 percent
proof stress. The duration of test extended from about 605 days to over
2 years.
To measure the stress in the specimens, the vibration technique
was developed as part of the research programo
(b) Results and Conclusions
The maximum losses recorded for the O~l-inQ diameter wire were
about 13 percent of initial stress at time of about 2 years. For the same
diameter wire, losses of about 10 percent were observed at 300 dayso The
greatest losses obtained for the Oo2-in. diameter wire were 9 percent of
initial stress when the initial stress was III percent of the 0.2 percent
proof stress.
The author noted that for wires whose stress versus logarithm of
time plots exhibited a point of contraflexure, it would be possible to establish
a limit of relaxation.
Bo3 Magnel - 1948
(a) Object and Scope
The purpose of the author 1 s paper was to present results of creep
tests on concrete and creep and relaxation tests on prestressing wire, and to
draw conclusions from these results.
The relaxation losses were measured for a period of over 300 hours
on two 82 fto specimens of Oo2-ino cold-drawn wire. The initial stress of
both specimens was 123,000 psi or 85 percent of the Ool-percent offset stress.

For one specimen} an overstress of l37}000 psi was held for two minutes
and then stress was reduced to l23}000 psi. The initial stress for the
second specimen was applied directly with no overstress.
(b) Results and Conclusions
For the specimen not subjected to prestretching} the loss was
12 percent of initial stress at the end of 12 days and was considered to
be the complete stress reduction for the wire.
After two days} the loss for the prestretched specimen was 4
percent of the initial stresso The author felt this to be the limiting
value of loss for the specimen.
B.4 de Strycker - 1948} 1951
(a) Object and Scope
de Strycker reported results of relaxation tests on 21 specimens
of 0.2-in. diameter and tensile strength of 199 ksi. The initial stress
for all specimens was 121 ksio For 20 specimens} the duration of test was
23 hours and for one specimen readings were continued to 1320 hourso
In 1953, de Strycker reported results of tests on 101 wire specimens 0
The maximum test duration was 23 hours for 97 tests and 4 were kept under
observation for 72 hours. The results of these tests are comparable to those
in Table Be4 and were not listed in this report.
(b) Results and Conclusions
At 23 hours, losses were three to four percent of initial stress.
However~ at 1320 hours loss was 25 percent of initial stress which is unusually
high for the short ~uration of testo

Bo5 Spare - 1952, 1954
(a) Object and Scope
The object was to provide users of high strength wire with informa-
tion on stability of stress over long periods of timeo
The 1952 tests included two specimens of Oo192-ino diameter cold-drawn
wire at initial stresses of 60 and 70 percent of tensile strength 0
The relaxation tests conducted in 1954 consisted of nine cold-drawn
and five stress-relieved specimens 0.2-ino in diametero Initial stress varied
from 54 to 93 percent of tensile strength 0
For both series of tests) the facilities and procedures were the
same. The specimens were 100-fto long with wire stress measured by the aid
of a load cell using the balancing technique (See Chapter 2) 0 The test
duration was 1000 hours for all specimenso
(b) Results ~~d Conclusions
In co=paring losses of cold-drawn and stress-relieved wire) the
author concluded ~~at, for initial stresses below 60 to 70 percent of tensile
strength, stress-relieved wire had losses which are less than those for cold-
drawn wire. For i::i tial stresses above approximately 70 percent of tensile
strength, cold-drawn wire had losses greater than those for stress-relieved
wire 0
It ~ r.oted that the rate of loss diminished rapidly and the results
obtained at l~JC bours should be close to the final value for losso
Bo6 Bannister - 1953
I \ \a) Object and Scope
Tests were made primarily to study the effect of heat treatment on
the relaxation characteristics of cold-drawn wireo

-B·5-
Four types of specimens were tested in the series for a duration
of 250 hours. Specimens designated 1 and 2 were in the as-drawn condition,
however, specimens 2 were produced by smaller reductions' of area in the
drawing process. To determine the effect of heat treatment on relaxation
losses, two types of stress-relieved wires were tested. The stress-relieved
specimens were designated l-H and l-H-T where T indicates that the wire was
stress-relieved under tension. The wires were tested under initial stresses
varying from 69 to 119 percent of the O.l-percent proof stress to cover the
range normally used in prestressed concrete construction.
As part of the test program, the tensile strength of wire 1 was
measured after cooling from temperatures ranging from 2l2oF to 9350F.
(b) Results and Conclusions
The heat-treated specimens, l-H, had lower losses than the as-drawn
wires, 1, at the lOWer initial stresses, but had losses greater than those
for wires 1 at the higher initial stresses. However, the wires heat treated
under tension had lower losses than the as-drawn ~re regardless of the initial
stress and also had lower losses than the heat-treated specimens l-H throughout
the range of initial stress.
From the results of the tensile strength temperature tests a plot
was made shOwing t.lJ.e tensile strength at the various temperatures. In the
o 0 range 390 F to 750 F, the tensile strength is either unchanged or increased.
Outside this range of temperatures the tensile strength was reduced.
In the conclusions of the paper the author states~ tiThe character-
istics of drawn wires are not a simple function of either diameter or maximum
strength, but are dependent on the basic material and its treatment, and the

-Bo6-
extent and manner of subsequent cold reduction and aging 0 The relaxation of
such wires is not related to elastic characteristics or the maximum strength
or elongation at this stresso"
Bo7 Clark and Walley - 1953
(a) Object and Scope
The object of this investigation was to determine the relaxation
losses of cold-drawn ~res obtained commerciallyo
The ~res obtained were 00104 ino, 0.2 ino and 00276 ino in diameter
and had tensile strengths ranging from 225 ksi to 320 ksi 0 In testing the
wires, a lever apparatus was arranged to accomodate specimens about 40 fto in
length 0 Thi s length was chosen as an approxima. tion of lengths commonly found
in prestressed concrete beamso To determine whether a general relationship
existed between relaxation loss and .initial stress, the test series covered a
wide range of initial stress, 29 to 117 percent of the O.l-percent offset
stress.. A total of 23 specimens were tested for a duration of 1000 hours ..
(b) Results and Conclusions
The authors felt that relaxation loss in a ~re is a function of
the initial stress and a property of the wire probably dependent on residual
stresses and the crystalline structure.. The characteristics of the wire would
show up in the shape of the stress-strain curve and in the value of tensile
strength and ultimate elongation 0 It was observed that losses were greater
for wires would on small diameter coils than for ~res straightened and wound
on large diameter coilso Relaxation loss increased at an increasing rate for
initial stress levels greater than 40 percent of the Ool-percent offset stresso

The authors felt that relaxation losses could be reduced by over
stressing, especially in pretensioning operations since a large portion of
the loss occurs after tensioning and before release.
BoB Gifford - 1953
(a) Object and Scope
Gifford tested 10 specimens of 0.2-in. diameter prestressing wire
for a duration of over 400 days. Two specimens were tested at each of five
levels of initial stress which ranged from 50 to 90 percent of tensile strength
in approximately 10-percent increments. At each level of initial stress, one
specimen was prestretched for two minutes to a load five percent of tensile
strength above the intended initial stress. The stress was determined by
measuring the lateral deflection of the 17.5 ft. specimen.
(b) Results and Conclusions
Gifford noted that for initial stresses up to 60 percent of the
tensile strength, the loss at 420 days was five percent or less of the initial
stress and should reach a limiting value of about seven percent. Since losses
caused by creep and shrinkage of concrete in prestressed concrete would reduce
the initial stress, the value of five percent stress loss due to relaxation
was sufficient allowance in design. For initial stresses greater than 60 percent
of tensile strength, a higher allowance must be made.
Based on the test results, the author concluded that the effect of
prestretch became significant only for wires with initial stress greater than
60 percent of tensile strength.
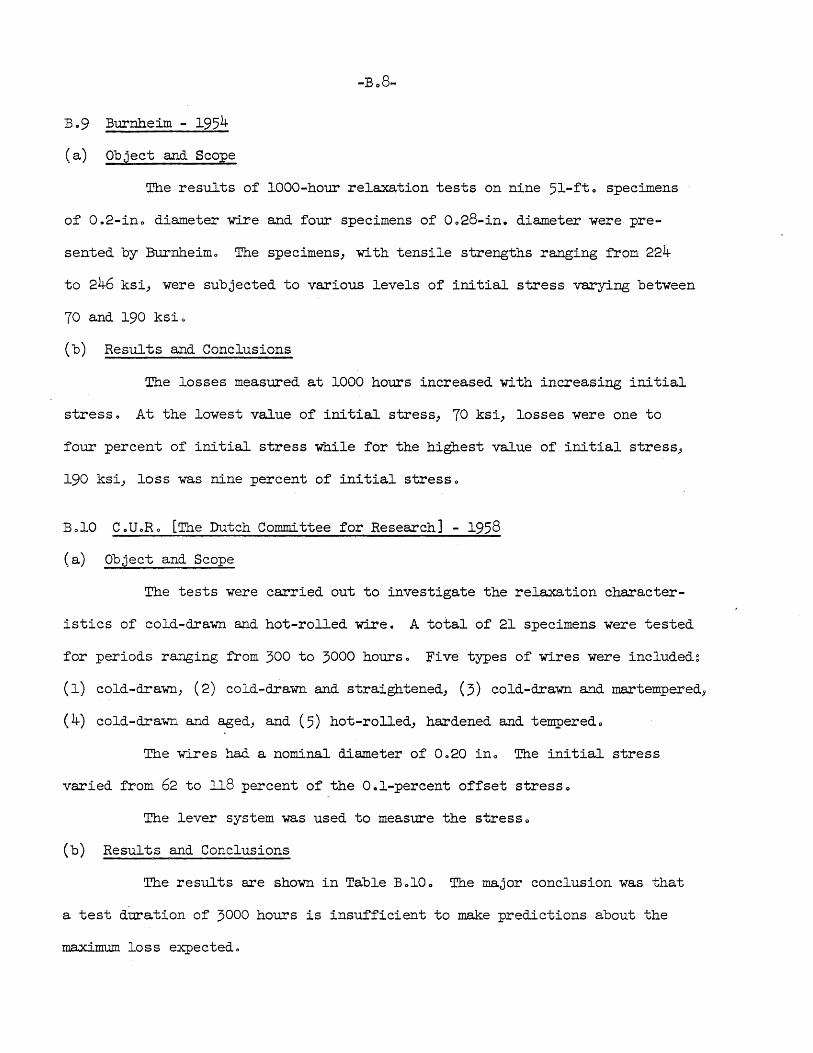
Bg9 Burnheim - 1954
(a) Object and Scope
The results of lOOO-hour relaxation tests on nine 51-fto specimens
of 0.2-ino diameter wire and four specimens of 0028-in. diameter were pre
sented by Burnheimo The specimens" w.i th tensile strengths ranging from 224
to 246 ksi, were subjected to various levels of initial stress varying between
70 and 190 ksio
(b) Results and Conclusions
The losses measured at 1000 hours increased with increasing initial
stress 0 At the lowest value of initial stress" 70 kSi" losses were one to
four percent of initial stress while for the highest value of initial stress,
190 ksi, loss was nine percent of initial stresso
BolO C.UoRo [The Dutch Committee for Research] - 1958
(a) Object and Scope
The tests were carried out to investigate the relaxation character
istics of cold-drawn and hot-rolled wire 0 A total of 21 specimens were tested
for periods ranging from 300 to 3000 hours 0 Five types of wires were included ~
(1) cold-drawn, (2) cold-drawn and straightened" (3) cold-drawn and martemperedJ
(4) cold-drawn and aged, and (5) hot-rolled, hardened and temperedo
The wires had a nominal diameter of 0020 ino The initial stress
varied from 62 to ll8 percent of the Ool-percent offset stresso
The lever system was used to measure the stress.,
(b) Results and Conclusions
The results are shown in Table BolO 0 The major conclusion was that
a test duration of 3000 hours is insufficient to make predictions about the
maximum loss expected 0

-Bo9-
B.ll Dumas - 1958
(a) Object and Scope
Results are presented to show the effect of prestretch on relaxa-
tion losses. Twenty-six specimens were tested at levels of initial stress
ranging from about 60 to 90 percent of the tensile strength. No information
was given on the type of wire and size of specimens. At each level of initial
stress, one specimen was not overstressed; other specimens were prestretched
for two minutes at various amounts of overstress. The duration of tests varied
from 500 to 1500 hours.
(b) Results and Conclusions
It is concluded that prestretching is- an effective technique to
reduce relaxa.tion loss. As overstress was increased for a particular level
of initial stress, measured losses were reduced. It must be noted, however,
that even for prestretched specimens, losses were substantial. This was
particularly tr...le for specimens tested at high initial stress • At 1000 hours;
specimens vi~ ~~ overstress and an initial stress of 85 to 88 percent of
tensile stre~~~~ ~~ losses amounting to 13 percent of initial stress while
for speci~e~s a: ~he sane level of initial stress and subjected to pre-
stretc~~~~ a~ ~.e ~~~tial stress for two minutes, loss was measured to be
from 14 tc _/ ;>e:,,::e::t of the initial stress.
(a) Object 8: A S::::::pe
A series of relaxation tests were conducted on O.l-in. cold-drawn
wire. Tne specioens tested were of two tj~eS: single
strand in which the pitch of twist was varied from 0.9 in. to infinity.
-B.10-
Forty-six s~ecimens of each type were tested ~or duration which varied from
10 to 130 days (Results are re~orted for only 80 tests). Initial stresses
a~~lied to the single strand s~ecimens ranged from 77 to 108 ~ercent of the
Oo2-~ercent offset stress. Twelve of the single strand. s~ecimens were over-
stressed 10 ~ercent above the initial stress for 10 minutes. All specimens
were 79 in. long and were mounted in steel frames of rolled sections. To
maintain constant length during the test period, a lever system was arranged
such that weights were removed from an arm as wire stress decreased. From the
statics of the system, wire stress was determined.
(b) Results and Conclusions
The author compared results obtained for the series of tests con-
ducted with other published results. He concluded that the basis of comparison
of relaxation tests should be the ratio of initial stress to the 0.2-~ercent
offset stress.
The results of Kajfasz's tests on the single wire strand and results
re~orted by Levi were used to study the relation between rate of relaxation
and time. The following formula was developed to describe relaxation loss:
where f r
c
f = c(log t - log t ) r 0
= relaxation in kg/mm2
a parameter de~ending on the ratio of initial stress to
the 0.2-percent offset stress
log t = natural logarithm of time in minutes
log t o natural logarithm oi' time in minutes at which first
reading was taken.
The parameter c was evaluated by assuming it was a linear function of the
ratio of initial stress to offset stress. By including in the expression

the loss occurring from zero time to the time at which the first reading
was taken, the total loss at time, t, can be determined.
From extrapolation of the test results, Kajfasz noted that for
an initial stress less than 0.55 of the Oo2-percent offset stress, losses
are not of practical significanceo
The parameter, c, was also evaluated for the twin-twisted strands 0
For values of initial stress less than the Oo2-percent offset stress, the
value o:f c was nearly the same as that for single wire strand..
In evaluating the effect of prestretching on companion specimens,
one prestretched and one non-prestretched at the same level of initial stress,
Kajfasz noted that only in the very early stages of the test was there a
noticeable difference in losses between the prestretched and non-prestretched
specimens 0 During the following period of testing, the losses were nearly
identical for the companion specimenso
B.13 Levi - 1958
(a) Object and Scope
At the Second and Third Congresses of the Federation Internationale
de la Precontrainte) Levi presented results of an extensive series of tests
on prestressing steel.
Diameter of wires tested varied from 0.078 to 0031 ino with tensile
strengths of 182 ksi to 313 ksio The initial stress applied to the specimens
ranged from 52 to 90 percent of tensile strength.
Specimens were tested for durations of 120 hours to nearly nine yearso
From results of tests of long uuration, it was felt that lOSSeS at 120 hours
would indicate final values of loss, therefore, a considerable number of tests
were terminated at that time.
-B.12-
(b ) Results and Conclusions
Based on results of ~res tested for long periods of time, the
author concluded that the relaxation at 120 hours would be little more than
half the final value. By carrying tests out to 120 hours) it would be possible
to estimate the final value of relaxation loss.
In considering the results with respect to initial stress, the
author stated that a stress of about 80 percent of the 0.2-percent proof
stress can be maintained indefinitely.
B.14 Jevtic - 1959
(a) Object and Scope
Relaxation tests and tests of tensile strength at elevated tempera-
tures were conducted by Jevtic as part of a program to determine the properties
of cold-drawn wire wanufactured in Jesenice, Yugoslavia 0
The relaxation tests consisted of measur.ing losses on two series of
specimens. One series of O.l-in. diameter wire contained five specimens with
f ./f ranging ~o~ 0.91 to l.19. In the second series, three wires of 0.2-in. Sl y
diameter vere s~tje:ted to f ./f from 0.90 to 1.12. The test duration was Sl y
696 hours :for t..'1e ':;.::.- in. diameter specimens. In the second series, the period
of test was 7?J ~~~S for two specimens and 796 hours for the third specimen.
Since the ~brat~~~ ~ethod was used to measure wire stress, each specimen was
mounted in a 51,.;.: :ab:'e steel frame. All wires tested had a free length of
80.7 in.
(b) Results and Co~clusions
At the end of the test duration, specimens of the first test series
had losses ranging from 8.2 percent to 3.3 percent of the initial stress where

the greater losses occurred in the wires with the higher initial stress.
For the specimens of 0.2-in. diameter} losses at the final time ranged from
7.9 percent to 4.7 percent of the initial stress.
B.15 Kingham, Fisher and Viest - i96l
(a) Object and Scope
As part of the bridge research at the AASHO Road Test, a study of
the long-time behavior of prestressed concrete beams was carried out. In
conjunction with the study, relaxation tests were conducted on stress-relieved
prestressing steel used in the construction of bridge beams in the Road Tests.
The relaxation tests consisted of determining losses in two types
of specDnens: O.192-in. "diameter wire and seven-wire strand of 0.375-in.
diameter with a mean cross-sectional area of 0.0806 square inches. Eight
wire specimens and 10 specimens of seven-wire strand were tested for a minimum
duration of 1000 hours with two specimens of each type observed for more than
7000 hours. To measure stress in the wires, the vibration technique was
employed. For the seven-wire strand, a load cell was used to measure stress.
Each spe~i:ne:: "WaS mounted in a steel frame where the distance between anchorages
was approx.i:lBtel.y 40 in. Initial stress for the specimens ranged from 60 to 78
percent o~ te::sile strength.
(b) Res~ts a:d Conclusions
Fro= the results of the relaxation tests, the authors noted that
substantial losses occurred beyond 1000 hours and although the rate of loss
decreased ~th time, there was no indication that losses would approach a
limiting value. At 1000 hours} losses for the wire specimens ranged from
4.2 to 9.0 percent of the initial stress while losses for the seven-wire
strand varied between 200 and 601 percent of the initial stress.
-B.14-
In the analysis of test data} the authors developed a formula to
be used in estimating relaxation losses in prestressed concrete beams. Using
a modified form of similar formulas found in literature} the final expression
was written as follows:
where ~ = relaxation loss at time t r
f. = initial stress l
f' = tensile strength s
e = base of natural logarithm
t = time from application of initial stress in hours
Test data from 10 to 1000 hours was used to evaluate the empirical constants
by multiple regression analyses. The authors concluded that the duration of
their tests was not sufficient to provide information on the limiting value
of the relaxation loss.

* Mark Diameter Strength
f' s in. ksi
1 0.126 219 2 0.126 219 3 0.126 279
Length of Specimen: Not reported.
Offset
** Stres8
t y
ksi
240 240 240
TABLE B.1
E.M.P.A. 1946
InitIal
Stress
tai kai
156 185 213
Type of Steel: Cold-Drawn single wire tram Sweden. Method of Stress Measurement: Not reported.
* **
Bot indicated in original. report.
Baaed on 0.2 percent strain.
Initial Prestretch Offset Stre8s Time
tilt s y ;, ksi min.
65 71 89
FInal Measurement Final Stress Time
In1 tial S~ess taltsi
hours ;,
288 91.} 388 95.0
1344 90.1
I bj • ~ V1 I
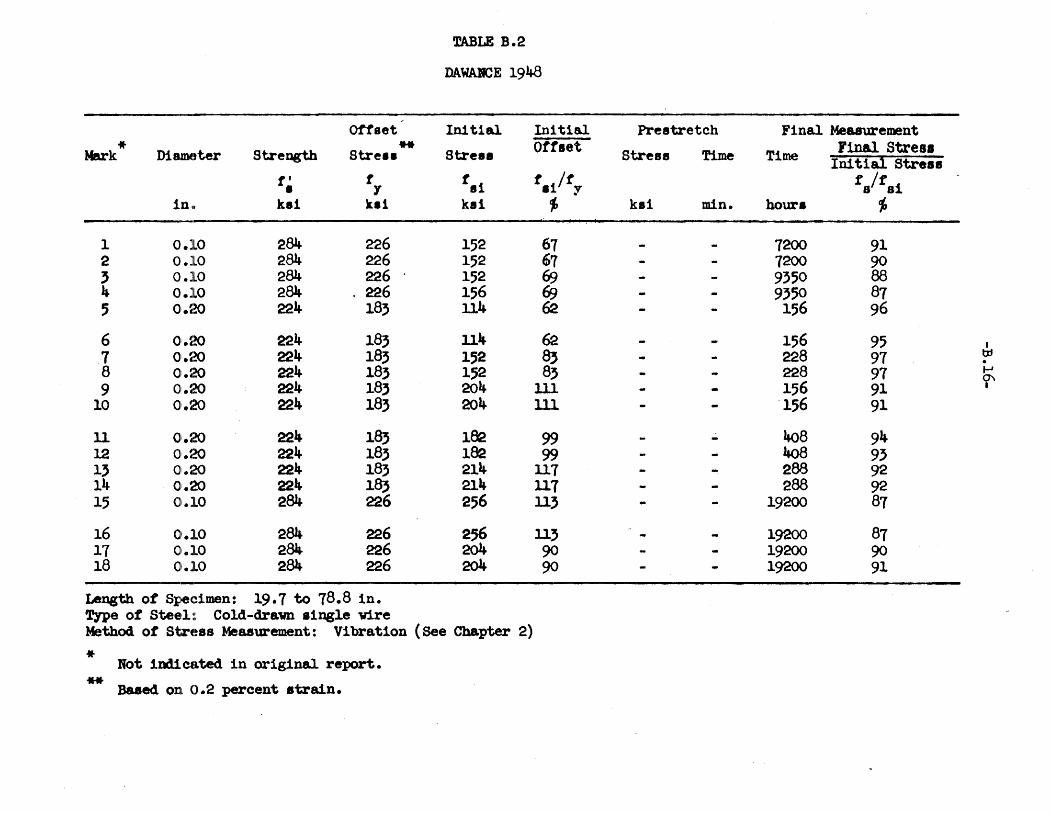
or-tset
* Mark D1a~!tter Strength Stress
t' t • Y in 'II k.1 ks1
1 01.10 284 226 2 0.10 284 226 , 0.10 284- 226 4 01.10 28lt. . 226 5 Qi.~:!O 224 183
6 Qi.~:!O 224- 1S} .7 Qi.~;!O 224 18, 8 Qi.~:!O 224 183 9 o.:;~ 224 18,
10 Qi.~:!O 224 183
11 Qi.~;!O 224. 183 12 o.~;!O 224 183 13 o.~;~ 224. 183 14- Qi.~!O 224 1S, 15 01.10 284 226
16 01.10 284 226 11 01.10 284 226 18 01.10 28lt. 226
Length of S:pe(:~imen: 19.7 to 78.8 in. '1'ype of Stee!1 ::: Cold-draw .ingle wire
.. TABLE B.2
DAWABCE 1948
Initlal Inltlal
Stress Offset
fsl flit • Y ks1 ",
152 67 152 67 152 fJ:) 156 fI:J 114 62
lllt. 62 152 a, 152 83 204 III 204 III
182 99 182 99 214 117 214 117 256 113
256 11, 204 90 204 90
Method of Str4!~88 Measurement: Vibrat10n (See Chapter 2)
* Not 1Dd1 ~:~:ted in original report.
** Baaed on~ 0.2 percent strain.
Prestretch Final Measurement Final Stress Stress Time Time Ini ti&l Stre8.
t It 1 8 8 kai min. hours ;,
7200 91 1200 90 9350 88 9350 87 156 96
156 95 I
228 97 OJ . 228 97 t-'
0'\ 156 91 I
156 91
408 94 408 93 288 92 288 92
19200 87
19200 81 19200 90 19200 91
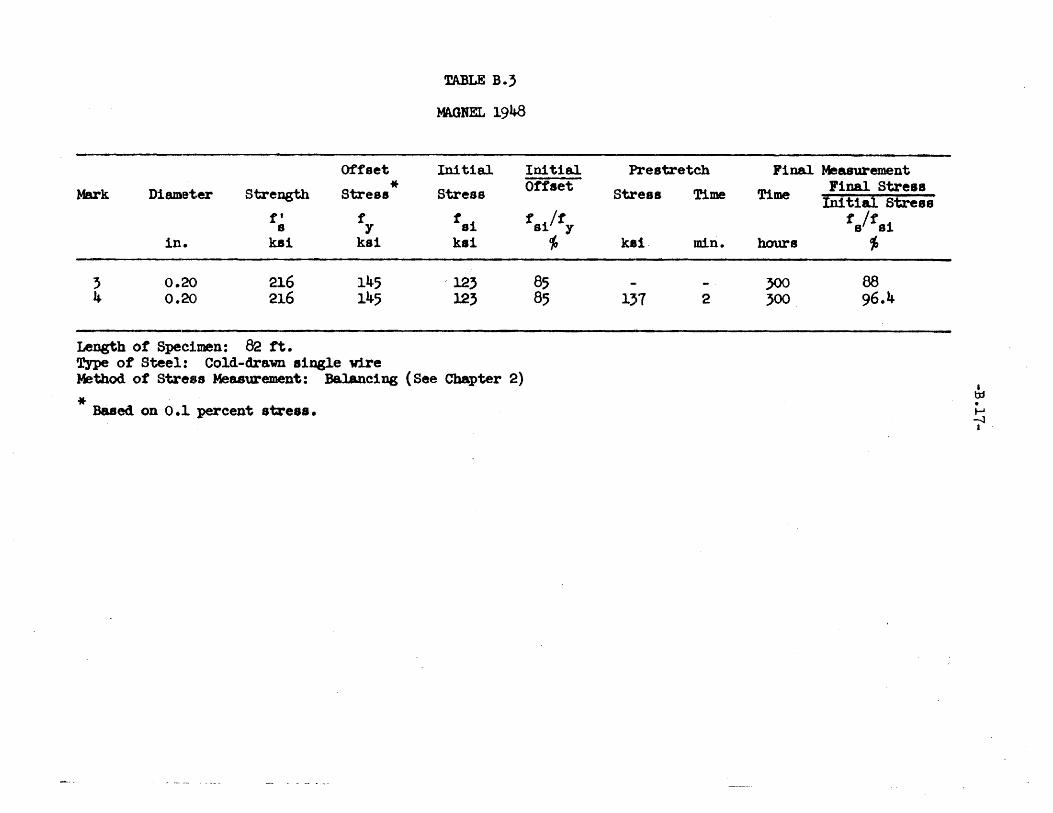
Mark
3 4
Diamet.er
in.
0.20 0.20
Strength
f' s
ksl
216 216
Length ot Speci.men: 82:rt.
Offset
Stress
f y
kai
145 145
Type ot Steel: Cold-drawn single wire
*
TABLE B.3
MA.GNEL1948
Initial Initial
Stress Offset
tsi tilt s y kai ~
'123 85 123 85
Method ot Stree~8 Measurement: BalAncing (See Chapter 2)
* Based on 0.1 percent stress.
Pre stretch
Stress Time
kel· min.
1'7 2
Final Measurement Final Streas Time Iii1 tial Stre8s
t If i 8 S
hours
'" 300 88 300 96.4
I txJ • ..... -.,J I
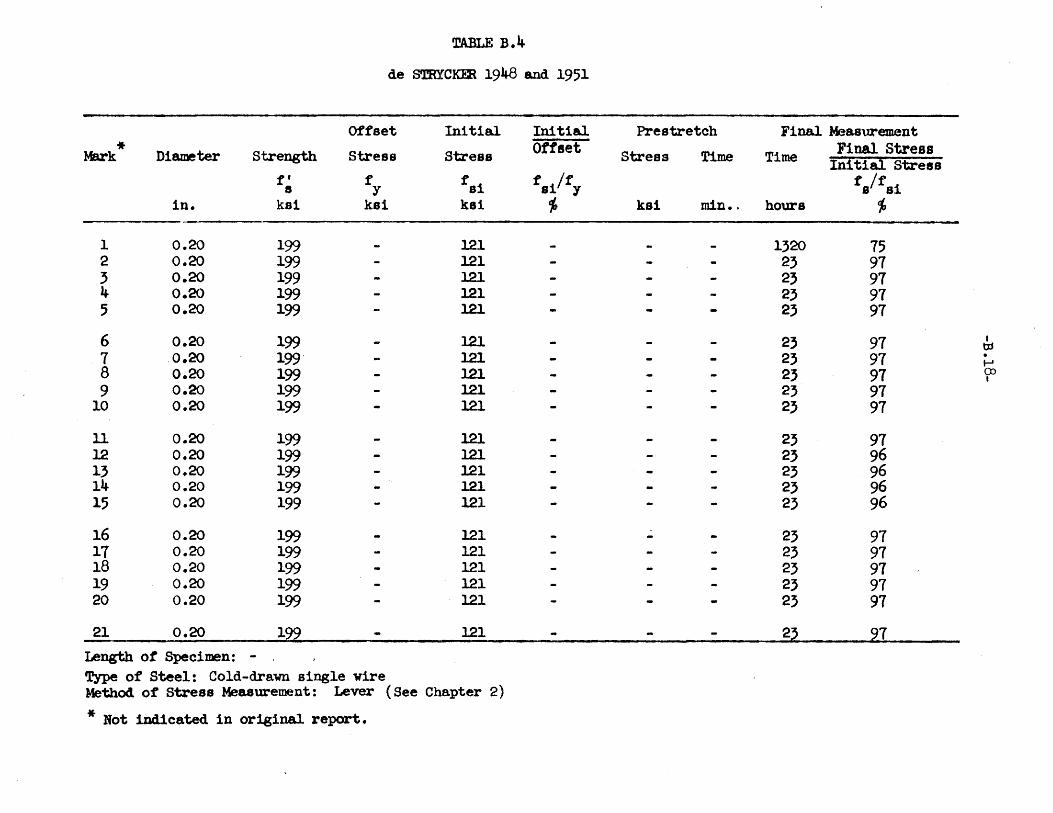
TABLE B.4
de STRYCKm 1948 and 1951
Offset Initial Initial Prestretch Flnal )basUl"ement
* Oftset Final Stress Mark Diameter Strength Stress stress stress Time Time Iiiltl&l Stress if f fSi f l/f fs/fsl s y 8 '1
In. ksi ksi kai
'" ksi min •. hours
'" 1 0.20 199 l21 1320 15 2 0.20 199 121 23 91 3 0.20 199 121 23 97 4 0.20 199 121 23 97 5 0.20 199 121 23 97
6 0.20 199 121 23 97 I t:Jj
7 0.20 199 121 23 97 . I--'
8 0.20 199 121 23 97 en I
9 0.20 199 121 23 91 10 0.20 199 121 23 91
11 0.20 199 121 23 97 12 0.20 199 121 23 96 13 0.20 199 121 23 96 14 0.20 199 121 23 96 15 0.20 199 121 23 96
16 0.20 199 l21 - 23 91 17 0.20 199 121 23 97 18 0.20 199 121 23 97 19 0.20 199 121 23 91 20 0.20 199 121 23 97
21 0.20 122 121 2~ 97 Length ot Specimen: -Type of Steel: Cold-drawn single wire Method of' stress Measurement: Lever (See Chapter 2)
* Not indicated in original report.

* Mark Diameter Strength
t' 8
In. ksi
1 0.20 22:5 2 0.20 223 3 0.20 25:5 4- 0.20 25:5 5 0.20 260
6 0.20 260 7 0.20 260 8 0.20 249 9 0.20 249
10 0.20 270
II 0.20 249 12 0.20 249 13 0.20 240 14- 0.20 272 15 0.192 250
16 1.92 250
Length of Specimen: 100ft.
Offset
Stres8
r y ka1
TABLE B.5
SPARE 1952 and 1954
Initial Initial
Stress bffset
fai f ilf S Y
ksi 10
145 167 222 235 141
174 208 154 112 189
179 194 168 155 155
172
Prestretch
Stress Time
ksi min.
Type of Steel: Cold-Drawn (Specimens 11 through 15 were stress-relieved) Method of Stress Measurement: Balancing (See Chapter 2)
* Not indicated ln orlginal. report.
Final Measurement Final Stress Time Initie.l. Stress
fs/fSi hours ;,
1000 9:5 1000 93 1000 90 1000 88 1000 96
1000 9:5 1000 91 I
tp
1000 95 . t-'
1000 92 \0 I
1000 9:5
1000 92 1000 87 1000 92 1000 91 1000 94-
1000 92
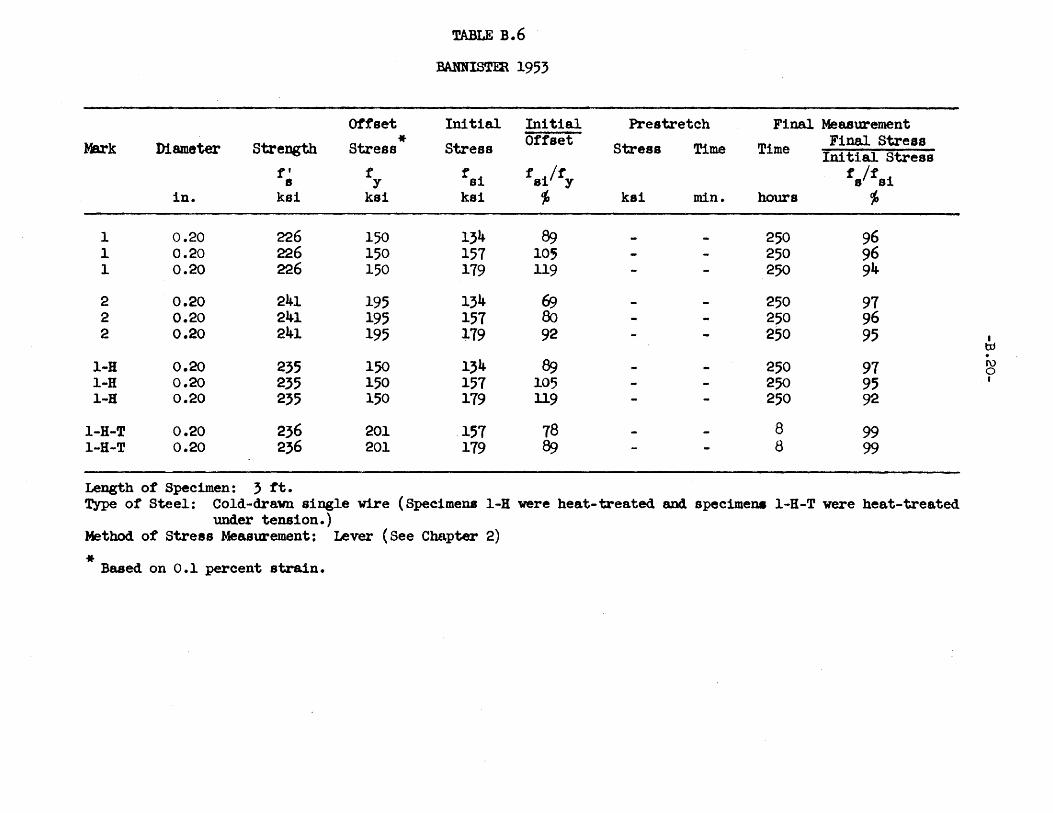
Offset
Mark Diameter strength * Stress it f
8 y in. ksi kai
1 0.20 226 150 1 0.20 226 150 1 0.20 226 150
2 0.20 241 195 2 0.20 241 195 2 0.20 241 195
1-H 0.20 235 150 1-8 0.20 235 150 I-H 0.20 235 150
1-H-T 0.20 236 201 1-H-T 0.20 236 201
Length of Specimen: 3 ft.
TABLE B.6
:BANNISTm 1953
Initial Initial
Stress Offset
fsi rSi/fy kai cf,
134 89 151 105 119 119
134 &9 151 80 179 92
134 Be; 151 105 179 119
157 78 179 89
Prestretch Final Measurement Final Stress Stress Time Time In1 tial stress
ta/tsi kai min. hours cJ,
250 96 250 96 250 94-
250 97 250 96 250 95
250 97 250 95 250 92
8 99 8 99
Type of Steel: Cold-drawn single wire (Speclmena l-H were beat-treated and spec1mena 1-H-T were heat-trea.ted under tension.)
Method ot Stress Measurement: Lever (See CruLpter 2)
* Based on 0.1 percent atrain.
I to . I\) 0 I
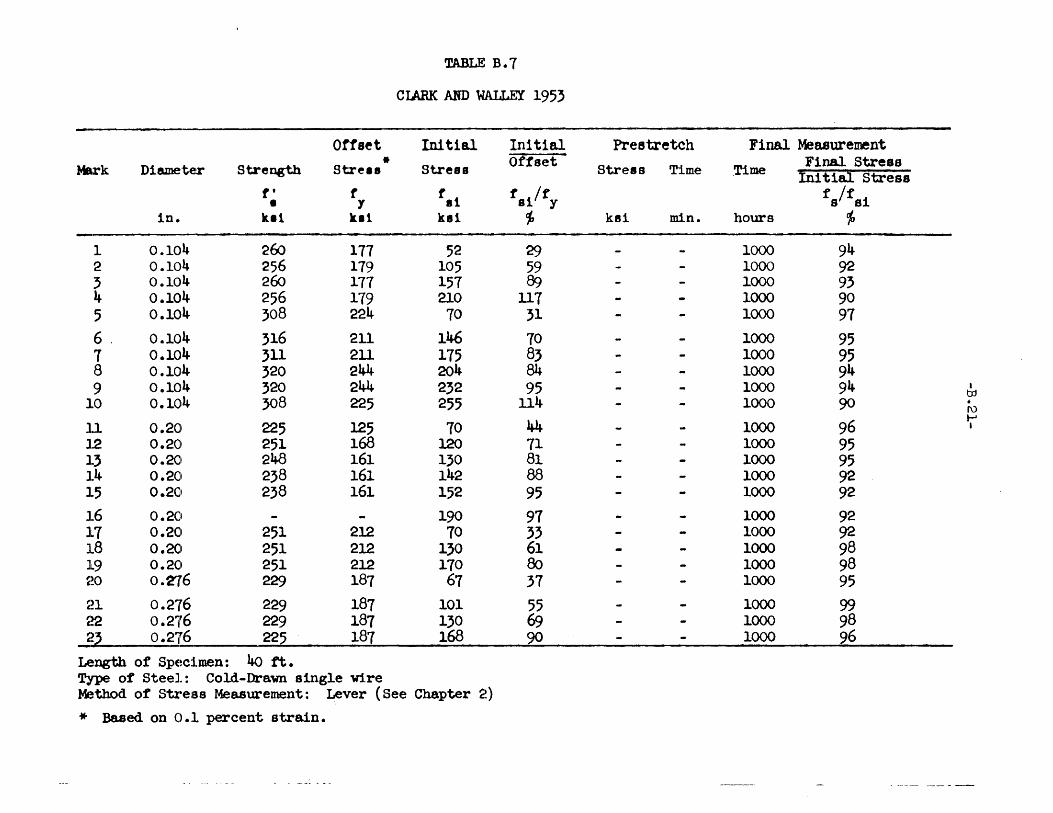
TABLE B.7
CLARK AND WALLEY 1953
ONset Initial Initial Preetretch Final Measurement • Offset FInal Stress Mark Dlame'ter Strength Strel. Stress Stress Time Time tnitl81 Stress
f' f fal t Ilf falfsi • y 8 Y In. k.1 kl1 kll ~ kl1 min. hours
'" 1 0.104 260 177 52 29 1000 94 2 0.104 256 179 105 59 1000 92 3 0.104 260 177 157 89 1000 93 4 0.104 256 179 210 117 1000 90 5 0.104 308 224 70 31 1000 97 6, 0.104 316 211 146 70 1000 95 7 0.104 311 211 175 83 1000 95 8 0.104 320 244 204 84 1000 94 9 0.104 320 244 232 95 1000 94 I
to 10 0.104 308 225 255 114 1000 90 .
J\)
44 96 t-'
l~ 0.201 225 125 70 1000 I
].2 0.20 251 168 120 71 1000 95 13 0.20 248 161 130 81 1000 95 14 0.201 238 161 142 88 1000 92 15 0.201 238 161 152 95 1000 92 16 0.20 190 97 1000 92 17 0.20 251 212 70 33 1000 92 18 0.20 251 212 1}O 61 1000 98 19 0.20 251 212 170 80 1000 98 ~~o 0.2T6 229 187 67 37 1000 95 21 0.276 229 187 101 55 1000 99 ~~ 0.276 229 187 130 69 1000 98 ~~~ o.2';r6 22~ 187 168 90 1000 96
lA~ngth of SpE~c:lmen: 40 ft. Type of Steel: Cold-Drawn single wire ~~thod of Stx~elCJs Measurement: Lever (See Chapter 2)
* Based on ().1 percent strain.
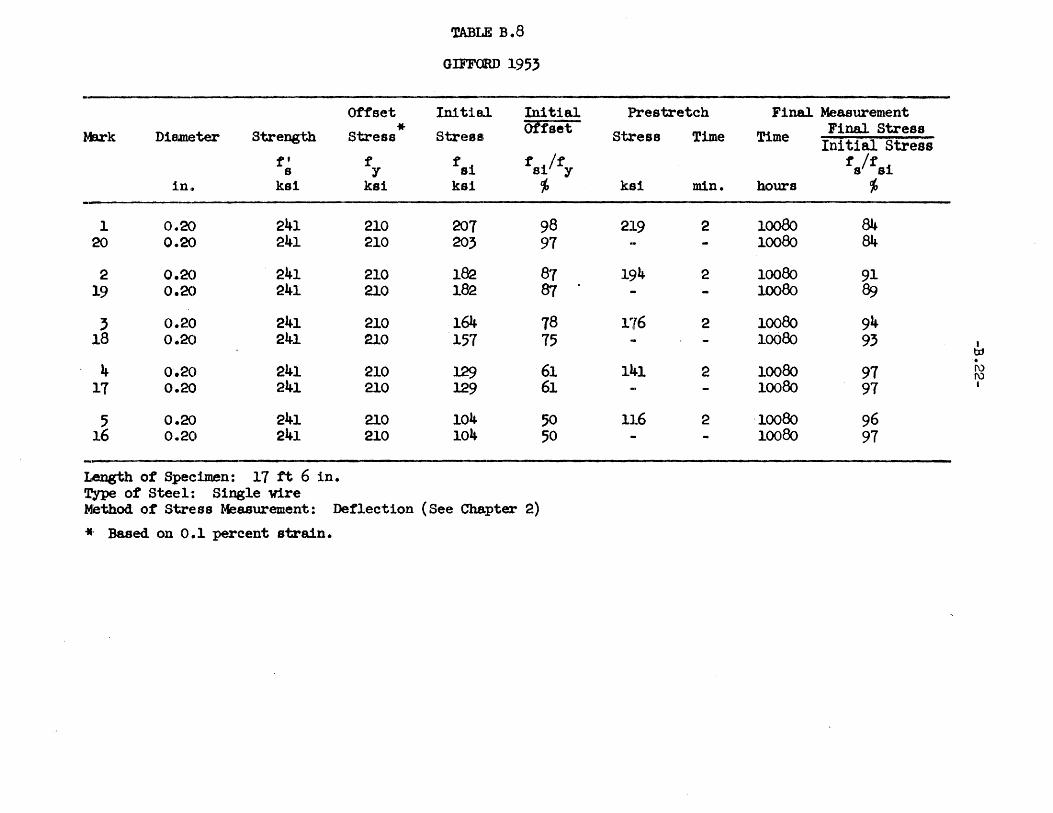
TABLE B.8
GIFFORD 1953
Offset Initial Initial Preatretch Final Measurement
* Offset Final stress ~Brk Diameter Strength stress Stress Stress Time Time Initial Stress
f' f fsi t Ilf t If 1 s y s y 8 S
i,n .. ka1 ksi kat ~ kai min. hours ~
1 0.20 241 210 201 98 219 2 10080 84 20 0.20 241 210 203 91 10080 84
2 O.2() 241 210 182 87 194 2 10080 91 19 0.2() 241 210 182 87 10080 89
3 0.2() 241 210 164 18 176 2 10080 94 18 0.20 241 210 151 15 10080 93 I
txt . 4 0'.20 241 210 129 61 141 2 10080 91 I\)
I\)
17 0.20 241 210 129 61 10080 91 I
5 0.20 241 210 104 50 116 2 '10080 96 16 0.20 241 210 104 50 10080 91
Length of Spec:1men: 11 ft 6 in. TyPe ot Stee 1: S1ng1e wire Method ot st~e~ss Measurement: Detlection (See Chapter 2)
*' Based on 10.1 percent strain.
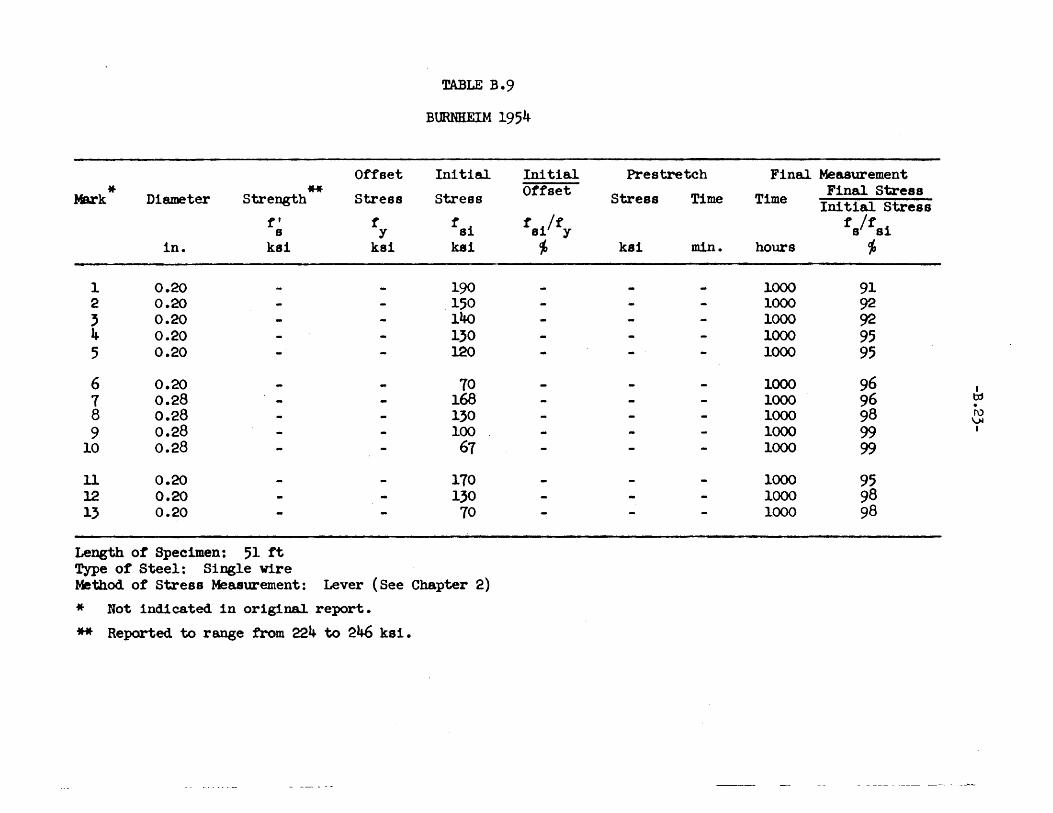
* Mark Diameter Strength
ft a
in. ksi
1 0.20 2 0.20 , 0.20 4 0.20 5 0.20
6 0.20 7 0.28 8 0.28 9 0.28
10 0.28
11 0.20 12 0.20 13 0.20
Length of Specimen: 51 ft Type of Steel: Single Wire
Offset
** Stress
t y kal
TABLE B.9
BURNHEIM 1954
Initial Initial
stress Otfset
tei t Ilf a y kal ;,
190 150 140 1,0 120
10 168 130 100 67
170 130
70
Method of Stress Measurement: Lever (See Chapter 2)
* Not indicated in original report.
** Reported to range from 224 to 246 ksl.
Prestretch Final Measurement Final stress
Stress Time Time Ini tial stress fa/fsi
ksl min. hours
'" 1000 91 1000 92 1000 92 1000 95 1000 95
1000 96 I
1000 96 txt . 1000 98 I\)
\.).I
1000 99 I
1000 99
1000 95 1000 98 1000 98
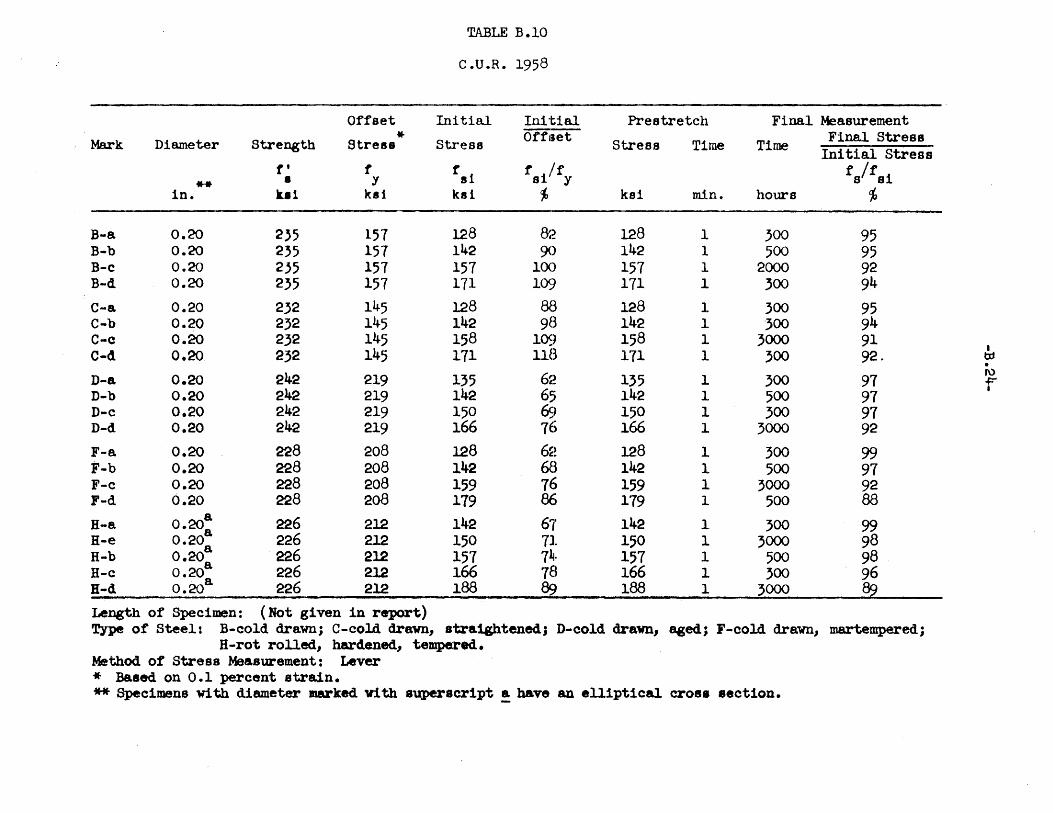
TABLE B.lO
C.U.R. 1958
Offset Initial lni'cia! Prestretch Final Measurement
* Offliet Final Stress Mark Diameter Strength Stre8S St.res8 Stress Time Time Initial stress
t' t fs! t /f fs/tSi ** • y sl y
In. ul Kal ka1 ~ kei min. hours i
B-a 0.20 2}5 157 128 &~ 128 1 300 95 B-b 0.20 2'5 157 142 90 142 1 500 95 B-c 0.20 235 157 151 1CX) 151 1 2000 92 B-d 0.20 235 157 171 109 111 1 300 94 C-a 0.20 232 145 128 aa 128 1 300 95 C-b 0.20 232 145 142 9H 142 1 -300 94 C-c 0.20 232 145 158 109 158 1 3000 91 C-d 0.20 232 145 111 liB 111 1 300 92·
I td .
D-a 0.20 242 219 135 6') 135 1 300 91 ro
I.. .po-
D-b 0.20 242 219 142 6'· 142 1 500 91 I
)
D-c 0.20 242 219 150 69 150 1 300 91 D-d 0.20 242 219 166 16 166 1 3000 92 F-e. 0.20 228 208 128 6~! 128 1 300 99 F-b 0.20 228 208 142 6B 142 1 500 91 F-c 0.20 228 208 159 16 159 1 3000 92 F-d 0.20 228 208 179 86 119 1 500 88
H-a a 226 212 142 67 142 1 300 99 0·2Oa
H-e 0.20 226 212 150 11 150 1 3000 98 H-b O.20
a 226 212 151 1~~ 157 1 500 98 H-c O.20a 226 212 166 18 166 1 300 96 H-d O.20a 226 212 188 89 188 1 3000 89 Length of Specimen: (Not given in report) Type ot Steel: B-cold drawn; C-cold drawn, stra.1ghtenedj D-cold drawn, qed; F-cold drawn, martemperedj
H-rot rolled, hardened, tempered. Method ot Stres8 Measurement: Lever * Baaed on 0.1 percent strain. ** Specimens with diameter marked with superscript! have an elliptical eross section.
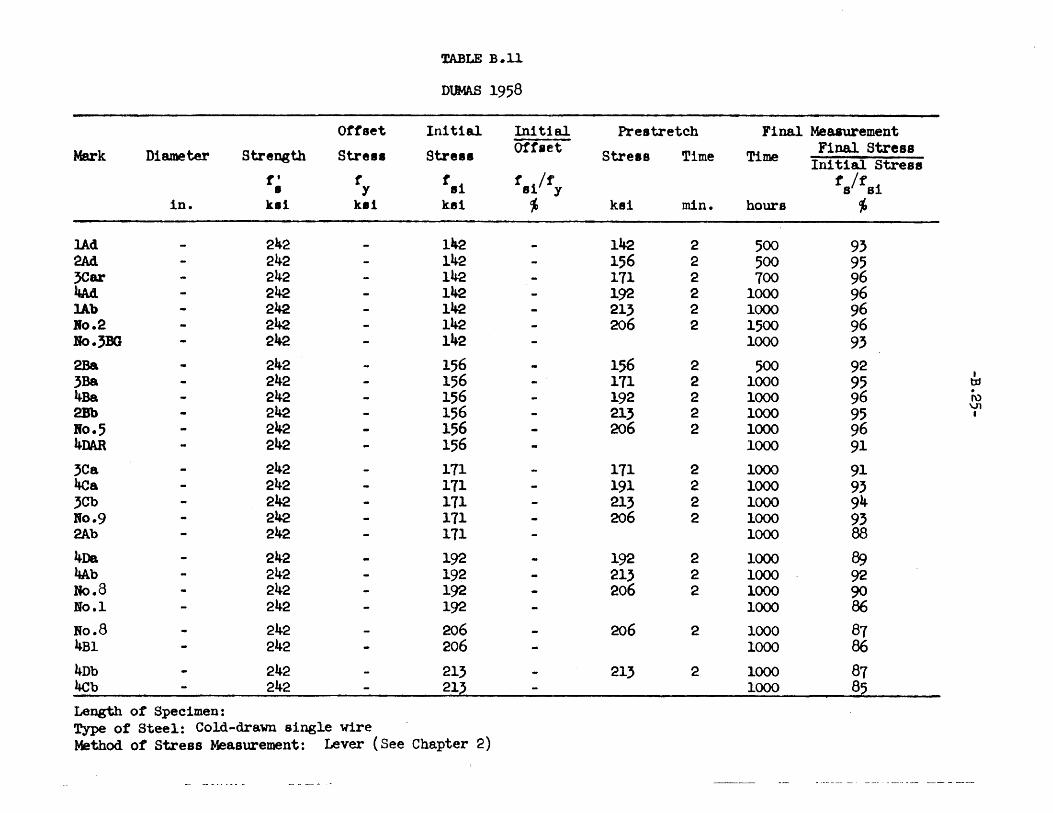
~LE B.ll
DUMAS 1958
Oftset Initial In1t1.al Prestretch Final Measurement
Mark Diameter Strength Stre •• stre •• ortle~ Stre.s Time Time F1nal stress Initial Stress
tt t tei t /1· t /f i • Y 81 Y 8 8 in. ksi kai kai ~ ksi min. hours
'" lAd 242 142 142 2 500 9} 2M. 242 142 156 2 500 95 }Car 242 142 171 2 700 96 l&Ad 242 142 192 2 1000 96 lAb 242 142 21} 2 1000 96 No.2 242 142 206 2 1500 96 No.3m 242 142 1000 93 2Ba 242 156 156 2 500 92
242 156 171 2 1000 95 I
3Ba tI1
4Ba 242 156 192 2 1000 96 . f\)
2Bb 242 156 213 2 1000 95 Vl I
110.5 242 156 206 2 1000 96 4DAR 242 156 1000 91
3Ca 242 171 171 2 1000 91 ltca 242 171 191 2 1000 9} 3Cb 242 171 213 2 1000 94 No.9 242 171 206 2 1000 93 2Ab 242 171 1000 88
4Da 242 192 192 2 1000 B9 4Ab 242 192 213 2 1000 92 No.8 242 192 206 2 1000 90 No.1 242 192 1000 86 No.8 242 206 206 2 1000 87 4B1 242 206 1000 86 4Db 242 213 213 2 1000 87 4cb 242 212 1000 85 Length ot Specimen: Type 01~ Steel: Cold-drawn single wire . Method ot Stres8 Measurement: Lever (See Chapter 2)
- -- - - - - -- - - - - - .- ... ------ - --_ ... __ . -- -- ---

TABLE B.12a
KA.JP'ASZ 1958
Offset Initial Initial Preatretch Final Measurement
* Offset Final stress Mark Di81neter Strength Stress Stress Stress Time Time In! t18lO stress
f' f fSi t lit t If i 8 Y a Y 8 s
jln. kai kat kst ~ kai min. hours ~
3 0.10 320 218 214 11 3~ 98 3 O.lO 320 218 214 11 360 98
13 0.10 320 218 214 11 9~ 91 13 0.10 320 218 214 11 960 91 22 0.10 320 218 214 71 3600 94 22 0.10 320 278 214 17 3600 96
4 ().10 320 218 214 71 235 10 360 98 I
!t- 0.10 320 278 214 71 235 10 360 98 to . 14 0.10 320 278 214 71 235 10 120 99
I\) 0\
14 ().10 320 218 214 11 235 10 120 99 I
5 0.10 320 218 242 87 120 97 5 0.10 320 218 242 87 120 97
23 0.10 320 278 242 81 2880 91 23 O.lO 320 278 242 81 2880 92
6 0.10 320 278 242 81 266 10 720 98 6 0.10 320 218 242 87 266 10 720 98
15 0.10 320 278 242 87 266 10 l20 99 .15 O.lO 320 218 242 87 266 10 120 98
9 0.10 ~20 278 242 81 2880 95 Length ot SPE~c:1men: 78.7 in. Type of' Steel: Cold-Drawn slng1e wire. Method of Stl:~ells. Measurement: Lever (See Chapter 2)
* Based on 0.12 percent strain.

TABLE B .12a (Cont I d.)
Offset Initial Initial Preatretch Final Measurement * Offset 1'1nal. Stress Mark Dismet;,er Strength Stress stress Stres8 Time Time inItial stress
f' t tsi f ilf f If i s y 8 Y s s in •. kai ks1 ks1 ;, ksi min. hours cJ,
1 0.0985 320 218 210 91 960 95 1 0.09B5 320 218 270 91 960 94
18 0.0985 320 218 210 91 96 97 18 0.09a5 320 218 210 91 96 91 20 0.0985 320 218 210 91 12 95 20 0.0985 320 218 210 91 12 94
8 0.0985 320 218 210 91 291 10 1440 96 8 o .()C~B5 320 218 210 97 291 10 1440 96
16 0.~~a5 320 218 270 97 297 10 120 98 I
16 0.~~B5 320 278 210 91 291 10 120 98 OJ • ro -l
9 0.~~a5 320 218 210 91 2880 93 I
19 0.0985 320 278 284 102 480 94 19 0.~~85 320 218 299 108 480 95 21 0.0985 320 278 299 108 72 90 21 0.0985 320 278 299 108 72 91
... - - --.---- -.---- -----~- --.-.-..--

TABLE B.l2b
KAJFASZ 1958
Offset Inltlal InitIal Prestretch Flnal Measurement • Offset Final stress
Mark Diameter Strength Stre •• Stre.8 stress Time Tlme lni tial StreBs
(' t tel t l/t f /f 1 • Y ., Y s s in. kal kel kal ~ ks,l min. hours cJ,
1 0.10 316 292 214 73 96 97 1 0.10 316 292 214 73 96 91 9 0.10 316 292 214- 13 96 98 9 0.10 316 292 214 13 120 98
10 0.10 316 292 214- 13 120 95 10 0.10 316 292 214 73 120 96 18 0.10 316 292 214 13 120 97 I
18 0.10 316 292 214 13 "120 98 tP
316 214-.
19 0.10 292 73 120 97 (\)
19 0.10 316 292 214- 73 120 97 co I
8 0.10 299 263 214- 81 120 96 8 0.10 299 263 214 81 120 96
17 0.10 299 263 214 81 96 96 17 0.10 299 263 214 81 96 96 26 0.10 299 263 214 81 120 96 26 0.10 299 263 214 81 120 95
7 0.10 299 246 214 87 120 96 7 0.10 299 246 214- 87 120 96
16 0.10 299 246 214 87 120 96 16 0.10 299 246 214 81 120 95 25 0.10 299 246 214 87 120 94 2~ 0.10 299 246 214 87 120 9}
Length of Specimen: 78.7 in. Type ot Steel: Cold-Drawn two-wire strand (The pitch ot the strand varied as follows. It was 0.9 in. for
2,11,20; 1.3 in. tor 3,12,21; 1.7 in. tor 4,13,22; 2.5 1n. for 6,15,24; 3 tor 1,16,25; 3.5 - tor 8,17,26, and infinite tor 1,9,10,18,19).
Method ot stress Measurement: Lever (See Chapter 2) * Based on 0.2 percent strain.
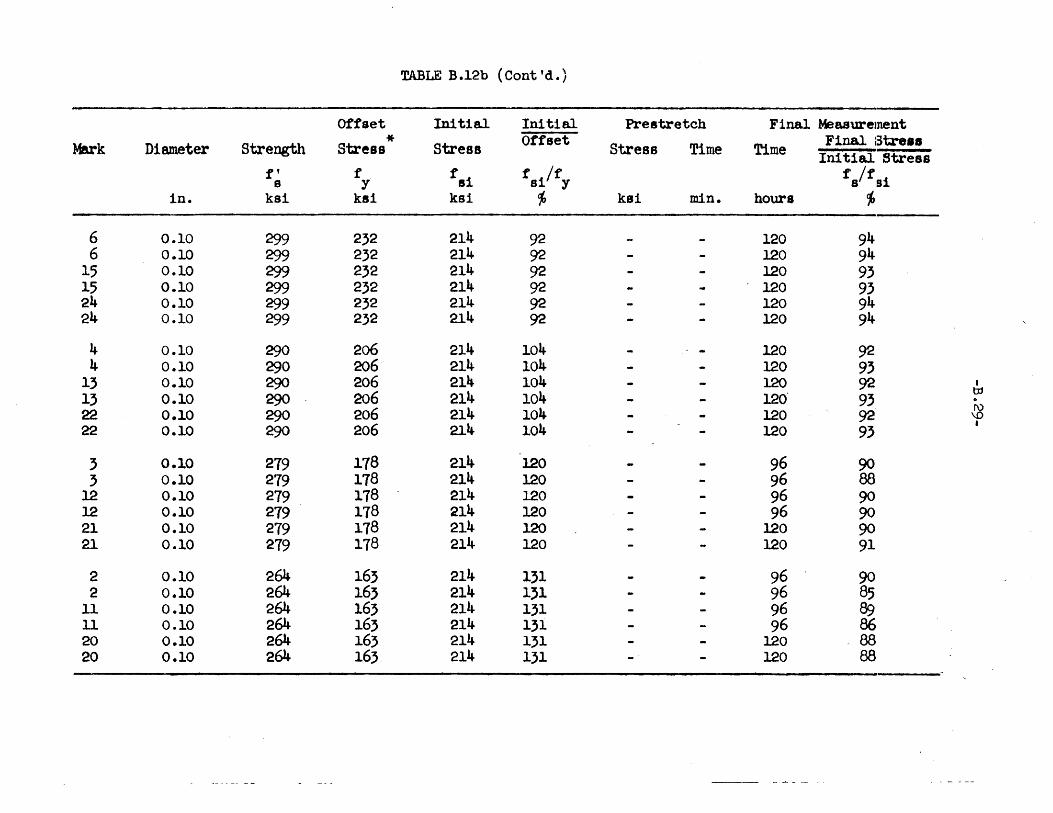
TABLE B.12b (Cont'd.)
Offset Initial Initial. Pre stretch Final Measm-eJDent * Offset Final IStre •• Mark Diameter Strength Stress Stress Stres8 Time Time In1 tial Stress
f' f fsi f'si/fy f If s Y S lsi In. ksi kai ksi
'" kai min. hours cj,
6 0.10 299 232 214 92 120 94 6 0.10 299 232 214 92 120 94
15 0.10 299 232 214 92 120 93 15 0.10 299 232 214 92 120 93 24 0.10 299 232 214 92 120 94 24 0.10 299 232 214 92 120 94
4 0.10 290 206 214 104 120 92 4 0.10 290 206 214 104 120 93
13 0.10 290 206 21~ 104 120 92 I
13 0.10 290 206 214 104 120' 93 1J1 II
22 0.10 290 206 214 104 120 92 ~~ 22 0.10 290 206 214 104 120 93
I
; 0.10 219 118 214 120 96 90 ; 0.10 279 178 214- 120 96 88
12 0.10 219 118 214 120 96 90 12 0.10 279 118 214 120 96 90 21 0.10 219 118 214- 120 120 90 21 0.10 219 118 214- 120 120 91
2 0.10 264 16; 214 131 96 90 2 0.10 264 163 214 131 96 85
11 0.10 264 16; 214 1;1 96 89 11 0.10 264 16; 214 131 96 86 20 0.10 264 16; 214 131 l20 88 20 0.10 264 16; 214 131 120 88
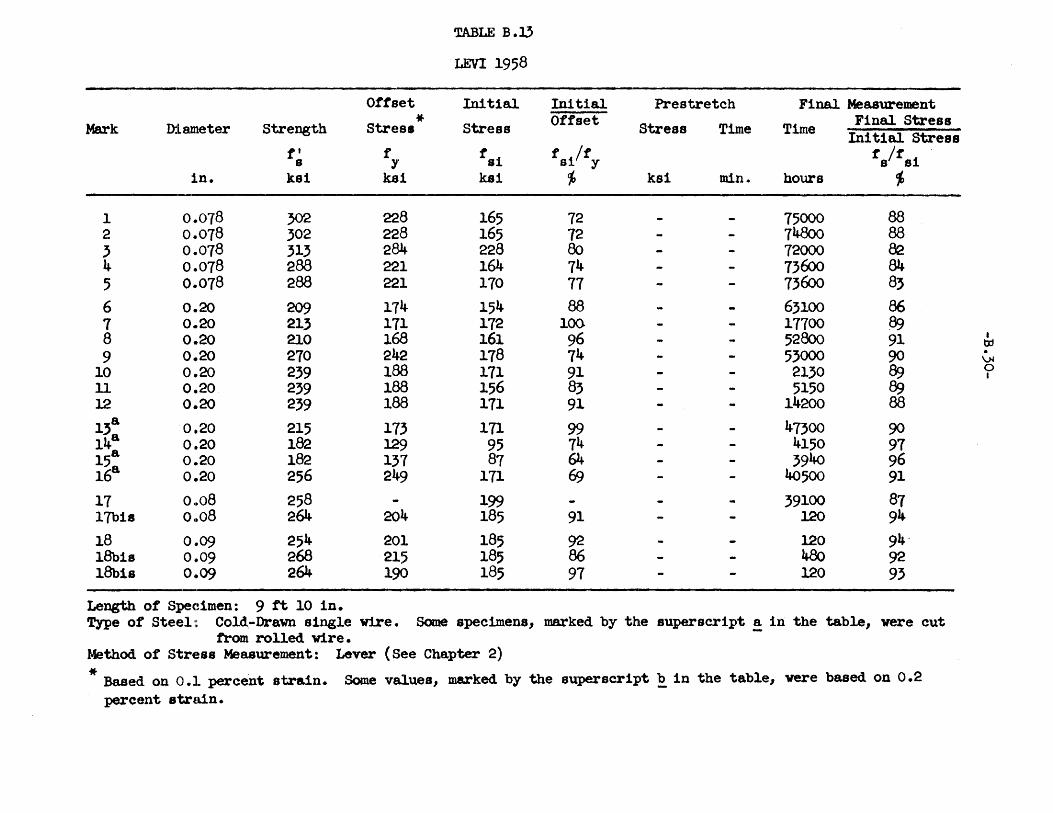
TABLE B.U
LEVI 1958
Offset Initial Initial Prestretch Final Measurement
* Offset Final Stres8 Mark D:la,meter Strength Stress stress Stress Time Time Initial stress
it f fS! f 1/f fs/tSi 8 y S Y In. ksl ka1 kal ~ ksi min. hours ~
1 0.078 ~ 228 165 12 15000 88 2 0.018 302 228 165 12 74800 88 3 0.078 313 284 228 80 12000 82 4 0.078 288 221 164 14 73(:00 84 5 0.078 288 221 110 71 73600 83 6 0.20 209 114 154 88 63100 86 7 0.20 213 171 172 100 17100 89 8 0.20 210 168 161 96 52800 91 • to
9 0.20 270 242 118 14 53000 90 . \)4
10 0.20 239 188 111 91 2130 89 0 I
11 0.20 239 188 156 83 5150 89 l2 0,.20 239 188 111 91 14200 88
13a 0,,20 215 113 111 99 41300 90
14a 0,,20 182 129 95 14 4150 97 15
8 0,.20 182 131 87 64- 3940 96 168 0,.20 256 249 111 f$ 40500 91 11 0 .. 08 258 199 39100 81 11bi8 0,,08 264- 204- 185 91 120 94
18 0 .. 09 254 201 185 92 120 94-18b18 01.09 268 215 185 86 480 92 18b18 0'1.09 264 190 185 91 120 93
Length of S:pe(~imen: 9 tt 10 in. Type of Steel::. Cold,-Drawn single wire. Some specimens, marked by the superscript! in the table, were cut
trom rolled wire. Method of Str~:~s8 Measurement: Lever (See Chapter 2)
* Based on 0.1 percent strain. Some values, marked by the superscript ~ in the table, were based on 0.2 percent atrl:un.
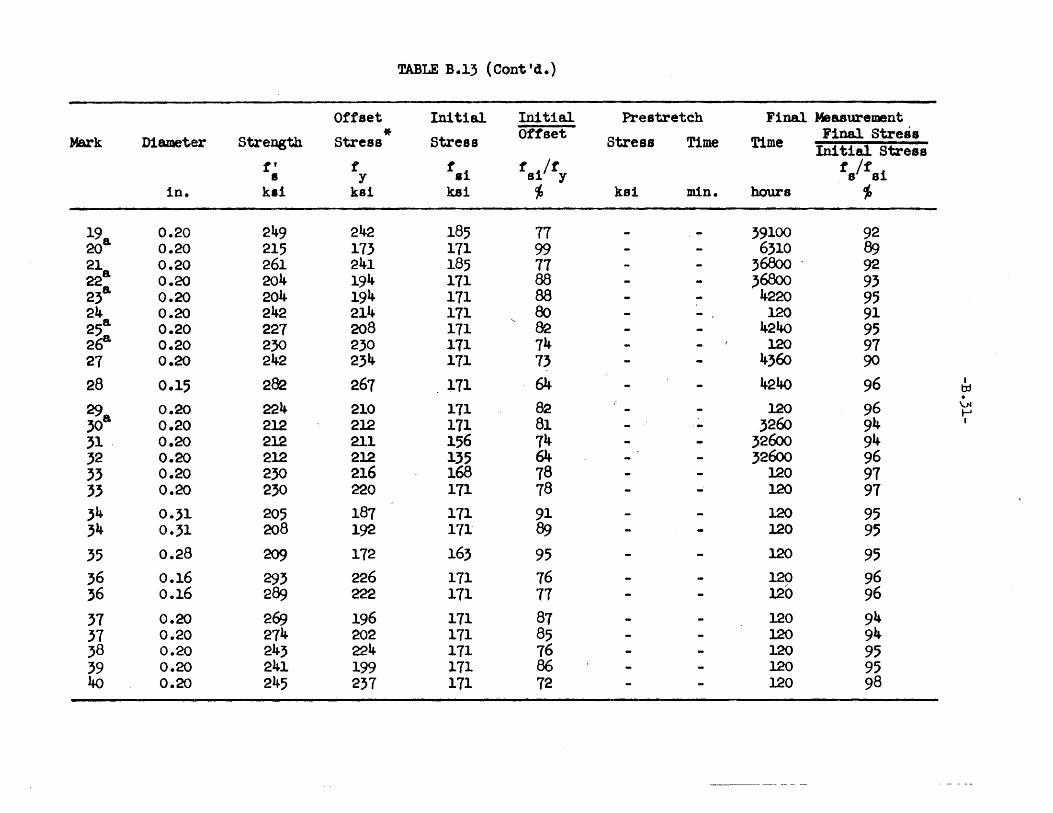
TABLE B.13 (Cont'd.)
Offset Initial Initial Prestretch Final Measurement * Offset Final stress
Mark D1ame~er Strength Stress stress stress Time Time In1 tial Stress f' f fai f l/f t It i I Y s Y s s
in. k.1 ke1 kai
'" ka1 min. hours
'" 19 0.20 249 242 185 77 39100 92 20& 0.20 215 113 111 99 6310 89 21 0.20 261 241 185 11 36800 . 92 22& 0.20 204 194 111 88 ,6800 93 23& 0.20 204 194 111 88 - 4220 95 24 0.20 242 214 171 80 120 91 25& 0.20 227 208 111 82 4240 95 2(,8 0.20 2}O 230 171 74 120 97 21 0.20 242 234- 171 73 4360 90
28 0.15 2&2 267 171 64 4-240 96 I tp .
29a 0.20 224 210 171 82 120 96 ~ t-'
30 0.20 212 212 171 81 3260 94 I
31 . 0.20 212 211 156 74- 32600 94 32 0.20 212 212 135 64- 32600 96 '3 0.20 230 216 168 78 120 97 33 0.20 230 220 171 78 120 97 34 0.31 205 187 111 91 120 95 34 0.31 208 192 171 89 120 95
35 0.28 209 172 163 95 120 95 36 0.16 293 226 111 76 120 96 36 0.16 289 222 171 71 120 96
31 0.20 269 196 111 87 120 94 31 0.20 274 202 171 85 120 94 38 0.20 243 224 111 16 120 95 39 0.20 241 199 111 86 120 95 40 0.20 245 231 111 72 120 98

TABLE B.l3 (Cont'd.)
Offset Initial Initial Prestretch Final Measurement * Offset Final. stress
Mark Diameter strength Stress Stress stress Time Time Initial Stress ff f tai t ilf t It 1 s y ., y 8 8
In. ksl ka! ka1 ~ kai min. hours c;,
41 0.20 262 228 135 59 1270 95 42 0.20 262 228 157 69 1300 97 43 0.210 262 228 171 15 1300 94 44 0.20 278 255 151 62 120 91 45 0.20 246 183 171 93 120 91
45 0.20 246 179 171 95 120 91 45 0.2() 244 118 171 96 120 91 45 0.20 251 179 171 95 120 90 45 0.20 25,1 185 111 92 120 90 46 0.20 262 228 111 75 120 94 I
to 46 0.20 262 228 171 75 120 95 .
\..N
-!~7 0.20 251 240 111 71 120 98 I\) I
47 0.20 253 241 171 11 120 98 47b1s 0.20 251 240 181 75 120 97 47bi8 0.20 253 241 223 97 120 91
53 0.28 221 193 199 103 120 94 53 0.213 221 193 185 96 120 95 53 0.213 221 193 171 Be) 120 96 53 0.28 221 193 157 81 120 96
54 0.20 232 212 111 81 120 99 55 o.2B 235 204 171 84 120
56 0.20 240 19~ 171 81 120 95 56 0.2() 240 19~ 171 81 120 95 58 0.20 250 202 171 85 120 92 58 0.2() 254 202b 142 70 120 94 58 0.20 254 202b
150 14 120 93 58 0.2() 249 18gb 171 90 120 90
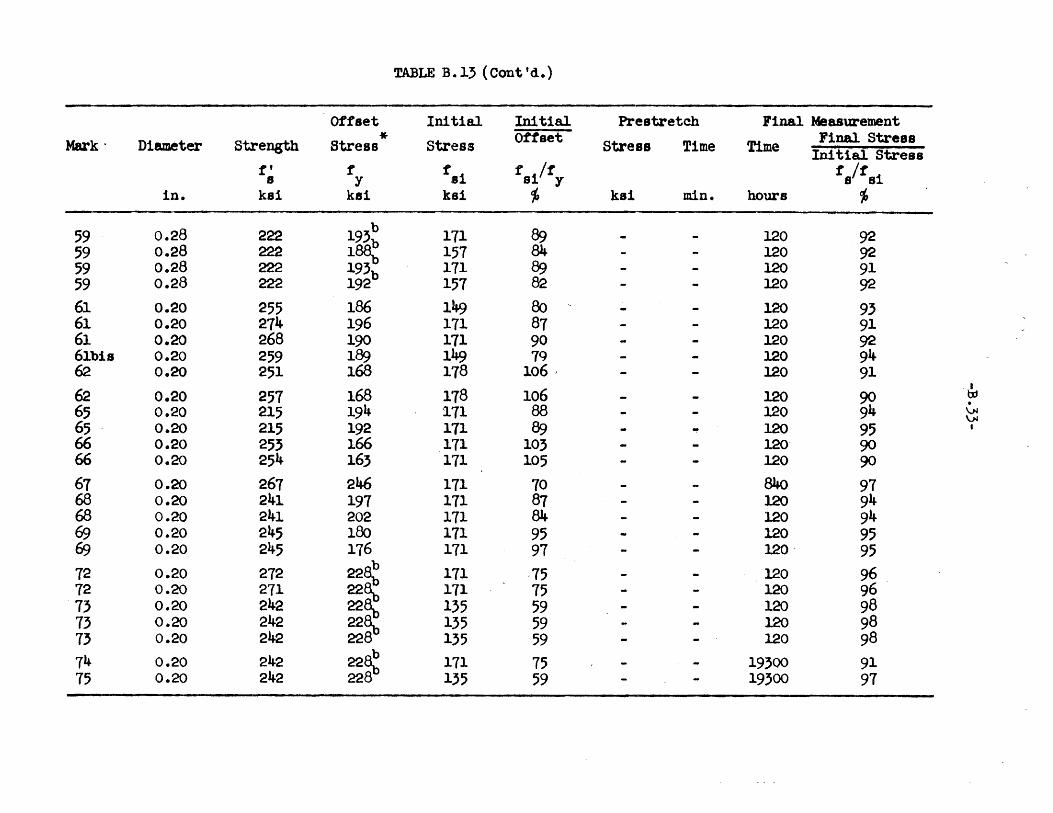
TABLE B.l3 (Cont 'd.)
Offset Initial Initial. Pr,estretch Final Measurement
* Offset Final. Stress Mark' Diameter Strength Stress stress Stress Time Time In! tlal Stres8
t' f fel t lit t It i s y s y S 8
in. ksi kai ksi ;, kai min. hours ;,
59 0.28 222 193b 171 8<) 120 92 59 0.28 222 1~ 151 84 120 92 59 0.28 222 193 111 89 120 91 59 0.28 222 192b 151 82 120 92 61 0.20 255 186 149 80 , 120 93 61 0.20 214 196 111 81 120 91 61 0.20 268 190 171 90 120 92 61bis 0.20 259 189 149 79 120 94 62 0.20 251 168 178 106 I 120 91 62 168 178 106
. I
0.20 251 120 ~
tJj . 65 0.20 215 194 1.71 88 120 \..N
\..N 65 0.20 215 192 111 8c; "!' 120 95 I
66 0.20 253 166 171 103 120 90 66 0.20 254 163 171 105 120 90
61 0.20 261 246 171 70 840 97 68 0.20 241 197 171 87 120 94 68 0.20 241 202 111 84 120 94 69 0.20 245 180 171 95 120 95 69 0.20 245 176 171 91 120 - 95 72 0.20 272 22~ 171 75 120 96 72 0.20 211 :~ 171 75 120 96 73 0.20 242 135 59 120 98 13 0.20 242 :~ 135 59 120 98 73 0.20 242 135 59 120 98 74 0.20 242 22~ 111 15 19300 91 75 0.20 242 228 135 59 19300 97
TABLE B.J4
.JEVTIC 1959
Offset Initial Initial Pre stretch Final Measurement * ** Offset Flnal Stres8
Mark Diameter Strength stress Stress stress Time Time Initial Stress f' t f'si f' IIf' falrsi s y a y-
in. ka! kal kai 10 ksi min. ho~8 cfo
1 0.1 271 l~ 113 91.5 696 96.1 2 0.1 211 189 116 93.1 696 95·3 3 0.1 211 189 189 100.0 696 95.2 4 0.1 211 189 202 101 6<;6 94.5 5 0.1 211 189 226 119 ~6 91.8
6 0.2 214 156 141 90.4 120 95·3 I
,1 0.2 214 156 155 99.4- 120 94.4 tJj . 8 0.2 214- 156 114 112.4- 192 92.1 VI
+="" I
Length ot Specimen: 80.1 in. Type ot Steel: Cold-drawn single wire
(See Chapter 2) Method of' Stres8 Measurement: Vibration
* Not Ind1 cated in original paper.
** Based. on 0.1 percent strain.

TABLE B.15
VIEST, KImHAM, AND FISHER 1960
Offset Initial Initial Pre stretch Final Measurement
Mark Diameter Strength Strf!811 8tres8 Offset Stress Time Time Final StreBB IDitial Stress
t' t t. i t Ilf t It i • 1 8 Y s s In. kal kal kai ~ kai min. hours ~
509 .192 257 ?15 199·1 92.6 219.1 1 1000 91.0 501 .192 257 215 196.4 91.3 216.4 1 1000 92.8 506 .192 257 215 187.5 81.2 201.5 1 1000 92.1 505 .192 257 215 184.7 85.9 204.7 1 1000 94.1 502 .192 257 215 180.8 84.1 200.8 1 1000 92·9 504- .192 251 215 180.5 84.0 200·5 1 1000 95·7 503 .192 251 215 175.0 81.4 195·0 1 1000 95.8 510 .192 257 215 169.1 78.1 1l?$.1 1 1000 95.1
604- ·375 265 240 187.5 18.1 a 0.3-0.5 1000 9,4.6 I
609 .315 265 240 185.0 0.3-0.5 1000 93.6 txJ
11.1 a - . , 610 .315 265 240 165.4 69.0 0.3-0.5 1000 91.0
~ a Vl
I 601 .315 265 240 163.0 68.0 a 0.3-0.5 1000 97.4 602 .315 265 240 158.0 65.9 a 0.3-0.5 1000 98.0
606 ·315 215 240 195·5 81.5 a 0·3-0.5 1000 93·9 608 ·315 215 240 1l$.0 18.8 a 0.3-0.5 1000 95.1 603 .315 215 240 185.8 17.5 a 0.3-0.5 1000 96.1 601 .315 215 240 169.3 10.6 a 0·3-0·5 1000 96.9 605 .315 215 240 168.3 10.1, a 0·3-0·5 1000 96.5
Length of Specimen: About 3 tt 4 in. Type of Steel: Cold-Drawn stress-relieved wire in Series 500 and cold-drawn stress-relieved seven-wire
strand in Series 600. Method of Stress Measurement: Vibration for the wires. The stress in the strand was measured directly.
(See Chapter 2)
a An additional stress of 19 to 24 ksi.