Embed Size (px)
Citation preview


CONTENTS
2 Company Profile
3 Principal Financial Data and Indicators
6 Changes in Share Capital and Shareholdings
of Principal Shareholders
8 Chairman’s Statement
11 Business Review and Prospects
19 Management’s Discussion and Analysis
29 Significant Events
39 Connected Transactions
43 Corporate Governance
50 Report of the Board of Directors
58 Report of the Board of Supervisors
60 Directors, Supervisors, Senior
Management and Employees
74 Principal Wholly-owned and
Controlled Subsidiaries
75 Financial Statements
209 Corporate Information
210 Documents for Inspection
This annual report includes forward-looking statements. All statements, other than statements of historical facts, that address activities, events or developments that the Company expects or anticipates will or may occur in the future (including but not limited to projections, targets, reserve and other estimates and business plans) are forward-looking statements. The Company’s actual results or developments may differ materially from those indicated by these forward-looking statements as a result of various factors and uncertainties. The Company makes the forward-looking statements referred to herein as at 24 March 2017 and unless required by regulatory authorities, the Company undertakes no obligation to update these statements.
2 CHINA PETROLEUM & CHEMICAL CORPORATIONAnnual Report 2016
COMPANY PROFILEC
ompan
y P
rofi
le
IMPORTANT NOTICE: THE BOARD OF DIRECTORS, THE BOARD OF SUPERVISORS, DIRECTORS, SUPERVISORS AND SENIOR MANAGEMENT OF SINOPEC CORP. WARRANT THAT THERE ARE NO FALSE REPRESENTATIONS, MISLEADING STATEMENTS OR MATERIAL OMISSIONS IN THIS ANNUAL REPORT, AND JOINTLY AND SEVERALLY ACCEPT FULL RESPONSIBILITY FOR THE AUTHENTICITY, ACCURACY AND COMPLETENESS OF THE INFORMATION CONTAINED IN THIS ANNUAL REPORT. THERE IS NO OCCUPANCY OF NON-OPERATING FUNDS BY THE CONTROLLING SHAREHOLDERS OF SINOPEC CORP.. MR. WANG YUPU, CHAIRMAN OF THE BOARD OF DIRECTORS, MR. DAI HOULIANG, VICE CHAIRMAN AND PRESIDENT, MR. WANG DEHUA, CHIEF FINANCIAL OFFICER AND HEAD OF THE FINACIAL DEPARTMENT OF SINOPEC CORP. WARRANT THE AUTHENTICITY AND COMPLETENESS OF THE FINANCIAL STATEMENTS CONTAINED IN THIS ANNUAL REPORT. THE AUDIT COMMITTEE OF SINOPEC CORP. HAS REVIEWED THE ANNUAL RESULTS OF SINOPEC CORP. FOR THE YEAR ENDED 31 DECEMBER 2016.
THE FINANCIAL STATEMENTS FOR THE YEAR ENDED 31 DECEMBER 2016 OF THE COMPANY PREPARED IN ACCORDANCE WITH THE PRC ACCOUNTING STANDARDS FOR BUSINESS ENTERPRISES (ASBE) AND INTERNATIONAL FINANCIAL REPORTING STANDARDS (IFRS) HAVE BEEN AUDITED BY PRICEWATERHOUSECOOPERS ZHONG TIAN LLP AND PRICEWATERHOUSECOOPERS RESPECTIVELY. BOTH FIRMS HAVE ISSUED STANDARD UNQUALIFIED AUDITOR’S REPORT.
AS APPROVED BY THE 12TH MEETING OF THE SIXTH SESSION OF THE BOARD OF DIRECTORS OF SINOPEC CORP., THE BOARD PROPOSED A FINAL CASH DIVIDEND OF RMB 0.17 (TAX INCLUSIVE) PER SHARE FOR 2016, COMBINING WITH THE INTERIM CASH DIVIDEND OF RMB 0.079 (TAX INCLUSIVE) PER SHARE, THE TOTAL CASH DIVIDEND FOR 2016 WILL BE RMB 0.249 (TAX INCLUSIVE) PER SHARE. THE DIVIDEND PROPOSAL IS SUBJECT TO THE SHAREHOLDERS’ APPROVAL AT THE ANNUAL GENERAL MEETING FOR THE YEAR 2016.
Exploration and Production Refining Marketing and Distribution Chemicals
COMPANY PROFILESinopec Corp. is one of the largest integrated energy and chemical companies in China. Its principal operations include the exploration and production, pipeline transportation and sale of petroleum and natural gas; the production, sale, storage and transportation of refinery products, petrochemical products, coal chemical products, synthetic fibre, and other chemical products; the import and export, including an import and export agency business, of petroleum, natural gas, petroleum products, petrochemical and chemical products, and other commodities and technologies; and research, development and application of technologies and information.
DEFINITIONS:In this report, unless the context otherwise requires, the following terms shall have the meaning set out below:Sinopec Corp.: China Petroleum & Chemical Corporation;Company: Sinopec Corp. and its subsidiaries;China Petrochemical Corporation: our controlling shareholder, China Petrochemical Corporation;Sinopec group: China Petrochemical Corporation and its subsidiaries;Sichuan-to-East China Pipeline Co.: Sinopec Sichuan-to-East China Natural Gas Pipeline Co., Ltd;RMC: Oil and Natural Gas Reserves Management Committee of the Company;CSRC: China Securities Regulatory Commission.Hong Kong Stock Exchange: The Stock Exchange of Hong Kong LimitedHong Kong Listing Rules: Listing Rules of the Hong Kong Stock Exchange
Conversion:For domestic production of crude oil, 1 tonne = 7.1 barrels;For overseas production of crude oil: 2016, 1 tonne = 7.20 barrels; 2015, 1 tonne = 7.21 barrels; 2014, 1 tonne = 7.22 barrels;For production of natural gas, 1 cubic meter = 35.31 cubic feet;Refinery throughput is converted at 1 tonne = 7.35 barrels.
3CHINA PETROLEUM & CHEMICAL CORPORATION Annual Report 2016
PRINCIPAL FINANCIAL DATA AND INDICATORS
Pri
ncip
al F
inan
cial
Dat
a an
d I
ndic
ator
s
1 FINANCIAL DATA AND INDICATORS PREPARED IN ACCORDANCE WITH ASBE
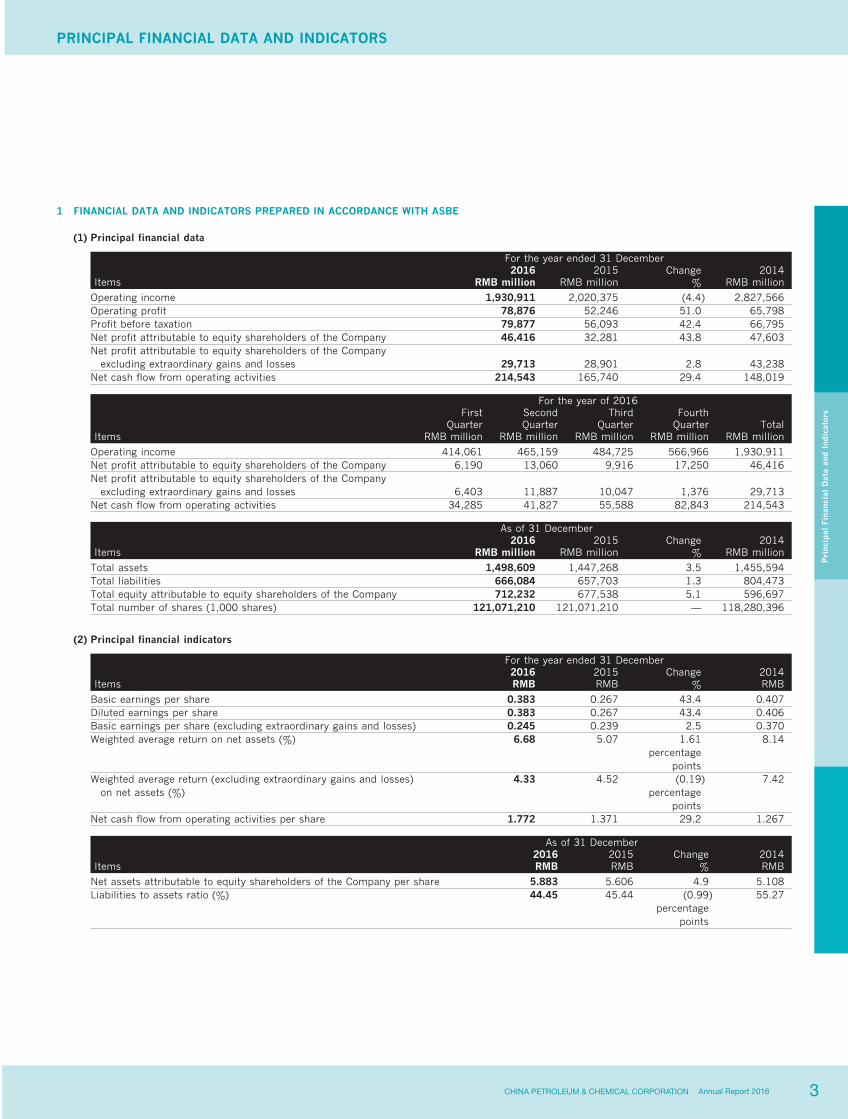
(1) Principal financial data
For the year ended 31 December2016 2015 Change 2014
Items RMB million RMB million % RMB million
Operating income 1,930,911 2,020,375 (4.4) 2,827,566Operating profit 78,876 52,246 51.0 65,798Profit before taxation 79,877 56,093 42.4 66,795Net profit attributable to equity shareholders of the Company 46,416 32,281 43.8 47,603Net profit attributable to equity shareholders of the Company excluding extraordinary gains and losses 29,713 28,901 2.8 43,238Net cash flow from operating activities 214,543 165,740 29.4 148,019
For the year of 2016First
QuarterSecondQuarter
ThirdQuarter
FourthQuarter Total
Items RMB million RMB million RMB million RMB million RMB million
Operating income 414,061 465,159 484,725 566,966 1,930,911Net profit attributable to equity shareholders of the Company 6,190 13,060 9,916 17,250 46,416Net profit attributable to equity shareholders of the Company excluding extraordinary gains and losses 6,403 11,887 10,047 1,376 29,713Net cash flow from operating activities 34,285 41,827 55,588 82,843 214,543
As of 31 December2016 2015 Change 2014
Items RMB million RMB million % RMB million
Total assets 1,498,609 1,447,268 3.5 1,455,594Total liabilities 666,084 657,703 1.3 804,473Total equity attributable to equity shareholders of the Company 712,232 677,538 5.1 596,697Total number of shares (1,000 shares) 121,071,210 121,071,210 — 118,280,396
(2) Principal financial indicators
For the year ended 31 December2016 2015 Change 2014
Items RMB RMB % RMB
Basic earnings per share 0.383 0.267 43.4 0.407Diluted earnings per share 0.383 0.267 43.4 0.406Basic earnings per share (excluding extraordinary gains and losses) 0.245 0.239 2.5 0.370Weighted average return on net assets (%) 6.68 5.07 1.61 8.14
percentage
points Weighted average return (excluding extraordinary gains and losses) on net assets (%)
4.33 4.52 (0.19)percentage
7.42
points Net cash flow from operating activities per share 1.772 1.371 29.2 1.267
As of 31 December2016 2015 Change 2014
Items RMB RMB % RMB
Net assets attributable to equity shareholders of the Company per share 5.883 5.606 4.9 5.108Liabilities to assets ratio (%) 44.45 45.44 (0.99) 55.27
percentage
points

4 CHINA PETROLEUM & CHEMICAL CORPORATIONAnnual Report 2016
Pri
ncip
al F
inan
cial
Dat
a an
d I
ndic
ator
s
PRINCIPAL FINANCIAL DATA AND INDICATORS (CONTINUED)
(3) Extraordinary items and corresponding amounts
For the year ended 31 December(Income)/expenses
2016 2015 2014Items RMB million RMB million RMB million
Net loss on disposal of non-current assets 1,528 721 1,622Donations 133 112 125Government grants (3,987) (5,002) (3,165)Gain on holding and disposal of various investments (518) (943) (4,680)Investment income in Sichuan-to-East China Pipeline Co. recalculated after losing control (20,562) — —Other non-operating expenses, net 1,328 331 419Gain on business combination under the same control (86) (134) (314)Subtotal (22,164) (4,915) (5,993)Tax effect 5,578 1,060 1,420Total (16,586) (3,855) (4,573)Attributable to: Equity shareholders of the Company (16,703) (3,380) (4,365)
Minority interests 117 (475) (208)
(4) Items measured by fair values Unit: RMB million
Beginning of End ofInfluence
on the profitItems the year the year Changes of the year
Available-for-sale financial assets 261 262 1 10Derivative financial instruments 403 314 (89) 195Cash flow hedging 4,722 (4,024) (8,746) (5,975)Total 5,386 (3,448) (8,834) (5,770)
(5) Significant changes of items in the financial statements The table below sets forth reasons for those changes where the fluctuation was more than 30% during the reporting period, or such changes
which constituted 5% or more of total assets at the balance sheet date or more than 10% of profit before taxation:
As of 31 December Increase/(decrease)2016 2015 Amount Percentage
Items RMB million RMB million RMB million (%) Reasons for change
Cash at bank and on hand
142,497
69,666
72,831
104.5
Significant Improvement on operating cash flow and decreased investment as compared with 2015, resulted in surplus cash
Long term equity investment
116,812
84,293
32,519
38.6
Mainly due to sale of equity in Sichuan-to-East China Pipeline Co., resulted in RMB 22.8 billion increase in long term equity in associates.
Short-term borrowings
30,374
74,729
(44,355)
(59.4)
Mainly due to increase in profits and decrease in demand for external funds, and the repayment of part of the short-term borrowings
Notes payable
5,828
3,566
2,262
63.4
The Company optimised its operating funds, and based on its trust worthy creditability, increased its credit line in using the notes
Accounts payable
174,301
130,558
43,743
33.5
Mainly due to the increase in trading volume of the trading business, resulted in an increase of RMB 30.5 billion in the accounts payable to the third parties.
Tax payable
52,886
32,492
20,394
62.8
Mainly due to significant increase in profit from refineries as well as the impact of timing of the taxes submitted by enterprises
Short term bonds payable
6,000
30,000
(24,000)
(80.0)
Mainly due to the maturity of RMB 30 billion super short term financing papers, and issuance of RMB 12 billion super short term papers in 2016, with the year-end balance of RMB 6 billion
Income of investment 30,779 8,876 21,903 246.8 Mainly due to increased income from reorganisation of pipeline assets

5CHINA PETROLEUM & CHEMICAL CORPORATION Annual Report 2016
Pri
ncip
al F
inan
cial
Dat
a an
d I
ndic
ator
s
2 FINANCIAL INFORMATION EXTRACTED FROM THE FINANCIAL STATEMENTS PREPARED IN ACCORDANCE WITH IFRSUnit: RMB million
For the year ended 31 DecemberItems 2016 2015 2014 2013 2012
Turnover and other operating revenues 1,930,911 2,020,375 2,827,566 2,881,928 2,787,684Operating profit 77,193 56,822 73,439 96,763 98,604Profit before taxation 80,151 56,411 65,818 95,444 91,012Profit attributable to owners of the Company 46,672 32,512 46,639 66,348 64,082Basic earnings per share (RMB) 0.385 0.269 0.399 0.571 0.568Diluted earnings per share (RMB) 0.385 0.269 0.399 0.536 0.546Return on capital employed (%) 7.30 5.23 6.06 8.03 9.10Return on net assets (%) 6.56 4.81 7.84 11.62 12.48Net cash generated from operating activities per share (RMB) 1.772 1.371 1.267 1.305 1.264
Unit: RMB million
As of 31 DecemberItems 2016 2015 2014 2013 2012
Non-current assets 1,086,348 1,113,611 1,094,035 1,012,703 895,761Net current liabilities 73,282 129,175 242,892 197,440 146,743Non-current liabilities 181,831 196,275 201,540 189,485 196,617Non-controlling interests 120,241 111,964 54,348 54,691 39,086Total equity attributable to owners of the Company 710,994 676,197 595,255 571,087 513,315Net assets per share (RMB) 5.873 5.585 5.033 4.899 5.912Adjusted net assets per share (RMB) 5.808 5.517 4.969 4.860 5.846
3 MAJOR DIFFERENCES BETWEEN THE AUDITED FINANCIAL STATEMENTS PREPARED UNDER ASBE AND IFRS PLEASE REFER TO PAGE 202 OF THE REPORT.
6 CHINA PETROLEUM & CHEMICAL CORPORATIONAnnual Report 2016
CHANGES IN SHARE CAPITAL AND SHAREHOLDINGS OF PRINCIPAL SHAREHOLDERS
Cha
nges
in
Sha
re C
apit
al a
nd
Sha
reho
ldin
gs o
f P
rinc
ipal
Sha
reho
lder
s
1 CHANGES IN THE SHARE CAPITALThere is no change on the number and nature of shares of Sinopec Corp. during the reporting period
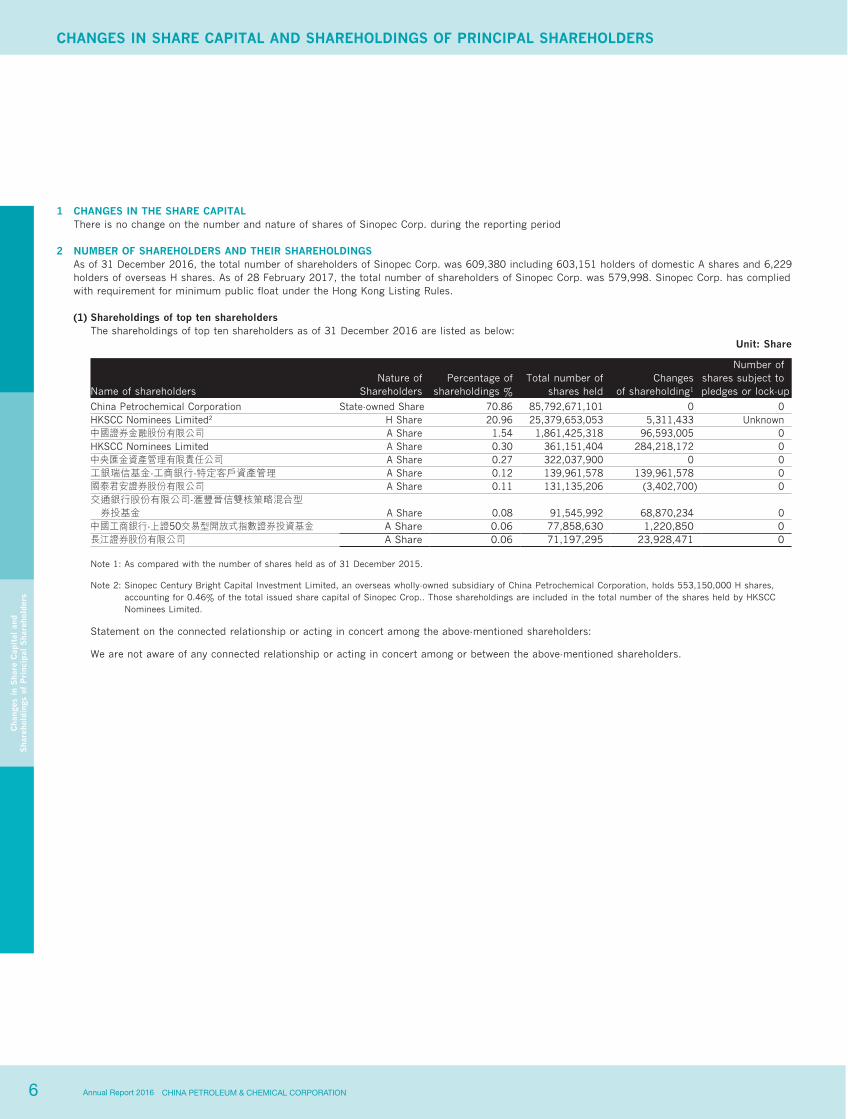
2 NUMBER OF SHAREHOLDERS AND THEIR SHAREHOLDINGSAs of 31 December 2016, the total number of shareholders of Sinopec Corp. was 609,380 including 603,151 holders of domestic A shares and 6,229 holders of overseas H shares. As of 28 February 2017, the total number of shareholders of Sinopec Corp. was 579,998. Sinopec Corp. has complied with requirement for minimum public float under the Hong Kong Listing Rules.
(1) Shareholdings of top ten shareholders The shareholdings of top ten shareholders as of 31 December 2016 are listed as below:
Unit: Share
Number of
Name of shareholdersNature of
ShareholdersPercentage of
shareholdings %Total number of
shares heldChanges
of shareholding1
shares subject topledges or lock-up
China Petrochemical Corporation State-owned Share 70.86 85,792,671,101 0 0HKSCC Nominees Limited2 H Share 20.96 25,379,653,053 5,311,433 Unknown中國證券金融股份有限公司 A Share 1.54 1,861,425,318 96,593,005 0HKSCC Nominees Limited A Share 0.30 361,151,404 284,218,172 0中央匯金資產管理有限責任公司 A Share 0.27 322,037,900 0 0工銀瑞信基金-工商銀行-特定客戶資產管理 A Share 0.12 139,961,578 139,961,578 0國泰君安證券股份有限公司 A Share 0.11 131,135,206 (3,402,700) 0交通銀行股份有限公司-滙豐晉信雙核策略混合型 券投基金 A Share 0.08 91,545,992 68,870,234 0中國工商銀行-上證50交易型開放式指數證券投資基金 A Share 0.06 77,858,630 1,220,850 0長江證券股份有限公司 A Share 0.06 71,197,295 23,928,471 0
Note 1: As compared with the number of shares held as of 31 December 2015.
Note 2: Sinopec Century Bright Capital Investment Limited, an overseas wholly-owned subsidiary of China Petrochemical Corporation, holds 553,150,000 H shares, accounting for 0.46% of the total issued share capital of Sinopec Crop.. Those shareholdings are included in the total number of the shares held by HKSCC Nominees Limited.
Statement on the connected relationship or acting in concert among the above-mentioned shareholders:
We are not aware of any connected relationship or acting in concert among or between the above-mentioned shareholders.

7CHINA PETROLEUM & CHEMICAL CORPORATION Annual Report 2016
Cha
nges
in
Sha
re C
apit
al a
nd
Sha
reho
ldin
gs o
f P
rinc
ipal
Sha
reho
lder
s
(2) Information disclosed by the shareholders of H shares in accordance with the Securities and Futures Ordinance (SFO)
Name of shareholders Status of shareholders
Number ofshares interests heldor regarded as held
(H Share)
Approximatepercentage of Sinopec
Corp.’s issued share capital (H Share) (%)
BlackRock, Inc.
Interest of corporation controlled by the substantial shareholder
2,278,374,418(L)1,558,000(S)
8.93(L)0.01(S)
JPMorgan Chase & Co. Beneficial owner 492,573,324(L) 1.93(L)158,634,692(S) 0.62(S)
Investment manager 31,602,000(L) 0.12(L)Trustee (exclusive of passive trustee) 20,400(L) 0.00(L)
Custodian corporation/approved lending agent 908,006,153(L) 3.56(L)Schroders Plc Investment manager 1,275,857,318(L) 5.00(L)
(L) : Long position, (S): Short position
3 ISSUANCE AND LISTING OF SECURITIES
Petrochemical Corporation injected its principal petroleum and petrochemical businesses into Sinopec Corp. and retained certain petrochemical facilities. It provides well-drilling services, well-logging services, downhole operation services, services in connection with manufacturing and maintenance of production equipment, engineering construction, utility services including water and power and social services.
Shares of other listed companies directly held by China Petrochemical Corporation
Name of CompanyNumberof
Shares HeldShareholding
Percentage
Sinopec Engineering (Group) Co. Ltd 2,907,856,000 65.67%Sinopec Oilfield Service Corporation 9,224,327,662 65.22%Sinopec Oilfield Equipment Corporation 351,351,000 58.74%China Merchants Energy Shipping Co., Ltd 912,886,426 17.23%
(2) Other than HKSCC Nominees Limited, there was no other legal person shareholder holding 10% or more of the total issued share capital of Sinopec Corp.
(3) Basic information of the de facto controllerChina Petrochemical Corporation is the de facto controller of Sinopec Corp.
(4) Diagram of the equity and controlling relationship between Sinopec Corp. and its de facto controller
*: Inclusive of 553,150,000 H shares held by Sinopec Century Bright Capital Investment Ltd. (overseas wholly-owned subsidiary of China Petrochemical Corporation) through HKSCC Nominees Limited.
(1) Issuance of securities in reporting periodThere is no issuance of shares of Sinopec Corp. during the reporting period
(2) Existing employee sharesAs at the end of the reporting period, there were no employee shares.
4 CHANGES IN THE CONTROLLING SHAREHOLDERS AND THE DE FACTO CONTROLLERThere was no change in the controlling shareholder and the de facto controller of Sinopec Corp. during the reporting period.
(1) Controlling shareholderThe controlling shareholder of Sinopec Corp. is China Petrochemical Corporation. Established in July 1998, China Petrochemical Corporation is a state-authorised investment organisation and a state-owned enterprise. The legal representative is Mr. Wang Yupu. Through re-organisation in 2000, China
8 CHINA PETROLEUM & CHEMICAL CORPORATIONAnnual Report 2016
CHAIRMAN’S STATEMENTC
hair
man
’ s S
tate
men
t
Dear Shareholders and Friends:
On behalf of the Board of Directors, the management and all the staff of Sinopec Corp., I would like to express my sincere gratitude to our shareholders and the wider community for your interest and support.
In 2016, as a result of low oil prices, the Company faced a challenging and complex operating environment. Given those conditions, on one hand, in light of the government’s new thinking about the country’s development, the Company took a visionary approach to the future. Guided by our strategies of value-oriented growth, innovation-driven development, integrated resource allocation, openness to cooperation, and green, low-carbon development, we formulated our 13th Five-Year Plan and has been continuously creating new and sustainable competitive advantages. On the
other hand, in view of the difficulties that low oil prices created for our upstream operations, along with slower growth in downstream demand and structural changes in the external environment, we intensified our reform initiatives and implemented stricter controls over our investment plans in tandem with a series of major reforms on the supply side. Over the past year, our focus on transformation of growth mode and structural adjustments allowed us to improve the quality and efficiency of our assets as well as upgrade our operations. Under the management’s leadership, the entire staff united to advance these goals. We achieved significant improvement in our operating results through unrelenting joint efforts to explore new markets, optimise our operations, reduce costs and improve risk management. Together, these achievements represented an exceptional start to our 13th Five-Year Plan.
In 2016, in accordance with the IFRS, the Company recorded a turnover and other operating revenue of RMB 1,930.9 billion. Profit before taxation was RMB80.2 billion, represented a 42.1% increase year on year, of which profit attributable to owners of the Company amounted to RMB46.7 billion, represented a 43.6% increase year on year. Taking into account the Company’s profitability, shareholders return and the need for future development, the Board of Directors proposed a final dividend of RMB 0.17 per share, which, combined with the interim dividend of RMB 0.079 per share, brought the full-year dividend to RMB 0.249 per share. The dividend payout ratio reaches 64.6%.
Over the past year, in its efforts to implement supply-side structural reform, the Company benefited from its integrated value chain, which allows our businesses to complement each other well. As we increased the effective supply of petroleum and petrochemical products and related services to the community, we reaped economic benefits and improved our asset utilisation. To cope with harsh conditions in the upstream sector, we strengthened measures to rein in costs and address our weaknesses. At the same time, we gave priority to high-efficiency exploration activities and made a number of important new discoveries. In line with our emphasis on profitability, we made continuous improvements in our oil production and trimmed production of high-cost oilfields, thereby effectively controlling our production costs. The Company also continuously improves its energy structure by increasing production of shale gas. As a result, domestic gas production for the year reached 21.6 billion cubic meters, while we further developed Fuling shale gas field, China’s first large-scale shale gas project, to an annual capacity of 7 billion cubic meters. Our energy structure improved steadily as our gas supply in the Yangtze River Economic Belt and the Beijing-Tianjin-Hebei region continued to grow. In downstream operations, the Company achieved robust results by taking advantage of market opportunities to expand the effective supply of mid-range and high-end products. We optimised the structure of our refinery products according to market demand and vigorously promoted applications of new technologies, leading to a lower diesel-to-gasoline ratio. Moreover, we pressed ahead with upgrading of our oil product specification to ensure implementation of GB V standards for automobile gasoline and diesel fuels and the GB VI standards for Beijing. At the same time, we eliminated obsolete and low-efficiency production
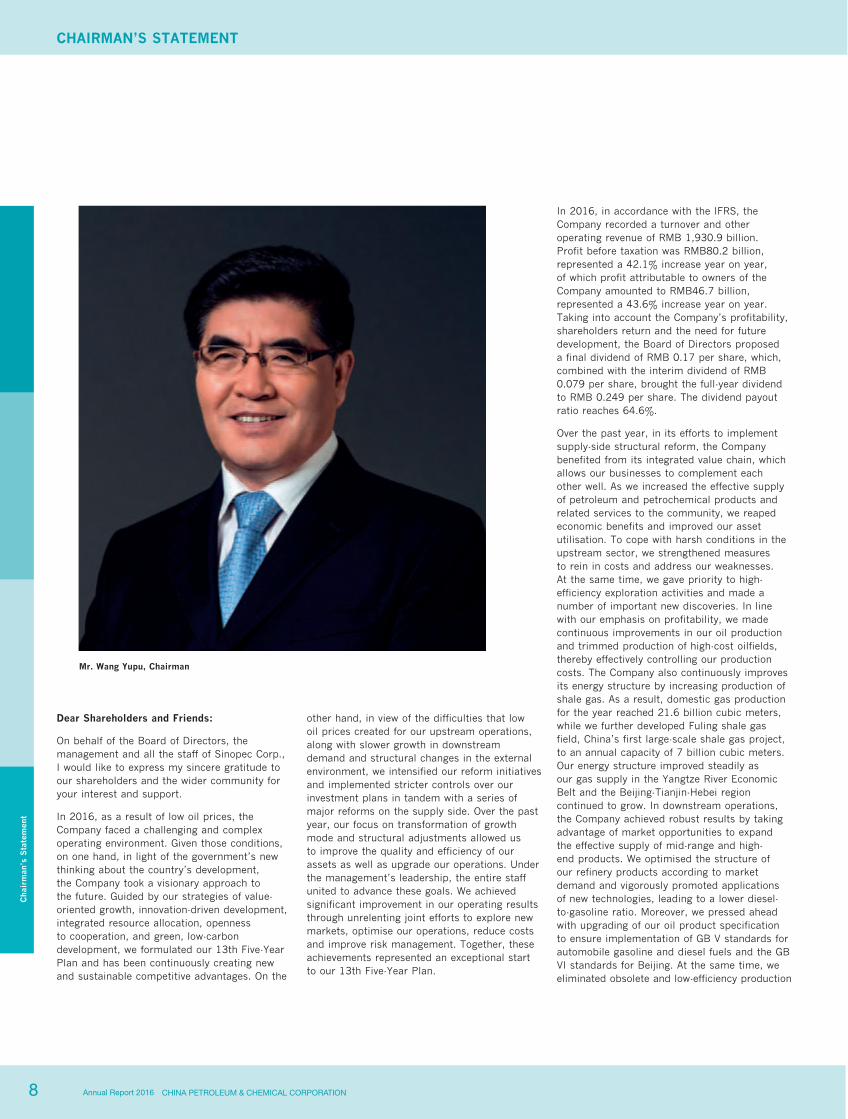
Mr. Wang Yupu, Chairman

9CHINA PETROLEUM & CHEMICAL CORPORATION Annual Report 2016
Cha
irm
an’ s
Sta
tem
ent
facilities. In the chemical business, we adhered to development of basic and high-end chemicals. We further increased the proportion of high end products from three major synthetic materials. As we enhanced our efforts in new product development, we pressed ahead with integration of production, sales, research and consumption, striving to offer comprehensive solutions to customers. Meanwhile, we continuously adapted our marketing initiatives to reflect the latest market trends. With our superior network, we delivered more environmentally friendly premium gasoline products to the market. In addition, we complemented our marketing activities by growing our emerging businesses. We continuously expanded our business types and product varieties in an aim to provide one-stop service to our customers. Transaction value of our emerging business surged by 41%. These results mark an important milestone for us in our development as an comprehensive service provider.
In 2016, the Company further enhanced cooperation with our business partners. In our overseas operations, we were actively involved in expanding projects across the Belt and Road region and we continued to make progress in developing a number of major projects, such as the Yanbu refinery in Saudi Arabia, which commenced operations during the year. In our domestic businesses, the Company further strengthened its mixed-ownership operations and partnered with 14 provinces and cities in China to drive the development of our natural gas business. We brought in new investors to Sichuan-to-East China Pipeline Co., raising RMB 22.8 billion. Meanwhile, Sinopec Marketing Co. Ltd.’s shareholding reform progressed smoothly. While we have continued developing our refining and chemical production bases and shifting our focus towards mid-range and high-end products, we increased our efforts to find additional opportunities for cooperation in various sectors with the aim of enabling all participants to enjoy the benefits of shared development.
In 2016, the Company continued to improve its management and operating efficiency. We diligently promoted a corporate culture of rigorousness, meticulousness and pragmatism, thus ensuring that we conducted our operations in compliance with applicable laws and regulations. At the same time, we integrated our internal control and risk management systems and further improved our controls on investment and financial management. We also increased our efforts to promote information-based, intelligent operations throughout the Company and to develop our data sharing platform. As
a result, we achieved effective control over our expenses and kept inventories at reasonable levels. Moreover, we enjoyed abundant free cash flow and maintained the ratio of liabilities to assets at a low level.
Over the past year, the Company actively fulfilled its social responsibilities and firmly established itself as a good corporate citizen. We advanced our green, low-carbon development initiatives as we delivered more environmentally friendly products. We also successfully concluded our Clear Water, Blue Sky environmental campaign, achieving further declines in the emissions of major pollutants. We stressed the importance of biodiversity and strove to minimise the environmental impact of our operations. Meanwhile, we continued to open up the Company to public scrutiny. As a people-oriented enterprise, we reinforced workplace safety for our employees and secured their legitimate rights and interests. In 2016, we earmarked a total of RMB 6.584 billion to promote social, educational, medical and healthcare development in the areas where we have operations. In addition, we stepped up targeted measures to combat poverty, reduce privation in impoverished areas in Qinghai and Tibet, with total donations amounted to RMB 133 million to help local residents achieve sustainable development.
Looking ahead to 2017, we expect the global political and economic landscape to become more complex, with international oil prices hovering at low levels. Meanwhile, we believe that more positive trends will emerge in China’s economy, driving faster growth in domestic demand for petroleum and petrochemical products. The Company will adhere to its development strategies of value-oriented growth, innovation-driven development, integrated resource allocation, openness to cooperation, and green, low-carbon development. In accordance with our objective of progressing at a steady pace, we will strive to achieve safety and environmental friendly goals, stable production and operations, and steady improvements in operating results. On top of that, we will actively pursue market opportunities and further deepen supply-side structural reform. While redoubling efforts to implement structural adjustments, we will promote technological innovations and prudently implement mixed-ownership reforms. In addition, we will explore ways to create a new business model that will capitalise on our finance business to support development of core physical operations. These measures will help us rejuvenate our operations, enhance our operating efficiency and augment the profitability of our
assets. We will take advantage of opportunities that arise from the government’s support policies, including reforms in the oil and gas sector and in state-owned enterprises as well as the Belt and Road initiative, to enhance the quality and profitability of our business.
In 2017, under the Company’s 13th Five-Year Plan, our planned capital expenditures will be RMB 110.2 billion. We will strive to increase our upstream reserves and resource base. We will also expand natural gas, especially shale gas, businesses to promote gas consumption in the Yangtze River Economic Belt. In the refining and chemical businesses, we will build four world-class refining bases, in Mao Zhan, Zhenhai, Shanghai and Nanjing. We will promote further upgrades in oil products and improve our capability to deliver high-end, high-value-added products. At the same time, we will give full play of our advantages in the marketing network and brand name to supply the market with cleaner oil products and reinforce our efforts to tap potentials in our emerging businesses and transform into an comprehensive services provider. Through the implementation of Energy Efficiency Doubling Plan and Green Enterprises Action Plan, we will endeavor to become the leading green, low-carbon operators in the industry.
The Board of Directors and I believe that through the joint efforts of the Board, the management and all the staff, coupled with the support of our shareholders and the wider community, Sinopec Corp. will continue to make progress in its various businesses, growing stronger and bigger and delivering greater value to our shareholders and our society.
Wang YupuChairman
Beijing, China24 March 2017
10 CHINA PETROLEUM & CHEMICAL CORPORATIONAnnual Report 2016
BUSINESS REVIEW AND PROSPECTSB
usin
ess
Rev
iew
and
Pro
spec
ts

11CHINA PETROLEUM & CHEMICAL CORPORATION Annual Report 2016
BUSINESS REVIEW AND PROSPECTS
Bus
ines
s R
evie
w a
nd P
rosp
ects
BUSINESS REVIEW
In 2016, global economic recovery continued to be weak, while China’s economy maintained its stable growth, with gross domestic product (GDP) up by 6.7%. International oil prices fluctuated above their lowest levels. With abundant supply, domestic oil products market witnessed strong competition. Demand for chemicals grew steadily, and China’s environmental regulations became more stringent. The Company actively addressed market changes through a focus on growth quality, profitability and restructuring. We pressed ahead with measures to address market development, optimisation, cost reduction and risk control, coordinating all aspects of our work, which helped deliver operating results that were better than expected.
1 MARKET REVIEW
(1) Crude Oil MarketIn 2016, international crude oil prices bottomed out and fluctuated upwards, yet still remained at a low level. The average spot price of Platt’s Brent for the year was USD 43.69 per barrel, down by 16.7% from the previous year.
(2) Refined Oil Products MarketIn 2016, domestic demand for refined oil products maintained its growth while the structure of consumption continued to change, and market supply was in surplus. According to our statistics, apparent consumption of refined oil products (including gasoline, diesel and kerosene) was 288 million tonnes, up by 4.3% from the previous year, with gasoline up by 11.9%, kerosene up by 11.0% and diesel down by 2.2%. The government further improved the pricing mechanism for refined oil products by setting the floor price. In 2016, the government made 15 price adjustments with 10 increases and 5 decreases.
(3) Chemical Products MarketIn 2016, domestic demand for chemicals grew steadily. According to our statistics, domestic apparent consumption of ethylene equivalent was up by 3.0% from the previous year, and consumption of synthetic resin, synthetic fiber and synthetic rubber rose by 5.1%, 2.6% and 7.5%, respectively. Domestic chemical product prices decreased compared with the previous year, but experienced an upward trend, in line with movements of international chemical product prices.
Mr. Dai Houliang, Vice Chairman & President
12 CHINA PETROLEUM & CHEMICAL CORPORATIONAnnual Report 2016
BUSINESS REVIEW AND PROSPECTS (CONTINUED)
Bus
ines
s R
evie
w a
nd P
rosp
ects
2 PRODUCTION & OPERATIONS REVIEW
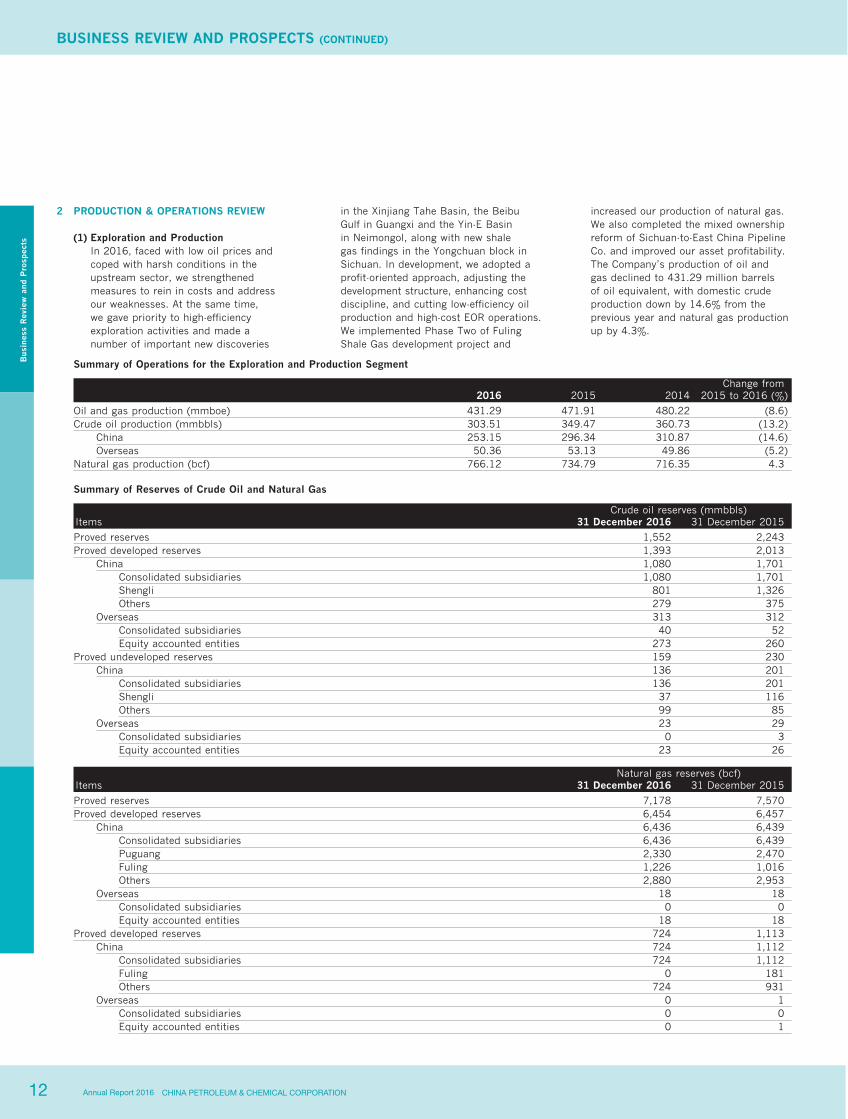
(1) Exploration and ProductionIn 2016, faced with low oil prices and coped with harsh conditions in the upstream sector, we strengthened measures to rein in costs and address our weaknesses. At the same time, we gave priority to high-efficiency exploration activities and made a number of important new discoveries
in the Xinjiang Tahe Basin, the Beibu Gulf in Guangxi and the Yin-E Basin in Neimongol, along with new shale gas findings in the Yongchuan block in Sichuan. In development, we adopted a profit-oriented approach, adjusting the development structure, enhancing cost discipline, and cutting low-efficiency oil production and high-cost EOR operations. We implemented Phase Two of Fuling Shale Gas development project and
increased our production of natural gas. We also completed the mixed ownership reform of Sichuan-to-East China Pipeline Co. and improved our asset profitability. The Company’s production of oil and gas declined to 431.29 million barrels of oil equivalent, with domestic crude production down by 14.6% from the previous year and natural gas production up by 4.3%.
Summary of Operations for the Exploration and Production Segment
Change from2016 2015 2014 2015 to 2016 (%)
Oil and gas production (mmboe) 431.29 471.91 480.22 (8.6)Crude oil production (mmbbls) 303.51 349.47 360.73 (13.2)
China 253.15 296.34 310.87 (14.6)Overseas 50.36 53.13 49.86 (5.2)
Natural gas production (bcf) 766.12 734.79 716.35 4.3
Summary of Reserves of Crude Oil and Natural Gas
Crude oil reserves (mmbbls)Items 31 December 2016 31 December 2015
Proved reserves 1,552 2,243Proved developed reserves 1,393 2,013
China 1,080 1,701Consolidated subsidiaries 1,080 1,701Shengli 801 1,326Others 279 375
Overseas 313 312Consolidated subsidiaries 40 52Equity accounted entities 273 260
Proved undeveloped reserves 159 230China 136 201
Consolidated subsidiaries 136 201Shengli 37 116Others 99 85
Overseas 23 29Consolidated subsidiaries 0 3Equity accounted entities 23 26
Natural gas reserves (bcf)Items 31 December 2016 31 December 2015
Proved reserves 7,178 7,570Proved developed reserves 6,454 6,457
China 6,436 6,439Consolidated subsidiaries 6,436 6,439Puguang 2,330 2,470Fuling 1,226 1,016Others 2,880 2,953
Overseas 18 18Consolidated subsidiaries 0 0Equity accounted entities 18 18
Proved developed reserves 724 1,113China 724 1,112
Consolidated subsidiaries 724 1,112Fuling 0 181Others 724 931
Overseas 0 1Consolidated subsidiaries 0 0Equity accounted entities 0 1

13CHINA PETROLEUM & CHEMICAL CORPORATION Annual Report 2016
Bus
ines
s R
evie
w a
nd P
rosp
ects
Exploration and Production Activities
Wells completed (as of 31 December)2016 2015
Exploratory Development Exploratory DevelopmentRegion Productive Dry Productive Dry Productive Dry Productive Dry
China 266 149 801 6 373 195 1,801 25Consolidated subsidiaries 266 149 801 6 373 195 1,801 25Shengli 166 73 462 5 150 73 1,020 18Others 100 76 339 1 223 122 781 7
Overseas 2 1 99 0 0 1 149 1Consolidated subsidiaries 0 0 0 0 0 0 5 0Equity accounted entities 2 1 99 0 0 1 144 1
Total 268 150 900 6 373 196 1,950 26
Wells being drilled (as of 31 December)2016 2015
Gross Net Gross NetRegion Exploratory Development Exploratory Development Exploratory Development Exploratory Development
China 78 138 78 138 110 152 110 152Consolidated subsidiaries 78 138 78 138 110 152 110 152Shengli 28 21 28 21 35 23 35 23Others 50 117 50 117 75 129 75 129
Overseas 0 2 0 2 0 3 0 1Consolidated subsidiaries 0 0 0 0 0 0 0 0Equity accounted entities 0 2 0 2 0 3 0 1
Total 78 140 78 140 110 155 110 153
Oil production wells (as of 31 December)2016 2015
Region Gross Net Gross Net
China 49,921 49,921 49,662 49,662Consolidated subsidiaries 49,921 49,921 49,662 49,662Shengli 32,019 32,019 31,547 31,547Others 17,902 17,902 18,115 18,115
Overseas 7,432 3,614 6,913 3,122Consolidated subsidiaries 28 14 28 15Equity accounted entities 7,404 3,600 6,885 3,107
Total 57,353 53,535 56,575 52,784
Natural gas production wells (as of 31 December)2016 2015
Region Gross Net Gross Net
China 4,966 4,932 4,758 4,727Consolidated subsidiaries 4,966 4,932 4,758 4,727Puguang 57 57 55 55Fuling 253 253 175 175Others 4,656 4,622 4,528 4,497
Total 4,966 4,932 4,758 4,727
14 CHINA PETROLEUM & CHEMICAL CORPORATIONAnnual Report 2016
BUSINESS REVIEW AND PROSPECTS (CONTINUED)
Bus
ines
s R
evie
w a
nd P
rosp
ects
Unit: Square kilometers
Area under license (as of 31 December)
2016 2015
Regions with exploration licenses 742,588 857,420China 742,588 857,420
Regions with development licenses 33,305 30,730China 28,436 25,748Overseas 4,869 4,982
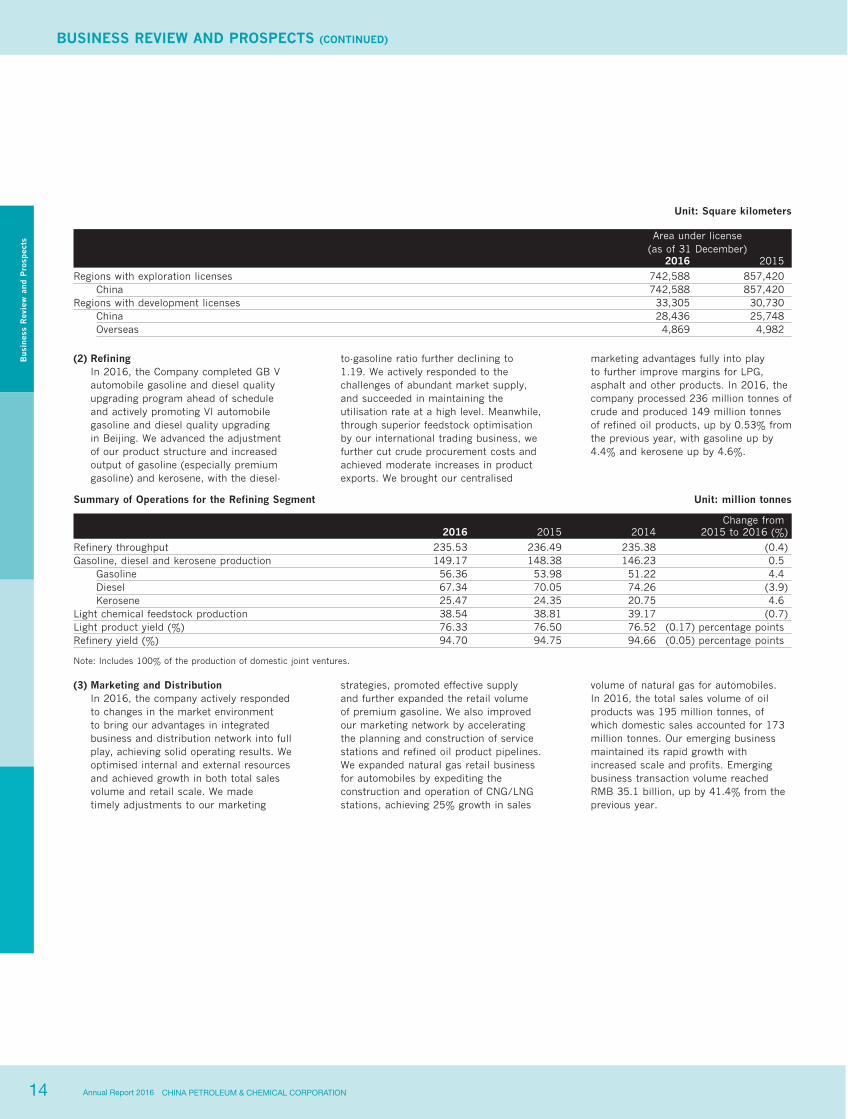
(2) RefiningIn 2016, the Company completed GB V automobile gasoline and diesel quality upgrading program ahead of schedule and actively promoting VI automobile gasoline and diesel quality upgrading in Beijing. We advanced the adjustment of our product structure and increased output of gasoline (especially premium gasoline) and kerosene, with the diesel-
to-gasoline ratio further declining to 1.19. We actively responded to the challenges of abundant market supply, and succeeded in maintaining the utilisation rate at a high level. Meanwhile, through superior feedstock optimisation by our international trading business, we further cut crude procurement costs and achieved moderate increases in product exports. We brought our centralised
marketing advantages fully into play to further improve margins for LPG, asphalt and other products. In 2016, the company processed 236 million tonnes of crude and produced 149 million tonnes of refined oil products, up by 0.53% from the previous year, with gasoline up by 4.4% and kerosene up by 4.6%.
Summary of Operations for the Refining Segment Unit: million tonnes
Change from2016 2015 2014 2015 to 2016 (%)
Refinery throughput 235.53 236.49 235.38 (0.4)Gasoline, diesel and kerosene production 149.17 148.38 146.23 0.5
Gasoline 56.36 53.98 51.22 4.4Diesel 67.34 70.05 74.26 (3.9)Kerosene 25.47 24.35 20.75 4.6
Light chemical feedstock production 38.54 38.81 39.17 (0.7)Light product yield (%) 76.33 76.50 76.52 (0.17) percentage pointsRefinery yield (%) 94.70 94.75 94.66 (0.05) percentage points
Note: Includes 100% of the production of domestic joint ventures.
(3) Marketing and DistributionIn 2016, the company actively responded to changes in the market environment to bring our advantages in integrated business and distribution network into full play, achieving solid operating results. We optimised internal and external resources and achieved growth in both total sales volume and retail scale. We made timely adjustments to our marketing
strategies, promoted effective supply and further expanded the retail volume of premium gasoline. We also improved our marketing network by accelerating the planning and construction of service stations and refined oil product pipelines. We expanded natural gas retail business for automobiles by expediting the construction and operation of CNG/LNG stations, achieving 25% growth in sales
volume of natural gas for automobiles. In 2016, the total sales volume of oil products was 195 million tonnes, of which domestic sales accounted for 173 million tonnes. Our emerging business maintained its rapid growth with increased scale and profits. Emerging business transaction volume reached RMB 35.1 billion, up by 41.4% from the previous year.
15CHINA PETROLEUM & CHEMICAL CORPORATION Annual Report 2016
Bus
ines
s R
evie
w a
nd P
rosp
ects
Summary of Operations for the Marketing and Distribution Segment
Change from2016 2015 2014 2015 to 2016 (%)
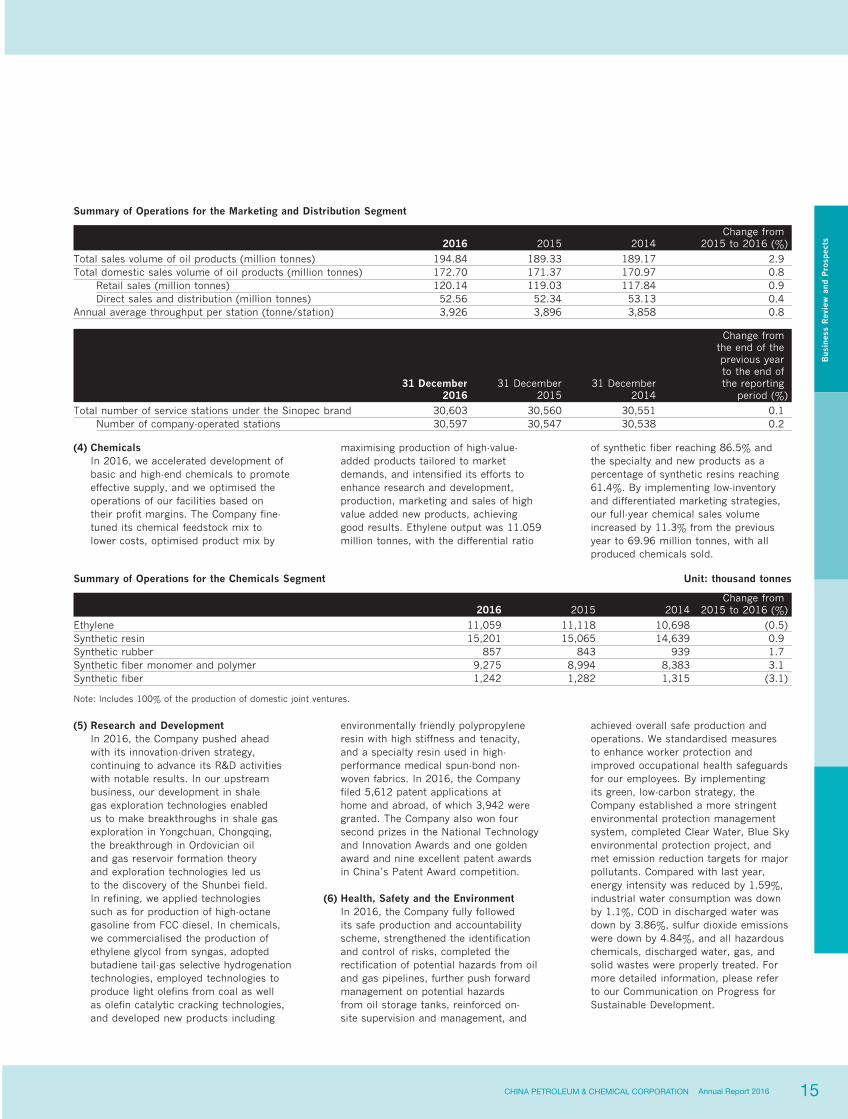
Total sales volume of oil products (million tonnes) 194.84 189.33 189.17 2.9Total domestic sales volume of oil products (million tonnes) 172.70 171.37 170.97 0.8
Retail sales (million tonnes) 120.14 119.03 117.84 0.9Direct sales and distribution (million tonnes) 52.56 52.34 53.13 0.4
Annual average throughput per station (tonne/station) 3,926 3,896 3,858 0.8
Change from
31 December 2016
31 December 2015
31 December 2014
the end of the previous year to the end of the reporting
period (%)
Total number of service stations under the Sinopec brand 30,603 30,560 30,551 0.1Number of company-operated stations 30,597 30,547 30,538 0.2
(4) ChemicalsIn 2016, we accelerated development of basic and high-end chemicals to promote effective supply, and we optimised the operations of our facilities based on their profit margins. The Company fine-tuned its chemical feedstock mix to lower costs, optimised product mix by
maximising production of high-value-added products tailored to market demands, and intensified its efforts to enhance research and development, production, marketing and sales of high value added new products, achieving good results. Ethylene output was 11.059 million tonnes, with the differential ratio
of synthetic fiber reaching 86.5% and the specialty and new products as a percentage of synthetic resins reaching 61.4%. By implementing low-inventory and differentiated marketing strategies, our full-year chemical sales volume increased by 11.3% from the previous year to 69.96 million tonnes, with all produced chemicals sold.
Summary of Operations for the Chemicals Segment Unit: thousand tonnes
Change from2016 2015 2014 2015 to 2016 (%)
Ethylene 11,059 11,118 10,698 (0.5)Synthetic resin 15,201 15,065 14,639 0.9Synthetic rubber 857 843 939 1.7Synthetic fiber monomer and polymer 9,275 8,994 8,383 3.1Synthetic fiber 1,242 1,282 1,315 (3.1)
Note: Includes 100% of the production of domestic joint ventures.
(5) Research and DevelopmentIn 2016, the Company pushed ahead with its innovation-driven strategy, continuing to advance its R&D activities with notable results. In our upstream business, our development in shale gas exploration technologies enabled us to make breakthroughs in shale gas exploration in Yongchuan, Chongqing, the breakthrough in Ordovician oil and gas reservoir formation theory and exploration technologies led us to the discovery of the Shunbei field. In refining, we applied technologies such as for production of high-octane gasoline from FCC diesel. In chemicals, we commercialised the production of ethylene glycol from syngas, adopted butadiene tail-gas selective hydrogenation technologies, employed technologies to produce light olefins from coal as well as olefin catalytic cracking technologies, and developed new products including
environmentally friendly polypropylene resin with high stiffness and tenacity, and a specialty resin used in high-performance medical spun-bond non-woven fabrics. In 2016, the Company filed 5,612 patent applications at home and abroad, of which 3,942 were granted. The Company also won four second prizes in the National Technology and Innovation Awards and one golden award and nine excellent patent awards in China’s Patent Award competition.
(6) Health, Safety and the EnvironmentIn 2016, the Company fully followed its safe production and accountability scheme, strengthened the identification and control of risks, completed the rectification of potential hazards from oil and gas pipelines, further push forward management on potential hazards from oil storage tanks, reinforced on-site supervision and management, and
achieved overall safe production and operations. We standardised measures to enhance worker protection and improved occupational health safeguards for our employees. By implementing its green, low-carbon strategy, the Company established a more stringent environmental protection management system, completed Clear Water, Blue Sky environmental protection project, and met emission reduction targets for major pollutants. Compared with last year, energy intensity was reduced by 1.59%, industrial water consumption was down by 1.1%, COD in discharged water was down by 3.86%, sulfur dioxide emissions were down by 4.84%, and all hazardous chemicals, discharged water, gas, and solid wastes were properly treated. For more detailed information, please refer to our Communication on Progress for Sustainable Development.
16 CHINA PETROLEUM & CHEMICAL CORPORATIONAnnual Report 2016
BUSINESS REVIEW AND PROSPECTS (CONTINUED)
Bus
ines
s R
evie
w a
nd P
rosp
ects
(7) Capital ExpendituresIn 2016, focusing on quality and profitability of investment, the Company continuously optimised its investment projects. Total capital expenditures were RMB 76.456 billion. Capital expenditures for the exploration and production segment were RMB 32.187 billion, mainly for Fuling shale gas and Yuanba gas field development projects and LNG terminal projects in Guangxi and Tianjin, as well as overseas projects. Capital expenditures for the refining segment were RMB 14.347 billion, mainly for gasoline and diesel quality upgrading projects, adjustments in the product mix and refinery revamping projects. Capital expenditures for the marketing and distribution segment were RMB 18.493 billion, mainly for constructing and renovating service stations and building refined oil product pipelines, depots and storage facilities, as well as for rectification of safety hazards. Capital expenditures for the chemicals segment were RMB 8.849 billion, mainly for adjustment of the feedstock and product structure, the Ningdong coal chemical project and the Zhongtianhechuang coal to chemical project. Capital expenditures for the corporate and others segment were RMB 2.58 billion, mainly for R&D facilities and information technology application projects.
BUSINESS PROSPECTS
(1) Market OutlookLooking ahead to 2017, we expect even more uncertainty in the global economy while China’s economy maintains its steady growth. International oil prices are expected to fluctuate at a low level, with domestic demand for refined oil products continuing to grow as the consumption structure undergoes further adjustments. Domestic demand for petrochemical products will increase steadily as the consumption structure gradually shifts towards the high end.
(2) OperationsIn 2017, bearing in mind structural reforms on the supply side, the Company will focus on enhancing quality and profitability of our assets, cost reduction, market expansion, structural adjustments, reforms, and consolidating the basis for further growth. We will undertake the following work during the year:
Exploration and Production: We will maintain exploration activities, optimising our plans to achieve high-efficiency exploration. Our goal will be discovery of low-cost, large-scale reserves to expand our resources. In oil development, we will fine-tune development plans based on oil price trends and promote oilfield development by increasing the volume
and profitability of both incremental and existing reserves. In gas development, we will advance key projects for capacity construction, refine the management of developed gas fields and optimise gas production and marketing plans. In 2017, we plan to produce 294 million barrels of crude oil, of which overseas production will account for 46 million barrels. We plan to produce 879.9 billion cubic feet of natural gas.
Refining: We will continue with our market-oriented, profitability-driven strategy to optimise crude oil procurement and resource allocation and to lower our purchasing costs. We will comprehensively adjust our production plans to ensure safe and reliable operations. We will enhance our product structure by increasing the production of jet fuel and gasoline (especially premium gasoline) and further lowering the diesel-to-gasoline ratio. We will accelerate the quality and supply of GB VI gasoline and diesel in Beijing and GB V regular diesel in other area. In 2017, we plan to process 240 million tonnes of crude and produce 150 million tonnes of oil products.
17CHINA PETROLEUM & CHEMICAL CORPORATION Annual Report 2016
Bus
ines
s R
evie
w a
nd P
rosp
ects
Marketing and Distribution: We will intensify our marketing strategy of balancing profits and volume, with the priority on profits. We will undertake measures to fully explore markets, expand our retail volume and increase our market share. We will further improve our marketing network to reinforce our advantages. We will accelerate construction of gas stations to strengthen our presence in the CNG/LNG market. We will step up the promotion of key merchandise and self-branding and boost the growth of our emerging business. We will explore building a new type of customer service center, employ techniques of Big Data analysis to conduct precision marketing and further our transformation into a modern comprehensive services provider. In 2017, we plan to sell 175 million tonnes of oil products in the domestic market.
Chemicals: We will continue to adjust our feedstock mix to lower costs, fine-tune our product slate to deliver more popular, profitable and high-value-added products, optimise our facility utilisation rate, shut down facilities which have no marginal contributions. We will deepen the adjustment on sector structure, through advancing the development of fine chemicals and biochemicals, and improving operations of our coal-chemical projects. Meanwhile, we will enhance our strategies of product differentiation and precision marketing, and provide our customers with full process solutions and value-added services. In 2017, we plan to produce 11.66 million tonnes of ethylene.
Research and Development: We will continue to implement our strategy of development driven by innovation, improving mechanisms for technological innovation and fast-tracking key technical breakthroughs. In exploration and production, we will focus on increasing reserves and production and pushing ahead with breakthroughs in enhanced oil recovery technologies and development of difficult-to-tap reserves. In refining, R&D initiatives will address processing of heavy crude oil, quality upgrading of oil products and optimisation of product slate. In chemicals we will focus on adjustments in our product mix along with further progress in R&D for basic chemicals, synthetic materials, coal-chemicals, fine chemicals and bio-chemicals. We also expect to make progress in safety, environmental and energy-conserving technologies as well as prospective and basic research to enhance our capabilities for innovation and to achieve new R&D breakthroughs.
Capital Expenditures: In 2017, we will devote attention to the quality and profitability of investments, and optimise our investment projects. Capital expenditures for the year are budgeted at RMB 110.2 billion. The exploration and production segment will account for expenditures of RMB 50.5 billion, mainly for Phase II of Fuling shale gas development, Tianjin LNG project, and gas storage project, and overseas oil and gas project development. The refining segment will account for RMB 22.8 billion, mainly for building of refining bases, structural adjustments
in the refining business, and revamping of refineries as well as GB VI quality upgrading of oil products. The marketing and distribution segment will account for RMB 18 billion, mainly for revamping service stations, improving pipeline network, building oil tank farms and removing safety hazards. The chemicals segment will account for RMB 15.1 billion, mainly for the integrated refining and chemical project in Zhanjiang of Guangdong Province, the integrated refining and chemical project in Gulei of Fujian Province and the high-efficiency and environmentally friendly aromatics project in Hainan refinery. The corporate and others segment will account for RMB 3.8 billion, mainly for R&D and Information technology projects.
18 CHINA PETROLEUM & CHEMICAL CORPORATIONAnnual Report 2016
MANAGEMENT’S DISCUSSION AND ANALYSIS
Man
agem
ent’
s D
iscu
ssio
nan
d A
naly
sis
19CHINA PETROLEUM & CHEMICAL CORPORATION Annual Report 2016
MANAGEMENT’S DISCUSSION AND ANALYSIS
Man
agem
ent’
s D
iscu
ssio
nan
d A
naly
sis
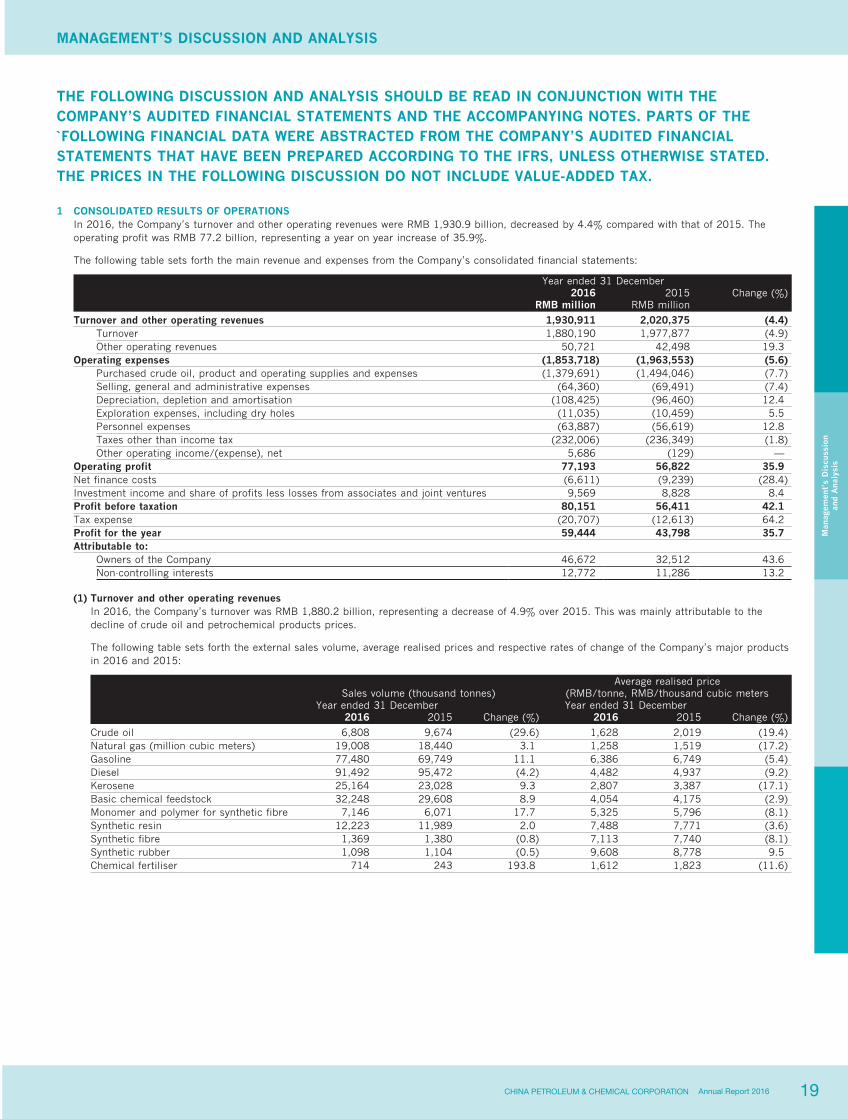
1 CONSOLIDATED RESULTS OF OPERATIONSIn 2016, the Company’s turnover and other operating revenues were RMB 1,930.9 billion, decreased by 4.4% compared with that of 2015. The operating profit was RMB 77.2 billion, representing a year on year increase of 35.9%.
The following table sets forth the main revenue and expenses from the Company’s consolidated financial statements:
Year ended 31 December2016 2015 Change (%)
RMB million RMB million
Turnover and other operating revenues 1,930,911 2,020,375 (4.4)Turnover 1,880,190 1,977,877 (4.9)Other operating revenues 50,721 42,498 19.3
Operating expenses (1,853,718) (1,963,553) (5.6)Purchased crude oil, product and operating supplies and expenses (1,379,691) (1,494,046) (7.7)Selling, general and administrative expenses (64,360) (69,491) (7.4)Depreciation, depletion and amortisation (108,425) (96,460) 12.4Exploration expenses, including dry holes (11,035) (10,459) 5.5Personnel expenses (63,887) (56,619) 12.8Taxes other than income tax (232,006) (236,349) (1.8)Other operating income/(expense), net 5,686 (129) —
Operating profit 77,193 56,822 35.9Net finance costs (6,611) (9,239) (28.4)Investment income and share of profits less losses from associates and joint ventures 9,569 8,828 8.4Profit before taxation 80,151 56,411 42.1Tax expense (20,707) (12,613) 64.2Profit for the year 59,444 43,798 35.7Attributable to:
Owners of the Company 46,672 32,512 43.6Non-controlling interests 12,772 11,286 13.2
(1) Turnover and other operating revenuesIn 2016, the Company’s turnover was RMB 1,880.2 billion, representing a decrease of 4.9% over 2015. This was mainly attributable to the decline of crude oil and petrochemical products prices.
The following table sets forth the external sales volume, average realised prices and respective rates of change of the Company’s major products in 2016 and 2015:
Sales volume (thousand tonnes)Average realised price
(RMB/tonne, RMB/thousand cubic metersYear ended 31 December Year ended 31 December
2016 2015 Change (%) 2016 2015 Change (%)
Crude oil 6,808 9,674 (29.6) 1,628 2,019 (19.4)Natural gas (million cubic meters) 19,008 18,440 3.1 1,258 1,519 (17.2)Gasoline 77,480 69,749 11.1 6,386 6,749 (5.4)Diesel 91,492 95,472 (4.2) 4,482 4,937 (9.2)Kerosene 25,164 23,028 9.3 2,807 3,387 (17.1)Basic chemical feedstock 32,248 29,608 8.9 4,054 4,175 (2.9)Monomer and polymer for synthetic fibre 7,146 6,071 17.7 5,325 5,796 (8.1)Synthetic resin 12,223 11,989 2.0 7,488 7,771 (3.6)Synthetic fibre 1,369 1,380 (0.8) 7,113 7,740 (8.1)Synthetic rubber 1,098 1,104 (0.5) 9,608 8,778 9.5Chemical fertiliser 714 243 193.8 1,612 1,823 (11.6)
THE FOLLOWING DISCUSSION AND ANALYSIS SHOULD BE READ IN CONJUNCTION WITH THE COMPANY’S AUDITED FINANCIAL STATEMENTS AND THE ACCOMPANYING NOTES. PARTS OF THE `FOLLOWING FINANCIAL DATA WERE ABSTRACTED FROM THE COMPANY’S AUDITED FINANCIAL STATEMENTS THAT HAVE BEEN PREPARED ACCORDING TO THE IFRS, UNLESS OTHERWISE STATED. THE PRICES IN THE FOLLOWING DISCUSSION DO NOT INCLUDE VALUE-ADDED TAX.

20 CHINA PETROLEUM & CHEMICAL CORPORATIONAnnual Report 2016
MANAGEMENT’S DISCUSSION AND ANALYSIS (CONTINUED)
Man
agem
ent’
s D
iscu
ssio
nan
d A
naly
sis
Most crude oil and a small portion of natural gas produced by the Company were internally used for refining and chemical production, with the remaining sold to external customers. In 2016, the turnover from crude oil, natural gas and other upstream products sold externally amounted to RMB 47.4 billion, a decrease of 17.8% over 2015. The change was mainly due to the decrease of crude oil prices and sales volume in 2016.
In 2016, petroleum products (mainly consisting of oil products and other refined petroleum products) sold by Refining Segment and Marketing and Distribution Segment achieved external sales revenues of RMB 1,130.4 billion, accounting for 58.5% of the Company’s turnover and other operating revenues, representing a decrease of 6.3% over 2015 mainly due to the decline of various refined oil products prices. The sales revenue of gasoline, diesel and kerosene was RMB 975.6 billion, representing a decrease of 4.4% over 2015, and accounting for 86.3% of the total sales revenue of petroleum products. Turnover of other refined petroleum products was RMB 154.8 billion, representing a decrease of 17.0% compared with 2015, accounting for 13.7% of the total sales revenue of petroleum products.
The Company’s external sales revenue of chemical products was RMB 284.3 billion, representing an increase of 2.8% over 2015, accounting for 14.7% of the Company’s total turnover and other operating revenues. This was mainly due to the increase of chemical products sales volume.
(2) Operating expensesIn 2016, the Company’s operating expenses were RMB 1,853.7 billion, decreased by 5.6% compared with 2015. The operating expenses mainly consisted of the following:
Purchased crude oil, products and operating supplies and expenses were RMB 1,379.7 billion, representing a decrease of 7.7% over the same period of 2015, accounting for 74.4% of the total operating expenses, of which:
Crude oil purchasing expenses were RMB 373.7 billion, representing a decrease of 20.4% over the same period of 2015.
Throughput of crude oil purchased externally in 2016 was 202.40 million tonnes (excluding the volume processed for third parties), representing a decrease of 1.9% over the same period of 2015. The average cost of crude oil purchased externally was RMB 2,084 per tonne, representing a drop of 19.6% over 2015.
The Company’s other purchasing expenses were RMB 1,006.0 billion, representing a decrease of 1.8% over the same period of 2015. This was mainly due to the decline in prices of externally purchased raw materials.
Selling, general and administrative expenses were RMB 64.4 billion, representing an decrease of 7.4% over 2015. That was mainly due to that the Company promoted the reform of employment system, adjusted the cost and tax accounting, and continuously enhanced cost control.
Depreciation, depletion and amortisation were RMB 108.4 billion, representing an increase of 12.4% as compared with 2015. That was mainly due to the significant increase in depreciation and depletion rate as a result of oil and gas reserve revision in the exploration and production segment corresponding to decreased oil price.
Exploration expenses were RMB 11.0 billion, representing an increase of 5.5% year on year. That was mainly due to that the Company maintained its exploration intensity in low oil price environment.
Personnel expenses were RMB 63.9 billion, representing an increase of 12.8% over 2015. That was mainly due to that that the Company promoted the reform of employment system since 2016.
Taxes other than income tax were RMB 232.0 billion, representing a decrease of 1.8% compared with 2015. Mainly due to the decrease in consumption tax by RMB 4.9 billion as a result of decreased production of diesel, and decrease in resource tax by RMB 1.0 billion as a result of drop in crude prices over the same period of 2015.
Other operating income/(expense), net were RMB 5.7 billion, decreasing 5.8 billion over the same period of 2015. That was mainly due to the non-operating income from reorganisation
and capital injection of Sichuan-to-East China Pipeline Co., and the increase of impairment of assets.
(3) Operating profit was RMB 77.2 billion, representing an increase of 35.9% compared with 2015. This is mainly due to outstanding performance of the Company’s downstream business as we fully tapped potential from our integrated business. It effectively offset the negative impact of low oil prices.
(4) Net finance costs were RMB 6.6 billion, representing a decrease of 28.4% over 2015, of which: interest expense increased by RMB 1.1 billion over 2015 as a result of the replacement of debt denominated in US dollars by debt denominated in RMB (inclusive of replacing borrowings in US dollars and decrease exposure to US dollars); net losses from foreign exchange was RMB 600 million, decreased by RMB 3.2 billion as compared with 2015; interest income increased by RMB 200 million as a result of increased interest income compared with the same period of 2015.
(5) Profit before taxation was RMB 80.2 billion, representing an increase of 42.1% year on year.
(6) Tax expense was RMB 20.7 billion, representing an increase of 64.2% year on year. That was mainly due to a substantial increase in profit over the same period of 2015.
(7) Profit attributable to non-controlling interests was RMB 12.8 billion, representing an increase of RMB 1.5 billion comparing with 2015.
(8) Profit attributable to owners of the Company was RMB 46.7 billion, representing an increase of 43.6% year on year.
2 RESULTS OF SEGMENT OPERATIONSThe Company manages its operations through four business segments, namely exploration and production segment, refining segment, marketing and distribution segment and chemicals segment, and corporate and others. Unless otherwise specified, the inter-segment transactions have not been eliminated from financial data discussed in this section. In addition, the operating revenue data of each segment include other operating revenues.

21CHINA PETROLEUM & CHEMICAL CORPORATION Annual Report 2016
Man
agem
ent’
s D
iscu
ssio
nan
d A
naly
sis
The following table shows the operating revenues by each segment, the contribution of external sales and inter-segment sales as a percentage of operating revenues before elimination of inter-segment sales, and the contribution of external sales as a percentage of consolidated operating revenues (i.e. after elimination of inter-segment sales) for the periods indicated.
As a percentage of As a percentage ofconsolidated operating consolidated operating
revenue before elimination revenue after eliminationOperating revenues of inter-segment sales of inter-segment sales
Year ended 31 December Year ended 31 December Year ended 31 December2016 2015 2016 2015 2016 2015
RMB million RMB million (%) (%) (%) (%)
Exploration and Production Segment External sales* 56,985 67,634 1.8 2.1 3.0 3.3Inter-segment sales 58,954 71,019 1.9 2.2 Operating revenues 115,939 138,653 3.7 4.3
Refining Segment External sales* 108,469 125,654 3.5 3.8 5.6 6.2Inter-segment sales 747,317 800,962 24.2 24.4 Operating revenues 855,786 926,616 27.7 28.2
Marketing and Distribution Segment External sales* 1,049,377 1,103,610 33.9 33.6 54.3 54.6Inter-segment sales 3,480 3,056 0.1 0.1 Operating revenues 1,052,857 1,106,666 34.0 33.7
Chemicals Segment External sales* 296,500 285,057 9.6 8.7 15.4 14.2Inter-segment sales 38,614 43,814 1.2 1.3 Operating revenues 335,114 328,871 10.8 10.0
Corporate and Others External sales* 419,580 438,420 13.5 13.3 21.7 21.7Inter-segment sales 320,367 345,454 10.3 10.5 Operating revenues 739,947 783,874 23.8 23.8
Operating revenue before elimination of inter-segment sales 3,099,643 3,284,680 100.0 100.0 Elimination of inter-segment sales (1,168,732) (1,264,305) Consolidated operating revenue 1,930,911 2,020,375 100.0 100.0
*: Other operating revenues are included.
The following table sets forth the operating revenues, operating expenses and operating profit by each segment before elimination of the inter-segment transactions for the periods indicated, and the percentage change of 2016 compared to 2015.
Year ended 31 December2016 2015 Change
RMB million RMB million (%)
Exploration and Production Segment Operating revenues 115,939 138,653 (16.4)Operating expenses 152,580 156,071 (2.2)Operating (loss)/profit (36,641) (17,418) —
Refining Segment Operating revenues 855,786 926,616 (7.6)Operating expenses 799,521 905,657 (11.7)Operating profit/(loss) 56,265 20,959 168.5
Marketing and Distribution Segment Operating revenues 1,052,857 1,106,666 (4.9)Operating expenses 1,020,704 1,077,811 (5.3)Operating profit 32,153 28,855 11.4
Chemicals Segment Operating revenues 335,114 328,871 1.9Operating expenses 314,491 309,395 1.6Operating profit/(loss) 20,623 19,476 5.9
Corporate and Others Operating revenues 739,947 783,874 (5.6)Operating expenses 736,735 783,490 (6.0)Operating profit/(loss) 3,212 384 736.5
Elimination of inter-segment profit 1,581 4,566 —
22 CHINA PETROLEUM & CHEMICAL CORPORATIONAnnual Report 2016
MANAGEMENT’S DISCUSSION AND ANALYSIS (CONTINUED)
Man
agem
ent’
s D
iscu
ssio
nan
d A
naly
sis
(1) Exploration and Production SegmentMost crude oil and a small portion of the natural gas produced by the exploration and production segment were used for the Company’s refining and chemical operations. Most of the natural gas and a small portion of crude oil were sold externally to other customers.
In 2016, the operating revenues of this segment were RMB 115.9 billion, representing a decrease of 16.4% over 2015. This was mainly attributable to the decline of realised price of crude oil and natural gas as well as decrease in sales volume of crude oil.
In 2016, the segment sold 36.38 million tonnes of crude oil, representing a decrease of 13.8% over 2015. Natural gas sales volume was 20.56 billion cubic meters, representing an increase of 3.7% over 2015. Average realised prices of crude oil and natural gas were RMB 1,734 per tonne and RMB 1,267 per thousand cubic meters, representing decreases of 13.9% and 17.5% respectively over 2015.
In 2016, the operating expenses of this segment were RMB 152.6 billion, representing a decrease of 2.2% over 2015. That was mainly due to the following:
‧ Depreciation, depletion and amortisation increased by RMB 9.8 billion year on year.
‧ Impairment loss on oil and gas related assets increased by RMB 6.7 billion year on year;
‧ The Company with the restructuring of Sichuan-to-East China Pipeline Co., other expenses (net) decreased by RMB 20.6 billion.
In 2016, the oil and gas lifting cost was RMB 786 per tonne, representing a moderate year-on-year increase of 0.8%, under the backdrop of a 13.2% decrease in crude oil production.
In 2016, the segment made every effort to optimise resource mix, attached great emphasis on cash flow contributions, and proactively controlled costs. Due to the
drop in crude oil and natural gas prices, the operating loss of the exploration and production segment were RMB 36.6 billion, representing an expanded losses as compared with 2015.
(2) Refining SegmentBusiness activities of the refining segment include purchasing crude oil from third parties and the exploration and production segment of the Company, as well as processing crude oil into refined petroleum products. Gasoline, diesel and kerosene are sold internally to the marketing and distribution segment of the Company; part of the chemical feedstock is sold to the chemicals segment of the Company; and other refined petroleum products are sold externally to both domestic and overseas customers.
In 2016, the operating revenues of this segment were RMB 855.8 billion, representing a decrease of 7.6% over 2015. This was mainly attributable to the decreased in refined oil products prices.
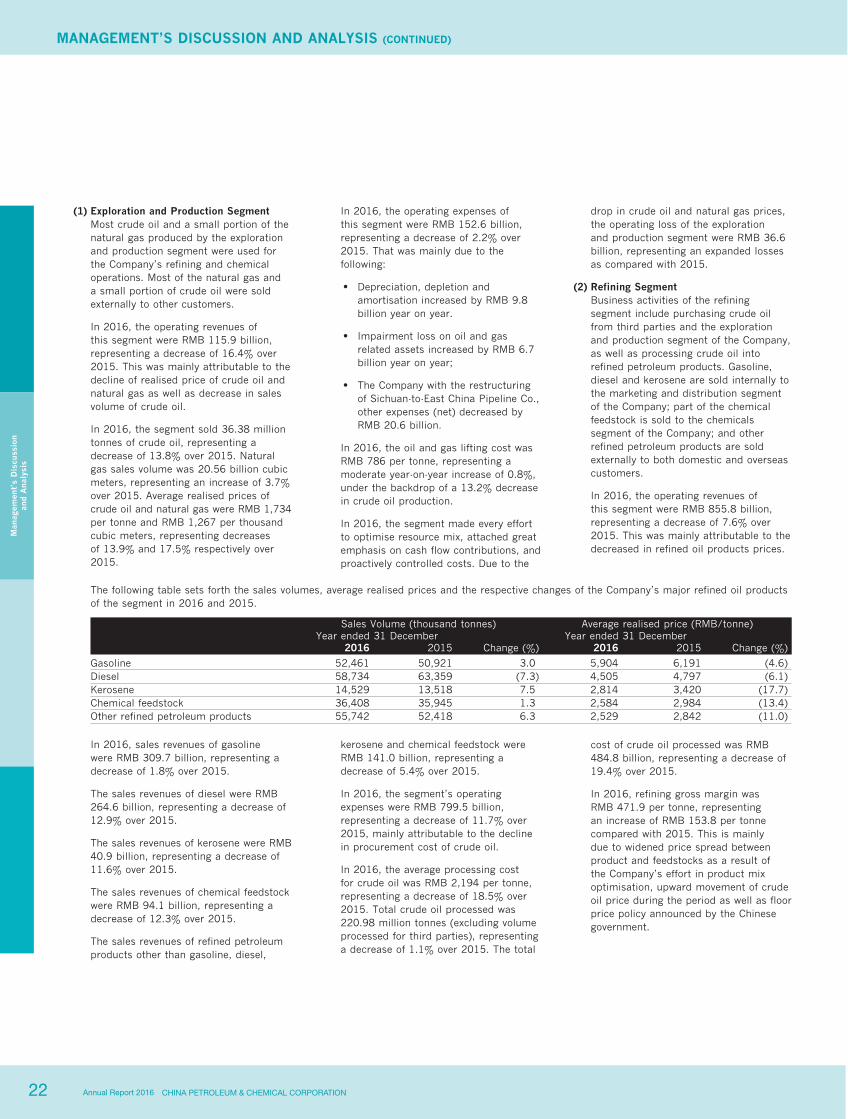
The following table sets forth the sales volumes, average realised prices and the respective changes of the Company’s major refined oil products of the segment in 2016 and 2015.
Sales Volume (thousand tonnes) Average realised price (RMB/tonne)Year ended 31 December Year ended 31 December
2016 2015 Change (%) 2016 2015 Change (%)
Gasoline 52,461 50,921 3.0 5,904 6,191 (4.6)Diesel 58,734 63,359 (7.3) 4,505 4,797 (6.1)Kerosene 14,529 13,518 7.5 2,814 3,420 (17.7)Chemical feedstock 36,408 35,945 1.3 2,584 2,984 (13.4)Other refined petroleum products 55,742 52,418 6.3 2,529 2,842 (11.0)
In 2016, sales revenues of gasoline were RMB 309.7 billion, representing a decrease of 1.8% over 2015.
The sales revenues of diesel were RMB 264.6 billion, representing a decrease of 12.9% over 2015.
The sales revenues of kerosene were RMB 40.9 billion, representing a decrease of 11.6% over 2015.
The sales revenues of chemical feedstock were RMB 94.1 billion, representing a decrease of 12.3% over 2015.
The sales revenues of refined petroleum products other than gasoline, diesel,
kerosene and chemical feedstock were RMB 141.0 billion, representing a decrease of 5.4% over 2015.
In 2016, the segment’s operating expenses were RMB 799.5 billion, representing a decrease of 11.7% over 2015, mainly attributable to the decline in procurement cost of crude oil.
In 2016, the average processing cost for crude oil was RMB 2,194 per tonne, representing a decrease of 18.5% over 2015. Total crude oil processed was 220.98 million tonnes (excluding volume processed for third parties), representing a decrease of 1.1% over 2015. The total
cost of crude oil processed was RMB 484.8 billion, representing a decrease of 19.4% over 2015.
In 2016, refining gross margin was RMB 471.9 per tonne, representing an increase of RMB 153.8 per tonne compared with 2015. This is mainly due to widened price spread between product and feedstocks as a result of the Company’s effort in product mix optimisation, upward movement of crude oil price during the period as well as floor price policy announced by the Chinese government.

23CHINA PETROLEUM & CHEMICAL CORPORATION Annual Report 2016
Man
agem
ent’
s D
iscu
ssio
nan
d A
naly
sis
The following table sets forth the sales volumes, average realised prices, and the respective percentage changes of the segment’s four major refined oil products in 2016 and 2015, including breakdown in retail, direct sales and wholesale of gasoline and diesel:
Sales Volume (Thousand tonnes) Average realised price (RMB/tonne)Year ended 31 December Year ended 31 December
2016 2015 Change (%) 2016 2015 Change (%)
Gasoline 77,613 69,842 11.1 6,380 6,747 (5.4)Retail 63,718 58,211 9.5 6,722 6,996 (3.9)Direct sales and wholesale 13,895 11,630 19.5 4,812 5,498 (12.5)
Diesel 91,998 95,907 (4.1) 4,478 4,936 (9.3)Retail 46,656 50,756 (8.1) 5,088 5,490 (7.3)Direct sales and wholesale 45,342 45,150 0.4 3,851 4,314 (10.7)
Kerosene 25,164 23,028 9.3 2,807 3,387 (17.1)Fuel 22,034 24,980 (11.8) 1,703 2,215 (23.1)
In 2016, the operating expenses of the segment were RMB 1,020.7 billion, representing a decrease of RMB 57.1 billion or 5.3% as compared with that of 2015. This was mainly due to decreased procurement volume and prices of diesel and fuel oil.
In 2016, the segment’s marketing cash operating cost (defined as the operating expenses less purchase costs, taxes other than income tax, depreciation and amortisation, and then divided by the sales volume) was RMB 197.3 per tonne, representing an increase of 4.3% compared with that of 2015.
In 2016, facing abundant domestic supply of refined oil products and strong market competition, the segment made full use of the advantages of end user marketing network, actively expanded
the gasoline market, increased the sales volume of high octane number gasoline, made efforts to improve total sales volume, coordinate internal and external resources, increased the spread between sales and procurement prices as compared with 2015, and achieved better performance.
In 2016, the operating profit of this segment was RMB 32.2 billion, representing an increase of 11.4% compared with 2015.
(4) Chemicals SegmentThe business activities of the chemicals segment include purchasing chemical feedstock from the refining segment and third parties, producing, marketing and distributing petrochemical and inorganic chemical products.
In 2016, the operating revenues of the chemicals segment were RMB 335.1 billion, representing an increase of 1.9% as compared with that of 2015, This was mainly due to increase in sales volume of chemical products as compared with 2015.
The sales revenues generated by the segment’s six major categories of chemical products (namely basic organic chemicals, synthetic resin, synthetic fibre monomer and polymer, synthetic fibre, synthetic rubber, and chemical fertiliser) totaled RMB 316.2 billion, representing an increase of 2.1% as compared with 2015, and accounting for 94.3% of the operating revenues of the segment.
In 2016, the unit refining cash operating cost (defined as operating expenses less the processing cost of crude oil and refining feedstock, depreciation and amortisation, taxes other than income tax and other operating expenses, then divided by the throughput of crude oil and refining feedstock) was RMB 165.7 per tonne, a decrease of RMB 1.9 per tonne against 2015, mainly because the segment enforced control over costs, improved efficiency of operations, and decreased operational costs in fuel, power, and other auxiliaries facilities.
In 2016, the segment seized the favorable opportunities of the bottoming out of crude oil prices, enforced
management in crude oil procurement, adjusted product mix based on market needs, increased export volume, made great efforts to improve the profitability of by-products, and as a result, realised significant increase in operating profit.
In 2016, the operating profit of the segment totaled RMB 56.3 billion, representing an increase of RMB 35.3 billion as compared with 2015.
(3) Marketing and Distribution SegmentThe business activities of the marketing and distribution segment include purchasing refined oil products from the refining segment and third parties, conducting wholesale and direct sales to
domestic customers and distributing oil products through the segment’s retail and distribution network, as well as providing related services.
In 2016, the operating revenues of this segment were RMB 1,052.9 billion, a decrease of 4.9% over 2015, of which: the sales revenues of gasoline totaled RMB 495.2 billion, a increase of 5.1% compared with 2015; the sales revenues of diesel were RMB 412.0 billion, a decrease of 13.0% over 2015, and the sales revenues of kerosene were RMB 70.6 billion, a decrease of 9.5% over 2015.
24 CHINA PETROLEUM & CHEMICAL CORPORATIONAnnual Report 2016
MANAGEMENT’S DISCUSSION AND ANALYSIS (CONTINUED)
Man
agem
ent’
s D
iscu
ssio
nan
d A
naly
sis
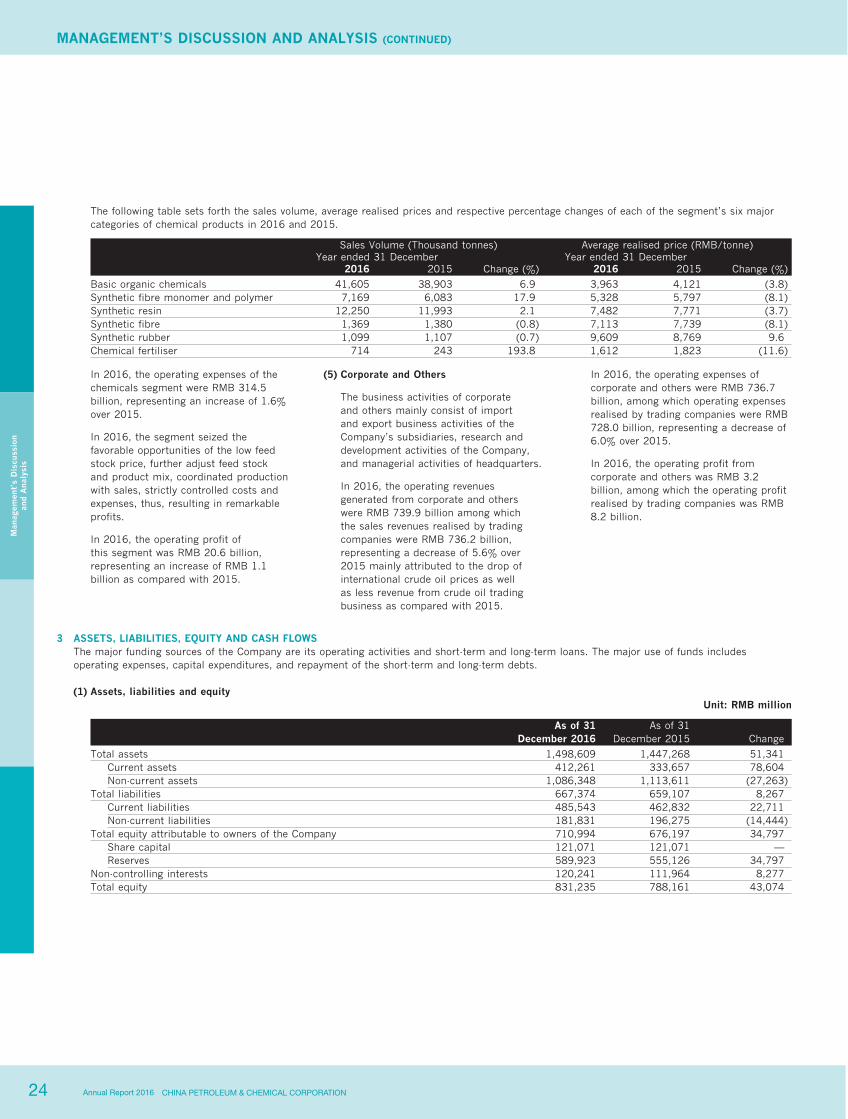
The following table sets forth the sales volume, average realised prices and respective percentage changes of each of the segment’s six major categories of chemical products in 2016 and 2015.
Sales Volume (Thousand tonnes) Average realised price (RMB/tonne)Year ended 31 December Year ended 31 December
2016 2015 Change (%) 2016 2015 Change (%)
Basic organic chemicals 41,605 38,903 6.9 3,963 4,121 (3.8)Synthetic fibre monomer and polymer 7,169 6,083 17.9 5,328 5,797 (8.1)Synthetic resin 12,250 11,993 2.1 7,482 7,771 (3.7)Synthetic fibre 1,369 1,380 (0.8) 7,113 7,739 (8.1)Synthetic rubber 1,099 1,107 (0.7) 9,609 8,769 9.6Chemical fertiliser 714 243 193.8 1,612 1,823 (11.6)
In 2016, the operating expenses of the chemicals segment were RMB 314.5 billion, representing an increase of 1.6% over 2015.
In 2016, the segment seized the favorable opportunities of the low feed stock price, further adjust feed stock and product mix, coordinated production with sales, strictly controlled costs and expenses, thus, resulting in remarkable profits.
In 2016, the operating profit of this segment was RMB 20.6 billion, representing an increase of RMB 1.1 billion as compared with 2015.
(5) Corporate and Others
The business activities of corporate and others mainly consist of import and export business activities of the Company’s subsidiaries, research and development activities of the Company, and managerial activities of headquarters.
In 2016, the operating revenues generated from corporate and others were RMB 739.9 billion among which the sales revenues realised by trading companies were RMB 736.2 billion, representing a decrease of 5.6% over 2015 mainly attributed to the drop of international crude oil prices as well as less revenue from crude oil trading business as compared with 2015.
In 2016, the operating expenses of corporate and others were RMB 736.7 billion, among which operating expenses realised by trading companies were RMB 728.0 billion, representing a decrease of 6.0% over 2015.
In 2016, the operating profit from corporate and others was RMB 3.2 billion, among which the operating profit realised by trading companies was RMB 8.2 billion.
3 ASSETS, LIABILITIES, EQUITY AND CASH FLOWSThe major funding sources of the Company are its operating activities and short-term and long-term loans. The major use of funds includes operating expenses, capital expenditures, and repayment of the short-term and long-term debts.
(1) Assets, liabilities and equity Unit: RMB million
As of 31December 2016
As of 31December 2015 Change
Total assets 1,498,609 1,447,268 51,341Current assets 412,261 333,657 78,604Non-current assets 1,086,348 1,113,611 (27,263)
Total liabilities 667,374 659,107 8,267Current liabilities 485,543 462,832 22,711Non-current liabilities 181,831 196,275 (14,444)
Total equity attributable to owners of the Company 710,994 676,197 34,797Share capital 121,071 121,071 —Reserves 589,923 555,126 34,797
Non-controlling interests 120,241 111,964 8,277Total equity 831,235 788,161 43,074
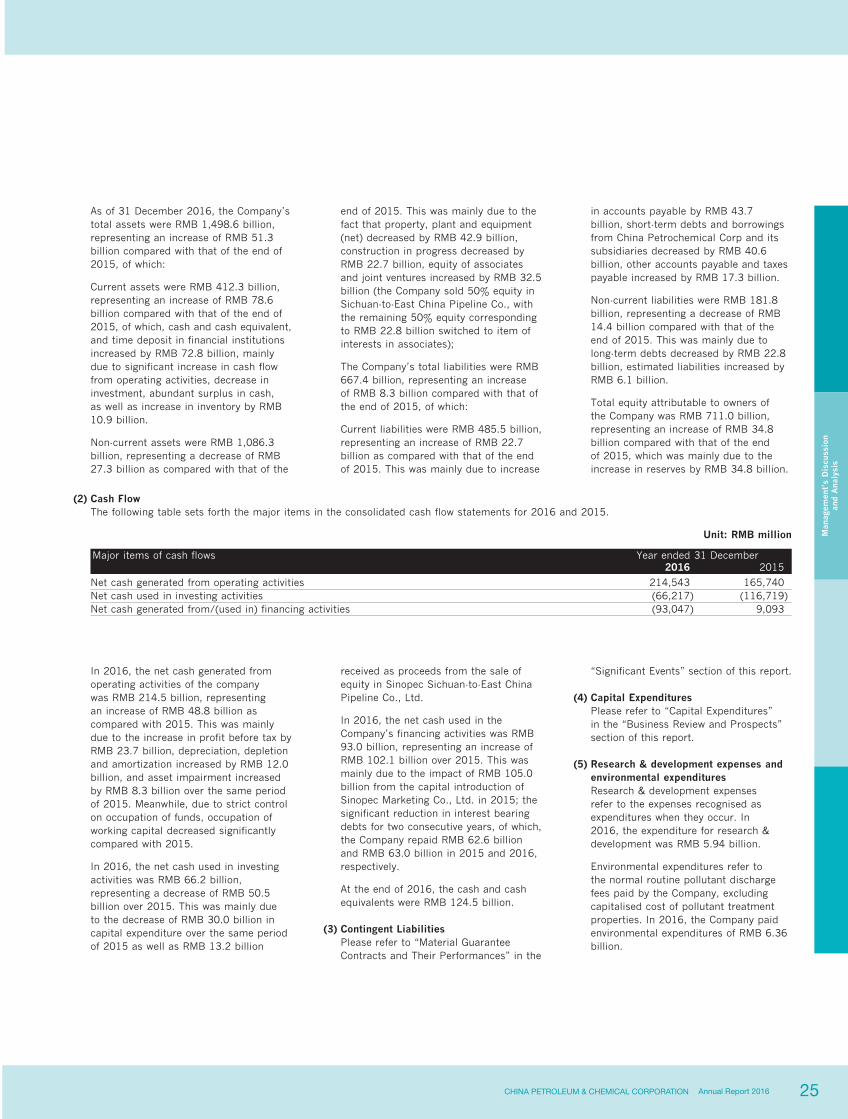
25CHINA PETROLEUM & CHEMICAL CORPORATION Annual Report 2016
Man
agem
ent’
s D
iscu
ssio
nan
d A
naly
sis
As of 31 December 2016, the Company’s total assets were RMB 1,498.6 billion, representing an increase of RMB 51.3 billion compared with that of the end of 2015, of which:
Current assets were RMB 412.3 billion, representing an increase of RMB 78.6 billion compared with that of the end of 2015, of which, cash and cash equivalent, and time deposit in financial institutions increased by RMB 72.8 billion, mainly due to significant increase in cash flow from operating activities, decrease in investment, abundant surplus in cash, as well as increase in inventory by RMB 10.9 billion.
Non-current assets were RMB 1,086.3 billion, representing a decrease of RMB 27.3 billion as compared with that of the
end of 2015. This was mainly due to the fact that property, plant and equipment (net) decreased by RMB 42.9 billion, construction in progress decreased by RMB 22.7 billion, equity of associates and joint ventures increased by RMB 32.5 billion (the Company sold 50% equity in Sichuan-to-East China Pipeline Co., with the remaining 50% equity corresponding to RMB 22.8 billion switched to item of interests in associates);
The Company’s total liabilities were RMB 667.4 billion, representing an increase of RMB 8.3 billion compared with that of the end of 2015, of which:
Current liabilities were RMB 485.5 billion, representing an increase of RMB 22.7 billion as compared with that of the end of 2015. This was mainly due to increase
in accounts payable by RMB 43.7 billion, short-term debts and borrowings from China Petrochemical Corp and its subsidiaries decreased by RMB 40.6 billion, other accounts payable and taxes payable increased by RMB 17.3 billion.
Non-current liabilities were RMB 181.8 billion, representing a decrease of RMB 14.4 billion compared with that of the end of 2015. This was mainly due to long-term debts decreased by RMB 22.8 billion, estimated liabilities increased by RMB 6.1 billion.
Total equity attributable to owners of the Company was RMB 711.0 billion, representing an increase of RMB 34.8 billion compared with that of the end of 2015, which was mainly due to the increase in reserves by RMB 34.8 billion.
(2) Cash FlowThe following table sets forth the major items in the consolidated cash flow statements for 2016 and 2015.
Unit: RMB million
Major items of cash flows Year ended 31 December2016 2015
Net cash generated from operating activities 214,543 165,740Net cash used in investing activities (66,217) (116,719)Net cash generated from/(used in) financing activities (93,047) 9,093
In 2016, the net cash generated from operating activities of the company was RMB 214.5 billion, representing an increase of RMB 48.8 billion as compared with 2015. This was mainly due to the increase in profit before tax by RMB 23.7 billion, depreciation, depletion and amortization increased by RMB 12.0 billion, and asset impairment increased by RMB 8.3 billion over the same period of 2015. Meanwhile, due to strict control on occupation of funds, occupation of working capital decreased significantly compared with 2015.
In 2016, the net cash used in investing activities was RMB 66.2 billion, representing a decrease of RMB 50.5 billion over 2015. This was mainly due to the decrease of RMB 30.0 billion in capital expenditure over the same period of 2015 as well as RMB 13.2 billion
received as proceeds from the sale of equity in Sinopec Sichuan-to-East China Pipeline Co., Ltd.
In 2016, the net cash used in the Company’s financing activities was RMB 93.0 billion, representing an increase of RMB 102.1 billion over 2015. This was mainly due to the impact of RMB 105.0 billion from the capital introduction of Sinopec Marketing Co., Ltd. in 2015; the significant reduction in interest bearing debts for two consecutive years, of which, the Company repaid RMB 62.6 billion and RMB 63.0 billion in 2015 and 2016, respectively.
At the end of 2016, the cash and cash equivalents were RMB 124.5 billion.
(3) Contingent LiabilitiesPlease refer to “Material Guarantee Contracts and Their Performances” in the
“Significant Events” section of this report.
(4) Capital ExpendituresPlease refer to “Capital Expenditures” in the “Business Review and Prospects” section of this report.
(5) Research & development expenses and environmental expendituresResearch & development expenses refer to the expenses recognised as expenditures when they occur. In 2016, the expenditure for research & development was RMB 5.94 billion.
Environmental expenditures refer to the normal routine pollutant discharge fees paid by the Company, excluding capitalised cost of pollutant treatment properties. In 2016, the Company paid environmental expenditures of RMB 6.36 billion.
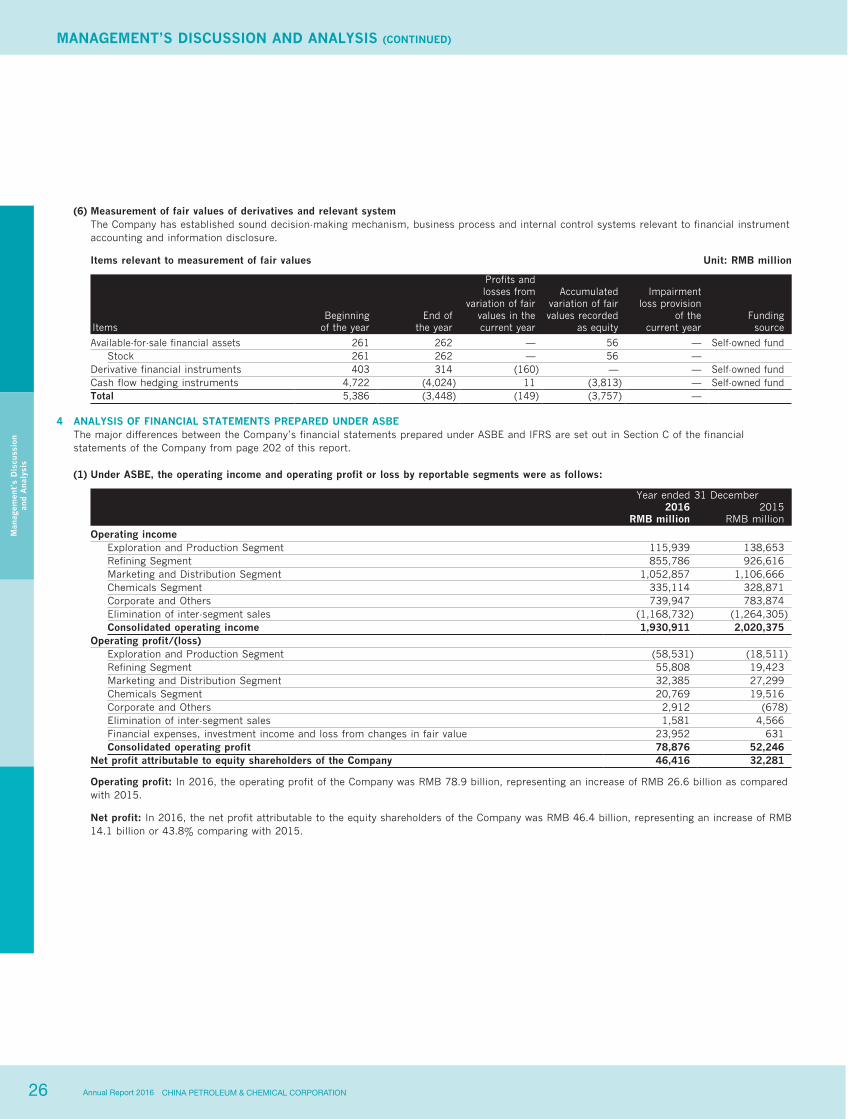
26 CHINA PETROLEUM & CHEMICAL CORPORATIONAnnual Report 2016
MANAGEMENT’S DISCUSSION AND ANALYSIS (CONTINUED)
Man
agem
ent’
s D
iscu
ssio
nan
d A
naly
sis
(6) Measurement of fair values of derivatives and relevant systemThe Company has established sound decision-making mechanism, business process and internal control systems relevant to financial instrument accounting and information disclosure.
Items relevant to measurement of fair values Unit: RMB million
ItemsBeginning
of the yearEnd of
the year
Profits andlosses from
variation of fairvalues in thecurrent year
Accumulatedvariation of fairvalues recorded
as equity
Impairmentloss provision
of thecurrent year
Fundingsource
Available-for-sale financial assets 261 262 — 56 — Self-owned fundStock 261 262 — 56 —
Derivative financial instruments 403 314 (160) — — Self-owned fundCash flow hedging instruments 4,722 (4,024) 11 (3,813) — Self-owned fundTotal 5,386 (3,448) (149) (3,757) —
4 ANALYSIS OF FINANCIAL STATEMENTS PREPARED UNDER ASBEThe major differences between the Company’s financial statements prepared under ASBE and IFRS are set out in Section C of the financial statements of the Company from page 202 of this report.
(1) Under ASBE, the operating income and operating profit or loss by reportable segments were as follows:
Year ended 31 December2016 2015
RMB million RMB million
Operating income Exploration and Production Segment 115,939 138,653Refining Segment 855,786 926,616Marketing and Distribution Segment 1,052,857 1,106,666Chemicals Segment 335,114 328,871Corporate and Others 739,947 783,874Elimination of inter-segment sales (1,168,732) (1,264,305)Consolidated operating income 1,930,911 2,020,375
Operating profit/(loss) Exploration and Production Segment (58,531) (18,511)Refining Segment 55,808 19,423Marketing and Distribution Segment 32,385 27,299Chemicals Segment 20,769 19,516Corporate and Others 2,912 (678)Elimination of inter-segment sales 1,581 4,566Financial expenses, investment income and loss from changes in fair value 23,952 631Consolidated operating profit 78,876 52,246
Net profit attributable to equity shareholders of the Company 46,416 32,281
Operating profit: In 2016, the operating profit of the Company was RMB 78.9 billion, representing an increase of RMB 26.6 billion as compared with 2015.
Net profit: In 2016, the net profit attributable to the equity shareholders of the Company was RMB 46.4 billion, representing an increase of RMB 14.1 billion or 43.8% comparing with 2015.
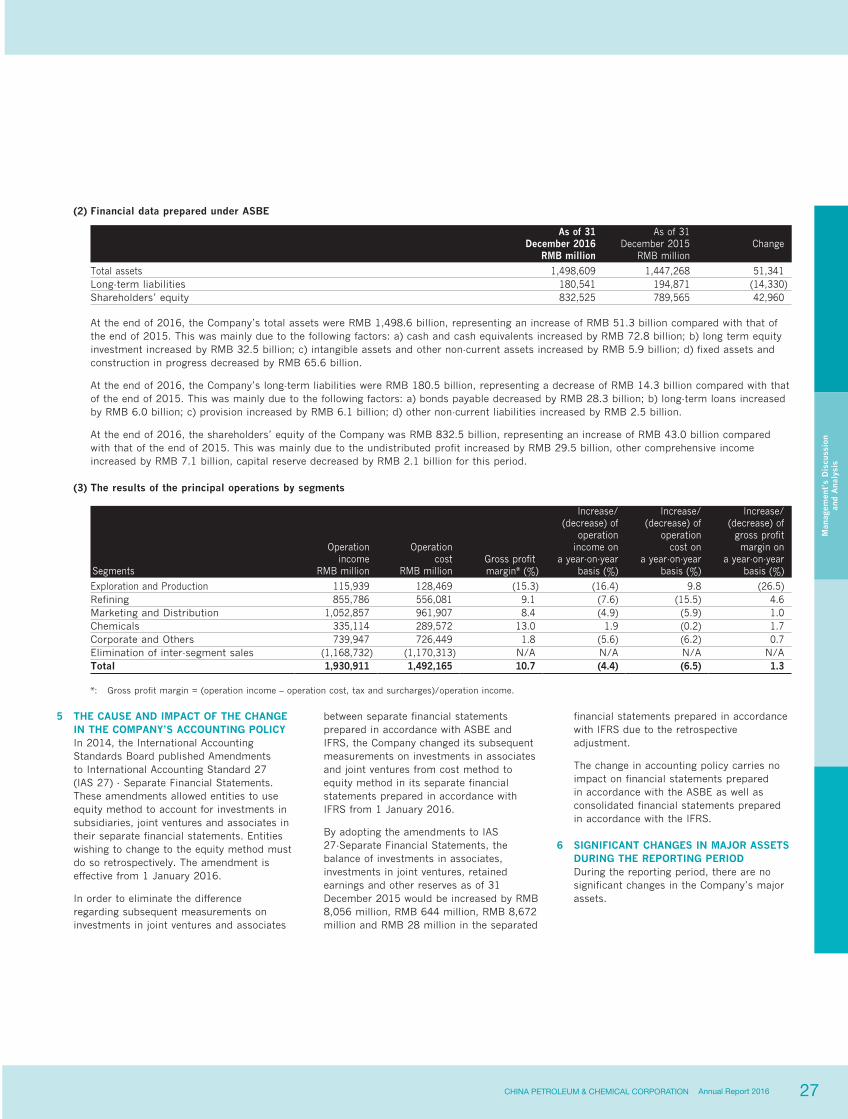
27CHINA PETROLEUM & CHEMICAL CORPORATION Annual Report 2016
Man
agem
ent’
s D
iscu
ssio
nan
d A
naly
sis
(2) Financial data prepared under ASBE
As of 31 As of 31December 2016 December 2015 Change
RMB million RMB million
Total assets 1,498,609 1,447,268 51,341Long-term liabilities 180,541 194,871 (14,330)Shareholders’ equity 832,525 789,565 42,960
At the end of 2016, the Company’s total assets were RMB 1,498.6 billion, representing an increase of RMB 51.3 billion compared with that of the end of 2015. This was mainly due to the following factors: a) cash and cash equivalents increased by RMB 72.8 billion; b) long term equity investment increased by RMB 32.5 billion; c) intangible assets and other non-current assets increased by RMB 5.9 billion; d) fixed assets and construction in progress decreased by RMB 65.6 billion.
At the end of 2016, the Company’s long-term liabilities were RMB 180.5 billion, representing a decrease of RMB 14.3 billion compared with that of the end of 2015. This was mainly due to the following factors: a) bonds payable decreased by RMB 28.3 billion; b) long-term loans increased by RMB 6.0 billion; c) provision increased by RMB 6.1 billion; d) other non-current liabilities increased by RMB 2.5 billion.
At the end of 2016, the shareholders’ equity of the Company was RMB 832.5 billion, representing an increase of RMB 43.0 billion compared with that of the end of 2015. This was mainly due to the undistributed profit increased by RMB 29.5 billion, other comprehensive income increased by RMB 7.1 billion, capital reserve decreased by RMB 2.1 billion for this period.
(3) The results of the principal operations by segments
Segments
Operationincome
RMB million
Operationcost
RMB millionGross profitmargin* (%)
Increase/(decrease) of
operationincome on
a year-on-year basis (%)
Increase/(decrease) of
operationcost on
a year-on-yearbasis (%)
Increase/(decrease) of
gross profitmargin on
a year-on-yearbasis (%)
Exploration and Production 115,939 128,469 (15.3) (16.4) 9.8 (26.5)Refining 855,786 556,081 9.1 (7.6) (15.5) 4.6Marketing and Distribution 1,052,857 961,907 8.4 (4.9) (5.9) 1.0Chemicals 335,114 289,572 13.0 1.9 (0.2) 1.7Corporate and Others 739,947 726,449 1.8 (5.6) (6.2) 0.7Elimination of inter-segment sales (1,168,732) (1,170,313) N/A N/A N/A N/ATotal 1,930,911 1,492,165 10.7 (4.4) (6.5) 1.3
*: Gross profit margin = (operation income – operation cost, tax and surcharges)/operation income.
5 THE CAUSE AND IMPACT OF THE CHANGE IN THE COMPANY’S ACCOUNTING POLICYIn 2014, the International Accounting Standards Board published Amendments to International Accounting Standard 27 (IAS 27) - Separate Financial Statements. These amendments allowed entities to use equity method to account for investments in subsidiaries, joint ventures and associates in their separate financial statements. Entities wishing to change to the equity method must do so retrospectively. The amendment is effective from 1 January 2016.
In order to eliminate the difference regarding subsequent measurements on investments in joint ventures and associates
between separate financial statements prepared in accordance with ASBE and IFRS, the Company changed its subsequent measurements on investments in associates and joint ventures from cost method to equity method in its separate financial statements prepared in accordance with IFRS from 1 January 2016.
By adopting the amendments to IAS 27-Separate Financial Statements, the balance of investments in associates, investments in joint ventures, retained earnings and other reserves as of 31 December 2015 would be increased by RMB 8,056 million, RMB 644 million, RMB 8,672 million and RMB 28 million in the separated
financial statements prepared in accordance with IFRS due to the retrospective adjustment.
The change in accounting policy carries no impact on financial statements prepared in accordance with the ASBE as well as consolidated financial statements prepared in accordance with the IFRS.
6 SIGNIFICANT CHANGES IN MAJOR ASSETS DURING THE REPORTING PERIODDuring the reporting period, there are no significant changes in the Company’s major assets.

28 CHINA PETROLEUM & CHEMICAL CORPORATIONAnnual Report 2016
SIGNIFICANT EVENTSS
igni
fica
nt E
vent
s

29CHINA PETROLEUM & CHEMICAL CORPORATION Annual Report 2016
SIGNIFICANT EVENTS
Sig
nifi
cant
Eve
nts
1 MAJOR PROJECTS
(1) Fuling shale gas projectIn accordance with the guidance of “overall deployment and stage-wise implementation”, the second phase of production capacity building was promoted comprehensively in 2016. The Company’s self-owned fund accounts for 50% of the project investment and bank loan is the main source of the other 50%. By the end of 2016, the cumulative realised investment was RMB 29.3 billion and total production capacity was 7 billion cubic meters per year. According to the plan, by the end of 2017, the total production capacity will be 10 billion cubic meters per year.
(2) Yuanba gas field projectThe production capacity building of Yuanba marine facies gas field with total production capacity of 3.4 billion cubic meters per year has been completed by the end of 2016. The Company’s self-owned fund accounts for 50% of the project investment and bank loan is the main source of the other 50%. By the end of 2016, the cumulative realised investment was RMB 12.8 billion.
(3) Guangxi LNG projectThe Guangxi LNG project with designed receiving capacity of 3 million tonnes per year consists mainly of the construction of wharf, terminal and transportation pipelines. It was put into operation in April 2016. The Company’s self-owned
fund accounts for 40% of the project investment and bank loan is the main source of the other 60%. By the end of 2016, the cumulative investment was RMB 9.7 billion.
(4) Tianjin LNG projectThe Tianjin LNG project with designed receiving capacity of 3 million tonnes per year consists mainly of the construction of wharf, terminal and transportation pipelines. It is expected to be completed and operational in December 2017. The Company’s self-owned fund accounts for 40% of the project investment and bank loan is the main source of the other 60%. By the end of 2016, the cumulative investment was RMB 8.2 billion.
2 CORPORATE BONDS ISSUED AND INTEREST PAYMENTS
Basic information of corporate bonds
Sinopec Corp. Sinopec Corp. Sinopec Corp.Bond name 2010 Corporate bond 2012 Corporate bond 2016 Corporate bond (first issue)
Abbreviation 10石化02 12石化01 12石化02 15石化01 15石化02Code 122052 122149 122150 136039 136040Issuance date 21 May 2010 1 June 2012 19 November 2015Maturity date
21 May 2020
1 June 2017 1 June 2022 19 November 19 November 2018 2020Amount issued (RMB billion) 9 13 7 16 4Outstanding balance (RMB billion) 9 13 7 16 4Interest rate (%) 4.05 4.26 4.90 3.3 3.7Principal and interest repayment
Simple interest is calculated and paid on an annual basis without compounding interests. The principal will be paid at maturity with last installment of interest.
Payment of interests Sinopec Corp. had paid in full the interest accrued for the current period interest payment year. Investor Qualification Arrangement
15石化01 and 15石化02 were publicly offered to qualified investors in accordance with Administration of the Issuance and Trading of Corporate Bonds
Listing place Shanghai Stock ExchangeCorporate bonds trustee China International Capital Corporation Limited
27th-28th Floor, China World Office 2, 1 Jianguomenwai Avenue, Chaoyang District, BeijingHuang Xu, Zhai Ying
(010) 6505 1166Credit rating agency United Credit ratings Co., Ltd. 12th Floor, PICC building, No.2 Jianguomenwai Avenue, Chaoyang District, BeijingUse of proceeds
Proceeds from the above-mentioned corporate bonds have been used for their designated purpose disclosed in the relevant announcements. All the proceeds have been completely used.
Credit rating agency
During the reporting period, United Credit ratings Co., Ltd. provided continuing credit rating for 10石化02, 12石化01, 12石化02, 15石化01 and 15石化02and reaffirmed AAA credit rating. The long term credit rating and outlook of Sinopec Corp. remained at AAA and stable respectively.
Credit addition mechanism, repayment scheme and other relative events for corporate bondsduring the reporting period
During the reporting period, there is no credit addition mechanism and change of the repayment arrangement for the above-mentioned corporate bonds Sinopec Corp. strictly followed the provisions in the corporate bond prospectus to repay principals and interests of the corporate bonds.
Convening of corporate bond holders’ meeting During the reporting period, the bondholders’ meeting has not been convened.Performance of corporate bonds trustee
During the durations of the above-mentioned bonds, the bond trustee, China International Capital Corporation Limited, has strictly followed the Bond Trustee Management Agreement and continuously tracked the company’s credit status, utilisation of bond proceeds and repayment of principals and interests of the bond. The bond trustee has also advised the company to satisfy obligations as described in the corporate bond prospectus and exercised its duty to protect the bondholders’ legitimate rights and interests. The bond trustee is expected to disclose the Trustee Management Affairs Report after disclosure of the company’s annual report. The full disclosure will be available on the website of Shanghai Stock Exchange (http://www.sse.com.cn)
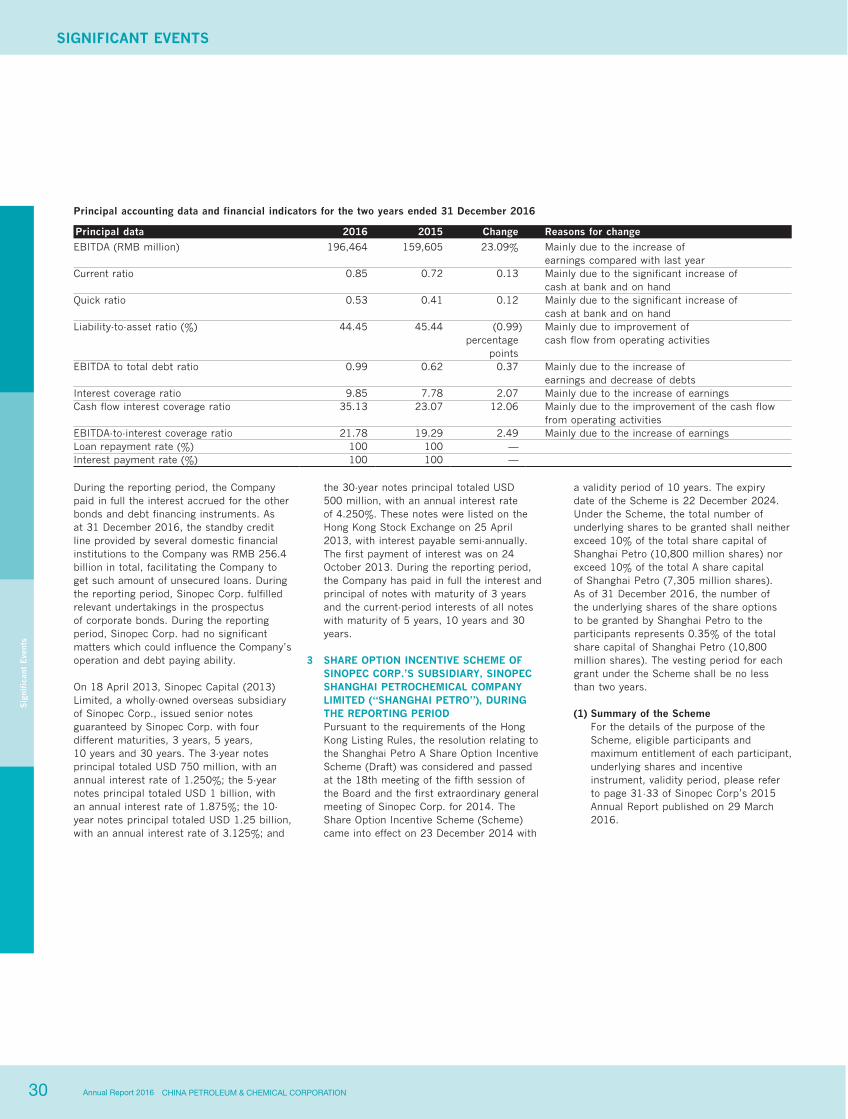
30 CHINA PETROLEUM & CHEMICAL CORPORATIONAnnual Report 2016
SIGNIFICANT EVENTSS
igni
fica
nt E
vent
s
Principal accounting data and financial indicators for the two years ended 31 December 2016
Principal data 2016 2015 Change Reasons for change
EBITDA (RMB million)
196,464
159,605
23.09%
Mainly due to the increase ofearnings compared with last year
Current ratio
0.85
0.72
0.13
Mainly due to the significant increase ofcash at bank and on hand
Quick ratio
0.53
0.41
0.12
Mainly due to the significant increase ofcash at bank and on hand
Liability-to-asset ratio (%)
44.45
45.44
(0.99)percentage
points
Mainly due to improvement ofcash flow from operating activities
EBITDA to total debt ratio
0.99
0.62
0.37
Mainly due to the increase ofearnings and decrease of debts
Interest coverage ratio 9.85 7.78 2.07 Mainly due to the increase of earningsCash flow interest coverage ratio
35.13
23.07
12.06
Mainly due to the improvement of the cash flow from operating activities
EBITDA-to-interest coverage ratio 21.78 19.29 2.49 Mainly due to the increase of earningsLoan repayment rate (%) 100 100 — Interest payment rate (%) 100 100 —
During the reporting period, the Company paid in full the interest accrued for the other bonds and debt financing instruments. As at 31 December 2016, the standby credit line provided by several domestic financial institutions to the Company was RMB 256.4 billion in total, facilitating the Company to get such amount of unsecured loans. During the reporting period, Sinopec Corp. fulfilled relevant undertakings in the prospectus of corporate bonds. During the reporting period, Sinopec Corp. had no significant matters which could influence the Company’s operation and debt paying ability.
On 18 April 2013, Sinopec Capital (2013) Limited, a wholly-owned overseas subsidiary of Sinopec Corp., issued senior notes guaranteed by Sinopec Corp. with four different maturities, 3 years, 5 years, 10 years and 30 years. The 3-year notes principal totaled USD 750 million, with an annual interest rate of 1.250%; the 5-year notes principal totaled USD 1 billion, with an annual interest rate of 1.875%; the 10-year notes principal totaled USD 1.25 billion, with an annual interest rate of 3.125%; and
the 30-year notes principal totaled USD 500 million, with an annual interest rate of 4.250%. These notes were listed on the Hong Kong Stock Exchange on 25 April 2013, with interest payable semi-annually. The first payment of interest was on 24 October 2013. During the reporting period, the Company has paid in full the interest and principal of notes with maturity of 3 years and the current-period interests of all notes with maturity of 5 years, 10 years and 30 years.
3 SHARE OPTION INCENTIVE SCHEME OF SINOPEC CORP.’S SUBSIDIARY, SINOPEC SHANGHAI PETROCHEMICAL COMPANY LIMITED (“SHANGHAI PETRO”), DURING THE REPORTING PERIODPursuant to the requirements of the Hong Kong Listing Rules, the resolution relating to the Shanghai Petro A Share Option Incentive Scheme (Draft) was considered and passed at the 18th meeting of the fifth session of the Board and the first extraordinary general meeting of Sinopec Corp. for 2014. The Share Option Incentive Scheme (Scheme) came into effect on 23 December 2014 with
a validity period of 10 years. The expiry date of the Scheme is 22 December 2024. Under the Scheme, the total number of underlying shares to be granted shall neither exceed 10% of the total share capital of Shanghai Petro (10,800 million shares) nor exceed 10% of the total A share capital of Shanghai Petro (7,305 million shares). As of 31 December 2016, the number of the underlying shares of the share options to be granted by Shanghai Petro to the participants represents 0.35% of the total share capital of Shanghai Petro (10,800 million shares). The vesting period for each grant under the Scheme shall be no less than two years.
(1) Summary of the SchemeFor the details of the purpose of the Scheme, eligible participants and maximum entitlement of each participant, underlying shares and incentive instrument, validity period, please refer to page 31-33 of Sinopec Corp’s 2015 Annual Report published on 29 March 2016.
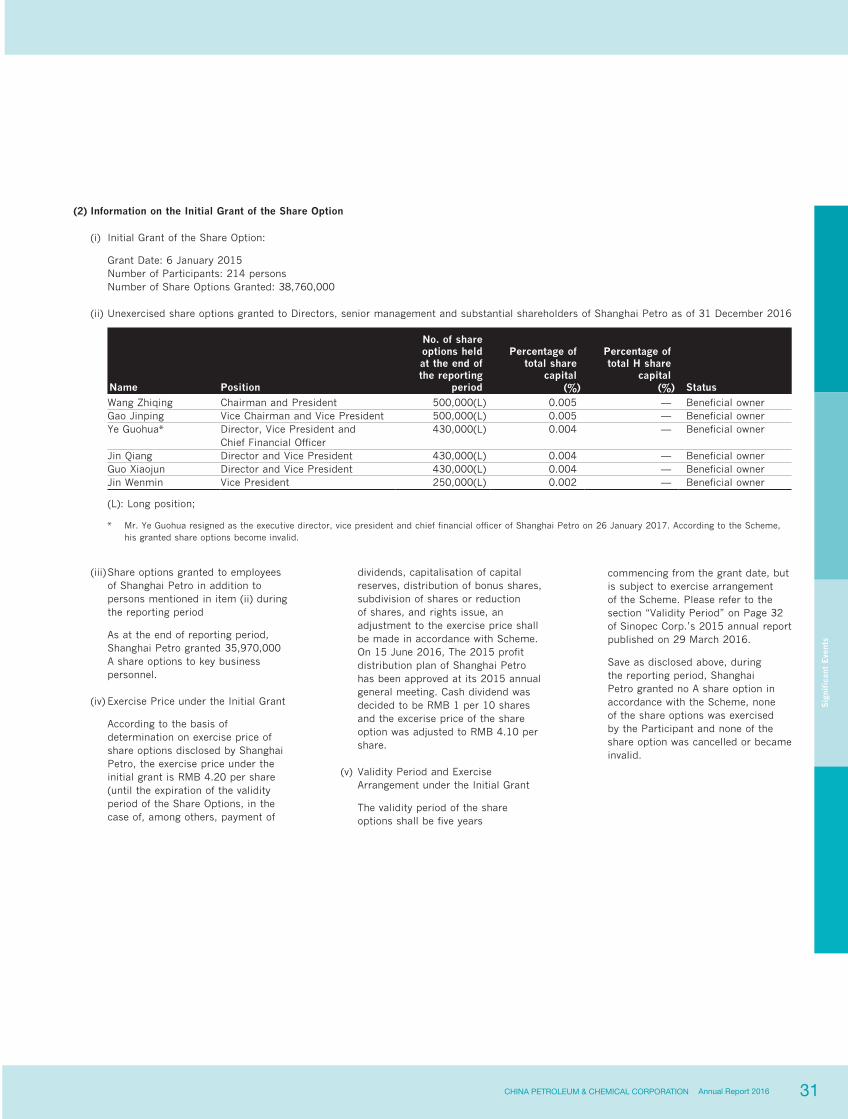
31CHINA PETROLEUM & CHEMICAL CORPORATION Annual Report 2016
Sig
nifi
cant
Eve
nts
(2) Information on the Initial Grant of the Share Option
(i) Initial Grant of the Share Option:
Grant Date: 6 January 2015Number of Participants: 214 personsNumber of Share Options Granted: 38,760,000
(ii) Unexercised share options granted to Directors, senior management and substantial shareholders of Shanghai Petro as of 31 December 2016
No. of share
Name Position
options heldat the end ofthe reporting
period
Percentage oftotal share
capital(%)
Percentage oftotal H share
capital(%) Status
Wang Zhiqing Chairman and President 500,000(L) 0.005 — Beneficial ownerGao Jinping Vice Chairman and Vice President 500,000(L) 0.005 — Beneficial ownerYe Guohua*
Director, Vice President andChief Financial Officer
430,000(L)
0.004
—
Beneficial owner
Jin Qiang Director and Vice President 430,000(L) 0.004 — Beneficial ownerGuo Xiaojun Director and Vice President 430,000(L) 0.004 — Beneficial ownerJin Wenmin Vice President 250,000(L) 0.002 — Beneficial owner
(L): Long position;
* Mr. Ye Guohua resigned as the executive director, vice president and chief financial officer of Shanghai Petro on 26 January 2017. According to the Scheme, his granted share options become invalid.
(iii) Share options granted to employees of Shanghai Petro in addition to persons mentioned in item (ii) during the reporting period
As at the end of reporting period, Shanghai Petro granted 35,970,000 A share options to key business personnel.
(iv) Exercise Price under the Initial Grant
According to the basis of determination on exercise price of share options disclosed by Shanghai Petro, the exercise price under the initial grant is RMB 4.20 per share (until the expiration of the validity period of the Share Options, in the case of, among others, payment of
dividends, capitalisation of capital reserves, distribution of bonus shares, subdivision of shares or reduction of shares, and rights issue, an adjustment to the exercise price shall be made in accordance with Scheme. On 15 June 2016, The 2015 profit distribution plan of Shanghai Petro has been approved at its 2015 annual general meeting. Cash dividend was decided to be RMB 1 per 10 shares and the excerise price of the share option was adjusted to RMB 4.10 per share.
(v) Validity Period and Exercise Arrangement under the Initial Grant
The validity period of the share options shall be five years
commencing from the grant date, but is subject to exercise arrangement of the Scheme. Please refer to the section “Validity Period” on Page 32 of Sinopec Corp.’s 2015 annual report published on 29 March 2016.
Save as disclosed above, during the reporting period, Shanghai Petro granted no A share option in accordance with the Scheme, none of the share options was exercised by the Participant and none of the share option was cancelled or became invalid.
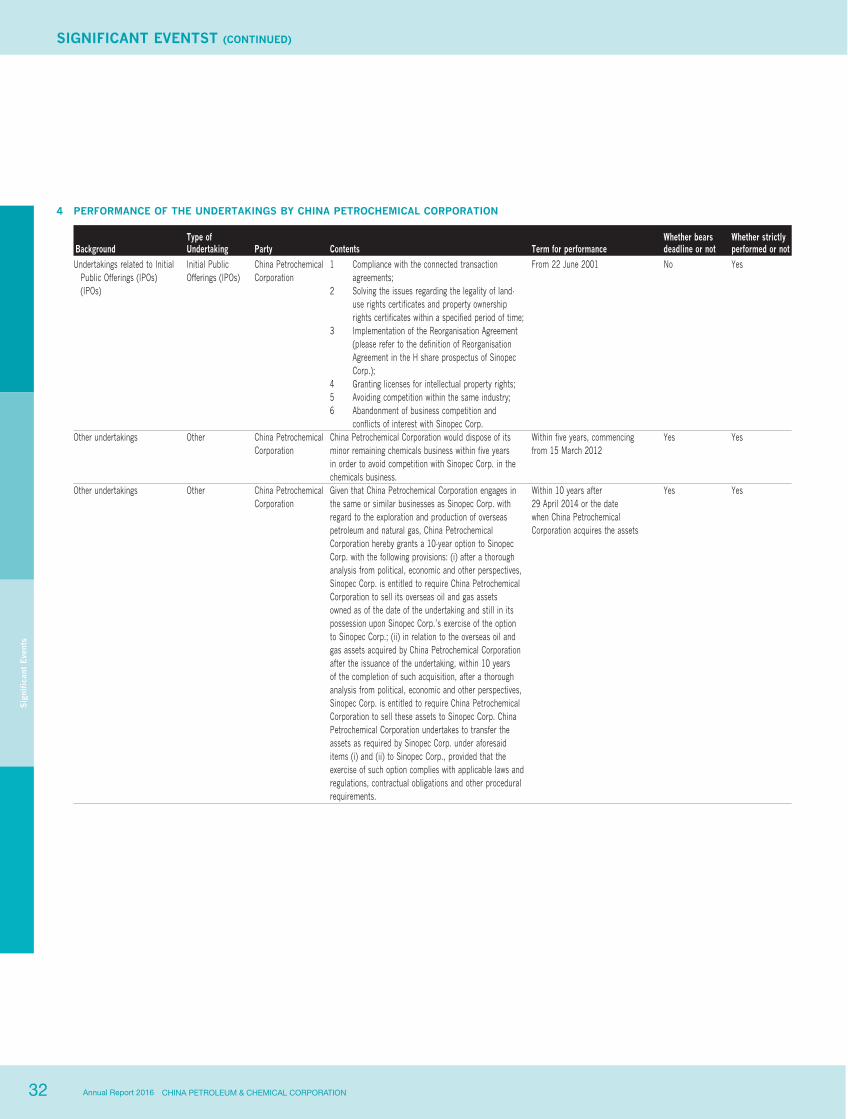
32 CHINA PETROLEUM & CHEMICAL CORPORATIONAnnual Report 2016
SIGNIFICANT EVENTST (CONTINUED)
Sig
nifi
cant
Eve
nts
4 PERFORMANCE OF THE UNDERTAKINGS BY CHINA PETROCHEMICAL CORPORATION
Type of Whether bears Whether strictlyBackground Undertaking Party Contents Term for performance deadline or not performed or not
Undertakings related to Initial Public Offerings (IPOs)
Initial Public Offerings (IPOs)
China Petrochemical Corporation
1 Compliance with the connected transaction agreements;
From 22 June 2001 No Yes
(IPOs) 2 Solving the issues regarding the legality of land-use rights certificates and property ownership rights certificates within a specified period of time;
3 Implementation of the Reorganisation Agreement (please refer to the definition of Reorganisation Agreement in the H share prospectus of Sinopec Corp.);
4 Granting licenses for intellectual property rights;5 Avoiding competition within the same industry;
6 Abandonment of business competition and
conflicts of interest with Sinopec Corp. Other undertakings
Other
China PetrochemicalCorporation
China Petrochemical Corporation would dispose of its minor remaining chemicals business within five years in order to avoid competition with Sinopec Corp. in the chemicals business.
Within five years, commencingfrom 15 March 2012
Yes
Yes
Other undertakings
Other
China Petrochemical Corporation
Given that China Petrochemical Corporation engages in the same or similar businesses as Sinopec Corp. with regard to the exploration and production of overseas petroleum and natural gas, China Petrochemical Corporation hereby grants a 10-year option to Sinopec Corp. with the following provisions: (i) after a thorough analysis from political, economic and other perspectives, Sinopec Corp. is entitled to require China Petrochemical Corporation to sell its overseas oil and gas assets owned as of the date of the undertaking and still in its possession upon Sinopec Corp.’s exercise of the option to Sinopec Corp.; (ii) in relation to the overseas oil and gas assets acquired by China Petrochemical Corporation after the issuance of the undertaking, within 10 years of the completion of such acquisition, after a thorough analysis from political, economic and other perspectives, Sinopec Corp. is entitled to require China Petrochemical Corporation to sell these assets to Sinopec Corp. China Petrochemical Corporation undertakes to transfer the assets as required by Sinopec Corp. under aforesaid items (i) and (ii) to Sinopec Corp., provided that the exercise of such option complies with applicable laws and regulations, contractual obligations and other procedural requirements.
Within 10 years after29 April 2014 or the datewhen China PetrochemicalCorporation acquires the assets
Yes
Yes
33CHINA PETROLEUM & CHEMICAL CORPORATION Annual Report 2016
Sig
nifi
cant
Eve
nts
Since 2012, China Petrochemical Corporation has earnestly fulfilled its undertaking in eliminating competitions in chemical business with Sinopec Corp. through: (1) subscribing capital contribution of joint ventures controlled by Sinopec Corp., by way of injecting net assets of certain chemical business and cash; (2) authorising Sinopec Corp. to be in charge of production plan, management and sales of the remaining chemical business. The competition in chemical business between China Petrochemical Corporation and Sinopec Corp. has been eliminated.
As of the date of this report, Sinopec Corp. had no undertakings in respect of profits, asset injections or asset restructuring that had not been fulfilled, nor did Sinopec Corp. make any profit forecast in relation to any asset or project.
5 SIGNIFICANT ASSETS AND EQUITY SALEOn 2 August 2016, the 7th meeting of sixth session of the board of directors of Sinopec Corp. considered and approved the proposal to introduce capital to invest in Sichuan-to-East China natural gas pipeline project, and agreed to take the Sichuan-to-East China Pipeline Co. as the platform to introduce capital publicly. On 12 December 2016, Sinopec Natural Gas Co., Ltd. (“Natural Gas Company”), a wholly-owned subsidiary of Sinopec Corp., entered into the capital injection agreement in relation to Sichuan-to-East China Pipeline Co. with China Life Insurance Company Limited (“China Life”) and SDIC Communications Holding Co., Ltd. (“SDIC Communications”). China life and SDIC Communications subscribed a total of 50% equity interest in Sichuan-to-East China Pipeline Co., a wholly-owned
subsidiary of Natural Gas Company, in cash with an aggregate amount of RMB 22.8 billion, among which China Life paid RMB 20 billion and SDIC Communications paid RMB 2.8 billion. Upon the completion of capital injection, the registered capital of Sichuan-to-East China Pipeline Co. increased from RMB 100 million to RMB 200 million, and each of Natural Gas Company, China Life and SDIC Communication will hold 50%, 43.86% and 6.14% equity interest in Sichuan-to-East China Pipeline Co., respectively. For more details, please refer to the announcement published in the China Securities Journal, the Shanghai Securities News and the Securities Times by Sinopec Corp. on 13 December 2016 and the announcement published on the website of the Hong Kong Stock Exchange on 12 December 2016.
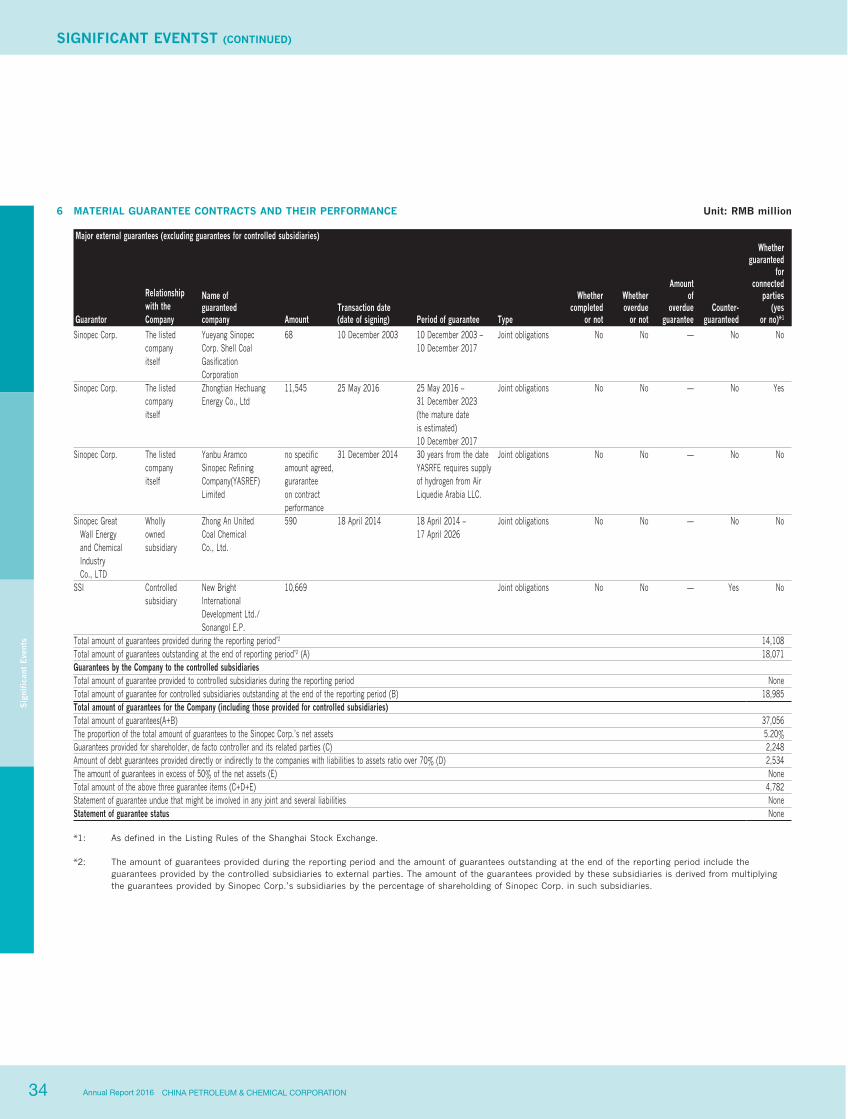
34 CHINA PETROLEUM & CHEMICAL CORPORATIONAnnual Report 2016
SIGNIFICANT EVENTST (CONTINUED)
Sig
nifi
cant
Eve
nts
6 MATERIAL GUARANTEE CONTRACTS AND THEIR PERFORMANCE Unit: RMB million
Major external guarantees (excluding guarantees for controlled subsidiaries)
Guarantor
Relationship with the Company
Name of guaranteedcompany Amount
Transaction date (date of signing) Period of guarantee Type
Whether completed
or not
Whether overdue
or not
Amountof
overdueguarantee
Counter-guaranteed
Whetherguaranteed
forconnected
parties(yes
or no)*1
Sinopec Corp.
The listed company itself
Yueyang Sinopec Corp. Shell Coal Gasification Corporation
68
10 December 2003
10 December 2003 – 10 December 2017
Joint obligations
No
No
—
No
No
Sinopec Corp.
The listed company itself
Zhongtian HechuangEnergy Co., Ltd
11,545
25 May 2016
25 May 2016 –31 December 2023(the mature dateis estimated)10 December 2017
Joint obligations
No
No
—
No
Yes
Sinopec Corp.
The listed company itself
Yanbu AramcoSinopec RefiningCompany(YASREF)Limited
no specificamount agreed,guraranteeon contractperformance
31 December 2014
30 years from the dateYASRFE requires supplyof hydrogen from AirLiquedie Arabia LLC.
Joint obligations
No
No
—
No
No
Sinopec Great Wall Energy and Chemical Industry Co., LTD
Wholly owned subsidiary
Zhong An United Coal Chemical Co., Ltd.
590
18 April 2014
18 April 2014 – 17 April 2026
Joint obligations
No
No
—
No
No
SSI
Controlled subsidiary
New BrightInternationalDevelopment Ltd./Sonangol E.P.
10,669
Joint obligations
No
No
—
Yes
No
Total amount of guarantees provided during the reporting period*2 14,108Total amount of guarantees outstanding at the end of reporting period*2 (A) 18,071Guarantees by the Company to the controlled subsidiariesTotal amount of guarantee provided to controlled subsidiaries during the reporting period NoneTotal amount of guarantee for controlled subsidiaries outstanding at the end of the reporting period (B) 18,985Total amount of guarantees for the Company (including those provided for controlled subsidiaries)Total amount of guarantees(A+B) 37,056The proportion of the total amount of guarantees to the Sinopec Corp.’s net assets 5.20%Guarantees provided for shareholder, de facto controller and its related parties (C) 2,248Amount of debt guarantees provided directly or indirectly to the companies with liabilities to assets ratio over 70% (D) 2,534The amount of guarantees in excess of 50% of the net assets (E) NoneTotal amount of the above three guarantee items (C+D+E) 4,782Statement of guarantee undue that might be involved in any joint and several liabilities NoneStatement of guarantee status None
*1: As defined in the Listing Rules of the Shanghai Stock Exchange.
*2: The amount of guarantees provided during the reporting period and the amount of guarantees outstanding at the end of the reporting period include the guarantees provided by the controlled subsidiaries to external parties. The amount of the guarantees provided by these subsidiaries is derived from multiplying the guarantees provided by Sinopec Corp.’s subsidiaries by the percentage of shareholding of Sinopec Corp. in such subsidiaries.
35CHINA PETROLEUM & CHEMICAL CORPORATION Annual Report 2016
Sig
nifi
cant
Eve
nts
7 SPECIFIC STATEMENTS AND INDEPENDENT OPINIONS FROM INDEPENDENT NON-EXECUTIVE DIRECTORS REGARDING EXTERNAL GUARANTEES PROVIDED BY SINOPEC CORP. DURING AND BY THE END OF 2016:We, as independent directors of Sinopec Corp., hereby make the following statements after conducting a thorough check of external guarantees provided by the Company accumulated up to and during 2016 in accordance with the requirements of the domestic regulatory authorities:
The external guarantees prior to 2016 had been disclosed in previous annual report. The aggregate balance of external guarantees provided by Sinopec Corp. for the year 2016 was RMB 37.056 billion, accounting for approximately 5.20% of the Company’s net assets.
We hereby present the following opinions:
Sinopec Corp. shall continue to strengthen its management and actively monitor guarantee risks. It shall strictly follow the approval and disclosure procedures in relation to guarantee businesses for any new external guarantees provided thereafter.
8 SIGNIFICANT LITIGATION, ARBITRATION RELATING TO SINOPEC CORP.No significant litigation, arbitration relating to the Company occurred during the reporting period.
9 INSOLVENCY AND RESTRUCTURINGDuring the reporting period, the Company was not involved in any insolvency or restructuring matters.
10 OTHER MATERIAL CONTRACTSSaved as disclosed by Sinopec Corp., the Company did not enter into any significant contracts subject to disclosure obligations during the reporting period.
11 CREDIBILITY FOR THE COMPANY, CONTROLLING SHAREHOLDERS AND DE FACTO CONTROLLERDuring the reporting period, the Company and its controlling shareholder did not have any court’s effective judgments which should be performed or any large amount of debt which should be repaid.
12 TRUSTEESHIP, CONTRACTING AND LEASESDuring the reporting period, the Company was not involved in any events relating to significant trusteeship, contracting or leases for the assets of any other company, nor has it placed its assets with any other company under a trusteeship, contracting or lease agreement subject to disclosure obligations.
13 ENTRUSTED ASSET MANAGEMENT AND ENTRUSTED LOANS
(1) Entrusted Asset ManagementDuring the reporting period, the Company has no entrusted asset management subject to disclosure obligation.
(2) Entrusted loans
Borrower
Amount(RMB
billion) TermInterest
Rate Purpose
Mortgageor
guarantor
Whetheroverdue
or not
Whetherconnectedtransaction
or not
Whetherroll-over
or not
Whetherinvolved
in lawsuitor not
Connectedrelationship
Gainor loss
Ningbo Gaotou Petroleum Development, Ltd.
0.2
5 years
6.00%
Workingcapital loan
None
No
No
No
No
Joint Venture
Gain
Maoming-BASF, Ltd.
0.6
5 years
4.75%
Projectconstruction
None
No
No
No
No
Joint Venture
Gain
(3) Other asset management and derivative investmentDuring the reporting period, the Company has no other asset management and derivative investment subject to disclosure obligation.
36 CHINA PETROLEUM & CHEMICAL CORPORATIONAnnual Report 2016
SIGNIFICANT EVENTST (CONTINUED)
Sig
nifi
cant
Eve
nts
14 DEPOSITS AT SINOPEC FINANCE CO., LTD. AND SINOPEC CENTURY BRIGHT CAPITAL INVESTMENT, LTD.In order to regulate connected transactions between the Company and Sinopec Finance Co., Ltd. (Sinopec Corp.’s domestic settlement center, hereinafter referred to as the “Finance Company”) and to ensure the safety and liquidity of the deposits of the Company in the Finance Company, Sinopec Corp. and the Finance Company formulated the Risk Control System on Connected Transactions of China Petroleum & Chemical Corporation and Sinopec Finance Co., Ltd., which covers the risk control system and the risk management plan of the Company to prevent financial risks and to ensure that the deposits of the Company in the Finance Company can be utilised at the Company’s discretion. At the same time, as the controlling shareholder of the Finance Company, China Petrochemical Corporation undertakes that in case of an emergency where the Finance Company has difficulty in making payments, China Petrochemical Corporation will increase the capital of the Finance Company in accordance with the actual need for the purpose of making payment.
In order to regulate connected transactions between the Company and Sinopec Century Bright Capital Investment, Ltd. (Sinopec Corp.’s overseas settlement center, hereinafter referred to as the Century Bright Company), Century Bright Company ensures the safety of the deposits of the Company in Century Bright Company by strengthening internal risk controls and obtaining support from China Petrochemical Corporation. China Petrochemical Corporation has formulated a number of internal rules, including the Rules for the Internal Control System, the Rules for Implementation of Overseas Capital Management Methods, and the Provisional Methods for Overseas Fund
Platform Management, to impose strict rules on Century Bright Company for providing overseas financial services. Century Bright Company has also established the Rules for the Implementation of the Internal Control System, which ensures the standardisation and safety of its corporate deposits business. At the same time, as the wholly controlling shareholder of Century Bright Company, China Petrochemical Corporation entered into a keep-well agreement with Century Bright Company in 2013, in which China Petrochemical Corporation undertakes that when Century Bright Company has difficulty in making payments, China Petrochemical Corporation will ensure that Century Bright Company will fulfill its repayment obligation through various channels.
The deposits of the Company in the Finance Company and Century Bright Company during the reporting period did not exceed the cap as approved at the general meeting of shareholders. During daily operations, Sinopec Corp. can withdraw the full amount of its deposits in the Finance Company and Century Bright Company.
15 APPROPRIATION OF NONOPERATIONAL FUNDS BY THE CONTROLLING SHAREHOLDER AND ITS RELATED PARTIES AND THE PROGRESS FOR CLEARING UPNot applicable
16 STRUCTURED ENTITY CONTROLLED BY THE COMPANYNone
17 DETAILED IMPLEMENTATION OF THE SHARE INCENTIVE SCHEME DURING THE REPORTING PERIODSinopec Corp. did not implement any share incentive scheme during the reporting period.
18 ENVIROMENTAL PROTECTION BY SINOPEC CORP AND ITS SUBSIDIARIESSome branches and subsidiaries of Sinopec Corp. are major pollutant discharging companies stipulated by China’s environmental protection agencies. Pursuant to relevant regulations and specific requirements of local related authorities, environmental information of these companies has been disclosed publicly. For more details, please refer to the website of local government.
19 POVERTY ALLEVIATION PROGRAM LAUNCHED BY SINOPEC CORP
(1) Targeted Poverty Alleviation PlanThe Company has strictly followed the nation’s poverty elimination program under the thirteenth five-year plan, persisted in targeted objects, targeted project planning, targeted utilisation of funds, targeted measures based on households, targeted personnel based on village and targeted poverty elimination effect, and uphold the principle of “blood-making style” and “blood–transfusion style” poverty alleviation. We also increased our investment, enhanced fund management, aimed at work innovation, emphasised supervision protocols and guaranteed work efficiency to ensure the effectiveness of the targeted poverty alleviation plan.
(2) Overview on 2016 Targeted Poverty AlleviationsIn 2016, the Company focused on poor villages and households, implemented targeted poverty elimination plans in infrastructure construction, labor output trainings, rural industry development, poverty relief and education assistance. We invested RMB 105.45 million in targeted poverty alleviation, helped 27,775 registered people out of poverty and funded the education of 2,797 students.
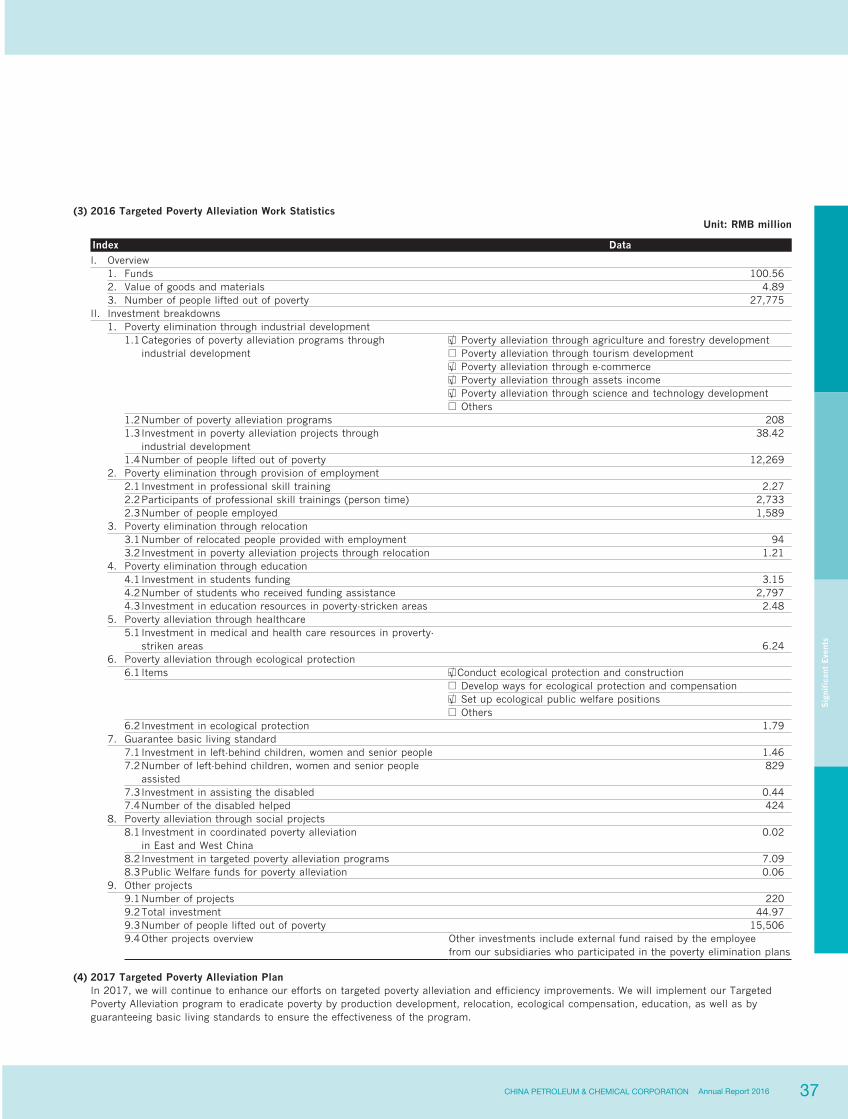
37CHINA PETROLEUM & CHEMICAL CORPORATION Annual Report 2016
Sig
nifi
cant
Eve
nts
(3) 2016 Targeted Poverty Alleviation Work StatisticsUnit: RMB million
Index Data
I. Overview 1. Funds 100.562. Value of goods and materials 4.893. Number of people lifted out of poverty 27,775
II. Investment breakdowns 1. Poverty elimination through industrial development
1.1 Categories of poverty alleviation programs through √□ Poverty alleviation through agriculture and forestry development industrial development □ Poverty alleviation through tourism development
√□ Poverty alleviation through e-commerce√□ Poverty alleviation through assets income√□ Poverty alleviation through science and technology development
□ Others1.2 Number of poverty alleviation programs 2081.3 Investment in poverty alleviation projects through industrial development
38.42
1.4 Number of people lifted out of poverty 12,2692. Poverty elimination through provision of employment
2.1 Investment in professional skill training 2.272.2 Participants of professional skill trainings (person time) 2,7332.3 Number of people employed 1,589
3. Poverty elimination through relocation 3.1 Number of relocated people provided with employment 943.2 Investment in poverty alleviation projects through relocation 1.21
4. Poverty elimination through education 4.1 Investment in students funding 3.154.2 Number of students who received funding assistance 2,7974.3 Investment in education resources in poverty-stricken areas 2.48
5. Poverty alleviation through healthcare 5.1 Investment in medical and health care resources in proverty-
striken areas 6.246. Poverty alleviation through ecological protection
6.1 Items √□Conduct ecological protection and construction □ Develop ways for ecological protection and compensation√□ Set up ecological public welfare positions
□ Others6.2 Investment in ecological protection 1.79
7. Guarantee basic living standard 7.1 Investment in left-behind children, women and senior people 1.467.2 Number of left-behind children, women and senior people
assisted829
7.3 Investment in assisting the disabled 0.447.4 Number of the disabled helped 424
8. Poverty alleviation through social projects 8.1 Investment in coordinated poverty alleviation in East and West China
0.02
8.2 Investment in targeted poverty alleviation programs 7.098.3 Public Welfare funds for poverty alleviation 0.06
9. Other projects 9.1 Number of projects 2209.2 Total investment 44.979.3 Number of people lifted out of poverty 15,5069.4 Other projects overview
Other investments include external fund raised by the employee from our subsidiaries who participated in the poverty elimination plans
(4) 2017 Targeted Poverty Alleviation PlanIn 2017, we will continue to enhance our efforts on targeted poverty alleviation and efficiency improvements. We will implement our Targeted Poverty Alleviation program to eradicate poverty by production development, relocation, ecological compensation, education, as well as by guaranteeing basic living standards to ensure the effectiveness of the program.

38 CHINA PETROLEUM & CHEMICAL CORPORATIONAnnual Report 2016
CONNECTED TRANSACTIONSC
onne
cted
Tra
nsac
tion
s
39CHINA PETROLEUM & CHEMICAL CORPORATION Annual Report 2016
CONNECTED TRANSACTIONS
Con
nect
ed T
rans
acti
ons
1 AGREEMENTS CONCERNING CONTINUING CONNECTED TRANSACTIONS BETWEEN SINOPEC CORP. AND CHINA PETROCHEMICAL CORPORATIONPrior to Sinopec Corp.’s overseas listing, in order to ensure the smooth continuation of production and business conducted by the Company and China Petrochemical Corporation, the two parties entered into a number of agreements on continuing connected transactions, details of which are as follows:
(1) The Company and China Petrochemical Corporation will mutually supply ancillary services for products, production and construction services (Mutual Supply Agreement)
(2) China Petrochemical Corporation will provide trademarks, patents and computer software to the Company for use free of charge
(3) China Petrochemical Corporation will provide cultural and educational, hygienic and community services to the Company (Cultural and Educational Hygienic and Community Services Agreement)
(4) China Petrochemical Corporation will provide leasing services for lands and certain properties to the Company
(5) China Petrochemical Corporation will provide comprehensive insurance to the Company
(6) China Petrochemical Corporation will provide shareholders’ loans to the Company and
(7) The Company will provide franchise licenses for service stations to China Petrochemical Corporation.
On 26 August 2015, Sinopec Corp. and China Petrochemical Corporation entered into a supplementary agreement of the continuing connected transactions, whereby
the terms of the Mutual Supply Agreement and the Cultural and Educational, Hygienic and Community Services Agreement were extended from 1 January 2016 to 31 December 2018. The resolution relating to continuing connected transactions for the three years from 2016 to 2018 was approved at the first extraordinary general meeting for 2015 held on 23 October 2015. For details of the above continuing connected transactions, please refer to relevant announcements published on 27 August 2015 in the China Securities Journal, the Shanghai Securities News and the Securities Times and on the websites of the Shanghai Stock Exchange and the Hong Kong Stock Exchange (dated 26 August 2015). The capitalised terms used in this section shall have the same meaning as that used in the above-mentioned announcements.
2 COMPLIANCE OF DISCLOSURES AND APPROVALS OF CONTINUING CONNECTED TRANSACTIONS BETWEEN THE COMPANY AND SINOPEC GROUP WITH HONG KONG LISTING RULES AND THE SHANGHAI LISTING RULESPursuant to the Hong Kong Listing Rules and the Shanghai Listing Rules, the continuing connected transactions between the Company and Sinopec Group are generally subject to full disclosure based on the nature and the value of the transactions, and are also subject to approvals of independent non-executive directors and/or independent shareholders. The Hong Kong Stock Exchange and Shanghai Stock Exchange exempted Sinopec Corp. from full compliance with the relevant listing rules regarding the above continuing connected transactions and conditionally exempted Sinopec Corp. from complying with the continuous disclosure obligations.
There was no change to the above-mentioned supplementary agreements on continuing connected transactions during the reporting period. The aggregated amount of the
continuing connected transactions for 2016 of the Company is in compliance with the relevant requirements of the Hong Kong Listing Rules and the Shanghai Listing Rules. For performance details of connected transaction agreements, please refer to Item 3 below.
3 ACTUAL CONTINUING CONNECTED TRANSACTIONS ENTERED INTO BY THE COMPANY DURING THE YEARSinopec Corp. and China Petrochemical Corporation have implemented the relevant framework agreements in relation to the continuing connected transactions, including Mutual Supply Agreement, Cultural, Educational, Hygiene and Community Services Agreement, Land Use Rights Leasing Agreement, Properties Leasing Agreement, Intellectual Property Licence Agreements and SPI Fund Document.
Pursuant to the above-mentioned agreements on continuing connected transactions, the aggregate amount of the continuing connected transactions of the Company during the year was RMB 260.704 billion. Among the transaction amount, purchases expenses amounted to RMB 179.82 billion, representing 9.32% of the total amount of this type of transaction for the reporting period, including purchases of products and services (procurement, storage, exploration and development services, and production-related services) of RMB 161.317 billion, purchases of auxiliary and community services of RMB 6.584 billion. The housing rent paid by the Company amounted to RMB 449 million. The rent for use of land was RMB 10.474 billion. Interest expenses amounted to RMB 996 million. The sales income amounted to RMB 80.884 billion, representing 4.04% of the total amount of this type of transaction for the reporting period, including RMB 80.634 billion for sales of products and services, RMB 41 million for agency commission income, and RMB 209 million for interest income.
40 CHINA PETROLEUM & CHEMICAL CORPORATIONAnnual Report 2016
CONNECTED TRANSACTIONS (CONTINUED)
Con
nect
ed T
rans
acti
ons
The amounts of the above continuing connected transactions between the Company and Sinopec Group did not exceed the caps for the continuing connected transactions as approved by the general meeting of shareholders and the Board.
Principle of pricing for the continuing connected transactions:
(a) The government-prescribed price will apply;
(b) when there is no government-prescribed price but there is a government-guidance price, the government-guidance price will apply;
(c) when there is neither a government-prescribed price nor a government-guidance price, the market price will apply; or
(d) when none of the above is applicable, the price for the provision of the products or services is to be agreed upon by the relevant parties, and shall be the reasonable cost incurred in providing the products or services plus 6% or less of such cost.
For details of the pricing principle, please refer to relevant announcements published on 27 August 2015 in the China Securities Journal, the Shanghai Securities News and the Securities Times and on the websites of the Shanghai Stock Exchange and the Hong Kong Stock Exchange.
Decision-making procedures:
The major continuing connected transaction agreements were entered into in the ordinary course of the Company’s business and in
accordance with normal commercial terms that are fair and reasonable to the Company and its shareholders. The Company, according to internal control procedures, adjusts the scope and amount of continuing connected transactions and the caps for the amount exempted from disclosure every three years, and will be announced and implemented upon the approval of the Board and/or independent shareholders. For the other connected transactions, Sinopec Corp., in strict compliance with domestic and overseas regulatory rules, will publish the announcement and implement the transactions only after submitting the relevant proposals of connected transactions to the Board and/or the general meeting of shareholders for consideration and approval according to internal control procedures.
Related party transactions with the Sinopec Group that occurred during the year, as set out in Note 34 to the financial statements prepared under the IFRS in this annual report, also fall under the definition of connected transactions under Chapter 14A of the Hong Kong Listing Rules.
The above-mentioned connected transactions between the Company and Sinopec Group in 2016 were approved at the 12th meeting of the sixth session of the Board and has complied with the disclosure requirements under Chapter 14A of the Hong Kong Listing Rules.
The external auditor of Sinopec Corp. was engaged to report on the Company’s continuing connected transactions in accordance with the Hong Kong Standard on Assurance Engagements 3000, Assurance Engagement Other Than Audits or Reviews
of Historical Financial Information, and with reference to Practice Note 740, Auditor’s Letter on Continuing Connected Transactions under the Hong Kong Listing Rules, issued by the Hong Kong Institute of Certified Public Accountants. The auditor has issued its unqualified letter containing its conclusions in respect of the above-mentioned continuing connected transactions in accordance with Rule 14A.56 of the Hong Kong Listing Rules. Sinopec Corp. has submitted a copy of the auditor’s letter to the Hong Kong Stock Exchange.
After reviewing the above-mentioned connected transactions, the independent non-executive directors of Sinopec Corp. have confirmed the following:
(a) The transactions have been conducted in the ordinary course of the Company’s business.
(b) The transactions have been entered into based on either of the following terms:
i normal commercial terms; or
ii terms not less favorable than those available from or to independent third parties, where there is no available comparison to determine whether such terms are on normal commercial terms.
(c) The transactions were conducted pursuant to the terms of relevant agreements, and the terms were fair and reasonable and in the interests of Sinopec Corp. and its shareholders as a whole.

41CHINA PETROLEUM & CHEMICAL CORPORATION Annual Report 2016
Con
nect
ed T
rans
acti
ons
4 OTHER SIGNIFICANT CONNECTED TRANSACTIONS OCCURED THIS YEARThere are no other significant connected transactions during the reporting period.
5 FUNDS PROVIDED BETWEEN RELATED PARTIESIn accordance with the disclosure requirement of the Shanghai Stock Exchange, where there are funds or guarantees provided between the Company and related parties, disclosure shall be made as to the reasons, the opening balance, the amount incurred in the current period and the ending balance of the funds provided, and their impacts on the Company.
Unit: RMB million
Funds to related parties Funds from related parties
Related Parties Relations
Balance at the
beginningof the year
Amountincurred
Balanceat the endof the year
Balance at the
beginningof the year
Amountincurred
Balance at the end
of the year
Sinopec Group Parent company and affiliated companies*
20,485 5,979 26,464 26,669 2,872 29,541
Other related parties Associates and joint ventures 5,472 536 6,008 174 (119) 55Total 25,957 6,515 32,472 26,843 2,753 29,596Reason for provision of funds between related parties Loans and other accounts receivable and accounts payableImpacts on the Company No material negative impact
*: affiliated companies include subsidiaries, associates and joint ventures.

42 CHINA PETROLEUM & CHEMICAL CORPORATIONAnnual Report 2016
CORPORATE GOVERNANCEC
orpor
ate
Gov
erna
nce
43CHINA PETROLEUM & CHEMICAL CORPORATION Annual Report 2016
CORPORATE GOVERNANCE
Cor
por
ate
Gov
erna
nce
1 IMPROVEMENTS IN CORPORATE GOVERNANCE DURING THE REPORTING PERIODDuring the reporting period, Sinopec Corp. was in full compliance with domestic and overseas laws and regulations as well as the Articles of Association of the Company, and operates in line with all legal requirements and its corporate governance has been further improved. The Board and Board committees’ members and senior management staff were adjusted in time, based on personnel changes. Shareholders’ meetings, Board meetings and meetings of Board of Supervisors were organised in a standardised and efficient manner. Independent directors have played their roles dutifully by offering suggestions to the Company for its planning, reform and development plan for the “Thirteenth Five-Year” Period. Oriented at investors’ demand, bilateral communication has been strengthened, high-quality information disclosure conducted, and green low-carbon development actively promoted and practiced, winning the recognition of the capital market and the society as a whole.
During the reporting period, there are no significant differences in Sinopec Corp.’s corporate governance and the requirements from the PRC Company Law and related regulations on securities of the CSRC. The Board of Supervisors of Sinopec Corp. agreed with all supervised matters. None of Sinopec Corp., the Board, directors, supervisors, senior management, controlling shareholders or de facto controllers of Sinopec Corp. were under the investigation by the CSRC or punished administratively or criticized publicly by the CSRC, the Hong Kong Securities and Futures Commission, the Securities and Exchange Commission of the United States, or received any public censure from Shanghai Stock Exchange, the Hong Kong Stock Exchange, the New York Stock Exchange or the London Stock Exchange.
2 ANNUAL GENERAL MEETINGDuring the reporting period, Sinopec Corp. convened the 1st extraordinary general meeting for 2016 and 2015 annual general meeting in Beijing, China on 25 February 2016 and 18 May 2016 respectively in accordance with relevant laws and regulations and procedures of noticing, convening and holding pursuant to the Articles of Association. For meeting details, please refer to the poll results announcements published in China Securities Journal, Shanghai Securities News and Securities Times and on the websites of Hong Kong Stock Exchange after each meeting.
3 EQUITY INTERESTS OF DIRECTORS, SUPERVISORS AND OTHER SENIOR MANAGEMENTAs of 31 December 2016, apart from 13,000 A shares of Sinopec Corp. held by Vice President Mr. Ling Yiqun, none of the directors, supervisors or other senior management of Sinopec Corp. held any shares of Sinopec Corp.
Save as disclosed above, during the reporting period, none of the directors, supervisors and senior management of Sinopec Corp. and their associates had any interests or short positions (including any interest or short position that is regarded or treated as being held in accordance with the Securities and Futures Ordinance (SFO) in the shares, debentures and underlying shares) of Sinopec Corp. or any associated corporations (as defined in Part XV of SFO) would fall to be disclosed to the Sinopec Corp. and the Hong Kong Stock Exchange under the Division 7 and 8 of Part XV of SFO or which was recorded in the register required to be kept under section 352 of SFO or otherwise notified to Sinopec Corp. and the Hong Kong Stock Exchange pursuant to the Model Code for Securities Transactions by Directors of Listed Company.
4 PERFORMANCE OF THE INDEPENDENT DIRECTORSDuring the reporting period, the independent non-executive directors of Sinopec Corp. fulfilled their duties in good faith as required by laws and regulations and the Articles of Association, and actively contributed to the development of the Company. They actively attended, meetings of the Board and meetings of the Board committees (please refer to the Report of the Board of Directors in this annual report for details of their attendance), reviewed the relevant documents with due care and exercised their profession advantages to offer advice and suggestions to Sinopec Corp.’s development strategy, operations and reform. The independent non-executive directors gave their independent opinions on matters such as connected transactions, dividend distributions and appointments of senior management as required by relevant rules and regulations, and maintained timely and effective communications with the executive directors, management, external auditors and the internal auditing department. The independent non-executive directors independently and objectively protected the legitimate interests of the Company and the shareholders, especially the minority shareholders, when performing their duties.
5 COMPANY’S INDEPENDENCE FROM CONTROLLING SHAREHOLDERThe Company is independent from its controlling shareholder in terms of, among other matters, business, assets and finances. The Company has a well-integrated independent business and independent operational capabilities.
6 COMPETITION BETWEEN SINOPEC CORP AND ITS CONTROLLING SHAREHOLDERPlease refer to “Performance of Undertaking by China Petrochemical Corporation” under the section “Significant Events” in this annual report for details.

44 CHINA PETROLEUM & CHEMICAL CORPORATIONAnnual Report 2016
CORPORATE GOVERNANCE (CONTINUED)
Cor
por
ate
Gov
erna
nce
7 IMPROVEMENT AND IMPLEMENTATION OF THE INTERNAL CONTROL SYSTEMFor details of internal control self-assessment and internal control auditing, please refer to the internal control assessment report and the internal control auditing report published by the Company on the same day of this annual report.
8 SENIOR MANAGEMENT APPRAISAL AND INCENTIVE SCHEMESSinopec Corp. has established and is continuously improving the fairness and transparency of its performance appraisal standards, its incentive schemes and requirements for directors, supervisors and other senior management. Sinopec Corp. has implemented a number of incentive schemes, including the Measures of Sinopec Corp. for the Implementation of Remuneration for Senior Managers, the Measures of Sinopec Corp. for the Management of Annual Performance Evaluations and the Measures of the Leadership of Companies Directly under Sinopec Corp. and the Headquarters Department for the Management of Performance Evaluation.
9 CORPORATE GOVERNANCE REPORT (IN ACCORDANCE WITH HONG KONG LISTING RULES)
(1) Compliance with the Corporate Governance CodeBased on its actual circumstances, Sinopec Corp. did not establish a Nomination Committee of the Board according to section A.5 of the Corporate Governance Code and Corporate Governance Report (Corporate Governance Code) as set out in Appendix 14 of the Hong Kong Listing Rules. Sinopec Corp. is of the view that the nomination of Director candidates by all members of the Board would be better suited in view of its actual situation. The board of directors of Sinopec Corp. (Board) would perform the duties of the Nomination Committee prescribed in the Corporate Governance Code.
Save as disclosed above, Sinopec Corp. complied with all code provisions set out in the Corporate Governance Code during the reporting period.
A Board of DirectorsA.1 Board of Directorsa. The Board is the decision-making
body of Sinopec Corp. and abides by good corporate governance practices and procedures. All decisions made by the Board are implemented by the Management of Sinopec Corp.
b. The meeting of the Board is held at least once a quarter. The Board will usually communicate the time and proposals of the Board meeting 14 days before convening of the meeting. The relevant documents and materials for Board meetings are usually sent to each Director 10 days in advance. In 2016, Sinopec Corp. held six Board meetings. For details about the attendance of each Director, please refer to the Report of the Board of Directors in this annual report.
c. Each Director of the Board may submit proposals to be included in the agenda of Board meetings, and each Director is entitled to request other related information.
d. The Board has reviewed and evaluated its performance in 2016 and is of the view that the Board made decisions in compliance with domestic and overseas regulatory authorities’ requirements and the Company’s internal rules; that the Board have received the suggestions from the Board of Supervisors and Management during its decision making process; and that the Board safeguarded the rights and interests of Sinopec Corp. and its shareholders.
e. The Secretary to the Board assists the Directors in handling the daily work of the Board, continuously informs the
Directors of any regulations, policies or other requirements of domestic or overseas regulatory bodies in relation to corporate governance and ensures that the Directors comply with domestic and overseas laws and regulations when performing their duties and responsibilities. Sinopec Corp. has purchased liability insurance for all Directors to minimise their risks that might incur, arising from the performance of their duties.
A.2 Chairman and Presidenta. Mr. Wang Yupu serves as
Chairman of the Board and Mr. Dai Houliang serves as Vice Chairman of the Board and President of Sinopec Corp. The Chairman of the Board is elected by a majority vote of all Directors, and the President is nominated and appointed by the Board. The main duties and responsibilities of the Chairman and the President are clearly distinguished from each other, and the scope of their respective duties and responsibilities are set out in the Articles of Association.
b. The Chairman of the Board places great emphasis on communication with the Independent Directors. The Chairman independently held two meetings with the Independent Directors in respect of development strategy, corporate governance and operational management, etc. of Sinopec Corp.
c. The Chairman encourages open and active discussions. Directors have spoken freely at the Board meetings and actively and deeply participated in the discussions of significant decision made by the Board in the Board meetings.
45CHINA PETROLEUM & CHEMICAL CORPORATION Annual Report 2016
Cor
por
ate
Gov
erna
nce
A.3 Board compositiona. The Board consists of ten
members (please refer to the Directors, Supervisors, Other Senior Management and Employees in this annual report), of which, five are Executive Directors; five are Non-executive Directors (including 4 Independent Non-executive Directors, which represent more than one-third of the Board). The Board has a fairly good diversity. The Chairman and Executive Directors of Sinopec Corp. have petroleum and petrochemical technical background and/or extensive management experience in large-scale enterprises. The Independent Non-executive Directors have rich experience in economics, capital management and investment.
b. Sinopec Corp. has received from each of the Independent Directors a letter of confirmation for 2016 regarding their compliance with relevant independence requirements set out in Rule 3.13 of the Hong Kong Listing Rules. Sinopec Corp. considers that each of the Independent Non-executive Directors is independent.
A.4 Appointment, re-election and dismissala. The term of each session of the
Directors of Sinopec Corp. is three years, and the consecutive term of office of an Independent Non-executive Director cannot exceed six years.
b. All Directors of Sinopec Corp. have been elected at the general meeting of shareholders. The Board has no power to appoint temporary Directors.
c. Sinopec Corp. engages professional consultants to prepare detailed materials for
newly appointed Directors, to notify them of the regulations of each listing place of Sinopec Corp. and to remind them of their rights, responsibilities and obligations as Directors.
A.5 Nomination Committeea. Considering that the Board
did not establish a Nomination Committee, the Board will perform the duties of the Nomination Committee prescribed in the Corporate Governance Code. The rules in relation to the nomination of Directors has been prescribed clearly in the Articles of Association and Rules of Procedure for the Shareholders’ Meeting. Nomination of Directors may be proposed by shareholders who individually or collectively hold 3% of the total voting shares of Sinopec Corp. (1% for the nomination of Independent Directors), by the Board or by the Board of Supervisors for approval at the general meeting of shareholders. When the Board nominates a candidate for Director, Independent Non-executive Directors shall give their independent opinions on the nomination in advance. Nine out of total ten Directors of the Board were elected at the annual general meeting of shareholders for the year 2014; one was elected at the first extraordinary general meeting of shareholders for the year 2016.
b. The Board establishes the Policy Concerning Diversity of Board Members which stipulates that the members of the Board shall be nominated and appointed based on the skills and experience required by the Board as well as the principles on diversity of the Board. When deciding the composition of the Board, Sinopec
Corp. shall consider several factors in relation to the diversity of the Board, including but not limited to, gender, age, culture and background of education, locations, profession and experience, skills, knowledge and service term.
A.6 Responsibility of Directorsa. All Non-executive Directors have
the same duties and powers as the Executive Directors. In addition, the Independent Non-executive Directors are entitled to certain specific powers. The Articles of Association and the Rules of Procedure for Meetings of Boards of Directors clearly prescribe the duties and powers of Directors, Non-executive Directors including Independent Non-executive Directors. The above duties and powers are published on the Sinopec Corp.’s website at http://www.sinopec.com.
b. Each of the Directors was able to devote sufficient time and effort to handling the matters of Sinopec Corp.
c. Each of the Directors confirmed that he has complied with the Model Code for Securities and Transactions by Directors of Listed Companies during the reporting period. In addition, Sinopec Corp. formulated the Rules Governing Shares Held by Company Directors, Supervisors and Senior Managers and Changes in Shares and the Model Code of Securities Transactions by Company Employees to regulate the purchase and sale of Sinopec Corp.’s securities by relevant personnel.

46 CHINA PETROLEUM & CHEMICAL CORPORATIONAnnual Report 2016
CORPORATE GOVERNANCE (CONTINUED)
Cor
por
ate
Gov
erna
nce
d. Sinopec Corp. organised and arranged training sessions for Directors and paid the relevant fees. The Directors actively participated in the trainings and continuing professional development program.
A.7 Provision of and access to informationa. The agenda and other reference
documents for meetings of the Board and Board committees will be distributed prior to the meetings to give each Director sufficient time to review the materials so that Directors can make informed decisions.
b. Each Director can obtain all related information in a comprehensive and timely manner. The Secretary to the Board is responsible for organising and preparing the materials for the Board meetings, including preparation of explanations for each proposal to ensure fully understanding by the Directors. The Management is responsible for providing the Directors with necessary information and materials. The Director may ask the Management, or ask, via the Management, relevant departments to provide necessary information or explanations. The Directors may seek advices from professional consultants when necessary.
B Remuneration and Appraisal Committeea. Remuneration and Appraisal
Committee (Remuneration Committee) consists of Independent Non-executive Director Mr. Fan Gang, who serves as the Chairman, and the Vice Chairman of the Board & President Mr. Dai Houliang and Independent Non-executive Director Mr. Jiang Xiaoming, who serve as the members of the Remuneration Committee. The Remuneration
Committee is responsible for reviewing the implementation of the annual remuneration plans for Directors. Supervisors and other senior Management as approved at the general meeting of the shareholders, and report to the Board.
b. The Remuneration Committee always consults the Chairman of the Board and the President about the remuneration plans for other Executive Directors. After the Remuneration Committee’s review, it is of the view that all the Executive Directors of Sinopec Corp. have fulfilled the duty clauses in the service contracts of the Directors in 2016.
c. The members of the Remuneration Committee may engage independent professionals when performing its duties. Reasonable costs arising from such consultations are borne by Sinopec Corp. In the meantime, the Remuneration Committee has also appointed consultants to provide advices. The working expenses of the Remuneration Committee are included in the budget of Sinopec Corp. According to the policies of Sinopec Corp., the senior Management and relevant departments of Sinopec Corp. must actively cooperate with the Remuneration Committee.
C Accountability and AuditingC.1 Financial reporting
a. Directors are responsible for supervising the preparation of accounts for each fiscal period to ensure that the accounts truly and fairly reflect the condition of the business, its performance and the cash flow of the Company during the period. The Board approved the Financial Report for 2016 and warranted that the annual report contained no false representations, no material omissions or misleading statements and jointly and severally accepted full responsibility for the authenticity, accuracy and completeness of the content.
b. Sinopec Corp. provides Directors with information about the financial, production and operating status of the Company every month to ensure that the Directors can learn about the latest developments of the Company in a timely manner.
c. Sinopec Corp. has adopted an internal control mechanism to ensure that the Management and relevant departments have provided the Board and the Audit Committee with sufficient financial data and related explanations and materials.
d. The external auditors of Sinopec Corp. made a statement about their reporting responsibilities in the auditor’s report contained in the financial report.
C.2 Internal Control and Risk Managementa. Sinopec Corp. has formulated
and implemented its internal control and risk management system. The Board as a decision-making body is responsible for evaluating and review the effectiveness of its internal control and risk management. The Board and Audit Committee periodically (at least annually) receive reports of the Company regarding internal control and risk management information from the Management. All major internal control and risk management issues are reported to the Board and Audit Committee. Sinopec Corp. has set up its internal control and risk management department and internal auditing departments, which are equipped with sufficient staff, and these departments periodically (at least twice per year) report to the Audit Committee. The internal control and risk management system of the Company are designed to manage rather than eliminate all the risks of the Company.
47CHINA PETROLEUM & CHEMICAL CORPORATION Annual Report 2016
Cor
por
ate
Gov
erna
nce
b. In terms of internal control, Sinopec Corp. adopted the internal control framework prescribed in the internationally accepted Committee of Sponsoring Organizations of the Treadway Commission Report (COSO). Based upon the Articles of Association and the applicable management policies currently in effect, as well as in accordance with relevant domestic and overseas applicable regulations, Sinopec Corp. formulated and continuously improves the Internal Control Manual to achieve internal control of all factors of internal environment, risk evaluation, control activities, information and communication, and internal supervision. At the same time, Sinopec Corp. has constantly supervised and evaluate its internal control, and conducted comprehensive and multi-level checks including regular test, enterprise self-examination and auditing check, and subsumed headquarters, branches and subsidiaries into the scope of internal control evaluation, with an internal control evaluation report being produced. The Board annually review the internal control evaluation report. For detailed information about the internal control during the reporting period, please refer to the report on internal control prepared by Sinopec Corp.
Sinopec Corp. has formulated and implemented its information disclosure policy and insider information registration policy. The corporation regularly evaluates the policy implementation and makes disclosure in accordance with relevant regulations. Please refer to the website of Sinopec Corp. for the details of the information disclosure policy
c. In terms of risk management, Sinopec Corp. adopted the enterprise risk management framework provided by COSO, and established its risk management policy and risk management organisation system. The Company annually conducts risk evaluation to identify major and important risks and perform risk management duties. It has designed major and important risks tackling measures combined with its internal control system and periodically monitor their implementation to ensure adequate care, monitor and tackling of major risks.
d. Based upon the review and evaluation of internal control and risk management of the reporting period, the Board is of the view that the internal control and risk management of the Company are effective.
C.3 Audit Committeea. The Board has established
an Audit Committee. The Audit Committee consists of Independent Non-executive Director Mr. Andrew Y. Yan, who serves as the Chairman, and Independent Non-executive Director Mr. Jiang Xiaoming and Independent Non-executive Director Mr. Tang Min, who serve as members. As verified, none of them has served as a partner or a former partner in our current auditing firm.
b. During the reporting period, the Audit Committee held four meetings. (please refer to the section Meetings held by the special committees of the Board under the Report of the Board of Directors in this annual report) The review opinions were issued at the meetings and submitted to the Board after signed by the
members of the Audit Committee. During the reporting period, the Board and the Audit Committee had no disagreement.
c. Audit Committee members may engage independent professionals when performing its duties. Reasonable costs arising from such consultations are borne by Sinopec Corp. In the meantime, the Audit Committee has appointed consultants to provide advices. The working expenses of the Audit Committee are included in the budget of Sinopec Corp. In accordance with the policies of Sinopec Corp., the senior Management and relevant departments of Sinopec Corp. must actively cooperate with the Audit Committee.
d. The Audit Committee held two meetings with auditors without the presence of Sinopec Corp.’s Management to discuss the auditing of financial reports and the auditing fee for the year. The Audit Committee has reviewed the adequacy of the resources for accounting and financial reporting and the qualifications and experience of the employees as well as the sufficiency of the training courses provided to relevant employees. Audit Committee is of the view that the Management has fulfilled the duties to establish an effective internal control system. The Company established a whistle-blowing policy in its internal control system, providing several channels as online reporting, letter reporting, receipt of appeals and a complaint mailbox,etc. to employees to report behavior that violates the internal control system of the Company. The Audit Committee has reviewed and approved such policy.
48 CHINA PETROLEUM & CHEMICAL CORPORATIONAnnual Report 2016
CORPORATE GOVERNANCE (CONTINUED)
Cor
por
ate
Gov
erna
nce
D Delegation of power by the Boarda. The Board and the Management have
clear terms of reference in writing. The Articles of Association and the Rules of Procedure for the General Meetings of Shareholders and the Rules of Procedure for Meetings of Boards of Directors clearly set forth the scope of duties, powers and delegation of power of the Board and Management, which are published on the website of Sinopec Corp. at http://www.sinopec.com.
b. In addition to the Audit Committee and the Remuneration Committee, the Board had established the Strategy Committee and the Social Responsibility Management Committee. The Strategy Committee is responsible for overseeing long-term development strategies and significant investment decisions of the Company. The Strategy Committee consists of eight directors, including Chairman of the Board Mr. Wang Yupu, who serves as Chairman, as well as Vice Chairman of the Board & President Mr. Dai Houliang, Executive Director Mr. Wang Zhigang,Mr. Zhang Haichao, Mr. Jiao Fangzheng, Mr. Ma Yongsheng and Independent Non-executive Directors Mr. Andrew Y. Yan and Mr. Fan Gang, who serve as members. The Social Responsibility Management is responsible for preparing policies, governance, strategies and plans for social responsibility management of the Company. The Social Responsibility Management Committee consists of three Directors, including Chairman of the Board Mr. Wang Yupu, who serves as Chairman, Vice Chairman of the Board & President Mr. Dai Houliang and Independent Non-executive Director Mr. Tang Min, who serve as members.
c. Each Board Committee is required to report its decisions and
recommendations to the Board. The terms of reference of the Audit Committee and the Remuneration Committee are published on the website of Sinopec Corp. at http://www.sinopec.com.
E Investor Relationsa. Sinopec Corp. pays close attention
to investor relations. The Chairman of the Board, President and Chief Financial Officer conduct road shows every year to answer questions on subjects of concern to investors, such as development strategies and the production and business performance of the Company. Sinopec Corp. established a department responsible for communicating with investors. In compliance with regulatory provisions, Sinopec Corp. enhanced communication with investors by holding meetings with institutional investors, setting up an investor hotline and communicating through internet platform.
b. During the reporting period, separate resolution was proposed for each substantially separate issue at the general meeting. All resolutions were voted by poll to ensure the interests of all shareholders. Notices of the general meeting of shareholders were dispatched to shareholders 45 days (excluding the date of the general meeting) in advance.
c. During the reporting period, the Chairman of the Board did not attend the annual general meeting for the year 2015 due to other business arrangement. As recommended by more than half number of Directors, the then Director & President Mr. Li Chunguang hosted the annual general meeting for the year 2015 and arranged the members of the Board and senior Management to attend the meeting and communicate with the investors extensively.
F Company Secretarya. The Hong Kong Stock Exchange
recognised the Secretary to the Board as having the relevant qualifications as company Secretary. Nominated by the Chairman of the Board and appointed by the Board, the Secretary to the Board is the Senior Management Officer of Sinopec Corp. and responsible for the Company and the Board. The Secretary gives opinions on corporate governance to the Board and arranges orientation training and professional development for the Directors.
b. During the reporting period, the Secretary to the Board actively participated in career development training with more than 15 training hours.
G Shareholders’ rightsa. Shareholders who individually or
collectively hold 10% of the total voting shares of Sinopec Corp. may request the Board in writing to convene the general meeting of shareholders. If the Board fails to grant the request to convene the meeting according to the Rules of Procedure for Meetings of Boards of Directors, the shareholders may convene and hold the meeting at their discretion according to applicable laws, and reasonable expenses incurred will be borne by Sinopec Corp. These provisions are subject to the following conditions: the proposals at the general meeting of shareholders must fall within the responsibilities of the general meeting of shareholders, with specific proposals and resolutions and in compliance with relevant laws, administrative regulations and the Articles of Association.
49CHINA PETROLEUM & CHEMICAL CORPORATION Annual Report 2016
Cor
por
ate
Gov
erna
nce
b. When Sinopec Corp. holds the general meeting of shareholders, shareholders who individually or collectively hold 3% of the total voting shares of Sinopec Corp. may propose a supplementary proposal 10 days before the date of the general meeting.
c. The eligibility for attending the general meeting, the rights of shareholders, the proposals at the meeting and the voting procedures are clearly stated in the notice of the general meeting of Sinopec Corp. dispatched to the shareholders.
d. According to relevant rules of Sinopec Corp., the Board Secretary is responsible for establishing an effective communication channel between Sinopec Corp. and its shareholders, for setting up special departments to communicate with the shareholders and for passing the opinions and proposals of the shareholders to the Board and Management in a timely manner. Contact details of Sinopec Corp. can be found on the Investor Center page on Sinopec Corp’s website.
(2) AuditorsThe appointment of PricewaterhouseCoopers Zhong Tian LLP and PricewaterhouseCoopers as Sinopec Corp.’s external auditors for 2016 and the authorisation of the Board to determine their remuneration were
approved at Sinopec Corp.’s annual general meeting for the year 2015 on 18 May 2016. The audit fee for 2016 is RMB 51.58 million (including audit fee of internal control), which was approved at the 12th meeting of the sixth session of the Board. The annual financial statements have been audited by PricewaterhouseCoopers Zhong Tian LLP and PricewaterhouseCoopers. The Chinese certified accountants signing the report are Zhao Jianrong and Gao Peng from PricewaterhouseCoopers Zhong Tian LLP.
During the reporting period, neither PricewaterhouseCoopers Zhong Tian LLP nor PricewaterhouseCoopers provided any non-audit service to the Company.
(3) Other information about Sinopec Corp.’s corporate governanceExcept for their working relationships with Sinopec Corp., none of the Directors, Supervisors or other Senior Management has any financial, business or family relationship or any relationship in other material aspects with one another. For information about changes in share capital and shareholdings of substantial shareholders, please refer to page 6 to page 7; for information about meetings of the Board, please refer to page 51; for information about equity interests of Directors, Supervisors and other senior Management, please refer to page 43; for information about the biographies and annual remuneration of Directors, Supervisors and other senior Management, please refer to page 60 to page 71.
50 CHINA PETROLEUM & CHEMICAL CORPORATIONAnnual Report 2016
REPORT OF THE BOARD OF DIRECTORSR
epor
t of
the
Boa
rd o
f D
irec
tors
The Board is pleased to present the directors’ report for the year ended 31 December 2016 for shareholders’ review.
1 MEETINGS OF THE BOARDDuring this reporting period, Sinopec Corp. held six(6)Board meetings. The details are as follows:
(1) The 5th meeting of the six session of the Board was held by on site and video conference on 29 March 2016, whereby the proposals in relation to the following matters were approved: (i) Work Report of the Board, (ii) Business performance of 2015 and work plan of 2016, (iii) Financial results and business performance of Sinopec Corp. for the year 2015, (iv) 2015 Communication on Progress for Sustainable Development Report of Sinopec Corp., (v) Financial Statements of Sinopec Corp. for the year 2015, (vi) Annual Report and form 20F of Sinopec Corp. for the year 2015, (vii) Internal control assessment report of Sinopec Corp. for the year 2015, (viii)Re-appointment of external auditors of Sinopec Corp. for the year of 2016 and to authorise the Board to determine their remunerations, (ix) Elected Mr Ma Yongsheng as member of Strategy Committee, (x) Authorising the Board to determine the interim profit distribution plan of Sinopec Corp. for the year 2016, (xi) Authorising the Board to determine the proposed plan for issuance of debt financing instrument(s) (xii) Granting to the Board a general mandate to issue new domestic shares and/or overseas-
listed foreign shares of Sinopec Corp., (xiii) Convening the annual general meeting of Sinopec Corp. for the year 2015 and to dispatch the notice of the annual general meeting.
(2) The 6th meeting of the six session of the Board was held by written resolution on 28 April 2016, whereby the proposal in relation to the first quarterly results of Sinopec Corp. for the three months ended 31 March 2016 was approved in the meeting.
(3) The 7th meeting of the six session of the Board was held by written resolution on 28 April 2016, whereby the proposal in relation to the capital injection into Sichuan-to-East China Pipeline Co. was approved.
(4) The 8th meeting of the sixth session of the Board was held by on site meeting on 26 August 2016, whereby the proposals in relation to the following matters were approved: (i) Nomitating and Appointing Mr.Dai Houliang as President of Sinopec Corp. (ii) Elected Mr.Dai Houliang as the Vice Chairman of the Board, (iii) The adjustment of members of the Board committees including Strategy Committee, Remuneration Committee and Social Responsibility Management Committee, (iv) Business performance of the first half year of 2016 and work plan of the latter half year of 2016 (v) Business performance, financial information and other related matters of Sinopec Corp. for the first half year 2016, (vi) Interim Financial statements
of Sinopec Corp. for the year 2016. (vii)Interim Report of Sinopec Corp. for the year 2016. (viii) the thirteenth five years plan summary of Sinopec corp.
(5) The 9th meeting of the six session of the Board was held by written resolution on 28 September 2016, whereby the proposal in relation to the appointment of Mr. Wang Dehua to be the chief financial officer of Sinopec Corp. was approved.
(6) The 10th meeting of the six session of the Board was held by written resolution on 27 October 2016, whereby the proposal in relation to the third quarterly results of Sinopec Corp. for the nine months ended 30 September 2016 was approved in the meeting.
For details of each meeting, please refer to the announcements published in China Securities Journal, Shanghai Securities News and Securities Times on the next working day after each meeting and on the websites of Shanghai Stock Exchange, Hong Kong Stock Exchange and Sinopec Corp.
2 IMPLEMENTATION OF RESOLUTIONS APPROVED AT THE GENERAL MEETINGS OF SHAREHOLDERS BY THE BOARDDuring this reporting period, in accordance with relevant laws and regulations as well as the articles of association, all members of the Board diligently implemented the resolutions approved at the general meetings of Sinopec Corp., and have completed various tasks delegated to them at the general meetings.
51CHINA PETROLEUM & CHEMICAL CORPORATION Annual Report 2016
Rep
ort
of t
he B
oard
of
Dir
ecto
rs
3 ATTENDANCE TO THE BOARD MEETINGS
The sixth session of the Board Directors’ attendance to the Board Meeting and the General Meetings.
Director Titles Names Board MeetingsNo. of
meeting heldActual
AttendenceAttended By
communicationAttended by proxy Absent
Chairman Wang Yupu 6 6 4 0 0Vice Chairman Dai Houliang 6 6 4 0 0Director Wang Zhigang 6 6 4 0 0Director Zhang Haichao 6 6 4 0 0Director Jiao Fangzheng 6 6 4 0 0Director Ma Yongsheng 6 6 4 0 0Independent Director Jiang Xiaoming 6 5 4 1 0Independent Director Andrew Y. Yan 6 6 5 0 0Independent Director Tang Min 6 6 4 0 0Independent Director Fan Gang 6 6 4 0 0
Director Titles Names Board Meetings*1
No. of meeting held
Actual Attendence
Attended By communication
Attended by proxy Absent
Former Director Li Chunguang 4 4 0 0 0Former Director Zhang Jianhua 2 1 0 1 0
1. Mr. Li Chunguang has resigned as director of the Board on 26 Aug 2016.2. Mr. Zhang Jianhua has resigned as director of the Board on 13 Jul 2016.
No directors were absent from two consecutive meetings of the Board. No Independent Non-executive Directors had attended the general meetings of shareholders in person.
4 MEETINGS HELD BY THE BOARD COMMITTEESDuring the reporting period, the Audit Committee held four (4) meetings. Strategy Committee held two (2) meetings, and each of the remuneration Committee and the Social Responsibility Management Committee held one(1) meeting. All members of each committee had attended the meetings. Details of those meetings are as follows:
(1) The 3rd Audit Committee meeting of the sixth session of the Board was held by on site meeting on 25 March 2016, whereby the proposal in relation to the following matters were approved in the meeting: (i) 2015 Annual Report; (ii) 20F of 2015 (iii) Financial results and business performance of Sinopec Corp. for the year 2015 (iv) Internal control assessment report of Sinopec Corp. for the year 2015 and the internal control manual (2016) (v) Work report on the internal auditing work for the year 2015, (vi) Performance report of Audit Committee for the year 2015, (vii) Reports on the auditing of the financial statements for the year 2015 delivered by the domestic and overseas auditors.
(2) The 4th meeting of the sixth session of the Board was held by written resolution on 27 April 2016, whereby the first quarterly report for three months ended 31 March 2016 was approved in the meeting.
(3) The 5th meeting of the sixth session of the Audit Committee was held by on site meeting on 22 August 2016, whereby (i) Interim report for the first half of 2016, (ii) Financial statements for the first half year of 2016, (iii) Reports on internal auditing work for the first half of 2016 were approved in the meeting.
(4) The 6th meeting of the sixth session of the Audit Committee was held by written resolution on 26 October 2016, whereby the third quarterly report for nine months ended 30 September 2016 was approved in the meeting.
(5) The 1st meeting of the sixth session of the Strategy Committee was held by written resolution on 25 March 2016, whereby the proposal in relation to the plan of investments of 2016 was approved in the meeting.
(6) The 2nd meeting of the sixth session of the Strategy Committee was held by written resolution on 24 August 2016, whereby the thirteenth five years plan summary of Sinopec corp. was approved in the meeting.
(7) The 1st meeting of the sixth session of the remuneration Committee was held by written resolution on 25 March 2016, whereby the proposal in relation to implementation of the rules of the remuneration of directors, supervisors and other senior management for 2015 was reviewed and approved.
(8) The 1st meeting of the sixth session of the Social Responsibility Management Committee was held by on site meeting on 25 March 2016, whereby the 2015 Communication on Progress for the Sustainable Development Report of Sinopec Corp. was approved in the meeting.
52 CHINA PETROLEUM & CHEMICAL CORPORATIONAnnual Report 2016
REPORT OF THE BOARD OF DIRECTORS (CONTINUED)
Rep
ort
of t
he B
oard
of
Dir
ecto
rs
5 BOARD COMMITTEES ISSUED REVIEW OPINIONS TO THE BOARD WHEN PERFORMING THEIR DUTIES DURING THE REPORT PERIOD, WITHOUT OBJECTION.
6 BUSINESS PERFORMANCEThe financial results of the Company for the year ended 31 December 2016, which is prepared in accordance with IFRS and the financial position as at that date and the accompanying analysis are set out from page 143 to page 201 in this annual report. A fair review of the Company’s business, a discussions and analysis on business performance using financial key performance indicators and the material factors underlying our results and financial position during the reporting period, particulars of significant events affecting the Company and the outlook of the Company’s business are discussed throughout this annual report included in the chapters of Chairman’s Statement, Business Review and Prospects, Management’s Discussion and Analysis and Significant Events. All above discussions constitute parts of the report of the Board of Directors.
7 DIVIDENDThe profit distribution policy of Sinopec Corp. maintains consistency and steadiness, and gives further consideration to the long-term interests of the Company, overall interests of all the shareholders and the sustainable development of the Company. Sinopec Corp. gives priority to adopting cash dividends for profit distribution, and is able to deliver an interim profit distribution. When the net profits and retained earnings of the Company are positive in current year, and in the event that the cash flow of Sinopec Corp. can satisfy the normal operation and sustainable development, Sinopec Corp. should adopt cash dividends, and the distribution profits in cash every year are no less than 30% of the net profits of the Company in current year.
The profit distribution plan of Sinopec Corp. for the current year will be carried out in accordance with the policy and procedures stipulated as per the Articles of Association, with the advice of minority shareholders being heard and considered, meanwhile, the independent directors will issue independent opinions.
Proposals for dividend distributionAt the 12th meeting of the sixth session of the Board, the Board approved the proposal to distribute a final cash dividend of RMB 0.17 (tax inclusive) per share, combining with an interim distributed dividend of RMB0.079 (tax inclusive) per share, the total dividend for the whole year is RMB 0.249 (tax included) per share.
The dividend will be denominated and declared in RMB, and distributed to the domestic shareholders and investors participating in the Shanghai-Hong Kong Stock Connect Program in RMB and to the overseas shareholders in Hong Kong Dollar. The exchange rate for the dividend calculation in Hong Kong Dollar is based on the average benchmark exchange rate of RMB against Hong Kong Dollar as published by the People’s Bank of China one week preceding the date of the declaration of such dividend. The arrangement of the payment of the final dividend will be published in due course.
In accordance with the Enterprise Income Tax Law of the People’s Republic of China which came into effect on 1 January 2008 and its implementation regulations, Sinopec Corp. is required to withhold and pay enterprise income tax at the rate of 10% on behalf of the non-resident enterprise shareholders whose names appear on the register of members for H Shares of Sinopec Corp. when distributing cash dividends or issuing bonus shares by way of capitalisation from retained earnings. Any H Shares of the Sinopec Corp. which is not registered under the name of an individual shareholder, including those registered under HKSCC Nominees Limited, other nominees, agents or trustees, or other organizations or groups, shall be deemed as shares held by nonresident enterprise shareholders. Therefore, on this basis, enterprise income tax shall be withheld from dividends payable to such shareholders. If holders of H Shares intend to change its shareholder status, please enquire about the relevant procedures with your agents or trustees. Sinopec Corp. will strictly comply with the law or the requirements of the relevant government authority to withhold and pay enterprise income tax on behalf of the relevant shareholders based on the registration of members for H shares of Sinopec Corp. as at the record date.
If the individual holders of the H shares who are Hong Kong or Macau residents or residents of the countries which had an agreed tax rate of 10% for the cash dividends or bonus shares by way of capitalisation from retained earnings with China under the relevant tax agreement, Sinopec Corp. should withhold and pay individual income tax on behalf of the relevant shareholders at a rate of 10%. Should the individual holders of the H Shares are residents of the countries which had an agreed tax rate of less than 10% with China under the relevant tax agreement, Sinopec Corp. shall withhold and pay individual income tax on behalf of the relevant shareholders at a rate of 10%. In that case, if the relevant individual holders of the H Shares wish to reclaim the extra amount withheld (Extra Amount) due to the application of 10% tax rate, Sinopec Corp. would apply for the relevant agreed preferential tax treatment provided that the relevant shareholders submit the evidence required by the notice of the tax agreement to the share register of Sinopec Corp. in a timely manner. Sinopec Corp. will assist with the tax refund after the approval of the competent tax authority. Should the individual holders of the H Shares are residents of the countries which had an agreed tax rate of over 10% but less than 20% with China under the tax agreement, Sinopec Corp. shall withhold and pay the individual income tax at the agreed actual rate in accordance with the relevant tax agreement. In the case that the individual holders of the H Shares are residents of the countries which had an agreed tax rate of 20% with China, or which has not entered into any tax agreement with China, or otherwise, Sinopec Corp. shall withhold and pay the individual income tax at a rate of 20%
Pursuant to the Notice on the Tax Policies Related to the Pilot Program of the Shanghai-Hong Kong Stock Connect (關於滬港股票市場交易互聯互通機制試點有關稅收政策
的通知) (Caishui [2014] No. 81):
For domestic investors investing in the H Shares of Sinopec Corp. through Shanghai-Hong Kong Stock Connect Program, the company shall withhold and pay income tax at the rate of 20% on behalf of individual investors and securities investment funds. The company will not withhold or pay the income tax of dividends for domestic enterprise investors and those domestic enterprise investors shall report and pay the relevant tax by themselves.
53CHINA PETROLEUM & CHEMICAL CORPORATION Annual Report 2016
Rep
ort
of t
he B
oard
of
Dir
ecto
rs
For investors of the Hong Kong Stock Exchange (including enterprises and individuals) investing in the A Shares of Sinopec Corp. through Shanghai-Hong Kong Stock Connect Program, the Company will withhold and pay income taxes at the rate of 10% on behalf of those investors and will report to the tax authorities for the withholding. For investors who are tax residents of other countries, whose country of domicile is a country having entered into a tax treaty with the PRC stipulating a dividend tax rate of lower than 10%, the enterprises and individuals may, or may entrust a withholding agent to, apply to the competent tax authorities for the entitlement of the rate under such tax treaty. Upon approval by the tax authorities, the amount paid in excess of the tax payable based on the tax rate according to such tax treaty will be refunded.
The dividend distribution and bonus shares declared by Sinopec Corp. in the past three years are as follows:
2016* 2015 2014
Cash dividends (RMB/Share, tax inclusive) 0.249 0.15 0.20Total amount of cash dividends (RMB million, tax inclusive) 30,147 18,160 23,830Net profits attributed to the shareholders of the listed company shown in the consolidated statement for the dividend year (RMB million) 46,416 32,281 47,603Ratio between the dividends and the net profit attributed to the shareholders of the listed company in the consolidated statement (%) 64.95 56.26 50.06
*: The final cash dividend for 2016 is subject to approval at the 2016 annual general meeting.
The aggregate cash dividend declared by Sinopec Corp. during three years from 2014 to 2016 is RMB 0.599 per share, and the total dividend payment from 2014 to 2016 as a percentage of average net profits in the three years is 171.35%.
8 RESPONSIBILITIES FOR THE COMPANY’S INTERNAL CONTROLThe Board is fully responsible for establishing and maintaining the internal control system related to the financial statements as well as ensuring its effective implementation. In 2016, the Board assessed and evaluated the internal control of Sinopec Corp. according to the Basic Standard for Enterprise Internal Control, Application Guidelines for Enterprise Internal Control and Estimation Guidelines for Enterprise Internal Control. There were no significant defects in relation to the internal control system related to the financial statements as of 31 December 2016. Therefore the internal control system of Sinopec Corp. related to the financial statements is sound and effective.
The 2016 Annual Internal Control Assessment Report of Sinopec Corp. was
reviewed and approved on the 12th meeting of the sixth Session of the Board on 24 March 2017, and all members of the Board undertook that the contents of the report are true, accurate and complete, and without any false representation, misleading statements or material omissions.
9 DURING THIS REPORTING PERIOD, THE COMPANY DID NOT VIOLATE ENVIRONMENTAL POLICIESDetails with regard to the Company’s performance in relation to environmental and social-related key performance indicators and policies, are provided in the Chapters of Chairman’s Statement and Business Review and Prospects in this annual report as well as the 2016 Communication on Progress for the Sustainable Development Report of Sinopec Corp. All these discussions in regard to environmental policies constitute part of the Report of the Board of Directors.
10 DURING THIS REPORTING PERIOD, THE COMPANY DID NOT VIOLATE LAWS AND REGULATIONS WHICH HAVE A SIGNIFICANT IMPACT ON THE COMPANY
11 MAJOR SUPPLIERS AND CUSTOMERSDuring this reporting period, the total purchases from the top five crude oil suppliers of the Company accounted for 56.6% of the total purchases of crude oil by the Company, of which the purchases from the largest supplier accounted for 18.7% of the total purchases of crude oil by the Company.
The total sales to the five largest customers of the Company accounted for 7.4% of the total sales of the Company, of which sales to the largest customer accounted for 3.0% of the total sales. Sinopec Group, the controlling shareholder of Sinopec Crop., is one of the five largest customers.
During the reporting period, other than disclosed above, all the top five crude oil suppliers and the other largest customers of the Company were independent third parties. There were no supplier, customer, employee and others that have a significant impact on the Company and on which the Company’s success depends.
54 CHINA PETROLEUM & CHEMICAL CORPORATIONAnnual Report 2016
REPORT OF THE BOARD OF DIRECTORS (CONTINUED)
Rep
ort
of t
he B
oard
of
Dir
ecto
rs
12 BANK LOANS AND OTHER BORROWINGSDetails of bank loans and other borrowings of Sinopec Corp. as of 31 December 2016 are set out in Note 28 to the financial statements prepared in accordance with IFRS in this annual report.
13 FIXED ASSETSDuring this reporting period, changes to the fixed assets of Sinopec Corp. are set out in Note 16 to the financial statements prepared in accordance with IFRS in this annual report.
14 RESERVESDuring this reporting period, the changes to the reserves of Sinopec Corp. are set out in the consolidated statement of changes in shareholders’ equity in the financial statements prepared in accordance with IFRS in this annual report.
15 DONATIONSDuring this reporting period, the amount of charity donations made by Sinopec Corp. amounted to RMB 133 million.
16 PRE-EMPTIVE RIGHTSPursuant to the Articles of Association and the laws of the PRC, the shareholders of Sinopec Corp. are not entitled to any pre-emptive rights; therefore the existing shareholders cannot request Sinopec Corp. for the right of first refusal in proportion to their shareholdings.
17 REPURCHASE, SALES AND REDEMPTION OF SHARESDuring this reporting period, neither Sinopec Corp. nor any of its subsidiaries repurchased, sold or redeemed any listed shares of Sinopec Corp. or its subsidiaries.
18 DIRECTORS’ INTERESTS IN COMPETING BUSINESSDuring the reporting period, the competing businesses in chemicals segment between Sinopec Group and the Company were solved. For details for the positions held by the directors of Sinopec Corp. (excluding independent non-executive directors), please refer to the chapter Directors, Supervisors, Senior Management and Employees of this annual report.
19 DIRECTORS’ INTERESTS IN CONTRACTSNo Director had a material interest, either directly or indirectly, in any contract of significance to the business of the Company to which Sinopec Corp. or any of its holding companies, subsidiaries or fellow subsidiaries was a party during the reporting period.
20 MANAGEMENT CONTRACTSNo contracts concerning management or administration of the whole or any substantial part of the business of the Company were entered into or existed during the reporting period.
21PERMITTED INDEMNITY PROVISIONSDuring the reporting period, Sinopec Corp. has purchased liability insurance for all directors to minimise their risks arising from the performance of their duties. The permitted indemnity provisions are provided in such directors liability insurance in respect of potential liability and costs associated with legal proceedings that may be brought against such directors.
22 EQUITY-LINKED AGREEMENTS
For the reporting period, the Company has not entered into any equity-linked agreement.
23 OIL & GAS RESERVE APPRAISAL PRINCIPLES
We manage our reserves estimation through a two-tier management system. Our Oil and Natural Gas Reserves Management Committee, or RMC, at the headquarters level oversees the overall reserves estimation process and reviews the reserves estimation of our company. Each of our branches has a reserves management committee that manages the reserves estimation process and reviews the reserve estimation report at the branch level.
Our RMC is led by a couple of senior vice presidents, as well as experts and directors general of Sinopec’s exploration and production segment. Mr. Wang Zhigang, the chairman of RMC holds a Ph.D. in geology from the Geology and Geophysics Research Institute of the Chinese Academy of Sciences and has over 30 years of experience in the oil and gas industry. Our RMC also includes other members who are senior managers in charge of exploration and development activities at the production bureau level. A majority of our RMC members hold doctorates or master’s degrees, and our members have an average of 20 years of technical experience in relevant professional fields, such as geology, engineering and economics.
55CHINA PETROLEUM & CHEMICAL CORPORATION Annual Report 2016
Rep
ort
of t
he B
oard
of
Dir
ecto
rs
Our reserves estimates are guided by procedural manuals and technical experts. A number of working divisions at the production bureau level, including the exploration, development, financial and legal divisions, are responsible for initial collection and compilation of information about reserves. Exploration and development division collectively prepares the initial report on the reserves estimate. Together with technical experts, reserves management committees at the subsidiary level then review the report to ensure qualitative and quantitative compliance with technical guidance and the accuracy and reasonableness of the reserves estimation. At corporate level, the RMC is primarily responsible for the management and coordination of the reserves estimation process, review and approval of annual changes and results in the reserves estimate, and disclosure of our proved reserves. We also engage outside consultants to assist in our compliance with the rules and regulations of the U.S. Securities and Exchange Commission. Our reserves estimation process is further facilitated by a specialised reserves database, which is improved and updated periodically.
24 CORE COMPETITIVENESS ANALYSISThe Company is a large scale integrated energy and petrochemical company with upstream, mid-stream and downstream operations. The Company is a large scaled oil and gas producer in China; in respect of refining capacity, it ranks first in China; equipped with a well-developed refined oil products sales network, the Company is the largest supplier of refined oil products in China; and in terms of ethylene production capacity, the Company takes the first position in China, and has a well-established marketing network for chemical products.
The integrated business structure of the Company carries strong advantages in synergy among its various business segments, enabling the Company to continuously tap onto potentials in attaining an efficient and comprehensive utilization of its resources, and endowed the Company with strong resistance against risks, as well as remarkable capabilities in sustaining profitability.
The Company enjoys a favorable positioning with its operations located close to the consumer markets. Along with the steady growth in the Chinese economy, sales volume of both oil products and chemical products of the Company has been increasing steadily over the years; through continuous and specialized marketing efforts, the Company’s capability in international operations and market expansion has been further enhanced.
The Company owns a team of professionals and expertise engaged in the production of oil and gas, operation of refineries and chemical plants, as well as marketing activities. The Company applies outstanding fine management measures with its remarkable capabilities in management of operations, and enjoys a favorable operational cost advantage in its downstream businesses.
The Company has formulated a well-established technology system and mechanism, and owns competent teams specialised in scientific research covering a wide range of subjects; the four platforms for technology advancement is taking shape, which includes exploration and development of oil and gas, refining, chemicals and strategic emerging technology. With its overall technologies reaching state of the art level in the global arena, and some of them taking the lead globally, the Company enjoys strong capability for technical innovations.
The Company always attaches great importance to fulfilling social responsibilities, and carries out the green and low carbon development strategy to pursue a sustainable development. Moreover, the Company enjoys an outstanding brand name, plays an important role in the economy and is a renowned and reputable company in China.
25 RISK FACTORSIn the course of its production and operations, the Company will actively take various measures to circumvent operational risks. However, in practice, it may not be possible to prevent the occurrence of all risks and uncertainties described below.
Risks with regard to the variations from macroeconomic situation: The business results of the Company are closely related to China’s and global economic situation. The development of Chinese economy has entered New Normal. Although various countries have adopted different kinds of macroeconomic policies to eliminate negative effects caused by lower growth of global economy, the turnaround of economic recovery still remains uncertain. The Company’s business could also be adversely affected by such factors as the impact on export due to trade protectionism from some countries, and impact on import which is likely caused by regional trade agreements and etc.
Risks with regard to the cyclical effects from the industry: The majority of the Company’s operating income comes from the sales of refined oil products and petrochemical products, and part of the those businesses and their related products are cyclic and are sensitive to macro-economy, cyclic changes of regional and global economy, the changes of the production capacity and output, demand of consumers, prices and supply of the raw materials, as well as prices and supply of the alternative products etc. Although the Company is an integrated company with upstream, midstream and downstream operations, it can only counteract the adverse influences of industry cycle to some extent.
56 CHINA PETROLEUM & CHEMICAL CORPORATIONAnnual Report 2016
REPORT OF THE BOARD OF DIRECTORS (CONTINUED)
Rep
ort
of t
he B
oard
of
Dir
ecto
rs
Risks from the macroeconomic policies and government regulation: Although the Chinese government is gradually liberalizing the market entry regulations on petroleum and petrochemicals sector, the petroleum and petrochemical industries in China are still subject to entry regulations to a certain degree, which include: issuing licenses in relation to exploration and development of crude oil and natural gas, issuing business licenses for trading crude oil and refined oil, setting caps for retail prices of gasoline, diesel and other oil products, the imposing of the special oil income levy, formulation of import and export quotas and procedures, formulation of safety, quality and environmental protection standards and formulation of energy conservation policies. In addition, the changes which have occurred or might occur in macroeconomic and industry policies such as the opening up of crude oil import licenses, and further improvement in pricing mechanism of refined oil products, reforming and improvement in pricing mechanism of natural gas, cost supervision of gas pipeline and access to third party, and reforming in resource tax and environmental tax, will cause effects on our business operations. Such changes might further intensify market competition and have certain effect on the operations and profitability of the Company.
Risks with regard to the changes from environmental legislation requirements: Our production activities generate waste liquids, gases and solids. The Company has built up the supporting effluent treatment systems to prevent and reduce the pollution to the environment. However, the relevant government authorities may issue and implement much stricter environmental protection laws and regulations, adopt much stricter environment protection standards. Under such situations, the Company may increase expenses in relation to the environment protection accordingly.
Risks from the uncertainties of obtaining additional oil and gas resources: The future sustainable development of the Company is partly dependent to a certain extent on our abilities in continuously discovering or acquiring additional oil and natural gas resources. To obtain additional oil and natural gas resources, the Company faces some inherent risks associated with exploration and development and/or with acquisition activities, and the Company has to invest a large amount of money with no guarantee of certainty. If the Company fails to acquire additional resources through further exploration, development and acquisition to increase the reserves of crude oil and natural gas, the oil and natural gas reserves and production of the Company may decline overtime which may adversely affect the Company’s financial situation and operation performance.
Risks with regard to the external purchase of crude oil: A significant amount of crude oil as needed by the Company is satisfied through external purchases. In recent years, especially influenced by the mismatch between supply and demand of crude oil, geopolitics, global economic growth and other factors, the prices of crude oil fell sharply. Additionally, the supply of crude oil may even be interrupted due to some extreme major incidents in certain regions. Although the Company has taken flexible counter measures, it may not fully avoid risks associated with any significant fluctuation of international crude oil prices and sudden disruption of supply of crude oil from certain regions.
57CHINA PETROLEUM & CHEMICAL CORPORATION Annual Report 2016
Rep
ort
of t
he B
oard
of
Dir
ecto
rs
Risks with regard to the operation and natural disasters: The process of petroleum chemical production is exposed to the risks of inflammation, explosion and environmental pollution and is vulnerable to natural disasters. Such contingencies may cause serious impacts to the community, major financial losses to the Company and grievous injuries to people. The Company has always been paying great emphasis on the safety of production, and has implemented a strict HSE management system as an effort to avoid such risks as far as possible. Meanwhile, the main assets and inventories of the Company as well as the possibility of damage to a third party have been insured. However, such measures may not shield the Company from financial losses or adverse impact resulting from such contingencies.
Investment risks: Petroleum and chemical sector is a capital intensive industry. Although the Company adopted a prudent investment strategy and conducted rigorous feasibility study on each investment project, some certain investment risks may exist in the sense that expected returns may not be achieved due to major changes in factors such as market environment, prices of equipment and raw materials, and construction period during the implementation of the projects.
Risks with regard to overseas business development and management: The Company engages in oil and gas exploration, refining and chemical, warehouse logistics and international trading businesses in some regions outside China. The Company’s overseas businesses and assets are subject to the jurisdiction of the host country’s laws and regulations. In light of the complicacy of geopolitics, economic and other conditions, including sanctions, barriers to entry, instability in the financial and taxation policies, contract defaults, the Company’s risks with regard to overseas business development and management could be increased.
Currency risks: At present, China implements an administered floating exchange rate regime based on market supply and demand which is regulated with reference to a basket of currencies in terms of the exchange rate of Renminbi. As the Company purchases a significant portion of crude oil in foreign currency which is based on US dollar-denominated prices, fluctuations in the exchange rate of Renminbi against US dollars and certain other foreign currencies may affect the Company’s purchasing costs of crude oil. Meanwhile, according to domestic pricing mechanism of refined oil products, the prices of domestic refined oil products fluctuate with Renminbi exchange rate, and the prices of other domestic refined and chemical products would also be influenced by import price.
By order of the BoardWang YupuChairman
Beijing, China, 24 March 2017
58 CHINA PETROLEUM & CHEMICAL CORPORATIONAnnual Report 2016
REPORT OF THE BOARD OF SUPERVISORSR
epor
t of
the
Boa
rd o
f S
uper
viso
rs
Dear Shareholders:
In 2016, the Board of Supervisors and each supervisor of Sinopec Corp. diligently performed their supervision responsibilities, actively participated in the supervision process of decision making, carefully reviewed and effectively supervised the major decisions of the Company, and endeavored to safeguard the interests of shareholders and the Company in accordance with the PRC Company Law and the Articles of Association of Sinopec Corp.
During this reporting period, the Board of Supervisors held four (4) meetings in total, and mainly reviewed and approved Sinopec Corp.’s annual report, financial statement, communication on progress report for sustainable development, internal control assessment report and working report of the board of supervisors etc.
On 28 March 2016, the 4th meeting of the sixth session of the Board of Supervisors was held, and Financial Statements of Sinopec Corp. for 2015, Annual Report of Sinopec Corp. for 2015, 2015 Communication on Progress for Sustainable Development Report of Sinopec Corp., Internal Control Assessment Report of Sinopec Corp. for 2015, Report on the Work of Board of Supervisors of Sinopec Corp. for 2015 were reviewed and approved at the meeting.
On 28 April 2016, the 5th meeting of the sixth session of the Board of Supervisors was held, and the First Quarterly Report of Sinopec Corp. for 2016 was approved at the meeting.
On 26 August 2016, the 6th meeting of the sixth session of the Board of Supervisors was held, and the Interim Financial Statements of Sinopec Corp. for 2016 as well as Interim Report of Sinopec Corp. for 2016 were reviewed and approved at the meeting.
On 27 October 2016, the 7th meeting of the sixth session of the Board of Supervisors was held, and Third Quarterly Report of Sinopec Corp. for 2016 was approved at the meeting.
In addition, the supervisors attended the general meetings of shareholders and presented at meetings of the Board. The Board of Supervisors also organised supervisors to attend the trainings for directors and supervisors of listed companies organised by Beijing Securities Supervisory Bureau under CSRC. And these activities have further improved their capabilities in performing supervisory duties.
Through supervision and inspection on the production and operation management as well as financial management conditions, the Board of Supervisors and all the supervisors conclude that under the severe operating environment of excessive supply of oil products in domestic market and fluctuation of international crude oil prices at low level, the Company focused on transformation of its growth mode, improve asset quality, increase asset efficiency and upgrade the asset structure, with an aim to optimise resource and structure adjustment. Make every effort to expand the market, optimise structure, reduce costs, and control risks, all contributing to a hard-won business result. The Board of Supervisors had no objection to the supervised issues during this reporting period.
Firstly, the Board and the management of Sinopec Corp. performed their responsibilities pursuant to relevant laws and regulations, and implemented efficient management. The Board diligently fulfilled its obligations and exercised its rights under the PRC Company Law and the Articles of Association, and made informed decisions on major issues concerning change in growth mode, structure adjustment, as well as development and profitability. The senior management diligently implemented the
59CHINA PETROLEUM & CHEMICAL CORPORATION Annual Report 2016
Rep
ort
of t
he B
oard
of
Sup
ervi
sors
resolutions approved by the Board, continued to deepen the reform, focus on innovations, regulate operations, intensified strict management and strived to tap potentials and enhance efficiency, optimise business structures, committed to achieving the aim of sustaining profit and growth set by the Board. During the reporting period, the Board of Supervisors did not discover any behaviors of any other director or senior management which violated laws, regulations, and the Articles of Association, or were detrimental to the interests of Sinopec Corp. or its shareholders.
Secondly, the reports and financial statements prepared by Sinopec Corp. in 2016 complied with the relevant regulation of domestic and overseas securities regulators, the disclosed information truly, accurately, completely and fairly reflected Sinopec Corp.’s financial status and operation performance. The dividend distribution plan was made after comprehensively consideration of the long-term interests of Sinopec Corp and the interest of the shareholder. No violation of confidential provisions of persons who prepared and reviewed the report was found.
Thirdly, Sinopec Corp.’s internal control system is robust and effective, no material defects of internal control were found. In the meantime, Sinopec Corp. actively fulfilled its social responsibilities and promoted the sustainable development of social economy. Information disclosed in the sustainable development report was in compliance with requirements made by Shanghai Stock Exchange and Hong Kong Stock Exchange for listed companies with regard to the publication of social responsibility report.
Fourthly, all connected transactions between the Company and Sinopec Group were in compliance with the relevant rules and regulations of domestic and overseas listing places. The pricing of all the connected transaction was fair and reasonable. No insider trading or asset loss which is detrimental to the interests of Sinopec Corp. or its shareholders was found.
In 2017, the Board of Supervisors and each supervisor will continue to follow the principle of due diligence and integrity, earnestly perform the duties of supervision as delegated by the shareholders, strictly review the significant decisions, strengthen the process control and supervision, increase the strength of inspection and supervision on subsidiaries and protect Sinopec Corp.’s benefit and its shareholders’ interests.

60 CHINA PETROLEUM & CHEMICAL CORPORATIONAnnual Report 2016
DIRECTORS, SUPERVISORS, SENIOR MANAGEMENT AND EMPLOYEES
Dir
ecto
rs,
Sup
ervi
sors
,S
enio
r M
anag
emen
t an
d E
mplo
yees
1 INTRODUCTION OF DIRECTORS, SUPERVISORS AND OTHER SENIOR MANAGEMENT
(1) DirectorsWang Yupu, aged 60, Chairman of Board of Directors of Sinopec Corp. Mr. Wang is a professor level senior engineer with a Ph.D. degree and an academician of the Chinese Academy of Engineering. In October 2000, he was appointed as Director, Deputy General Manager of Daqing Oilfield Company Limited; in December 2003, he was appointed as Chairman and General Manager of Daqing Oilfield Company Limited; in March 2008, he was appointed as Chairman and General Manager (Director-General) of Daqing Oilfield Company Limited (Daqing Petroleum Administration Bureau); in August 2009, he was appointed as Vice Governor of the People’s Government of Heilongjiang Province. In July 2010, he was elected as Secretary of the Leading
Party Member Group , Vice Chairman, and First Secretary of the Secretariat of All China Federation of Trade Unions; in March 2013, he was appointed as Deputy Secretary of the Leading Party Member Group (Minister Level) of the Chinese Academy of Engineering; in June 2014, he was appointed as Deputy Secretary of the Leading Party Member Group and Vice President (Minister Level) of the Chinese Academy of Engineering. In April 2015, Mr. Wang acts as Chairman and Secretary of the Leading Party Member Group of China Petrochemical Corporation. Mr. Wang is an Alternate Member of the 17th CPC Central Committee and a Member of the 18th CPC Central Committee. In May 2015, Mr. Wang was appointed as Chairman of Board of Directors of Sinopec Corp.
Dai Houliang, aged 53, Vice Chairman of the Board and the President of Sinopec Corp. Mr. Dai is a professor level senior engineer with a Ph.D. degree. In December 1997, he was appointed as Vice President of Yangzi Petrochemical Corporation; in April 1998, he served as Board Director and Vice President of Yangzi Petrochemical Co., Ltd.; in July 2002, he served as Vice Chairman of Board of Directors, President of Yangzi Petrochemical Co., Ltd. and Board Director of Yangzi Petrochemical Corporation; in December 2003, he served as Chairman of Board of Directors and President of Yangzi Petrochemical Co., Ltd. and concurrently as Chairman of Board of Directors of Yangzi Petrochemical Corporation; in December 2004, he served concurrently as Chairman of Board of Directors of BASF-YPC Company Limited; in
September 2005, he was appointed as Deputy CFO of Sinopec Corp.; in November 2005, he was appointed as Vice President of Sinopec Corp.; in May 2006, he served as Board Director, Senior Vice President and CFO of Sinopec Corp.; in August 2012, he was appointed concurrently as Chairman of Sinopec Great Wall Energy & Chemical Co., Ltd.; in March 2013, he was appointed concurrently as Chairman of Sinopec Catalyst Co., Ltd.; and in May 2009, he was elected as Board Director and appointed as Senior Vice President of Sinopec Corp. in May 2016, he was appointed as the President of China Petrochemical Corporation and since August 2016, he was elected as the Vice Chairman of the Board and appointed as President of Sinopec Corp.
Dai HouliangWang Yupu
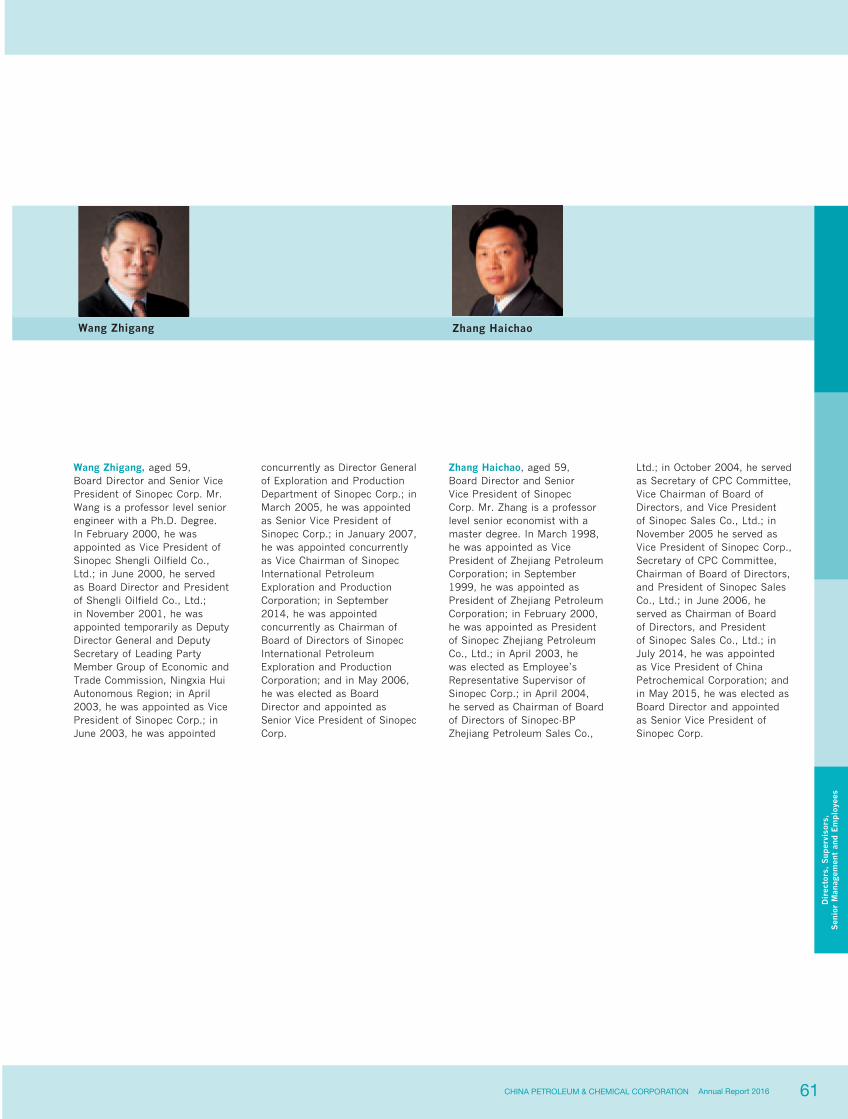
61CHINA PETROLEUM & CHEMICAL CORPORATION Annual Report 2016
Dir
ecto
rs,
Sup
ervi
sors
,S
enio
r M
anag
emen
t an
d E
mplo
yees
Wang Zhigang, aged 59, Board Director and Senior Vice President of Sinopec Corp. Mr. Wang is a professor level senior engineer with a Ph.D. Degree. In February 2000, he was appointed as Vice President of Sinopec Shengli Oilfield Co., Ltd.; in June 2000, he served as Board Director and President of Shengli Oilfield Co., Ltd.; in November 2001, he was appointed temporarily as Deputy Director General and Deputy Secretary of Leading Party Member Group of Economic and Trade Commission, Ningxia Hui Autonomous Region; in April 2003, he was appointed as Vice President of Sinopec Corp.; in June 2003, he was appointed
Zhang Haichao, aged 59, Board Director and Senior Vice President of Sinopec Corp. Mr. Zhang is a professor level senior economist with a master degree. In March 1998, he was appointed as Vice President of Zhejiang Petroleum Corporation; in September 1999, he was appointed as President of Zhejiang Petroleum Corporation; in February 2000, he was appointed as President of Sinopec Zhejiang Petroleum Co., Ltd.; in April 2003, he was elected as Employee’s Representative Supervisor of Sinopec Corp.; in April 2004, he served as Chairman of Board of Directors of Sinopec-BP Zhejiang Petroleum Sales Co.,
Ltd.; in October 2004, he served as Secretary of CPC Committee, Vice Chairman of Board of Directors, and Vice President of Sinopec Sales Co., Ltd.; in November 2005 he served as Vice President of Sinopec Corp., Secretary of CPC Committee, Chairman of Board of Directors, and President of Sinopec Sales Co., Ltd.; in June 2006, he served as Chairman of Board of Directors, and President of Sinopec Sales Co., Ltd.; in July 2014, he was appointed as Vice President of China Petrochemical Corporation; and in May 2015, he was elected as Board Director and appointed as Senior Vice President of Sinopec Corp.
Wang Zhigang
concurrently as Director General of Exploration and Production Department of Sinopec Corp.; in March 2005, he was appointed as Senior Vice President of Sinopec Corp.; in January 2007, he was appointed concurrently as Vice Chairman of Sinopec International Petroleum Exploration and Production Corporation; in September 2014, he was appointed concurrently as Chairman of Board of Directors of Sinopec International Petroleum Exploration and Production Corporation; and in May 2006, he was elected as Board Director and appointed as Senior Vice President of Sinopec Corp.
Zhang Haichao
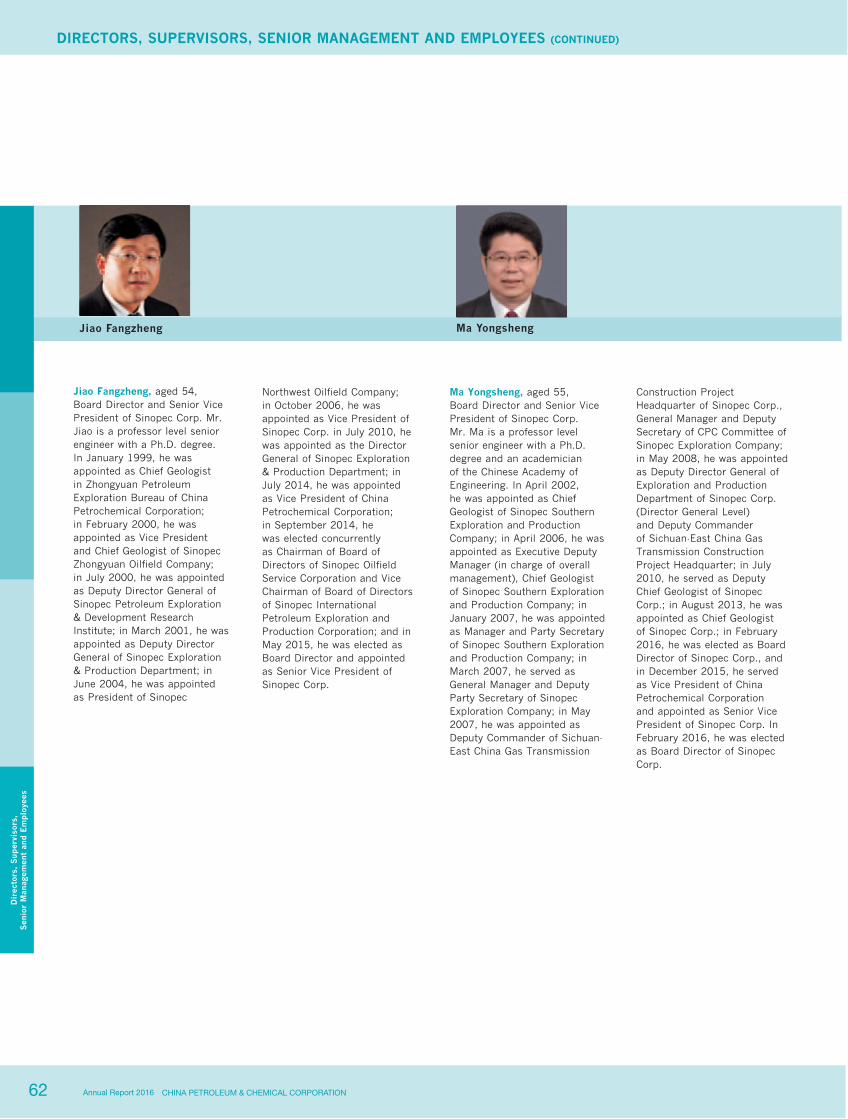
62 CHINA PETROLEUM & CHEMICAL CORPORATIONAnnual Report 2016
DIRECTORS, SUPERVISORS, SENIOR MANAGEMENT AND EMPLOYEES (CONTINUED)
Dir
ecto
rs,
Sup
ervi
sors
,S
enio
r M
anag
emen
t an
d E
mplo
yees
Northwest Oilfield Company; in October 2006, he was appointed as Vice President of Sinopec Corp. in July 2010, he was appointed as the Director General of Sinopec Exploration & Production Department; in July 2014, he was appointed as Vice President of China Petrochemical Corporation; in September 2014, he was elected concurrently as Chairman of Board of Directors of Sinopec Oilfield Service Corporation and Vice Chairman of Board of Directors of Sinopec International Petroleum Exploration and Production Corporation; and in May 2015, he was elected as Board Director and appointed as Senior Vice President of Sinopec Corp.
Ma Yongsheng, aged 55, Board Director and Senior Vice President of Sinopec Corp. Mr. Ma is a professor level senior engineer with a Ph.D. degree and an academician of the Chinese Academy of Engineering. In April 2002, he was appointed as Chief Geologist of Sinopec Southern Exploration and Production Company; in April 2006, he was appointed as Executive Deputy Manager (in charge of overall management), Chief Geologist of Sinopec Southern Exploration and Production Company; in January 2007, he was appointed as Manager and Party Secretary of Sinopec Southern Exploration and Production Company; in March 2007, he served as General Manager and Deputy Party Secretary of Sinopec Exploration Company; in May 2007, he was appointed as Deputy Commander of Sichuan-East China Gas Transmission
Construction Project Headquarter of Sinopec Corp., General Manager and Deputy Secretary of CPC Committee of Sinopec Exploration Company; in May 2008, he was appointed as Deputy Director General of Exploration and Production Department of Sinopec Corp. (Director General Level) and Deputy Commander of Sichuan-East China Gas Transmission Construction Project Headquarter; in July 2010, he served as Deputy Chief Geologist of Sinopec Corp.; in August 2013, he was appointed as Chief Geologist of Sinopec Corp.; in February 2016, he was elected as Board Director of Sinopec Corp., and in December 2015, he served as Vice President of China Petrochemical Corporation and appointed as Senior Vice President of Sinopec Corp. In February 2016, he was elected as Board Director of Sinopec Corp.
Jiao Fangzheng, aged 54, Board Director and Senior Vice President of Sinopec Corp. Mr. Jiao is a professor level senior engineer with a Ph.D. degree. In January 1999, he was appointed as Chief Geologist in Zhongyuan Petroleum Exploration Bureau of China Petrochemical Corporation; in February 2000, he was appointed as Vice President and Chief Geologist of Sinopec Zhongyuan Oilfield Company; in July 2000, he was appointed as Deputy Director General of Sinopec Petroleum Exploration & Development Research Institute; in March 2001, he was appointed as Deputy Director General of Sinopec Exploration & Production Department; in June 2004, he was appointed as President of Sinopec
Jiao Fangzheng Ma Yongsheng
63CHINA PETROLEUM & CHEMICAL CORPORATION Annual Report 2016
Dir
ecto
rs,
Sup
ervi
sors
,S
enio
r M
anag
emen
t an
d E
mplo
yees
Jiang Xiaoming, aged 63,
Independent Director of Sinopec
Corp. Mr. Jiang has a doctorate
in economics. Presently, he
acts as the member of the
national committee of CPPCC,
director of China Foundation
for Disabled Persons, member
of the United Nations Board of
Investment, Chairman of the
Board of Directors of Hong Kong
Saibo International Co. Ltd.,
Independent Director of COSCO
International, Senior Fellow of
the University of Cambridge
Business School, and trustee of
University of Cambridge China
Development Fund. Between
Andrew Y. Yan, aged 59,
Independent Director of Sinopec
Corp. Mr. Yan is the founding
Managing Partner of SAIF
Partners. He studied in Nanjing
University of Aeronautics and
Astronautics, Peking University
and Princeton University and
earned a master degree from
Princeton University. Presently,
he acts as the Independent
Non-executive Director of
China Resources Land Limited
and Cogobuy Group, the Non-
executive Director of China
Huiyuan Juice Group Limited,
Feng Deli Holdings Limited
and Guodian Technology &
Environment Group Corporation
Limited; the Independent
Director of Beijing BlueFocus
Brand Management Consulting
Co., Ltd, TCL Group and Sky
Solar Holdings Ltd.; and the
Jiang Xiaoming Andrew Y. Yan
1992 and 1998, he acted as
the Vice President of United
Nations Staff Retirement Fund;
between 1999 and 2003, he
acted as the Chairman of the
Board of Directors of Frasers
Property (China) Co., Ltd.; and
he has previously acted as the
Board Director of JSW Energy
Ltd., member of the Advisory
Committee of American Capital
Group and Rothschild, the
British Investment Bank, and
Independent Director of China
Oilfield Services Co., Ltd. From
May 2012 to the present, he
has acted as Independent
Director of Sinopec Corp.
Director of ATA Co., Ltd and
Ata Online(Beijing)Education
Technology Co.,Ltd.. From 1989
to 1994, he acted as Economist
of the World Bank headquarters
in Washington, research
Fellow of Hudson Institute, an
American famous research think
tank, and acted as the director
of APAC Strategic Planning &
Business Development of Sprint
International Corporation;
between 1994 and 2001,
he acted as the Managing
Director of Emerging Markets
Partnership and Director of
Hong Kong Office of AIG Asia
Infrastructural Investment
Fund. And from May 2012 to
the present, he has acted as
Independent Director of
Sinopec Corp.

64 CHINA PETROLEUM & CHEMICAL CORPORATIONAnnual Report 2016
DIRECTORS, SUPERVISORS, SENIOR MANAGEMENT AND EMPLOYEES (CONTINUED)
Dir
ecto
rs,
Sup
ervi
sors
,S
enio
r M
anag
emen
t an
d E
mplo
yees
Tang Min, aged 63,
Independent Director of Sinopec
Corp. Mr. Tang has a doctorate
in economics. He presently
acts as a Counsellor of the
State Council of the PRC and
the Executive Vice Chairman
of YouChange China Social
Entrepreneur Foundation,
Independent Director of
Minmetals Development Co.,
Ltd, Origin Agritech Limited
and Baoshang Bank Co., Ltd.
He has served as economist
and senior economist at the
Economic Research Centre of
Fan Gang, aged 62, Independent Director of Sinopec Corp. Mr. Fan has a doctorate in economics. He presently acts as Vice President of China Society of Economic Reform, President of China Reform Foundation, Head of the National Economic Research Institution, President of China Development Institute (Shenzhen) and an economics professor at Peking University. He began to work for Chinese Academy of Social Sciences in 1988, and subsequently served as Director of Editorial Department for the Economic Research Journal between 1992 and 1993 and as Deputy Head of the Institute of Economics
Tang Min Fan Gang
the Asian Development Bank
between 1989 and 2000; chief
economist at the Representative
office of the Asian Development
Bank in China between 2000
and 2004; deputy representative
at the Representative Office of
the Asian Development Bank in
China between 2004 and 2007
and the deputy secretary-general
of the China Development
Research Foundation between
2007 and 2010. From May
2015 to the present, he has
acted as Independent Director
of Sinopec Corp.
of Chinese Academy of Social Sciences between 1994 and 1995. In 1996, he was redesignated to work for China Society of Economic Reform, and subsequently founded the National Economic Research Institution. From 2006 to 2010, and from 2015 to the present, he has served as a member of the Monetary Policy Committee of People’s Bank of China. Mr. Fan is recognised as one of the National Young and Middle-Aged Experts with Outstanding Contributions. From May 2015 to the present, he has acted as Independent Director of Sinopec Corp.

65CHINA PETROLEUM & CHEMICAL CORPORATION Annual Report 2016
Dir
ecto
rs,
Sup
ervi
sors
,S
enio
r M
anag
emen
t an
d E
mplo
yees
List of Members of the Board
Remunerationpaid by
Sinopec Corp.in 2016 Whether paid Equity interests in Sinopec Corp.
Position in (RMB 1,000, by the holding (as at 31 December)Name Gender Age Sinopec Corp. Tenure before tax) Company 2016 2015
Wang Yupu Male 60 Chairman 2015.05-2018.05 — Yes 0 0Dai Houliang Male 53 Vice Chairman, 2009.05-2018.05 745.3 No 0 0 President Wang Zhigang Male 59 Board Director, 2006.05-2018.05 698.8 No 0 0 Senior Vice President Zhang Haichao Male 59 Board Director, 2015.05-2018.05 — Yes 0 0 Senior Vice President Jiao Fangzheng Male 54 Board Director, 2015.05-2018.05 — Yes 0 0 Senior Vice President Ma Yongsheng Male 55 Board Director, 2016.02-2018.05 — Yes 0 0 Senior Vice President Jiang Xiaoming Male 63 Independent Director 2012.05-2018.05 300.0 No 0 0 Andrew Y. Yan Male 59 Independent Director 2012.05-2018.05 300.0 No 0 0 Tang Min Male 63 Independent Director 2015.05-2018.05 300.0 No 0 0 Fan Gang Male 62 Independent Director 2015.05-2018.05 300.0 No 0 0
Remunerationpaid by
Sinopec Corp.in 2016 Whether paid Equity interests in Sinopec Corp.
Position in (RMB 1,000, by the holding (as at 31 December)Name Gender Age Sinopec Corp. Tenure before tax) Company 2016 2015
Li Chunguang Male 61 Former Board Director, 2009.05-2016.08 556.3 No 0 0 President Zhang Jianhua Male 52 Former Board Director, 2006.05-2016.07 519.7 No 0 0 Senior Vice President
66 CHINA PETROLEUM & CHEMICAL CORPORATIONAnnual Report 2016
DIRECTORS, SUPERVISORS, SENIOR MANAGEMENT AND EMPLOYEES (CONTINUED)
Dir
ecto
rs,
Sup
ervi
sors
,S
enio
r M
anag
emen
t an
d E
mplo
yees
(2) SupervisorsLiu Yun, aged 60, former Chairman of the Board of Supervisors of Sinopec Corp. Mr. Liu is a professor level senior accountant with a master degree. In December 1998, he was appointed as Deputy Director General of Finance Department of China Petrochemical Corporation; in February 2000, he was appointed as Deputy Director General of Finance Department of Sinopec Corp.; in January 2001, he was appointed as Director General of Finance Department of Sinopec Corp.; in June 2006, he was appointed as Deputy CFO of Sinopec Corp.; in February 2009, he was appointed as Chief Accountant of China Petrochemical Corporation; in May 2009, he was elected as a Board Director of Sinopec Corp.; in May 2012, he was appointed concurrently as the Chairman of Sinopec Finance Co., Ltd.; in September 2013, he was appointed concurrently as Chairman of Sinopec Insurance Co., Ltd.; and in May 2015, he was elected as Chairman of the Board of Supervisors of Sinopec Corp. On 16 March 2017, he resigned as the Chairman of the Board of Supervisors and Supervisor of Sinopec Corp.
Liu Zhongyun, aged 53, Supervisor of Sinopec Corp. Mr. Liu is a professor level senior engineer with a doctorate in engineering. In December 2002, he was appointed as a standing committee member of CPC Committee and Director of Organisation Department of Shengli Petroleum Administration Bureau; in November 2004, he was appointed as Deputy Secretary of CPC Committee of Shengli Petroleum Administration Bureau; in December 2005, he was appointed as Manager of Sinopec Shengli Oilfield Branch; in December 2008, he was appointed as Secretary of CPC Committee of Sinopec International Petroleum Exploration and Production Corporation; in July 2010, he was appointed as General Manager of Sinopec Northwest Oilfield Company, Director General of Northwest Petroleum Bureau under China Petrochemical Corporation. Since August 2014, Mr. Liu has acted as Assistant to President and Director General of HR Department of China Petrochemical Corporation, and in May 2015, he was elected as Supervisor of Sinopec Corp.
Zhou Hengyou, aged 53, Supervisor of Sinopec Corp. Mr. Zhou is a professor level senior administration engineer and a postgraduate. In December 1998, Mr. Zhou was appointed as a standing committee member of CPC Committee and Deputy Labour Union Chairman of Jiangsu Petroleum Exploration Bureau; in February 1999, he was appointed as a standing committee member of CPC Committee and Labour Union Chairman of Jiangsu Petroleum Exploration Bureau of China Petrochemical Corporation; in December 2002, he was appointed as Deputy Secretary of CPC Committee and Labour Union Chairman of Jiangsu Petroleum Exploration Bureau; in June 2004, he was appointed as Deputy Secretary of CPC Committee and Secretary of CPC Disciplinary Inspection Committee of Jiangsu Petroleum Exploration Bureau; in August 2005, he was appointed as Secretary of CPC
Liu Yun Liu Zhongyun Zhou Hengyou
Committee of Jiangsu Petroleum Exploration Bureau; in March 2011,he was appointed as Director General and Secretary of CPC Committee of China Petrochemical News. In March 2015, he was appointed as Director General of the General Office of China Petrochemical Corporation, Director General of Policy Research Department of the General Office and Director General of President of Sinopec Corp. In August 2015, he was appointed as Director General of Board of Directors Office under China Petrochemical Corporation; and in May 2015, he was elected as Supervisor of Sinopec Corp.
67CHINA PETROLEUM & CHEMICAL CORPORATION Annual Report 2016
Dir
ecto
rs,
Sup
ervi
sors
,S
enio
r M
anag
emen
t an
d E
mplo
yees
Jiang Zhenying, aged 52, Employee’s Representative Supervisor of Sinopec Corp. Mr. Jiang is a professor level senior economist with a doctor degree. In December 1998, he was appointed as the Vice President of the China Petrochemical Supplies & Equipment Co., Ltd.; in February 2000, he was appointed as the Deputy Director General of Sinopec Procurement Management Department; in December 2001, he was appointed as the Director General of Sinopec Procurement Management Department and in November 2005 he concurrently held the positions of Chairman of Board of Directors, President and Secretary of CPC Committee of China Petrochemical International Co., Ltd.; in March 2006, he was appointed as the Director General (General Manager), Executive Director and Secretary of the CPC Committee of Sinopec Procurement Management Department (Sinopec International Co. Ltd.); in April 2010, he was appointed as the Director General (General Manager), Executive Director and Deputy Secretary of the CPC Committee of Sinopec Procurement Management Department (Sinopec International Co. Ltd); in November 2014, he was appointed as Director General of Safety Supervisory Department of Sinopec Corp.; and since December 2010, he was elected as the Employee’s Representative Supervisor of Sinopec Corp.
Yu Renming, aged 53, Employee’s Representative Supervisor of Sinopec Corp. Mr. Yu is a professor level senior engineer with a university diploma. In June 2000, he was appointed as the Deputy General Manager of Sinopec Zhenhai Refining & Chemical Co., Ltd.; in June 2003, he was appointed as the Board Director and Deputy General Manager of Sinopec Zhenhai Refining & Chemical Co., Ltd.; in September 2006, he was appointed as the Vice President of Sinopec Zhenhai Refining & Chemical Company; in September 2007, he was appointed as the President and the Vice Secretary of CPC committee of Sinopec Zhenhai Refining & Chemical Company; in January 2008, he was appointed as the Director General of Sinopec Production Management Department; and in December 2010, he was elected as Employee’s Representative Supervisor of Sinopec Corp.
Wang Yajun, aged 60, Empolyee’s Representative Supervisor of Sinopec Corp. Mr. Wang is a professor level senior administration engineer with a university diploma. In December 2004, he was appointed as Vice Secretary of CPC committee, Secretary of Discipline Inspection Committee and Labour Union Chairman of Zhongyuan Petroleum Exploration Bureau of China Petrochemical Corporation. In November 2010, he was appointed as Party Secretary of CPC committee, of Zhongyuan Petroleum Exploration Bureau. In March 2015, Mr. Wang was appointed as Secretary of CPC of China Sinopec International Petroleum Exploration and Development Co., Ltd; and in May 2015, he was elected as Employee’s Representative Supervisor of Sinopec Corp.
Jiang Zhenying Yu Renming
Zou Huiping, aged 56, Supervisor of Sinopec Corp. Mr. Zou is a professor level senior accountant with a university diploma. In November 1998, he was appointed as Chief Accountant in Guangzhou Petrochemical General Plant of China Petrochemical Corporation; in February 2000, he was appointed as Deputy Director General of Finance & Assets Department of China Petrochemical Corporation; in December 2001, he was appointed as Deputy Director General of Finance & Planning Department of China Petrochemical Corporation; in March 2006, he was appointed as Director General of Finance & Assets Department of Assets Management Co., Ltd. of China Petrochemical Corporation; in March 2006, he was appointed as Director General of Auditing Department of Sinopec Corp.; and in May 2006, he was elected as Supervisor of Sinopec Corp.
Zou Huiping Wang Yajun
68 CHINA PETROLEUM & CHEMICAL CORPORATIONAnnual Report 2016
DIRECTORS, SUPERVISORS, SENIOR MANAGEMENT AND EMPLOYEES (CONTINUED)
Dir
ecto
rs,
Sup
ervi
sors
,S
enio
r M
anag
emen
t an
d E
mplo
yees
List of Members of the Board of Supervisors
Remunerationpaid by
Sinopec Corp. in 2016 Whether paid Equity interests in Sinopec Corp.
Position in (RMB 1,000, by the holding (as of 31 December)Name Gender Age Sinopec Corp. Tenure before tax) Company 2016 2015
Liu Yun
Male
60
Former Chairmanof the Board
2015.05-2017.03
—
Yes
0
0
of Supervisors Liu Zhongyun Male 53 Supervisor 2015.05-2018.05 — Yes 0 0Zhou Hengyou Male 53 Supervisor 2015.05-2018.05 — Yes 0 0Zou Huiping Male 56 Supervisor 2006.05-2018.05 618.2 No 0 0Jiang Zhenying Male 52 Employee’s 2010.12-2018.05 618.2 No 0 0 Representative Supervisor Yu Renming Male 53 Employee’s 2010.12 -2018.05 594.1 No 0 0 Representative Supervisor Wang Yajun Male 60 Employee’s 2015.05-2018.05 596.6 No 0 0 Representative Supervisor
Note: Mr. Liu Yun resigned as the Chairman of the Board of Supervisors and supervisor of Sinopec Corp. on 16 March 2017.
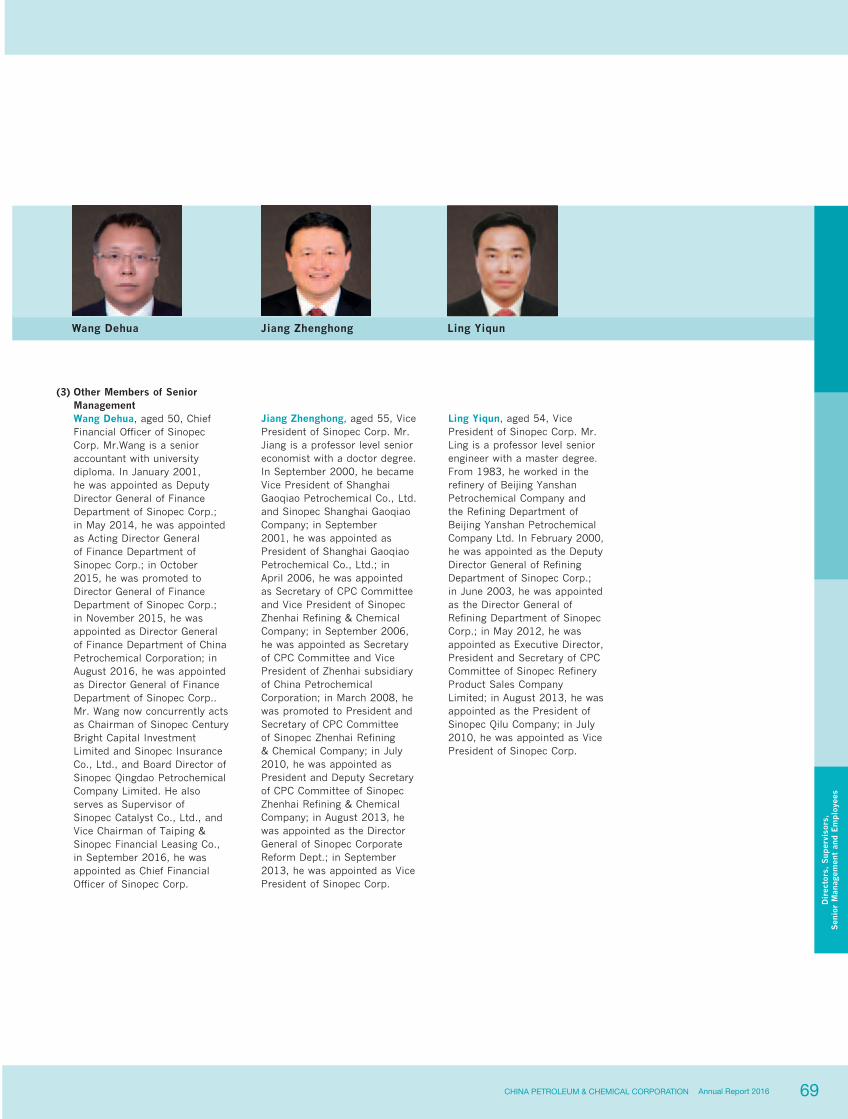
69CHINA PETROLEUM & CHEMICAL CORPORATION Annual Report 2016
Dir
ecto
rs,
Sup
ervi
sors
,S
enio
r M
anag
emen
t an
d E
mplo
yees
(3) Other Members of Senior ManagementWang Dehua, aged 50, Chief Financial Officer of Sinopec Corp. Mr.Wang is a senior accountant with university diploma. In January 2001, he was appointed as Deputy Director General of Finance Department of Sinopec Corp.; in May 2014, he was appointed as Acting Director General of Finance Department of Sinopec Corp.; in October 2015, he was promoted to Director General of Finance Department of Sinopec Corp.; in November 2015, he was appointed as Director General of Finance Department of China Petrochemical Corporation; in August 2016, he was appointed as Director General of Finance Department of Sinopec Corp.. Mr. Wang now concurrently acts as Chairman of Sinopec Century Bright Capital Investment Limited and Sinopec Insurance Co., Ltd., and Board Director of Sinopec Qingdao Petrochemical Company Limited. He also serves as Supervisor of Sinopec Catalyst Co., Ltd., and Vice Chairman of Taiping & Sinopec Financial Leasing Co., in September 2016, he was appointed as Chief Financial Officer of Sinopec Corp.
Ling Yiqun, aged 54, Vice President of Sinopec Corp. Mr. Ling is a professor level senior engineer with a master degree. From 1983, he worked in the refinery of Beijing Yanshan Petrochemical Company and the Refining Department of Beijing Yanshan Petrochemical Company Ltd. In February 2000, he was appointed as the Deputy Director General of Refining Department of Sinopec Corp.; in June 2003, he was appointed as the Director General of Refining Department of Sinopec Corp.; in May 2012, he was appointed as Executive Director, President and Secretary of CPC Committee of Sinopec Refinery Product Sales Company Limited; in August 2013, he was appointed as the President of Sinopec Qilu Company; in July 2010, he was appointed as Vice President of Sinopec Corp.
Wang Dehua Ling YiqunJiang Zhenghong
Jiang Zhenghong, aged 55, Vice President of Sinopec Corp. Mr. Jiang is a professor level senior economist with a doctor degree. In September 2000, he became Vice President of Shanghai Gaoqiao Petrochemical Co., Ltd. and Sinopec Shanghai Gaoqiao Company; in September 2001, he was appointed as President of Shanghai Gaoqiao Petrochemical Co., Ltd.; in April 2006, he was appointed as Secretary of CPC Committee and Vice President of Sinopec Zhenhai Refining & Chemical Company; in September 2006, he was appointed as Secretary of CPC Committee and Vice President of Zhenhai subsidiary of China Petrochemical Corporation; in March 2008, he was promoted to President and Secretary of CPC Committee of Sinopec Zhenhai Refining & Chemical Company; in July 2010, he was appointed as President and Deputy Secretary of CPC Committee of Sinopec Zhenhai Refining & Chemical Company; in August 2013, he was appointed as the Director General of Sinopec Corporate Reform Dept.; in September 2013, he was appointed as Vice President of Sinopec Corp.

70 CHINA PETROLEUM & CHEMICAL CORPORATIONAnnual Report 2016
DIRECTORS, SUPERVISORS, SENIOR MANAGEMENT AND EMPLOYEES (CONTINUED)
Dir
ecto
rs,
Sup
ervi
sors
,S
enio
r M
anag
emen
t an
d E
mplo
yees
Huang Wensheng, aged 50, Vice President of Sinopec Corp., Secretary to the Board of Directors. Mr. Huang is a professor level senior economist with a university diploma. In March 2003, he was appointed as Deputy Director General of the Board Secretariat of Sinopec Corp.; in May 2006, he was appointed as Representative on Securities Matters of Sinopec Corp.; since August 2009, He has served as the Deputy Director General of President’s office of Sinopec Corp. In September 2009, he was appointed as Director General of the Board Secretariat of Sinopec Corp.; in May 2012, he was appointed as Secretary to the Board of Directors of Sinopec Corp.; and in May 2014, he was appointed as Vice President of Sinopec Corp.
Chang Zhenyong, aged 58, Vice President of Sinopec Corp. Mr. Chang is a professor level senior engineer with a master’s degree. In September 1997, he was appointed as Vice President of Tianjin Petrochemical Company; in February 2000, he was appointed as Vice President of Sinopec Tianjin Company; and in September 2000, he was promoted to President of Sinopec Tianjin Company; from February 2004, he was appointed temporarily as member of Standing Committee of CPC Committee of Beihai, Guangxi; in March 2004, he was appointed temporarily as deputy mayor of Beihai, Guangxi; in November 2005, he was appointed as Director General of Production and Operation Management Department of Sinopec Corp.; in December 2007, he was appointed as President of Qilu Petrochemical Company and President of Sinopec Qilu Company; in April 2010, he was appointed as Employee’s Representative Supervisor of Sinopec Corp.; in
Lei Dianwu, aged 54, Vice President of Sinopec Corp. Mr. Lei is a Professor level Senior Engineer with a university diploma. In October 1995, he was appointed as Vice President of Yangzi Petrochemical Corporation; in December 1997, he was appointed as Director General of Planning & Development Department in China Eastern United Petrochemical (Group) Co., Ltd.; in May 1998, he was appointed as Vice President of Yangzi Petrochemical Corporation; in August 1998 he was appointed as Vice President of Yangzi Petrochemical Co., Ltd.; in March 1999, he was appointed temporarily as Deputy Director General of Development & Planning Department of China Petrochemical Corporation; in February 2000, he was appointed as Deputy Director General of Development & Planning Department of Sinopec Corp.; in March 2001, he was appointed as Director General of Development & Planning Department of Sinopec Corp.; in March 2009, he was appointed as Assistant to President of China Petrochemical Corporation; in August 2013, he was appointed as the Chief Economist of China Petrochemical Corporation; in October 2015, he was appointed as Secretary to the Board of Directors of China Petrochemical Corporation; and in May 2009, he was appointed as Vice President of Sinopec Corp.
Huang Wensheng Chang Zhenyong Lei Dianwu
July 2010, he was appointed as Deputy Chief Engineer and concurrently as Director General of Chemicals Department of Sinopec Corp.; in August 2012, he was appointed concurrently as Vice Chairman of Board of Directors of Sinopec Great Wall Energy & Chemical Co., Ltd.; in November 2014, he was appointed as Executive Director and President of Sinopec Chemical Products Sales Co. Ltd and concurrently as Chairman of Board of Directors of Sinopec Chemical Products Sales (Hong Kong) Co. Ltd.; and in May 2014, he was appointed as Vice President of Sinopec Corp.
71CHINA PETROLEUM & CHEMICAL CORPORATION Annual Report 2016
Dir
ecto
rs,
Sup
ervi
sors
,S
enio
r M
anag
emen
t an
d E
mplo
yees
List of Members of the Senior Management
Remuneration paidby Sinopec Corp.
in 2016 Whether paid Equity interests in Sinopec Corp.Position in (RMB 1,000, by the holding (as of 31 December)
Name Gender Age Sinopec Corp. before tax) Company 2016 2015
Wang Dehua Male 50 CFO 133.8 No 0 0Jiang Zhenghong Male 55 Vice President 704.2 No 0 0Ling Yiqun Male 54 Vice President 709.6 No 13,000 13,000Huang Wensheng Male 50 Vice President, 702.0 No 0 0 Board Secretary Chang Zhenyong Male 58 Vice President 709.6 No 0 0Lei Dianwu Male 54 Vice President 709.6 No 0 0Wen Dongfen Female 52 Former CFO 542.9 No 0 0
Note: The members of senior management in office are in order of the number of strokes of their surname in Chinese.
2 INFORMATION ON APPOINTMENT OR TERMINATION OF DIRECTORS, SUPERVISORS AND SENIOR MANAGEMENTOn 25 February 2016, Sinopec Corp. convened the first extraordinary shareholder meeting for the year 2016, and elected Mr. Ma Yongsheng as Director of the sixth session of Board of Directors.
On 13 July 2016, Mr. Zhang Jianhua resigned as Director of the Board, member of Strategic committee as well as Senior Vice President of Sinopec Corp. due to working arrangement.
On 29 July 2016, Ms. Wen Dongfen resigned as CFO of Sinopec Corp. due to working arrangement.
On 26 August 2016 Mr. Li Chunguang resigned as President and Director of the Board of Sinopec Corp. due to his age.
On 26 August 2016, Mr. Dai Houliang was elected as Vice Chairman and was appointed as President of Sinopec Corp.
On 28 September 2016, Mr. Wang Dehua was appointed as CFO of Sinopec Corp.
On 16 March 2017, Mr. Liu Yun resigned as the Chairman of the Board of Supervisors and supervisor of Sinopec Corp. due to his age.
For details, please refer to the
announcements, published in China Securities Journal, Shanghai Securities News and Securities Times after the meetings and on websites of Shanghai Stock Exchange, Hong Kong Stock Exchange and Sinopec Corp.
3 CHANGE OF SHAREHOLDING OF DIRECTORS, SUPERVISORS, AND THE SENIOR MANAGEMENTThere is no change in shareholdings of the Company by Directors, Supervisors and other senior managements during the reporting period.
4 CONTRACTRAL INTERESTS OF DIRECTORS AND SUPERVISORSAs of 31 December 2016 or any time during the reporting period, there is no Director or Supervisor of the Company entered into any agreement with any of Sinopec Corp., its controlling shareholder, any subsidiary or related subsidiary which shall significantly benefit such Director or Supervisor.
5 REMUNERATION OF DIRECTORS, SUPERVISORS, AND THE SENIOR MANAGEMENTDuring this reporting period, there is a total of 19 directors, supervisors and other senior management received remuneration from Sinopec Corp. with a total amount of RMB 10.3588 million.
6 THE COMPANY’S EMPLOYEESAs at 31 December 2016, the Company has a total of 451,611 employees. There is a total of 225,418 retired employees to be reimbursed by Sinopec Corp. Sinopec Marketing Co. Limited and China International United Petroleum and Chemical Company Limited, both principal subsidiaries of Sinopec Corp., have a total of 153,924 employees and 276 employees respectively.
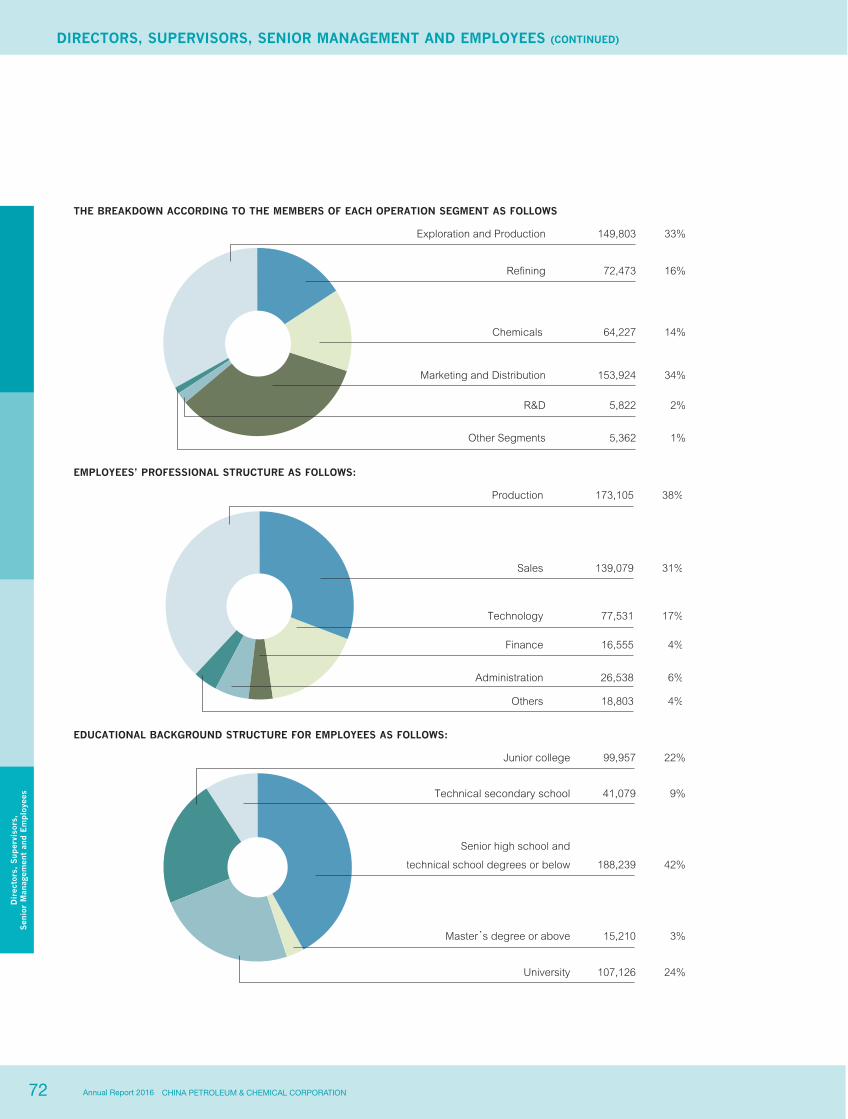
72 CHINA PETROLEUM & CHEMICAL CORPORATIONAnnual Report 2016
DIRECTORS, SUPERVISORS, SENIOR MANAGEMENT AND EMPLOYEES (CONTINUED)
Dir
ecto
rs,
Sup
ervi
sors
,S
enio
r M
anag
emen
t an
d E
mplo
yees
THE BREAKDOWN ACCORDING TO THE MEMBERS OF EACH OPERATION SEGMENT AS FOLLOWS
EMPLOYEES’ PROFESSIONAL STRUCTURE AS FOLLOWS:
EDUCATIONAL BACKGROUND STRUCTURE FOR EMPLOYEES AS FOLLOWS:
73CHINA PETROLEUM & CHEMICAL CORPORATION Annual Report 2016
Dir
ecto
rs,
Sup
ervi
sors
,S
enio
r M
anag
emen
t an
d E
mplo
yees
7 CHANGES OF CORE TECHNICAL TEAM OR KEY TECHNICIANSDuring the reporting period, there are no significant changes of core technical team and key technicians.
8 EMPLOYEE BENEFITS SCHEMEDetails of the Company’s employee benefits scheme are set out in Note35 of the financial statements prepared under IFRS of this annual report. As at 31 December 2016, the Company has a total of 225,418 retired employees. All of them participated in the basic pension schemes administered by provincial (autonomous region or municipalities) governments. Government-administered pension schemes are responsible for the payments of basic pensions.
9 REMUNERATION POLICYBased on a relatively united basic remuneration system, Sinopec Corp. has established its remuneration distribution system based on the value of positions, performance & contribution, with an aim to improve employee capabilities, and constantly improve employee performance evaluation and incentive & discipline mechanisms.
10 TRAINNING PROGRAMMSCentering on enterprise development strategy and key work of the year, the Company organised training programs at headquarters level which were attended by 4,505 high-level personnel. With an aim to enhance the comprehensive capabilities and capacities to fulfill their duties, the Company launched a series of training programs for new management personnel, and organised seminars with topics such as Innovation & Development for 1,514 senior management. The Company organised online classes titled “Five Major development Methodologies” for management personnel for 1,922 persons. With an aim to solve key problems related to scientific research and production, the Company organised workshops for leading experts in the field of oil & gas exploration and refining technology as well as seminars titled “customer value orientation” which focused on discussion of marketing capabilities for 905 high-level professional and technical personnel. With roles of positions, heritage and improvement of skills as the focus, the Company launched the first chief technician training classes and training programs for five types of work such as oil and gas gathering and transferring, catalytic cracking for top skilled talents covering 164 people. The branch companies and subsidiaries according to their conditions, adopted various ways to carry out different kinds of personnel training, and organized off-job training for a total of 898,000 people, as well as basic training for a total of 1.086 million persons.
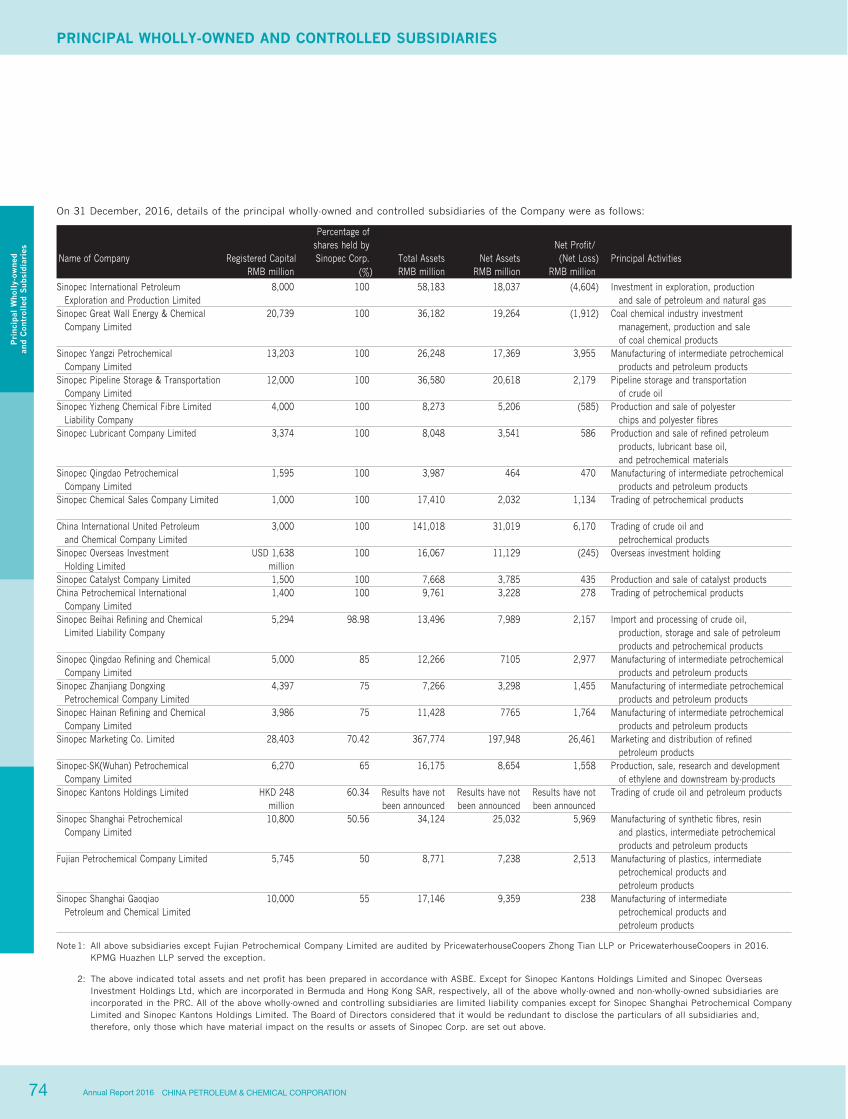
74 CHINA PETROLEUM & CHEMICAL CORPORATIONAnnual Report 2016
PRINCIPAL WHOLLY-OWNED AND CONTROLLED SUBSIDIARIES
Pri
ncip
al W
holl
y-ow
ned
and C
ontr
olle
d S
ubsi
dia
ries
On 31 December, 2016, details of the principal wholly-owned and controlled subsidiaries of the Company were as follows:
Percentage of
Name of Company Registered Capitalshares held bySinopec Corp. Total Assets Net Assets
Net Profit/(Net Loss) Principal Activities
RMB million (%) RMB million RMB million RMB million
Sinopec International Petroleum 8,000 100 58,183 18,037 (4,604) Investment in exploration, production Exploration and Production Limited and sale of petroleum and natural gasSinopec Great Wall Energy & Chemical 20,739 100 36,182 19,264 (1,912) Coal chemical industry investment Company Limited management, production and sale of coal chemical productsSinopec Yangzi Petrochemical 13,203 100 26,248 17,369 3,955 Manufacturing of intermediate petrochemical Company Limited products and petroleum productsSinopec Pipeline Storage & Transportation 12,000 100 36,580 20,618 2,179 Pipeline storage and transportation Company Limited of crude oilSinopec Yizheng Chemical Fibre Limited 4,000 100 8,273 5,206 (585) Production and sale of polyester Liability Company chips and polyester fibresSinopec Lubricant Company Limited 3,374 100 8,048 3,541 586 Production and sale of refined petroleum
products, lubricant base oil, and petrochemical materialsSinopec Qingdao Petrochemical 1,595 100 3,987 464 470 Manufacturing of intermediate petrochemical Company Limited products and petroleum productsSinopec Chemical Sales Company Limited 1,000 100 17,410 2,032 1,134 Trading of petrochemical products China International United Petroleum 3,000 100 141,018 31,019 6,170 Trading of crude oil and and Chemical Company Limited petrochemical productsSinopec Overseas Investment USD 1,638 100 16,067 11,129 (245) Overseas investment holding Holding Limited million Sinopec Catalyst Company Limited 1,500 100 7,668 3,785 435 Production and sale of catalyst productsChina Petrochemical International 1,400 100 9,761 3,228 278 Trading of petrochemical products Company Limited Sinopec Beihai Refining and Chemical 5,294 98.98 13,496 7,989 2,157 Import and processing of crude oil, Limited Liability Company production, storage and sale of petroleum products and petrochemical productsSinopec Qingdao Refining and Chemical 5,000 85 12,266 7105 2,977 Manufacturing of intermediate petrochemical Company Limited products and petroleum productsSinopec Zhanjiang Dongxing 4,397 75 7,266 3,298 1,455 Manufacturing of intermediate petrochemical Petrochemical Company Limited products and petroleum productsSinopec Hainan Refining and Chemical 3,986 75 11,428 7765 1,764 Manufacturing of intermediate petrochemical Company Limited products and petroleum productsSinopec Marketing Co. Limited 28,403 70.42 367,774 197,948 26,461 Marketing and distribution of refined petroleum productsSinopec-SK(Wuhan) Petrochemical 6,270 65 16,175 8,654 1,558 Production, sale, research and development Company Limited of ethylene and downstream by-productsSinopec Kantons Holdings Limited HKD 248 60.34 Results have not Results have not Results have not Trading of crude oil and petroleum products million been announced been announced been announced Sinopec Shanghai Petrochemical 10,800 50.56 34,124 25,032 5,969 Manufacturing of synthetic fibres, resin Company Limited and plastics, intermediate petrochemical products and petroleum productsFujian Petrochemical Company Limited 5,745 50 8,771 7,238 2,513 Manufacturing of plastics, intermediate
petrochemical products and petroleum productsSinopec Shanghai Gaoqiao 10,000 55 17,146 9,359 238 Manufacturing of intermediate Petroleum and Chemical Limited petrochemical products and petroleum products
Note 1: All above subsidiaries except Fujian Petrochemical Company Limited are audited by PricewaterhouseCoopers Zhong Tian LLP or PricewaterhouseCoopers in 2016. KPMG Huazhen LLP served the exception.
2: The above indicated total assets and net profit has been prepared in accordance with ASBE. Except for Sinopec Kantons Holdings Limited and Sinopec Overseas Investment Holdings Ltd, which are incorporated in Bermuda and Hong Kong SAR, respectively, all of the above wholly-owned and non-wholly-owned subsidiaries are incorporated in the PRC. All of the above wholly-owned and controlling subsidiaries are limited liability companies except for Sinopec Shanghai Petrochemical Company Limited and Sinopec Kantons Holdings Limited. The Board of Directors considered that it would be redundant to disclose the particulars of all subsidiaries and, therefore, only those which have material impact on the results or assets of Sinopec Corp. are set out above.

75CHINA PETROLEUM & CHEMICAL CORPORATION Annual Report 2016
Fina
ncia
l S
tate
men
ts (
PR
C)
REPORT OF THE PRC AUDITOR
PwC ZT Shen Zi (2017) No. 10001
To the Shareholders of China Petroleum & Chemical Corporation,
OPINION
What we have audited
We have audited the accompanying financial statements of China Petroleum & Chemical Corporation (hereinafter “Sinopec Corp.”), which comprise the consolidated and company balance sheets as at 31 December 2016, the consolidated and company income statements, the consolidated and company cash flow statements and the consolidated and company statements of changes in shareholders’ equity for the year then ended, and the notes to the financial statements.
Our opinion
In our opinion, the accompanying financial statements present fairly, in all material respects, the consolidated and company’s financial position of Sinopec Corp. as at 31 December 2016, and their financial performance and cash flows for the year then ended in accordance with the requirements of Accounting Standards for Business Enterprises (“CASs”).
BASIS FOR OPINION
We conducted our audit in accordance with China Standards on Auditing (“CSAs”). Our responsibilities under those standards are further described in the Auditor’s Responsibilities for the Audit of the Financial Statements section of our report. We believe that the audit evidence we have obtained is sufficient and appropriate to provide a basis for our opinion.
We are independent of Sinopec Corp. in accordance with the Code of Ethics for Professional Accountants of the Chinese Institute of Certified Public Accountants (“CICPA Code”), and we have fulfilled our other ethical responsibilities in accordance with the CICPA Code.
KEY AUDIT MATTERS
Key audit matters are those matters that, in our professional judgment, were of most significance in our audit of the financial statements of the current period. These matters were addressed in the context of our audit of the financial statements as a whole, and in forming our opinion thereon, and we do not provide a separate opinion on these matters.
76 CHINA PETROLEUM & CHEMICAL CORPORATIONAnnual Report 2016
Fina
ncia
l S
tate
men
ts (
PR
C)
REPORT OF THE PRC AUDITOR (CONTINUED)
Key audit matters identified in our audit are summarised as follows:
‧ Recoverability of the carrying amount of oil and gas properties;
‧ Accounting for investment income of capital injection by external investors into Sinopec Sichuan to East China Gas Pipeline Co., Ltd.
Key Audit Matter How our audit addressed the Key Audit Matter
Recoverability of the carrying amount of oil and gas properties
Refer to note 13 “FIXED ASSETS” to the consolidated financial statements.
As at 31 December 2016, the carrying amount of oil and gas properties amounted to RMB 215,124 million.
Low crude oil prices gave rise to possible indication that the carrying amount of oil and gas properties as at 31 December 2016 might be impaired. The Group has adopted discounted cash flow as the respective recoverable amounts of the oil and gas properties, which involved estimations or assumptions including:
– Future crude oil prices;– Future production profiles;– Future cost profiles; and– Discount rates.
Because of the significance of the carrying amount of oil and gas properties as at 31 December 2016, together with the use of estimations or assumptions in determining their respective discounted cash flow, we had placed our audit emphasis on this matter.
In auditing the respective discounted cash flow of the relevant oil and gas properties, we have performed the following key procedures on the relevant discounted cash flow projections prepared by management:
‧ Evaluated and tested the key controls, relating to the preparation of the discounted cash flow projections of oil and gas properties.
‧ Compared estimates of future crude oil prices adopted by the Group against a range of reputable published crude oil price forecasts.
‧ Compared the future production profiles against the oil and gas reserve estimation report approved by the Group’s reserve management committee. Evaluated the competence, capability and objectivity of the management’s experts engaged in estimating the oil and gas reserves. Assessed key estimations or assumptions used in the reserve estimation, by reference to historical data, management plans and/or reputable external data.
‧ Compared the future cost profiles against historical costs or relevant budgets of the Group.
‧ Independently estimated a range of discount rates, and found that the discount rates adopted by management were within the range.
‧ Tested selected other key data inputs, such as nature gas prices and production profiles in the projections by reference to historical data and/or relevant budgets of the Group.
‧ Assessed the methodology adopted in, and tested mathematical accuracy of the discounted cash flow projections.
‧ Evaluated the sensitivity analyses prepared by the Group, and assessed the potential impacts of a range of possible outcomes.
Based on our work, we found the key assumptions and input data adopted were supported by the evidence we gathered and consistent with our expectations.
Accounting for investment income of capital injection by external investors into Sinopec Sichuan to East China Gas Pipeline Co., Ltd
Refer to note 12 “LONG-TERM EQUITY INVESTMENTS” to the consolidated financial statements, an amount of RMB 20.562 billion investment income was arisen as a result of the derecognition of the assets and liabilities of a former subsidiary (Sinopec Sichuan to East China Gas Pipeline Co., Ltd, the “Pipeline Ltd”) from the consolidated financial position of the Group when the control over Pipeline Ltd was lost. The Group continues to retain a 50% equity interest in the Pipeline Ltd, and hence its significant influence over the Pipeline Ltd. As a result, the Group deconsolidated the Pipeline Ltd when the control was lost, and accounts for its 50% equity interest in the Pipeline Ltd as an associate company.
Because of the significance of such investment income in the year ended 31 December 2016, we had placed our audit emphasis on this matter.
In auditing the investment income of capital injection by external investors into Pipeline Ltd, we have performed the following procedures:
‧ Evaluated the effective date on which the Group lost control over the Pipeline Ltd, taking into consideration of factors including when the composition of the board of directors was changed.
‧ Tested the consideration to the Group as compensation for the loss of control over the Pipeline Ltd by checking against the relevant bank receipt notices. Corroborated the detail of the transaction by inspecting the relevant documents, agreements and contracts.
‧ Recomputed the investment income arising from the capital injection by external investors into Pipeline Ltd of RMB 20.562 billion, and agreed to management’s computation.
Based on our work, we found that the investment income of capital injection by external investors into Pipeline Ltd of RMB 20.562 billion was supported by the evidence we gathered.

77CHINA PETROLEUM & CHEMICAL CORPORATION Annual Report 2016
Fina
ncia
l S
tate
men
ts (
PR
C)
REPORT OF THE PRC AUDITOR (CONTINUED)
OTHER INFORMATION
Management is responsible for the other information. The other information comprises all of the information included in 2016 annual report of Sinopec Corp. other than the financial statements and our auditor’s report thereon.
Our opinion on the financial statements does not cover the other information and we do not express any form of assurance conclusion thereon.
In connection with our audit of the financial statements, our responsibility is to read the other information and, in doing so, consider whether the other information is materially inconsistent with the financial statements or our knowledge obtained in the audit or otherwise appears to be materially misstated. If, based on the work we have performed, we conclude that there is a material misstatement of this other information, we are required to report that fact. We have nothing to report in this regard.
RESPONSIBILITIES OF MANAGEMENT AND THOSE CHARGED WITH GOVERNANCE FOR THE FINANCIAL STATEMENTS
Management is responsible for the preparation and fair presentation of these financial statements in accordance with the CASs, and for such internal control as management determines is necessary to enable the preparation of financial statements that are free from material misstatement, whether due to fraud or error.
In preparing these financial statements, management is responsible for assessing Sinopec Corp.’s ability to continue as a going concern, disclosing, as applicable, matters related to going concern and using the going concern basis of accounting unless management either intend to liquidate Sinopec Corp. or to cease operations, or have no realistic alternative but to do so.
Those charged with governance are responsible for overseeing Sinopec Corp.’s financial reporting process.
AUDITOR’S RESPONSIBILITIES FOR THE AUDIT OF THE FINANCIAL STATEMENTS
Our objectives are to obtain reasonable assurance about whether these financial statements as a whole are free from material misstatement, whether due to fraud or error, and to issue an auditor’s report that includes our opinion. Reasonable assurance is a high level of assurance, but is not a guarantee that an audit conducted in accordance with CSAs will always detect a material misstatement when it exists. Misstatements can arise from fraud or error and are considered material if, individually or in the aggregate, they could reasonably be expected to influence the economic decisions of users taken on the basis of these financial statements.
As part of an audit in accordance with CSAs, we exercise professional judgment and maintain professional scepticism throughout the audit. We also:
‧ Identify and assess the risks of material misstatement of the financial statements, whether due to fraud or error, design and perform audit procedures responsive to those risks, and obtain audit evidence that is sufficient and appropriate to provide a basis for our opinion. The risk of not detecting a material misstatement resulting from fraud is higher than for one resulting from error, as fraud may involve collusion, forgery, intentional omissions, misrepresentations, or the override of internal control.
‧ Obtain an understanding of internal control relevant to the audit in order to design audit procedures that are appropriate in the circumstances.
‧ Evaluate the appropriateness of accounting policies used and the reasonableness of accounting estimates and related disclosures made by management.
‧ Conclude on the appropriateness of management’s use of the going concern basis of accounting and, based on the audit evidence obtained, whether a material uncertainty exists related to events or conditions that may cast significant doubt on Sinopec Corp.’s ability to continue as a going concern. If we conclude that a material uncertainty exists, we are required to draw attention in our auditor’s report to the related disclosures in these financial statements or, if such disclosures are inadequate, to modify our opinion. Our conclusions are based on the audit evidence obtained up to the date of our auditor’s report. However, future events or conditions may cause Sinopec Corp. to cease to continue as a going concern.
‧ Evaluate the overall presentation, structure and content of the financial statements, including the disclosures, and whether the financial statements represent the underlying transactions and events in a manner that achieves fair presentation.
‧ Obtain sufficient appropriate audit evidence regarding the financial information of the entities or business activities within the Sinopec Corp. to express an opinion on the consolidated financial statements. We are responsible for the direction, supervision and performance of the group audit. We remain solely responsible for our audit opinion.
78 CHINA PETROLEUM & CHEMICAL CORPORATIONAnnual Report 2016
Fina
ncia
l S
tate
men
ts (
PR
C)
REPORT OF THE PRC AUDITOR (CONTINUED)
We communicate with those charged with governance regarding, among other matters, the planned scope and timing of the audit and significant audit findings, including any significant deficiencies in internal control that we identify during our audit.
We also provide those charged with governance with a statement that we have complied with relevant ethical requirements regarding independence, and to communicate with them all relationships and other matters that may reasonably be thought to bear on our independence, and where applicable, related safeguards.
From the matters communicated with those charged with governance, we determine those matters that were of most significance in the audit of the financial statements of the current period and are therefore the key audit matters. We describe these matters in our auditor’s report unless law or regulation precludes public disclosure about the matter or when, in extremely rare circumstances, we determine that a matter should not be communicated in our report because the adverse consequences of doing so would reasonably be expected to outweigh the public interest benefits of such communication.
PricewaterhouseCoopers Zhong Tian LLP Certified Public AccountantsRegistered in the People’s Republic of China
Zhao Jianrong (Engagement Partner)Gao Peng
Shanghai, the People’s Republic of China 24 March 2017
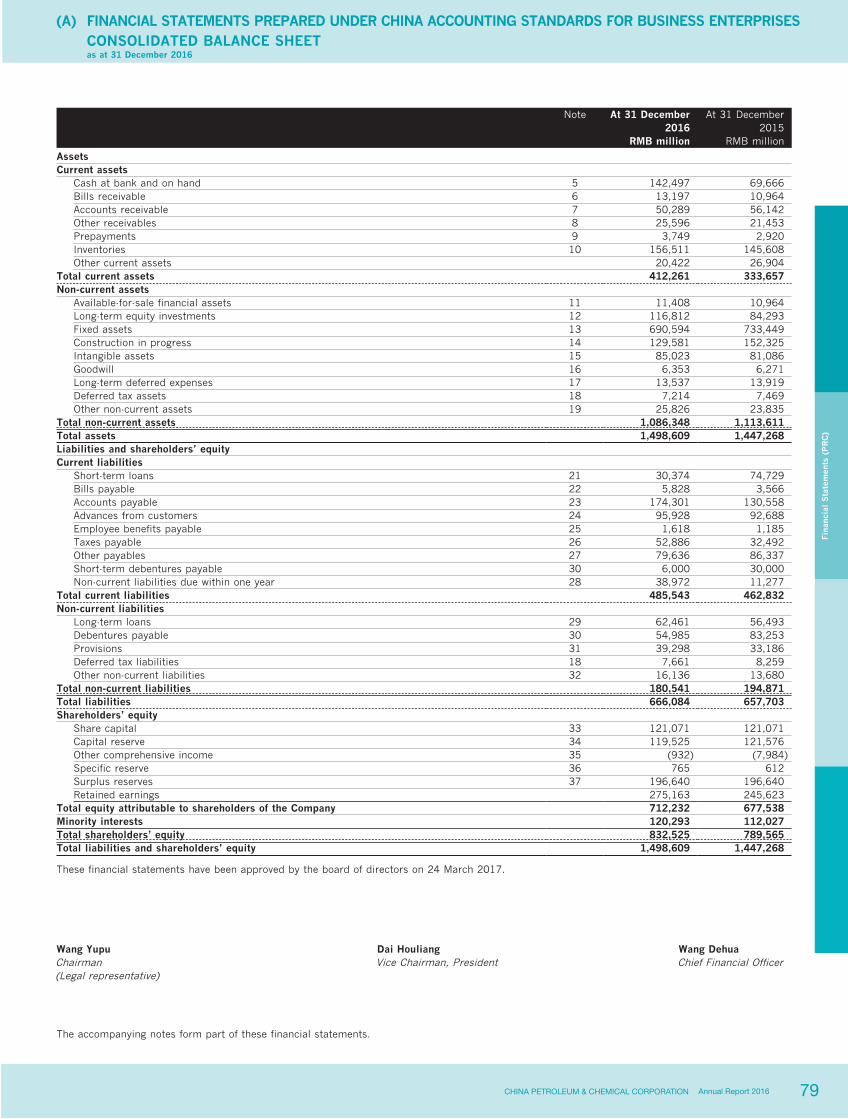
79CHINA PETROLEUM & CHEMICAL CORPORATION Annual Report 2016
Fina
ncia
l S
tate
men
ts (
PR
C)
(A) FINANCIAL STATEMENTS PREPARED UNDER CHINA ACCOUNTING STANDARDS FOR BUSINESS ENTERPRISES CONSOLIDATED BALANCE SHEET as at 31 December 2016
Note At 31 December At 31 December2016 2015
RMB million RMB million
Assets Current assets
Cash at bank and on hand 5 142,497 69,666Bills receivable 6 13,197 10,964Accounts receivable 7 50,289 56,142Other receivables 8 25,596 21,453Prepayments 9 3,749 2,920Inventories 10 156,511 145,608Other current assets 20,422 26,904
Total current assets 412,261 333,657Non-current assets
Available-for-sale financial assets 11 11,408 10,964Long-term equity investments 12 116,812 84,293Fixed assets 13 690,594 733,449Construction in progress 14 129,581 152,325Intangible assets 15 85,023 81,086Goodwill 16 6,353 6,271Long-term deferred expenses 17 13,537 13,919Deferred tax assets 18 7,214 7,469Other non-current assets 19 25,826 23,835
Total non-current assets 1,086,348 1,113,611Total assets 1,498,609 1,447,268Liabilities and shareholders’ equity Current liabilities
Short-term loans 21 30,374 74,729Bills payable 22 5,828 3,566Accounts payable 23 174,301 130,558Advances from customers 24 95,928 92,688Employee benefits payable 25 1,618 1,185Taxes payable 26 52,886 32,492Other payables 27 79,636 86,337Short-term debentures payable 30 6,000 30,000Non-current liabilities due within one year 28 38,972 11,277
Total current liabilities 485,543 462,832Non-current liabilities
Long-term loans 29 62,461 56,493Debentures payable 30 54,985 83,253Provisions 31 39,298 33,186Deferred tax liabilities 18 7,661 8,259Other non-current liabilities 32 16,136 13,680
Total non-current liabilities 180,541 194,871Total liabilities 666,084 657,703Shareholders’ equity
Share capital 33 121,071 121,071Capital reserve 34 119,525 121,576Other comprehensive income 35 (932) (7,984)Specific reserve 36 765 612Surplus reserves 37 196,640 196,640Retained earnings 275,163 245,623
Total equity attributable to shareholders of the Company 712,232 677,538Minority interests 120,293 112,027Total shareholders’ equity 832,525 789,565Total liabilities and shareholders’ equity 1,498,609 1,447,268
These financial statements have been approved by the board of directors on 24 March 2017.
Wang Yupu Dai Houliang Wang DehuaChairman Vice Chairman, President Chief Financial Officer(Legal representative)
The accompanying notes form part of these financial statements.
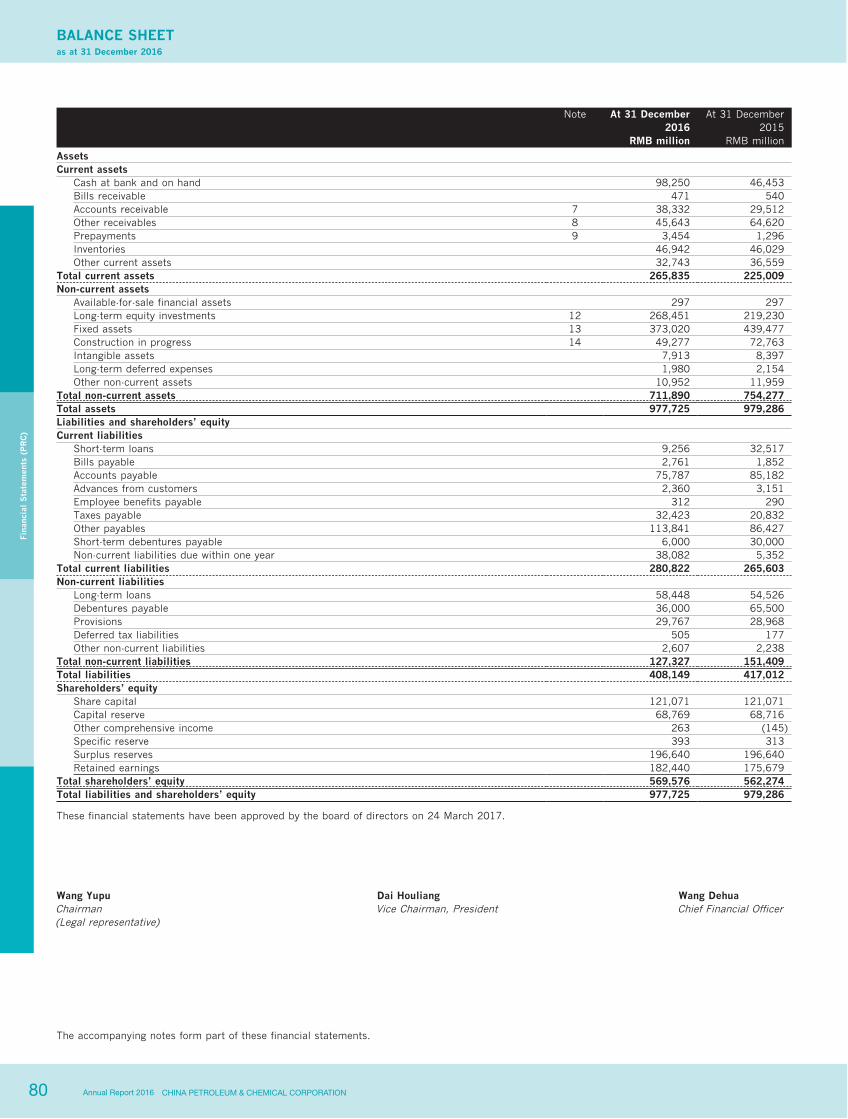
80 CHINA PETROLEUM & CHEMICAL CORPORATIONAnnual Report 2016
BALANCE SHEETas at 31 December 2016
Fina
ncia
l S
tate
men
ts (
PR
C)
Note At 31 December At 31 December2016 2015
RMB million RMB million
Assets Current assets
Cash at bank and on hand 98,250 46,453Bills receivable 471 540Accounts receivable 7 38,332 29,512Other receivables 8 45,643 64,620Prepayments 9 3,454 1,296Inventories 46,942 46,029Other current assets 32,743 36,559
Total current assets 265,835 225,009Non-current assets
Available-for-sale financial assets 297 297Long-term equity investments 12 268,451 219,230Fixed assets 13 373,020 439,477Construction in progress 14 49,277 72,763Intangible assets 7,913 8,397Long-term deferred expenses 1,980 2,154Other non-current assets 10,952 11,959
Total non-current assets 711,890 754,277Total assets 977,725 979,286Liabilities and shareholders’ equity Current liabilities
Short-term loans 9,256 32,517Bills payable 2,761 1,852Accounts payable 75,787 85,182Advances from customers 2,360 3,151Employee benefits payable 312 290Taxes payable 32,423 20,832Other payables 113,841 86,427Short-term debentures payable 6,000 30,000Non-current liabilities due within one year 38,082 5,352
Total current liabilities 280,822 265,603Non-current liabilities
Long-term loans 58,448 54,526Debentures payable 36,000 65,500Provisions 29,767 28,968Deferred tax liabilities 505 177Other non-current liabilities 2,607 2,238
Total non-current liabilities 127,327 151,409Total liabilities 408,149 417,012Shareholders’ equity
Share capital 121,071 121,071Capital reserve 68,769 68,716Other comprehensive income 263 (145)Specific reserve 393 313Surplus reserves 196,640 196,640Retained earnings 182,440 175,679
Total shareholders’ equity 569,576 562,274Total liabilities and shareholders’ equity 977,725 979,286
These financial statements have been approved by the board of directors on 24 March 2017.
Wang Yupu Dai Houliang Wang DehuaChairman Vice Chairman, President Chief Financial Officer(Legal representative)
The accompanying notes form part of these financial statements.
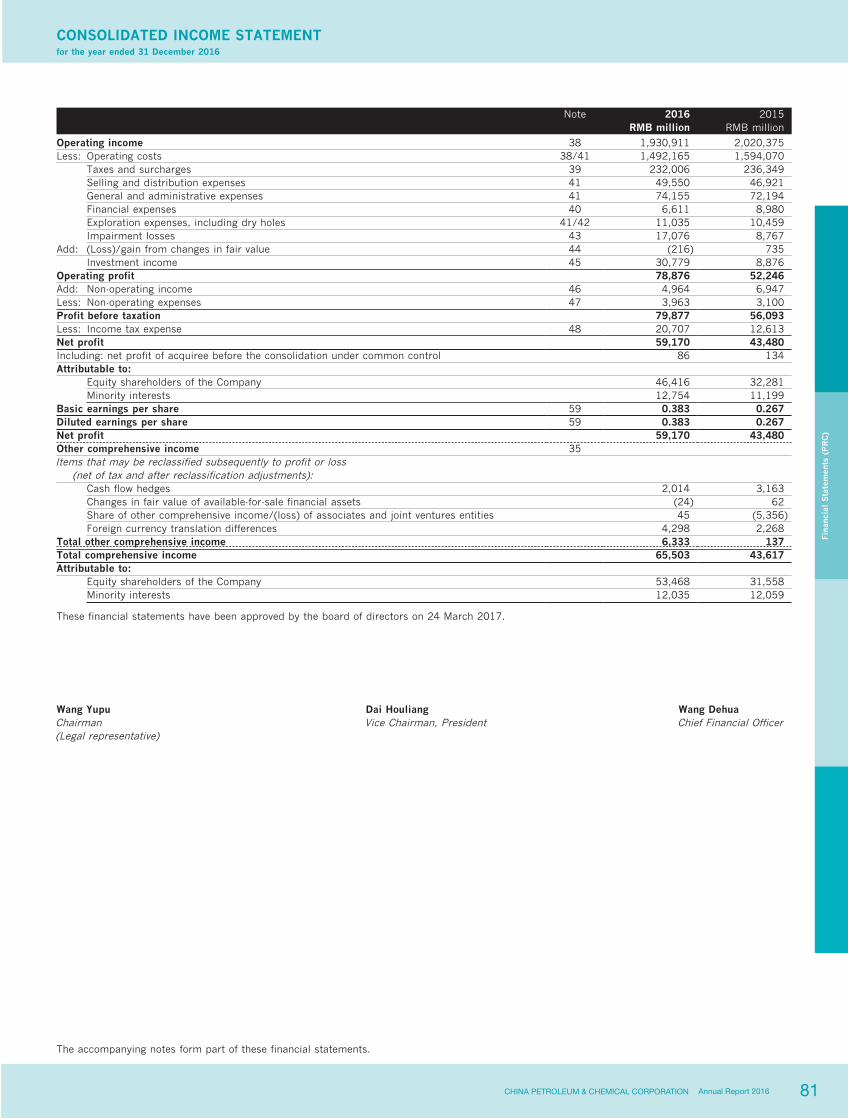
81CHINA PETROLEUM & CHEMICAL CORPORATION Annual Report 2016
CONSOLIDATED INCOME STATEMENTfor the year ended 31 December 2016
Fina
ncia
l S
tate
men
ts (
PR
C)
Note 2016 2015 RMB million RMB million
Operating income 38 1,930,911 2,020,375Less: Operating costs 38/41 1,492,165 1,594,070
Taxes and surcharges 39 232,006 236,349Selling and distribution expenses 41 49,550 46,921General and administrative expenses 41 74,155 72,194Financial expenses 40 6,611 8,980Exploration expenses, including dry holes 41/42 11,035 10,459Impairment losses 43 17,076 8,767
Add: (Loss)/gain from changes in fair value 44 (216) 735Investment income 45 30,779 8,876
Operating profit 78,876 52,246Add: Non-operating income 46 4,964 6,947Less: Non-operating expenses 47 3,963 3,100Profit before taxation 79,877 56,093Less: Income tax expense 48 20,707 12,613Net profit 59,170 43,480Including: net profit of acquiree before the consolidation under common control 86 134Attributable to:
Equity shareholders of the Company 46,416 32,281Minority interests 12,754 11,199
Basic earnings per share 59 0.383 0.267Diluted earnings per share 59 0.383 0.267Net profit 59,170 43,480Other comprehensive income 35 Items that may be reclassified subsequently to profit or loss
(net of tax and after reclassification adjustments): Cash flow hedges 2,014 3,163Changes in fair value of available-for-sale financial assets (24) 62Share of other comprehensive income/(loss) of associates and joint ventures entities 45 (5,356)Foreign currency translation differences 4,298 2,268
Total other comprehensive income 6,333 137Total comprehensive income 65,503 43,617Attributable to:
Equity shareholders of the Company 53,468 31,558Minority interests 12,035 12,059
These financial statements have been approved by the board of directors on 24 March 2017.
Wang Yupu Dai Houliang Wang DehuaChairman Vice Chairman, President Chief Financial Officer(Legal representative)
The accompanying notes form part of these financial statements.
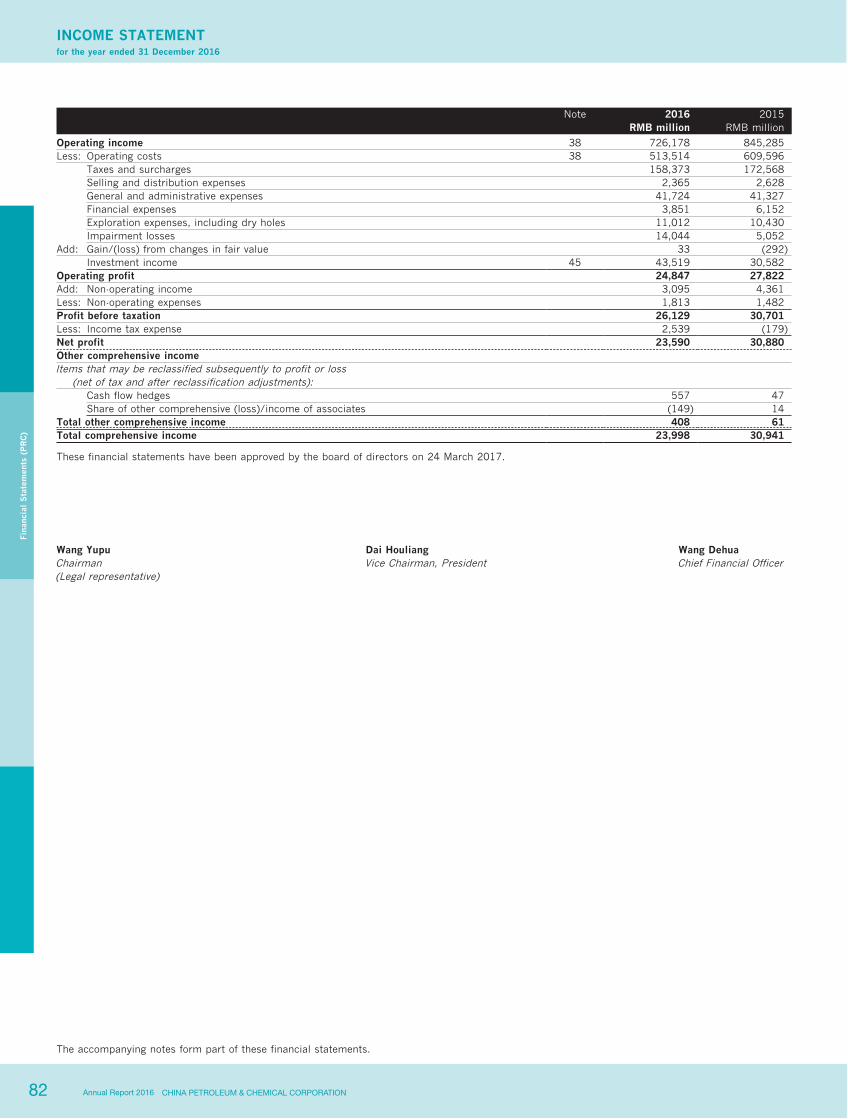
82 CHINA PETROLEUM & CHEMICAL CORPORATIONAnnual Report 2016
INCOME STATEMENTfor the year ended 31 December 2016
Fina
ncia
l S
tate
men
ts (
PR
C)
Note 2016 2015RMB million RMB million
Operating income 38 726,178 845,285Less: Operating costs 38 513,514 609,596
Taxes and surcharges 158,373 172,568Selling and distribution expenses 2,365 2,628General and administrative expenses 41,724 41,327Financial expenses 3,851 6,152Exploration expenses, including dry holes 11,012 10,430Impairment losses 14,044 5,052
Add: Gain/(loss) from changes in fair value 33 (292)Investment income 45 43,519 30,582
Operating profit 24,847 27,822Add: Non-operating income 3,095 4,361Less: Non-operating expenses 1,813 1,482Profit before taxation 26,129 30,701Less: Income tax expense 2,539 (179)Net profit 23,590 30,880Other comprehensive income Items that may be reclassified subsequently to profit or loss
(net of tax and after reclassification adjustments): Cash flow hedges 557 47Share of other comprehensive (loss)/income of associates (149) 14
Total other comprehensive income 408 61Total comprehensive income 23,998 30,941
These financial statements have been approved by the board of directors on 24 March 2017.
Wang Yupu Dai Houliang Wang DehuaChairman Vice Chairman, President Chief Financial Officer(Legal representative)
The accompanying notes form part of these financial statements.

83CHINA PETROLEUM & CHEMICAL CORPORATION Annual Report 2016
CONSOLIDATED CASH FLOW STATEMENTfor the year ended 31 December 2016
Fina
ncia
l S
tate
men
ts (
PR
C)
Note 2016 2015 RMB million RMB million
Cash flows from operating activities: Cash received from sale of goods and rendering of services 2,163,695 2,306,162Refund of taxes and levies 2,434 3,507Other cash received relating to operating activities 77,436 85,692Sub-total of cash inflows 2,243,565 2,395,361Cash paid for goods and services (1,547,868) (1,731,441)Cash paid to and for employees (62,602) (55,472)Payments of taxes and levies (316,062) (327,421)Other cash paid relating to operating activities (102,490) (115,287)Sub-total of cash outflows (2,029,022) (2,229,621)
Net cash flow from operating activities 50(a) 214,543 165,740Cash flows from investing activities:
Cash received from disposal of investments 31,489 3,353Cash received from returns on investments 4,028 3,399Net cash received from disposal of fixed assets, intangible assets and other long-term assets 440 427Other cash received relating to investing activities 2,914 6,158Net cash received from disposal of subsidiaries and other business entities 2,027 —Sub-total of cash inflows 40,898 13,337Cash paid for acquisition of fixed assets, intangible assets and other long-term assets (72,847) (102,698)Cash paid for acquisition of investments 11,12 (16,389) (23,351)Other cash paid relating to investing activities (17,879) (3,918)Net cash paid for the acquisition of subsidiaries and other business entities — (89)Sub-total of cash outflows (107,115) (130,056)
Net cash flow from investing activities (66,217) (116,719)Cash flows from financing activities:
Cash received from capital contributions 343 105,529Including: Cash received from minority shareholders’ capital contributions to subsidiaries 343 105,529Cash received from borrowings 506,097 1,090,241Sub-total of cash inflows 506,440 1,195,770Cash repayments of borrowings (569,091) (1,152,837)Cash paid for dividends, profits distribution or interest (30,396) (33,840)Including: Subsidiaries’ cash payments for distribution of dividends or profits to minority shareholders (6,553) (1,481)Sub-total of cash outflows (599,487) (1,186,677)
Net cash flow from financing activities (93,047) 9,093Effects of changes in foreign exchange rate 256 293Net increase in cash and cash equivalents 50(b) 55,535 58,407
These financial statements have been approved by the board of directors on 24 March 2017.
Wang Yupu Dai Houliang Wang DehuaChairman Vice Chairman, President Chief Financial Officer(Legal representative)
The accompanying notes form part of these financial statements.

84 CHINA PETROLEUM & CHEMICAL CORPORATIONAnnual Report 2016
CASH FLOW STATEMENTfor the year ended 31 December 2016
Fina
ncia
l S
tate
men
ts (
PR
C)
Note 2016 2015RMB million RMB million
Cash flows from operating activities: Cash received from sale of goods and rendering of services 831,578 975,387Refund of taxes and levies 1,323 2,954Other cash received relating to operating activities 85,932 69,615Sub-total of cash inflows 918,833 1,047,956Cash paid for goods and services (504,152) (643,612)Cash paid to and for employees (35,190) (35,061)Payments of taxes and levies (189,557) (213,949)Other cash paid relating to operating activities (50,638) (165,867)Sub-total of cash outflows (779,537) (1,058,489)
Net cash flow from operating activities 139,296 (10,533)Cash flows from investing activities:
Cash received from disposal of investments 29,002 146,685Cash received from returns on investments 22,233 22,822Net cash received from disposal of fixed assets, intangible assets and other long-term assets 1,885 4,390Other cash received relating to investing activities 1,488 967Net cash received from disposal of subsidiaries and other business entities 2,027 —Sub-total of cash inflows 56,635 174,864Cash paid for acquisition of fixed assets, intangible assets and other long-term assets (43,765) (77,403)Cash paid for acquisition of investments (39,505) (29,246)Other cash paid relating to investing activities (10,130) —Sub-total of cash outflows (93,400) (106,649)
Net cash flow from investing activities (36,765) 68,215Cash flows from financing activities:
Cash received from borrowings 153,790 285,281Sub-total of cash inflows 153,790 285,281Cash repayments of borrowings (192,828) (267,932)Cash paid for dividends or interest (21,826) (30,382)Sub-total of cash outflows (214,654) (298,314)
Net cash flow from financing activities (60,864) (13,033)Net increase in cash and cash equivalents 41,667 44,649
These financial statements have been approved by the board of directors on 24 March 2017.
Wang Yupu Dai Houliang Wang DehuaChairman Vice Chairman, President Chief Financial Officer(Legal representative)
The accompanying notes form part of these financial statements.
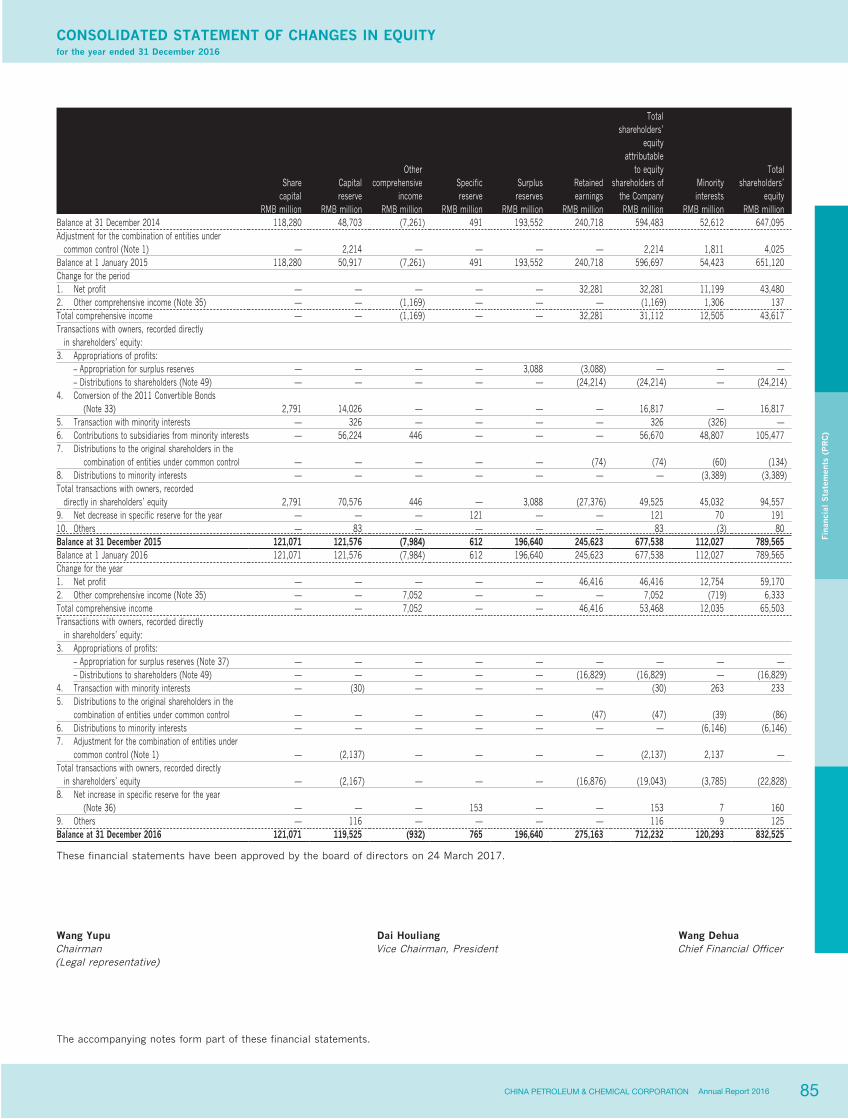
85CHINA PETROLEUM & CHEMICAL CORPORATION Annual Report 2016
CONSOLIDATED STATEMENT OF CHANGES IN EQUITYfor the year ended 31 December 2016
Fina
ncia
l S
tate
men
ts (
PR
C)
Share capital
Capital reserve
Other comprehensive
incomeSpecific reserve
Surplus reserves
Retained earnings
Total shareholders’
equity attributable
to equity shareholders of
the CompanyMinority interests
Total shareholders’
equity RMB million RMB million RMB million RMB million RMB million RMB million RMB million RMB million RMB millionBalance at 31 December 2014 118,280 48,703 (7,261) 491 193,552 240,718 594,483 52,612 647,095Adjustment for the combination of entities under common control (Note 1) — 2,214 — — — — 2,214 1,811 4,025Balance at 1 January 2015 118,280 50,917 (7,261) 491 193,552 240,718 596,697 54,423 651,120Change for the period 1. Net profit — — — — — 32,281 32,281 11,199 43,4802. Other comprehensive income (Note 35) — — (1,169) — — — (1,169) 1,306 137Total comprehensive income — — (1,169) — — 32,281 31,112 12,505 43,617Transactions with owners, recorded directly in shareholders’ equity: 3. Appropriations of profits:
– Appropriation for surplus reserves — — — — 3,088 (3,088) — — —– Distributions to shareholders (Note 49) — — — — — (24,214) (24,214) — (24,214)
4. Conversion of the 2011 Convertible Bonds (Note 33) 2,791 14,026 — — — — 16,817 — 16,8175. Transaction with minority interests — 326 — — — — 326 (326) —6. Contributions to subsidiaries from minority interests — 56,224 446 — — — 56,670 48,807 105,4777. Distributions to the original shareholders in the combination of entities under common control — — — — — (74) (74) (60) (134)8. Distributions to minority interests — — — — — — — (3,389) (3,389)Total transactions with owners, recorded directly in shareholders’ equity 2,791 70,576 446 — 3,088 (27,376) 49,525 45,032 94,5579. Net decrease in specific reserve for the year — — — 121 — — 121 70 19110. Others — 83 — — — — 83 (3) 80Balance at 31 December 2015 121,071 121,576 (7,984) 612 196,640 245,623 677,538 112,027 789,565Balance at 1 January 2016 121,071 121,576 (7,984) 612 196,640 245,623 677,538 112,027 789,565Change for the year 1. Net profit — — — — — 46,416 46,416 12,754 59,1702. Other comprehensive income (Note 35) — — 7,052 — — — 7,052 (719) 6,333Total comprehensive income — — 7,052 — — 46,416 53,468 12,035 65,503Transactions with owners, recorded directly in shareholders’ equity: 3. Appropriations of profits:
– Appropriation for surplus reserves (Note 37) — — — — — — — — —– Distributions to shareholders (Note 49) — — — — — (16,829) (16,829) — (16,829)
4. Transaction with minority interests — (30) — — — — (30) 263 2335. Distributions to the original shareholders in the
combination of entities under common control — — — — — (47) (47) (39) (86)6. Distributions to minority interests — — — — — — — (6,146) (6,146)7. Adjustment for the combination of entities under
common control (Note 1) — (2,137) — — — — (2,137) 2,137 —Total transactions with owners, recorded directly in shareholders’ equity — (2,167) — — — (16,876) (19,043) (3,785) (22,828)8. Net increase in specific reserve for the year (Note 36) — — — 153 — — 153 7 1609. Others — 116 — — — — 116 9 125Balance at 31 December 2016 121,071 119,525 (932) 765 196,640 275,163 712,232 120,293 832,525
These financial statements have been approved by the board of directors on 24 March 2017.
Wang Yupu Dai Houliang Wang DehuaChairman Vice Chairman, President Chief Financial Officer(Legal representative)
The accompanying notes form part of these financial statements.

86 CHINA PETROLEUM & CHEMICAL CORPORATIONAnnual Report 2016
STATEMENT OF CHANGES IN EQUITYfor the year ended 31 December 2016
Fina
ncia
l S
tate
men
ts (
PR
C)
Other TotalShare Capital comprehensive Specific Surplus Retained shareholders’
capital reserve income reserve reserves earnings equityRMB million RMB million RMB million RMB million RMB million RMB million RMB million
Balance at 1 January 2015 118,280 54,690 (206) 232 193,552 172,101 538,649Change for the year 1. Net profit — — — — — 30,880 30,8802. Other comprehensive income — — 61 — — — 61Total comprehensive income — — 61 — — 30,880 30,941Transactions with owners, recorded directly in shareholders’ equity: 3. Appropriations of profits:
– Appropriation for surplus reserves — — — — 3,088 (3,088) —– Distributions to shareholders (Note 49) — — — — — (24,214) (24,214)
4. Conversion of the 2011 Convertible Bonds (Note 33) 2,791 14,026 — — — — 16,817Total transactions with owners, recorded directly in shareholders’ equity 2,791 14,026 — — 3,088 (27,302) (7,397)5. Net decrease in specific reserve for the year — — — 81 — — 81Balance at 31 December 2015 121,071 68,716 (145) 313 196,640 175,679 562,274Balance at 1 January 2016 121,071 68,716 (145) 313 196,640 175,679 562,274Change for the year 1. Net profit — — — — — 23,590 23,5902. Other comprehensive income — — 408 — — — 408Total comprehensive income — — 408 — — 23,590 23,998Transactions with owners, recorded directly in shareholders’ equity: 3. Appropriations of profits:
– Appropriation for surplus reserves — — — — — — —– Distributions to shareholders (Note 49) — — — — — (16,829) (16,829)
Total transactions with owners, recorded directly in shareholders’ equity — — — — — (16,829) (16,829)4. Net increase in specific reserve for the year — — — 80 — — 805. Others — 53 — — — — 53Balance at 31 December 2016 121,071 68,769 263 393 196,640 182,440 569,576
These financial statements have been approved by the board of directors on 24 March 2017.
Wang Yupu Dai Houliang Wang DehuaChairman Vice Chairman, President Chief Financial Officer(Legal representative)
The accompanying notes form part of these financial statements.
87CHINA PETROLEUM & CHEMICAL CORPORATION Annual Report 2016
NOTES TO THE FINANCIAL STATEMENTSfor the year ended 31 December 2016
Fina
ncia
l S
tate
men
ts (
PR
C)
1 STATUS OF THE COMPANY
China Petroleum & Chemical Corporation (the “Company”) was established on 25 February 2000 as a joint stock limited company. The company is registered in Beijing, the People’s Republic of China, and the headquarter is located in Beijing, the People’s Republic of China. The approval date of the financial report is 24 March 2017.
According to the State Council’s approval to the “Preliminary Plan for the Reorganisation of China Petrochemical Corporation” (the “Reorganisation”), the Company was established by China Petrochemical Corporation (“Sinopec Group Company”), which transferred its core businesses together with the related assets and liabilities at 30 September 1999 to the Company. Such assets and liabilities had been valued jointly by China United Assets Appraisal Corporation, Beijing Zhong Zheng Appraisal Company, CIECC Assets Appraisal Corporation and Zhong Fa International Properties Valuation Corporation. The net asset value was determined at RMB 98,249,084,000. The valuation was reviewed and approved by the Ministry of Finance (the “MOF”) (Cai Ping Zi [2000] No. 20 “Comments on the Review of the Valuation Regarding the Formation of a Joint Stock Limited Company by China Petrochemical Corporation”).
In addition, pursuant to the notice Cai Guan Zi [2000] No. 34 “Reply to the Issue Regarding Management of State-Owned Equity by China Petroleum and Chemical Corporation” issued by the MOF, 68.8 billion domestic state-owned shares with a par value of RMB 1.00 each were issued to Sinopec Group Company, the amount of which is equivalent to 70% of the above net asset value transferred from Sinopec Group Company to the Company in connection with the Reorganisation.
Pursuant to the notice Guo Jing Mao Qi Gai [2000] No. 154 “Reply on the Formation of China Petroleum and Chemical Corporation”, the Company obtained the approval from the State Economic and Trade Commission on 21 February 2000 for the formation of a joint stock limited company.
The Company took over the exploration, development and production of crude oil and natural gas, refining, chemicals and related sales and marketing business of Sinopec Group Company after the establishment of the Company.
The company and its subsidiaries (the “Group”) engage in the oil and gas and chemical operations and businesses, including:
(1) the exploration, development and production of crude oil and natural gas;
(2) the refining, transportation, storage and marketing of crude oil and petroleum product; and
(3) the production and sale of chemical.
Pursuant to the resolution passed at the Directors’ meeting on 29 October 2015, the Company entered into the JV Agreement with Sinopec Assets Management Corporation (“SAMC”) in relation to the formation of the Gaoqiao Petrochemical Co. Ltd. According to the JV Agreement, the Company and SAMC jointly set up Gaoqiao Petrochemical Co. Ltd. for RMB 100 million in cash in 2016. Subsequently, the Company subscribed capital contribution with the net assets of Gaoqiao Branch of the Company and SAMC subscribed capital contribution with the net assets of Gaoqiao Branch of SAMC. The capital contribution was completed on 1 June 2016, after which the Company held 55% of Gaoqiao Petrochemical Co. Ltd.’s voting rights and become the parent company of Gaoqiao Petrochemical Co.Ltd..
As Sinopec Group Company controls both the Group and SAMC, the non-cash transaction described above between Sinopec and SAMC has been accounted as business combination under common control. Accordingly, the assets and liabilities of Gaoqiao Branch of SAMC have been accounted for at historical cost, and the consolidated financial statements of the Group prior to these acquisitions have been restated to include the results of operation and the assets and liabilities of Gaoqiao Branch of SAMC on a combined basis.
(1) The financial information disclosed in the consolidated scope changes are as follows:
The acquireeObtain
Proportion
The basis forthe businesscombinationunder thecommon control
Consolidationdate
Determinationbasis ofconsolidationdate
Revenue ofthe acquiree
from 1 January2016 to the
consolidationdate
RMB Million
Net profitof the
acquiree from1 January
2016 to theconsolidation
dateRMB Million
Revenueof the
acquiree from 1 Janurary
2015 to31 December
2015RMB Million
Net profitof the
acquiree from1 Janurary
2015 to31 December
2015RMB Million
Operating cashflow of the
acquiree from1 Janurary
2016 to theconsolidation
dateRMB Million
Net cashflow of the
acquiree from1 Janurary
2016 to theconsolidation
dateRMB Million
The acquiree and The consolidationthe company are date is the date oncontrolled by which the Company
Gaoqiao Branch of SAMC
Sinopec effectively obtains55% Group Company 1 June 2016 control of the 916 86 2,563 134 (85) (399)
both before and acquiree.after combination,and the control is
not transitory.
(2) The consolidation cost is as follow:
Consolidation cost (RMB million) 2,137
88 CHINA PETROLEUM & CHEMICAL CORPORATIONAnnual Report 2016
NOTES TO THE FINANCIAL STATEMENTS (CONTINUED)for the year ended 31 December 2016
Fina
ncia
l S
tate
men
ts (
PR
C)
1 STATUS OF THE COMPANY (Continued)
(3) The carrying value of the assets and liabilities of the acquiree are as follows:
At Consolidationdate
At 31 December2015
Book ValueRMB million
Book ValueRMB million
Current assets 937 1,287Total assets 4,130 4,174Current liabilities 203 225Total liabilities 203 232Total shareholders’ equity 3,927 3,942
Details of the Company’s principal subsidiaries are set out in Note 53.
2 BASIS OF PREPARATION
(1) Statement of compliance of China Accounting Standards for Business Enterprises (“ASBE”)The financial statements have been prepared in accordance with the requirements of Accounting Standards for Business Enterprises-Basic Standards, specific standards and relevant regulations (hereafter referred as ASBE collectively) issued by the MOF on or after 15 February 2006. These financial statements also comply with the disclosure requirements of “Regulation on the Preparation of Information Disclosures of Companies Issuing Public Shares, No.15: General Requirements for Financial Reports” issued by the China Securities Regulatory Commission (“CSRC”). These financial statements present truly and completely the consolidated and company financial position as at 31 December 2016, and the consolidated and company financial performance and the consolidated and company cash flows for the year then ended.
These financial statements are prepared on a basis of going concern.
(2) Accounting periodThe accounting year of the Group is from 1 January to 31 December.
(3) Measurement basisThe financial statements of the Group have been prepared under the historical cost convention, except for the assets and liabilities set out below:
— Financial asset and financial liability with change in fair value recognised through profit or loss (see Note 3(11))
— Available-for-sale financial assets (see Note 3(11))
— Convertible bonds (see Note 3(11))
— Derivative financial instruments (see Note 3(11))
(4) Functional currency and presentation currencyThe functional currency of the Company’s and most of its subsidiaries are Renminbi. The Group’s consolidated financial statements are presented in Renminbi. The Company translates the financial statements of subsidiaries from their respective functional currencies into Renminbi (see Note 3(2)) if the subsidiaries’ functional currencies are not Renminbi.
3 SIGNIFICANT ACCOUNTING POLICIES
The Group determines specific accounting policies and accounting estimates based on the characteristics of production and operational activities, mainly reflected in the accounting for allowance for accounts receivable (Note 3(12)), valuation of inventories (Note 3(4)), depreciation of fixed assets and depletion of oil and gas properties (Note 3(6), (7)), measurement of provisions (Note 3(16)), etc.
Principal accounting estimates and judgements of the Group are set out in Note 52.
89CHINA PETROLEUM & CHEMICAL CORPORATION Annual Report 2016
NOTES TO THE FINANCIAL STATEMENTS (CONTINUED)for the year ended 31 December 2016
Fina
ncia
l S
tate
men
ts (
PR
C)
3 SIGNIFICANT ACCOUNTING POLICIES (Continued)
(1) Accounting treatment of business combination involving entities under common control and not under common control
(a) Business combination involving entities under common control A business combination involving entities or businesses under common control is a business combination in which all of the combining
entities or businesses are ultimately controlled by the same party or parties both before and after the business combination, and that control is not transitory. The assets and liabilities that the acquirer receives in the acquisition are accounted for at the acquiree’s carrying amount on the acquisition date. The difference between the carrying amount of the acquired net assets and the carrying amount of the consideration paid for the acquisition (or the total nominal value of shares issued) is recognised in the share premium of capital reserve, or the retained earnings in case of any shortfall in the share premium of capital reserve. Any costs directly attributable to the combination shall be recognised in profit or loss for the current period when occurred. The expense incurred for equity securities and debt securities issued as the consideration of the combination is recognised in the initial cost of the securities. The combination date is the date on which the acquirer effectively obtains control of the acquiree.
(b) Business combination involving entities not under common control A business combination involving entities or businesses not under common control is a business combination in which all of the combining
entities or businesses are not ultimately controlled by the same party or parties both before and after the business combination. Difference between the consideration paid by the Group as the acquirer, comprises of the aggregate of the fair value at the acquisition date of assets given, liabilities incurred or assumed, and equity securities issued by the acquirer in exchange for control of the acquiree, and the Group’s interest in the fair value of the identifiable net assets of the acquiree, is recognised as goodwill (Note 3(9)) if it is an excess, otherwise in the profit or loss. The expense incurred for equity securities and debt securities issued as the consideration of the combination is recognised in the initial cost of the securities. Any other expense directly attributable to the business combination is recognised in the profit or loss for the year. The difference between the fair value and the book value of the assets given is recognised in profit or loss. The acquiree’s identifiable assets, liabilities and contingent liabilities, if satisfying the recognition criteria, are recognised by the Group at their fair value at the acquisition date. The acquisition date is the date on which the acquirer effectively obtains control of the acquiree.
(c) Method for preparation of consolidated financial statements The scope of consolidated financial statements is based on control and the consolidated financial statements comprise the Company and its
subsidiaries. Control means an entity is exposed to, or has rights to, variable returns from its involvement with the entity and has the ability to affect those returns through its power over the entity. The financial statements of subsidiaries are included in the consolidated financial statements from the date that control commences until the date that control ceases.
Where the Company combines a subsidiary during the reporting period through a business combination involving entities under common control, the financial statements of the subsidiary are included in the consolidated financial statements as if the combination had occurred at the beginning of the earliest comparative year presented or, if later, at the date that common control was established. Therefore the opening balances and the comparative figures of the consolidated financial statements are restated. In the preparation of the consolidated financial statements, the subsidiary’s assets, liabilities and results of operations are included in the consolidated balance sheet and the consolidated income statement, respectively, based on their carrying amounts in the subsidiary’s financial statements, from the date that common control was established.
Where the Company acquires a subsidiary during the reporting year through a business combination involving entities not under common control, the identifiable assets, liabilities and results of operations of the subsidiaries are consolidated into consolidated financial statements from the date that control commences, based on the fair value of those identifiable assets and liabilities at the acquisition date.
Where the Company acquired a minority interest from a subsidiary’s minority shareholders, the difference between the investment cost and the newly acquired interest into the subsidiary’s identifiable net assets at the acquisition date is adjusted to the capital reserve (capital surplus) in the consolidated balance sheet. Where the Company partially disposed an investment of a subsidiary that do not result in a loss of control, the difference between the proceeds and the corresponding share of the interest into the subsidiary is adjusted to the capital reserve (capital surplus) in the consolidated balance sheet. If the credit balance of capital reserve (capital surplus) is insufficient, any excess is adjusted to retained profits.
In a business combination involving entities not under common control achieved in stages, the Group remeasures its previously held equity interest in the acquiree on the acquisition date. The difference between the fair value and the net book value is recognised as investment income for the year. If other comprehensive income was recognised regarding the equity interest previously held in the acquiree before the acquisition date, the relevant other comprehensive income is transferred to investment income in the period in which the acquisition occurs.
Where control of a subsidiary is lost due to partial disposal of the equity investment held in a subsidiary, or any other reasons, the Group derecognises assets, liabilities, minority interests and other equity items related to the subsidiary. The remaining equity investment is remeasured to fair value at the date in which control is lost. The sum of consideration received from disposal of equity investment and the fair value of the remaining equity investment, net of the fair value of the Group’s previous share of the subsidiary’s identifiable net assets recorded from the acquisition date, is recognised in investment income in the period in which control is lost. Other comprehensive income related to the previous equity investment in the subsidiary, is transferred to investment income when control is lost.
90 CHINA PETROLEUM & CHEMICAL CORPORATIONAnnual Report 2016
NOTES TO THE FINANCIAL STATEMENTS (CONTINUED)for the year ended 31 December 2016
Fina
ncia
l S
tate
men
ts (
PR
C)
3 SIGNIFICANT ACCOUNTING POLICIES (Continued)
(1) Accounting treatment of business combination involving entities under common control and not under common control (Continued)
(c) Method for preparation of consolidated financial statements (Continued) Minority interest is presented separately in the consolidated balance sheet within shareholders’ equity. Net profit or loss attributable to
minority shareholders is presented separately in the consolidated income statement below the net profit line item.
The excess of the loss attributable to the minority interests during the period over the minority interests’ share of the equity at the beginning of the reporting period is deducted from minority interests.
Where the accounting policies and accounting period adopted by the subsidiaries are different from those adopted by the Company, adjustments are made to the subsidiaries’ financial statements according to the Company’s accounting policies and accounting period. Intra-group balances and transactions, and any unrealised profit or loss arising from intra-group transactions, are eliminated in preparing the consolidated financial statements. Unrealised losses resulting from intra-group transactions are eliminated in the same way as unrealised gains but only to the extent that there is no evidence of impairment.
The unrealised profit or loss arising from the sale of assets by the Company to its subsidiaries is eliminated in full against the net profit attributed to shareholders; the unrealised profit or loss from the sale of assets by subsidiaries to the Company is eliminated according to the distribution ratio between shareholders of the parent company and minority interests. For sale of assets that occurred between subsidiaries, the unrealised gains and losses is eliminated according to the distribution ratio for its subsidiaries seller between net profit attributable to shareholders of the parent company and minority interests.
(2) Transactions in foreign currencies and translation of financial statements in foreign currencies Foreign currency transactions are, on initial recognition, translated into Renminbi at the spot exchange rates quoted by the People’s Bank of
China (“PBOC rates”) at the transaction dates.
Foreign currency monetary items are translated at the PBOC rates at the balance sheet date. Exchange differences, except for those directly related to the acquisition, construction or production of qualified assets, are recognised as income or expenses in the income statement. Non-monetary items denominated in foreign currency measured at historical cost are not translated. Non-monetary items denominated in foreign currency that are measured at fair value are translated using the exchange rates at the date when the fair value was determined. The difference between the translated amount and the original currency amount is recognised as other comprehensive income, if it is classified as available-for-sale financial assets; or charged to the income statement if it is measured at fair value through profit or loss.
The assets and liabilities of foreign operation are translated into Renminbi at the spot exchange rates at the balance sheet date. The equity items, excluding “Retained earnings”, are translated into Renminbi at the spot exchange rates at the transaction dates. The income and expenses of foreign operation are translated into Renminbi at the spot exchange rates or an exchange rate that approximates the spot exchange rates on the transaction dates. The resulting exchange differences are separately presented as other comprehensive income in the balance sheet within equity. Upon disposal of a foreign operation, the cumulative amount of the exchange differences recognised in which relate to that foreign operation is transferred to profit or loss in the year in which the disposal occurs.
(3) Cash and cash equivalents Cash and cash equivalents comprise cash on hand, demand deposits, short-term and highly liquid investments which are readily convertible into
known amounts of cash and are subject to an insignificant risk of change in value.
(4) Inventories Inventories are initially measured at cost. Cost includes the cost of purchase and processing, and other expenditures incurred in bringing the
inventories to their present location and condition. The cost of inventories is calculated using the weighted average method. In addition to the cost of purchase of raw material, work in progress and finished goods include direct labour and an appropriate allocation of manufacturing overhead costs.
At the balance sheet date, inventories are stated at the lower of cost and net realisable value.
Any excess of the cost over the net realisable value of each item of inventories is recognised as a provision for diminution in the value of inventories. Net realisable value is the estimated selling price in the normal course of business less the estimated costs of completion and the estimated costs necessary to make the sale and relevant taxes. The net realisable value of materials held for use in the production is measured based on the net realisable value of the finished goods in which they will be incorporated. The net realisable value of the quantity of inventory held to satisfy sales or service contracts is measured based on the contract price. If the quantities held by the Group are more than the quantities of inventories specified in sales contracts, the net realisable value of the excess portion of inventories is measured based on general selling prices.
Inventories include raw materials, work in progress, semi-finished goods, finished goods and reusable materials. Reusable materials include low-value consumables, packaging materials and other materials, which can be used repeatedly but do not meet the definition of fixed assets. Reusable materials are amortised in full when received for use. The amounts of the amortisation are included in the cost of the related assets or profit or loss.
Inventories are recorded by perpetual method.
91CHINA PETROLEUM & CHEMICAL CORPORATION Annual Report 2016
NOTES TO THE FINANCIAL STATEMENTS (CONTINUED)for the year ended 31 December 2016
Fina
ncia
l S
tate
men
ts (
PR
C)
3 SIGNIFICANT ACCOUNTING POLICIES (Continued)
(5) Long-term equity investments
(a) Investment in subsidiaries In the Company’s separate financial statements, long-term equity investments in subsidiaries are accounted for using the cost method.
Except for cash dividends or profits distributions declared but not yet distributed that have been included in the price or consideration paid in obtaining the investments, the Company recognises its share of the cash dividends or profit distributions declared by the investee as investment income irrespective of whether these represent the net profit realised by the investee before or after the investment. Investments in subsidiaries are stated at cost less impairment losses (see Note 3(12)) in the balance sheet. At initial recognition, such investments are measured as follows:
The initial investment cost of a long-term equity investment obtained through a business combination involving entities under common control is the Company’s share of the carrying amount of the subsidiary’s equity at the combination date. The difference between the initial investment cost and the carrying amounts of the consideration given is adjusted to share premium in capital reserve. If the balance of the share premium is insufficient, any excess is adjusted to retained earnings.
For a long-term equity investment obtained through a business combination not involving enterprises under common control, the initial investment cost comprises the aggregate of the fair values of assets transferred, liabilities incurred or assumed, and equity securities issued by the Company, in exchange for control of the acquiree. For a long-term equity investment obtained through a business combination not involving enterprises under common control, if it is achieved in stages, the initial cost comprises the carrying value of previously-held equity investment in the acquiree immediately before the acquisition date, and the additional investment cost at the acquisition date.
An investment in a subsidiary acquired otherwise than through a business combination is initially recognised at actual purchase cost if the Group acquires the investment by cash, or at the fair value of the equity securities issued if an investment is acquired by issuing equity securities, or at the value stipulated in the investment contract or agreement if an investment is contributed by investors.
(b) Investment in joint ventures entities and associates A joint venture is an incorporated entity over which the Group, based on legal form, contractual terms and other facts and circumstances,
has joint control with the other parties to the joint venture and rights to the net assets of the joint venture. Joint control is the contractually agreed sharing of control of an arrangement, which exists only when decisions about the relevant activities require the unanimous consent of the Group and the parties sharing control.
An associate is the investee that the Group has significant influence on their financial and operating policies. Significant influence represents the right to participate in the financial and operating policy decisions of the investee but is not control or joint control over the establishment of these policies. The Group generally considers the following circumstances in determining whether it can exercise significant influence over the investee: whether there is representative appointed to the board of directors or equivalent governing body of the investee; whether to participate in the investee’s policy-making process; whether there are significant transactions with the investees; whether there is management personnel sent to the investee; whether to provide critical technical information to the investee.
An investment in a joint ventures entity or an associate is accounted for using the equity method, unless the investment is classified as held for sale (see Note 3(10)).
The initial cost of investment in joint ventures entities and associates is stated at the consideration paid except for cash dividends or profits distributions declared but unpaid at the time of acquisition and therefore included in the consideration paid should be deducted if the investment is made in cash. Under the circumstances that the long-term investment is obtained through non-monetary asset exchange, the initial cost of the investment is stated at the fair value of the assets exchanged if the transaction has commercial substance, the difference between the fair value of the assets exchanged and its carrying amount is charged to profit or loss; or stated at the carrying amount of the assets exchanged if the transaction lacks commercial substance.
The Group’s accounting treatments when adopting the equity method include:
Where the initial investment cost of a long-term equity investment exceeds the Group’s interest in the fair value of the investee’s identifiable net assets at the date of acquisition, the investment is initially recognised at the initial investment cost. Where the initial investment cost is less than the Group’s interest in the fair value of the investee’s identifiable net assets at the time of acquisition, the investment is initially recognised at the investor’s share of the fair value of the investee’s identifiable net assets, and the difference is charged to profit or loss.
After the acquisition of the investment, the Group recognises its share of the investee’s net profits or losses and other comprehensive income as investment income or losses and other comprehensive income, and adjusts the carrying amount of the investment accordingly. Once the investee declares any cash dividends or profits distributions, the carrying amount of the investment is reduced by that attributable to the Group.

92 CHINA PETROLEUM & CHEMICAL CORPORATIONAnnual Report 2016
NOTES TO THE FINANCIAL STATEMENTS (CONTINUED)for the year ended 31 December 2016
Fina
ncia
l S
tate
men
ts (
PR
C)
3 SIGNIFICANT ACCOUNTING POLICIES (Continued)
(5) Long-term equity investments (Continued)
(b) Investment in joint ventures entities and associates (Continued) The Group recognises its share of the investee’s net profits or losses after making appropriate adjustments to align the accounting policies
or accounting periods with those of the Group based on the fair values of the investee’s net identifiable assets at the time of acquisition. Under the equity accounting method, unrealised profits and losses resulting from transactions between the Group and its associates or joint ventures entities are eliminated to the extent of the Group’s interest in the associates or joint ventures entities. Unrealised losses resulting from transactions between the Group and its associates or joint ventures entities are fully recognised in the event that there is an evidence of impairment.
The Group discontinues recognising its share of net losses of the investee after the carrying amount of the long-term equity investment and any long-term interest that is in substance forms part of the Group’s net investment in the associate or the joint ventures entity is reduced to zero, except to the extent that the Group has an obligation to assume additional losses. However, if the Group has incurred obligations for additional losses and the conditions on recognition of provision are satisfied in accordance with the accounting standard on contingencies, the Group continues recognising the investment losses and the provision. Where net profits are subsequently made by the associate or joint venture entity, the Group resumes recognising its share of those profits only after its share of the profits equals the share of losses not recognised.
The Group adjusts the carrying amount of the long-term equity investment for changes in owners’ equity of the investee other than those arising from net profits or losses and other comprehensive income, and recognises the corresponding adjustment in capital reserve.
(c) The impairment assessment method and provision accrual on investment The impairment assessment and provision accrual on investments in subsidiaries, associates and joint ventures entities are stated in Note
3(12).
(6) Fixed assets and construction in progress Fixed assets represent the tangible assets held by the Group using in the production of goods, rendering of services and for operation and
administrative purposes with useful life over one year.
Fixed assets are stated in the balance sheet at cost less accumulated depreciation and impairment losses (see Note 3(12)). Construction in progress is stated in the balance sheet at cost less impairment losses (see Note 3(12)).
The cost of a purchased fixed asset comprises the purchase price, related taxes, and any directly attributable expenditure for bringing the asset to working condition for its intended use. The cost of self-constructed assets includes the cost of materials, direct labour, capitalised borrowing costs (see Note 3(19)), and any other costs directly attributable to bringing the asset to working condition for its intended use. According to legal or contractual obligations, costs of dismantling and removing the items and restoring the site on which the related assets located are included in the initial cost.
Construction in progress is transferred to fixed assets when the asset is ready for its intended use. No depreciation is provided against construction in progress.
Where the individual component parts of an item of fixed asset have different useful lives or provide benefits to the Group in different patterns thus necessitating use of different depreciation rates or methods, each part is recognised as a separate fixed asset.
The subsequent costs including the cost of replacing part of an item of fixed assets are recognised in the carrying amount of the item if the recognition criteria are satisfied, and the carrying amount of the replaced part is derecognised. The costs of the day-to-day servicing of fixed assets are recognised in profit or loss as incurred.
The Group terminates the recognition of an item of fixed asset when it is in a state of disposal or it is estimated that it is unable to generate any economic benefits through use or disposal. Gains or losses arising from the retirement or disposal of an item of fixed asset are determined as the difference between the net disposal proceeds and the carrying amount of the item and are recognised in profit or loss on the date of retirement or disposal.
Other than oil and gas properties, the cost of fixed assets less residual value and accumulated impairment losses is depreciated using the straight-line method over their estimated useful lives, unless the fixed asset is classified as held for sale (see Note 3(10)). The estimated useful lives and the estimated rate of residual values adopted for respective classes of fixed assets are as follows:
Estimated Estimated rateuseful life of residual value
Plants and buildings 12-50 years 3%Equipment, machinery and others 4-30 years 3%
Useful lives, residual values and depreciation methods are reviewed at least each year end.
93CHINA PETROLEUM & CHEMICAL CORPORATION Annual Report 2016
NOTES TO THE FINANCIAL STATEMENTS (CONTINUED)for the year ended 31 December 2016
Fina
ncia
l S
tate
men
ts (
PR
C)
3 SIGNIFICANT ACCOUNTING POLICIES (Continued)
(7) Oil and gas properties Oil and gas properties include the mineral interests in properties, wells and related support equipment arising from oil and gas exploration and
production activities.
The acquisition cost of mineral interest is capitalised as oil and gas properties. Costs of development wells and related support equipment are capitalised. The cost of exploratory wells is initially capitalised as construction in progress pending determination of whether the well has found proved reserves. Exploratory well costs are charged to expenses upon the determination that the well has not found proved reserves. However, in the absence of a determination of the discovery of proved reserves, exploratory well costs are not carried as an asset for more than one year following completion of drilling. If, after one year has passed, a determination of the discovery of proved reserves cannot be made, the exploratory well costs are impaired and charged to expense. All other exploration costs, including geological and geophysical costs, are charged to profit or loss in the year as incurred.
The Group estimates future dismantlement costs for oil and gas properties with reference to engineering estimates after taking into consideration the anticipated method of dismantlement required in accordance with the industry practices. These estimated future dismantlement costs are discounted at credit-adjusted risk-free rate and are capitalised as oil and gas properties, which are subsequently amortised as part of the costs of the oil and gas properties.
Capitalised costs of proved oil and gas properties are amortised on a unit-of-production method based on volumes produced and reserves.
(8) Intangible assets Intangible assets, where the estimated useful life is finite, are stated in the balance sheet at cost less accumulated amortisation and provision
for impairment losses (see Note 3(12)). For an intangible asset with finite useful life, its cost less estimated residual value and accumulated impairment losses is amortised on a straight-line basis over the expected useful lives, unless the intangible assets are classified as held for sale (see Note 3(10)).
An intangible asset is regarded as having an indefinite useful life and is not amortised when there is no foreseeable limit to the year over which the asset is expected to generate economic benefits for the Group.
Useful lives and amortisation methods are reviewed at least each year end.
(9) Goodwill The initial cost of goodwill represents the excess of cost of acquisition over the acquirer’s interest in the fair value of the identifiable net assets
of the acquiree under the business combination involving entities not under common control.
Goodwill is not amortised and is stated at cost less accumulated impairment losses (see Note 3(12)). On disposal of an asset group or a set of asset groups, any attributable amount of purchased goodwill is written off and included in the calculation of the profit or loss on disposal.
(10) Held for sale and discontinued operation Non-current assets or disposal group that meet the following conditions will be classified as held for sale. (i) for the non-current assets or the
disposal group, they can only be sold immediately in current condition, according to the usual terms of selling the assets or disposal group; (ii) the Group has made the resolution and obtain the appropriate approval on disposal of the non-current assets or the disposal group; (iii) the Group has signed an irrevocable transfer agreement with the transferee; (iv) the transfer will be completed within one year.
Non-current assets, except for financial assets and deferred tax assets that satisfy the cognition criteria for assets held for sale are stated at the lower of carrying amount and the fair value less costs to sell. Any excess of the original carrying amount over the fair value less costs to sell is recognised as asset impairment loss.
The assets and liabilities in the non-current asset or disposal groups which have been classified as assets held for sale are classified as current assets and current liabilities, and are presented separately in the consolidated balance sheet.
A discontinued operation is a component of the Group that either has been disposed of, or is classified as held for sale, can be clearly distinguished operationally and for financial reporting purposes from the rest of the Group and (i) represents a separate major line of business or geographical area of operations, (ii) is part of a single coordinated plan to dispose of a separate major line of business or geographical area of operations, or (iii) is a subsidiary acquired exclusively with a view to resale.
94 CHINA PETROLEUM & CHEMICAL CORPORATIONAnnual Report 2016
NOTES TO THE FINANCIAL STATEMENTS (CONTINUED)for the year ended 31 December 2016
Fina
ncia
l S
tate
men
ts (
PR
C)
3 SIGNIFICANT ACCOUNTING POLICIES (Continued)
(11) Financial InstrumentsFinancial instruments of the Group include cash and cash equivalents, bond investments, equity securities other than long-term equity investments, receivables, derivative financial instruments, payables, loans, bonds payable, and share capital, etc.
(a) Classification, recognition and measurement of financial instruments The Group recognises a financial asset or a financial liability on its balance sheet when the Group enters into and becomes a party to the
underlining contract of the financial instrument.
The Group classifies financial assets and liabilities into different categories at initial recognition based on the purpose of acquiring assets and assuming liabilities: financial assets and financial liabilities at fair value through profit or loss, loans and receivables, held-to-maturity investments, available-for-sale financial assets and other financial liabilities.
Financial assets and financial liabilities are initially recognised at fair value. For financial asset or financial liability of which the change in its fair value is recognised in profit or loss, the relevant transaction cost is recognised in profit or loss. The transaction costs for other financial assets or financial liabilities are included in the initially recognised amount. Subsequent to initial recognition financial assets and liabilities are measured as follows:
— Financial asset or financial liability with change in fair value recognised through profit or loss
A financial asset or financial liability is classified as at fair value through profit or loss if it is acquired or incurred principally for the purpose of selling or repurchasing in the near term or if it is a derivative, unless the derivative is a designated and effective hedging instrument, or a financial guarantee contract, or a derivative that is linked to and must be settled by delivery of an unquoted equity instrument (without a quoted price from an active market) whose fair value cannot be reliably measured. These financial instruments are initially measured at fair value with subsequently changes in fair value recognised in profit or loss. Subsequent to initial recognition, financial assets and financial liabilities at fair value through profit or loss are measured at fair value, and changes therein are recognised in profit or loss.
— Loans and Receivables
Loans and Receivables are non-derivative financial assets with fixed or determinable recoverable amount and with no quoted price in active market. After the initial recognition, loans and receivables are measured at amortised cost using the effective interest rate method.
— Held-to-maturity investment
Held-to-maturity investment includes non-derivative financial assets with fixed or determinable recoverable amount and fixed maturity that the Group has the positive intention and ability to hold to maturity. Subsequent to initial recognition, held-to-maturity investments are measured at amortised cost using the effective interest method.
— Available-for-sale financial assets
Available-for-sale financial assets include non-derivative financial assets that are designated as available for sales and other financial assets which do not fall into any of the above categories.
Available-for-sale financial assets whose fair value cannot be measured reliably are measured at cost subsequent to initial recognition. Other than the above equity instrument investments whose fair values cannot be measured reliably, other available-for-sale financial assets are initially stated at fair values. The gains or losses arising from changes in the fair value are directly recognised in equity, except for the impairment losses and exchange differences from monetary financial assets denominated in foreign currencies, which are recognised in profit or loss. The cumulative gains and losses previously recognised in equity are transferred to profit or loss when the available-for-sale financial assets are derecognised. Dividend income from these equity instruments is recognised in profit or loss when the investee declares the dividends. Interest on available-for-sale debt instrument investments calculated using the effective interest rate method is recognised in profit or loss (see Note 3(17) (c)).
— Other financial liabilities
Financial liabilities other than the financial liabilities at fair value through profit or loss are classified as other financial liabilities.
Other financial liabilities include the liabilities arising from financial guarantee contracts. Financial guarantees are contracts that require the issuer (i.e. the guarantor) to make specified payments to reimburse the beneficiary of the guarantee (the holder) for a loss the holder incurs because a specified debtor fails to make payment when due in accordance with the terms of a debt instrument. Where the Group issues a financial guarantee, subsequent to initial recognition, the guarantee is measured at the higher of the amount initially recognised less accumulated amortisation and the amount of a provision determined in accordance with the principles of contingencies (see Note 3(16)).
Except for the other financial liabilities described above, subsequent to initial recognition, other financial liabilities are measured at amortised cost using the effective interest method.
95CHINA PETROLEUM & CHEMICAL CORPORATION Annual Report 2016
NOTES TO THE FINANCIAL STATEMENTS (CONTINUED)for the year ended 31 December 2016
Fina
ncia
l S
tate
men
ts (
PR
C)
3 SIGNIFICANT ACCOUNTING POLICIES (Continued)
(11) Financial Instruments (Continued)
(b) Disclosure of financial assets and financial liabilities In the balance sheet, financial assets and liabilities are not offset unless all the following conditions are met:
— the Group has a legally enforceable right to set off financial assets against financial liabilities; and
— the Group intends to settle the financial assets and liabilities on a net basis, or to realise the assets and settle the liabilities simultaneously.
(c) Determination of fair value If there is an active market for a financial asset or financial liability, the quoted price in the active market is used to establish the fair value
of the financial asset or financial liability.
If no active market exists for a financial instrument, a valuation technique is used to establish the fair value. Valuation techniques include using arm’s length market transactions between knowledge, and willing parties; reference to the current fair value of other instrument that is substantially the same; discounted cash flows and option pricing model. The Group calibrates the valuation technique and tests it for validity periodically.
(d) Hedge accounting Hedge accounting is a method which recognises the offsetting effects on profit or loss of changes in the fair values of the hedging instrument
and the hedged item in the same accounting period(s).
Hedged items are the items that expose the Group to risks of changes in fair value or future cash flows and that are designated as being hedged. The Group’s hedged items include fixed-rate borrowings that expose the Group to risk of changes in fair values, floating rate borrowings that expose the Group to risk of variability in cash flows, and a forecast transaction that is settled with a fixed amount of foreign currency and expose the Group to foreign currency risk, and a forecast transaction that is settled with an undetermined future market price and exposes the Group to risk of variability in cash flows, etc.
A hedging instrument is a designated derivative whose changes in fair value or cash flows are expected to offset changes in the fair value or cash flows of the hedged item.
The hedge is assessed by the Group for effectiveness on an ongoing basis and determined to have been highly effective throughout the accounting periods for which the hedging relationship was designated. The Group uses a ratio analysis to assess the subsequent effectiveness of a cash flow hedge, and uses a regression analysis to assess the subsequent effectiveness of a fair value hedge.
— Cash flow hedges
A cash flow hedge is a hedge of the exposure to variability in cash flows. The portion of the gain or loss on the hedging instrument that is determined to be an effective hedge is recognised directly in shareholders’ equity as a separate component. That effective portion is adjusted to the lesser of the following (in absolute amounts):
— the cumulative gain or loss on the hedging instrument from inception of the hedge;
— the cumulative change in present value of the expected future cash flows on the hedged item from inception of the hedge.
The portion of the gain or loss on the hedging instrument that is determined to be an ineffective hedge is recognised in profit or loss.
If a hedge of a forecast transaction subsequently results in the recognition of a non-financial asset, the associated gain or loss is removed from shareholders’ equity, included in the initial cost of the non-financial asset, and recognised in profit or loss in the same year during which the non-financial asset affects profit or loss. However, if the Group expects that all or a portion of a net loss recognised directly in shareholders’ equity will not be recovered in future accounting periods, it reclassifies the amount that is not expected to be recovered into profit or loss.
If a hedge of a forecast transaction subsequently results in the recognition of a financial asset or a financial liability, the associated gain or loss is removed from equity and recognised in profit or loss in the same period during which the financial asset or financial liability affects profit or loss. However, if the Group expects that all or a portion of a net loss recognised directly in shareholders’ equity will not be recovered in future accounting periods, it reclassifies the amount that is not expected to be recovered into profit or loss.
For cash flow hedges, other than those covered by the preceding two policy statements, the associated gain or loss is removed from shareholders’ equity and recognised in profit or loss in the same period or periods during which the hedged forecast transaction affects profit or loss.
When a hedging instrument expires or is sold, terminated or exercised, or the hedge no longer meets the criteria for hedge accounting, the Group will discontinue the hedge accounting treatments prospectively. In this case, the gain or loss on the hedging instrument that remains recognised directly in shareholders’ equity from the period when the hedge was effective shall not be reclassified into profit or loss and is recognised in accordance with the above policy when the forecast transaction occurs. If the forecast transaction is no longer expected to occur, the gain or loss on the hedging instrument that remains recognised directly in shareholders’ equity from the period when the hedge was effective shall be reclassified into profit or loss immediately.
96 CHINA PETROLEUM & CHEMICAL CORPORATIONAnnual Report 2016
NOTES TO THE FINANCIAL STATEMENTS (CONTINUED)for the year ended 31 December 2016
Fina
ncia
l S
tate
men
ts (
PR
C)
3 SIGNIFICANT ACCOUNTING POLICIES (Continued)
(11) Financial Instruments (Continued)
(d) Hedge accounting (Continued)
— Fair value hedges
A fair value hedge is a hedge of the exposure to changes in fair value of a recognised asset or liability or an unrecognised firm commitment, or an identified portion of such an asset, liability or unrecognised firm commitment.
The gain or loss from remeasuring the hedging instrument at fair value is recognised in profit or loss. The gain or loss on the hedged item attributable to the hedged risk adjusts the carrying amount of the hedged item and is recognised in profit or loss.
When a hedging instrument expires or is sold, terminated or exercised, or no longer meets the criteria for hedge accounting, the Group discontinues prospectively the hedge accounting treatments. If the hedged item is a financial instrument measured at amortised cost, any adjustment to the carrying amount of the hedged item is amortised to profit or loss from the adjustment date to the maturity date using the recalculated effective interest rate at the adjustment date.
— Hedge of net investment in foreign operation
A hedge of a net investment in a foreign operation is a hedge of the exposure to foreign exchange risk associated with a net investment in a foreign operation. The portion of the gain or loss on a hedging instrument that is determined to be an effective hedge is recognised directly in equity as a separate component until the disposal of the foreign operation, at which time the cumulative gain or loss recognised directly in equity is recognised in profit or loss. The ineffective portion is recognised immediately in profit or loss.
(e) Convertible bonds
— Convertible bonds that contain an equity component
Convertible bonds that can be converted to equity share capital at the option of the holder, where the number of shares that would be issued on conversion and the value of the consideration that would be received at that time do not vary, are accounted for as compound financial instruments which contain both a liability component and an equity component.
At initial recognition, the liability component of the convertible bonds is measured as the present value of the future interest and principal payments, discounted at the market rate of interest applicable at the time of initial recognition to similar liabilities that do not have a conversion option. Any excess of proceeds over the amount initially recognised as the liability component is recognised as the equity component. Transaction costs that relate to the issue of the convertible bonds are allocated to the liability and equity components in proportion to the allocation of proceeds.
Subsequent to initial recognition, the liability component of a convertible corporate bond is measured at amortised cost using the effective interest method, unless it is designated at fair value through profit or loss. The equity component of a convertible corporate bond is not remeasured subsequent to initial recognition.
If the convertible corporate bond is converted, the liability component, together with the equity component, is transferred to share capital and capital reserve (share premium). If the convertible corporate bond is redeemed, the consideration paid for the redemption, together with the transaction costs that relate to the redemption, are allocated to the liability and equity components. The difference between the allocated and carrying amounts is charged to profit or loss if it relates to the liability component or is directly recognised in equity if it relates to the equity component.
— Other convertible bonds
Convertible bonds issued with a cash settlement option and other embedded derivative features are split into liability and derivative components.
At initial recognition, the derivative component of the convertible bonds is measured at fair value. Any excess of proceeds over the amount initially recognised as the derivative component is recognised as the liability component. Transaction costs that relate to the issue of the convertible bonds are allocated to the liability and derivative components in proportion to the allocation of proceeds. The portion of the transaction costs relating to the liability component is recognised initially as part of the liability. The portion relating to the derivative component is recognised immediately as an expense in profit or loss.
The derivative component is subsequently remeasured at each balance sheet date and any gains or losses arising from change in the fair value are recognised in profit or loss. The liability component is subsequently carried at amortised cost using the effective interest method until extinguished on conversion or redemption. Both the liability and the related derivative components are presented together for financial statements reporting purposes.
If the convertible bonds are converted, the carrying amounts of the derivative and liability components are transferred to share capital and share premium as consideration for the shares issued. If the convertible bonds are redeemed, any difference between the amount paid and the carrying amount of both components is recognised in profit or loss.
97CHINA PETROLEUM & CHEMICAL CORPORATION Annual Report 2016
NOTES TO THE FINANCIAL STATEMENTS (CONTINUED)for the year ended 31 December 2016
Fina
ncia
l S
tate
men
ts (
PR
C)
3 SIGNIFICANT ACCOUNTING POLICIES (Continued)
(11) Financial Instruments (Continued)
(f) Derecognition of financial assets and financial liabilities The Group derecognises a financial asset when the contractual right to receive cash flows from the financial asset expires, or where the Group
transfers substantially all risks and rewards of ownership of the financial asset, or where the Group neither transfers nor retains substantially all risks and rewards of ownership of the financial asset but the Group gives up the control of a financial asset.
On derecognition of a financial asset, the difference between the following amounts is recognised in profit or loss:
— the carrying amounts; and
— the sum of the consideration received and any cumulative gain or loss that had been recognised directly in equity.
Where the obligations for financial liabilities are completely or partially discharged, the entire or parts of financial liabilities are derecognised.
(12) Impairment of financial assets and non-financial long-term assets
(a) Impairment of financial assets The carrying amount of financial assets (except those financial assets stated at fair value with changes in the fair values charged to profit or
loss) are reviewed at each balance sheet date to determine whether there is objective evidence of impairment. If any such evidence exists, impairment loss is provided.
Objective evidences of impairment include but not limited to:
(i) significant financial difficulty of the debtor;
(ii) a breach of contract, such as a default or delinquency in interest or principal payments;
(iii) it becoming probable that the debtor will enter bankruptcy or other financial reorganisation;
(iv) due to the significant financial difficulty of the debtor, financial assets is unable to be traded in active market;
(v) significant changes in the technological, market, economic or legal environment that have an adverse effect on the debtor; and the cost of investment may not be recoverable; and
(vi) a significant or prolonged decline in the fair value of an investment in an equity instrument below its cost.
— Receivables and held-to-maturity investments
Receivables are assessed for impairment on the combination of an individual basis and the aging analysis.
Held-to-maturity investments are assessed for impairment on an individual basis.
Where impairment is assessed on an individual basis, an impairment loss in respect of a receivable or held-to-maturity investment is calculated as the excess of its carrying amount over the present value of the estimated future cash flows (exclusive of future credit losses that have not been incurred) discounted at the original effective interest rate. All impairment losses are recognised in profit or loss.
Impairment loss on receivables and held-to-maturity investments is reversed in profit or loss if evidence suggests that the financial assets’ carrying amounts have increased and the reason for the increase is objectively as a result of an event occurred after the recognition of the impairment loss. The reversed carrying amount shall not exceed the amortised cost if the financial assets had no impairment recognised.
— Available-for-sale financial assets
Available-for-sale financial assets are assessed for impairment on an individual basis. Objective evidence of impairment for equity instruments classified as available-for-sale includes information about significant but not temporary decline in the fair value of the equity investment instrument below its cost. The Group assesses equity instruments classified as available-for-sale separately at the end of each reporting period, it will be considered as impaired if the fair value of the equity instrument at reporting date is less than its initial investment cost over 50% (including 50%) or the duration of the fair value below its initial investment cost is more than one (including one) year, if the fair value of the equity instrument at reporting date is less than its initial investment cost over 20% (including 20%) but below 50%, other related factors such as price volatility will be taken into consideration to assess if it is impaired.
98 CHINA PETROLEUM & CHEMICAL CORPORATIONAnnual Report 2016
NOTES TO THE FINANCIAL STATEMENTS (CONTINUED)for the year ended 31 December 2016
Fina
ncia
l S
tate
men
ts (
PR
C)
3 SIGNIFICANT ACCOUNTING POLICIES (Continued)
(12) Impairment of financial assets and non-financial long-term assets (Continued)
(a) Impairment of financial assets (Continued)When available-for-sale financial assets measured at fair value are impaired, despite not being derecognised, the cumulative losses resulted from the decrease in fair value which had previously been recognised directly in shareholders’ equity, are reversed and charged to profit or loss.
When available-for-sale financial assets measured at cost are impaired, the differences between the book value and the discounted present value with the market return of similar financial assets are charged to profit or loss.
Impairment loss of available-for-sale debt instrument is reversed, if the reason for the subsequent increase in fair value is objectively as a result of an event occurred after the recognition of the impairment loss. Impairment loss for available-for-sale equity instrument is not reversed through profit or loss. Impairment loss for available-for-sale financial assets measured by the cost cannot be reversed in the following period.
(b) Impairment of other non-financial long-term assets Internal and external sources of information are reviewed at each balance sheet date for indications that the following assets, including fixed
assets, oil and gas properties, construction in progress, goodwill, intangible assets and investments in subsidiaries, associates and joint ventures may be impaired.
Assets are tested for impairment whenever events or changes in circumstances indicate that their carrying amounts may not be recoverable. The recoverable amounts of goodwill and intangible assets with uncertain useful lives are estimated annually no matter there are any indications of impairment. Goodwill is tested for impairment together with related asset units or groups of asset units.
An asset unit is the smallest identifiable group of assets that generates cash inflows largely independent of the cash inflows from other assets or groups of assets. An asset unit comprises related assets that generate associated cash inflows. In identifying an asset unit, the Group primarily considers whether the asset unit is able to generate cash inflows independently as well as the management style of production and operational activities, and the decision for the use or disposal of asset.
The recoverable amount is the greater of the fair value less costs to sell and the present value of expected future cash flows generated by the asset (or asset unit, set of asset units).
Fair value less costs to sell of an asset is based on its selling price in an arm’s length transaction less any direct costs attributable to the disposal. Present value of expected future cash flows is the estimation of future cash flows to be generated from the use of and upon disposal of the asset, discounted at an appropriate pre-tax discount rate over the asset’s remaining useful life.
If the recoverable amount of an asset is less than its carrying amount, the carrying amount is reduced to the recoverable amount. The amount by which the carrying amount is reduced is recognised as an impairment loss in profit or loss. A provision for impairment loss of the asset is recognised accordingly. Impairment losses related to an asset unit or a set of asset units first reduce the carrying amount of any goodwill allocated to the asset unit or set of asset units, and then reduce the carrying amount of the other assets in the asset unit or set of asset units on a pro rata basis. However, the carrying amount of an impaired asset will not be reduced below the highest of its individual fair value less costs to sell (if determinable), the present value of expected future cash flows (if determinable) and zero.
Impairment losses for assets are not reversed.
99CHINA PETROLEUM & CHEMICAL CORPORATION Annual Report 2016
NOTES TO THE FINANCIAL STATEMENTS (CONTINUED)for the year ended 31 December 2016
Fina
ncia
l S
tate
men
ts (
PR
C)
3 SIGNIFICANT ACCOUNTING POLICIES (Continued)
(13) Long-term deferred expenses Long-term deferred expenses are amortised on a straight-line basis over their beneficial periods.
(14) Employee benefits Employee benefits are all forms of considerations and compensation given in exchange for services rendered by employees, including short term
compensation, post-employment benefits, termination benefits and other long term employee benefits.
(a) Short term compensationShort term compensation includes salaries, bonuses, allowances and subsidies, employee benefits, medical insurance premiums, work-related injury insurance premium, maternity insurance premium, contributions to housing fund, unions and education fund and short-term absence with payment etc. When an employee has rendered service to the Group during an accounting period, the Group shall recognise the short term compensation actually incurred as a liability and charged to the cost of an asset or to profit or loss in the same period, and non-monetary benefits are valued with the fair value.
(b) Post-employment benefitsThe Group classifies post-employment benefits into either Defined Contribution Plan (DC plan) or Defined Benefit Plan (DB plan). DC plan means the Group only contributes a fixed amount to an independent fund and no longer bears other payment obligation; DB plan is post-employment benefits other than DC plan. In this reporting period, the post-employment benefits of the Group primarily comprise basic pension insurance and unemployment insurance and both of them are DC plans.
Basic pension insurance
Employees of the Group participate in the social insurance system established and managed by local labor and social security department. The Group makes basic pension insurance to the local social insurance agencies every month, at the applicable benchmarks and rates stipulated by the government for the benefits of its employees. After the employees retire, the local labor and social security department has obligations to pay them the basic pension. When an employee has rendered service to the Group during an accounting period, the Group shall recognise the accrued amount according to the above social security provisions as a liability and charged to the cost of an asset or to profit or loss in the same period.
(c) Termination benefitsWhen the Group terminates the employment relationship with employees before the employment contracts expire, or provides compensation as an offer to encourage employees to accept voluntary redundancy, a provision for the termination benefits provided is recognised in profit or loss under the conditions of both the Group has a formal plan for the termination of employment or has made an offer to employees for voluntary redundancy, which will be implemented shortly; and the Group is not allowed to withdraw from termination plan or redundancy offer unilaterally.
(15) Income tax Current tax and deferred tax are recognised in profit or loss except to the extent that they relate to business combinations and items recognised
directly in equity (including other comprehensive income).
Current tax is the expected tax payable calculated at the applicable tax rate on taxable income for the year, plus any adjustment to tax payable in respect of previous years.
At the balance sheet date, current tax assets and liabilities are offset if the Group has a legally enforceable right to set them off and also intends either to settle on a net basis or to realize the asset and settle the liability simultaneously.
Deferred tax assets and liabilities are recognised based on deductible temporary differences and taxable temporary differences respectively. Temporary difference is the difference between the carrying amounts of assets and liabilities and their tax bases. Unused tax losses and unused tax credits able to be utilised in subsequent years are treated as temporary differences. Deferred tax assets are recognised to the extent that it is probable that future taxable income will be available to offset the deductible temporary differences.
Temporary differences arise in a transaction, which is not a business combination, and at the time of transaction, does not affect accounting profit or taxable profit (or unused tax losses), will not result in deferred tax. Temporary differences arising from the initial recognition of goodwill will not result in deferred tax.
At the balance sheet date, the amounts of deferred tax recognised is measured based on the expected manner of recovery or settlement of the carrying amount of the assets and liabilities, using tax rates that are expected to be applied in the period when the asset is recovered or the liability is settled in accordance with tax laws.

100 CHINA PETROLEUM & CHEMICAL CORPORATIONAnnual Report 2016
NOTES TO THE FINANCIAL STATEMENTS (CONTINUED)for the year ended 31 December 2016
Fina
ncia
l S
tate
men
ts (
PR
C)
3 SIGNIFICANT ACCOUNTING POLICIES (Continued)
(15) Income tax (Continued)The carrying amount of deferred tax assets is reviewed at each balance sheet date. If it is unlikely to obtain sufficient taxable income to offset against the benefit of deferred tax asset, the carrying amount of the deferred tax assets is written down. Any such write-down should be subsequently reversed where it becomes probable that sufficient taxable income will be available.
At the balance sheet date, deferred tax assets and liabilities are offset if all the following conditions are met:
— the taxable entity has a legally enforceable right to offset current tax assets and current tax liabilities; and
— they relate to income taxes levied by the same tax authority on either:
— the same taxable entity; or
— different taxable entities which either to intend to settle the current tax liabilities and assets on a net basis, or to realise the assets and settle the liabilities simultaneously, in each future period in which significant amounts of deferred tax liabilities or assets are expected to be settled or recovered.
(16) Provisions Provisions are recognised when the Group has a present obligation as a result of a contingent event, it is probable that an outflow of economic
benefits will be required to settle the obligations and a reliable estimate can be made. Where the effect of time value of money is material, provisions are determined by discounting the expected future cash flows.
Provisions for future dismantlement costs are initially recognised based on the present value of the future costs expected to be incurred in respect of the Group’s expected dismantlement and abandonment costs at the end of related oil and gas exploration and development activities. Any subsequent change in the present value of the estimated costs, other than the change due to passage of time which is regarded as interest costs, is reflected as an adjustment to the provision of oil and gas properties.
(17) Revenue recognition Revenue is the gross inflow of economic benefits arising in the course of the Group’s normal activities when the inflows result in increase in
shareholder’s equity, other than increase relating to contributions from shareholders. Revenue is recognised in profit or loss when it is probable that the economic benefits will flow to the Group, the revenue and costs can be measured reliably and the following respective conditions are met.
(a) Revenues from sales of goods Revenue from the sales of goods is recognised when all of the general conditions stated above and following conditions are satisfied:
— the significant risks and rewards of ownership and title have been transferred to buyers; and
— the Group does not retain the management rights, which is normally associated with owner, on goods sold and has no control over the goods sold.
Revenue from the sales of goods is measured at fair value of the considerations received or receivable under the sales contract or agreement.
(b) Revenues from rendering services The Group determines the revenue from the rendering of services according to the fair value of the received or to-be received price of the
party that receives the services as stipulated in the contract or agreement.
At the balance sheet date, when the outcome of a transaction involving the rendering of services can be estimated reliably, revenue from rendering of services is recognised in the income statement by reference to the stage of completion of the transaction based on the proportion of services performed to date to the total services to be performed.
When the outcome of rendering the services cannot be estimated reliably, revenues are recognised only to the extent that the costs incurred are expected to be recoverable. If the costs of rendering of services are not expected to be recoverable, the costs are recognised in profit or loss when incurred, and revenues are not recognised.
(c) Interest income Interest income is recognised on a time proportion basis with reference to the principal outstanding and the applicable effective interest rate.

101CHINA PETROLEUM & CHEMICAL CORPORATION Annual Report 2016
NOTES TO THE FINANCIAL STATEMENTS (CONTINUED)for the year ended 31 December 2016
Fina
ncia
l S
tate
men
ts (
PR
C)
3 SIGNIFICANT ACCOUNTING POLICIES (Continued)
(18) Government grants Government grants are the gratuitous monetary assets or non-monetary assets that the Group receives from the government, excluding capital
injection by the government as an investor. Special funds such as investment grants allocated by the government, if clearly defined in official documents as part of “capital reserve” are dealt with as capital contributions, and not regarded as government grants.
Government grants are recognised when there is reasonable assurance that the grants will be received and the Group is able to comply with the conditions attaching to them. Government grants in the form of monetary assets are recorded based on the amount received or receivable, whereas non-monetary assets are measured at fair value.
Government grants received in relation to assets are recorded as deferred income, and recognised evenly in profit or loss over the assets’ useful lives. Government grants received in relation to revenue are recorded as deferred income, and recognised as income in future periods as compensation when the associated future expenses or losses arise; or directly recognised as income in the current period as compensation for past expenses or losses.
(19) Borrowing costs Borrowing costs incurred on borrowings for the acquisition, construction or production of qualified assets are capitalised into the cost of the
related assets.
Except for the above, other borrowing costs are recognised as financial expenses in the income statement when incurred.
(20) Repairs and maintenance expenses Repairs and maintenance (including overhauling expenses) expenses are recognised in profit or loss when incurred.
(21) Environmental expenditures Environmental expenditures that relate to current ongoing operations or to conditions caused by past operations is expensed as incurred.
Liabilities related to future remediation costs are recorded when environmental assessments and/or cleanups are probable and the costs can be reliably estimated. As facts concerning environmental contingencies become known to the Group, the Group reassesses its position both with respect to accrued liabilities and other potential exposures.
(22) Research and development costs Research costs and development costs that cannot meet the capitalisation crateria are recognised in profit or loss when incurred.
(23) Operating leases Operating lease payments are charged as expenses on a straight-line basis over the period of the respective leases.
(24) Dividends Dividends and distributions of profits proposed in the profit appropriation plan which will be authorised and declared after the balance sheet
date, are not recognised as a liability at the balance sheet date and are separately disclosed in the notes to the financial statements. Dividends are recognised as a liability in the period in which they are declared.
(25) Related parties If a party has the power to control, jointly control or exercise significant influence over another party, or vice versa, or where two or more parties
are subject to common control, joint control from another party, they are considered to be related parties. Related parties may be individuals or enterprises. Where enterprises are subject to state control but are otherwise unrelated, they are not related parties. Related parties of the Group and the Company include, but not limited to:
(a) the holding company of the Company;
(b) the subsidiaries of the Company;
(c) the parties that are subject to common control with the Company;
(d) investors that have joint control or exercise significant influence over the Group;
(e) enterprises or individuals if a party has control, joint control over both the enterprises or individuals and the Group;
(f) joint ventures of the Group, including subsidiaries of the joint ventures;
(g) associates of the Group, including subsidiaries of the associates;
(h) principle individual investors of the Group and close family members of such individuals;
102 CHINA PETROLEUM & CHEMICAL CORPORATIONAnnual Report 2016
NOTES TO THE FINANCIAL STATEMENTS (CONTINUED)for the year ended 31 December 2016
Fina
ncia
l S
tate
men
ts (
PR
C)
3 SIGNIFICANT ACCOUNTING POLICIES (Continued)
(25) Related parties (Continued)(i) key management personnel of the Group, and close family members of such individuals;
(j) key management personnel of the Company’s holding company;
(k) close family members of key management personnel of the Company’s holding company; and
(l) an entity which is under control, joint control of principle individual investor, key management personnel or close family members of such individuals.
(26) Segment reporting Reportable segments are identified based on operating segments which are determined based on the structure of the Group’s internal
organisation, management requirements and internal reporting system. An operating segment is a component of the Group that meets the following respective conditions:
— engage in business activities from which it may earn revenues and incur expenses;
— whose operating results are regularly reviewed by the Group’s management to make decisions about resource to be allocated to the segment and assess its performance; and
— for which financial information regarding financial position, results of operations and cash flows are available.
Inter-segment revenues are measured on the basis of actual transaction price for such transactions for segment reporting, and segment accounting policies are consistent with those for the consolidated financial statements.
4 TAXATION
Major types of tax applicable to the Group are income tax, consumption tax, resources tax, value added tax, city construction tax, education surcharge and local education surcharge.
Consumption tax was levied based on sales quantities of taxable products, tax rate of products is presented as below:
Products
Effective from13 December
2014(RMB/Ton)
Effective from13 January
2015(RMB/Ton)
Gasoline 1,943.20 2,109.76Diesel 1,293.60 1,411.20Naphtha 1,939.00 2,105.20Solvent oil 1,794.80 1,948.64Lubricant oil 1,576.40 1,711.52Fuel oil 1,116.50 1,218.00Jet fuel oil 1,370.60 1,495.20
Value added tax rate for liquefied petroleum gas, natural gas and certain agricultural products is 13% and that for other products is 17%.
Pursuant to the ‘Circular on the Overall Promotion of Pilot Program of Levying VAT in place of Business Tax’(Cai Shui [2016] 36) jointly issued by the Ministry of Finance and the State Administration of Taxation, revenue from modern service of the subsidiaries of the Group, are subject to VAT from 1 May 2016, and the applicable tax rate is 6%, while the business tax was from 3% to 5% before then.
103CHINA PETROLEUM & CHEMICAL CORPORATION Annual Report 2016
NOTES TO THE FINANCIAL STATEMENTS (CONTINUED)for the year ended 31 December 2016
Fina
ncia
l S
tate
men
ts (
PR
C)
5 CASH AT BANK AND ON HAND
The Group
At 31 December 2016 At 31 December 2015Original currency Exchange RMB
Original currency Exchange RMB
million rates million million rates million
Cash on hand Renminbi 10 16
Cash at bank Renminbi 91,855 42,030US Dollars 1,499 6.9370 10,406 1,412 6.4936 9,168Hong Kong Dollars 87 0.8945 78 96 0.8378 80Others 75 69 102,424 51,363
Deposits at related parities Renminbi 21,843 14,290US Dollars 2,619 6.9370 18,181 609 6.4936 3,962Other 49 51 40,073 18,303
Total 142,497 69,666
Deposits at related parties represent deposits placed at Sinopec Finance Company Limited and Sinopec Century Bright Capital Investment Limited. Deposits interest is calculated based on market rate.
At 31 December 2016, time deposits with financial institutions of the Group amounted to RMB 18,029 million (2015: RMB 733 million).
At 31 December 2016, structured deposits with financial institutions of the Group amounted to RMB 75,000 million (2015: RMB 25,380 million).
6 BILLS RECEIVABLE
Bills receivable represents mainly the bills of acceptance issued by banks for sales of goods and products.
At 31 December 2016, the Group’s outstanding endorsed or discounted bills (with recourse) amounted to RMB 7,523 million (2015: RMB 5,352 million).
104 CHINA PETROLEUM & CHEMICAL CORPORATIONAnnual Report 2016
NOTES TO THE FINANCIAL STATEMENTS (CONTINUED)for the year ended 31 December 2016
Fina
ncia
l S
tate
men
ts (
PR
C)
7 ACCOUNTS RECEIVABLE
The Group The CompanyAt 31 December At 31 December At 31 December At 31 December
2016 2015 2016 2015RMB million RMB million RMB million RMB million
Amounts due from subsidiaries — — 33,142 24,222Amounts due from Sinopec Group Company and fellow subsidiaries 6,398 18,672 1,662 677Amounts due from associates and joint ventures 4,580 3,734 2,036 1,980Amounts due from others 39,994 34,261 1,720 2,771 50,972 56,667 38,560 29,650Less: Allowance for doubtful accounts 683 525 228 138Total 50,289 56,142 38,332 29,512
Ageing analysis on accounts receivable is as follows:
The GroupAt 31 December 2016 At 31 December 2015
Amount
Percentage to total
accounts receivable Allowance
Percentage of allowance to accounts receivable
balance Amount
Percentage to total
accounts receivable Allowance
Percentage of allowance to accounts
receivable balance
RMB million % RMB million % RMB million % RMB million %
Within one year 49,854 97.8 — — 55,385 97.8 7 —Between one and two years 464 0.9 231 49.8 750 1.3 35 4.7Between two and three years 225 0.4 48 21.3 59 0.1 23 39.0Over three years 429 0.9 404 94.2 473 0.8 460 97.3Total 50,972 100.0 683 56,667 100.0 525
The CompanyAt 31 December 2016 At 31 December 2015
Amount
Percentage to total
accounts receivable Allowance
Percentage of allowance to accounts receivable
balance Amount
Percentage to total
accounts receivable Allowance
Percentage of allowance to accounts
receivable balance
RMB million % RMB million % RMB million % RMB million %
Within one year 38,023 98.7 — — 24,578 82.8 — —Between one and two years 357 0.9 114 31.9 2,809 9.5 12 0.4Between two and three years 49 0.1 10 20.4 2,125 7.2 2 0.1Over three years 131 0.3 104 79.4 138 0.5 124 89.9Total 38,560 100.0 228 29,650 100.0 138
At 31 December 2016 and 2015, the total amounts of the top five accounts receivable of the Group are set out below:
At 31 December At 31 December2016 2015
Total amount (RMB million) 14,967 20,975Percentage to the total balance of accounts receivable 29.4% 37.0%Allowance for doubtful accounts — —
During the year ended 31 December 2016 and 2015, the Group and the Company had no individually significant accounts receivable been fully or substantially provided allowance for doubtful accounts.
During the year ended 31 December 2016 and 2015, the Group and the Company had no individually significant write-off or recovery of doubtful debts which had been fully or substantially provided in prior years.

105CHINA PETROLEUM & CHEMICAL CORPORATION Annual Report 2016
NOTES TO THE FINANCIAL STATEMENTS (CONTINUED)for the year ended 31 December 2016
Fina
ncia
l S
tate
men
ts (
PR
C)
8 OTHER RECEIVABLES
The Group The CompanyAt 31 December At 31 December At 31 December At 31 December
2016 2015 2016 2015RMB million RMB million RMB million RMB million
Amounts due from subsidiaries — — 40,824 61,621Amounts due from Sinopec Group Company and fellow subsidiaries 8,019 2,694 164 2,229Amounts due from associates and joint ventures 4,841 308 3,986 4Amounts due from others 14,085 19,843 1,793 2,029 26,945 22,845 46,767 65,883Less: Allowance for doubtful accounts 1,349 1,392 1,124 1,263Total 25,596 21,453 45,643 64,620
Ageing analysis of other receivables is as follows:
The GroupAt 31 December 2016 At 31 December 2015
Amount
Percentage to total
other receivables Allowance
Percentage of allowance
to other receivables
balance Amount
Percentage to total
other receivables Allowance
Percentage of allowance
to other receivables
balanceRMB million % RMB million % RMB million % RMB million %
Within one year 24,316 90.2 57 0.2 20,067 87.9 2 —Between one and two years 515 2.0 32 6.2 484 2.1 9 1.9Between two and three years 254 0.9 13 5.1 211 0.9 14 6.6Over three years 1,860 6.9 1,247 67.0 2,083 9.1 1,367 65.6Total 26,945 100.0 1,349 22,845 100.0 1,392
The CompanyAt 31 December 2016 At 31 December 2015
Amount
Percentage to total
other receivables Allowance
Percentage of allowance
to other receivables
balance Amount
Percentage to total
other receivables Allowance
Percentage of allowance
to other receivables
balanceRMB million % RMB million % RMB million % RMB million %
Within one year 34,217 73.1 — — 43,852 66.6 — —Between one and two years 2,740 5.9 1 — 5,341 8.1 1 —Between two and three years 5,237 11.2 1 — 14,787 22.4 2 —Over three years 4,573 9.8 1,122 24.5 1,903 2.9 1,260 66.2Total 46,767 100.0 1,124 65,883 100.0 1,263
At 31 December 2016 and 2015, the total amounts of the top five other receivables of the Group are set out below:
At 31 December At 31 December2016 2015
Total amount (RMB million) 11,226 8,095Ageing Within one year Within one yearPercentage to the total balance of other receivables 41.7% 35.4%Allowance for doubtful accounts — —
During the year ended 31 December 2016 and 2015, the Group and the Company had no individually significant other receivables been fully or substantially provided allowance for doubtful accounts.
During the year ended 31 December 2016 and 2015, the Group and the Company had no individually significant write-off or recovery of doubtful debts which had been fully or substantially provided in prior years.
106 CHINA PETROLEUM & CHEMICAL CORPORATIONAnnual Report 2016
NOTES TO THE FINANCIAL STATEMENTS (CONTINUED)for the year ended 31 December 2016
Fina
ncia
l S
tate
men
ts (
PR
C)
9 PREPAYMENTS
The Group The CompanyAt 31 December At 31 December At 31 December At 31 December
2016 2015 2016 2015RMB million RMB million RMB million RMB million
Amounts to subsidiaries — — 3,043 690Amounts to Sinopec Group Company and fellow subsidiaries 206 86 58 50Amounts to associates and joint ventures 24 47 — —Amounts to others 3,550 2,810 364 572 3,780 2,943 3,465 1,312Less: Allowance for doubtful accounts 31 23 11 16Total 3,749 2,920 3,454 1,296
Ageing analysis of prepayments is as follows:
The GroupAt 31 December 2016 At 31 December 2015
Amount
Percentage to total
prepayments Allowance
Percentageof allowance
to prepayments
balance Amount
Percentage to total
prepayments Allowance
Percentageof allowance
to prepayments
balanceRMB million % RMB million % RMB million % RMB million %
Within one year 3,465 91.7 — — 2,826 96.0 — —Between one and two years 211 5.6 12 5.7 82 2.8 — —Between two and three years 72 1.9 1 1.4 6 0.2 1 16.7Over three years 32 0.8 18 56.3 29 1.0 22 75.9Total 3,780 100.0 31 2,943 100.0 23
The CompanyAt 31 December 2016 At 31 December 2015
Amount
Percentage to total
prepayments Allowance
Percentageof allowance
to prepayments
balance Amount
Percentage to total
prepayments Allowance
Percentageof allowance
to prepayments
balanceRMB million % RMB million % RMB million % RMB million %
Within one year 3,306 95.4 — — 1,072 81.7 — —Between one and two years 62 1.8 — — 141 10.7 — —Between two and three years 13 0.4 — — 43 3.3 1 2.3Over three years 84 2.4 11 13.1 56 4.3 15 26.8Total 3,465 100.0 11 1,312 100.0 16
At 31 December 2016 and 2015, the total amounts of the top five prepayments of the Group are set out below:
At 31 December At 31 December2016 2015
Total amount (RMB million) 1,354 1,202Percentage to the total balance of prepayments 35.8% 40.8%
10 INVENTORIES
The Group
At 31 December At 31 December2016 2015
RMB million RMB million
Raw materials 75,680 59,376Work in progress 14,141 22,762Finished goods 65,772 66,320Spare parts and consumables 1,838 1,552 157,431 150,010Less: Provision for diminution in value of inventories 920 4,402Total 156,511 145,608
Provision for diminution in value of inventories is mainly against finished goods and raw materials. For the year ended 31 December 2016, the provision for diminution in value of inventories of the Group was primarily due to the costs of finished goods and raw materials of the refining segment and chemical segment were higher than their net realizable value.

107CHINA PETROLEUM & CHEMICAL CORPORATION Annual Report 2016
NOTES TO THE FINANCIAL STATEMENTS (CONTINUED)for the year ended 31 December 2016
Fina
ncia
l S
tate
men
ts (
PR
C)
11 AVAILABLE-FOR-SALE FINANCIAL ASSETS
At 31 December At 31 December2016 2015
RMB million RMB million
Equity securities, listed and at quoted market price 262 261Other investment, unlisted and at cost 11,175 10,732 11,437 10,993Less: Impairment loss for investments 29 29Total 11,408 10,964
Other investment, unlisted and at cost, represents the Group’s interests in privately owned enterprises which are mainly engaged in oil and natural gas activities and chemical production.
The impairment losses relating to investments for the year ended 31 December 2016 amounted to nil (2015: nil).
12 LONG-TERM EQUITY INVESTMENTS
The Group
Investmentsin joint ventures
Investmentsin associates
Provision forimpairment
losses TotalRMB million RMB million RMB million RMB million
Balance at 1 January 2016 43,581 41,389 (677) 84,293Additions for the year 995 24,817 — 25,812Share of profits less losses under the equity method 7,422 1,884 — 9,306Change of other comprehensive income/(loss) under the equity method 184 (139) — 45Other equity movement under the equity method 2 16 — 18Dividends declared (3,106) (1,447) — (4,553)Disposals for the year (1) (70) — (71)Reclassification 96 (96) — —Other movements 1,523 484 — 2,007Movement of provision for impairment — — (45) (45)Balance at 31 December 2016 50,696 66,838 (722) 116,812
The Company
Investments insubsidiaries
Investmentsin joint
venturesInvestments in
associates
Provision forimpairment
losses TotalRMB million RMB million RMB million RMB million RMB million
Balance at 1 January 2016 199,060 13,840 13,987 (7,657) 219,230Additions for the year 46,695 942 139 — 47,776Share of profits less losses under the equity method — 2,883 866 — 3,749Change of other comprehensive loss under the equity method — — (149) — (149)Dividends declared — (1,993) (152) — (2,145)Disposals for the year (10) — — — (10)Investments transferred to subsidiaries 176 (176) — — —Balance at 31 December 2016 245,921 15,496 14,691 (7,657) 268,451
For the year 2016, the Group and the Company had no individually significant long-term investment impairment.
Details of the Company’s principal subsidiaries are set out in Note 53.
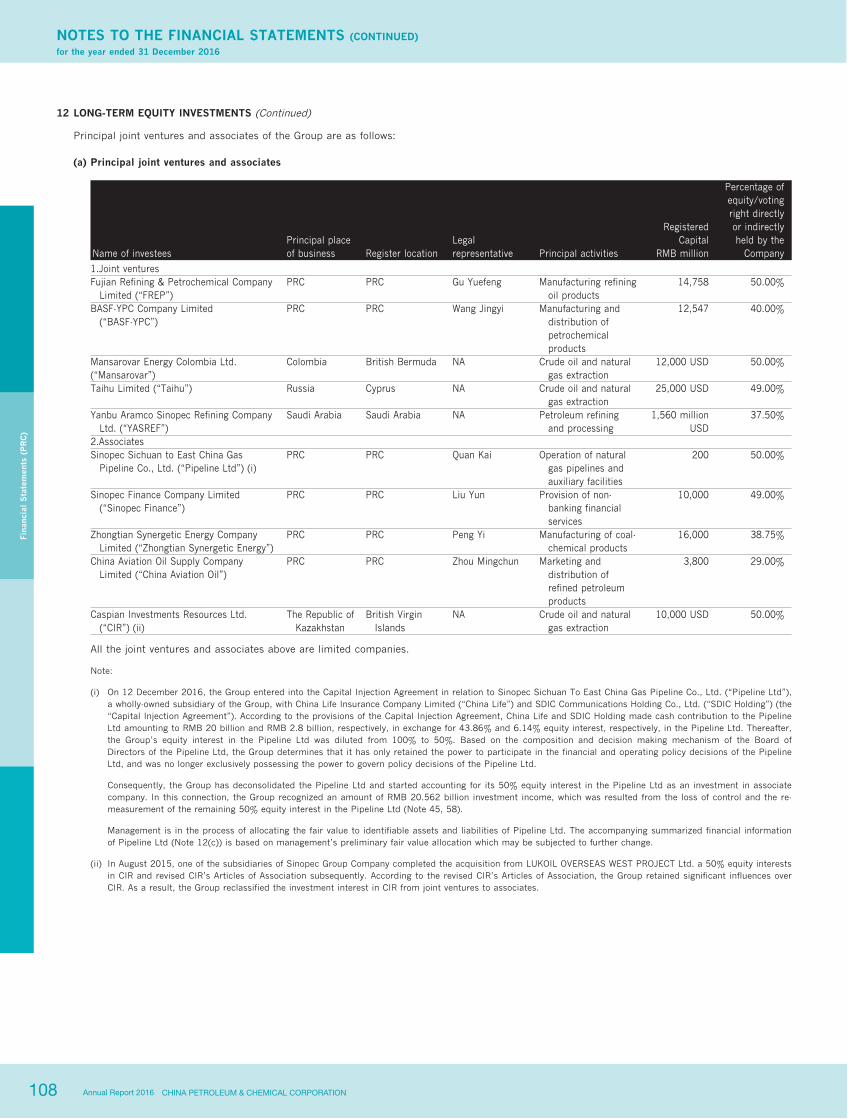
108 CHINA PETROLEUM & CHEMICAL CORPORATIONAnnual Report 2016
NOTES TO THE FINANCIAL STATEMENTS (CONTINUED)for the year ended 31 December 2016
Fina
ncia
l S
tate
men
ts (
PR
C)
12 LONG-TERM EQUITY INVESTMENTS (Continued)
Principal joint ventures and associates of the Group are as follows:
(a) Principal joint ventures and associates
Name of investeesPrincipal placeof business Register location
Legalrepresentative Principal activities
RegisteredCapital
RMB million
Percentage ofequity/votingright directlyor indirectlyheld by the
Company
1.Joint ventures Fujian Refining & Petrochemical Company Limited (“FREP”)
PRC
PRC
Gu Yuefeng
Manufacturing refining oil products
14,758
50.00%
BASF-YPC Company Limited (“BASF-YPC”)
PRC
PRC
Wang Jingyi
Manufacturing and distribution of petrochemical products
12,547
40.00%
Mansarovar Energy Colombia Ltd. (“Mansarovar”)
Colombia
British Bermuda
NA
Crude oil and natural gas extraction
12,000 USD
50.00%
Taihu Limited (“Taihu”)
Russia
Cyprus
NA
Crude oil and natural gas extraction
25,000 USD
49.00%
Yanbu Aramco Sinopec Refining Company Ltd. (“YASREF”)
Saudi Arabia
Saudi Arabia
NA
Petroleum refining and processing
1,560 million USD
37.50%
2.Associates Sinopec Sichuan to East China Gas Pipeline Co., Ltd. (“Pipeline Ltd”) (i)
PRC
PRC
Quan Kai
Operation of natural gas pipelines and auxiliary facilities
200
50.00%
Sinopec Finance Company Limited (“Sinopec Finance”)
PRC
PRC
Liu Yun
Provision of non- banking financial services
10,000
49.00%
Zhongtian Synergetic Energy Company Limited (“Zhongtian Synergetic Energy”)
PRC
PRC
Peng Yi
Manufacturing of coal- chemical products
16,000
38.75%
China Aviation Oil Supply Company Limited (“China Aviation Oil”)
PRC
PRC
Zhou Mingchun
Marketing and distribution of refined petroleum products
3,800
29.00%
Caspian Investments Resources Ltd. (“CIR”) (ii)
The Republic of Kazakhstan
British Virgin Islands
NA
Crude oil and natural gas extraction
10,000 USD
50.00%
All the joint ventures and associates above are limited companies.
Note:
(i) On 12 December 2016, the Group entered into the Capital Injection Agreement in relation to Sinopec Sichuan To East China Gas Pipeline Co., Ltd. (“Pipeline Ltd”), a wholly-owned subsidiary of the Group, with China Life Insurance Company Limited (“China Life”) and SDIC Communications Holding Co., Ltd. (“SDIC Holding”) (the “Capital Injection Agreement”). According to the provisions of the Capital Injection Agreement, China Life and SDIC Holding made cash contribution to the Pipeline Ltd amounting to RMB 20 billion and RMB 2.8 billion, respectively, in exchange for 43.86% and 6.14% equity interest, respectively, in the Pipeline Ltd. Thereafter, the Group’s equity interest in the Pipeline Ltd was diluted from 100% to 50%. Based on the composition and decision making mechanism of the Board of Directors of the Pipeline Ltd, the Group determines that it has only retained the power to participate in the financial and operating policy decisions of the Pipeline Ltd, and was no longer exclusively possessing the power to govern policy decisions of the Pipeline Ltd.
Consequently, the Group has deconsolidated the Pipeline Ltd and started accounting for its 50% equity interest in the Pipeline Ltd as an investment in associate company. In this connection, the Group recognized an amount of RMB 20.562 billion investment income, which was resulted from the loss of control and the re-measurement of the remaining 50% equity interest in the Pipeline Ltd (Note 45, 58).
Management is in the process of allocating the fair value to identifiable assets and liabilities of Pipeline Ltd. The accompanying summarized financial information of Pipeline Ltd (Note 12(c)) is based on management’s preliminary fair value allocation which may be subjected to further change.
(ii) In August 2015, one of the subsidiaries of Sinopec Group Company completed the acquisition from LUKOIL OVERSEAS WEST PROJECT Ltd. a 50% equity interests in CIR and revised CIR’s Articles of Association subsequently. According to the revised CIR’s Articles of Association, the Group retained significant influences over CIR. As a result, the Group reclassified the investment interest in CIR from joint ventures to associates.
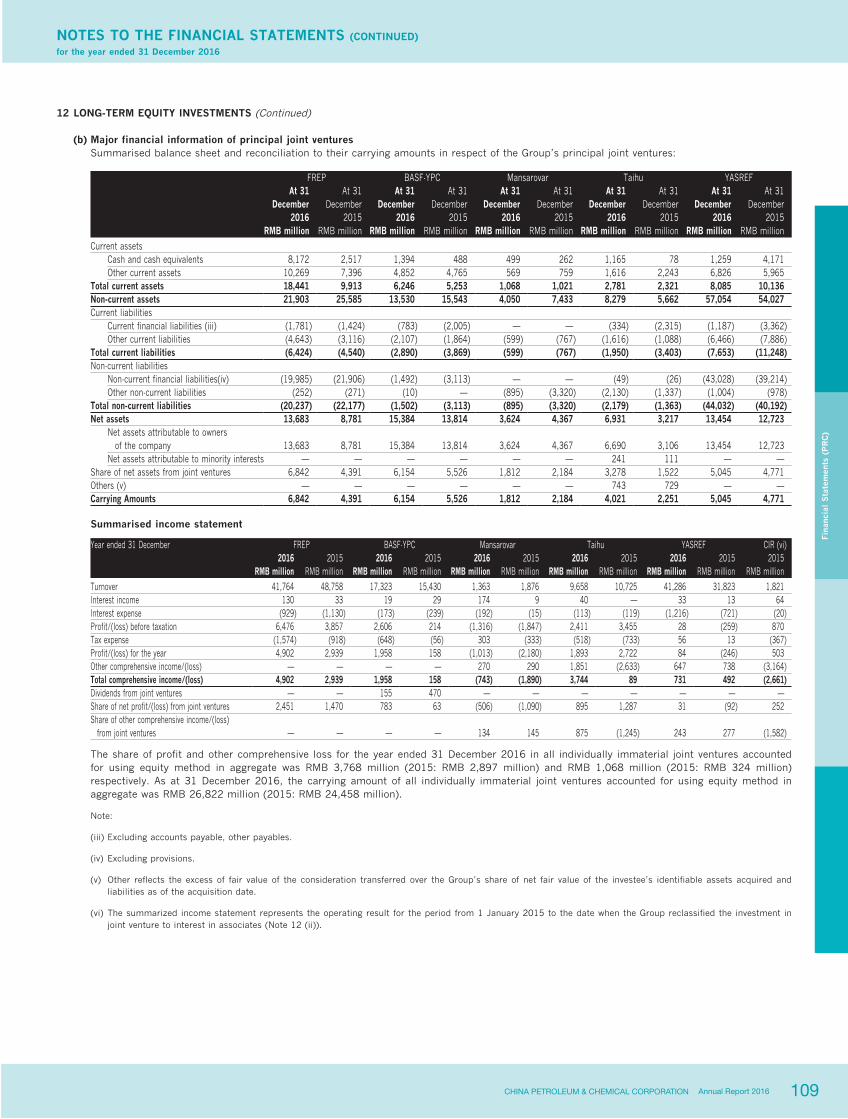
109CHINA PETROLEUM & CHEMICAL CORPORATION Annual Report 2016
NOTES TO THE FINANCIAL STATEMENTS (CONTINUED)for the year ended 31 December 2016
Fina
ncia
l S
tate
men
ts (
PR
C)
12 LONG-TERM EQUITY INVESTMENTS (Continued)
(b) Major financial information of principal joint venturesSummarised balance sheet and reconciliation to their carrying amounts in respect of the Group’s principal joint ventures:
FREP BASF-YPC Mansarovar Taihu YASREFAt 31
December2016
At 31December
2015
At 31December
2016
At 31December
2015
At 31December
2016
At 31December
2015
At 31December
2016
At 31December
2015
At 31December
2016
At 31December
2015RMB million RMB million RMB million RMB million RMB million RMB million RMB million RMB million RMB million RMB million
Current assets Cash and cash equivalents 8,172 2,517 1,394 488 499 262 1,165 78 1,259 4,171Other current assets 10,269 7,396 4,852 4,765 569 759 1,616 2,243 6,826 5,965
Total current assets 18,441 9,913 6,246 5,253 1,068 1,021 2,781 2,321 8,085 10,136Non-current assets 21,903 25,585 13,530 15,543 4,050 7,433 8,279 5,662 57,054 54,027Current liabilities
Current financial liabilities (iii) (1,781) (1,424) (783) (2,005) — — (334) (2,315) (1,187) (3,362)Other current liabilities (4,643) (3,116) (2,107) (1,864) (599) (767) (1,616) (1,088) (6,466) (7,886)
Total current liabilities (6,424) (4,540) (2,890) (3,869) (599) (767) (1,950) (3,403) (7,653) (11,248)Non-current liabilities
Non-current financial liabilities(iv) (19,985) (21,906) (1,492) (3,113) — — (49) (26) (43,028) (39,214)Other non-current liabilities (252) (271) (10) — (895) (3,320) (2,130) (1,337) (1,004) (978)
Total non-current liabilities (20,237) (22,177) (1,502) (3,113) (895) (3,320) (2,179) (1,363) (44,032) (40,192)Net assets 13,683 8,781 15,384 13,814 3,624 4,367 6,931 3,217 13,454 12,723
Net assets attributable to owners of the company 13,683 8,781 15,384 13,814 3,624 4,367 6,690 3,106 13,454 12,723Net assets attributable to minority interests — — — — — — 241 111 — —
Share of net assets from joint ventures 6,842 4,391 6,154 5,526 1,812 2,184 3,278 1,522 5,045 4,771Others (v) — — — — — — 743 729 — —Carrying Amounts 6,842 4,391 6,154 5,526 1,812 2,184 4,021 2,251 5,045 4,771
Summarised income statement
Year ended 31 December FREP BASF-YPC Mansarovar Taihu YASREF CIR (vi)2016 2015 2016 2015 2016 2015 2016 2015 2016 2015 2015
RMB million RMB million RMB million RMB million RMB million RMB million RMB million RMB million RMB million RMB million RMB million
Turnover 41,764 48,758 17,323 15,430 1,363 1,876 9,658 10,725 41,286 31,823 1,821Interest income 130 33 19 29 174 9 40 — 33 13 64Interest expense (929) (1,130) (173) (239) (192) (15) (113) (119) (1,216) (721) (20)Profit/(loss) before taxation 6,476 3,857 2,606 214 (1,316) (1,847) 2,411 3,455 28 (259) 870Tax expense (1,574) (918) (648) (56) 303 (333) (518) (733) 56 13 (367)Profit/(loss) for the year 4,902 2,939 1,958 158 (1,013) (2,180) 1,893 2,722 84 (246) 503Other comprehensive income/(loss) — — — — 270 290 1,851 (2,633) 647 738 (3,164)Total comprehensive income/(loss) 4,902 2,939 1,958 158 (743) (1,890) 3,744 89 731 492 (2,661)Dividends from joint ventures — — 155 470 — — — — — — —Share of net profit/(loss) from joint ventures 2,451 1,470 783 63 (506) (1,090) 895 1,287 31 (92) 252Share of other comprehensive income/(loss) from joint ventures — — — — 134 145 875 (1,245) 243 277 (1,582)
The share of profit and other comprehensive loss for the year ended 31 December 2016 in all individually immaterial joint ventures accounted for using equity method in aggregate was RMB 3,768 million (2015: RMB 2,897 million) and RMB 1,068 million (2015: RMB 324 million) respectively. As at 31 December 2016, the carrying amount of all individually immaterial joint ventures accounted for using equity method in aggregate was RMB 26,822 million (2015: RMB 24,458 million).
Note:
(iii) Excluding accounts payable, other payables.
(iv) Excluding provisions.
(v) Other reflects the excess of fair value of the consideration transferred over the Group’s share of net fair value of the investee’s identifiable assets acquired and liabilities as of the acquisition date.
(vi) The summarized income statement represents the operating result for the period from 1 January 2015 to the date when the Group reclassified the investment in joint venture to interest in associates (Note 12 (ii)).
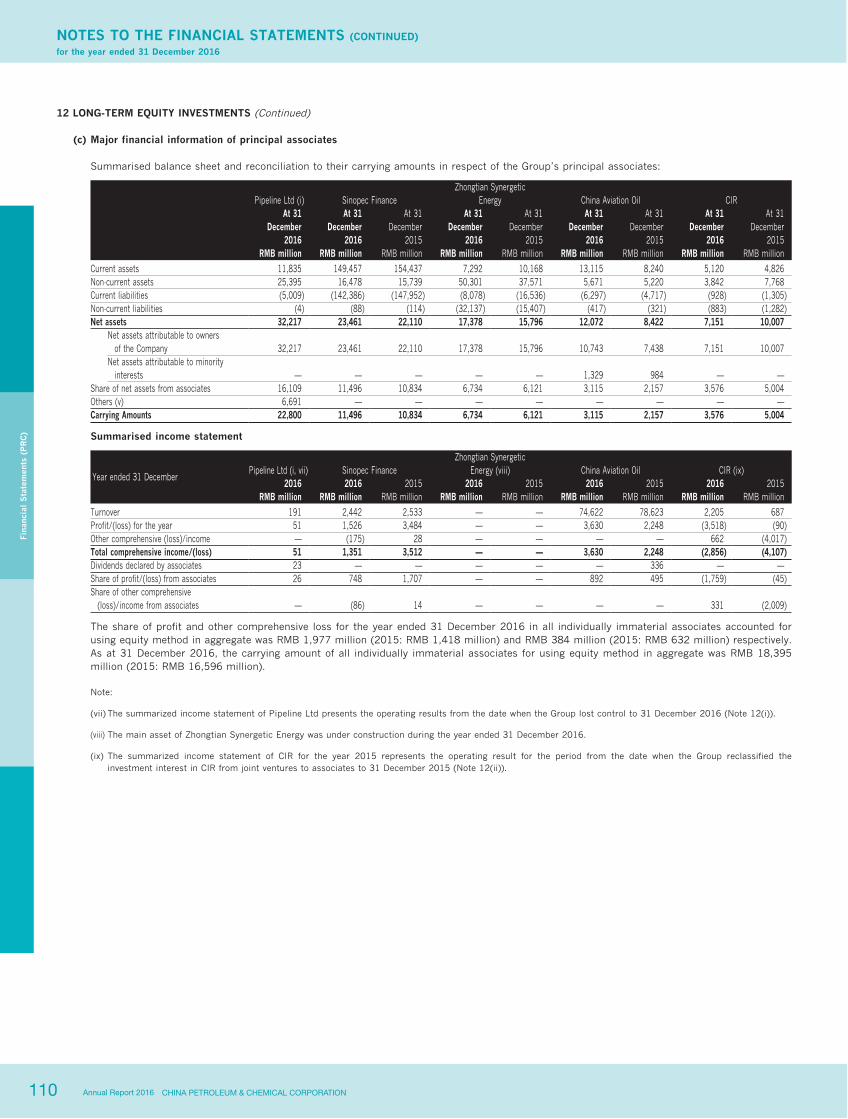
110 CHINA PETROLEUM & CHEMICAL CORPORATIONAnnual Report 2016
NOTES TO THE FINANCIAL STATEMENTS (CONTINUED)for the year ended 31 December 2016
Fina
ncia
l S
tate
men
ts (
PR
C)
12 LONG-TERM EQUITY INVESTMENTS (Continued)
(c) Major financial information of principal associates
Summarised balance sheet and reconciliation to their carrying amounts in respect of the Group’s principal associates:
Pipeline Ltd (i) Sinopec FinanceZhongtian Synergetic
Energy China Aviation Oil CIRAt 31
December 2016
At 31 December
2016
At 31 December
2015
At 31 December
2016
At 31 December
2015
At 31 December
2016
At 31 December
2015
At 31 December
2016
At 31 December
2015RMB million RMB million RMB million RMB million RMB million RMB million RMB million RMB million RMB million
Current assets 11,835 149,457 154,437 7,292 10,168 13,115 8,240 5,120 4,826Non-current assets 25,395 16,478 15,739 50,301 37,571 5,671 5,220 3,842 7,768Current liabilities (5,009) (142,386) (147,952) (8,078) (16,536) (6,297) (4,717) (928) (1,305)Non-current liabilities (4) (88) (114) (32,137) (15,407) (417) (321) (883) (1,282)Net assets 32,217 23,461 22,110 17,378 15,796 12,072 8,422 7,151 10,007
Net assets attributable to owners of the Company 32,217 23,461 22,110 17,378 15,796 10,743 7,438 7,151 10,007Net assets attributable to minority interests — — — — — 1,329 984 — —
Share of net assets from associates 16,109 11,496 10,834 6,734 6,121 3,115 2,157 3,576 5,004Others (v) 6,691 — — — — — — — —Carrying Amounts 22,800 11,496 10,834 6,734 6,121 3,115 2,157 3,576 5,004
Summarised income statement
Year ended 31 DecemberPipeline Ltd (i, vii) Sinopec Finance
Zhongtian SynergeticEnergy (viii) China Aviation Oil CIR (ix)
2016 2016 2015 2016 2015 2016 2015 2016 2015RMB million RMB million RMB million RMB million RMB million RMB million RMB million RMB million RMB million
Turnover 191 2,442 2,533 — — 74,622 78,623 2,205 687Profit/(loss) for the year 51 1,526 3,484 — — 3,630 2,248 (3,518) (90)Other comprehensive (loss)/income — (175) 28 — — — — 662 (4,017)Total comprehensive income/(loss) 51 1,351 3,512 — — 3,630 2,248 (2,856) (4,107)Dividends declared by associates 23 — — — — — 336 — —Share of profit/(loss) from associates 26 748 1,707 — — 892 495 (1,759) (45)Share of other comprehensive (loss)/income from associates — (86) 14 — — — — 331 (2,009)
The share of profit and other comprehensive loss for the year ended 31 December 2016 in all individually immaterial associates accounted for using equity method in aggregate was RMB 1,977 million (2015: RMB 1,418 million) and RMB 384 million (2015: RMB 632 million) respectively. As at 31 December 2016, the carrying amount of all individually immaterial associates for using equity method in aggregate was RMB 18,395 million (2015: RMB 16,596 million).
Note:
(vii) The summarized income statement of Pipeline Ltd presents the operating results from the date when the Group lost control to 31 December 2016 (Note 12(i)).
(viii) The main asset of Zhongtian Synergetic Energy was under construction during the year ended 31 December 2016.
(ix) The summarized income statement of CIR for the year 2015 represents the operating result for the period from the date when the Group reclassified the investment interest in CIR from joint ventures to associates to 31 December 2015 (Note 12(ii)).

111CHINA PETROLEUM & CHEMICAL CORPORATION Annual Report 2016
NOTES TO THE FINANCIAL STATEMENTS (CONTINUED)for the year ended 31 December 2016
Fina
ncia
l S
tate
men
ts (
PR
C)
13 FIXED ASSETS
The Group
Oil Equipment,Plants and and gas machinery
buildings properties and others TotalRMB million RMB million RMB million RMB million
Cost: Balance at 1 January 2016 107,873 613,134 880,711 1,601,718Additions for the year 277 3,420 626 4,323Transferred from construction in progress 5,901 31,473 50,025 87,399Reclassifications 1,426 (115) (1,311) —Decreases for the year (639) (27) (37,302) (37,968)Exchange adjustments 82 2,800 187 3,069Balance at 31 December 2016 114,920 650,685 892,936 1,658,541Accumulated depreciation: Balance at 1 January 2016 41,569 354,181 432,151 827,901Additions for the year 3,815 49,005 47,914 100,734Reclassifications 357 (58) (299) —Decreases for the year (525) (22) (16,822) (17,369)Exchange adjustments 27 1,813 79 1,919Balance at 31 December 2016 45,243 404,919 463,023 913,185Provision for impairment losses: Balance at 1 January 2016 2,900 20,010 17,458 40,368Additions for the year 440 10,580 3,901 14,921Reclassifications 12 — (12) —Decreases for the year (23) — (561) (584)Exchange adjustments — 52 5 57Balance at 31 December 2016 3,329 30,642 20,791 54,762Net book value: Balance at 31 December 2016 66,348 215,124 409,122 690,594Balance at 31 December 2015 63,404 238,943 431,102 733,449
The Company
Oil EquipmentPlants and and gas machinery
buildings properties and others TotalRMB million RMB million RMB million RMB million
Cost: Balance at 1 January 2016 47,882 530,446 469,966 1,048,294Additions for the year 6 2,939 535 3,480Transferred from construction in progress 1,368 30,267 18,835 50,470Reclassifications 58 (115) 57 —Transferred to subsidiaries (1,621) (23,012) (40,610) (65,243)Decreases for the year (107) (26) (5,298) (5,431)Balance at 31 December 2016 47,586 540,499 443,485 1,031,570Accumulated depreciation: Balance at 1 January 2016 21,077 302,711 254,097 577,885Additions for the year 1,670 41,476 23,349 66,495Reclassifications 5 (58) 53 —Transferred to subsidiaries (1,069) (6,713) (17,791) (25,573)Decreases for the year (282) (22) (4,257) (4,561)Balance at 31 December 2016 21,401 337,394 255,451 614,246Provision for impairment losses: Balance at 1 January 2016 1,288 16,971 12,673 30,932Additions for the year 350 9,756 3,338 13,444Reclassifications — — — —Transferred to subsidiaries — — — —Decreases for the year (15) — (57) (72)Balance at 31 December 2016 1,623 26,727 15,954 44,304Net book value: Balance at 31 December 2016 24,562 176,378 172,080 373,020Balance at 31 December 2015 25,517 210,764 203,196 439,477
The additions to oil and gas properties of the Group and the Company for the year ended 31 December 2016 included RMB 3,420 million (2015: RMB 2,899 million) (Note 31) and RMB 2,939 million (2015: RMB 2,954 million), respectively of the estimated dismantlement costs for site restoration.
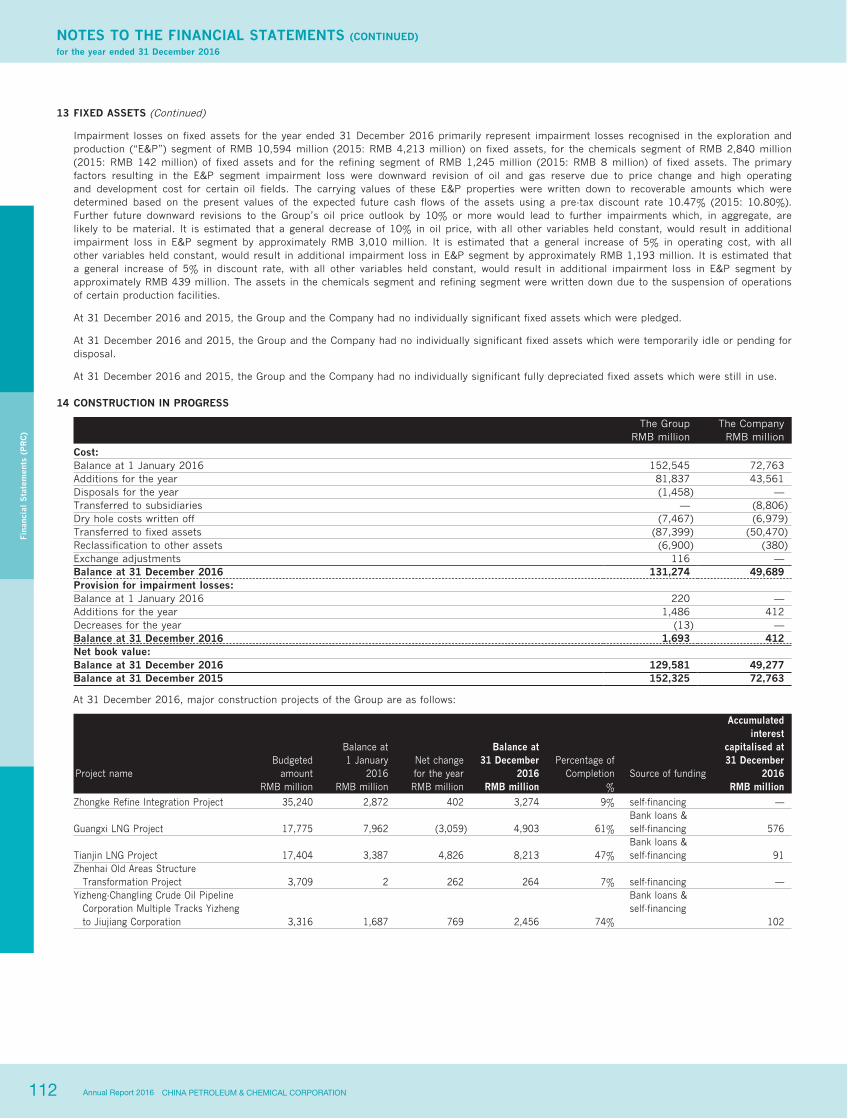
112 CHINA PETROLEUM & CHEMICAL CORPORATIONAnnual Report 2016
NOTES TO THE FINANCIAL STATEMENTS (CONTINUED)for the year ended 31 December 2016
Fina
ncia
l S
tate
men
ts (
PR
C)
13 FIXED ASSETS (Continued)
Impairment losses on fixed assets for the year ended 31 December 2016 primarily represent impairment losses recognised in the exploration and production (“E&P”) segment of RMB 10,594 million (2015: RMB 4,213 million) on fixed assets, for the chemicals segment of RMB 2,840 million (2015: RMB 142 million) of fixed assets and for the refining segment of RMB 1,245 million (2015: RMB 8 million) of fixed assets. The primary factors resulting in the E&P segment impairment loss were downward revision of oil and gas reserve due to price change and high operating and development cost for certain oil fields. The carrying values of these E&P properties were written down to recoverable amounts which were determined based on the present values of the expected future cash flows of the assets using a pre-tax discount rate 10.47% (2015: 10.80%). Further future downward revisions to the Group’s oil price outlook by 10% or more would lead to further impairments which, in aggregate, are likely to be material. It is estimated that a general decrease of 10% in oil price, with all other variables held constant, would result in additional impairment loss in E&P segment by approximately RMB 3,010 million. It is estimated that a general increase of 5% in operating cost, with all other variables held constant, would result in additional impairment loss in E&P segment by approximately RMB 1,193 million. It is estimated that a general increase of 5% in discount rate, with all other variables held constant, would result in additional impairment loss in E&P segment by approximately RMB 439 million. The assets in the chemicals segment and refining segment were written down due to the suspension of operations of certain production facilities.
At 31 December 2016 and 2015, the Group and the Company had no individually significant fixed assets which were pledged.
At 31 December 2016 and 2015, the Group and the Company had no individually significant fixed assets which were temporarily idle or pending for disposal.
At 31 December 2016 and 2015, the Group and the Company had no individually significant fully depreciated fixed assets which were still in use.
14 CONSTRUCTION IN PROGRESS
The Group The CompanyRMB million RMB million
Cost: Balance at 1 January 2016 152,545 72,763Additions for the year 81,837 43,561Disposals for the year (1,458) —Transferred to subsidiaries — (8,806)Dry hole costs written off (7,467) (6,979)Transferred to fixed assets (87,399) (50,470)Reclassification to other assets (6,900) (380)Exchange adjustments 116 —Balance at 31 December 2016 131,274 49,689Provision for impairment losses: Balance at 1 January 2016 220 —Additions for the year 1,486 412Decreases for the year (13) —Balance at 31 December 2016 1,693 412Net book value: Balance at 31 December 2016 129,581 49,277Balance at 31 December 2015 152,325 72,763
At 31 December 2016, major construction projects of the Group are as follows:
Project nameBudgeted
amount
Balance at1 January
2016Net changefor the year
Balance at31 December
2016Percentage of
Completion Source of funding
Accumulatedinterest
capitalised at31 December
2016RMB million RMB million RMB million RMB million % RMB million
Zhongke Refine Integration Project 35,240 2,872 402 3,274 9% self-financing —
Guangxi LNG Project 17,775 7,962 (3,059) 4,903 61% Bank loans &self-financing 576
Tianjin LNG Project 17,404 3,387 4,826 8,213 47% Bank loans &self-financing 91
Zhenhai Old Areas Structure Transformation Project 3,709 2 262 264 7% self-financing —Yizheng-Changling Crude Oil Pipeline Corporation Multiple Tracks Yizheng to Jiujiang Corporation 3,316 1,687 769 2,456 74%
Bank loans &self-financing
102
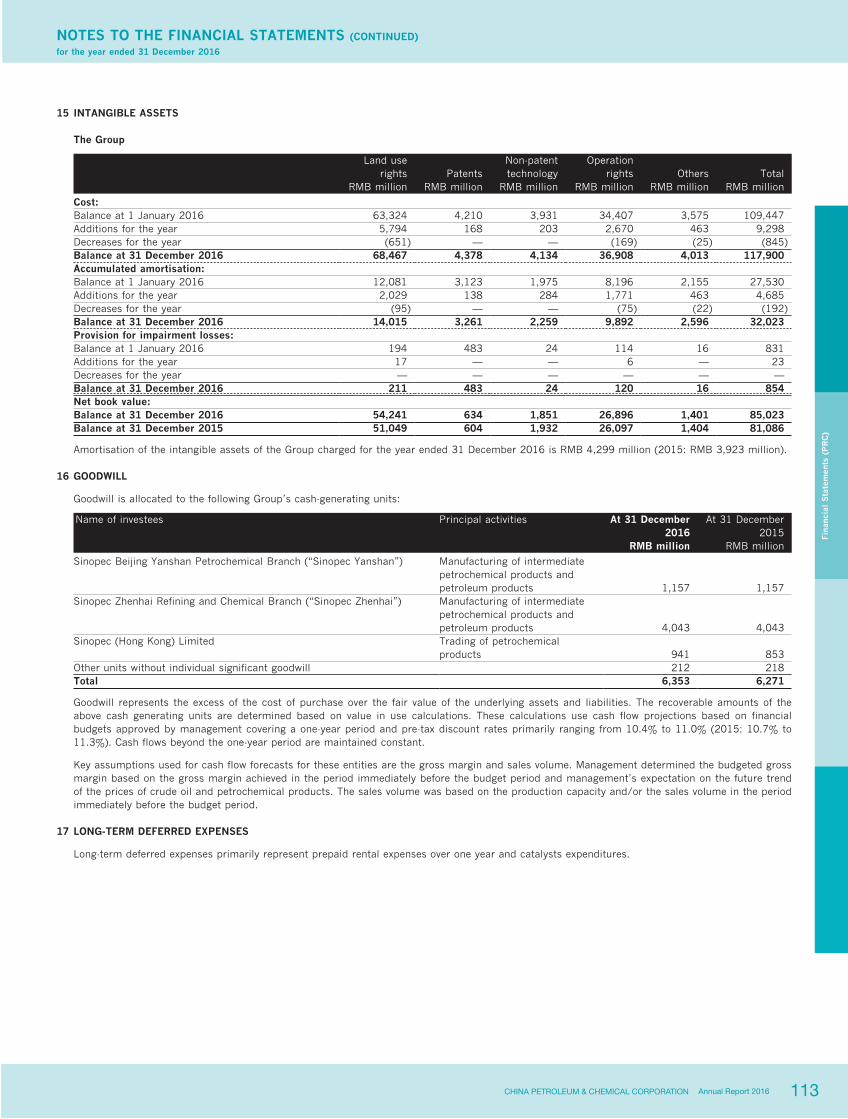
113CHINA PETROLEUM & CHEMICAL CORPORATION Annual Report 2016
NOTES TO THE FINANCIAL STATEMENTS (CONTINUED)for the year ended 31 December 2016
Fina
ncia
l S
tate
men
ts (
PR
C)
15 INTANGIBLE ASSETS
The Group
Land userights Patents
Non-patenttechnology
Operationrights Others Total
RMB million RMB million RMB million RMB million RMB million RMB million
Cost: Balance at 1 January 2016 63,324 4,210 3,931 34,407 3,575 109,447Additions for the year 5,794 168 203 2,670 463 9,298Decreases for the year (651) — — (169) (25) (845)Balance at 31 December 2016 68,467 4,378 4,134 36,908 4,013 117,900Accumulated amortisation: Balance at 1 January 2016 12,081 3,123 1,975 8,196 2,155 27,530Additions for the year 2,029 138 284 1,771 463 4,685Decreases for the year (95) — — (75) (22) (192)Balance at 31 December 2016 14,015 3,261 2,259 9,892 2,596 32,023Provision for impairment losses: Balance at 1 January 2016 194 483 24 114 16 831Additions for the year 17 — — 6 — 23Decreases for the year — — — — — —Balance at 31 December 2016 211 483 24 120 16 854Net book value: Balance at 31 December 2016 54,241 634 1,851 26,896 1,401 85,023Balance at 31 December 2015 51,049 604 1,932 26,097 1,404 81,086
Amortisation of the intangible assets of the Group charged for the year ended 31 December 2016 is RMB 4,299 million (2015: RMB 3,923 million).
16 GOODWILL
Goodwill is allocated to the following Group’s cash-generating units:
Name of investees Principal activities At 31 December At 31 December2016 2015
RMB million RMB million
Sinopec Beijing Yanshan Petrochemical Branch (“Sinopec Yanshan”)
Manufacturing of intermediate petrochemical products and petroleum products 1,157 1,157
Sinopec Zhenhai Refining and Chemical Branch (“Sinopec Zhenhai”)
Manufacturing of intermediate petrochemical products and petroleum products 4,043 4,043
Sinopec (Hong Kong) Limited
Trading of petrochemical products 941 853
Other units without individual significant goodwill 212 218Total 6,353 6,271
Goodwill represents the excess of the cost of purchase over the fair value of the underlying assets and liabilities. The recoverable amounts of the above cash generating units are determined based on value in use calculations. These calculations use cash flow projections based on financial budgets approved by management covering a one-year period and pre-tax discount rates primarily ranging from 10.4% to 11.0% (2015: 10.7% to 11.3%). Cash flows beyond the one-year period are maintained constant.
Key assumptions used for cash flow forecasts for these entities are the gross margin and sales volume. Management determined the budgeted gross margin based on the gross margin achieved in the period immediately before the budget period and management’s expectation on the future trend of the prices of crude oil and petrochemical products. The sales volume was based on the production capacity and/or the sales volume in the period immediately before the budget period.
17 LONG-TERM DEFERRED EXPENSES
Long-term deferred expenses primarily represent prepaid rental expenses over one year and catalysts expenditures.
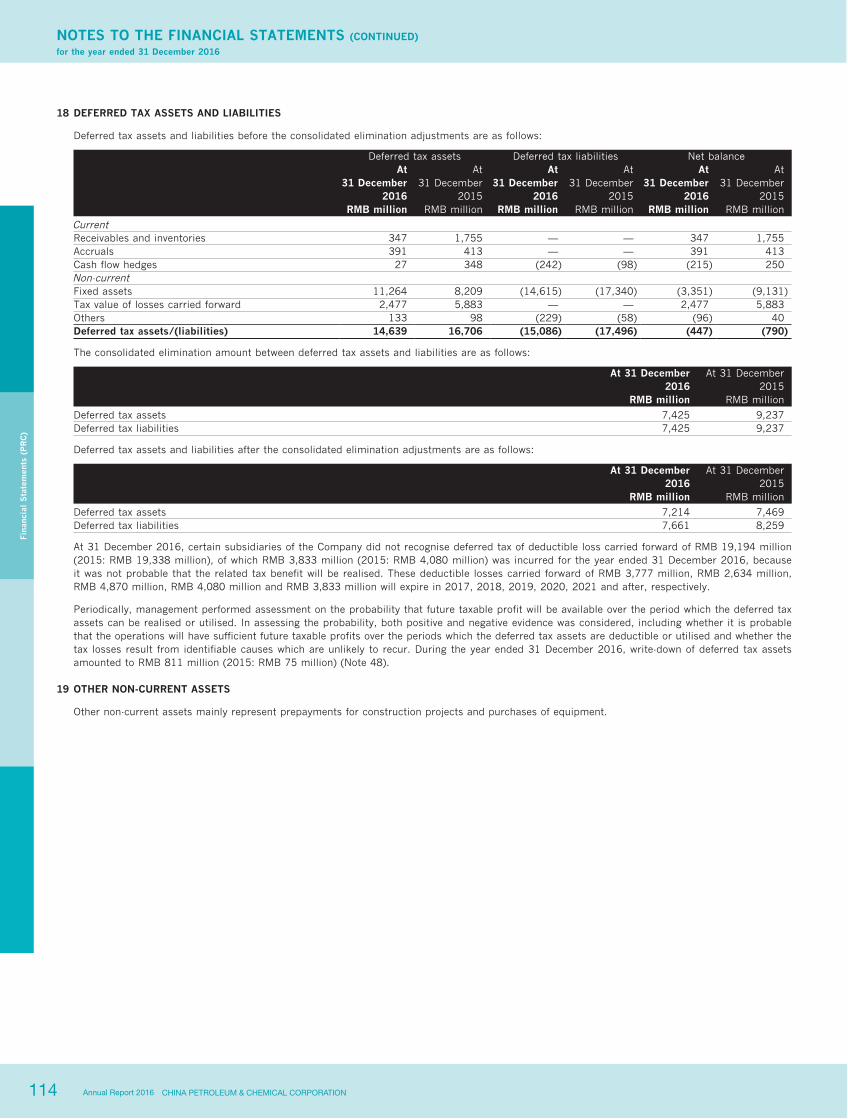
114 CHINA PETROLEUM & CHEMICAL CORPORATIONAnnual Report 2016
NOTES TO THE FINANCIAL STATEMENTS (CONTINUED)for the year ended 31 December 2016
Fina
ncia
l S
tate
men
ts (
PR
C)
18 DEFERRED TAX ASSETS AND LIABILITIES
Deferred tax assets and liabilities before the consolidated elimination adjustments are as follows:
Deferred tax assets Deferred tax liabilities Net balanceAt
31 DecemberAt
31 DecemberAt
31 DecemberAt
31 DecemberAt
31 DecemberAt
31 December2016 2015 2016 2015 2016 2015
RMB million RMB million RMB million RMB million RMB million RMB million
Current Receivables and inventories 347 1,755 — — 347 1,755Accruals 391 413 — — 391 413Cash flow hedges 27 348 (242) (98) (215) 250Non-current Fixed assets 11,264 8,209 (14,615) (17,340) (3,351) (9,131)Tax value of losses carried forward 2,477 5,883 — — 2,477 5,883Others 133 98 (229) (58) (96) 40Deferred tax assets/(liabilities) 14,639 16,706 (15,086) (17,496) (447) (790)
The consolidated elimination amount between deferred tax assets and liabilities are as follows:
At 31 December2016
At 31 December2015
RMB million RMB million
Deferred tax assets 7,425 9,237Deferred tax liabilities 7,425 9,237
Deferred tax assets and liabilities after the consolidated elimination adjustments are as follows:
At 31 December2016
At 31 December2015
RMB million RMB million
Deferred tax assets 7,214 7,469Deferred tax liabilities 7,661 8,259
At 31 December 2016, certain subsidiaries of the Company did not recognise deferred tax of deductible loss carried forward of RMB 19,194 million (2015: RMB 19,338 million), of which RMB 3,833 million (2015: RMB 4,080 million) was incurred for the year ended 31 December 2016, because it was not probable that the related tax benefit will be realised. These deductible losses carried forward of RMB 3,777 million, RMB 2,634 million, RMB 4,870 million, RMB 4,080 million and RMB 3,833 million will expire in 2017, 2018, 2019, 2020, 2021 and after, respectively.
Periodically, management performed assessment on the probability that future taxable profit will be available over the period which the deferred tax assets can be realised or utilised. In assessing the probability, both positive and negative evidence was considered, including whether it is probable that the operations will have sufficient future taxable profits over the periods which the deferred tax assets are deductible or utilised and whether the tax losses result from identifiable causes which are unlikely to recur. During the year ended 31 December 2016, write-down of deferred tax assets amounted to RMB 811 million (2015: RMB 75 million) (Note 48).
19 OTHER NON-CURRENT ASSETS
Other non-current assets mainly represent prepayments for construction projects and purchases of equipment.

115CHINA PETROLEUM & CHEMICAL CORPORATION Annual Report 2016
NOTES TO THE FINANCIAL STATEMENTS (CONTINUED)for the year ended 31 December 2016
Fina
ncia
l S
tate
men
ts (
PR
C)
20 DETAILS OF IMPAIRMENT LOSSES
At 31 December 2016, impairment losses of the Group are analysed as follows:
Note
Balance at1 January
2016Provision
for the yearWritten backfor the year
Written offfor the year
Otherincrease/
(decrease)
Balance at31 December
2016RMB million RMB million RMB million RMB million RMB million RMB million
Allowance for doubtful accounts Included: Accounts receivable 7 525 238 (8) (72) — 683
Other receivables 8 1,392 132 (144) (33) 2 1,349Prepayments 9 23 14 (1) (5) — 31 1,940 384 (153) (110) 2 2,063
Inventories 10 4,402 430 (10) (4,021) 119 920Long-term equity investments 12 677 1 — (1) 45 722Fixed assets 13 40,368 14,921 — (584) 57 54,762Construction in progress 14 220 1,486 — (5) (8) 1,693Intangible assets 15 831 11 — — 12 854Goodwill 16 7,657 6 — — — 7,663Others 43 — — — — 43Total 56,138 17,239 (163) (4,721) 227 68,720
The reasons for recognising impairment losses are set out in the respective notes of respective assets.
21 SHORT-TERM LOANS
The Group’s short-term loans represent:
At 31 December 2016 At 31 December 2015Originalcurrency
millionExchange
ratesRMB
million
Originalcurrency
millionExchange
ratesRMB
million
Short-term bank loans 11,944 31,036– Renminbi loans 10,931 11,357– US Dollar loans 146 6.9370 1,013 1,821 6.4936 11,824– Euro loans — 7.3068 — 1,107 7.0952 7,855
Short-term loans from Sinopec Group Company and fellow subsidiaries 18,430 43,693
– Renminbi loans 2,858 10,806– US Dollar loans 1,957 6.9370 13,577 5,063 6.4936 32,878– HK Dollar loans 2,202 0.8945 1,969 6 0.8373 5– Euro loans 1 7.3068 5 1 7.0952 4– Singapore Dollar loans 4 4.7995 21 — 4.5875 —
Total 30,374 74,729
At 31 December 2016, the Group’s interest rates on short-term loans were from interest 0.68% to 6.19% (2015: from interest 0.23% to 6.16%). The majority of the above loans are by credit.
At 31 December 2016 and 2015, the Group had no significant overdue short-term loan.
22 BILLS PAYABLE
Bills payable primarily represented bank accepted bills for the purchase of material, goods and products. Bills payable were due within one year.
At 31 December 2016 and 2015, the Group had no overdue unpaid bills.
23 ACCOUNTS PAYABLE
At 31 December 2016 and 2015, the Group had no individually significant accounts payable aged over one year.
24 ADVANCES FROM CUSTOMERS
At 31 December 2016 and 2015, the Group had no individually significant advances from customers aged over one year.
25 EMPLOYEE BENEFITS PAYABLE
At 31 December 2016 and 2015, the Group’s employee benefits payable primarily represented wages payable and social insurance payables.

116 CHINA PETROLEUM & CHEMICAL CORPORATIONAnnual Report 2016
NOTES TO THE FINANCIAL STATEMENTS (CONTINUED)for the year ended 31 December 2016
Fina
ncia
l S
tate
men
ts (
PR
C)
26 TAXES PAYABLE
The Group
At 31 December At 31 December2016 2015
RMB million RMB million
Value-added tax payable 8,668 4,433Consumption tax 29,682 20,491Income tax 6,051 1,048Mineral resources compensation fee 196 213Other taxes 8,289 6,307Total 52,886 32,492
27 OTHER PAYABLES
At 31 December 2016 and 2015, the Group’s other payables primarily represented payables for constructions.
At 31 December 2016 and 2015, the Group had no individually significant other payables aged over three years.
28 NON-CURRENT LIABILITIES DUE WITHIN ONE YEAR
The Group’s non-current liabilities due within one year represent:
At 31 December 2016 At 31 December 2015Originalcurrency
millionExchange
ratesRMB
million
Originalcurrency million
Exchangerates
RMBmillion
Long-term bank loans – Renminbi loans 8,753 5,559– US Dollar loans 6 6.9370 42 8 6.4936 54 8,795 5,613
Long-term loans from Sinopec Group Company and fellow subsidiaries
– Renminbi loans 150 50– US Dollar loans — 6.9370 — 29 6.4936 186 150 236
Long-term loans due within one year 8,945 5,849Debentures payable due within one year 29,500 4,868Others 527 560Non-current liabilities due within one year 38,972 11,277
At 31 December 2016 and 2015, the Group had no significant overdue long-term loans.

117CHINA PETROLEUM & CHEMICAL CORPORATION Annual Report 2016
NOTES TO THE FINANCIAL STATEMENTS (CONTINUED)for the year ended 31 December 2016
Fina
ncia
l S
tate
men
ts (
PR
C)
29 LONG-TERM LOANS
The Group’s long-term loans represent:
At 31 December 2016 At 31 December 2015
Interest rate and final maturity
Originalcurrency
millionExchange
ratesRMB
million
Originalcurrency
millionExchange
ratesRMB
million
Long-term bank loans – Renminbi loans
Interest rates ranging from interest 1.08% to 4.41% per annum at 31 December 2016 with maturities through 2030
26,058
17,345
– US Dollar loans
Interest rates ranging from interest 1.30% to 4.29% per annum at 31 December 2016 with maturities through 2031
61
6.9370
426
71
6.4936
461
Less: Current portion (8,795) (5,613)Long-term bank loans 17,689 12,193Long-term loans from Sinopec Group Company and fellow subsidiaries
– Renminbi loans
Interest rates ranging from interest free to 5.75% per annum at 31 December 2016 with maturities through 2021
44,922
44,350
– US Dollar loans No loans at 31 December 2016 — 6.9370 — 29 6.4936 186
Less: Current portion (150) (236)Long-term loans from Sinopec Group Company and fellow subsidiaries 44,772 44,300Total 62,461 56,493
The maturity analysis of the Group’s long-term loans is as follows:
At 31 December At 31 December2016 2015
RMB million RMB million
Between one and two years 3,957 8,988Between two and five years 56,725 10,467After five years 1,779 37,038Total 62,461 56,493
Long-term loans are primarily unsecured, and carried at amortised costs.

118 CHINA PETROLEUM & CHEMICAL CORPORATIONAnnual Report 2016
NOTES TO THE FINANCIAL STATEMENTS (CONTINUED)for the year ended 31 December 2016
Fina
ncia
l S
tate
men
ts (
PR
C)
30 DEBENTURES PAYABLE
The Group
At 31 December2016
RMB million
At 31 December2015
RMB million
Short-term corporate bonds (i) 6,000 30,000Debentures payable:
– Corporate Bonds (ii) 84,485 88,121Less: Current portion (29,500) (4,868)Total 54,985 83,253
Note:
(i) The company issued 180-day corporate bonds of face value RMB 10 billion to corporate investors in the PRC debenture market on 23 September 2015 at par value of RMB 100. The effective cost of the 180-day corporate bonds is 2.99% per annum. The short-term bonds were due on 23 March 2016 and have been fully paid by the Group at maturity.
The company issued 182-day corporate bonds of face value RMB 16 billion to corporate investors in the PRC debenture market on 14 December 2015 at par value of RMB 100. The effective cost of the 182-day corporate bonds is 2.90% per annum. The short-term bonds were due on 14 June 2016 and have been fully paid by the Group at maturity.
The company issued 180-day corporate bonds of face value RMB 4 billion to corporate investors in the PRC debenture market on 31 December 2015 at par value of RMB 100. The effective cost of the 180-day corporate bonds is 2.75% per annum. The short-term bonds were due on 30 June 2016 and have been fully paid by the Group at maturity.
The company issued 182-day corporate bonds of face value RMB 6 billion to corporate investors in the PRC debenture market on 12 September 2016 at par value of RMB 100. The effective cost of the 182-day corporate bonds is 2.54% per annum.
(ii) These corporate bonds are carried at amortised cost, including USD denominated corporate bonds of RMB 18,985 million, and RMB denominated corporate bonds of RMB 65,500 million (2015: USD denominated corporate bonds of RMB 22,621 million, and RMB denominated corporate bonds of RMB 65,500 million). At 31 December 2016, RMB 18,985 million (2015: RMB 22,621 million) are guaranteed by Sinopec Group Company.
31 PROVISIONS
Provisions primarily represent provision for future dismantlement costs of oil and gas properties. The Group has established certain standardised measures for the dismantlement of its retired oil and gas properties by making reference to the industry practices and is thereafter constructively obligated to take dismantlement measures of its retired oil and gas properties. Movement of provision of the Group’s obligations for the dismantlement of its retired oil and gas properties is as follows:
The GroupRMB million
Balance at 1 January 2016 33,115Provision for the year 3,420Accretion expenses 1,057Utilised for the year (843)Exchange adjustments 169Balance at 31 December 2016 36,918
32 OTHER NON-CURRENT LIABILITIES
Other non-current liabilities primarily represent long-term payables, special payables and deferred income.
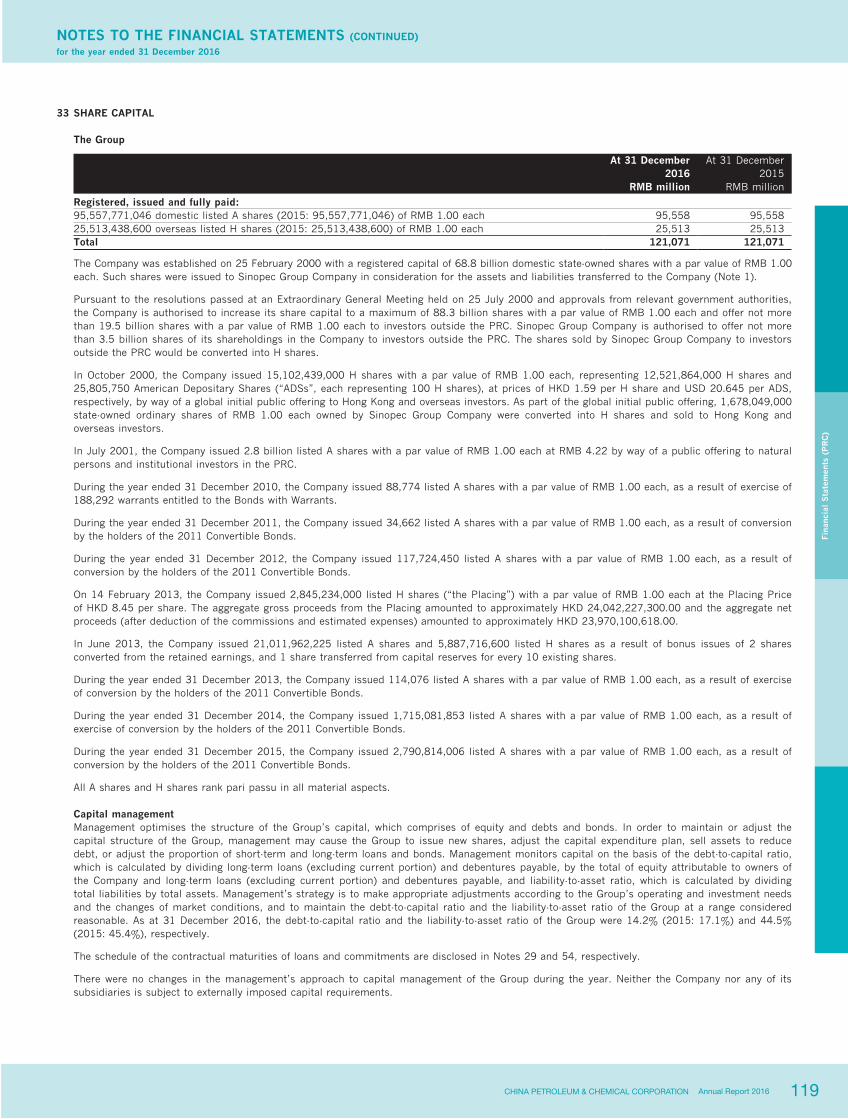
119CHINA PETROLEUM & CHEMICAL CORPORATION Annual Report 2016
NOTES TO THE FINANCIAL STATEMENTS (CONTINUED)for the year ended 31 December 2016
Fina
ncia
l S
tate
men
ts (
PR
C)
33 SHARE CAPITAL
The Group
At 31 December At 31 December2016 2015
RMB million RMB million
Registered, issued and fully paid: 95,557,771,046 domestic listed A shares (2015: 95,557,771,046) of RMB 1.00 each 95,558 95,55825,513,438,600 overseas listed H shares (2015: 25,513,438,600) of RMB 1.00 each 25,513 25,513Total 121,071 121,071
The Company was established on 25 February 2000 with a registered capital of 68.8 billion domestic state-owned shares with a par value of RMB 1.00 each. Such shares were issued to Sinopec Group Company in consideration for the assets and liabilities transferred to the Company (Note 1).
Pursuant to the resolutions passed at an Extraordinary General Meeting held on 25 July 2000 and approvals from relevant government authorities, the Company is authorised to increase its share capital to a maximum of 88.3 billion shares with a par value of RMB 1.00 each and offer not more than 19.5 billion shares with a par value of RMB 1.00 each to investors outside the PRC. Sinopec Group Company is authorised to offer not more than 3.5 billion shares of its shareholdings in the Company to investors outside the PRC. The shares sold by Sinopec Group Company to investors outside the PRC would be converted into H shares.
In October 2000, the Company issued 15,102,439,000 H shares with a par value of RMB 1.00 each, representing 12,521,864,000 H shares and 25,805,750 American Depositary Shares (“ADSs”, each representing 100 H shares), at prices of HKD 1.59 per H share and USD 20.645 per ADS, respectively, by way of a global initial public offering to Hong Kong and overseas investors. As part of the global initial public offering, 1,678,049,000 state-owned ordinary shares of RMB 1.00 each owned by Sinopec Group Company were converted into H shares and sold to Hong Kong and overseas investors.
In July 2001, the Company issued 2.8 billion listed A shares with a par value of RMB 1.00 each at RMB 4.22 by way of a public offering to natural persons and institutional investors in the PRC.
During the year ended 31 December 2010, the Company issued 88,774 listed A shares with a par value of RMB 1.00 each, as a result of exercise of 188,292 warrants entitled to the Bonds with Warrants.
During the year ended 31 December 2011, the Company issued 34,662 listed A shares with a par value of RMB 1.00 each, as a result of conversion by the holders of the 2011 Convertible Bonds.
During the year ended 31 December 2012, the Company issued 117,724,450 listed A shares with a par value of RMB 1.00 each, as a result of conversion by the holders of the 2011 Convertible Bonds.
On 14 February 2013, the Company issued 2,845,234,000 listed H shares (“the Placing”) with a par value of RMB 1.00 each at the Placing Price of HKD 8.45 per share. The aggregate gross proceeds from the Placing amounted to approximately HKD 24,042,227,300.00 and the aggregate net proceeds (after deduction of the commissions and estimated expenses) amounted to approximately HKD 23,970,100,618.00.
In June 2013, the Company issued 21,011,962,225 listed A shares and 5,887,716,600 listed H shares as a result of bonus issues of 2 shares converted from the retained earnings, and 1 share transferred from capital reserves for every 10 existing shares.
During the year ended 31 December 2013, the Company issued 114,076 listed A shares with a par value of RMB 1.00 each, as a result of exercise of conversion by the holders of the 2011 Convertible Bonds.
During the year ended 31 December 2014, the Company issued 1,715,081,853 listed A shares with a par value of RMB 1.00 each, as a result of exercise of conversion by the holders of the 2011 Convertible Bonds.
During the year ended 31 December 2015, the Company issued 2,790,814,006 listed A shares with a par value of RMB 1.00 each, as a result of conversion by the holders of the 2011 Convertible Bonds.
All A shares and H shares rank pari passu in all material aspects.
Capital management Management optimises the structure of the Group’s capital, which comprises of equity and debts and bonds. In order to maintain or adjust the
capital structure of the Group, management may cause the Group to issue new shares, adjust the capital expenditure plan, sell assets to reduce debt, or adjust the proportion of short-term and long-term loans and bonds. Management monitors capital on the basis of the debt-to-capital ratio, which is calculated by dividing long-term loans (excluding current portion) and debentures payable, by the total of equity attributable to owners of the Company and long-term loans (excluding current portion) and debentures payable, and liability-to-asset ratio, which is calculated by dividing total liabilities by total assets. Management’s strategy is to make appropriate adjustments according to the Group’s operating and investment needs and the changes of market conditions, and to maintain the debt-to-capital ratio and the liability-to-asset ratio of the Group at a range considered reasonable. As at 31 December 2016, the debt-to-capital ratio and the liability-to-asset ratio of the Group were 14.2% (2015: 17.1%) and 44.5% (2015: 45.4%), respectively.
The schedule of the contractual maturities of loans and commitments are disclosed in Notes 29 and 54, respectively.
There were no changes in the management’s approach to capital management of the Group during the year. Neither the Company nor any of its subsidiaries is subject to externally imposed capital requirements.
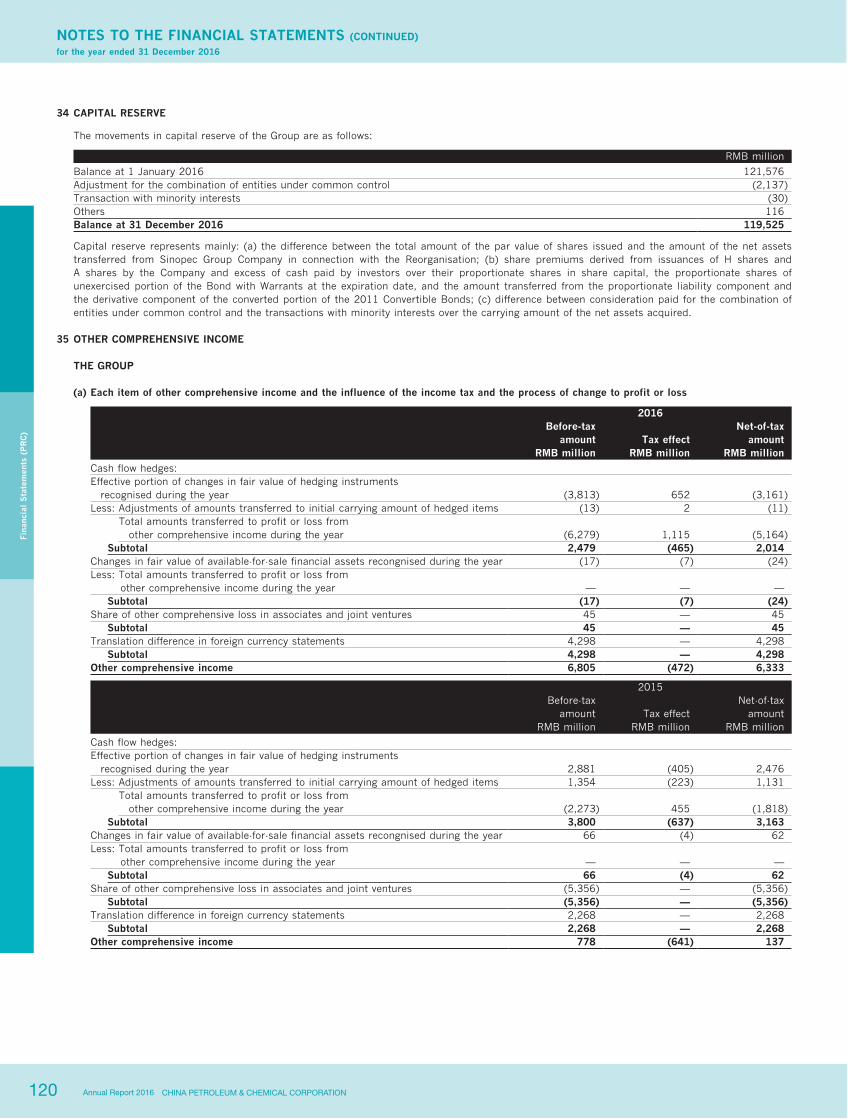
120 CHINA PETROLEUM & CHEMICAL CORPORATIONAnnual Report 2016
NOTES TO THE FINANCIAL STATEMENTS (CONTINUED)for the year ended 31 December 2016
Fina
ncia
l S
tate
men
ts (
PR
C)
34 CAPITAL RESERVE
The movements in capital reserve of the Group are as follows:
RMB million
Balance at 1 January 2016 121,576Adjustment for the combination of entities under common control (2,137)Transaction with minority interests (30)Others 116Balance at 31 December 2016 119,525
Capital reserve represents mainly: (a) the difference between the total amount of the par value of shares issued and the amount of the net assets transferred from Sinopec Group Company in connection with the Reorganisation; (b) share premiums derived from issuances of H shares and A shares by the Company and excess of cash paid by investors over their proportionate shares in share capital, the proportionate shares of unexercised portion of the Bond with Warrants at the expiration date, and the amount transferred from the proportionate liability component and the derivative component of the converted portion of the 2011 Convertible Bonds; (c) difference between consideration paid for the combination of entities under common control and the transactions with minority interests over the carrying amount of the net assets acquired.
35 OTHER COMPREHENSIVE INCOME
THE GROUP
(a) Each item of other comprehensive income and the influence of the income tax and the process of change to profit or loss
2016Before-tax
amount Tax effectNet-of-tax
amountRMB million RMB million RMB million
Cash flow hedges: Effective portion of changes in fair value of hedging instruments recognised during the year (3,813) 652 (3,161)Less: Adjustments of amounts transferred to initial carrying amount of hedged items (13) 2 (11)
Total amounts transferred to profit or loss from other comprehensive income during the year (6,279) 1,115 (5,164)
Subtotal 2,479 (465) 2,014Changes in fair value of available-for-sale financial assets recongnised during the year (17) (7) (24)Less: Total amounts transferred to profit or loss from other comprehensive income during the year — — —
Subtotal (17) (7) (24)Share of other comprehensive loss in associates and joint ventures 45 — 45
Subtotal 45 — 45Translation difference in foreign currency statements 4,298 — 4,298
Subtotal 4,298 — 4,298Other comprehensive income 6,805 (472) 6,333
2015Before-tax
amountRMB million
Tax effectRMB million
Net-of-taxamount
RMB million
Cash flow hedges: Effective portion of changes in fair value of hedging instruments recognised during the year 2,881 (405) 2,476Less: Adjustments of amounts transferred to initial carrying amount of hedged items 1,354 (223) 1,131
Total amounts transferred to profit or loss from other comprehensive income during the year (2,273) 455 (1,818)
Subtotal 3,800 (637) 3,163Changes in fair value of available-for-sale financial assets recongnised during the year 66 (4) 62Less: Total amounts transferred to profit or loss from other comprehensive income during the year — — —
Subtotal 66 (4) 62Share of other comprehensive loss in associates and joint ventures (5,356) — (5,356)
Subtotal (5,356) — (5,356)Translation difference in foreign currency statements 2,268 — 2,268
Subtotal 2,268 — 2,268Other comprehensive income 778 (641) 137

121CHINA PETROLEUM & CHEMICAL CORPORATION Annual Report 2016
NOTES TO THE FINANCIAL STATEMENTS (CONTINUED)for the year ended 31 December 2016
Fina
ncia
l S
tate
men
ts (
PR
C)
35 OTHER COMPREHENSIVE INCOME (Continued)
THE GROUP (Continued)
(b) Reconciliation of other comprehensive income
Equity Attributable to shareholders of the company Minority interests Total othercomprehensive
incomeThe share of other
comprehensiveincome which
being reclassifiedto profit and
loss in the futureunder equity
method
Changes in fairvalue of
available-for-salefinancial assets Cash flow hedges
Translationdifference in
foreign currencystatements Subtotal
RMB Million RMB Million RMB Million RMB Million RMB Million RMB Million RMB Million
31 December 2014 (968) 97 (4,057) (2,333) (7,261) (2,029) (9,290)Changes in 2015 (5,589) 17 3,219 1,630 (723) 860 13731 December 2015 (6,557) 114 (838) (703) (7,984) (1,169) (9,153)Changes in 2016 2,396 (17) 1,970 2,703 7,052 (719) 6,33331 December 2016 (4,161) 97 1,132 2,000 (932) (1,888) (2,820)
36 SPECIFIC RESERVE
According to relevant PRC regulations, the Group is required to transfer an amount to specific reserve for the safety production fund based on the turnover of certain refining and chemicals products or based on the production volume of crude oil and natural gas. The movements of specific reserve are as follows:
The GroupRMB million
Balance at 1 January 2016 612Provision for the year 3,345Utilisation for the year (3,192)Balance at 31 December 2016 765
37 SURPLUS RESERVES
Movements in surplus reserves are as follows:
The GroupStatutory
surplus reserveDiscretionary
surplus reserves TotalRMB million RMB million RMB million
Balance at 1 January 2016 79,640 117,000 196,640Appropriation — — —Balance at 31 December 2016 79,640 117,000 196,640
The PRC Company Law and Articles of Association of the company have set out the following profit appropriation plans:
(a) 10% of the net profit is transferred to the statutory surplus reserve. In the event that the reserve balance reaches 50% of the registered capital, no transfer is needed;
(b) After the transfer to the statutory surplus reserve, a transfer to discretionary surplus reserve can be made upon the passing of a resolution at the shareholders’ meeting.
Pursuant to the Articles of Association of the Company and a resolution passed at the Directors’ meeting on 24 March 2017, the directors proposed to transfer RMB 2,359 million to the statutory surplus reserve.

122 CHINA PETROLEUM & CHEMICAL CORPORATIONAnnual Report 2016
NOTES TO THE FINANCIAL STATEMENTS (CONTINUED)for the year ended 31 December 2016
Fina
ncia
l S
tate
men
ts (
PR
C)
38 OPERATING INCOME AND OPERATING COSTS
The Group The Company2016 2015 2016 2015
RMB million RMB million RMB million RMB million
Income from principal operations 1,880,190 1,977,877 696,211 819,593Income from other operations 50,721 42,498 29,967 25,692Total 1,930,911 2,020,375 726,178 845,285Operating costs 1,492,165 1,594,070 513,514 609,596
The income from principal operations mainly represents revenue from sales of crude oil, natural gas, refined petroleum products and chemical products. The income from other operations mainly represents revenue from sale of materials, service, rental income and others. Operating costs primarily represent the products cost related to the principal operations. The Group’s segmental information is set out in Note 56.
39 TAXES AND SURCHARGES
The Group
2016 2015RMB million RMB million
Consumption tax 193,836 198,754City construction tax 18,155 18,195Education surcharge 13,695 13,686Resources tax 3,871 4,853Other taxes 2,449 861Total 232,006 236,349
The applicable tax rate of the taxes and surcharges are set out in Note 4.
40 FINANCIAL EXPENSES
The Group
2016 2015RMB million RMB million
Interest expenses incurred 9,021 8,273Less: Capitalised interest expenses 859 1,221Net interest expenses 8,162 7,052Accretion expenses (Note 31) 1,057 1,081Interest income (3,218) (3,010)Net foreign exchange loss 610 3,857Total 6,611 8,980
The interest rates per annum at which borrowing costs were capitalised during the year ended 31 December 2016 by the Group ranged from 2.65% to 4.82% (2015: 2.6% to 5.9%).
41 CLASSIFICATION OF EXPENSES BY NATURE
The operation costs, selling and distribution expenses, general and administrative expenses and exploration expenses (including dry holes) in consolidated income statement classified by nature are as follows:
2016 2015RMB million RMB million
Purchased crude oil, products and operating supplies and expenses 1,379,691 1,494,046Personnel expenses 63,887 56,619Depreciation, depletion and amortization 108,425 96,460Exploration expenses (including dry holes) 11,035 10,459Other expenses 63,867 66,060Total 1,626,905 1,723,644
42 EXPLORATION EXPENSES
Exploration expenses include geological and geophysical expenses and written-off of unsuccessful dry hole costs.
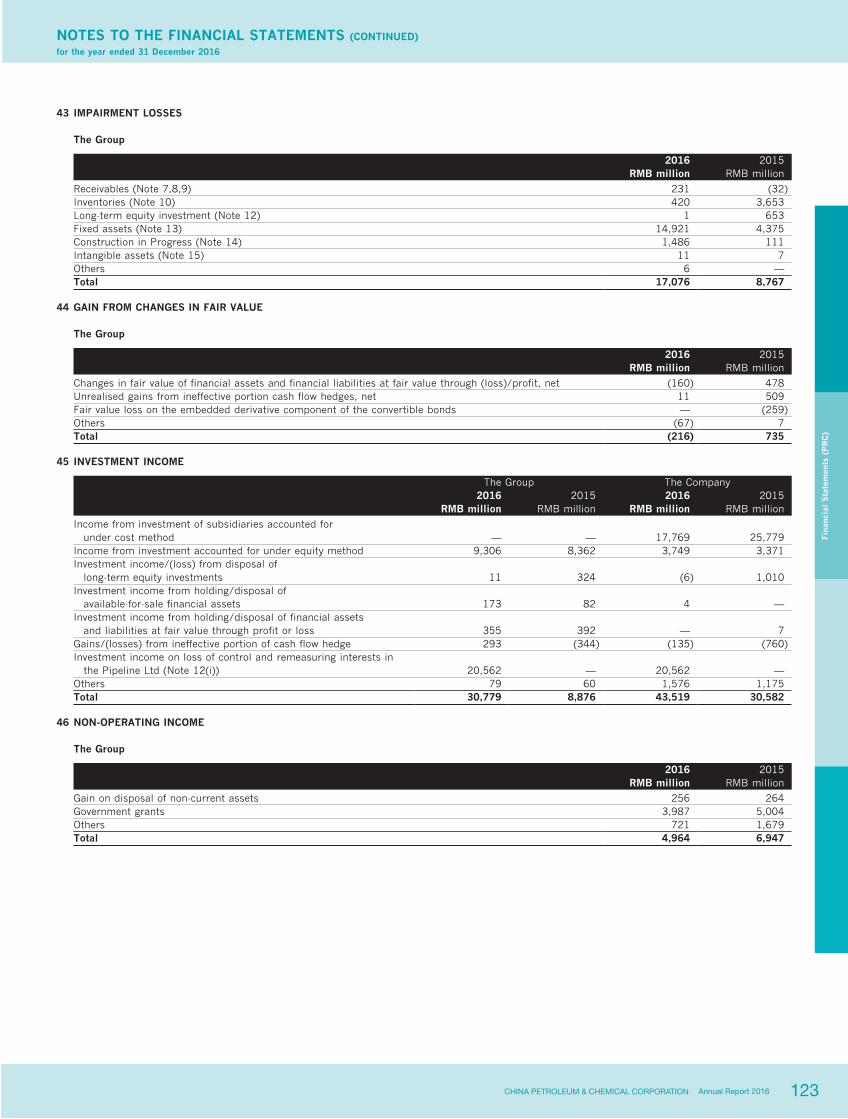
123CHINA PETROLEUM & CHEMICAL CORPORATION Annual Report 2016
NOTES TO THE FINANCIAL STATEMENTS (CONTINUED)for the year ended 31 December 2016
Fina
ncia
l S
tate
men
ts (
PR
C)
43 IMPAIRMENT LOSSES
The Group
2016 2015RMB million RMB million
Receivables (Note 7,8,9) 231 (32)Inventories (Note 10) 420 3,653Long-term equity investment (Note 12) 1 653Fixed assets (Note 13) 14,921 4,375Construction in Progress (Note 14) 1,486 111Intangible assets (Note 15) 11 7Others 6 —Total 17,076 8,767
44 GAIN FROM CHANGES IN FAIR VALUE
The Group
2016 2015RMB million RMB million
Changes in fair value of financial assets and financial liabilities at fair value through (loss)/profit, net (160) 478Unrealised gains from ineffective portion cash flow hedges, net 11 509Fair value loss on the embedded derivative component of the convertible bonds — (259)Others (67) 7Total (216) 735
45 INVESTMENT INCOME
The Group The Company2016 2015 2016 2015
RMB million RMB million RMB million RMB million
Income from investment of subsidiaries accounted for under cost method — — 17,769 25,779Income from investment accounted for under equity method 9,306 8,362 3,749 3,371Investment income/(loss) from disposal of long-term equity investments 11 324 (6) 1,010Investment income from holding/disposal of available-for-sale financial assets 173 82 4 —Investment income from holding/disposal of financial assets and liabilities at fair value through profit or loss 355 392 — 7Gains/(losses) from ineffective portion of cash flow hedge 293 (344) (135) (760)Investment income on loss of control and remeasuring interests in the Pipeline Ltd (Note 12(i)) 20,562 — 20,562 —Others 79 60 1,576 1,175Total 30,779 8,876 43,519 30,582
46 NON-OPERATING INCOME
The Group
2016 2015RMB million RMB million
Gain on disposal of non-current assets 256 264Government grants 3,987 5,004Others 721 1,679Total 4,964 6,947
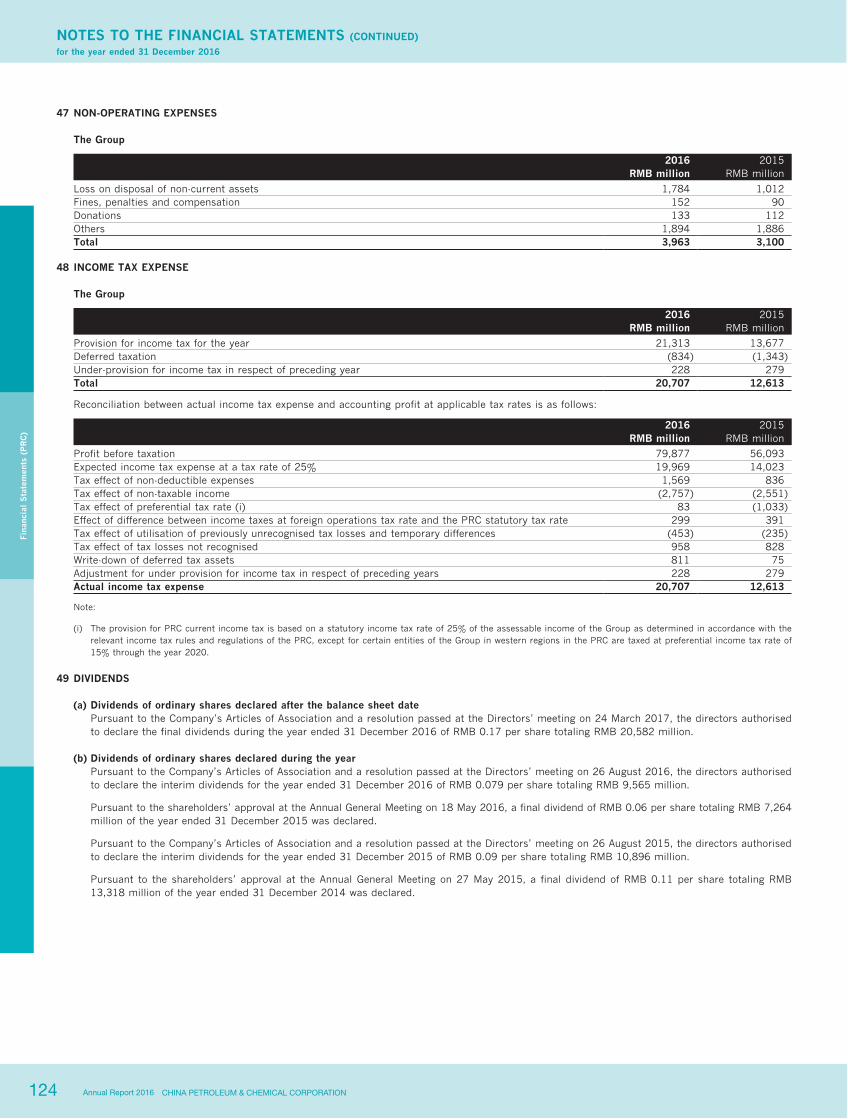
124 CHINA PETROLEUM & CHEMICAL CORPORATIONAnnual Report 2016
NOTES TO THE FINANCIAL STATEMENTS (CONTINUED)for the year ended 31 December 2016
Fina
ncia
l S
tate
men
ts (
PR
C)
47 NON-OPERATING EXPENSES
The Group
2016 2015RMB million RMB million
Loss on disposal of non-current assets 1,784 1,012Fines, penalties and compensation 152 90Donations 133 112Others 1,894 1,886Total 3,963 3,100
48 INCOME TAX EXPENSE
The Group
2016 2015RMB million RMB million
Provision for income tax for the year 21,313 13,677Deferred taxation (834) (1,343)Under-provision for income tax in respect of preceding year 228 279Total 20,707 12,613
Reconciliation between actual income tax expense and accounting profit at applicable tax rates is as follows:
2016 2015RMB million RMB million
Profit before taxation 79,877 56,093Expected income tax expense at a tax rate of 25% 19,969 14,023Tax effect of non-deductible expenses 1,569 836Tax effect of non-taxable income (2,757) (2,551)Tax effect of preferential tax rate (i) 83 (1,033)Effect of difference between income taxes at foreign operations tax rate and the PRC statutory tax rate 299 391Tax effect of utilisation of previously unrecognised tax losses and temporary differences (453) (235)Tax effect of tax losses not recognised 958 828Write-down of deferred tax assets 811 75Adjustment for under provision for income tax in respect of preceding years 228 279Actual income tax expense 20,707 12,613
Note:
(i) The provision for PRC current income tax is based on a statutory income tax rate of 25% of the assessable income of the Group as determined in accordance with the relevant income tax rules and regulations of the PRC, except for certain entities of the Group in western regions in the PRC are taxed at preferential income tax rate of 15% through the year 2020.
49 DIVIDENDS
(a) Dividends of ordinary shares declared after the balance sheet date Pursuant to the Company’s Articles of Association and a resolution passed at the Directors’ meeting on 24 March 2017, the directors authorised
to declare the final dividends during the year ended 31 December 2016 of RMB 0.17 per share totaling RMB 20,582 million.
(b) Dividends of ordinary shares declared during the year Pursuant to the Company’s Articles of Association and a resolution passed at the Directors’ meeting on 26 August 2016, the directors authorised
to declare the interim dividends for the year ended 31 December 2016 of RMB 0.079 per share totaling RMB 9,565 million.
Pursuant to the shareholders’ approval at the Annual General Meeting on 18 May 2016, a final dividend of RMB 0.06 per share totaling RMB 7,264 million of the year ended 31 December 2015 was declared.
Pursuant to the Company’s Articles of Association and a resolution passed at the Directors’ meeting on 26 August 2015, the directors authorised to declare the interim dividends for the year ended 31 December 2015 of RMB 0.09 per share totaling RMB 10,896 million.
Pursuant to the shareholders’ approval at the Annual General Meeting on 27 May 2015, a final dividend of RMB 0.11 per share totaling RMB 13,318 million of the year ended 31 December 2014 was declared.

125CHINA PETROLEUM & CHEMICAL CORPORATION Annual Report 2016
NOTES TO THE FINANCIAL STATEMENTS (CONTINUED)for the year ended 31 December 2016
Fina
ncia
l S
tate
men
ts (
PR
C)
50 SUPPLEMENTAL INFORMATION TO THE CASH FLOW STATEMENT
The Group
(a) Reconciliation of net profit to cash flows from operating activities:
2016 2015RMB million RMB million
Net profit 59,170 43,480Add: Impairment losses on assets 17,076 8,767
Depreciation of fixed assets 99,592 87,074Amortisation of intangible assets and long-term deferred expenses 8,833 9,386Dry hole costs written off 7,467 6,099Net loss on disposal of non-current assets 1,528 748Fair value loss/(gain) 216 (735)Financial expenses 4,336 10,728Investment income (30,779) (8,876)Decrease/(increase) in deferred tax assets 1,719 (1,982)(Decrease)/increase in deferred tax liabilities (2,553) 639(Increase)/decrease in inventories (11,364) 39,136Safety fund reserve 160 191(Increase)/decrease in operating receivables (22,549) 40,910Increase/(decrease) in operating payables 81,691 (69,825)
Net cash flow from operating activities 214,543 165,740
(b) Net change in cash:
2016 2015RMB million RMB million
Cash balance at the end of the year 124,468 68,933Less: Cash at the beginning of the year 68,933 10,526Net increase of cash 55,535 58,407
(c) The analysis of cash held by the Group is as follows:
2016 2015RMB million RMB million
Cash at bank and on hand – Cash on hand 10 16– Demand deposits 124,458 68,917
Cash at the end of the year 124,468 68,933

126 CHINA PETROLEUM & CHEMICAL CORPORATIONAnnual Report 2016
NOTES TO THE FINANCIAL STATEMENTS (CONTINUED)for the year ended 31 December 2016
Fina
ncia
l S
tate
men
ts (
PR
C)
51 RELATED PARTIES AND RELATED PARTY TRANSACTIONS
(1) Related parties having the ability to exercise control over the Group
The name of the company : China Petrochemical CorporationOrganisation code : 10169286-XRegistered address : No. 22, Chaoyangmen North Street, Chaoyang District, BeijingPrincipal activities : Exploration, production, storage and transportation (including pipeline transportation), sales
and utilisation of crude oil and natural gas; refining; wholesale and retail of gasoline, kerosene and diesel; production, sales, storage and transportation of petrochemical and other chemical products; industrial investment and investment management; exploration, construction, installation and maintenance of petroleum and petrochemical constructions and equipments; manufacturing electrical equipment; research, development, application and consulting services of information technology and alternative energy products; import & export of goods and technology.
Relationship with the Group : Ultimate holding companyTypes of legal entity : State-ownedAuthorised representative : Wang YupuRegistered capital : RMB 274,867 million
Sinopec Group Company is an enterprise controlled by the PRC government. Sinopec Group Company directly and indirectly holds 71.32% shareholding of the Company.
(2) Related parties not having the ability to exercise control over the Group
Related parties under common control of a parent company with the Company:Sinopec Finance (Note)Sinopec Shengli Petroleum Administration BureauSinopec Zhongyuan Petroleum Exploration BureauSinopec Assets Management CorporationSinopec Engineering IncorporationSinopec Century Bright Capital Investment LimitedSinopec Petroleum Storage and Reserve Limited
Associates of the Group:Pipeline LtdSinopec FinanceZhongtian Synergetic EnergyChina Aviation OilCIR
Joint ventures of the Group:FREPBASF-YPCMansarovarTaihuYASREF
Note: Sinopec Finance is under common control of a parent company with the Company and is also the associate of the Group.
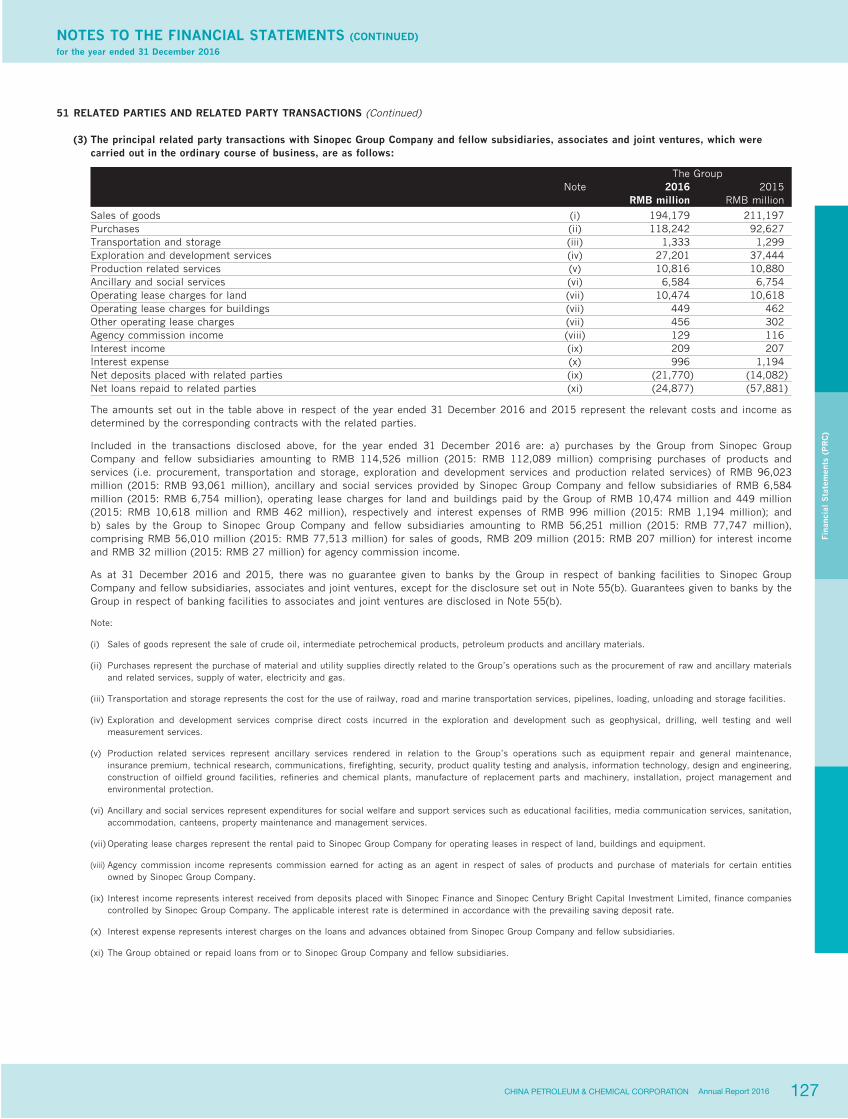
127CHINA PETROLEUM & CHEMICAL CORPORATION Annual Report 2016
NOTES TO THE FINANCIAL STATEMENTS (CONTINUED)for the year ended 31 December 2016
Fina
ncia
l S
tate
men
ts (
PR
C)
51 RELATED PARTIES AND RELATED PARTY TRANSACTIONS (Continued)
(3) The principal related party transactions with Sinopec Group Company and fellow subsidiaries, associates and joint ventures, which were carried out in the ordinary course of business, are as follows:
The GroupNote 2016 2015
RMB million RMB million
Sales of goods (i) 194,179 211,197Purchases (ii) 118,242 92,627Transportation and storage (iii) 1,333 1,299Exploration and development services (iv) 27,201 37,444Production related services (v) 10,816 10,880Ancillary and social services (vi) 6,584 6,754Operating lease charges for land (vii) 10,474 10,618Operating lease charges for buildings (vii) 449 462Other operating lease charges (vii) 456 302Agency commission income (viii) 129 116Interest income (ix) 209 207Interest expense (x) 996 1,194Net deposits placed with related parties (ix) (21,770) (14,082)Net loans repaid to related parties (xi) (24,877) (57,881)
The amounts set out in the table above in respect of the year ended 31 December 2016 and 2015 represent the relevant costs and income as determined by the corresponding contracts with the related parties.
Included in the transactions disclosed above, for the year ended 31 December 2016 are: a) purchases by the Group from Sinopec Group Company and fellow subsidiaries amounting to RMB 114,526 million (2015: RMB 112,089 million) comprising purchases of products and services (i.e. procurement, transportation and storage, exploration and development services and production related services) of RMB 96,023 million (2015: RMB 93,061 million), ancillary and social services provided by Sinopec Group Company and fellow subsidiaries of RMB 6,584 million (2015: RMB 6,754 million), operating lease charges for land and buildings paid by the Group of RMB 10,474 million and 449 million (2015: RMB 10,618 million and RMB 462 million), respectively and interest expenses of RMB 996 million (2015: RMB 1,194 million); and b) sales by the Group to Sinopec Group Company and fellow subsidiaries amounting to RMB 56,251 million (2015: RMB 77,747 million), comprising RMB 56,010 million (2015: RMB 77,513 million) for sales of goods, RMB 209 million (2015: RMB 207 million) for interest income and RMB 32 million (2015: RMB 27 million) for agency commission income.
As at 31 December 2016 and 2015, there was no guarantee given to banks by the Group in respect of banking facilities to Sinopec Group Company and fellow subsidiaries, associates and joint ventures, except for the disclosure set out in Note 55(b). Guarantees given to banks by the Group in respect of banking facilities to associates and joint ventures are disclosed in Note 55(b).
Note:
(i) Sales of goods represent the sale of crude oil, intermediate petrochemical products, petroleum products and ancillary materials.
(ii) Purchases represent the purchase of material and utility supplies directly related to the Group’s operations such as the procurement of raw and ancillary materials and related services, supply of water, electricity and gas.
(iii) Transportation and storage represents the cost for the use of railway, road and marine transportation services, pipelines, loading, unloading and storage facilities.
(iv) Exploration and development services comprise direct costs incurred in the exploration and development such as geophysical, drilling, well testing and well measurement services.
(v) Production related services represent ancillary services rendered in relation to the Group’s operations such as equipment repair and general maintenance, insurance premium, technical research, communications, firefighting, security, product quality testing and analysis, information technology, design and engineering, construction of oilfield ground facilities, refineries and chemical plants, manufacture of replacement parts and machinery, installation, project management and environmental protection.
(vi) Ancillary and social services represent expenditures for social welfare and support services such as educational facilities, media communication services, sanitation, accommodation, canteens, property maintenance and management services.
(vii) Operating lease charges represent the rental paid to Sinopec Group Company for operating leases in respect of land, buildings and equipment.
(viii) Agency commission income represents commission earned for acting as an agent in respect of sales of products and purchase of materials for certain entities owned by Sinopec Group Company.
(ix) Interest income represents interest received from deposits placed with Sinopec Finance and Sinopec Century Bright Capital Investment Limited, finance companies controlled by Sinopec Group Company. The applicable interest rate is determined in accordance with the prevailing saving deposit rate.
(x) Interest expense represents interest charges on the loans and advances obtained from Sinopec Group Company and fellow subsidiaries.
(xi) The Group obtained or repaid loans from or to Sinopec Group Company and fellow subsidiaries.
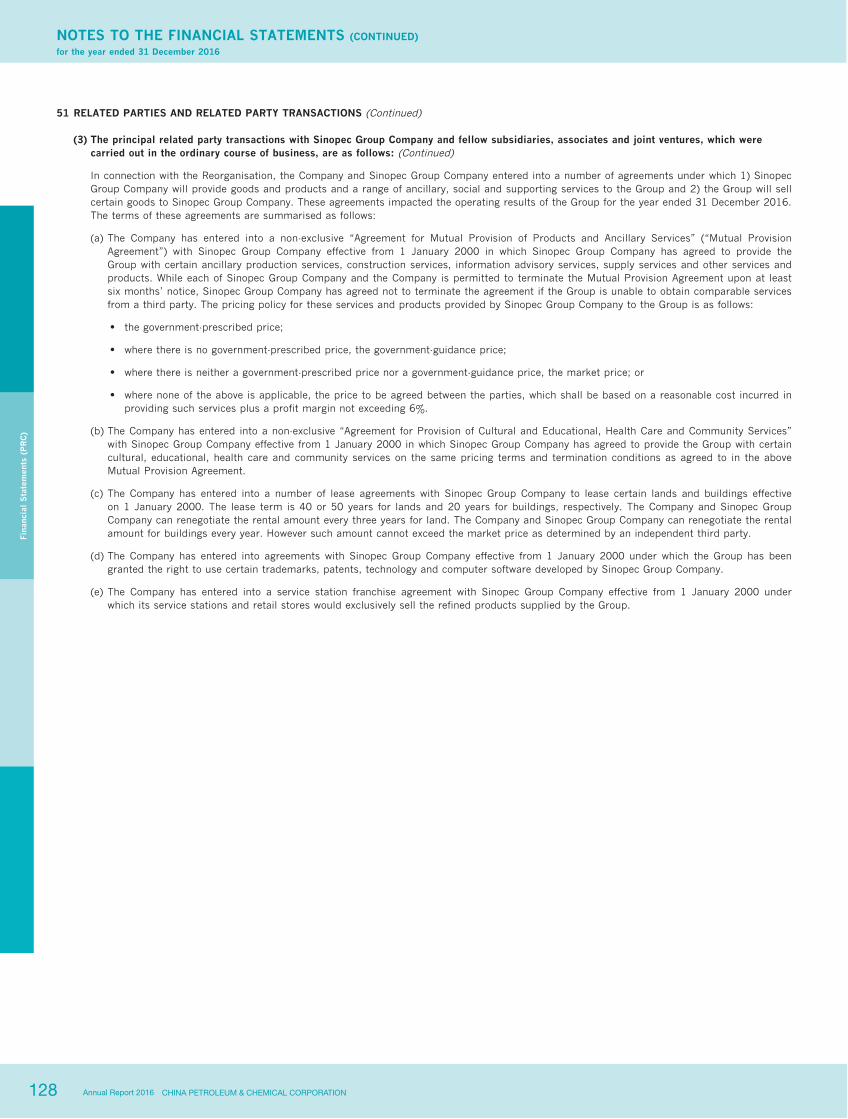
128 CHINA PETROLEUM & CHEMICAL CORPORATIONAnnual Report 2016
NOTES TO THE FINANCIAL STATEMENTS (CONTINUED)for the year ended 31 December 2016
Fina
ncia
l S
tate
men
ts (
PR
C)
51 RELATED PARTIES AND RELATED PARTY TRANSACTIONS (Continued)
(3) The principal related party transactions with Sinopec Group Company and fellow subsidiaries, associates and joint ventures, which were carried out in the ordinary course of business, are as follows: (Continued)
In connection with the Reorganisation, the Company and Sinopec Group Company entered into a number of agreements under which 1) Sinopec Group Company will provide goods and products and a range of ancillary, social and supporting services to the Group and 2) the Group will sell certain goods to Sinopec Group Company. These agreements impacted the operating results of the Group for the year ended 31 December 2016. The terms of these agreements are summarised as follows:
(a) The Company has entered into a non-exclusive “Agreement for Mutual Provision of Products and Ancillary Services” (“Mutual Provision Agreement”) with Sinopec Group Company effective from 1 January 2000 in which Sinopec Group Company has agreed to provide the Group with certain ancillary production services, construction services, information advisory services, supply services and other services and products. While each of Sinopec Group Company and the Company is permitted to terminate the Mutual Provision Agreement upon at least six months’ notice, Sinopec Group Company has agreed not to terminate the agreement if the Group is unable to obtain comparable services from a third party. The pricing policy for these services and products provided by Sinopec Group Company to the Group is as follows:
‧ the government-prescribed price;
‧ where there is no government-prescribed price, the government-guidance price;
‧ where there is neither a government-prescribed price nor a government-guidance price, the market price; or
‧ where none of the above is applicable, the price to be agreed between the parties, which shall be based on a reasonable cost incurred in providing such services plus a profit margin not exceeding 6%.
(b) The Company has entered into a non-exclusive “Agreement for Provision of Cultural and Educational, Health Care and Community Services” with Sinopec Group Company effective from 1 January 2000 in which Sinopec Group Company has agreed to provide the Group with certain cultural, educational, health care and community services on the same pricing terms and termination conditions as agreed to in the above Mutual Provision Agreement.
(c) The Company has entered into a number of lease agreements with Sinopec Group Company to lease certain lands and buildings effective on 1 January 2000. The lease term is 40 or 50 years for lands and 20 years for buildings, respectively. The Company and Sinopec Group Company can renegotiate the rental amount every three years for land. The Company and Sinopec Group Company can renegotiate the rental amount for buildings every year. However such amount cannot exceed the market price as determined by an independent third party.
(d) The Company has entered into agreements with Sinopec Group Company effective from 1 January 2000 under which the Group has been granted the right to use certain trademarks, patents, technology and computer software developed by Sinopec Group Company.
(e) The Company has entered into a service station franchise agreement with Sinopec Group Company effective from 1 January 2000 under which its service stations and retail stores would exclusively sell the refined products supplied by the Group.

129CHINA PETROLEUM & CHEMICAL CORPORATION Annual Report 2016
NOTES TO THE FINANCIAL STATEMENTS (CONTINUED)for the year ended 31 December 2016
Fina
ncia
l S
tate
men
ts (
PR
C)
51 RELATED PARTIES AND RELATED PARTY TRANSACTIONS (Continued)
(4) Balances with Sinopec Group Company and fellow subsidiaries, associates and joint ventures
The balances with the Group’s related parties at 31 December 2016 and 2015 are as follows:
The ultimate holding company Other related companiesAt 31 December
2016At 31 December
2015At 31 December
2016At 31 December
2015RMB million RMB million RMB million RMB million
Cash and cash equivalents — — 40,073 18,303Accounts receivable 25 1 10,953 22,392Prepayments and other current assets 33 34 13,397 9,050Other non-current assets — — 20,385 17,760Accounts payable 3 5 19,416 13,190Advances from customers 13 20 1,969 1,792Other payables 178 29 19,430 18,616Other non-current liabilities — — 9,998 8,226Short-term loans — — 18,430 43,693Long-term loans (including current portion) (Note) — — 44,922 44,536
Note: The long-term borrowings mainly include an interest-free loan with a maturity period of 20 years amounting to RMB 35,560 million from the Sinopec Group Company through the Sinopec Finance. This borrowing is a special arrangement to reduce financing costs and improve liquidity of the Company during its initial global offering in 2000.
Amounts due from/to Sinopec Group Company and fellow subsidiaries, associates and joint ventures, other than short-term loans and long-term loans, bear no interest, are unsecured and are repayable in accordance with normal commercial terms. The terms and conditions associated with short-term loans and long-term loans payable to Sinopec Group Company and fellow subsidiaries are set out in Note 21 and Note 29.
As at and for the year ended 31 December 2016 and 2015, no individually significant impairment losses for bad and doubtful debts were recorded in respect of amounts due from Sinopec Group Company and fellow subsidiaries, associates and joint ventures.
(5) Key management personnel emoluments
Key management personnel are those persons having authority and responsibility for planning, directing and controlling the activities of the Group, directly or indirectly, including directors and supervisors of the Group. The key management personnel compensations are as follows:
2016 2015RMB thousand RMB thousand
Short-term employee benefits 5,648 5,225Retirement scheme contributions 499 510Total 6,147 5,735
130 CHINA PETROLEUM & CHEMICAL CORPORATIONAnnual Report 2016
NOTES TO THE FINANCIAL STATEMENTS (CONTINUED)for the year ended 31 December 2016
Fina
ncia
l S
tate
men
ts (
PR
C)
52 PRINCIPAL ACCOUNTING ESTIMATES AND JUDGEMENTS
The Group’s financial condition and results of operations are sensitive to accounting methods, assumptions and estimates that underlie the preparation of the financial statements. The Group bases the assumptions and estimates on historical experience and on various other assumptions that it believes to be reasonable and which form the basis for making judgements about matters that are not readily apparent from other sources. On an on-going basis, management evaluates its estimates. Actual results may differ from those estimates as facts, circumstances and conditions change.
The selection of critical accounting policies, the judgements and other uncertainties affecting application of those policies and the sensitivity of reported results to changes in conditions and assumptions are factors to be considered when reviewing the financial statements. The significant accounting policies are set forth in Note 3. The Group believes the following critical accounting policies involve the most significant judgements and estimates used in the preparation of the financial statements.
(a) Oil and gas properties and reserves The accounting for the exploration and production segment’s oil and gas activities is subject to accounting rules that are unique to the oil and
gas industry. The Group has used the successful efforts method to account for oil and gas business activities. The successful efforts method reflects the volatility that is inherent in exploring for mineral resources in that costs of unsuccessful exploratory efforts are charged to expense. These costs primarily include dry hole costs, seismic costs and other exploratory costs.
Engineering estimates of the Group’s oil and gas reserves are inherently imprecise and represent only approximate amounts because of the subjective judgements involved in developing such information. There are authoritative guidelines regarding the engineering criteria that have to be met before estimated oil and gas reserves can be designated as “proved”. Proved and proved developed reserves estimates are updated at least annually and take into account recent production and technical information about each field. In addition, as prices and cost levels change from year to year, the estimate of proved and proved developed reserves also changes. This change is considered a change in estimate for accounting purposes and is reflected on a prospective basis in related depreciation rates. Oil and gas reserves have a direct impact on the assessment of the recoverability of the carrying amounts of oil and gas properties reported in the financial statements. If proved reserves estimates are revised downwards, earnings could be affected by changes in depreciation expense or an immediate write-down of the property’s carrying amount.
Future dismantlement costs for oil and gas properties are estimated with reference to engineering estimates after taking into consideration the anticipated method of dismantlement required in accordance with industry practices in the similar geographic area, including estimation of economic life of oil and gas properties, technology and price level. The present values of these estimated future dismantlement costs are capitalised as oil and gas properties with equivalent amounts recognised as provisions for dismantlement costs.
Despite the inherent imprecision in these engineering estimates, these estimates are used in determining depreciation expense, impairment expense and future dismantlement costs. Capitalised costs of proved oil and gas properties are amortised on a unit-of-production method based on volumes produced and reserves.
(b) Impairment for assets If circumstances indicate that the net book value of a long-lived asset may not be recoverable, the asset may be considered “impaired”, and
an impairment loss may be recognised in accordance with “ASBE 8 – Impairment of Assets”. The carrying amounts of long-lived assets are reviewed periodically in order to assess whether the recoverable amounts have declined below the carrying amounts. These assets are tested for impairment whenever events or changes in circumstances indicate that their recorded carrying amounts may not be recoverable. When such a decline has occurred, the carrying amount is reduced to recoverable amount. For goodwill, the recoverable amount is estimated annually. The recoverable amount is the greater of the fair value less costs to sell and the present value of expected future cash flows. It is difficult to precisely estimate the fair value because quoted market prices for the Group’s assets or cash-generating units are not readily available. In determining the value of expected future cash flows, expected cash flows generated by the asset or the cash-generating unit are discounted to their present value, which requires significant judgement relating to sales volume, selling price and amount of operating costs. The Group uses all readily available information in determining an amount that is a reasonable approximation of recoverable amount, including estimates based on reasonable and supportable assumptions and projections of sales volume, selling price and amount of operating costs.
(c) Depreciation Fixed assets are depreciated on a straight-line basis over the estimated useful lives of the assets, after taking into account the estimated residual
value. Management reviews the estimated useful lives of the assets at least annually in order to determine the amount of depreciation expense to be recorded during any reporting year. The useful lives are based on the Group’s historical experience with similar assets and taking into account anticipated technological changes. The depreciation expense for future years is adjusted if there are significant changes from previous estimates.
(d) Allowances for doubtful accounts Management estimates impairment losses for bad and doubtful debts resulting from the inability of the Group’s customers to make the required
payments. Management bases the estimates on the ageing of the accounts receivable balance, customer credit-worthiness, and historical write-off experience. If the financial condition of the customers were to deteriorate, actual write-offs would be higher than estimated.
(e) Allowance for diminution in value of inventories If the costs of inventories become higher than their net realisable values, an allowance for diminution in value of inventories is recognised.
Net realisable value represents the estimated selling price in the ordinary course of business, less the estimated costs of completion and the estimated costs necessary to make the sale. Management bases the estimates on all available information, including the current market prices of the finished goods and raw materials, and historical operating costs. If the actual selling prices were to be lower or the costs of completion were to be higher than estimated, the actual allowance for diminution in value of inventories would be higher than estimated.
131CHINA PETROLEUM & CHEMICAL CORPORATION Annual Report 2016
NOTES TO THE FINANCIAL STATEMENTS (CONTINUED)for the year ended 31 December 2016
Fina
ncia
l S
tate
men
ts (
PR
C)
53 PRINCIPAL SUBSIDIARIES
The Company’s principal subsidiaries have been consolidated into the Group’s financial statements for the year ended 31 December 2016. The following list contains the particulars of subsidiaries which principally affected the results, assets and liabilities of the Group:
Full name of enterprise Principal activities
Registeredcapital/paid-
up capital
Actualinvestment at31 December
2016
Percentageof equityinterest/
voting rightheld by
the Group
MinorityInterests at
31 December2016
million million % RMB million
(a) Subsidiaries acquired through group restructuring: China Petrochemical International Company Limited Trading of petrochemical products RMB 1,400 RMB 1,856 100.00 26China International United Petroleum and Chemical Company Limited
Trading of crude oil and petrochemical products
RMB 3,000
RMB 4,585
100.00
3,790
Sinopec Catalyst Company Limited Production and sale of catalyst products RMB 1,500 RMB 1,562 100.00 194Sinopec Yangzi Petrochemical Company Limited
Manufacturing of intermediate petrochemical products and petroleum products
RMB 13,203
RMB 15,651
100.00
—
Sinopec Pipeline Storage & Transportation Company Limited
Pipeline storage and transportation of crude oil
RMB 12,000
RMB 12,000
100.00
—
Sinopec Lubricant Company Limited
Production and sale of refined petroleum products, lubricant base oil, and petrochemical materials
RMB 3,374
RMB 3,374
100.00
49
Sinopec Yizheng Chemical Fibre Limited Liability Company
Production and sale of polyester chips and polyester fibres
RMB 4,000
RMB 6,713
100.00
—
Sinopec Marketing Company Limited (“Marketing Company”)
Marketing and distribution of refined petroleum products
RMB 28,403
RMB 20,000
70.42
63,555
Sinopec Kantons Holdings Limited (“Sinopec Kantons”) Trading of crude oil and petroleum products HKD 248 HKD 3,952 60.34 3,398Sinopec Shanghai Petrochemical Company Limited (“Shanghai Petrochemical”)
Manufacturing of synthetic fibres, resin and plastics, intermediate petrochemical products and petroleum products
RMB 10,800
RMB 5,820
50.56
12,518
Fujian Petrochemical Company Limited (“Fujian Petrochemical”) (i)
Manufacturing of plastics, intermediate petrochemical products and petroleum products
RMB 5,745
RMB 2,873
50.00
3,619
(b) Subsidiaries established by the Group: Sinopec International Petroleum Exploration and Production Limited (“SIPL”)
Investment in exploration, production and sale of petroleum and natural gas
RMB 8,000
RMB 8,000
100.00
15,253
Sinopec Overseas Investment Holding Limited (“SOIH”) Investment holding USD 1,638 USD 1,638 100.00 52Sinopec Chemical Sales Company Limited Marketing and distribution of petrochemical products RMB 1,000 RMB 1,165 100.00 64Sinopec Great Wall Energy & Chemical Company Limited
Coal chemical industry investment management, production and sale of coal chemical products
RMB 20,739
RMB 20,773
100.00
201
Sinopec Beihai Refining and Chemical Limited Liability Company
Import and processing of crude oil, production, storage and sale of petroleum products and petrochemical products
RMB 5,294
RMB 5,240
98.98
81
Sinopec Qingdao Refining and Chemical Company Limited
Manufacturing of intermediate petrochemical products and petroleum products
RMB 5,000
RMB 4,250
85.00
1,066
Sinopec-SK(Wuhan) Petrochemical Company Limited (“Zhonghan Wuhan”)
Production, sale, research and development of ethylene and downstream byproducts
RMB 6,270
RMB 4,076
65.00
3,029
(c) Subsidiaries acquired through business combination under common control:Sinopec Hainan Refining and Chemical Company Limited
Manufacturing of intermediate petrochemical products and petroleum products
RMB 3,986
RMB 2,990
75.00
1,941
Sinopec Qingdao Petrochemical Company Limited
Manufacturing of intermediate petrochemical products and petroleum products
RMB 1,595
RMB 7,233
100.00
—
Gaoqiao Petrochemical Company Limited (Note 1)
Manufacturing of intermediate petrochemical products and petroleum products
RMB 10,000
RMB 4,804
55.00
4,211
(d) Subsidiaries acquired through business combination not under common control:Sinopec Zhanjiang Dongxing Petrochemical Company Limited
Manufacturing of intermediate petrochemical products and petroleum products
RMB 4,397
RMB 3,225
75.00
825
* The minority interests of subsidiaries which the Group holds 100% of equity interests at the end of the year are the minority interests of their subsidiaries.
Except for Sinopec Kantons and SOIH, which are incorporated in Bermuda and Hong Kong, respectively, all of the above principal subsidiaries are incorporated and operate their businesses principally in the PRC.
Note:
(i) The Group consolidated the financial statements of the entity because it is exposed to, or has rights to, variable returns from its involvement with the entity and has the ability to affect those return through its power over the entity.

132 CHINA PETROLEUM & CHEMICAL CORPORATIONAnnual Report 2016
NOTES TO THE FINANCIAL STATEMENTS (CONTINUED)for the year ended 31 December 2016
Fina
ncia
l S
tate
men
ts (
PR
C)
53 PRINCIPAL SUBSIDIARIES (Continued)
Summarised financial information on subsidiaries with material minority interests
Set out below are the summarised financial information which the amount before inter-company eliminations for each subsidiary that has minority interests that are material to the Group.
Summarised consolidated balance sheet
Marketing Company SIPL Shanghai Petrochemical Fujian Petrochemical Sinopec Kantons (ii) Zhonghan WuhanAt 31
DecemberAt 31
DecemberAt 31
DecemberAt 31
DecemberAt 31
DecemberAt 31
DecemberAt 31
DecemberAt 31
DecemberAt 31
DecemberAt 31
DecemberAt 31
December2016 2015 2016 2015 2016 2015 2016 2015 2015 2016 2015
RMB million RMB million RMB million RMB million RMB million RMB million RMB million RMB million RMB million RMB million RMB million
Current assets 121,260 102,948 18,116 20,231 14,876 8,144 926 140 1,732 1,489 1,386Current liabilities (168,366) (156,028) (824) (5,468) (8,942) (7,726) (812) (73) (3,488) (7,521) (9,885)Net current (liabilities)/assets (47,106) (53,080) 17,292 14,763 5,934 418 114 67 (1,756) (6,032) (8,499)Non-current assets 246,514 240,312 40,067 40,075 19,248 19,878 7,845 5,487 13,025 14,686 15,815Non-current liabilities (1,460) (1,628) (39,322) (34,320) (150) (160) (721) (831) (3,384) — —Net non-current assets 245,054 238,684 745 5,755 19,098 19,718 7,124 4,656 9,641 14,686 15,815
Summarised consolidated statement of comprehensive income and cash flow
Year ended 31 December Marketing Company SIPL Shanghai Petrochemical Fujian Petrochemical Sinopec Kantons (ii) Zhonghan Wuhan2016 2015 2016 2015 2016 2015 2016 2015 2015 2016 2015
RMB million RMB million RMB million RMB million RMB million RMB million RMB million RMB million RMB million RMB million RMB Million
Turnover 1,050,294 1,103,934 4,016 6,557 77,894 80,803 4,968 5,532 1,642 11,703 14,077Profit/(loss) for the year 26,461 23,684 (4,604) (222) 5,969 3,282 2,513 1,456 825 1,558 1,738Total comprehensive income/(loss) 27,385 24,391 (2,481) (4,257) 5,988 3,282 2,513 1,456 302 1,558 1,738Comprehensive income/(loss) attributable to minority interests 9,028 7,755 (3,279) (1,218) 2,966 1,641 1,256 728 120 545 608Dividends paid to minority interests 4,932 7,356 — — 563 10 — — 40 — —Net cash generated from/ (used in) operating activities 50,840 33,196 2,576 4,059 7,211 5,143 617 (179) 1,185 3,636 4,223
Note:
(ii) This listed company will announce its financial information for the year ended 31 December later than the Company, therefore its 2016 financial information is not currently disclosed.
133CHINA PETROLEUM & CHEMICAL CORPORATION Annual Report 2016
NOTES TO THE FINANCIAL STATEMENTS (CONTINUED)for the year ended 31 December 2016
Fina
ncia
l S
tate
men
ts (
PR
C)
54 COMMITMENTS
Operating lease commitments The Group lease land and buildings, service stations and other equipment through non-cancellable operating leases. These operating leases do not
contain provisions for contingent lease rentals. None of the rental agreements contains escalation provisions that may require higher future rental payments.
At 31 December 2016 and 2015, the future minimum lease payments of the Group under operating leases are as follows:
At 31 December At 31 December2016 2015
RMB million RMB million
Within one year 14,917 13,737Between one and two years 14,228 13,265Between two and three years 13,966 13,199Between three and four years 13,217 13,091Between four and five years 12,980 12,430After five years 275,570 284,300Total 344,878 350,022
Capital commitmentsAt 31 December 2016 and 2015, the capital commitments of the Group are as follows:
At 31 December At 31 December2016 2015
RMB million RMB million
Authorised and contracted for (i) 116,379 113,017Authorised but not contracted for 31,720 47,043Total 148,099 160,060
These capital commitments relate to oil and gas exploration and development, refining and petrochemical production capacity expansion projects, the construction of service stations and oil depots and investment commitments.
Note:
(i) The investment commitments of the Group is RMB 4,173 million (2015: RMB 4,089 million).
Commitments to joint venturesPursuant to certain of the joint venture agreements entered into by the Group, the Group is obliged to purchase products from the joint ventures based on market prices.
Exploration and production licensesExploration licenses for exploration activities are registered with the Ministry of Land and Resources. The maximum term of the Group’s exploration licenses is 7 years, and may be renewed twice within 30 days prior to expiration of the original term with each renewal being for a two-year term. The Group is obligated to make progressive annual minimum exploration investment relating to the exploration blocks in respect of which the license is issued. The Ministry of Land and Resources also issues production licenses to the Group on the basis of the reserve reports approved by relevant authorities. The maximum term of a full production license is 30 years unless a special dispensation is given by the State Council. The maximum term of the production licenses issued to the Group is 80 years as a special dispensation was given to the Group by the State Council. The Group’s production license is renewable upon application by the Group 30 days prior to expiration.
The Group is required to make payments of exploration license fees and production right usage fees to the Ministry of Land and Resources annually and recognised in profit and loss. Payments incurred were approximately RMB 333 million for the year ended 31 December 2016 (2015: RMB 372 million).
Estimated future annual payments of the Group are as follows:
At 31 December At 31 December2016 2015
RMB million RMB million
Within one year 263 283Between one and two years 123 125Between two and three years 25 32Between three and four years 24 22Between four and five years 25 21After five years 867 834Total 1,327 1,317
The implementation of commitments in previous year and the Group’s commitments did not have material discrepancy.
134 CHINA PETROLEUM & CHEMICAL CORPORATIONAnnual Report 2016
NOTES TO THE FINANCIAL STATEMENTS (CONTINUED)for the year ended 31 December 2016
Fina
ncia
l S
tate
men
ts (
PR
C)
55 CONTINGENT LIABILITIES
(a) The Company has been advised by its PRC lawyers that, except for liabilities constituting or arising out of or relating to the business assumed by the Company in the Reorganisation, no other liabilities were assumed by the Company, and the Company is not jointly and severally liable for other debts and obligations incurred by Sinopec Group Company prior to the Reorganisation.
(b) At 31 December 2016 and 2015, guarantees by the Group in respect of facilities granted to the parties below are as follows:
At 31 December At 31 December2016 2015
RMB million RMB million
Joint ventures 658 703Associates (i) 11,545 —Others 10,669 6,010Total 22,872 6,713
(i) The group provided a guarantee in respect to standby credit facilities granted to Zhongtian Synergetic Energy by banks amount to RMB 17,050 million. As at 31 December 2016, the amount withdrawn by Zhongtian Synergetic Energy from banks and guaranteed by the group was RMB 11,545 million.
The Group monitors the conditions that are subject to the guarantees to identify whether it is probable that a loss has occurred, and recognises any such losses under guarantees when those losses are reliably estimable. At 31 December 2016 and 2015, it was not probable that the Group will be required to make payments under the guarantees. Thus no liabilities have been accrued for a loss related to the Group’s obligation under these guarantee arrangements.
Environmental contingenciesUnder existing legislation, management believes that there are no probable liabilities that will have a material adverse effect on the financial position or operating results of the Group. The PRC government, however, has moved, and may move further towards more rigorous enforcement of applicable laws, and towards the adoption of more stringent environmental standards. Environmental liabilities are subject to considerable uncertainties which affect the Group’s ability to estimate the ultimate cost of remediation efforts. These uncertainties include (i) the exact nature and extent of the contamination at various sites including, but not limited to refineries, oil fields, service stations, terminals and land development areas, whether operating, closed or sold, (ii) the extent of required cleanup efforts, (iii) varying costs of alternative remediation strategies, (iv) changes in environmental remediation requirements, and (v) the identification of new remediation sites. The amount of such future cost is indeterminable due to such factors as the unknown magnitude of possible contamination and the unknown timing and extent of the corrective actions that may be required. Accordingly, the outcome of environmental liabilities under proposed or future environmental legislation cannot reasonably be estimated at present, and could be material. The Group paid normal routine pollutant discharge fees of approximately RMB 6,358 million for the year ended 31 December 2016 (2015: RMB 5,813 million).
Legal contingenciesThe Group is a defendant in certain lawsuits as well as the named party in other proceedings arising in the ordinary course of business. Management has assessed the likelihood of an unfavourable outcome of such contingencies, lawsuits or other proceedings and believes that any resulting liabilities will not have a material adverse effect on the financial position, operating results or cash flows of the Group.
56 SEGMENT REPORTING
Segment information is presented in respect of the Group’s operating segments. The format is based on the Group’s management and internal reporting structure.
In a manner consistent with the way in which information is reported internally to the Group’s chief operating decision maker for the purposes of resource allocation and performance assessment, the Group has identified the following five reportable segments. No operating segments have been aggregated to form the following reportable segments.
(i) Exploration and production — which explores and develops oil fields, produces crude oil and natural gas and sells such products to the refining segment of the Group and external customers.
(ii) Refining — which processes and purifies crude oil, which is sourced from the exploration and production segment of the Group and external suppliers, and manufactures and sells petroleum products to the chemicals and marketing and distribution segments of the Group and external customers.
(iii) Marketing and distribution — which owns and operates oil depots and service stations in the PRC, and distributes and sells refined petroleum products (mainly gasoline and diesel) in the PRC through wholesale and retail sales networks.
(iv) Chemicals — which manufactures and sells petrochemical products, derivative petrochemical products and other chemical products to external customers.
(v) Corporate and others — which largely comprise the trading activities of the import and export companies of the Group and research and development undertaken by other subsidiaries.
The segments were determined primarily because the Group manages its exploration and production, refining, marketing and distribution, chemicals, and corporate and others businesses separately. The reportable segments are each managed separately because they manufacture and/or distribute distinct products with different production processes and due to their distinct operating and gross margin characteristics.
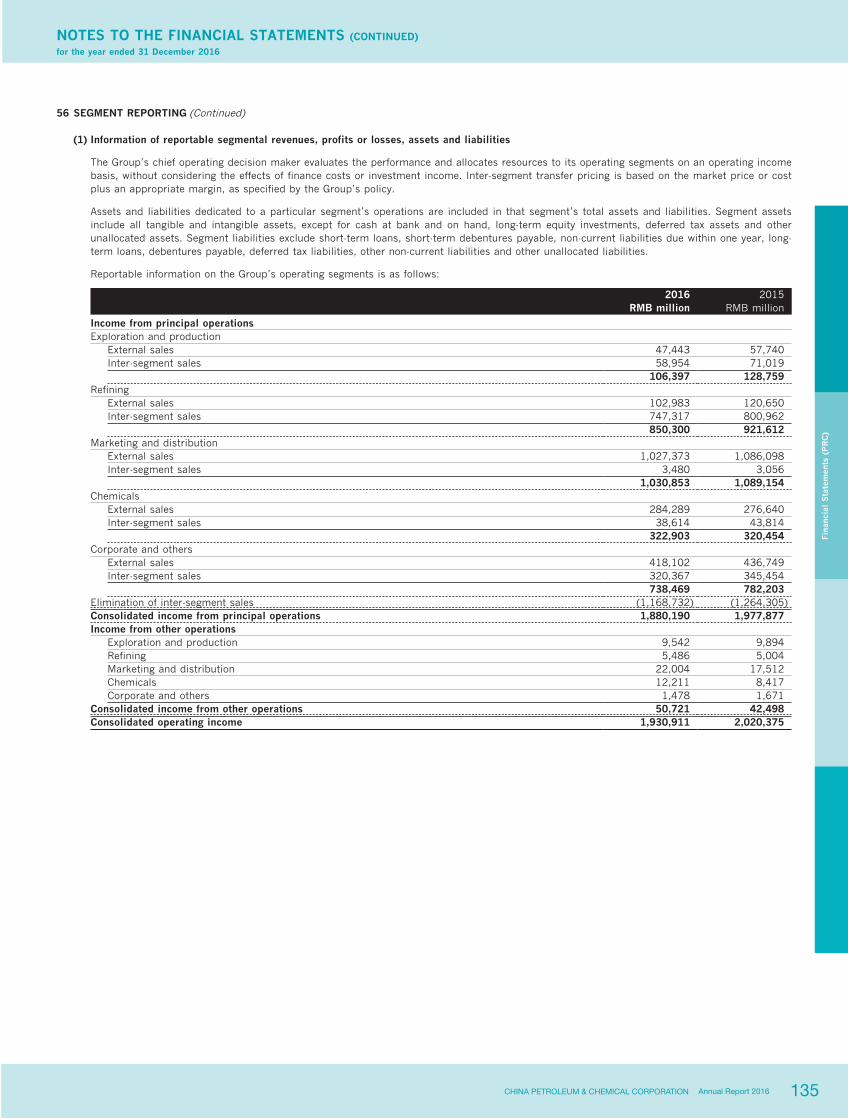
135CHINA PETROLEUM & CHEMICAL CORPORATION Annual Report 2016
NOTES TO THE FINANCIAL STATEMENTS (CONTINUED)for the year ended 31 December 2016
Fina
ncia
l S
tate
men
ts (
PR
C)
56 SEGMENT REPORTING (Continued)
(1) Information of reportable segmental revenues, profits or losses, assets and liabilities
The Group’s chief operating decision maker evaluates the performance and allocates resources to its operating segments on an operating income basis, without considering the effects of finance costs or investment income. Inter-segment transfer pricing is based on the market price or cost plus an appropriate margin, as specified by the Group’s policy.
Assets and liabilities dedicated to a particular segment’s operations are included in that segment’s total assets and liabilities. Segment assets include all tangible and intangible assets, except for cash at bank and on hand, long-term equity investments, deferred tax assets and other unallocated assets. Segment liabilities exclude short-term loans, short-term debentures payable, non-current liabilities due within one year, long-term loans, debentures payable, deferred tax liabilities, other non-current liabilities and other unallocated liabilities.
Reportable information on the Group’s operating segments is as follows:
2016 2015RMB million RMB million
Income from principal operations Exploration and production
External sales 47,443 57,740Inter-segment sales 58,954 71,019 106,397 128,759
Refining External sales 102,983 120,650Inter-segment sales 747,317 800,962 850,300 921,612
Marketing and distribution External sales 1,027,373 1,086,098Inter-segment sales 3,480 3,056 1,030,853 1,089,154
Chemicals External sales 284,289 276,640Inter-segment sales 38,614 43,814 322,903 320,454
Corporate and others External sales 418,102 436,749Inter-segment sales 320,367 345,454 738,469 782,203
Elimination of inter-segment sales (1,168,732) (1,264,305)Consolidated income from principal operations 1,880,190 1,977,877Income from other operations
Exploration and production 9,542 9,894Refining 5,486 5,004Marketing and distribution 22,004 17,512Chemicals 12,211 8,417Corporate and others 1,478 1,671
Consolidated income from other operations 50,721 42,498Consolidated operating income 1,930,911 2,020,375

136 CHINA PETROLEUM & CHEMICAL CORPORATIONAnnual Report 2016
NOTES TO THE FINANCIAL STATEMENTS (CONTINUED)for the year ended 31 December 2016
Fina
ncia
l S
tate
men
ts (
PR
C)
56 SEGMENT REPORTING (Continued)
(1) Information of reportable segmental revenues, profits or losses, assets and liabilities (Continued)
2016 2015RMB million RMB million
Operating (loss)/profit By segment
Exploration and production (58,531) (18,511)Refining 55,808 19,423Marketing and distribution 32,385 27,299Chemicals 20,769 19,516Corporate and others 2,912 (678)Elimination 1,581 4,566
Total segment operating profit 54,924 51,615Investment income/(loss)
Exploration and production 19,248 708Refining 1,071 754Marketing and distribution 2,928 1,910Chemicals 5,815 3,384Corporate and others 1,717 2,942Elimination — (822)
Total segment investment income 30,779 8,876Financial expenses (6,611) (8,980)(Loss)/gain from changes in fair value (216) 735Operating profit 78,876 52,246Add: Non-operating income 4,964 6,947Less: Non-operating expenses 3,963 3,100Profit before taxation 79,877 56,093
At 31 December At 31 December2016 2015
RMB million RMB million
Assets Segment assets
Exploration and production 402,476 447,307Refining 260,903 264,573Marketing and distribution 292,328 283,416Chemicals 144,371 151,646Corporate and others 95,263 108,921
Total segment assets 1,195,341 1,255,863Cash at bank and on hand 142,497 69,666Long-term equity investments 116,812 84,293Deferred tax assets 7,214 7,469Other unallocated assets 36,745 29,977Total assets 1,498,609 1,447,268Liabilities Segment liabilities
Exploration and production 95,883 96,725Refining 82,170 58,578Marketing and distribution 132,922 118,476Chemicals 31,989 27,160Corporate and others 97,078 104,193
Total segment liabilities 440,042 405,132Short-term loans 30,374 74,729Non-current liabilities due within one year 38,972 11,277Long-term loans 62,461 56,493Debentures payable 54,985 83,253Deferred tax liabilities 7,661 8,259Other non-current liabilities 16,136 13,673Other unallocated liabilities 15,453 4,887Total liabilities 666,084 657,703
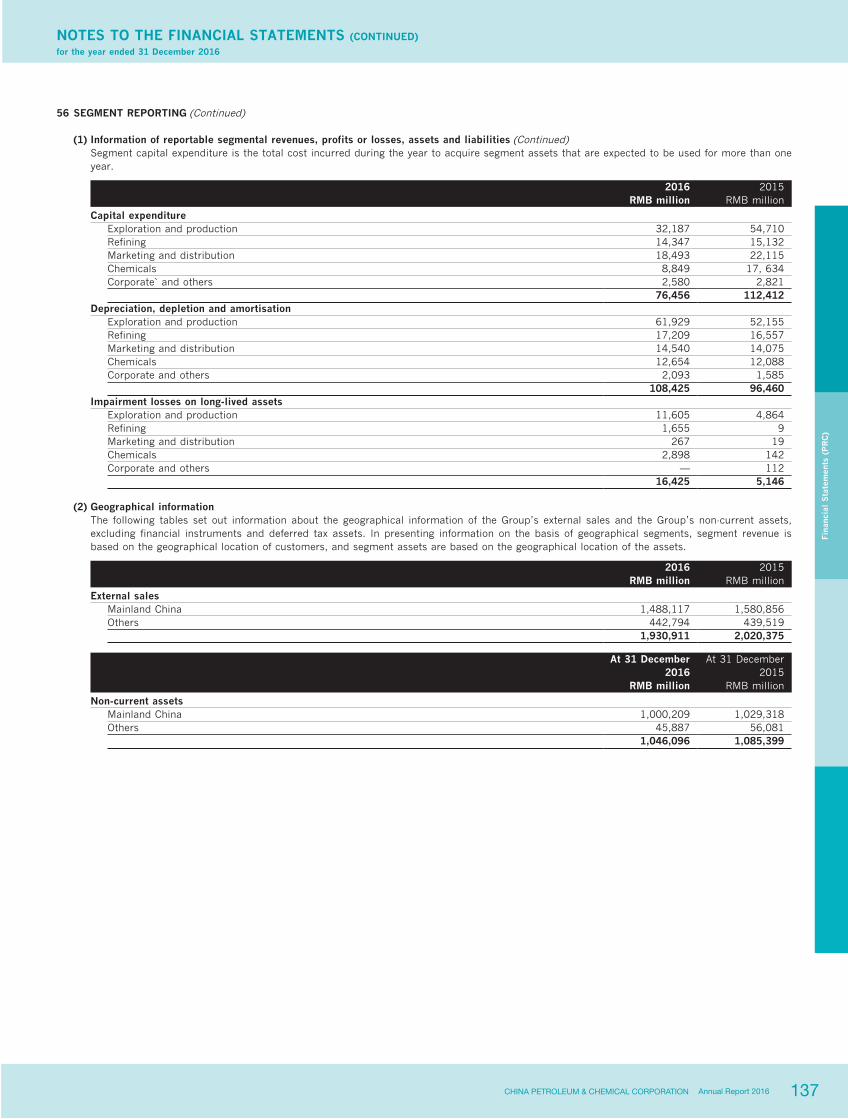
137CHINA PETROLEUM & CHEMICAL CORPORATION Annual Report 2016
NOTES TO THE FINANCIAL STATEMENTS (CONTINUED)for the year ended 31 December 2016
Fina
ncia
l S
tate
men
ts (
PR
C)
56 SEGMENT REPORTING (Continued)
(1) Information of reportable segmental revenues, profits or losses, assets and liabilities (Continued)Segment capital expenditure is the total cost incurred during the year to acquire segment assets that are expected to be used for more than one year.
2016 2015RMB million RMB million
Capital expenditure Exploration and production 32,187 54,710Refining 14,347 15,132Marketing and distribution 18,493 22,115Chemicals 8,849 17, 634Corporate` and others 2,580 2,821 76,456 112,412
Depreciation, depletion and amortisation Exploration and production 61,929 52,155Refining 17,209 16,557Marketing and distribution 14,540 14,075Chemicals 12,654 12,088Corporate and others 2,093 1,585 108,425 96,460
Impairment losses on long-lived assets Exploration and production 11,605 4,864Refining 1,655 9Marketing and distribution 267 19Chemicals 2,898 142Corporate and others — 112 16,425 5,146
(2) Geographical informationThe following tables set out information about the geographical information of the Group’s external sales and the Group’s non-current assets, excluding financial instruments and deferred tax assets. In presenting information on the basis of geographical segments, segment revenue is based on the geographical location of customers, and segment assets are based on the geographical location of the assets.
2016 2015RMB million RMB million
External sales Mainland China 1,488,117 1,580,856Others 442,794 439,519 1,930,911 2,020,375
At 31 December At 31 December2016 2015
RMB million RMB million
Non-current assets Mainland China 1,000,209 1,029,318Others 45,887 56,081 1,046,096 1,085,399

138 CHINA PETROLEUM & CHEMICAL CORPORATIONAnnual Report 2016
NOTES TO THE FINANCIAL STATEMENTS (CONTINUED)for the year ended 31 December 2016
Fina
ncia
l S
tate
men
ts (
PR
C)
57 FINANCIAL INSTRUMENTS
OverviewFinancial assets of the Group include cash at bank, equity investments other than long-term equity investment, accounts receivable, bills receivable, available-for-sale financial assets, derivative financial instruments and other receivables. Financial liabilities of the Group include short-term and long-term loans, accounts payable, bills payable, debentures payable, employee benefits payable, derivative financial instruments and other payables.
The Group has exposure to the following risks from its uses of financial instruments:
‧ credit risk;
‧ liquidity risk;
‧ market risk;
The Board of Directors has overall responsibility for the establishment and oversight of the Group’s risk management framework, and developing and monitoring the Group’s risk management policies.
The Group’s risk management policies are established to identify and analyse the risks faced by the Group, and set appropriate risk limits and controls to monitor risks and adherence to limits. Risk management policies and systems are reviewed regularly to reflect changes in market conditions and the Group’s activities. The Group, through its training and management standards and procedures, aims to develop a disciplined and constructive control environment in which all employees understand their roles and obligations. Internal audit department undertakes both regular and ad hoc reviews of risk management controls and procedures, the results of which are reported to the Group’s audit committee.
Credit riskCredit risk is the risk of financial loss to the Group if a customer or counterparty to a financial instrument fails to meet its contractual obligations, and arises principally from the Group’s deposits placed with financial institutions and receivables from customers. To limit exposure to credit risk relating to deposits, the Group primarily places cash deposits only with large financial institution in the PRC with acceptable credit ratings. The majority of the Group’s accounts receivable relates to sales of petroleum and chemical products to related parties and third parties operating in the petroleum and chemical industries. No single customer accounted for greater than 10% of total accounts receivable at 31 December 2016, except for the amounts due from Sinopec Group Company and fellow subsidiaries. The Group performs ongoing credit evaluations of its customers’ financial condition and generally does not require collateral on accounts receivable. The Group maintains an impairment loss for doubtful accounts and actual losses have been within management’s expectations.
The carrying amounts of cash at bank, trade accounts and bills receivables, derivative financial instruments and other receivables, represent the Group’s maximum exposure to credit risk in relation to financial assets.
Liquidity riskLiquidity risk is the risk that the Group encounters short fall of capital when meeting its obligation of financial liabilities. The Group’s approach to managing liquidity is to ensure, as far as possible, that it will always have sufficient liquidity to meet its liabilities when due, under both normal and stressed capital conditions, without incurring unacceptable losses or risking damage to the Group’s reputation. The Group prepares monthly cash flow budget to ensure that they will always have sufficient liquidity to meet its financial obligation as they fall due. The Group arranges and negotiates financing with financial institutions and maintains a certain level of standby credit facilities to reduce the liquidity risk.
At 31 December 2016, the Group has standby credit facilities with several PRC financial institutions which provide the Group to borrow up to RMB 256,375 million (2015: RMB 297,997 million) on an unsecured basis, at a weighted average interest rate of 3.57% (2015: 2.50%). At 31 December 2016, the Group’s outstanding borrowings under these facilities were RMB 36,933 million (2015: RMB 32,991 million) and were included in loans.
The following table sets out the remaining contractual maturities at the balance sheet date of the Group’s financial liabilities, which are based on contractual undiscounted cash flows (including interest payments computed using contractual rates or, if floating, based on prevailing rates current at the balance sheet date) and the earliest date the Group would be required to repay:
At 31 December 2016
Carryingamount
Totalcontractual
undiscountedcash flow
Within oneyear or on
demand
More thanone year
but less thantwo years
More thantwo years
but less thanfive years
More thanfive years
RMB million RMB million RMB million RMB million RMB million RMB million
Short-term loans 30,374 30,708 30,708 — — —Non-current liabilities due within one year 38,972 39,934 39,934 — — —Short-term debentures payable 6,000 6,030 6,030 — — —Long-term loans 62,461 64,566 900 4,652 57,262 1,752Debentures payable 54,985 65,503 1,932 24,717 16,069 22,785Bills payable 5,828 5,828 5,828 — — —Accounts payable 174,301 174,301 174,301 — — —Other payables and employee benefits payable 81,254 81,254 81,254 — — —Total 454,175 468,124 340,887 29,369 73,331 24,537
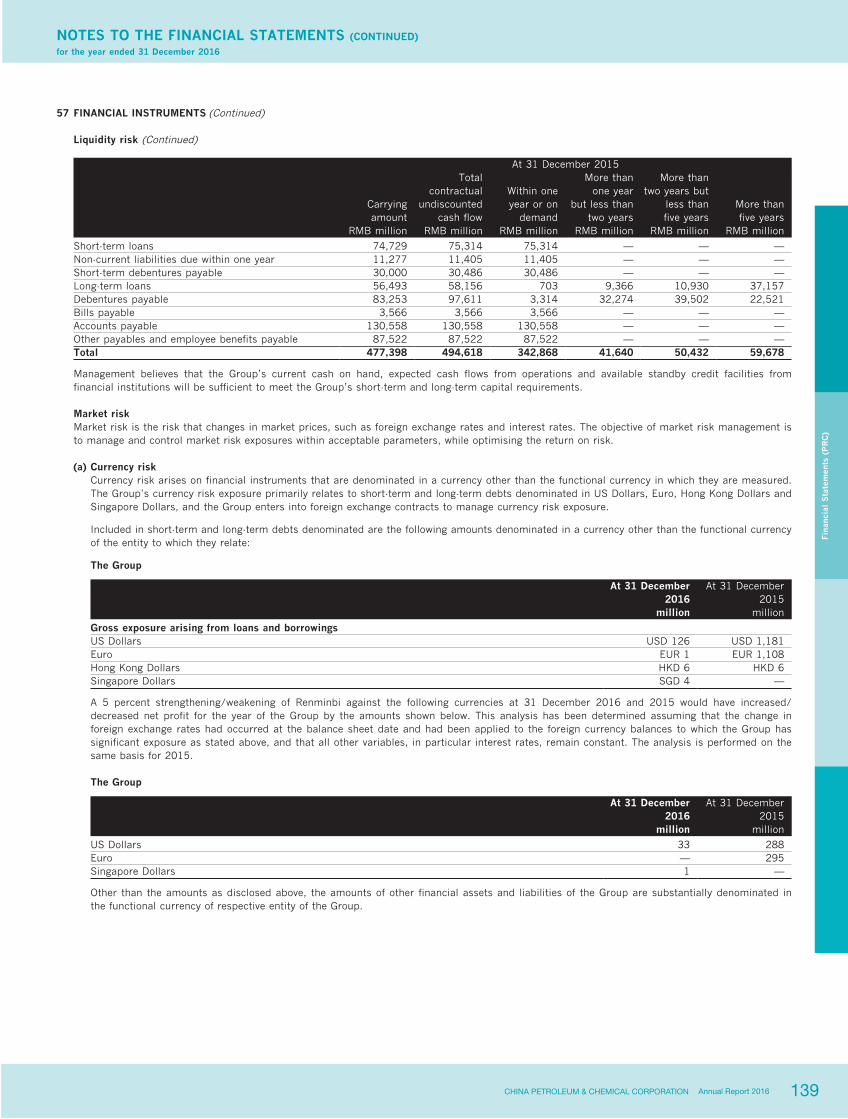
139CHINA PETROLEUM & CHEMICAL CORPORATION Annual Report 2016
NOTES TO THE FINANCIAL STATEMENTS (CONTINUED)for the year ended 31 December 2016
Fina
ncia
l S
tate
men
ts (
PR
C)
57 FINANCIAL INSTRUMENTS (Continued)
Liquidity risk (Continued)
At 31 December 2015
Carryingamount
Totalcontractual
undiscountedcash flow
Within oneyear or on
demand
More thanone year
but less thantwo years
More thantwo years but
less thanfive years
More thanfive years
RMB million RMB million RMB million RMB million RMB million RMB million
Short-term loans 74,729 75,314 75,314 — — —Non-current liabilities due within one year 11,277 11,405 11,405 — — —Short-term debentures payable 30,000 30,486 30,486 — — —Long-term loans 56,493 58,156 703 9,366 10,930 37,157Debentures payable 83,253 97,611 3,314 32,274 39,502 22,521Bills payable 3,566 3,566 3,566 — — —Accounts payable 130,558 130,558 130,558 — — —Other payables and employee benefits payable 87,522 87,522 87,522 — — —Total 477,398 494,618 342,868 41,640 50,432 59,678
Management believes that the Group’s current cash on hand, expected cash flows from operations and available standby credit facilities from financial institutions will be sufficient to meet the Group’s short-term and long-term capital requirements.
Market risk Market risk is the risk that changes in market prices, such as foreign exchange rates and interest rates. The objective of market risk management is
to manage and control market risk exposures within acceptable parameters, while optimising the return on risk.
(a) Currency risk Currency risk arises on financial instruments that are denominated in a currency other than the functional currency in which they are measured.
The Group’s currency risk exposure primarily relates to short-term and long-term debts denominated in US Dollars, Euro, Hong Kong Dollars and Singapore Dollars, and the Group enters into foreign exchange contracts to manage currency risk exposure.
Included in short-term and long-term debts denominated are the following amounts denominated in a currency other than the functional currency of the entity to which they relate:
The Group
At 31 December At 31 December2016 2015
million million
Gross exposure arising from loans and borrowings US Dollars USD 126 USD 1,181Euro EUR 1 EUR 1,108Hong Kong Dollars HKD 6 HKD 6Singapore Dollars SGD 4 —
A 5 percent strengthening/weakening of Renminbi against the following currencies at 31 December 2016 and 2015 would have increased/decreased net profit for the year of the Group by the amounts shown below. This analysis has been determined assuming that the change in foreign exchange rates had occurred at the balance sheet date and had been applied to the foreign currency balances to which the Group has significant exposure as stated above, and that all other variables, in particular interest rates, remain constant. The analysis is performed on the same basis for 2015.
The Group
At 31 December At 31 December2016 2015
million million
US Dollars 33 288Euro — 295Singapore Dollars 1 —
Other than the amounts as disclosed above, the amounts of other financial assets and liabilities of the Group are substantially denominated in the functional currency of respective entity of the Group.
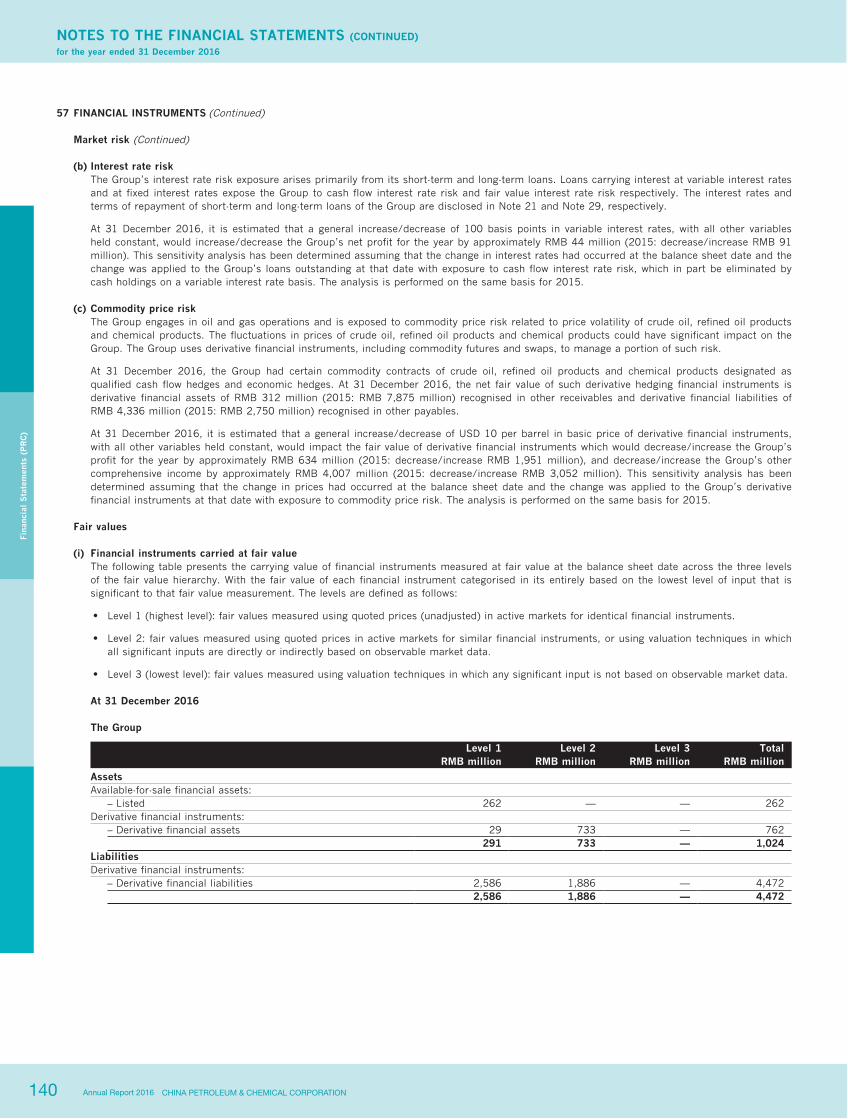
140 CHINA PETROLEUM & CHEMICAL CORPORATIONAnnual Report 2016
NOTES TO THE FINANCIAL STATEMENTS (CONTINUED)for the year ended 31 December 2016
Fina
ncia
l S
tate
men
ts (
PR
C)
57 FINANCIAL INSTRUMENTS (Continued)
Market risk (Continued)
(b) Interest rate risk The Group’s interest rate risk exposure arises primarily from its short-term and long-term loans. Loans carrying interest at variable interest rates
and at fixed interest rates expose the Group to cash flow interest rate risk and fair value interest rate risk respectively. The interest rates and terms of repayment of short-term and long-term loans of the Group are disclosed in Note 21 and Note 29, respectively.
At 31 December 2016, it is estimated that a general increase/decrease of 100 basis points in variable interest rates, with all other variables held constant, would increase/decrease the Group’s net profit for the year by approximately RMB 44 million (2015: decrease/increase RMB 91 million). This sensitivity analysis has been determined assuming that the change in interest rates had occurred at the balance sheet date and the change was applied to the Group’s loans outstanding at that date with exposure to cash flow interest rate risk, which in part be eliminated by cash holdings on a variable interest rate basis. The analysis is performed on the same basis for 2015.
(c) Commodity price risk The Group engages in oil and gas operations and is exposed to commodity price risk related to price volatility of crude oil, refined oil products
and chemical products. The fluctuations in prices of crude oil, refined oil products and chemical products could have significant impact on the Group. The Group uses derivative financial instruments, including commodity futures and swaps, to manage a portion of such risk.
At 31 December 2016, the Group had certain commodity contracts of crude oil, refined oil products and chemical products designated as qualified cash flow hedges and economic hedges. At 31 December 2016, the net fair value of such derivative hedging financial instruments is derivative financial assets of RMB 312 million (2015: RMB 7,875 million) recognised in other receivables and derivative financial liabilities of RMB 4,336 million (2015: RMB 2,750 million) recognised in other payables.
At 31 December 2016, it is estimated that a general increase/decrease of USD 10 per barrel in basic price of derivative financial instruments, with all other variables held constant, would impact the fair value of derivative financial instruments which would decrease/increase the Group’s profit for the year by approximately RMB 634 million (2015: decrease/increase RMB 1,951 million), and decrease/increase the Group’s other comprehensive income by approximately RMB 4,007 million (2015: decrease/increase RMB 3,052 million). This sensitivity analysis has been determined assuming that the change in prices had occurred at the balance sheet date and the change was applied to the Group’s derivative financial instruments at that date with exposure to commodity price risk. The analysis is performed on the same basis for 2015.
Fair values
(i) Financial instruments carried at fair value The following table presents the carrying value of financial instruments measured at fair value at the balance sheet date across the three levels
of the fair value hierarchy. With the fair value of each financial instrument categorised in its entirely based on the lowest level of input that is significant to that fair value measurement. The levels are defined as follows:
‧ Level 1 (highest level): fair values measured using quoted prices (unadjusted) in active markets for identical financial instruments.
‧ Level 2: fair values measured using quoted prices in active markets for similar financial instruments, or using valuation techniques in which all significant inputs are directly or indirectly based on observable market data.
‧ Level 3 (lowest level): fair values measured using valuation techniques in which any significant input is not based on observable market data.
At 31 December 2016
The Group
Level 1 Level 2 Level 3 TotalRMB million RMB million RMB million RMB million
Assets Available-for-sale financial assets:
– Listed 262 — — 262Derivative financial instruments:
– Derivative financial assets 29 733 — 762 291 733 — 1,024
Liabilities Derivative financial instruments:
– Derivative financial liabilities 2,586 1,886 — 4,472 2,586 1,886 — 4,472
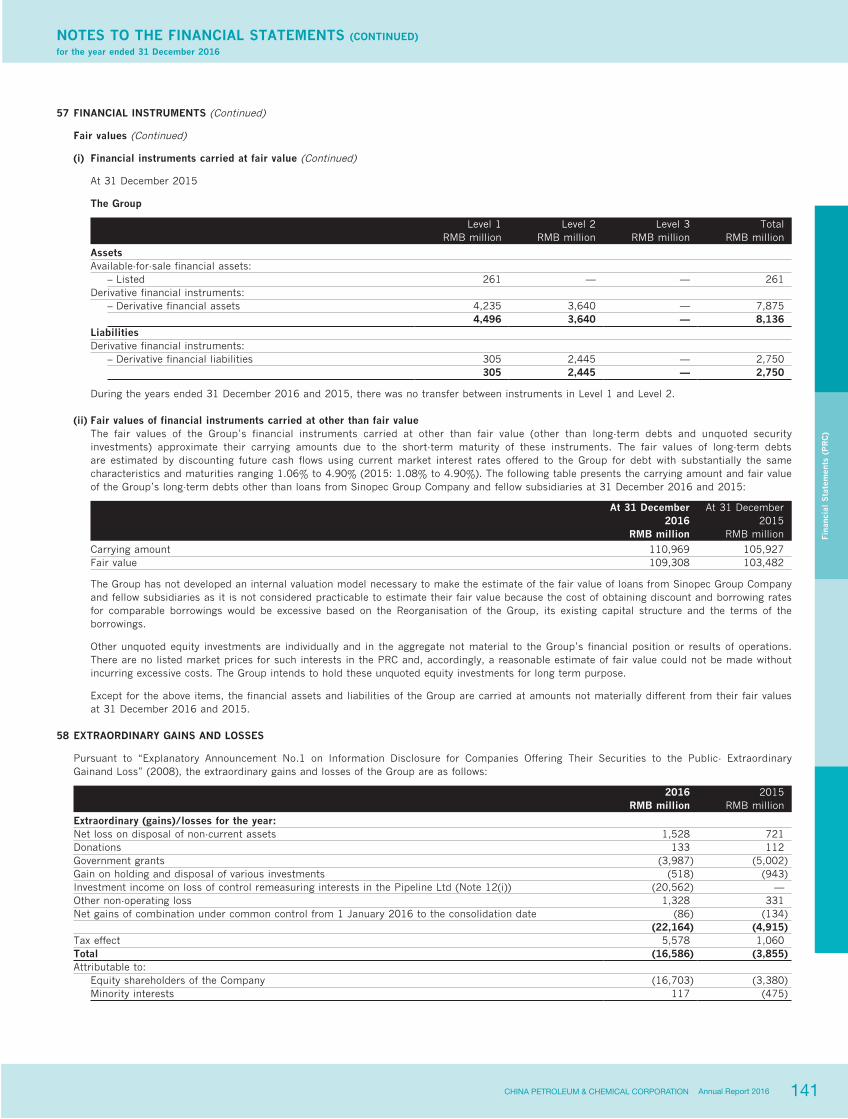
141CHINA PETROLEUM & CHEMICAL CORPORATION Annual Report 2016
NOTES TO THE FINANCIAL STATEMENTS (CONTINUED)for the year ended 31 December 2016
Fina
ncia
l S
tate
men
ts (
PR
C)
57 FINANCIAL INSTRUMENTS (Continued)
Fair values (Continued)
(i) Financial instruments carried at fair value (Continued)
At 31 December 2015
The Group
Level 1 Level 2 Level 3 TotalRMB million RMB million RMB million RMB million
Assets Available-for-sale financial assets:
– Listed 261 — — 261Derivative financial instruments:
– Derivative financial assets 4,235 3,640 — 7,875 4,496 3,640 — 8,136
Liabilities Derivative financial instruments:
– Derivative financial liabilities 305 2,445 — 2,750 305 2,445 — 2,750
During the years ended 31 December 2016 and 2015, there was no transfer between instruments in Level 1 and Level 2.
(ii) Fair values of financial instruments carried at other than fair value The fair values of the Group’s financial instruments carried at other than fair value (other than long-term debts and unquoted security
investments) approximate their carrying amounts due to the short-term maturity of these instruments. The fair values of long-term debts are estimated by discounting future cash flows using current market interest rates offered to the Group for debt with substantially the same characteristics and maturities ranging 1.06% to 4.90% (2015: 1.08% to 4.90%). The following table presents the carrying amount and fair value of the Group’s long-term debts other than loans from Sinopec Group Company and fellow subsidiaries at 31 December 2016 and 2015:
At 31 December At 31 December2016 2015
RMB million RMB million
Carrying amount 110,969 105,927Fair value 109,308 103,482
The Group has not developed an internal valuation model necessary to make the estimate of the fair value of loans from Sinopec Group Company and fellow subsidiaries as it is not considered practicable to estimate their fair value because the cost of obtaining discount and borrowing rates for comparable borrowings would be excessive based on the Reorganisation of the Group, its existing capital structure and the terms of the borrowings.
Other unquoted equity investments are individually and in the aggregate not material to the Group’s financial position or results of operations. There are no listed market prices for such interests in the PRC and, accordingly, a reasonable estimate of fair value could not be made without incurring excessive costs. The Group intends to hold these unquoted equity investments for long term purpose.
Except for the above items, the financial assets and liabilities of the Group are carried at amounts not materially different from their fair values at 31 December 2016 and 2015.
58 EXTRAORDINARY GAINS AND LOSSES
Pursuant to “Explanatory Announcement No.1 on Information Disclosure for Companies Offering Their Securities to the Public- Extraordinary Gainand Loss” (2008), the extraordinary gains and losses of the Group are as follows:
2016 2015RMB million RMB million
Extraordinary (gains)/losses for the year: Net loss on disposal of non-current assets 1,528 721Donations 133 112Government grants (3,987) (5,002)Gain on holding and disposal of various investments (518) (943)Investment income on loss of control remeasuring interests in the Pipeline Ltd (Note 12(i)) (20,562) —Other non-operating loss 1,328 331Net gains of combination under common control from 1 January 2016 to the consolidation date (86) (134) (22,164) (4,915)Tax effect 5,578 1,060Total (16,586) (3,855)Attributable to:
Equity shareholders of the Company (16,703) (3,380)Minority interests 117 (475)
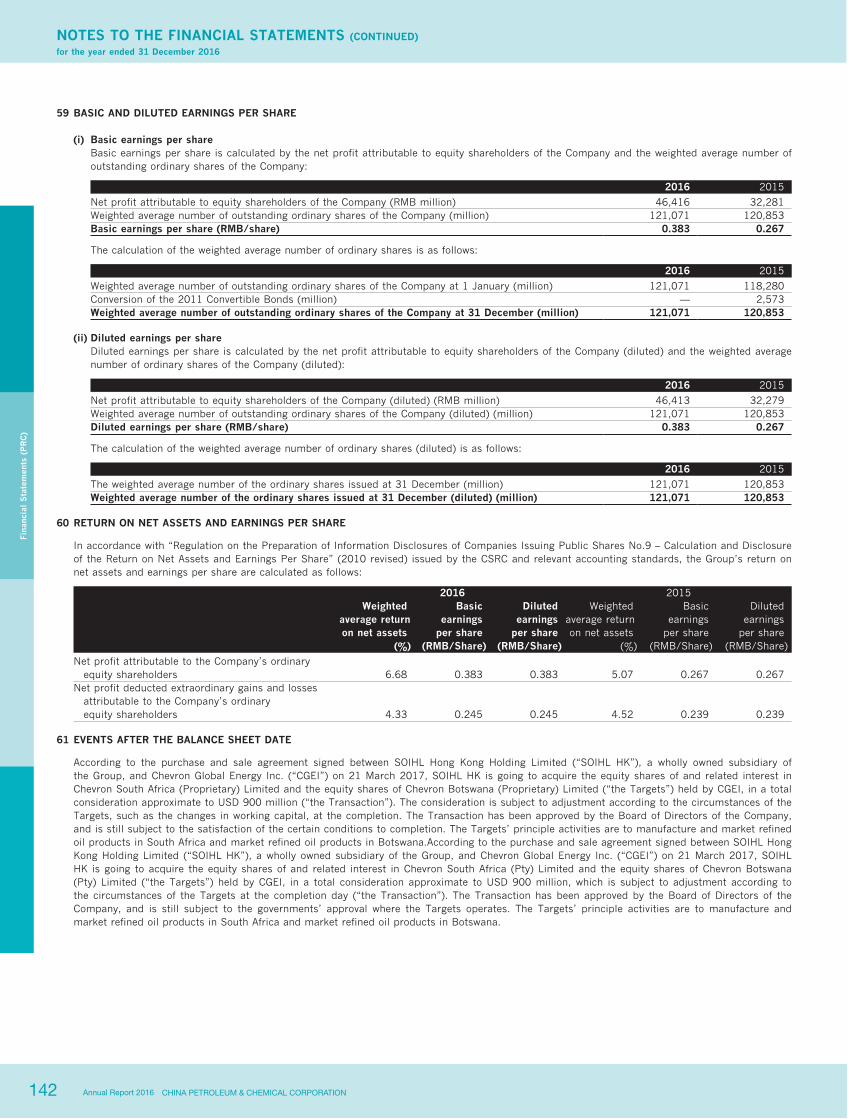
142 CHINA PETROLEUM & CHEMICAL CORPORATIONAnnual Report 2016
NOTES TO THE FINANCIAL STATEMENTS (CONTINUED)for the year ended 31 December 2016
Fina
ncia
l S
tate
men
ts (
PR
C)
59 BASIC AND DILUTED EARNINGS PER SHARE
(i) Basic earnings per share Basic earnings per share is calculated by the net profit attributable to equity shareholders of the Company and the weighted average number of
outstanding ordinary shares of the Company:
2016 2015
Net profit attributable to equity shareholders of the Company (RMB million) 46,416 32,281Weighted average number of outstanding ordinary shares of the Company (million) 121,071 120,853Basic earnings per share (RMB/share) 0.383 0.267
The calculation of the weighted average number of ordinary shares is as follows:
2016 2015
Weighted average number of outstanding ordinary shares of the Company at 1 January (million) 121,071 118,280Conversion of the 2011 Convertible Bonds (million) — 2,573Weighted average number of outstanding ordinary shares of the Company at 31 December (million) 121,071 120,853
(ii) Diluted earnings per share Diluted earnings per share is calculated by the net profit attributable to equity shareholders of the Company (diluted) and the weighted average
number of ordinary shares of the Company (diluted):
2016 2015
Net profit attributable to equity shareholders of the Company (diluted) (RMB million) 46,413 32,279Weighted average number of outstanding ordinary shares of the Company (diluted) (million) 121,071 120,853Diluted earnings per share (RMB/share) 0.383 0.267
The calculation of the weighted average number of ordinary shares (diluted) is as follows:
2016 2015
The weighted average number of the ordinary shares issued at 31 December (million) 121,071 120,853Weighted average number of the ordinary shares issued at 31 December (diluted) (million) 121,071 120,853
60 RETURN ON NET ASSETS AND EARNINGS PER SHARE
In accordance with “Regulation on the Preparation of Information Disclosures of Companies Issuing Public Shares No.9 – Calculation and Disclosure of the Return on Net Assets and Earnings Per Share” (2010 revised) issued by the CSRC and relevant accounting standards, the Group’s return on net assets and earnings per share are calculated as follows:
2016 2015Weighted
average returnon net assets
Basicearnings
per share
Dilutedearnings
per share
Weightedaverage returnon net assets
Basicearnings
per share
Dilutedearnings
per share(%) (RMB/Share) (RMB/Share) (%) (RMB/Share) (RMB/Share)
Net profit attributable to the Company’s ordinary equity shareholders 6.68 0.383 0.383 5.07 0.267 0.267Net profit deducted extraordinary gains and losses attributable to the Company’s ordinary equity shareholders 4.33 0.245 0.245 4.52 0.239 0.239
61 EVENTS AFTER THE BALANCE SHEET DATE
According to the purchase and sale agreement signed between SOIHL Hong Kong Holding Limited (“SOIHL HK”), a wholly owned subsidiary of the Group, and Chevron Global Energy Inc. (“CGEI”) on 21 March 2017, SOIHL HK is going to acquire the equity shares of and related interest in Chevron South Africa (Proprietary) Limited and the equity shares of Chevron Botswana (Proprietary) Limited (“the Targets”) held by CGEI, in a total consideration approximate to USD 900 million (“the Transaction”). The consideration is subject to adjustment according to the circumstances of the Targets, such as the changes in working capital, at the completion. The Transaction has been approved by the Board of Directors of the Company, and is still subject to the satisfaction of the certain conditions to completion. The Targets’ principle activities are to manufacture and market refined oil products in South Africa and market refined oil products in Botswana.According to the purchase and sale agreement signed between SOIHL Hong Kong Holding Limited (“SOIHL HK”), a wholly owned subsidiary of the Group, and Chevron Global Energy Inc. (“CGEI”) on 21 March 2017, SOIHL HK is going to acquire the equity shares of and related interest in Chevron South Africa (Pty) Limited and the equity shares of Chevron Botswana (Pty) Limited (“the Targets”) held by CGEI, in a total consideration approximate to USD 900 million, which is subject to adjustment according to the circumstances of the Targets at the completion day (“the Transaction”). The Transaction has been approved by the Board of Directors of the Company, and is still subject to the governments’ approval where the Targets operates. The Targets’ principle activities are to manufacture and market refined oil products in South Africa and market refined oil products in Botswana.

143CHINA PETROLEUM & CHEMICAL CORPORATION Annual Report 2016
Fina
ncia
l S
tate
men
ts (
Inte
rnat
iona
l)
REPORT OF THE INTERNATIONAL AUDITOR
Independent Auditor’s ReportTo the shareholders of China Petroleum & Chemical Corporation(incorporated in People’s Republic of China with limited liability)
OPINION
What we have audited
The consolidated financial statements of China Petroleum & Chemical Corporation (the “Company”) and its subsidiaries (the “Group”) set out on pages 147 to 201, which comprise:
• the consolidated balance sheet as at 31 December 2016;
• the consolidated income statement for the year then ended;
• the consolidated statement of comprehensive income for the year then ended;
• the consolidated statement of changes in equity for the year then ended;
• the consolidated statement of cash flows for the year then ended; and
• the notes to the consolidated financial statements, which include a summary of significant accounting policies.
Our opinion
In our opinion, the consolidated financial statements give a true and fair view of the consolidated financial position of the Group as at 31 December 2016, and of its consolidated financial performance and its consolidated cash flows for the year then ended in accordance with International Financial Reporting Standards (“IFRSs”) as issued by the International Accounting Standard Board and have been properly prepared in compliance with the disclosure requirements of the Hong Kong Companies Ordinance.
BASIS FOR OPINION
We conducted our audit in accordance with Hong Kong Standards on Auditing (“HKSAs”) issued by the Hong Kong Instituted of Certified Public Accountants (“HKICPA”). Our responsibilities under those standards are further described in the Auditor’s Responsibilities for the Audit of the Consolidated Financial Statements section of our report.
We believe that the audit evidence we have obtained is sufficient and appropriate to provide a basis for our opinion.
Independence
We are independent of the Group in accordance with the HKICPA’s Code of Ethics for Professional Accountants (“the Code”), and we have fulfilled our other ethical responsibilities in accordance with the Code.
KEY AUDIT MATTERS
Key audit matters are those matters that, in our professional judgment, were of most significance in our audit of the consolidated financial statements of the current period. These matters were addressed in the context of our audit of the consolidated financial statements as a whole, and in forming our opinion thereon, and we do not provide a separate opinion on these matters.
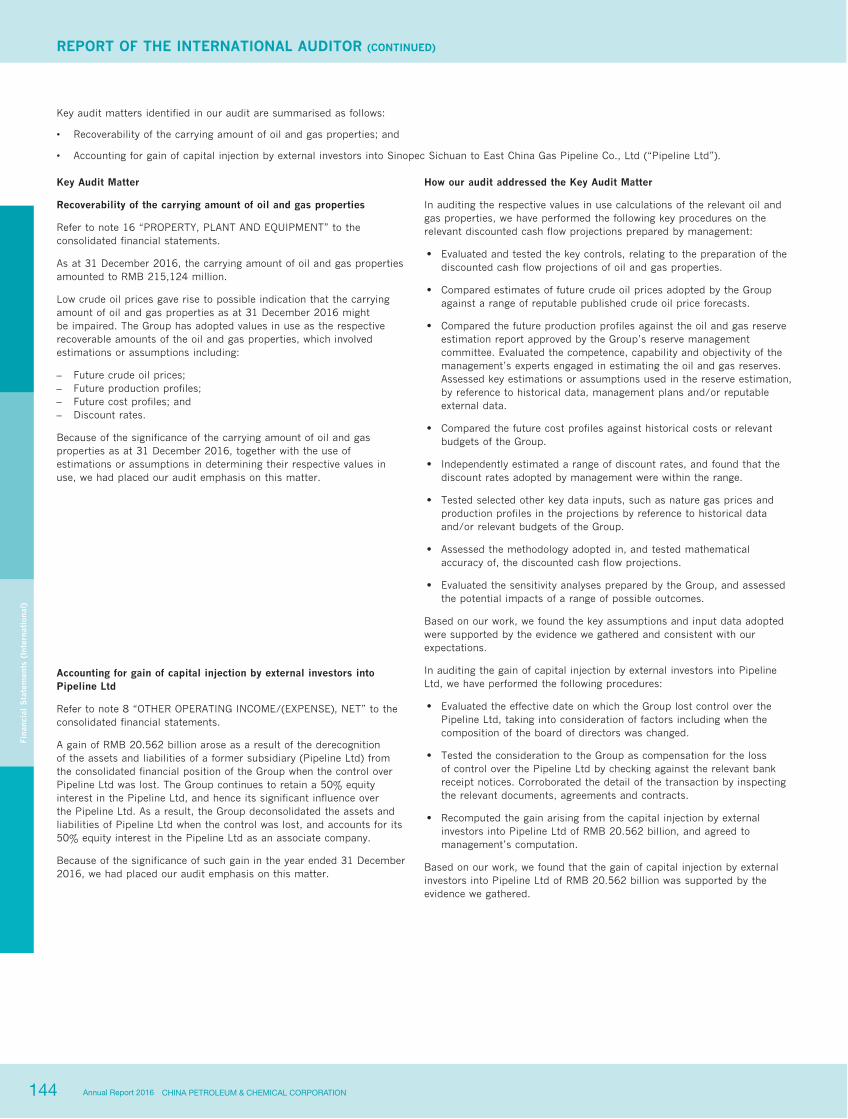
144 CHINA PETROLEUM & CHEMICAL CORPORATIONAnnual Report 2016
Fina
ncia
l S
tate
men
ts (
Inte
rnat
iona
l)
REPORT OF THE INTERNATIONAL AUDITOR (CONTINUED)
Key audit matters identified in our audit are summarised as follows:
• Recoverability of the carrying amount of oil and gas properties; and
• Accounting for gain of capital injection by external investors into Sinopec Sichuan to East China Gas Pipeline Co., Ltd (“Pipeline Ltd”).
Key Audit Matter How our audit addressed the Key Audit Matter
Recoverability of the carrying amount of oil and gas properties
Refer to note 16 “PROPERTY, PLANT AND EQUIPMENT” to the consolidated financial statements.
As at 31 December 2016, the carrying amount of oil and gas properties amounted to RMB 215,124 million.
Low crude oil prices gave rise to possible indication that the carrying amount of oil and gas properties as at 31 December 2016 might be impaired. The Group has adopted values in use as the respective recoverable amounts of the oil and gas properties, which involved estimations or assumptions including:
– Future crude oil prices;– Future production profiles;– Future cost profiles; and– Discount rates.
Because of the significance of the carrying amount of oil and gas properties as at 31 December 2016, together with the use of estimations or assumptions in determining their respective values in use, we had placed our audit emphasis on this matter.
In auditing the respective values in use calculations of the relevant oil and gas properties, we have performed the following key procedures on the relevant discounted cash flow projections prepared by management:
‧ Evaluated and tested the key controls, relating to the preparation of the discounted cash flow projections of oil and gas properties.
‧ Compared estimates of future crude oil prices adopted by the Group against a range of reputable published crude oil price forecasts.
‧ Compared the future production profiles against the oil and gas reserve estimation report approved by the Group’s reserve management committee. Evaluated the competence, capability and objectivity of the management’s experts engaged in estimating the oil and gas reserves. Assessed key estimations or assumptions used in the reserve estimation, by reference to historical data, management plans and/or reputable external data.
‧ Compared the future cost profiles against historical costs or relevant budgets of the Group.
‧ Independently estimated a range of discount rates, and found that the discount rates adopted by management were within the range.
Accounting for gain of capital injection by external investors into Pipeline Ltd
Refer to note 8 “OTHER OPERATING INCOME/(EXPENSE), NET” to the consolidated financial statements.
A gain of RMB 20.562 billion arose as a result of the derecognition of the assets and liabilities of a former subsidiary (Pipeline Ltd) from the consolidated financial position of the Group when the control over Pipeline Ltd was lost. The Group continues to retain a 50% equity interest in the Pipeline Ltd, and hence its significant influence over the Pipeline Ltd. As a result, the Group deconsolidated the assets and liabilities of Pipeline Ltd when the control was lost, and accounts for its 50% equity interest in the Pipeline Ltd as an associate company.
Because of the significance of such gain in the year ended 31 December 2016, we had placed our audit emphasis on this matter.
‧ Tested selected other key data inputs, such as nature gas prices and production profiles in the projections by reference to historical data and/or relevant budgets of the Group.
‧ Assessed the methodology adopted in, and tested mathematical accuracy of, the discounted cash flow projections.
‧ Evaluated the sensitivity analyses prepared by the Group, and assessed the potential impacts of a range of possible outcomes.
Based on our work, we found the key assumptions and input data adopted were supported by the evidence we gathered and consistent with our expectations.
In auditing the gain of capital injection by external investors into Pipeline Ltd, we have performed the following procedures:
‧ Evaluated the effective date on which the Group lost control over the Pipeline Ltd, taking into consideration of factors including when the composition of the board of directors was changed.
‧ Tested the consideration to the Group as compensation for the loss of control over the Pipeline Ltd by checking against the relevant bank receipt notices. Corroborated the detail of the transaction by inspecting the relevant documents, agreements and contracts.
‧ Recomputed the gain arising from the capital injection by external investors into Pipeline Ltd of RMB 20.562 billion, and agreed to management’s computation.
Based on our work, we found that the gain of capital injection by external investors into Pipeline Ltd of RMB 20.562 billion was supported by the evidence we gathered.
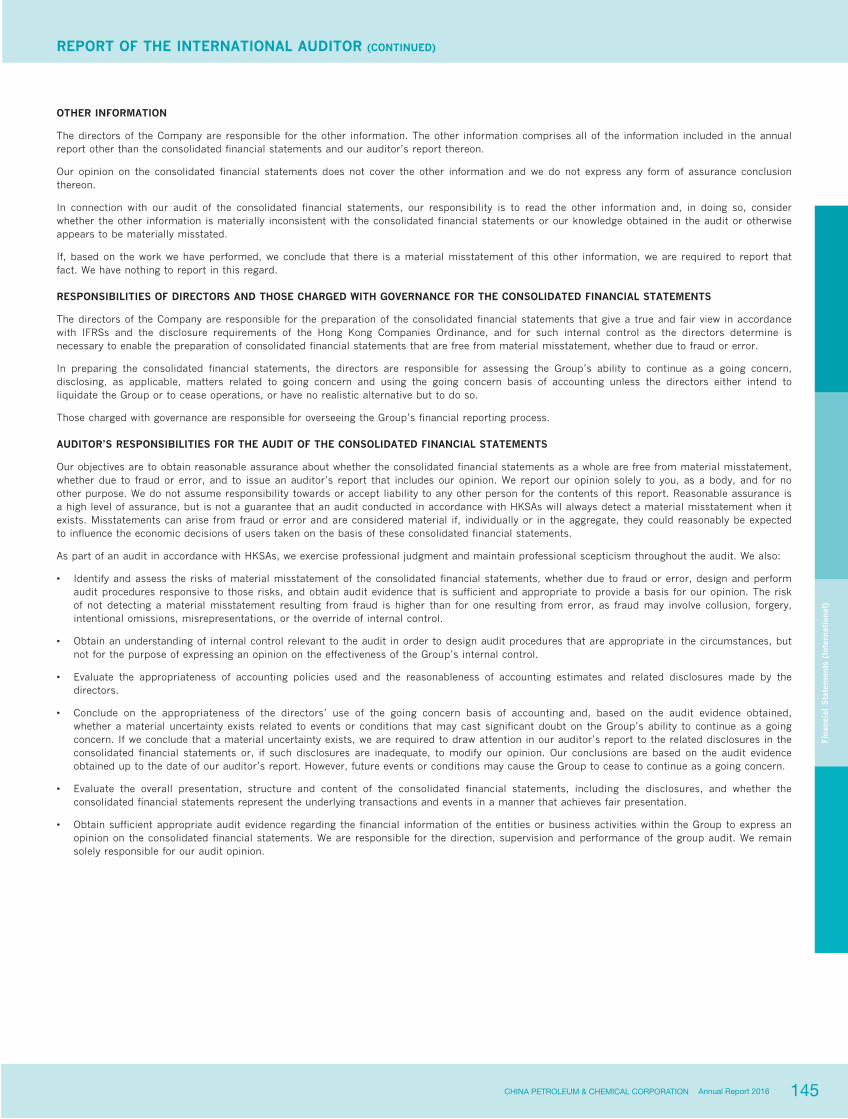
145CHINA PETROLEUM & CHEMICAL CORPORATION Annual Report 2016
Fina
ncia
l S
tate
men
ts (
Inte
rnat
iona
l)
REPORT OF THE INTERNATIONAL AUDITOR (CONTINUED)
OTHER INFORMATION
The directors of the Company are responsible for the other information. The other information comprises all of the information included in the annual report other than the consolidated financial statements and our auditor’s report thereon.
Our opinion on the consolidated financial statements does not cover the other information and we do not express any form of assurance conclusion thereon.
In connection with our audit of the consolidated financial statements, our responsibility is to read the other information and, in doing so, consider whether the other information is materially inconsistent with the consolidated financial statements or our knowledge obtained in the audit or otherwise appears to be materially misstated.
If, based on the work we have performed, we conclude that there is a material misstatement of this other information, we are required to report that fact. We have nothing to report in this regard.
RESPONSIBILITIES OF DIRECTORS AND THOSE CHARGED WITH GOVERNANCE FOR THE CONSOLIDATED FINANCIAL STATEMENTS
The directors of the Company are responsible for the preparation of the consolidated financial statements that give a true and fair view in accordance with IFRSs and the disclosure requirements of the Hong Kong Companies Ordinance, and for such internal control as the directors determine is necessary to enable the preparation of consolidated financial statements that are free from material misstatement, whether due to fraud or error.
In preparing the consolidated financial statements, the directors are responsible for assessing the Group’s ability to continue as a going concern, disclosing, as applicable, matters related to going concern and using the going concern basis of accounting unless the directors either intend to liquidate the Group or to cease operations, or have no realistic alternative but to do so.
Those charged with governance are responsible for overseeing the Group’s financial reporting process.
AUDITOR’S RESPONSIBILITIES FOR THE AUDIT OF THE CONSOLIDATED FINANCIAL STATEMENTS
Our objectives are to obtain reasonable assurance about whether the consolidated financial statements as a whole are free from material misstatement, whether due to fraud or error, and to issue an auditor’s report that includes our opinion. We report our opinion solely to you, as a body, and for no other purpose. We do not assume responsibility towards or accept liability to any other person for the contents of this report. Reasonable assurance is a high level of assurance, but is not a guarantee that an audit conducted in accordance with HKSAs will always detect a material misstatement when it exists. Misstatements can arise from fraud or error and are considered material if, individually or in the aggregate, they could reasonably be expected to influence the economic decisions of users taken on the basis of these consolidated financial statements.
As part of an audit in accordance with HKSAs, we exercise professional judgment and maintain professional scepticism throughout the audit. We also:
• Identify and assess the risks of material misstatement of the consolidated financial statements, whether due to fraud or error, design and perform audit procedures responsive to those risks, and obtain audit evidence that is sufficient and appropriate to provide a basis for our opinion. The risk of not detecting a material misstatement resulting from fraud is higher than for one resulting from error, as fraud may involve collusion, forgery, intentional omissions, misrepresentations, or the override of internal control.
• Obtain an understanding of internal control relevant to the audit in order to design audit procedures that are appropriate in the circumstances, but not for the purpose of expressing an opinion on the effectiveness of the Group’s internal control.
• Evaluate the appropriateness of accounting policies used and the reasonableness of accounting estimates and related disclosures made by the directors.
• Conclude on the appropriateness of the directors’ use of the going concern basis of accounting and, based on the audit evidence obtained, whether a material uncertainty exists related to events or conditions that may cast significant doubt on the Group’s ability to continue as a going concern. If we conclude that a material uncertainty exists, we are required to draw attention in our auditor’s report to the related disclosures in the consolidated financial statements or, if such disclosures are inadequate, to modify our opinion. Our conclusions are based on the audit evidence obtained up to the date of our auditor’s report. However, future events or conditions may cause the Group to cease to continue as a going concern.
• Evaluate the overall presentation, structure and content of the consolidated financial statements, including the disclosures, and whether the consolidated financial statements represent the underlying transactions and events in a manner that achieves fair presentation.
• Obtain sufficient appropriate audit evidence regarding the financial information of the entities or business activities within the Group to express an opinion on the consolidated financial statements. We are responsible for the direction, supervision and performance of the group audit. We remain solely responsible for our audit opinion.
146 CHINA PETROLEUM & CHEMICAL CORPORATIONAnnual Report 2016
Fina
ncia
l S
tate
men
ts (
Inte
rnat
iona
l)
REPORT OF THE INTERNATIONAL AUDITOR (CONTINUED)
We communicate with those charged with governance regarding, among other matters, the planned scope and timing of the audit and significant audit findings, including any significant deficiencies in internal control that we identify during our audit.
We also provide those charged with governance with a statement that we have complied with relevant ethical requirements regarding independence, and to communicate with them all relationships and other matters that may reasonably be thought to bear on our independence, and where applicable, related safeguards.
From the matters communicated with those charged with governance, we determine those matters that were of most significance in the audit of the consolidated financial statements of the current period and are therefore the key audit matters. We describe these matters in our auditor’s report unless law or regulation precludes public disclosure about the matter or when, in extremely rare circumstances, we determine that a matter should not be communicated in our report because the adverse consequences of doing so would reasonably be expected to outweigh the public interest benefits of such communication.
The engagement partner on the audit resulting in this independent auditor’s report is HON CHONG HENG.
PricewaterhouseCoopersCertified Public Accountants
Hong Kong, 24 March 2017

147CHINA PETROLEUM & CHEMICAL CORPORATION Annual Report 2016
Fina
ncia
l S
tate
men
ts (
Inte
rnat
iona
l)
(B) FINANCIAL STATEMENTS PREPARED UNDER INTERNATIONAL FINANCIAL REPORTING STANDARDS (“IFRS”) CONSOLIDATED INCOME STATEMENT for the year ended 31 December 2016 (Amounts in million, except per share data)
Note Year ended 31 December2016 2015RMB RMB
Turnover and other operating revenues Turnover 3 1,880,190 1,977,877Other operating revenues 4 50,721 42,498
1,930,911 2,020,375Operating expenses
Purchased crude oil, products and operating supplies and expenses (1,379,691) (1,494,046)Selling, general and administrative expenses 5 (64,360) (69,491)Depreciation, depletion and amortisation (108,425) (96,460)Exploration expenses, including dry holes (11,035) (10,459)Personnel expenses 6 (63,887) (56,619)Taxes other than income tax 7 (232,006) (236,349)Other operating income/(expense), net 8 5,686 (129)
Total operating expenses (1,853,718) (1,963,553)Operating profit 77,193 56,822Finance costs
Interest expense 9 (9,219) (8,133)Interest income 3,218 3,010Loss on embedded derivative component of the convertible bonds — (259)Foreign currency exchange losses, net (610) (3,857)
Net finance costs (6,611) (9,239)Investment income 263 466Share of profits less losses from associates and joint ventures 19, 20 9,306 8,362Profit before taxation 80,151 56,411Tax expense 10 (20,707) (12,613)Profit for the year 59,444 43,798Attributable to:
Owners of the Company 46,672 32,512Non-controlling interests 12,772 11,286
Profit for the year 59,444 43,798Earnings per share: 15
Basic 0.385 0.269Diluted 0.385 0.269
The notes on pages 154 to 201 form part of these consolidated financial statements. Details of dividends payable to owners of the Company attributable to the profit for the year are set out in Note 13
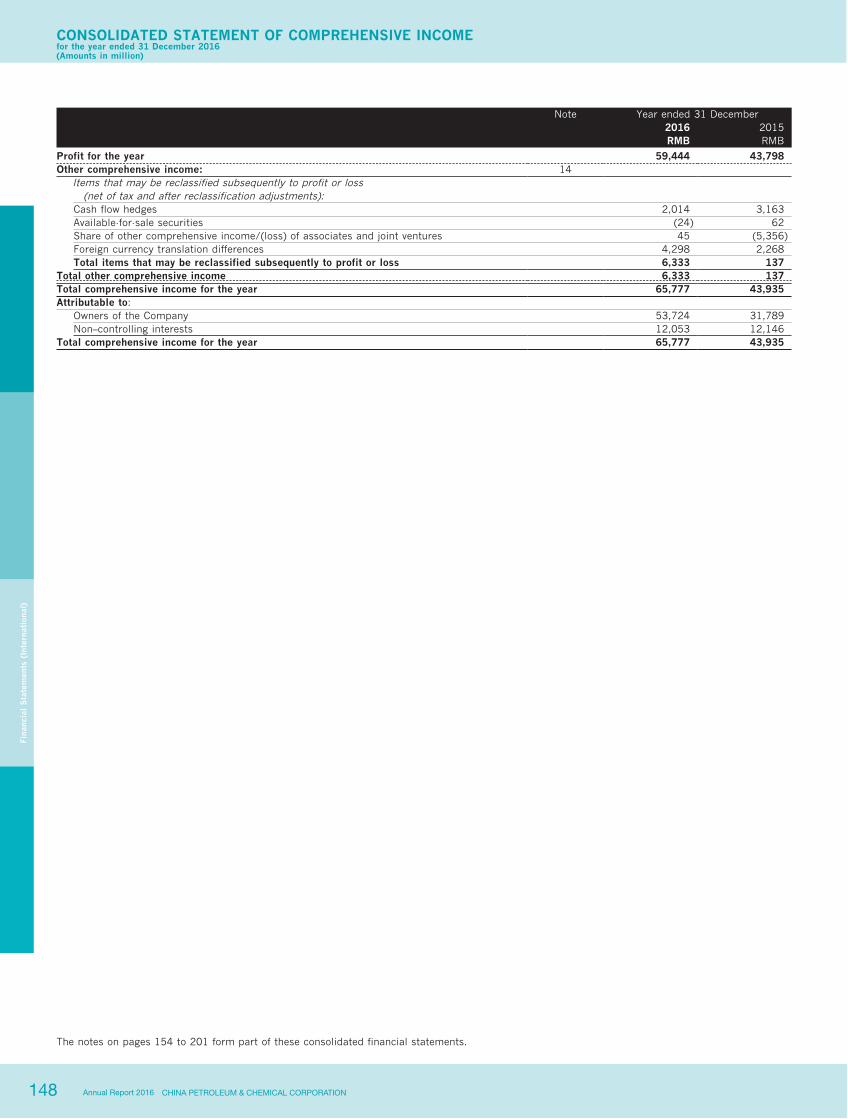
148 CHINA PETROLEUM & CHEMICAL CORPORATIONAnnual Report 2016
CONSOLIDATED STATEMENT OF COMPREHENSIVE INCOMEfor the year ended 31 December 2016(Amounts in million)
Fina
ncia
l S
tate
men
ts (
Inte
rnat
iona
l)
Note Year ended 31 December2016 2015RMB RMB
Profit for the year 59,444 43,798Other comprehensive income: 14
Items that may be reclassified subsequently to profit or loss (net of tax and after reclassification adjustments): Cash flow hedges 2,014 3,163Available-for-sale securities (24) 62Share of other comprehensive income/(loss) of associates and joint ventures 45 (5,356)Foreign currency translation differences 4,298 2,268Total items that may be reclassified subsequently to profit or loss 6,333 137
Total other comprehensive income 6,333 137Total comprehensive income for the year 65,777 43,935Attributable to:
Owners of the Company 53,724 31,789Non–controlling interests 12,053 12,146
Total comprehensive income for the year 65,777 43,935
The notes on pages 154 to 201 form part of these consolidated financial statements.
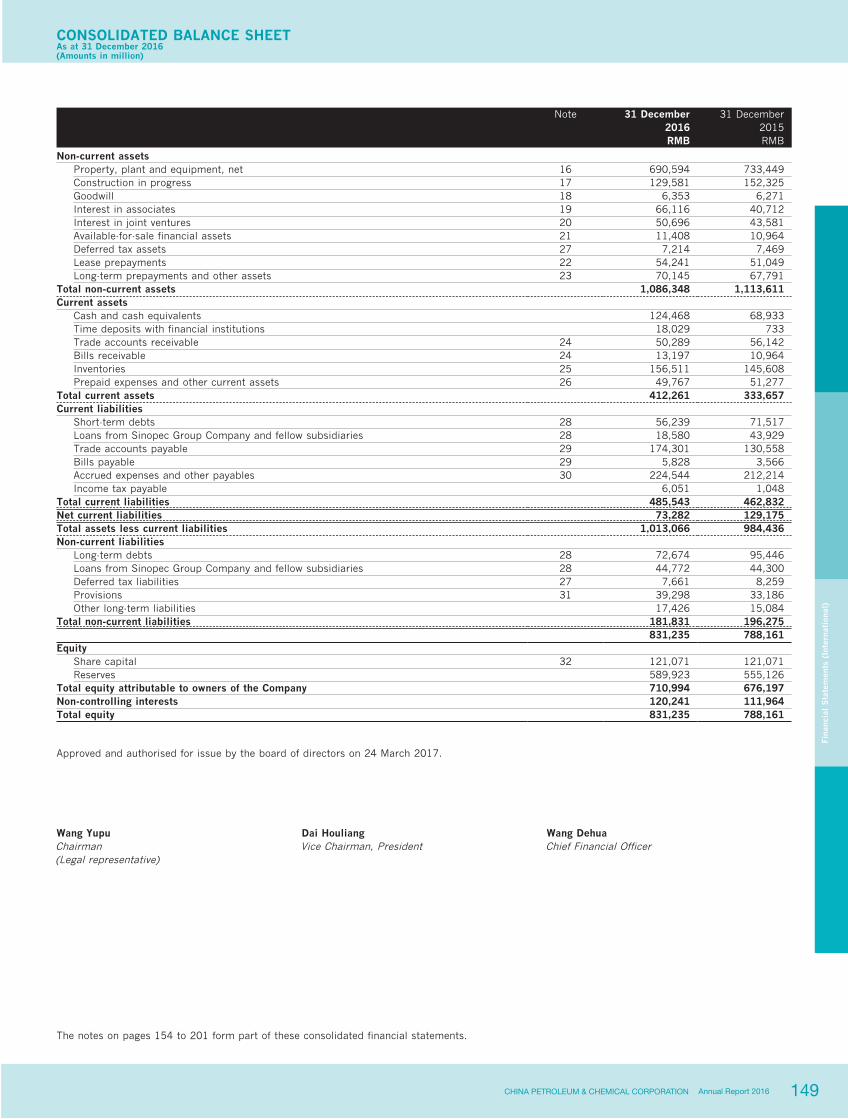
149CHINA PETROLEUM & CHEMICAL CORPORATION Annual Report 2016
CONSOLIDATED BALANCE SHEETAs at 31 December 2016(Amounts in million)
Fina
ncia
l S
tate
men
ts (
Inte
rnat
iona
l)
Note 31 December 31 December2016 2015RMB RMB
Non-current assets Property, plant and equipment, net 16 690,594 733,449Construction in progress 17 129,581 152,325Goodwill 18 6,353 6,271Interest in associates 19 66,116 40,712Interest in joint ventures 20 50,696 43,581Available-for-sale financial assets 21 11,408 10,964Deferred tax assets 27 7,214 7,469Lease prepayments 22 54,241 51,049Long-term prepayments and other assets 23 70,145 67,791
Total non-current assets 1,086,348 1,113,611Current assets
Cash and cash equivalents 124,468 68,933Time deposits with financial institutions 18,029 733Trade accounts receivable 24 50,289 56,142Bills receivable 24 13,197 10,964Inventories 25 156,511 145,608Prepaid expenses and other current assets 26 49,767 51,277
Total current assets 412,261 333,657Current liabilities
Short-term debts 28 56,239 71,517Loans from Sinopec Group Company and fellow subsidiaries 28 18,580 43,929Trade accounts payable 29 174,301 130,558Bills payable 29 5,828 3,566Accrued expenses and other payables 30 224,544 212,214Income tax payable 6,051 1,048
Total current liabilities 485,543 462,832Net current liabilities 73,282 129,175Total assets less current liabilities 1,013,066 984,436Non-current liabilities
Long-term debts 28 72,674 95,446Loans from Sinopec Group Company and fellow subsidiaries 28 44,772 44,300Deferred tax liabilities 27 7,661 8,259Provisions 31 39,298 33,186Other long-term liabilities 17,426 15,084
Total non-current liabilities 181,831 196,275 831,235 788,161Equity
Share capital 32 121,071 121,071Reserves 589,923 555,126
Total equity attributable to owners of the Company 710,994 676,197Non-controlling interests 120,241 111,964Total equity 831,235 788,161
Approved and authorised for issue by the board of directors on 24 March 2017.
Wang Yupu Dai Houliang Wang DehuaChairman Vice Chairman, President Chief Financial Officer(Legal representative)
The notes on pages 154 to 201 form part of these consolidated financial statements.

150 CHINA PETROLEUM & CHEMICAL CORPORATIONAnnual Report 2016
CONSOLIDATED STATEMENT OF CHANGES IN EQUITYfor the year ended 31 December 2016(Amounts in million)
Fina
ncia
l S
tate
men
ts (
Inte
rnat
iona
l)
Sharecapital
Capitalreserve
Sharepremium
Statutorysurplusreserve
Discretionarysurplusreserve
Otherreserves
Retainedearnings
Total equityattributable
to ownersof the
Company
Non–controlling
interestsTotal
equityRMB RMB RMB RMB RMB RMB RMB RMB RMB RMB
Balance at 31 December 2014 118,280 (30,497) 41,824 76,552 117,000 (6,179) 276,061 593,041 52,536 645,577Contribution from SAMC in the Acquisition of Gaoqiao Branch of SAMC (Note 1) — 2,214 — — — — — 2,214 1,811 4,025Balance at 1 January 2015 118,280 (28,283) 41,824 76,552 117,000 (6,179) 276,061 595,255 54,347 649,602Profit for the year — — — — — — 32,512 32,512 11,286 43,798Other comprehensive income (Note 14) — — — — — (1,169) — (1,169) 1,306 137Total comprehensive income for the year — — — — — (1,169) 32,512 31,343 12,592 43,935Transactions with owners, recorded directly in equity:
Contributions by and distributions to owners: Conversion of the 2011 Convertible Bonds 2,791 — 14,026 — — — — 16,817 — 16,817Final dividend for 2014 (Note 13) — — — — — — (13,318) (13,318) — (13,318)Interim dividend for 2015 (Note 13) — — — — — — (10,896) (10,896) — (10,896)Appropriation (Note (a)) — — — 3,088 — — (3,088) — — —Contributions to subsidiaries from non–controlling interests — 56,224 — — — 446 — 56,670 48,807 105,477Distributions to non–controlling interests — — — — — — — — (3,389) (3,389)Profit distribution to SAMC (Note 1) — — — — — — (74) (74) (60) (134)
Total contributions by and distributions to owners 2,791 56,224 14,026 3,088 — 446 (27,376) 49,199 45,358 94,557Changes in ownership interests in subsidiaries that do not result in a loss of control: Transaction with non–controlling interests — 326 — — — — — 326 (326) —Total changes in ownership interests in subsidiaries that do not result in a loss of control — 326 — — — — — 326 (326) —
Total transactions with owners 2,791 56,550 14,026 3,088 — 446 (27,376) 49,525 45,032 94,557Others — 74 — — — 121 (121) 74 (7) 67Balance at 31 December 2015 121,071 28,341 55,850 79,640 117,000 (6,781) 281,076 676,197 111,964 788,161
The notes on pages 154 to 201 form part of these consolidated financial statements.

151CHINA PETROLEUM & CHEMICAL CORPORATION Annual Report 2016
CONSOLIDATED STATEMENT OF CHANGES IN EQUITY (CONTINUED)for the year ended 31 December 2016(Amounts in million)
Fina
ncia
l S
tate
men
ts (
Inte
rnat
iona
l)
Sharecapital
Capitalreserve
Sharepremium
Statutorysurplusreserve
Discretionarysurplusreserve
Otherreserves
Retainedearnings
Total equityattributable
to ownersof the
Company
Non–controlling
interestsTotal
equityRMB RMB RMB RMB RMB RMB RMB RMB RMB RMB
Balance at 1 January 2016 121,071 28,341 55,850 79,640 117,000 (6,781) 281,076 676,197 111,964 788,161Profit for the year — — — — — — 46,672 46,672 12,772 59,444Other comprehensive income (Note 14) — — — — — 7,052 — 7,052 (719) 6,333Total comprehensive income for the year — — — — — 7,052 46,672 53,724 12,053 65,777Transactions with owners, recorded directly in equity:
Contributions by and distributions to owners: Final dividend for 2015 (Note 13) — — — — — — (7,264) (7,264) — (7,264)Interim dividend for 2016 (Note 13) — — — — — — (9,565) (9,565) — (9,565)Appropriation (Note (a)) — — — — — — — — — —Distributions to non–controlling interests — — — — — — — — (6,146) (6,146)Profit distribution to SAMC (Note 1) — — — — — — (47) (47) (39) (86)Distribution to SAMC in the Acquisition of Gaoqiao Branch of SAMC (Note 1) — (2,137) — — — — — (2,137) 2,137 —
Total contributions by and distributions to owners — (2,137) — — — — (16,876) (19,013) (4,048) (23,061)Changes in ownership interests in subsidiaries that do not result in a loss of control: Transaction with non–controlling interests — (30) — — — — — (30) 263 233Total changes in ownership interests in subsidiaries that do not result in a loss of control — (30) — — — — — (30) 263 233
Total transactions with owners — (2,167) — — — — (16,876) (19,043) (3,785) (22,828)Others — 116 — — — 153 (153) 116 9 125Balance at 31 December 2016 121,071 26,290 55,850 79,640 117,000 424 310,719 710,994 120,241 831,235
Note:
(a) According to the PRC Company Law and the Articles of Association of the Company, the Company is required to transfer 10% of its net profit determined in accordance with the accounting policies complying with Accounting Standards for Business Enterprises (“ASBE”), adopted by the Group to statutory surplus reserve. In the event that the reserve balance reaches 50% of the registered capital, no transfer is required. The transfer to this reserve must be made before distribution of a dividend to shareholders. Statutory surplus reserve can be used to make good previous years’ losses, if any, and may be converted into share capital by issuing of new shares to shareholders in proportion to their existing shareholdings or by increasing the par value of the shares currently held by them, provided that the balance after such issue is not less than 25% of the registered capital.
Pursuant to the Articles of Association of the Company and the resolution passed at the Directors’ meeting on 24 March 2017, the directors proposed to transfer RMB 2,359 million to the statutory surplus reserve, being 10% of the current year’s net profit determined in accordance with the accounting policies complying with ASBE to this reserve.
(b) The usage of the discretionary surplus reserve is similar to that of statutory surplus reserve.
(c) As at 31 December 2016, the amount of retained earnings available for distribution was RMB 182,440 million (2015: RMB 175,679 million), being the amount determined in accordance with ASBE. According to the Articles of Association of the Company, the amount of retained earnings available for distribution to owners of the Company is lower of the amount determined in accordance with the accounting policies complying with ASBE and the amount determined in accordance with the accounting policies complying with International Financial Reporting Standards (“IFRS”).
(d) The capital reserve represents (i) the difference between the total amount of the par value of shares issued and the amount of the net assets transferred from Sinopec Group Company in connection with the Reorganisation; and (ii) the difference between the considerations paid over or received the amount of the net assets of entities and related operations acquired from or sold to Sinopec Group Company and non–controlling interests.
(e) The application of the share premium account is governed by Sections 167 and 168 of the PRC Company Law.
The notes on pages 154 to 201 form part of these consolidated financial statements.
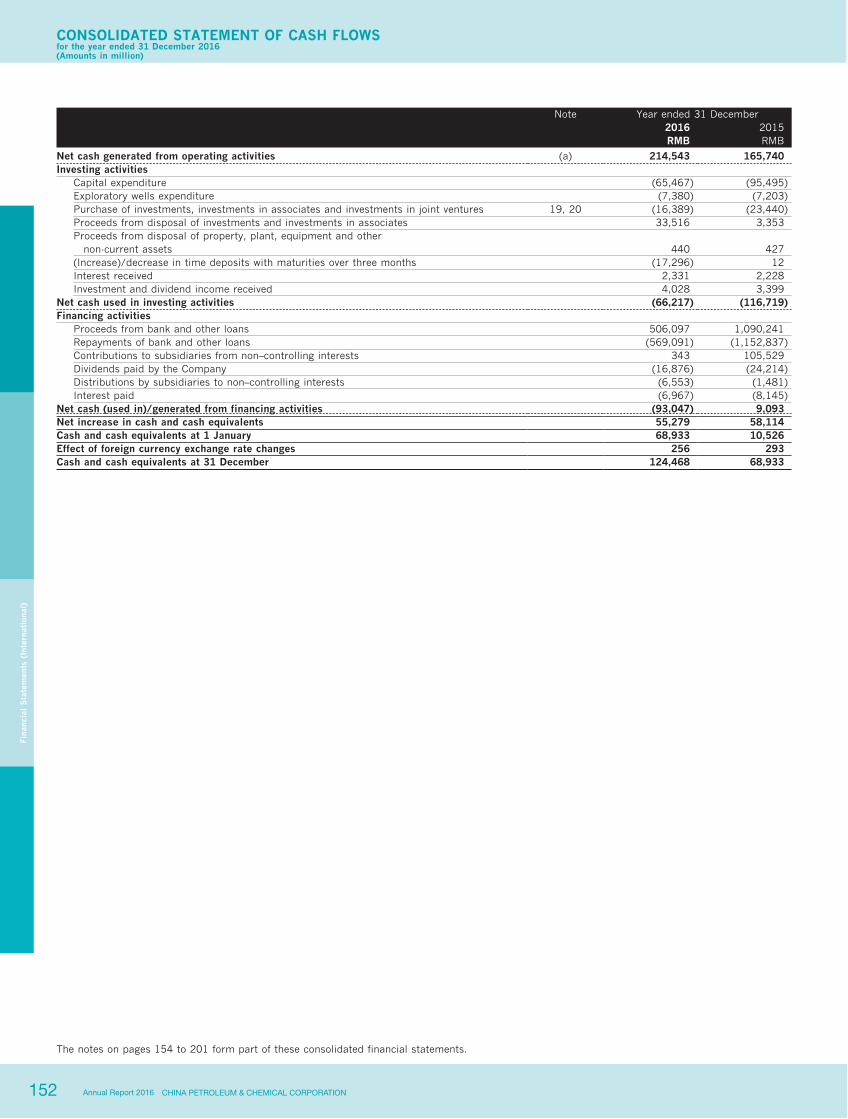
152 CHINA PETROLEUM & CHEMICAL CORPORATIONAnnual Report 2016
CONSOLIDATED STATEMENT OF CASH FLOWSfor the year ended 31 December 2016(Amounts in million)
Fina
ncia
l S
tate
men
ts (
Inte
rnat
iona
l)
Note Year ended 31 December2016 2015RMB RMB
Net cash generated from operating activities (a) 214,543 165,740Investing activities
Capital expenditure (65,467) (95,495)Exploratory wells expenditure (7,380) (7,203)Purchase of investments, investments in associates and investments in joint ventures 19, 20 (16,389) (23,440)Proceeds from disposal of investments and investments in associates 33,516 3,353Proceeds from disposal of property, plant, equipment and other non-current assets 440 427(Increase)/decrease in time deposits with maturities over three months (17,296) 12Interest received 2,331 2,228Investment and dividend income received 4,028 3,399
Net cash used in investing activities (66,217) (116,719)Financing activities
Proceeds from bank and other loans 506,097 1,090,241Repayments of bank and other loans (569,091) (1,152,837)Contributions to subsidiaries from non–controlling interests 343 105,529Dividends paid by the Company (16,876) (24,214)Distributions by subsidiaries to non–controlling interests (6,553) (1,481)Interest paid (6,967) (8,145)
Net cash (used in)/generated from financing activities (93,047) 9,093Net increase in cash and cash equivalents 55,279 58,114Cash and cash equivalents at 1 January 68,933 10,526Effect of foreign currency exchange rate changes 256 293Cash and cash equivalents at 31 December 124,468 68,933
The notes on pages 154 to 201 form part of these consolidated financial statements.
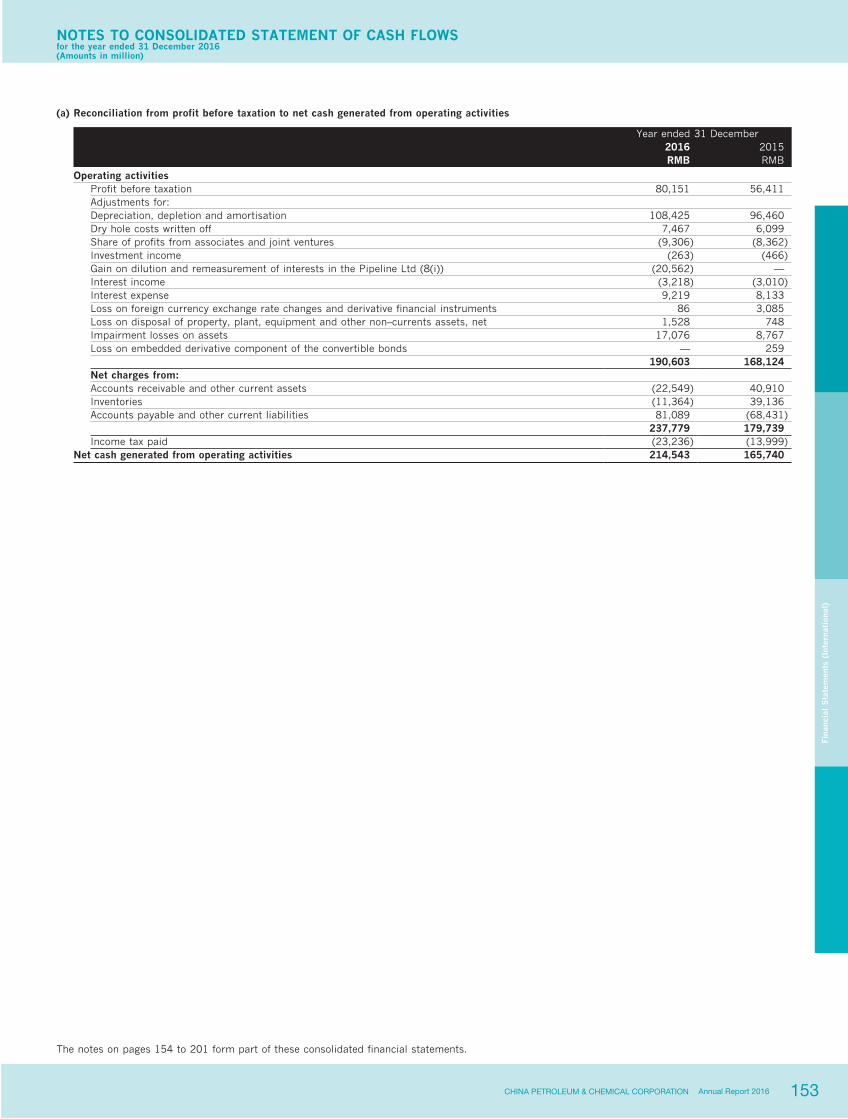
153CHINA PETROLEUM & CHEMICAL CORPORATION Annual Report 2016
NOTES TO CONSOLIDATED STATEMENT OF CASH FLOWSfor the year ended 31 December 2016(Amounts in million)
Fina
ncia
l S
tate
men
ts (
Inte
rnat
iona
l)
(a) Reconciliation from profit before taxation to net cash generated from operating activities
Year ended 31 December2016 2015RMB RMB
Operating activities Profit before taxation 80,151 56,411Adjustments for: Depreciation, depletion and amortisation 108,425 96,460Dry hole costs written off 7,467 6,099Share of profits from associates and joint ventures (9,306) (8,362)Investment income (263) (466)Gain on dilution and remeasurement of interests in the Pipeline Ltd (8(i)) (20,562) —Interest income (3,218) (3,010)Interest expense 9,219 8,133Loss on foreign currency exchange rate changes and derivative financial instruments 86 3,085Loss on disposal of property, plant, equipment and other non–currents assets, net 1,528 748Impairment losses on assets 17,076 8,767Loss on embedded derivative component of the convertible bonds — 259 190,603 168,124Net charges from: Accounts receivable and other current assets (22,549) 40,910Inventories (11,364) 39,136Accounts payable and other current liabilities 81,089 (68,431) 237,779 179,739Income tax paid (23,236) (13,999)
Net cash generated from operating activities 214,543 165,740
The notes on pages 154 to 201 form part of these consolidated financial statements.

154 CHINA PETROLEUM & CHEMICAL CORPORATIONAnnual Report 2016
NOTES TO THE CONSOLIDATED FINANCIAL STATEMENTSfor the year ended 31 December 2016
Fina
ncia
l S
tate
men
ts (
Inte
rnat
iona
l)
1 PRINCIPAL ACTIVITIES, ORGANISATION AND BASIS OF PREPARATION
Principal activitiesChina Petroleum & Chemical Corporation (the “Company”) is an energy and chemical company that, through its subsidiaries (hereinafter collectively referred to as the “Group”), engages in oil and gas and chemical operations in the People’s Republic of China (the “PRC”). Oil and gas operations consist of exploring for, developing and producing crude oil and natural gas; transporting crude oil and natural gas by pipelines; refining crude oil into finished petroleum products; and marketing crude oil, natural gas and refined petroleum products. Chemical operations include the manufacture and marketing of a wide range of chemicals for industrial uses.
OrganisationThe Company was established in the PRC on 25 February 2000 as a joint stock limited company as part of the reorganisation (the “Reorganisation”) of China Petrochemical Corporation (“Sinopec Group Company”), the ultimate holding company of the Group and a ministry–level enterprise under the direct supervision of the State Council of the PRC. Prior to the incorporation of the Company, the oil and gas and chemical operations of the Group were carried on by oil administration bureaux, petrochemical and refining production enterprises and sales and marketing companies of Sinopec Group Company.
As part of the Reorganisation, certain of Sinopec Group Company’s core oil and gas and chemical operations and businesses together with the related assets and liabilities were transferred to the Company. On 25 February 2000, in consideration for Sinopec Group Company transferring such oil and gas and chemical operations and businesses and the related assets and liabilities to the Company, the Company issued 68.8 billion domestic state–owned ordinary shares with a par value of RMB 1.00 each to Sinopec Group Company. The shares issued to Sinopec Group Company on 25 February 2000 represented the entire registered and issued share capital of the Company on that date. The oil and gas and chemical operations and businesses transferred to the Company were related to (i) the exploration, development and production of crude oil and natural gas, (ii) the refining, transportation, storage and marketing of crude oil and petroleum products, and (iii) the production and sales of chemicals.
Basis of preparationPursuant to the resolution passed at the Directors’ meeting on 29 October 2015, the Company entered into the JV Agreement with Sinopec Assets Management Corporation (“SAMC”) in relation to the formation of the Gaoqiao Petrochemical Co., Ltd. According to the JV Agreement, the Company and SAMC jointly set up Gaoqiao Petrochemical Co., Ltd. for RMB 100 million in cash in 2016. Subsequently, the Company subscribed capital contribution with the net assets of Gaoqiao Branch of the Company and SAMC subscribed capital contribution with the net assets of Gaoqiao Branch of SAMC. The capital contribution was completed on 1 June 2016, after which the Company held 55% of Gaoqiao Petrochemical Co., Ltd.’s voting rights and became the parent company of Gaoqiao Petrochemical Co., Ltd.
As Sinopec Group Company controls both the Group and SAMC, the non–cash transaction described above between Sinopec and SAMC has been accounted as business combination under the common control and it has been reflected in the accompanying consolidated financial statements as combination of entities under common control in a manner of predecessor value accounting. Accordingly, the assets and liabilities of Gaoqiao Branch of SAMC have been accounted for at historical cost, and the consolidated financial statements of the Group prior to these acquisitions have been restated to include the results of operation and the assets and liabilities of Gaoqiao Branch of SAMC on a combined basis.

155CHINA PETROLEUM & CHEMICAL CORPORATION Annual Report 2016
NOTES TO THE CONSOLIDATED FINANCIAL STATEMENTS (CONTINUED)for the year ended 31 December 2016
Fina
ncia
l S
tate
men
ts (
Inte
rnat
iona
l)
1 PRINCIPAL ACTIVITIES, ORGANISATION AND BASIS OF PREPARATION (Continued)
Basis of preparation (Continued)The financial condition as at 31 December 2015 and the results of operation for the year ended 31 December 2015 previously reported by the Group have been restated to include the results of operations and the assets and liabilities of Gaoqiao Branch of SAMC on a combined basis as set out below:
The Group,as previously
reported
GaoqiaoBranch
of SAMC
Eliminationand
Adjustment*The Group,as restated
RMB million RMB million RMB million RMB million
Summarised consolidated income statement for the year ended 31 December 2015: Turnover and other operating revenues 2,018,883 2,563 (1,071) 2,020,375Profit attributable to owners of the Company 32,438 134 (60) 32,512Profit attributable to non–controlling interests 11,226 — 60 11,286Basic earnings per share (RMB) 0.268 0.001 — 0.269Diluted earnings per share (RMB) 0.268 0.001 — 0.269Summarised consolidated balance sheet as at 31 December 2015: Current assets 332,405 1,287 (35) 333,657Total assets 1,443,129 4,174 (35) 1,447,268Current liabilities 462,642 225 (35) 462,832Total liabilities 658,910 232 (35) 659,107Total equity attributable to owners of the Company 674,029 3,942 (1,774) 676,197Non–controlling interests 110,190 — 1,774 111,964Summarised consolidated statement of cash flows for the year ended 31 December 2015: Net cash generated from/(used in) operating activities 165,818 (79) 1 165,740Net cash (used in)/generated from investing activities (116,952) 201 32 (116,719)Net cash generated from/(used in) financing activities 9,310 (185) (32) 9,093Net increase/(decrease) in cash and cash equivalents 58,176 (63) 1 58,407
* Gaoqiao Branch of SAMC sold its chemical products and steam to the Group. The transactions between the Group and the Gaoqiao Branch of SAMC have been eliminated on combination. All other significant balances and transactions between the Group and Gaoqiao Branch of SAMC have been eliminated on combination.
At the completion date, the non–controlling interests amount to RMB 2,137 million was recognized in relation to SAMC’s 45% interest in Gaoqiao Branch of the Company.
The accompanying consolidated financial statements have been prepared in accordance with all applicable IFRSs as issued by the International Accounting Standards Board (“IASB”). IFRS includes International Accounting Standards (“IAS”) and related interpretations (“IFRIC”). These consolidated financial statements also comply with the applicable disclosure provisions of the Rules Governing the Listing of Securities on the Stock Exchange of Hong Kong Limited. A summary of the significant accounting policies adopted by the Group are set out in Note 2.
(a) New and amended standards and interpretations adopted by the GroupThe following is the Amendment to IAS 27 that has been adopted by the Group. The Group has changed from cost method to equity method to measure investments in joint ventures and associates in the separate financial statements from 1 January 2016 and accordingly made retrospective adjustments.
Amendment to IAS 27, ‘Method to measure investments in subsidiaries, joint ventures and associates’, allows entities to use equity method to measure investments in subsidiaries, joint ventures and associates in their separate financial statements. Previousely, IAS 27 allows entities to measure their investments in subsidiaries, joint ventures and associates either at cost or as a financial asset in their separate financial statements. The amendments introduce the equity method as a third option. The election can be made independently for each category of investment (subsidiaries, joint ventures and associates). Entities wishing to change to the equity method must do so retrospectively. The amendment is effective for annual period beginning on or after 1 January 2016.

156 CHINA PETROLEUM & CHEMICAL CORPORATIONAnnual Report 2016
NOTES TO THE CONSOLIDATED FINANCIAL STATEMENTS (CONTINUED)for the year ended 31 December 2016
Fina
ncia
l S
tate
men
ts (
Inte
rnat
iona
l)
1 PRINCIPAL ACTIVITIES, ORGANISATION AND BASIS OF PREPARATION (Continued)
Basis of preparation (Continued)(b) New and amended standards and interpretations not yet adopted by the Group
The following relevant IFRSs, amendments to existing IFRSs and interpretation of IFRS have been published and are mandatory for accounting periods beginning on or after 1 January 2017 or later periods and have not been early adopted by the Group. Management is in the process of making an assessment of what the impact of these amendments, new standards and new interpretations is expected to be in the period of initial application and has so far concluded that, except for IFRS 16, the adoption of these amendments, new standards and new interpretations is unlikely to have a significant impact on the Group’s results of operations and financial position.
IFRS 9, ‘Financial instruments’, addresses the classification, measurement and recognition of financial assets and financial liabilities. The complete version of IFRS 9 was issued in July 2014. It replaces the whole of IAS 39. IFRS 9 introduces a new model for the recognition of impairment losses – the expected credit losses (ECL) model, which constitutes a change from the incurred loss model in IAS 39. IFRS 9 applies to all hedging relationships, with the exception of portfolio fair value hedges of interest rate risk. The new guidance better aligns hedge accounting with the risk management activities of an entity and provides relief from the more “rule–based” approach of IAS 39. IFRS 9 is effective for annual periods beginning on or after 1 January 2018. Earlier application is permitted.
Amendments to IFRS 10 and IAS 28 on sale or contribution of assets between an investor and its associate or joint venture. The amendments address an inconsistency between IFRS 10 and IAS 28 in the sale and contribution of assets between an investor and its associate or joint venture. A full gain or loss is recognised when a transaction involves a business. A partial gain or loss is recognised when a transaction involves assets that do not constitute a business, even if those assets are in a subsidiary. The amendments were originally intended to be effective for annual periods beginning on or after 1 January 2016. The effective date has now been deferred/removed. Early application of the amendments continues to be permitted.
IFRS 15, ‘Revenue from contracts with customers’, establishes a comprehensive framework for determining when to recognise revenue and how much revenue to recognise through a 5–step approach. IFRS 15 provides specific guidance on capitalisation of contract cost and licence arrangements. It also includes a cohesive set of disclosure requirements about the nature, amount, timing and uncertainty of revenue and cash flows arising from the entity’s contracts with customers. The core principle is that a company should recognise revenue to depict the transfer of promised goods or services to the customer in an amount that reflects the consideration to which the company expects to be entitled in exchange for those goods or services. IFRS 15 replaces the previous revenue standards: IAS 18 ‘Revenue’ and IAS 11 ‘Construction Contracts’ and the related Interpretations on revenue recognition: IFRIC 13 ‘Customer Loyalty Programmes’, IFRIC 15 ‘Agreements for the Construction of Real Estate’, IFRIC 18 ‘Transfers of Assets from Customers’ and SIC–31 ‘Revenue—Barter Transactions Involving Advertising Services’. IFRS 15 is effective for annual reporting periods beginning on or after 1 January 2018, with earlier application permitted.
IFRS 16, ‘Leases’, provides updated guidance on the definition of leases, and the guidance on the combination and separation of contracts. Under IFRS 16, a contract is, or contains, a lease if the contract conveys the right to control the use of an identified asset for a period of time in exchange for consideration. IFRS 16 requires lessees to recognise lease liability reflecting future lease payments and a ‘right–of–use–asset’ for almost all lease contracts, with an exemption for certain short–term leases and leases of low–value assets. The lessors accounting stays almost the same as under IAS 17 ‘Leases’. An entity shall apply IFRS 16 for annual reporting periods beginning on or after 1 January 2019. Earlier application is permitted if IFRS 15 is also applied.
Amendments to IAS 7, ‘Statement of cash flows’, the IASB has issued an amendment to IAS 7 introducing an additional disclosure that will enable users of financial statements to evaluate changes in liabilities arising from financing activities. The amendment is part of the IASB’s Disclosure Initiative, which continues to explore how financial statement disclosure can be improved. Amendments to IAS 7 are effective for annual periods beginning on or after 1 January 2017.
Amendments to IAS 12, ‘Income taxes’, the IASB has issued amendments to IAS 12, ‘Income taxes’. These amendments on the recognition of deferred tax assets for unrealised losses clarify how to account for deferred tax assets related to debt instruments measured at fair value. Amendments to IAS 12 are effective for annual periods beginning on or after 1 January 2017.
The accompanying consolidated financial statements are prepared on the historical cost basis except for the remeasurement of available–for–sale securities (Note 2(k)), securities held for trading (Note 2(k)), derivative financial instruments (Note 2(l) and (n)) and derivative component of the convertible bonds (Note 2(r)) to their fair values.
The preparation of the consolidated financial statements in accordance with IFRS requires management to make judgements, estimates and assumptions that affect the application of policies and reported amounts of assets and liabilities and disclosure of contingent assets and liabilities at the date of the financial statements and the reported amounts of revenues and expenses during the period. The estimates and associated assumptions are based on historical experience and various other factors that are believed to be reasonable under the circumstances, the results of which form the basis of making the judgements about the carrying values of assets and liabilities that are not readily apparent from other sources. Actual results could differ from those estimates.
The estimates and underlying assumptions are reviewed on an ongoing basis. Revisions to accounting estimates are recognised in the period in which the estimate is revised if the revision affects only that period, or in the period of the revision and future periods if the revision affects both current and future periods.
Key assumptions and estimation made by management in the application of IFRSs that have significant effect on the consolidated financial statements and the major sources of estimation uncertainty are disclosed in Note 39.

157CHINA PETROLEUM & CHEMICAL CORPORATION Annual Report 2016
NOTES TO THE CONSOLIDATED FINANCIAL STATEMENTS (CONTINUED)for the year ended 31 December 2016
Fina
ncia
l S
tate
men
ts (
Inte
rnat
iona
l)
2 SIGNIFICANT ACCOUNTING POLICIES
(a) Basis of consolidationThe consolidated financial statements comprise the Company and its subsidiaries, and interest in associates and joint ventures.
(i) Subsidiaries and non–controlling interestsSubsidiaries are those entities controlled by the Group. The Group controls an entity when the Group is exposed to, or has rights to, variable returns from its involvement with the entity and has the ability to affect those returns through its power over the entity.
The financial statements of subsidiaries are included in the consolidated financial statements from the date that control effectively commences until the date that control effectively ceases.
Non–controlling interests at the balance sheet date, being the portion of the net assets of subsidiaries attributable to equity interests that are not owned by the Company, whether directly or indirectly through subsidiaries, are presented in the consolidated balance sheet and consolidated statement of changes in equity within equity, separately from equity attributable to the owners of the Company. Non–controlling interests in the results of the Group are presented on the face of the consolidated income statement and the consolidated statement of comprehensive income as an allocation of the total profit or loss and total comprehensive income for the year between non–controlling interests and the owners of the Company.
Changes in the Group’s interests in a subsidiary that do not result in a loss of control are accounted for as equity transactions, whereby adjustments are made to the amounts of controlling and non–controlling interests within consolidated equity to reflect the change in relative interests, but no adjustments are made to goodwill and no gain or loss is recognised.
When the Group loses control of a subsidiary, it is accounted for as a disposal of the entire interest in that subsidiary, with a resulting gain or loss being recognised in profit or loss. Any interest retained in that former subsidiary at the date when control is lost is recognised at fair value and this amount is regarded as the fair value on initial recognition of a financial asset (Note 2(k)) or, when appropriate, the cost on initial recognition of an investment in an associate or joint venture (Note 2(a) (ii)).
In the Company’s balance sheet, investments in subsidiaries are stated at cost less impairment losses (Note 2(o)).
The particulars of the Group’s principal subsidiaries are set out in Note 37.
(ii) Associates and joint ventures An associate is an entity, not being a subsidiary, in which the Group exercises significant influence over its management. Significant influence
is the power to participate in the financial and operating policy decisions of the investee but is not control or joint control over those policies.
The investments in joint arrangements are classified as either joint operations or joint ventures depending on the contractual rights and obligations each investor has rather than the legal structure of the joint arrangement. A joint venture is a joint arrangement whereby the parties that have joint control of the arrangement have rights to the net assets of the arrangement.
Investments in associates and joint ventures are accounted for in the consolidated financial statements using the equity method from the date that significant influence or joint control commences until the date that significant influence or joint control ceases. Under the equity method, the investment is initially recorded at cost and adjusted thereafter for the post acquisition change in the Group’s share of the investee’s net assets and any impairment loss relating to the investment (Note 2(j) and (o)).
The Group’s share of the post–acquisition, post–tax results of the investees and any impairment losses for the year are recognised in the consolidated income statement, whereas the Group’s share of the post–acquisition, post–tax items of the investees’ other comprehensive income is recognised in the consolidated statement of comprehensive income.
When the Group ceases to have significant influence over an associate or joint control over a joint venture, it is accounted for as a disposal of the entire interest in that investee, with a resulting gain or loss being recognised in profit or loss. Any interest retained in that former investee at the date when significant influence or joint control is lost is recognised at fair value and this amount is regarded as the fair value on initial recognition of a financial asset (see Note 2(k)) or, when appropriate, the cost on initial recognition of an investment in an associate (see Note 2(a) (ii)).
In the Company’s balance sheet, investments in associates and joint ventures are stated at carrying amount (Note 2(o)).
(iii) Transactions eliminated on consolidationInter–company balances and transactions and any unrealised gains arising from inter–company transactions are eliminated on consolidation. Unrealised gains arising from transactions with associates and joint ventures are eliminated to the extent of the Group’s interest in the entity. Unrealised losses are eliminated in the same way as unrealised gains, but only to the extent that there is no evidence of impairment.
158 CHINA PETROLEUM & CHEMICAL CORPORATIONAnnual Report 2016
NOTES TO THE CONSOLIDATED FINANCIAL STATEMENTS (CONTINUED)for the year ended 31 December 2016
Fina
ncia
l S
tate
men
ts (
Inte
rnat
iona
l)
2 SIGNIFICANT ACCOUNTING POLICIES (Continued)
(a) Basis of consolidation (Continued)(iv) Merger accounting for common control combination
The consolidated financial statements incorporate the financial statements of the combining entities or businesses in which the common control combination occurs as if they had been combined from the date when the combining entities or businesses first came under the control of the controlling party. The net assets of the combining entities or businesses are combined using the existing book values from the controlling parties’ perspective. No amount is recognised as consideration for goodwill or excess of acquirers’ interest in the net fair value of acquiree’s identifiable assets, liabilities and contingent liabilities over cost at the time of common control combination, to the extent of the continuation of the controlling party’s interest.
The consolidated income statement includes the results of each of the combining entities or businesses from the earliest date presented or since the date when the combining entities or businesses first came under the common control, where there is a shorter period, regardless of the date of the common control combination. The comparative amounts in the consolidated financial statements are presented as if the entities or businesses had been combined at the previous balance sheet date or when they first came under common control, whichever is shorter.
A uniform set of accounting policies is adopted by those entities. All intra–group transactions, balances and unrealised gains on transactions between combining entities or businesses are eliminated on consolidation. Transaction costs, including professional fees, registration fees, costs of furnishing information to shareholders, costs or losses incurred in combining operations of the previously separate businesses, etc., incurred in relation to the common control combination that is to be accounted for by using merger accounting is recognised as an expense in the period in which it is incurred.
(b) Translation of foreign currenciesThe presentation currency of the Group is Renminbi. Foreign currency transactions during the year are translated into Renminbi at the applicable rates of exchange quoted by the People’s Bank of China (‘‘PBOC’’) prevailing on the transaction dates. Foreign currency monetary assets and liabilities are translated into Renminbi at the PBOC’s rates at the balance sheet date.
Exchange differences, other than those capitalised as construction in progress, are recognised as income or expense in the “finance costs” section of the consolidated income statement.
The results of foreign operations are translated into Renminbi at the applicable rates quoted by the PBOC prevailing on the transaction dates. Balance sheet items, including goodwill arising on consolidation of foreign operations are translated into Renminbi at the closing foreign exchange rates at the balance sheet date. The income and expenses of foreign operation are translated into Renminbi at the spot exchange rates or an exchange rate that approximents the spot exchange rates on the transaction dates. The resulting exchange differences are recognised in other comprehensive income and accumulated in equity in the other reserves.
On disposal of a foreign operation, the cumulative amount of the exchange differences relating to that foreign operation is reclassified from equity to the consolidated income statement when the profit or loss on disposal is recognised.
(c) Cash and cash equivalentsCash equivalents consist of time deposits with financial institutions with an initial term of less than three months when purchased. Cash equivalents are stated at cost, which approximates fair value.
(d) Trade, bills and other receivablesTrade, bills and other receivables are initially recognised at fair value and thereafter stated at amortised cost using the effective interest method, less impairment losses for bad and doubtful debts (Note 2(o)). Trade, bills and other receivables are derecognised if the Group’s contractual rights to the cash flows from these financial assets expire or if the Group transfers these financial assets to another party without retaining control or substantially all risks and rewards of the assets.
(e) InventoriesInventories are stated at the lower of cost and net realisable value. Cost includes the cost of purchase computed using the weighted average method and, in the case of work in progress and finished goods, direct labour and an appropriate proportion of production overheads. Net realisable value is the estimated selling price in the ordinary course of business, less the estimated costs of completion and the estimated costs necessary to make the sale.

159CHINA PETROLEUM & CHEMICAL CORPORATION Annual Report 2016
NOTES TO THE CONSOLIDATED FINANCIAL STATEMENTS (CONTINUED)for the year ended 31 December 2016
Fina
ncia
l S
tate
men
ts (
Inte
rnat
iona
l)
2 SIGNIFICANT ACCOUNTING POLICIES (Continued)
(f) Property, plant and equipmentAn item of property, plant and equipment is initially recorded at cost, less accumulated depreciation and impairment losses (Note 2(o)). The cost of an asset comprises its purchase price, any directly attributable costs of bringing the asset to working condition and location for its intended use. The Group recognises in the carrying amount of an item of property, plant and equipment the cost of replacing part of such an item when that cost is incurred, when it is probable that the future economic benefits embodied with the item will flow to the Group and the cost of the item can be measured reliably. All other expenditure is recognised as an expense in the consolidated income statement in the year in which it is incurred.
Gains or losses arising from the retirement or disposal of an item of property, plant and equipment, other than oil and gas properties, are determined as the difference between the net disposal proceeds and the carrying amount of the item and are recognised as income or expense in the consolidated income statement on the date of retirement or disposal.
Depreciation is provided to write off the cost amount of items of property, plant and equipment, other than oil and gas properties, over its estimated useful life on a straight–line basis, after taking into account its estimated residual value, as follows:
Estimated Estimatedusage period residuals rate
Buildings 12 to 50 years 3%Equipment, machinery and others 4 to 30 years 3%
Where parts of an item of property, plant and equipment have different useful lives, the cost of the item is allocated on a reasonable basis between the parts and each part is depreciated separately. Both the useful life of an asset and its residual value, if any, are reassessed annually.
(g) Oil and gas propertiesThe Group uses the successful efforts method of accounting for its oil and gas producing activities. Under this method, costs of development wells, the related supporting equipment and proved mineral interests in properties are capitalised. The cost of exploratory wells is initially capitalised as construction in progress pending determination of whether the well has found proved reserves. The impairment of exploratory well costs occurs upon the determination that the well has not found proved reserves. The exploratory well costs are usually not carried as an asset for more than one year following completion of drilling, unless (i) the well has found a sufficient quantity of reserves to justify its completion as a producing well if the required capital expenditure is made; (ii) drilling of the additional exploratory wells is under way or firmly planned for the near future; or (iii) other activities are being undertaken to sufficiently progress the assessing of the reserves and the economic and operating viability of the project. All other exploration costs, including geological and geophysical costs, other dry hole costs and annual lease rentals, are expensed as incurred. Capitalised costs of proved oil and gas properties are amortised on a unit–of–production method based on volumes produced and reserves.
Management estimates future dismantlement costs for oil and gas properties with reference to engineering estimates after taking into consideration the anticipated method of dismantlement required in accordance with the industry practices and the future cash flows are adjusted to reflect such risks specific to the liability, as appropriate. These estimated future dismantlement costs are discounted at pre–tax risk–free rate and are capitalised as oil and gas properties, which are subsequently amortised as part of the costs of the oil and gas properties.
(h) Lease prepaymentsLease prepayments represent land use rights paid to the relevant government authorities. Land use rights are carried at cost less accumulated amount charged to expense and impairment losses (Note 2(o)). The cost of lease prepayments is charged to expense on a straight–line basis over the respective periods of the rights.
(i) Construction in progressConstruction in progress represents buildings, oil and gas properties, various plant and equipment under construction and pending installation, and is stated at cost less impairment losses (Note 2(o)). Cost comprises direct costs of construction as well as interest charges, and foreign exchange differences on related borrowed funds to the extent that they are regarded as an adjustment to interest charges, during the periods of construction.
Construction in progress is transferred to property, plant and equipment when the asset is substantially ready for its intended use.
No depreciation is provided in respect of construction in progress.

160 CHINA PETROLEUM & CHEMICAL CORPORATIONAnnual Report 2016
NOTES TO THE CONSOLIDATED FINANCIAL STATEMENTS (CONTINUED)for the year ended 31 December 2016
Fina
ncia
l S
tate
men
ts (
Inte
rnat
iona
l)
2 SIGNIFICANT ACCOUNTING POLICIES (Continued)
(j) GoodwillGoodwill represents amounts arising on acquisition of subsidiaries, associates or joint ventures. Goodwill represents the difference between the cost of acquisition and the fair value of the net identifiable assets acquired.
Prior to 1 January 2008, the acquisition of the non–controlling interests of a consolidated subsidiary was accounted for using the acquisition method whereby the difference between the cost of acquisition and the fair value of the net identifiable assets acquired (on a proportionate share) was recognised as goodwill. From 1 January 2008, any difference between the amount by which the non–controlling interest is adjusted (such as through an acquisition of the non–controlling interests) and the cash or other considerations paid is recognised in equity.
Goodwill is stated at cost less accumulated impairment losses. Goodwill arising on a business combination is allocated to each cash–generating unit, or groups of cash–generating units, that is expected to benefit the synergies of the combination and is tested annually for impairment (Note 2(o)). In respect of associates or joint ventures, the carrying amount of goodwill is included in the carrying amount of the interest in the associate or joint venture and the investment as a whole is tested for impairment whenever there is objective evidence of impairment (Note 2(o)).
(k) Available–for–sale financial assetsInvestments in available–for–sale securities are carried at fair value with any change in fair value recognised in other comprehensive income and accumulated separately in equity in other reserves. When these investments are derecognised or impaired, the cumulative gain or loss is reclassified from equity to the consolidated income statement. Investments in equity securities, other than investments in associates and joint ventures, that do not have a quoted market price in an active market and whose fair value cannot be reliably measured are recognised in the balance sheet at cost less impairment losses (Note 2(o)).
Investments in securities held for trading are classified as current assets. Any attributable transaction costs are recognised in the consolidated income statement as incurred. At each balance sheet date, the fair value is remeasured, with any resultant gain or loss being recognised in the consolidated income statement.
(l) Derivative financial instrumentsDerivative financial instruments are recognised initially at fair value. At each balance sheet date, the fair value is remeasured. The gain or loss on remeasurement to fair value is recognised immediately in the consolidated income statement, except where the derivatives qualify for cash flow hedge accounting or hedge the net investment in a foreign operation, in which case recognition of any resulting gain or loss depends on the nature of the item being hedged (Note 2(n)).
(m) Offsetting financial instrumentsFinancial assets and liabilities are presented respectively in the consolidated balance sheet, without any offset. However, they are offset and reported in the balance sheet when satisfied the following: (1) There is a legally enforceable right to offset the recognised amounts. (2) There is an intention to settle on a net basis or realise the asset and settle the liability simultaneously. The legally enforceable right must not be contingent on future events and must be enforceable in the normal course of business and in the event of default, insolvency or bankruptcy of the Company or the counterparty.
(n) Hedging
(i) Cash flow hedgesWhere a derivative financial instrument is designated as a hedge of the variability in cash flows of a recognised asset or liability or a highly probable forecast transaction or the foreign currency risk of a committed future transaction, the effective portion of any gains or losses on remeasurement of the derivative financial instrument to fair value are recognised in other comprehensive income and accumulated separately in equity in other reserves. The ineffective portion of any gain or loss is recognised immediately in the consolidated income statement.
If a hedge of a forecast transaction subsequently results in the recognition of a non–financial asset, the associated gain or loss is reclassified from equity to be included in the initial cost or other carrying amount of the non–financial asset.
If a hedge of a forecast transaction subsequently results in the recognition of a financial asset or a financial liability, the associated gain or loss is reclassified from equity to the consolidated income statement in the same period or periods during which the asset acquired or liability assumed affects the consolidated income statement (such as when interest income or expense is recognised).
For cash flow hedges, other than those covered by the preceding two policy statements, the associated gain or loss is reclassified from equity to the consolidated income statement in the same period or periods during which the hedged forecast transaction affects the consolidated income statement.
When a hedging instrument expires or is sold, terminated, exercised, or the entity revokes designation of the hedge relationship but the hedged forecast transaction is still expected to occur, the cumulative gain or loss at that point remains in equity until the transaction occurs and it is recognised in accordance with the above policy. If the hedged transaction is no longer expected to take place, the cumulative unrealised gain or loss is reclassified from equity to the consolidated income statement immediately.
161CHINA PETROLEUM & CHEMICAL CORPORATION Annual Report 2016
NOTES TO THE CONSOLIDATED FINANCIAL STATEMENTS (CONTINUED)for the year ended 31 December 2016
Fina
ncia
l S
tate
men
ts (
Inte
rnat
iona
l)
2 SIGNIFICANT ACCOUNTING POLICIES (Continued)
(n) Hedging (Continued)
(ii) Fair value hedgesA fair value hedge is a hedge of the exposure to changes in fair value of a recognised asset or liability or an unrecognised firm commitment, or an identified portion of such an asset, liability or unrecognised firm commitment.
The gain or loss from remeasuring the hedging instrument at fair value is recognised in profit or loss. The gain or loss on the hedged item attributable to the hedged risk adjusts the carrying amount of the hedged item and is recognised in profit or loss.
When a hedging instrument expires or is sold, terminated or exercised, or no longer meets the criteria for hedge accounting, the Group discontinues prospectively the hedge accounting treatments. If the hedged item is a financial instrument measured at amortised cost, any adjustment to the carrying amount of the hedged item is amortised to profit or loss from the adjustment date to the maturity date using the recalculated effective interest rate at the adjustment date.
(iii) Hedge of net investments in foreign operations The portion of the gain or loss on remeasurement to fair value of an instrument used to hedge a net investment in a foreign operation that is
determined to be an effective hedge is recognised in other comprehensive income and accumulated separately in equity in the other reserve until the disposal of the foreign operation, at which time the cumulative gain or loss is reclassified from equity to the consolidated income statement. The ineffective portion is recognised immediately in the consolidated income statement. In this year no hedge of net investment in foreign operations was hold by the Group.
(o) Impairment of assets
(i) Trade accounts receivable, other receivables and investment in equity securities that do not have a quoted market price in an active market are reviewed at each balance sheet date to determine whether there is objective evidence of impairment. If any such evidence exists, an impairment loss is determined and recognised.
The impairment loss is measured as the difference between the asset’s carrying amount and the estimated future cash flows, discounted at the current market rate of return for a similar financial asset where the effect of discounting is material, and is recognised as an expense in the consolidated income statement. Impairment losses for trade and other receivables are reversed through the consolidated income statement if in a subsequent period the amount of the impairment losses decreases. Impairment losses for equity securities carried at cost are not reversed.
For investments in associates and joint ventures accounted under the equity method (Note 2(a) (ii)), the impairment loss is measured by comparing the recoverable amount of the investment as a whole with its carrying amount in accordance with the accounting policy set out in Note 2(o) (ii). The impairment loss is reversed if there has been a favourable change in the estimates used to determine the recoverable amount in accordance with the accounting policy set out in Note 2(o) (ii).
(ii) Impairment of other long–lived assets is accounted as follows: The carrying amounts of other long–lived assets, including property, plant and equipment, construction in progress, lease prepayments and
other assets, are reviewed at each balance sheet date to identify indicators that the assets may be impaired. These assets are tested for impairment whenever events or changes in circumstances indicate that their recorded carrying amounts may not be recoverable. When such a decline has occurred, the carrying amount is reduced to the recoverable amount. For goodwill, the recoverable amount is estimated at each balance sheet date.
The recoverable amount is the greater of the fair value less costs to disposal and the value in use. In determining the value in use, expected future cash flows generated by the asset are discounted to their present value using a pre–tax discount rate that reflects current market assessments of the time value of money and the risks specific to the asset. Where an asset does not generate cash inflows largely independent of those from other assets, the recoverable amount is determined for the smallest group of assets that generates cash inflows independently (i.e. a cash–generating unit).
The amount of the reduction is recognised as an expense in the consolidated income statement. Impairment losses recognised in respect of cash–generating units are allocated first to reduce the carrying amount of any goodwill allocated to the cash–generating unit and then, to reduce the carrying amount of the other assets in the unit on a pro rata basis, except that the carrying value of an asset will not be reduced below its individual fair value less costs to disposal, or value in use, if determinable.
Management assesses at each balance sheet date whether there is any indication that an impairment loss recognised for a long–lived asset, except in the case of goodwill, in prior years may no longer exist. An impairment loss is reversed if there has been a favourable change in the estimates used to determine the recoverable amount. A subsequent increase in the recoverable amount of an asset, when the circumstances and events that led to the write–down or write–off cease to exist, is recognised as an income. The reversal is reduced by the amount that would have been recognised as depreciation had the write–down or write–off not occurred. An impairment loss in respect of goodwill is not reversed.

162 CHINA PETROLEUM & CHEMICAL CORPORATIONAnnual Report 2016
NOTES TO THE CONSOLIDATED FINANCIAL STATEMENTS (CONTINUED)for the year ended 31 December 2016
Fina
ncia
l S
tate
men
ts (
Inte
rnat
iona
l)
2 SIGNIFICANT ACCOUNTING POLICIES (Continued)
(p) Trade, bills and other payablesTrade, bills and other payables are initially recognised at fair value and thereafter stated at amortised cost unless the effect of discounting would be immaterial, in which case they are stated at cost.
(q) Interest–bearing borrowingsInterest–bearing borrowings are recognised initially at fair value less attributable transaction costs. Subsequent to initial recognition, interest–bearing borrowings are stated at amortised cost with any difference between cost and redemption value being recognised in the consolidated income statement over the period of borrowings using the effective interest method.
(r) Convertible bonds
(i) Convertible bonds that contain an equity component Convertible bonds that can be converted to equity share capital at the option of the holder, where the number of shares that would be issued
on conversion and the value of the consideration that would be received at that time do not vary, are accounted for as compound financial instruments that contain both a liability component and an equity component.
At initial recognition, the liability component of the convertible bonds is measured as the present value of the future interest and principal payments, discounted at the market rate of interest applicable at the time of initial recognition to similar liabilities that do not have a conversion option. Any excess of proceeds over the amount initially recognised as the liability component is recognised as the equity component. Transaction costs that relate to the issuance of the convertible bonds are allocated to the liability and equity components in proportion to the allocation of proceeds.
The liability component is subsequently carried at amortised cost. The interest expense on the liability component is calculated using the effective interest method. The equity component is recognised in the capital reserve until the bond is converted or redeemed.
If the bond is converted, the capital reserve, together with the carrying amount of the liability component at the time of conversion, is transferred to share capital and share premium as consideration for the shares issued. If the bond is redeemed, the capital reserve is transferred to share premium.
(ii) Other convertible bonds Convertible bonds issued with a cash settlement option and other embedded derivative features are accounted for as compound financial
instruments that contain a liability component and a derivative component.
At initial recognition, the derivative component of the convertible bonds is measured at fair value. Any excess of proceeds over the amount initially recognised as the derivative component is recognised as the liability component. Transaction costs that relate to the issuance of the convertible bonds are allocated to the liability and derivative components in proportion to the allocation of proceeds. The portion of the transaction costs relating to the liability component is recognised initially as part of the liability. The portion relating to the derivative component is recognised immediately as an expense in the consolidated income statement.
The derivative component is subsequently remeasured at each balance sheet date and any gains or losses arising from change in the fair value are recognised in the consolidated income statement. The liability component is subsequently carried at amortised cost until extinguished on conversion or redemption. The interest expense recognised in the consolidated income statement on the liability component is calculated using the effective interest method. Both the liability and the related derivative components are presented together for financial statements reporting purposes.
If the convertible bonds are converted, the carrying amounts of the derivative and liability components are transferred to share capital and share premium as consideration for the shares issued. If the convertible bonds are redeemed, any difference between the amount paid and the carrying amounts of both components is recognised in the consolidated income statement.

163CHINA PETROLEUM & CHEMICAL CORPORATION Annual Report 2016
NOTES TO THE CONSOLIDATED FINANCIAL STATEMENTS (CONTINUED)for the year ended 31 December 2016
Fina
ncia
l S
tate
men
ts (
Inte
rnat
iona
l)
2 SIGNIFICANT ACCOUNTING POLICIES (Continued)
(s) Provisions and contingent liability A provision is recognised for liability of uncertain timing or amount when the Group has a legal or constructive obligation arising as a result of a
past event, when it is probable that an outflow of economic benefits will be required to settle the obligation and a reliable estimate can be made.
When it is not probable that an outflow of economic benefits will be required, or the amount cannot be estimated reliably, the obligation is disclosed as a contingent liability, unless the probability of outflow of economic benefits is remote. Possible obligations, whose existence will only be confirmed by the occurrence or non–occurrence of one or more future events are also disclosed as contingent liabilities unless the probability of outflow of economic benefits is remote.
Provisions for future dismantlement costs are initially recognised based on the present value of the future costs expected to be incurred in respect of the Group’s expected dismantlement and abandonment costs at the end of related oil and gas exploration and development activities. Any subsequent change in the present value of the estimated costs, other than the change due to passage of time which is regarded as interest cost, is reflected as an adjustment to the provision and oil and gas properties.
(t) Revenue recognitionRevenues associated with the sale of crude oil, natural gas, petroleum and chemical products and ancillary materials are recorded when the customer accepts the goods and the significant risks and rewards of ownership and title have been transferred to the buyer. Revenue from the rendering of services is recognised in the consolidated income statement upon performance of the services. No revenue is recognised if there are significant uncertainties regarding recovery of the consideration due, the possible return of goods, or when the amount of revenue and the costs incurred or to be incurred in respect of the transaction cannot be measured reliably.
Interest income is recognised on a time apportioned basis that takes into account the effective yield on the asset.
A government grant that becomes receivable as compensation for expenses or losses already incurred with no future related costs is recognised as income in the period in which it becomes receivable.
(u) Borrowing costsBorrowing costs are expensed in the consolidated income statement in the period in which they are incurred, except to the extent that they are capitalised as being attributable to the construction of an asset which necessarily takes a period of time to get ready for its intended use.
(v) Repairs and maintenance expenditureRepairs and maintenance expenditure is expensed as incurred.
(w) Environmental expendituresEnvironmental expenditures that relate to current ongoing operations or to conditions caused by past operations are expensed as incurred.
Liabilities related to future remediation costs are recorded when environmental assessments and/or cleanups are probable and the costs can be reliably estimated. As facts concerning environmental contingencies become known to the Group, the Group reassesses its position both with respect to accrued liabilities and other potential exposures.
(x) Research and development expenseResearch and development expenditures that cannot be capitalised are expensed in the period in which they are incurred. Research and development expense amounted to RMB 5,941 million for the year ended 31 December 2016 (2015: RMB 5,654 million).
(y) Operating leasesOperating lease payments are charged to the consolidated income statement on a straight–line basis over the period of the respective leases.
(z) Employee benefitsThe contributions payable under the Group’s retirement plans are recognised as an expense in the consolidated income statement as incurred and according to the contribution determined by the plans. Further information is set out in Note 35.
Termination benefits, such as employee reduction expenses, are recognised when, and only when, the Group demonstrably commits itself to terminate employment or to provide benefits as a result of voluntary redundancy by having a detailed formal plan which is without realistic possibility of withdrawal.
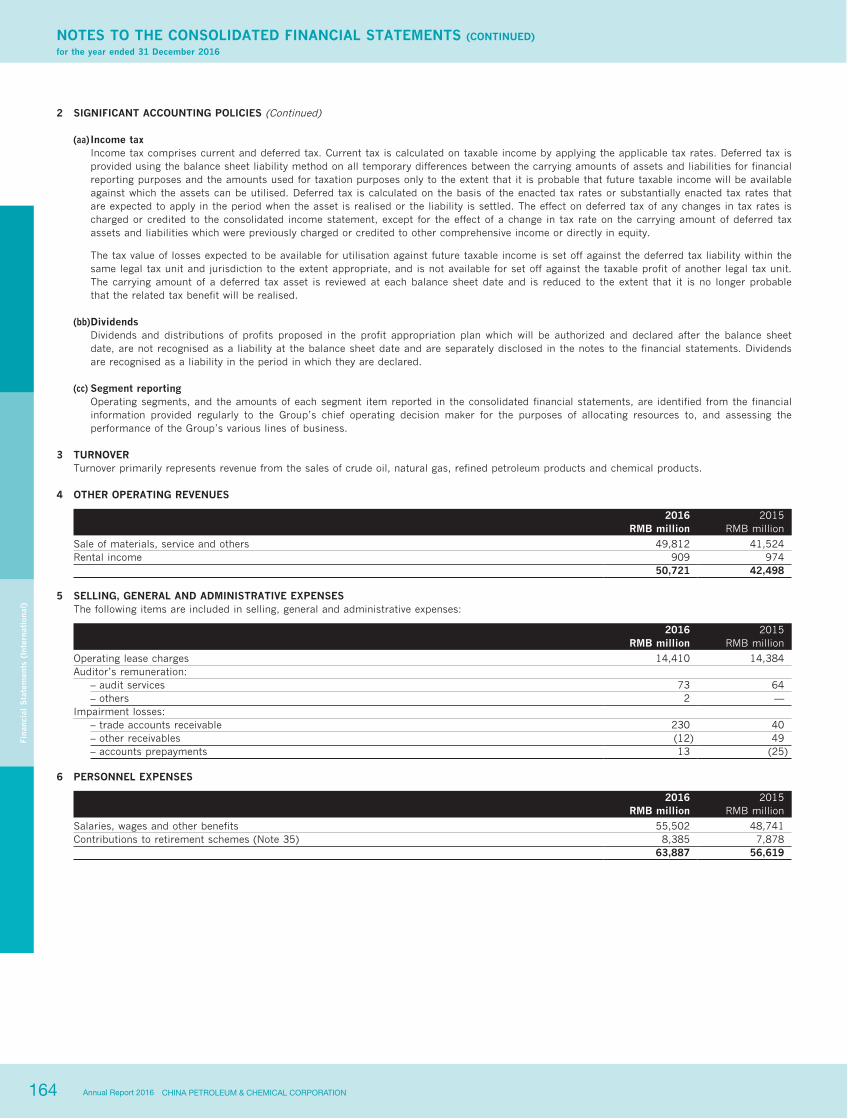
164 CHINA PETROLEUM & CHEMICAL CORPORATIONAnnual Report 2016
NOTES TO THE CONSOLIDATED FINANCIAL STATEMENTS (CONTINUED)for the year ended 31 December 2016
Fina
ncia
l S
tate
men
ts (
Inte
rnat
iona
l)
2 SIGNIFICANT ACCOUNTING POLICIES (Continued)
(aa) Income taxIncome tax comprises current and deferred tax. Current tax is calculated on taxable income by applying the applicable tax rates. Deferred tax is provided using the balance sheet liability method on all temporary differences between the carrying amounts of assets and liabilities for financial reporting purposes and the amounts used for taxation purposes only to the extent that it is probable that future taxable income will be available against which the assets can be utilised. Deferred tax is calculated on the basis of the enacted tax rates or substantially enacted tax rates that are expected to apply in the period when the asset is realised or the liability is settled. The effect on deferred tax of any changes in tax rates is charged or credited to the consolidated income statement, except for the effect of a change in tax rate on the carrying amount of deferred tax assets and liabilities which were previously charged or credited to other comprehensive income or directly in equity.
The tax value of losses expected to be available for utilisation against future taxable income is set off against the deferred tax liability within the same legal tax unit and jurisdiction to the extent appropriate, and is not available for set off against the taxable profit of another legal tax unit. The carrying amount of a deferred tax asset is reviewed at each balance sheet date and is reduced to the extent that it is no longer probable that the related tax benefit will be realised.
(bb) DividendsDividends and distributions of profits proposed in the profit appropriation plan which will be authorized and declared after the balance sheet date, are not recognised as a liability at the balance sheet date and are separately disclosed in the notes to the financial statements. Dividends are recognised as a liability in the period in which they are declared.
(cc) Segment reportingOperating segments, and the amounts of each segment item reported in the consolidated financial statements, are identified from the financial information provided regularly to the Group’s chief operating decision maker for the purposes of allocating resources to, and assessing the performance of the Group’s various lines of business.
3 TURNOVERTurnover primarily represents revenue from the sales of crude oil, natural gas, refined petroleum products and chemical products.
4 OTHER OPERATING REVENUES
2016 2015RMB million RMB million
Sale of materials, service and others 49,812 41,524Rental income 909 974 50,721 42,498
5 SELLING, GENERAL AND ADMINISTRATIVE EXPENSESThe following items are included in selling, general and administrative expenses:
2016 2015RMB million RMB million
Operating lease charges 14,410 14,384Auditor’s remuneration:
– audit services 73 64– others 2 —
Impairment losses: – trade accounts receivable 230 40– other receivables (12) 49– accounts prepayments 13 (25)
6 PERSONNEL EXPENSES
2016 2015RMB million RMB million
Salaries, wages and other benefits 55,502 48,741Contributions to retirement schemes (Note 35) 8,385 7,878 63,887 56,619
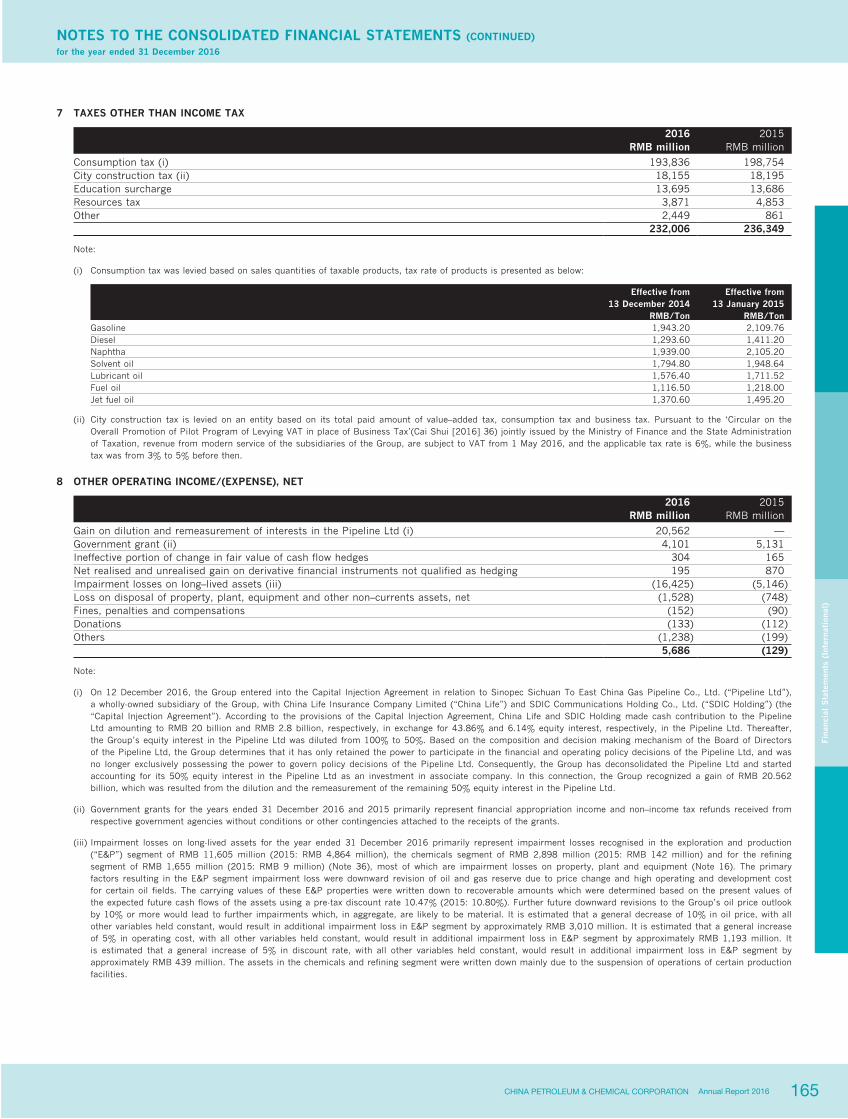
165CHINA PETROLEUM & CHEMICAL CORPORATION Annual Report 2016
NOTES TO THE CONSOLIDATED FINANCIAL STATEMENTS (CONTINUED)for the year ended 31 December 2016
Fina
ncia
l S
tate
men
ts (
Inte
rnat
iona
l)
7 TAXES OTHER THAN INCOME TAX
2016 2015RMB million RMB million
Consumption tax (i) 193,836 198,754City construction tax (ii) 18,155 18,195Education surcharge 13,695 13,686Resources tax 3,871 4,853Other 2,449 861 232,006 236,349
Note:
(i) Consumption tax was levied based on sales quantities of taxable products, tax rate of products is presented as below:
Effective from Effective from13 December 2014 13 January 2015
RMB/Ton RMB/TonGasoline 1,943.20 2,109.76Diesel 1,293.60 1,411.20Naphtha 1,939.00 2,105.20Solvent oil 1,794.80 1,948.64Lubricant oil 1,576.40 1,711.52Fuel oil 1,116.50 1,218.00Jet fuel oil 1,370.60 1,495.20
(ii) City construction tax is levied on an entity based on its total paid amount of value–added tax, consumption tax and business tax. Pursuant to the ‘Circular on the Overall Promotion of Pilot Program of Levying VAT in place of Business Tax’(Cai Shui [2016] 36) jointly issued by the Ministry of Finance and the State Administration of Taxation, revenue from modern service of the subsidiaries of the Group, are subject to VAT from 1 May 2016, and the applicable tax rate is 6%, while the business tax was from 3% to 5% before then.
8 OTHER OPERATING INCOME/(EXPENSE), NET
2016 2015RMB million RMB million
Gain on dilution and remeasurement of interests in the Pipeline Ltd (i) 20,562 —Government grant (ii) 4,101 5,131Ineffective portion of change in fair value of cash flow hedges 304 165Net realised and unrealised gain on derivative financial instruments not qualified as hedging 195 870Impairment losses on long–lived assets (iii) (16,425) (5,146)Loss on disposal of property, plant, equipment and other non–currents assets, net (1,528) (748)Fines, penalties and compensations (152) (90)Donations (133) (112)Others (1,238) (199) 5,686 (129)
Note:
(i) On 12 December 2016, the Group entered into the Capital Injection Agreement in relation to Sinopec Sichuan To East China Gas Pipeline Co., Ltd. (“Pipeline Ltd”), a wholly-owned subsidiary of the Group, with China Life Insurance Company Limited (“China Life”) and SDIC Communications Holding Co., Ltd. (“SDIC Holding”) (the “Capital Injection Agreement”). According to the provisions of the Capital Injection Agreement, China Life and SDIC Holding made cash contribution to the Pipeline Ltd amounting to RMB 20 billion and RMB 2.8 billion, respectively, in exchange for 43.86% and 6.14% equity interest, respectively, in the Pipeline Ltd. Thereafter, the Group’s equity interest in the Pipeline Ltd was diluted from 100% to 50%. Based on the composition and decision making mechanism of the Board of Directors of the Pipeline Ltd, the Group determines that it has only retained the power to participate in the financial and operating policy decisions of the Pipeline Ltd, and was no longer exclusively possessing the power to govern policy decisions of the Pipeline Ltd. Consequently, the Group has deconsolidated the Pipeline Ltd and started accounting for its 50% equity interest in the Pipeline Ltd as an investment in associate company. In this connection, the Group recognized a gain of RMB 20.562 billion, which was resulted from the dilution and the remeasurement of the remaining 50% equity interest in the Pipeline Ltd.
(ii) Government grants for the years ended 31 December 2016 and 2015 primarily represent financial appropriation income and non–income tax refunds received from respective government agencies without conditions or other contingencies attached to the receipts of the grants.
(iii) Impairment losses on long-lived assets for the year ended 31 December 2016 primarily represent impairment losses recognised in the exploration and production (“E&P”) segment of RMB 11,605 million (2015: RMB 4,864 million), the chemicals segment of RMB 2,898 million (2015: RMB 142 million) and for the refining segment of RMB 1,655 million (2015: RMB 9 million) (Note 36), most of which are impairment losses on property, plant and equipment (Note 16). The primary factors resulting in the E&P segment impairment loss were downward revision of oil and gas reserve due to price change and high operating and development cost for certain oil fields. The carrying values of these E&P properties were written down to recoverable amounts which were determined based on the present values of the expected future cash flows of the assets using a pre-tax discount rate 10.47% (2015: 10.80%). Further future downward revisions to the Group’s oil price outlook by 10% or more would lead to further impairments which, in aggregate, are likely to be material. It is estimated that a general decrease of 10% in oil price, with all other variables held constant, would result in additional impairment loss in E&P segment by approximately RMB 3,010 million. It is estimated that a general increase of 5% in operating cost, with all other variables held constant, would result in additional impairment loss in E&P segment by approximately RMB 1,193 million. It is estimated that a general increase of 5% in discount rate, with all other variables held constant, would result in additional impairment loss in E&P segment by approximately RMB 439 million. The assets in the chemicals and refining segment were written down mainly due to the suspension of operations of certain production facilities.
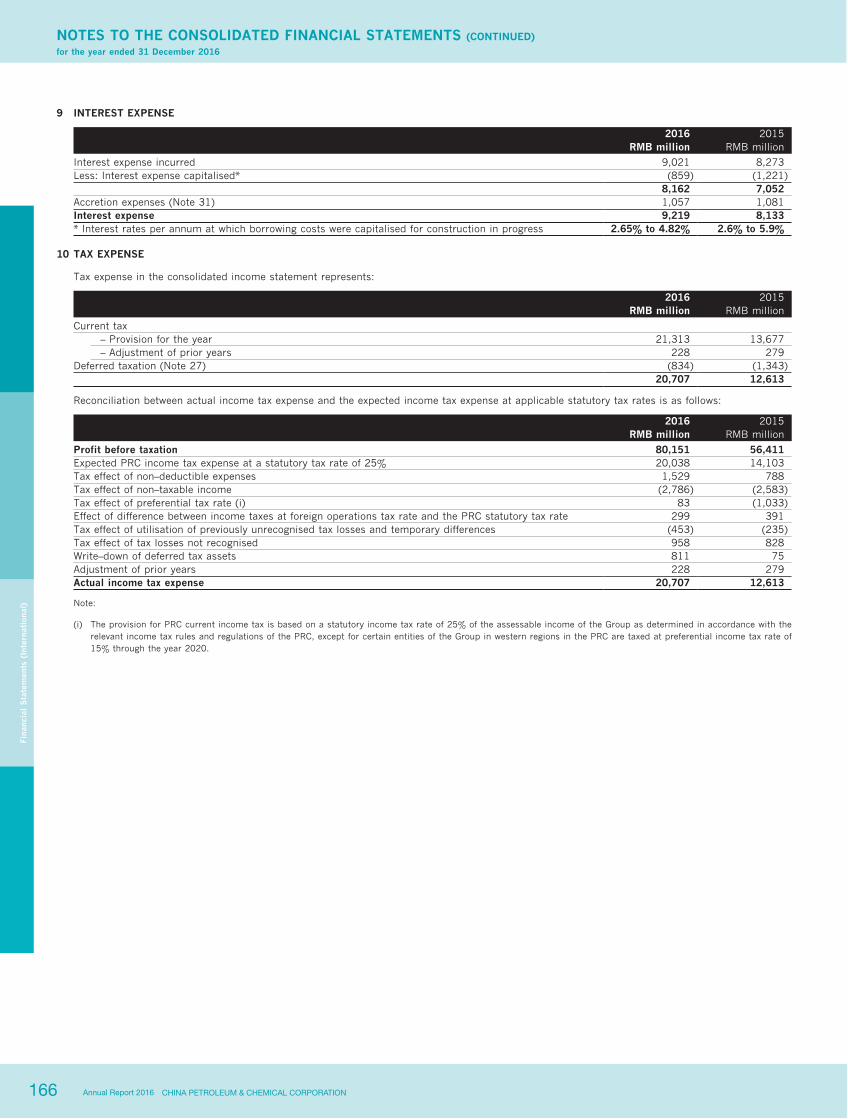
166 CHINA PETROLEUM & CHEMICAL CORPORATIONAnnual Report 2016
NOTES TO THE CONSOLIDATED FINANCIAL STATEMENTS (CONTINUED)for the year ended 31 December 2016
Fina
ncia
l S
tate
men
ts (
Inte
rnat
iona
l)
9 INTEREST EXPENSE
2016 2015RMB million RMB million
Interest expense incurred 9,021 8,273Less: Interest expense capitalised* (859) (1,221) 8,162 7,052Accretion expenses (Note 31) 1,057 1,081Interest expense 9,219 8,133* Interest rates per annum at which borrowing costs were capitalised for construction in progress 2.65% to 4.82% 2.6% to 5.9%
10 TAX EXPENSE
Tax expense in the consolidated income statement represents:
2016 2015RMB million RMB million
Current tax – Provision for the year 21,313 13,677 – Adjustment of prior years 228 279
Deferred taxation (Note 27) (834) (1,343) 20,707 12,613
Reconciliation between actual income tax expense and the expected income tax expense at applicable statutory tax rates is as follows:
2016 2015RMB million RMB million
Profit before taxation 80,151 56,411Expected PRC income tax expense at a statutory tax rate of 25% 20,038 14,103Tax effect of non–deductible expenses 1,529 788Tax effect of non–taxable income (2,786) (2,583)Tax effect of preferential tax rate (i) 83 (1,033)Effect of difference between income taxes at foreign operations tax rate and the PRC statutory tax rate 299 391Tax effect of utilisation of previously unrecognised tax losses and temporary differences (453) (235)Tax effect of tax losses not recognised 958 828Write–down of deferred tax assets 811 75Adjustment of prior years 228 279Actual income tax expense 20,707 12,613
Note:
(i) The provision for PRC current income tax is based on a statutory income tax rate of 25% of the assessable income of the Group as determined in accordance with the relevant income tax rules and regulations of the PRC, except for certain entities of the Group in western regions in the PRC are taxed at preferential income tax rate of 15% through the year 2020.
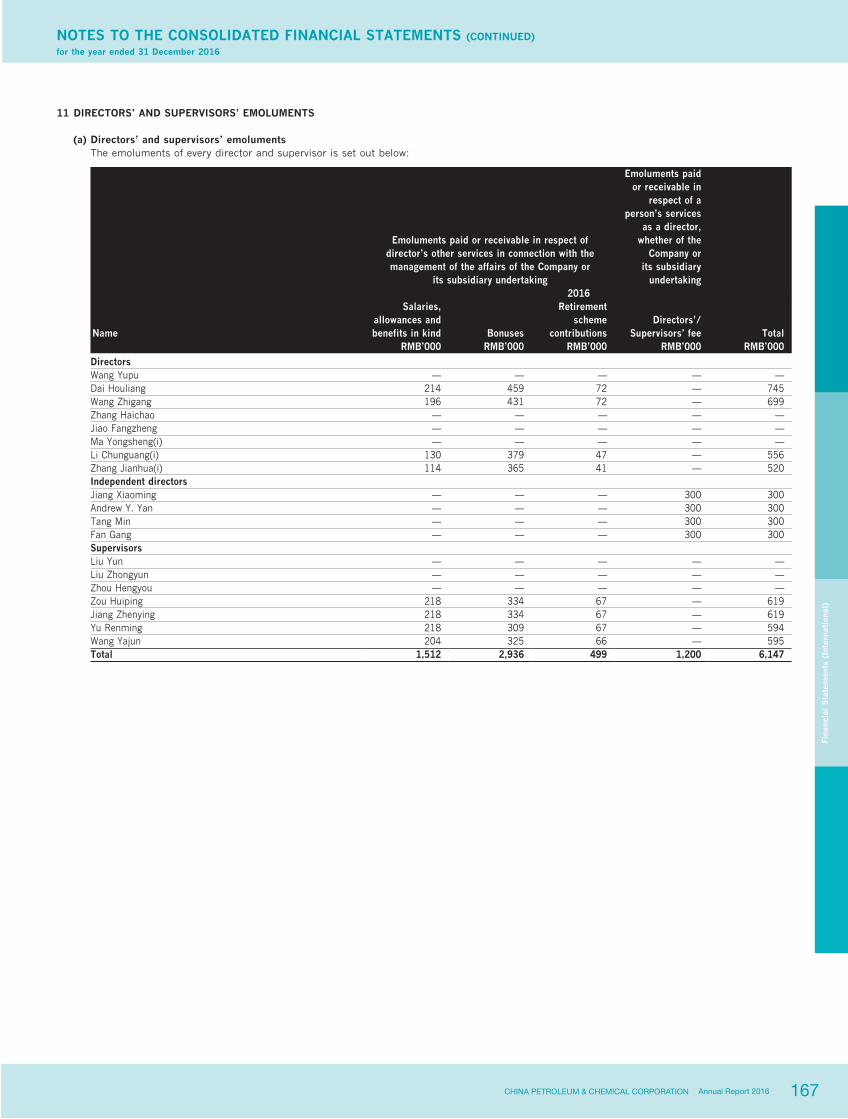
167CHINA PETROLEUM & CHEMICAL CORPORATION Annual Report 2016
NOTES TO THE CONSOLIDATED FINANCIAL STATEMENTS (CONTINUED)for the year ended 31 December 2016
Fina
ncia
l S
tate
men
ts (
Inte
rnat
iona
l)
11 DIRECTORS’ AND SUPERVISORS’ EMOLUMENTS
(a) Directors’ and supervisors’ emoluments The emoluments of every director and supervisor is set out below:
Emoluments paid or receivable in respect ofdirector’s other services in connection with themanagement of the affairs of the Company or
its subsidiary undertaking
Emoluments paidor receivable in
respect of aperson’s services
as a director,whether of the
Company orits subsidiary
undertaking2016
Name
Salaries,allowances andbenefits in kind Bonuses
Retirementscheme
contributionsDirectors’/
Supervisors’ fee TotalRMB’000 RMB’000 RMB’000 RMB’000 RMB’000
Directors Wang Yupu — — — — —Dai Houliang 214 459 72 — 745Wang Zhigang 196 431 72 — 699Zhang Haichao — — — — —Jiao Fangzheng — — — — —Ma Yongsheng(i) — — — — —Li Chunguang(i) 130 379 47 — 556Zhang Jianhua(i) 114 365 41 — 520Independent directors Jiang Xiaoming — — — 300 300Andrew Y. Yan — — — 300 300Tang Min — — — 300 300Fan Gang — — — 300 300Supervisors Liu Yun — — — — —Liu Zhongyun — — — — —Zhou Hengyou — — — — —Zou Huiping 218 334 67 — 619Jiang Zhenying 218 334 67 — 619Yu Renming 218 309 67 — 594Wang Yajun 204 325 66 — 595Total 1,512 2,936 499 1,200 6,147
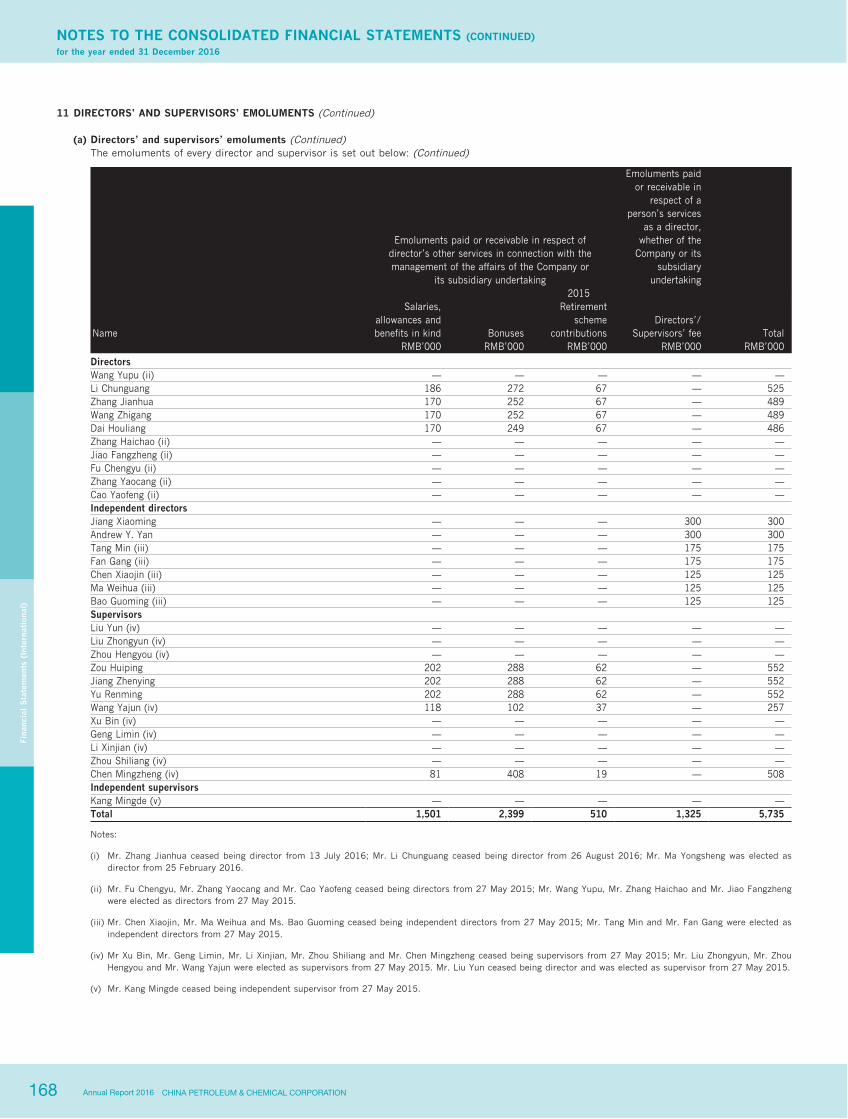
168 CHINA PETROLEUM & CHEMICAL CORPORATIONAnnual Report 2016
NOTES TO THE CONSOLIDATED FINANCIAL STATEMENTS (CONTINUED)for the year ended 31 December 2016
Fina
ncia
l S
tate
men
ts (
Inte
rnat
iona
l)
11 DIRECTORS’ AND SUPERVISORS’ EMOLUMENTS (Continued)
(a) Directors’ and supervisors’ emoluments (Continued) The emoluments of every director and supervisor is set out below: (Continued)
Emoluments paid or receivable in respect ofdirector’s other services in connection with the management of the affairs of the Company or
its subsidiary undertaking
Emoluments paidor receivable in
respect of aperson’s services
as a director,whether of the
Company or itssubsidiary
undertaking2015
Name
Salaries,allowances andbenefits in kind Bonuses
Retirementscheme
contributionsDirectors’/
Supervisors’ fee TotalRMB’000 RMB’000 RMB’000 RMB’000 RMB’000
Directors Wang Yupu (ii) — — — — —Li Chunguang 186 272 67 — 525Zhang Jianhua 170 252 67 — 489Wang Zhigang 170 252 67 — 489Dai Houliang 170 249 67 — 486Zhang Haichao (ii) — — — — —Jiao Fangzheng (ii) — — — — —Fu Chengyu (ii) — — — — —Zhang Yaocang (ii) — — — — —Cao Yaofeng (ii) — — — — —Independent directors Jiang Xiaoming — — — 300 300Andrew Y. Yan — — — 300 300Tang Min (iii) — — — 175 175Fan Gang (iii) — — — 175 175Chen Xiaojin (iii) — — — 125 125Ma Weihua (iii) — — — 125 125Bao Guoming (iii) — — — 125 125Supervisors Liu Yun (iv) — — — — —Liu Zhongyun (iv) — — — — —Zhou Hengyou (iv) — — — — —Zou Huiping 202 288 62 — 552Jiang Zhenying 202 288 62 — 552Yu Renming 202 288 62 — 552Wang Yajun (iv) 118 102 37 — 257Xu Bin (iv) — — — — —Geng Limin (iv) — — — — —Li Xinjian (iv) — — — — —Zhou Shiliang (iv) — — — — —Chen Mingzheng (iv) 81 408 19 — 508Independent supervisors Kang Mingde (v) — — — — —Total 1,501 2,399 510 1,325 5,735
Notes:
(i) Mr. Zhang Jianhua ceased being director from 13 July 2016; Mr. Li Chunguang ceased being director from 26 August 2016; Mr. Ma Yongsheng was elected as director from 25 February 2016.
(ii) Mr. Fu Chengyu, Mr. Zhang Yaocang and Mr. Cao Yaofeng ceased being directors from 27 May 2015; Mr. Wang Yupu, Mr. Zhang Haichao and Mr. Jiao Fangzheng were elected as directors from 27 May 2015.
(iii) Mr. Chen Xiaojin, Mr. Ma Weihua and Ms. Bao Guoming ceased being independent directors from 27 May 2015; Mr. Tang Min and Mr. Fan Gang were elected as independent directors from 27 May 2015.
(iv) Mr Xu Bin, Mr. Geng Limin, Mr. Li Xinjian, Mr. Zhou Shiliang and Mr. Chen Mingzheng ceased being supervisors from 27 May 2015; Mr. Liu Zhongyun, Mr. Zhou Hengyou and Mr. Wang Yajun were elected as supervisors from 27 May 2015. Mr. Liu Yun ceased being director and was elected as supervisor from 27 May 2015.
(v) Mr. Kang Mingde ceased being independent supervisor from 27 May 2015.
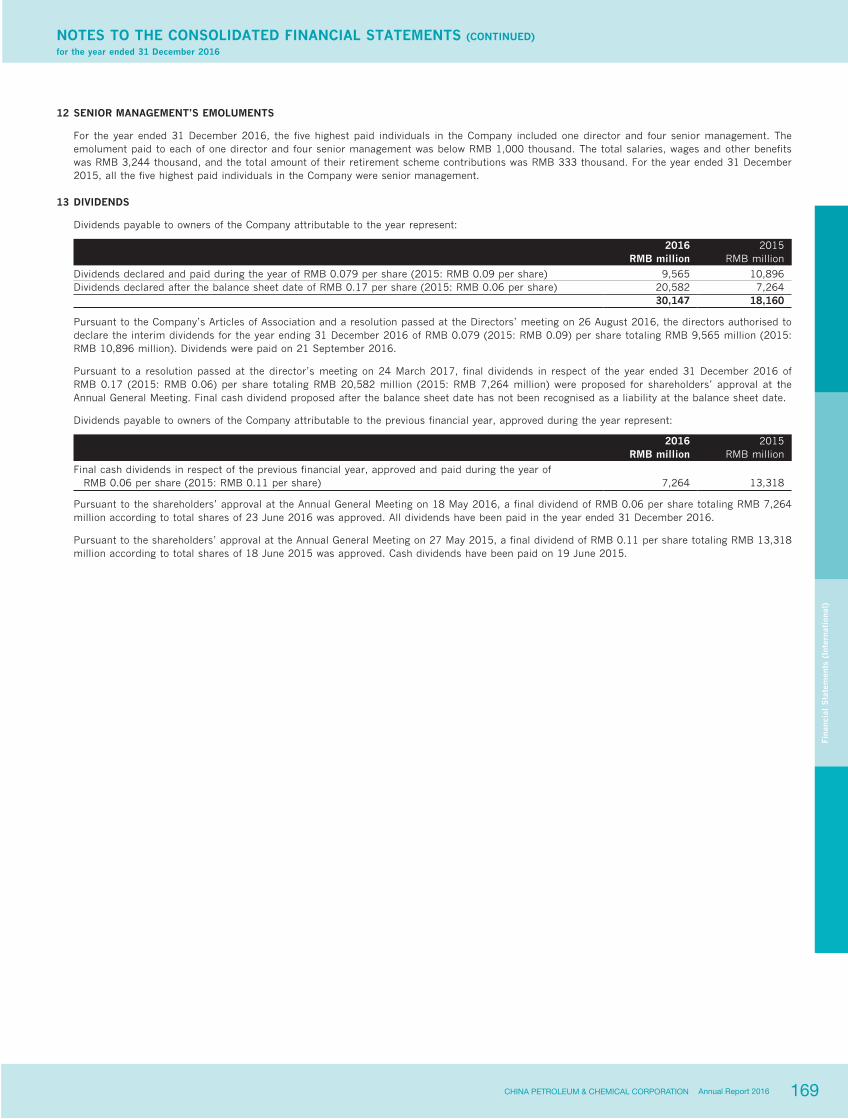
169CHINA PETROLEUM & CHEMICAL CORPORATION Annual Report 2016
NOTES TO THE CONSOLIDATED FINANCIAL STATEMENTS (CONTINUED)for the year ended 31 December 2016
Fina
ncia
l S
tate
men
ts (
Inte
rnat
iona
l)
12 SENIOR MANAGEMENT’S EMOLUMENTS
For the year ended 31 December 2016, the five highest paid individuals in the Company included one director and four senior management. The emolument paid to each of one director and four senior management was below RMB 1,000 thousand. The total salaries, wages and other benefits was RMB 3,244 thousand, and the total amount of their retirement scheme contributions was RMB 333 thousand. For the year ended 31 December 2015, all the five highest paid individuals in the Company were senior management.
13 DIVIDENDS
Dividends payable to owners of the Company attributable to the year represent:
2016 2015RMB million RMB million
Dividends declared and paid during the year of RMB 0.079 per share (2015: RMB 0.09 per share) 9,565 10,896Dividends declared after the balance sheet date of RMB 0.17 per share (2015: RMB 0.06 per share) 20,582 7,264 30,147 18,160
Pursuant to the Company’s Articles of Association and a resolution passed at the Directors’ meeting on 26 August 2016, the directors authorised to declare the interim dividends for the year ending 31 December 2016 of RMB 0.079 (2015: RMB 0.09) per share totaling RMB 9,565 million (2015: RMB 10,896 million). Dividends were paid on 21 September 2016.
Pursuant to a resolution passed at the director’s meeting on 24 March 2017, final dividends in respect of the year ended 31 December 2016 of RMB 0.17 (2015: RMB 0.06) per share totaling RMB 20,582 million (2015: RMB 7,264 million) were proposed for shareholders’ approval at the Annual General Meeting. Final cash dividend proposed after the balance sheet date has not been recognised as a liability at the balance sheet date.
Dividends payable to owners of the Company attributable to the previous financial year, approved during the year represent:
2016 2015RMB million RMB million
Final cash dividends in respect of the previous financial year, approved and paid during the year of RMB 0.06 per share (2015: RMB 0.11 per share) 7,264 13,318
Pursuant to the shareholders’ approval at the Annual General Meeting on 18 May 2016, a final dividend of RMB 0.06 per share totaling RMB 7,264 million according to total shares of 23 June 2016 was approved. All dividends have been paid in the year ended 31 December 2016.
Pursuant to the shareholders’ approval at the Annual General Meeting on 27 May 2015, a final dividend of RMB 0.11 per share totaling RMB 13,318 million according to total shares of 18 June 2015 was approved. Cash dividends have been paid on 19 June 2015.
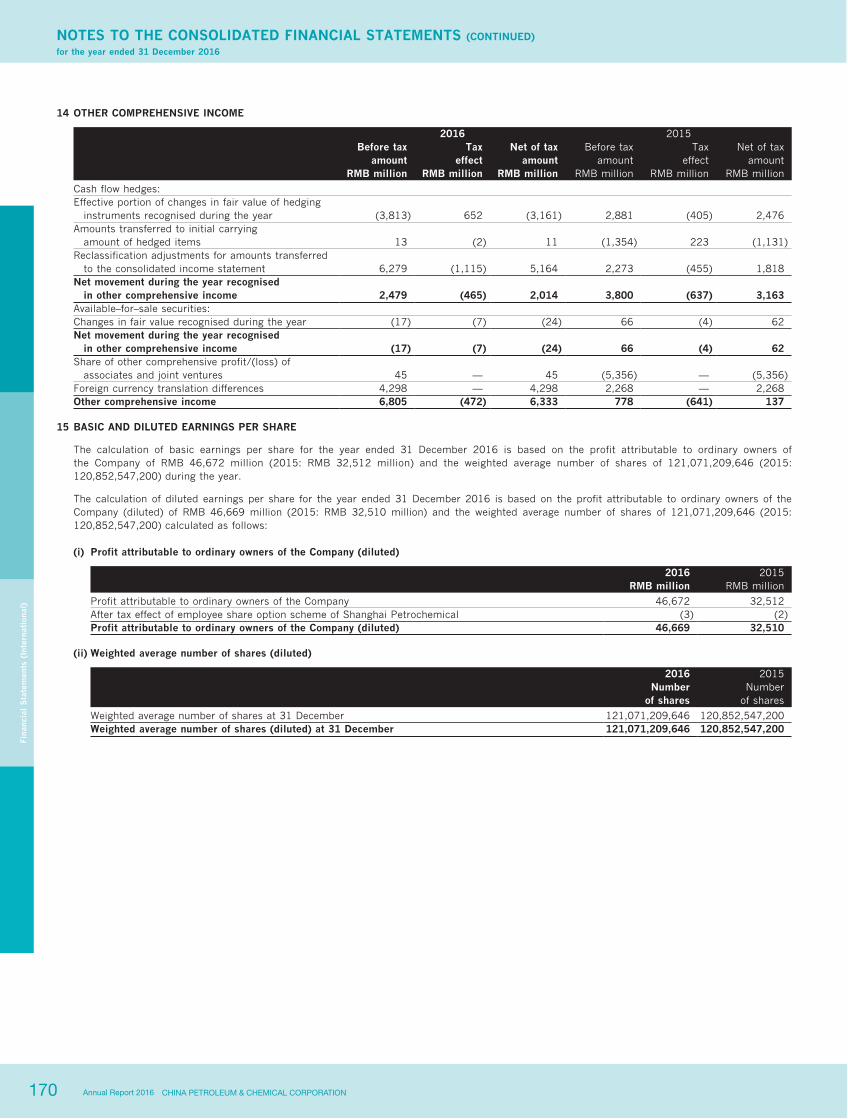
170 CHINA PETROLEUM & CHEMICAL CORPORATIONAnnual Report 2016
NOTES TO THE CONSOLIDATED FINANCIAL STATEMENTS (CONTINUED)for the year ended 31 December 2016
Fina
ncia
l S
tate
men
ts (
Inte
rnat
iona
l)
14 OTHER COMPREHENSIVE INCOME
2016 2015Before tax Tax Net of tax Before tax Tax Net of tax
amount effect amount amount effect amountRMB million RMB million RMB million RMB million RMB million RMB million
Cash flow hedges: Effective portion of changes in fair value of hedging instruments recognised during the year (3,813) 652 (3,161) 2,881 (405) 2,476Amounts transferred to initial carrying amount of hedged items 13 (2) 11 (1,354) 223 (1,131)Reclassification adjustments for amounts transferred to the consolidated income statement 6,279 (1,115) 5,164 2,273 (455) 1,818Net movement during the year recognised in other comprehensive income 2,479 (465) 2,014 3,800 (637) 3,163Available–for–sale securities: Changes in fair value recognised during the year (17) (7) (24) 66 (4) 62Net movement during the year recognised in other comprehensive income (17) (7) (24) 66 (4) 62Share of other comprehensive profit/(loss) of associates and joint ventures 45 — 45 (5,356) — (5,356)Foreign currency translation differences 4,298 — 4,298 2,268 — 2,268Other comprehensive income 6,805 (472) 6,333 778 (641) 137
15 BASIC AND DILUTED EARNINGS PER SHARE
The calculation of basic earnings per share for the year ended 31 December 2016 is based on the profit attributable to ordinary owners of the Company of RMB 46,672 million (2015: RMB 32,512 million) and the weighted average number of shares of 121,071,209,646 (2015: 120,852,547,200) during the year.
The calculation of diluted earnings per share for the year ended 31 December 2016 is based on the profit attributable to ordinary owners of the Company (diluted) of RMB 46,669 million (2015: RMB 32,510 million) and the weighted average number of shares of 121,071,209,646 (2015: 120,852,547,200) calculated as follows:
(i) Profit attributable to ordinary owners of the Company (diluted)
2016 2015RMB million RMB million
Profit attributable to ordinary owners of the Company 46,672 32,512After tax effect of employee share option scheme of Shanghai Petrochemical (3) (2)Profit attributable to ordinary owners of the Company (diluted) 46,669 32,510
(ii) Weighted average number of shares (diluted)
2016 2015Number
of sharesNumber
of shares
Weighted average number of shares at 31 December 121,071,209,646 120,852,547,200Weighted average number of shares (diluted) at 31 December 121,071,209,646 120,852,547,200

171CHINA PETROLEUM & CHEMICAL CORPORATION Annual Report 2016
NOTES TO THE CONSOLIDATED FINANCIAL STATEMENTS (CONTINUED)for the year ended 31 December 2016
Fina
ncia
l S
tate
men
ts (
Inte
rnat
iona
l)
16 PROPERTY, PLANT AND EQUIPMENT
Equipment,Plants and Oil and gas, machinery
buildings properties and others TotalRMB million RMB million RMB million RMB million
Cost: Balance at 1 January 2015 101,648 569,172 815,123 1,485,943Additions 268 2,899 565 3,732Transferred from construction in progress 4,928 39,949 74,594 119,471Reclassifications 1,780 (1,008) (772) —Contribution to associates and joint ventures (4) — (8) (12)Reclassification to lease prepayments and other long–term assets (380) — (1,170) (1,550)Disposals (479) (79) (7,778) (8,336)Exchange adjustments 112 2,201 157 2,470Balance at 31 December 2015 107,873 613,134 880,711 1,601,718Balance at 1 January 2016 107,873 613,134 880,711 1,601,718Additions 277 3,420 626 4,323Transferred from construction in progress 5,901 31,473 50,025 87,399Reclassifications 1,426 (115) (1,311) —Reclassification to lease prepayments and other long–term assets (130) — (2,202) (2,332)Disposals (509) (27) (35,100) (35,636)Exchange adjustments 82 2,800 187 3,069Balance at 31 December 2016 114,920 650,685 892,936 1,658,541Accumulated depreciation: Balance at 1 January 2015 40,523 329,267 411,871 781,661Depreciation for the year 3,541 40,200 44,078 87,819Impairment losses for the year 32 4,213 130 4,375Reclassifications 679 (766) 87 —Contribution to associates and joint ventures — — (4) (4)Reclassification to lease prepayments and other long–term assets (68) (2) (86) (156)Written back on disposals (278) (65) (6,533) (6,876)Exchange adjustments 40 1,344 66 1,450Balance at 31 December 2015 44,469 374,191 449,609 868,269Balance at 1 January 2016 44,469 374,191 449,609 868,269Depreciation for the year 3,815 49,005 47,914 100,734Impairment losses for the year 440 10,580 3,901 14,921Reclassifications 369 (58) (311) —Reclassification to lease prepayments and other long–term assets (14) — (316) (330)Written back on disposals (534) (22) (17,067) (17,623)Exchange adjustments 27 1,865 84 1,976Balance at 31 December 2016 48,572 435,561 483,814 967,947Net book value: Balance at 1 January 2015 61,125 239,905 403,252 704,282Balance at 31 December 2015 63,404 238,943 431,102 733,449Balance at 31 December 2016 66,348 215,124 409,122 690,594
The additions to oil and gas properties of the Group for the year ended 31 December 2016 included RMB 3,420 million (2015: RMB 2,899 million) of estimated dismantlement costs for site restoration (Note 31).
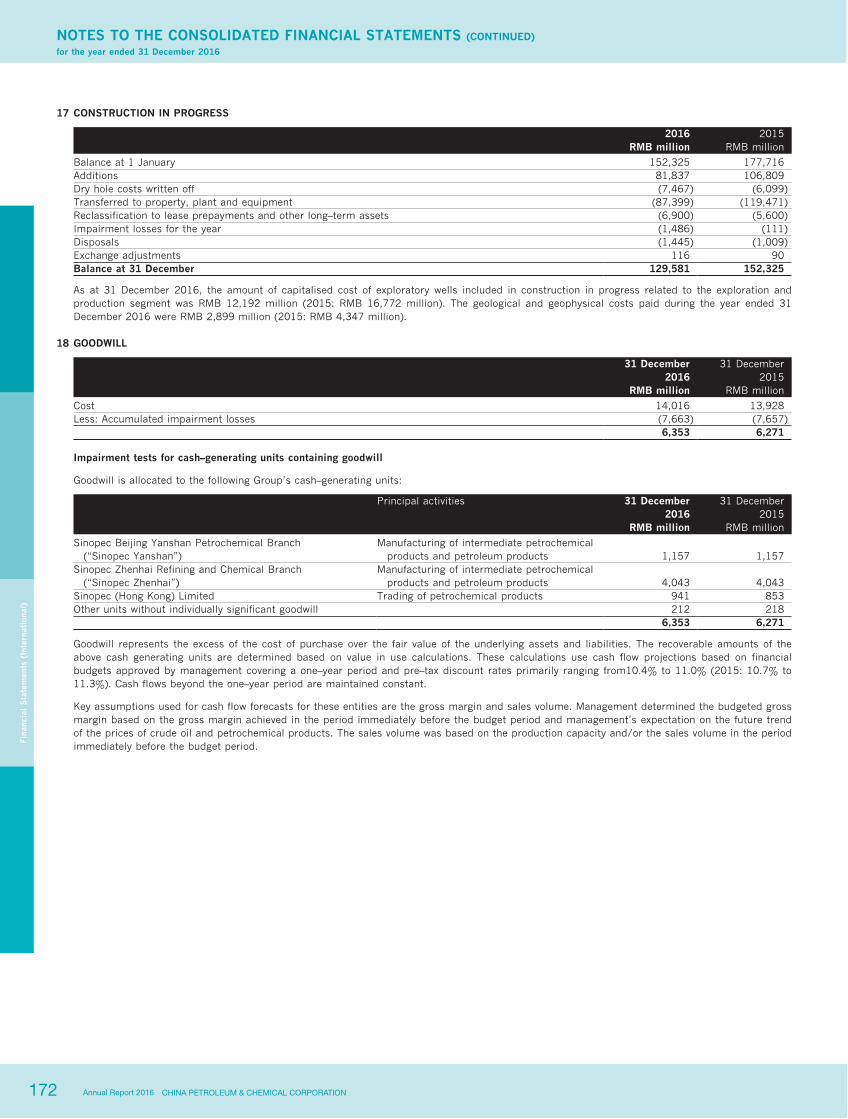
172 CHINA PETROLEUM & CHEMICAL CORPORATIONAnnual Report 2016
NOTES TO THE CONSOLIDATED FINANCIAL STATEMENTS (CONTINUED)for the year ended 31 December 2016
Fina
ncia
l S
tate
men
ts (
Inte
rnat
iona
l)
17 CONSTRUCTION IN PROGRESS
2016 2015RMB million RMB million
Balance at 1 January 152,325 177,716Additions 81,837 106,809Dry hole costs written off (7,467) (6,099)Transferred to property, plant and equipment (87,399) (119,471)Reclassification to lease prepayments and other long–term assets (6,900) (5,600)Impairment losses for the year (1,486) (111)Disposals (1,445) (1,009)Exchange adjustments 116 90Balance at 31 December 129,581 152,325
As at 31 December 2016, the amount of capitalised cost of exploratory wells included in construction in progress related to the exploration and production segment was RMB 12,192 million (2015: RMB 16,772 million). The geological and geophysical costs paid during the year ended 31 December 2016 were RMB 2,899 million (2015: RMB 4,347 million).
18 GOODWILL
31 December 31 December2016 2015
RMB million RMB million
Cost 14,016 13,928Less: Accumulated impairment losses (7,663) (7,657) 6,353 6,271
Impairment tests for cash–generating units containing goodwill
Goodwill is allocated to the following Group’s cash–generating units:
Principal activities 31 December 31 December2016 2015
RMB million RMB million
Sinopec Beijing Yanshan Petrochemical Branch (“Sinopec Yanshan”)
Manufacturing of intermediate petrochemical products and petroleum products 1,157 1,157
Sinopec Zhenhai Refining and Chemical Branch (“Sinopec Zhenhai”)
Manufacturing of intermediate petrochemical products and petroleum products 4,043 4,043
Sinopec (Hong Kong) Limited Trading of petrochemical products 941 853Other units without individually significant goodwill 212 218 6,353 6,271
Goodwill represents the excess of the cost of purchase over the fair value of the underlying assets and liabilities. The recoverable amounts of the above cash generating units are determined based on value in use calculations. These calculations use cash flow projections based on financial budgets approved by management covering a one–year period and pre–tax discount rates primarily ranging from10.4% to 11.0% (2015: 10.7% to 11.3%). Cash flows beyond the one–year period are maintained constant.
Key assumptions used for cash flow forecasts for these entities are the gross margin and sales volume. Management determined the budgeted gross margin based on the gross margin achieved in the period immediately before the budget period and management’s expectation on the future trend of the prices of crude oil and petrochemical products. The sales volume was based on the production capacity and/or the sales volume in the period immediately before the budget period.

173CHINA PETROLEUM & CHEMICAL CORPORATION Annual Report 2016
NOTES TO THE CONSOLIDATED FINANCIAL STATEMENTS (CONTINUED)for the year ended 31 December 2016
Fina
ncia
l S
tate
men
ts (
Inte
rnat
iona
l)
19 INTEREST IN ASSOCIATES
The Group’s investments in associates are with companies primarily engaged in the oil and gas, petrochemical, and marketing and distribution operations in the PRC.
The Group’s principal associates are as follows:
Name of company
% ofownership
interests Principal activitiesMeasurementmethod
Country ofincorporation
Principal placeof business
Sinopec Sichuan To East China Gas Pipeline Co., Ltd. (“Pipeline Ltd”)
50.00 Operation of natural gas pipelines and auxiliary
Equity method PRC PRC
facilities Sinopec Finance Company Limited 49.00 Provision of non-banking Equity method PRC PRC (“Sinopec Finance”) financial services Zhongtian Synergetic Energy Company Limited
38.75 Manufacturing of coal-chemical products
Equity method PRC PRC
(“Zhongtian Synergetic Energy”) China Aviation Oil Supply Company Limited
29.00 Marketing and distribution of refined petroleum
Equity method PRC PRC
(“China Aviation Oil”) products Caspian Investments Resources Ltd. (“CIR”) (i)
50.00
Crude oil and natural gas extraction
Equity method
British Virgin Islands
The Republic of Kazakhstan
Summarised financial information and reconciliation to their carrying amounts in respect of the Group’s principal associates:
Pipeline Ltd (ii) Sinopec Finance Zhongtian Synergetic Energy China Aviation Oil CIR (i)31 December 31 December 31 December 31 December 31 December 31 December 31 December 31 December 31 December
2016 2016 2015 2016 2015 2016 2015 2016 2015RMB million RMB million RMB million RMB million RMB million RMB million RMB million RMB million RMB million
Current assets 11,835 149,457 154,437 7,292 10,168 13,115 8,240 5,120 4,826Non-current assets 25,395 16,478 15,739 50,301 37,571 5,671 5,220 3,842 7,768Current liabilities (5,009) (142,386) (147,952) (8,078) (16,536) (6,297) (4,717) (928) (1,305)Non-current liabilities (4) (88) (114) (32,137) (15,407) (417) (321) (883) (1,282)Net assets 32,217 23,461 22,110 17,378 15,796 (12,072) 8,422 7,151 10,007
Net assets attributable to owners of the Company 32,217 23,461 22,110 17,378 15,796 10,743 7,438 7,151 10,007Net assets attributable to non-controlling interests — — — — — 1,329 984 — —
Share of net assets from associates 16,109 11,496 10,834 6,734 6,121 3,115 2,157 3,576 5,004Others (iii) 6,691 — — — — — — — —Carrying Amounts 22,800 11,496 10,834 6,734 6,121 3,115 2,157 3,576 5,004
Summarised statement of comprehensive income
Year ended 31 December Pipeline Ltd (ii, iv) Sinopec Finance Zhongtian Synergetic Energy (v) China Aviation Oil CIR (i)2016 2016 2015 2016 2015 2016 2015 2016 2015
RMB million RMB million RMB million RMB million RMB million RMB million RMB million RMB million RMB millionTurnover 191 2,442 2,533 — — 74,622 78,623 2,205 687Profit/(loss) for the year 51 1,526 3,484 — — 3,630 2,248 (3,518) (90)Other comprehensive (loss)/income — (175) 28 — — — — 662 (4,017)Total comprehensive income/(loss) 51 1,351 3,512 — — 3,630 2,248 (2,856) (4,107)Dividends declared by associates 23 — — — — — 336 — —Share of profit/(loss) from associates 26 748 1,707 — — 892 495 (1,759) (45)Share of other comprehensive (loss)/income from associates — (86) 14 — — — — 331 (2,009)
The share of profit and other comprehensive loss for the year ended 31 December 2016 in all individually immaterial associates accounted for using equity method in aggregate was RMB 1,977 million (2015: RMB 1,418 million) and RMB 384 million (2015: RMB 632 million) respectively. As at 31 December 2016, the carrying amount of all individually immaterial associates accounted for using equity method in aggregate was RMB 18,395 million (2015: RMB 16,596 million).
Note:
(i) In August 2015, one of the subsidiaries of Sinopec Group Company completed the acquisition from LUKOIL OVERSEAS WEST PROJECT Ltd. a 50% equity interests in CIR and revised CIR’s Articles of Association subsequently. According to the revised CIR’s Articles of Association, the Group retained significant influences over CIR. As a result, the Group reclassified the investment interest in CIR from joint ventures to associates. The summarized statement of comprehensive income for the year 2015 of CIR represents the operating result for the period from the date when the Group reclassified the investment interest in CIR from joint ventures to associates to 31 December 2015.
(ii) Management is in the process of allocating the fair value to identifiable assets and liabilities of Pipeline Ltd, therefore the summarised financial information of Pipeline Ltd is based on management’s preliminary fair value allocation which may be subject to further change.
(iii) Other reflects the excess of fair value of the consideration transferred over the Group’s share of the fair value of the investee’s identifiable assets and liabilities as of the transaction date.
(iv) The summarised statement of comprehensive income of Pipeline Ltd represents the operating results of the Pipeline Ltd for the period from the date when the Group lost control to 31 December 2016 (Note 8(i)).
(v) The main asset of Zhongtian Synergetic Energy was under construction during the year ended 31 December 2016.
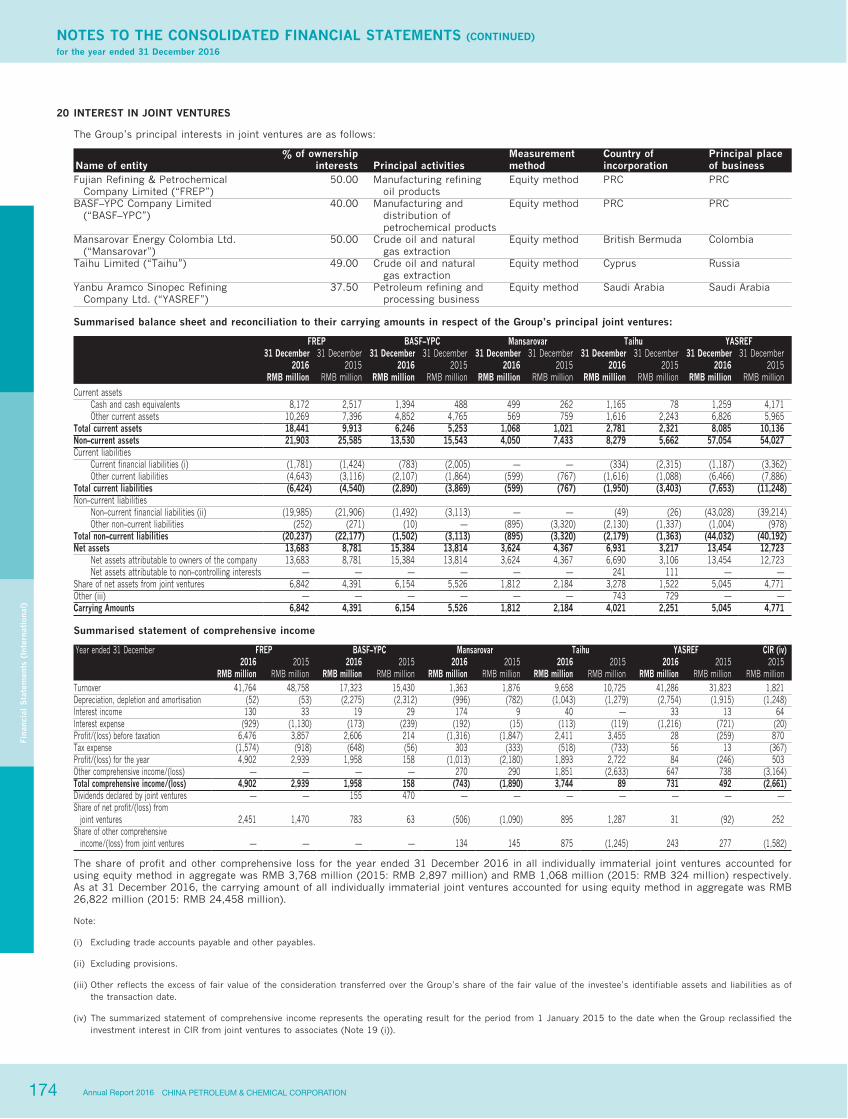
174 CHINA PETROLEUM & CHEMICAL CORPORATIONAnnual Report 2016
NOTES TO THE CONSOLIDATED FINANCIAL STATEMENTS (CONTINUED)for the year ended 31 December 2016
Fina
ncia
l S
tate
men
ts (
Inte
rnat
iona
l)
20 INTEREST IN JOINT VENTURES
The Group’s principal interests in joint ventures are as follows:
Name of entity% of ownership
interests Principal activitiesMeasurementmethod
Country ofincorporation
Principal placeof business
Fujian Refining & Petrochemical Company Limited (“FREP”)
50.00
Manufacturing refining oil products
Equity method
PRC
PRC
BASF–YPC Company Limited (“BASF–YPC”)
40.00
Manufacturing and distribution of petrochemical products
Equity method
PRC
PRC
Mansarovar Energy Colombia Ltd. (“Mansarovar”)
50.00
Crude oil and natural gas extraction
Equity method
British Bermuda
Colombia
Taihu Limited (“Taihu”)
49.00
Crude oil and natural gas extraction
Equity method
Cyprus
Russia
Yanbu Aramco Sinopec Refining Company Ltd. (“YASREF”)
37.50
Petroleum refining and processing business
Equity method
Saudi Arabia
Saudi Arabia
Summarised balance sheet and reconciliation to their carrying amounts in respect of the Group’s principal joint ventures:
FREP BASF–YPC Mansarovar Taihu YASREF31 December
201631 December
201531 December
201631 December
201531 December
201631 December
201531 December
201631 December
201531 December
201631 December
2015RMB million RMB million RMB million RMB million RMB million RMB million RMB million RMB million RMB million RMB million
Current assets Cash and cash equivalents 8,172 2,517 1,394 488 499 262 1,165 78 1,259 4,171Other current assets 10,269 7,396 4,852 4,765 569 759 1,616 2,243 6,826 5,965
Total current assets 18,441 9,913 6,246 5,253 1,068 1,021 2,781 2,321 8,085 10,136Non–current assets 21,903 25,585 13,530 15,543 4,050 7,433 8,279 5,662 57,054 54,027Current liabilities
Current financial liabilities (i) (1,781) (1,424) (783) (2,005) — — (334) (2,315) (1,187) (3,362)Other current liabilities (4,643) (3,116) (2,107) (1,864) (599) (767) (1,616) (1,088) (6,466) (7,886)
Total current liabilities (6,424) (4,540) (2,890) (3,869) (599) (767) (1,950) (3,403) (7,653) (11,248)Non–current liabilities
Non–current financial liabilities (ii) (19,985) (21,906) (1,492) (3,113) — — (49) (26) (43,028) (39,214)Other non–current liabilities (252) (271) (10) — (895) (3,320) (2,130) (1,337) (1,004) (978)
Total non–current liabilities (20,237) (22,177) (1,502) (3,113) (895) (3,320) (2,179) (1,363) (44,032) (40,192)Net assets 13,683 8,781 15,384 13,814 3,624 4,367 6,931 3,217 13,454 12,723
Net assets attributable to owners of the company 13,683 8,781 15,384 13,814 3,624 4,367 6,690 3,106 13,454 12,723Net assets attributable to non–controlling interests — — — — — — 241 111 — —
Share of net assets from joint ventures 6,842 4,391 6,154 5,526 1,812 2,184 3,278 1,522 5,045 4,771Other (iii) — — — — — — 743 729 — —Carrying Amounts 6,842 4,391 6,154 5,526 1,812 2,184 4,021 2,251 5,045 4,771
Summarised statement of comprehensive income
Year ended 31 December FREP BASF–YPC Mansarovar Taihu YASREF CIR (iv)2016 2015 2016 2015 2016 2015 2016 2015 2016 2015 2015
RMB million RMB million RMB million RMB million RMB million RMB million RMB million RMB million RMB million RMB million RMB millionTurnover 41,764 48,758 17,323 15,430 1,363 1,876 9,658 10,725 41,286 31,823 1,821Depreciation, depletion and amortisation (52) (53) (2,275) (2,312) (996) (782) (1,043) (1,279) (2,754) (1,915) (1,248)Interest income 130 33 19 29 174 9 40 — 33 13 64Interest expense (929) (1,130) (173) (239) (192) (15) (113) (119) (1,216) (721) (20)Profit/(loss) before taxation 6,476 3,857 2,606 214 (1,316) (1,847) 2,411 3,455 28 (259) 870Tax expense (1,574) (918) (648) (56) 303 (333) (518) (733) 56 13 (367)Profit/(loss) for the year 4,902 2,939 1,958 158 (1,013) (2,180) 1,893 2,722 84 (246) 503Other comprehensive income/(loss) — — — — 270 290 1,851 (2,633) 647 738 (3,164)Total comprehensive income/(loss) 4,902 2,939 1,958 158 (743) (1,890) 3,744 89 731 492 (2,661)Dividends declared by joint ventures — — 155 470 — — — — — — —Share of net profit/(loss) from joint ventures 2,451 1,470 783 63 (506) (1,090) 895 1,287 31 (92) 252Share of other comprehensive income/(loss) from joint ventures — — — — 134 145 875 (1,245) 243 277 (1,582)
The share of profit and other comprehensive loss for the year ended 31 December 2016 in all individually immaterial joint ventures accounted for using equity method in aggregate was RMB 3,768 million (2015: RMB 2,897 million) and RMB 1,068 million (2015: RMB 324 million) respectively. As at 31 December 2016, the carrying amount of all individually immaterial joint ventures accounted for using equity method in aggregate was RMB 26,822 million (2015: RMB 24,458 million).
Note:
(i) Excluding trade accounts payable and other payables.
(ii) Excluding provisions.
(iii) Other reflects the excess of fair value of the consideration transferred over the Group’s share of the fair value of the investee’s identifiable assets and liabilities as of the transaction date.
(iv) The summarized statement of comprehensive income represents the operating result for the period from 1 January 2015 to the date when the Group reclassified the investment interest in CIR from joint ventures to associates (Note 19 (i)).
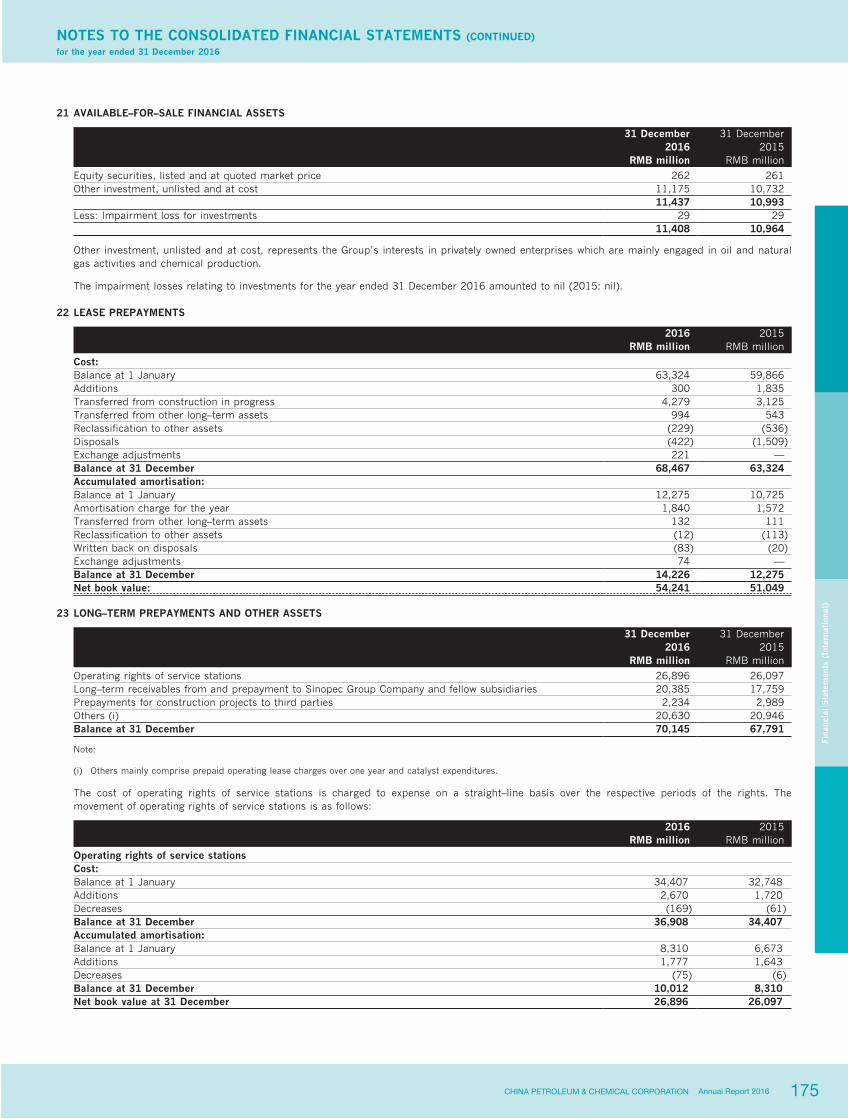
175CHINA PETROLEUM & CHEMICAL CORPORATION Annual Report 2016
NOTES TO THE CONSOLIDATED FINANCIAL STATEMENTS (CONTINUED)for the year ended 31 December 2016
Fina
ncia
l S
tate
men
ts (
Inte
rnat
iona
l)
21 AVAILABLE–FOR–SALE FINANCIAL ASSETS
31 December 31 December2016 2015
RMB million RMB million
Equity securities, listed and at quoted market price 262 261Other investment, unlisted and at cost 11,175 10,732 11,437 10,993Less: Impairment loss for investments 29 29 11,408 10,964
Other investment, unlisted and at cost, represents the Group’s interests in privately owned enterprises which are mainly engaged in oil and natural gas activities and chemical production.
The impairment losses relating to investments for the year ended 31 December 2016 amounted to nil (2015: nil).
22 LEASE PREPAYMENTS
2016 2015RMB million RMB million
Cost: Balance at 1 January 63,324 59,866Additions 300 1,835Transferred from construction in progress 4,279 3,125Transferred from other long–term assets 994 543Reclassification to other assets (229) (536)Disposals (422) (1,509)Exchange adjustments 221 —Balance at 31 December 68,467 63,324Accumulated amortisation: Balance at 1 January 12,275 10,725Amortisation charge for the year 1,840 1,572Transferred from other long–term assets 132 111Reclassification to other assets (12) (113)Written back on disposals (83) (20)Exchange adjustments 74 —Balance at 31 December 14,226 12,275Net book value: 54,241 51,049
23 LONG–TERM PREPAYMENTS AND OTHER ASSETS
31 December 31 December2016 2015
RMB million RMB million
Operating rights of service stations 26,896 26,097Long–term receivables from and prepayment to Sinopec Group Company and fellow subsidiaries 20,385 17,759Prepayments for construction projects to third parties 2,234 2,989Others (i) 20,630 20,946Balance at 31 December 70,145 67,791
Note:
(i) Others mainly comprise prepaid operating lease charges over one year and catalyst expenditures.
The cost of operating rights of service stations is charged to expense on a straight–line basis over the respective periods of the rights. The movement of operating rights of service stations is as follows:
2016 2015RMB million RMB million
Operating rights of service stations Cost: Balance at 1 January 34,407 32,748Additions 2,670 1,720Decreases (169) (61)Balance at 31 December 36,908 34,407Accumulated amortisation: Balance at 1 January 8,310 6,673Additions 1,777 1,643Decreases (75) (6)Balance at 31 December 10,012 8,310Net book value at 31 December 26,896 26,097
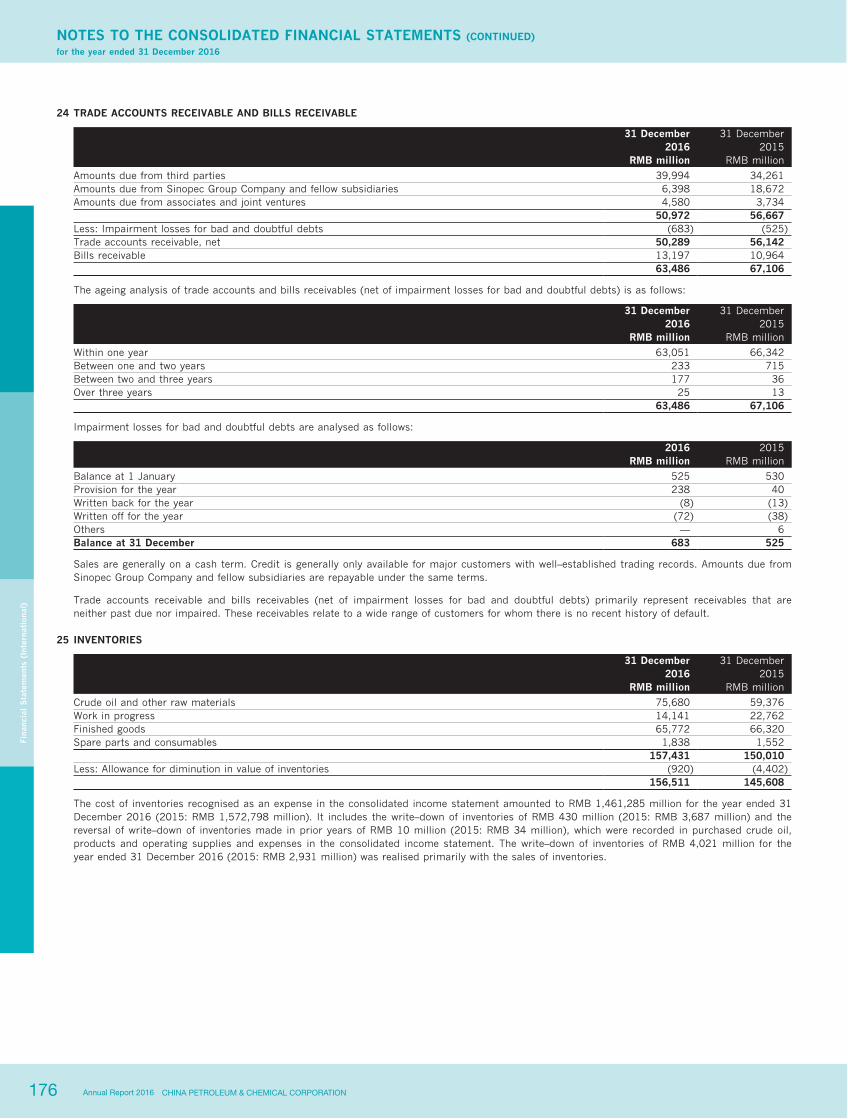
176 CHINA PETROLEUM & CHEMICAL CORPORATIONAnnual Report 2016
NOTES TO THE CONSOLIDATED FINANCIAL STATEMENTS (CONTINUED)for the year ended 31 December 2016
Fina
ncia
l S
tate
men
ts (
Inte
rnat
iona
l)
24 TRADE ACCOUNTS RECEIVABLE AND BILLS RECEIVABLE
31 December 31 December2016 2015
RMB million RMB million
Amounts due from third parties 39,994 34,261Amounts due from Sinopec Group Company and fellow subsidiaries 6,398 18,672Amounts due from associates and joint ventures 4,580 3,734 50,972 56,667Less: Impairment losses for bad and doubtful debts (683) (525)Trade accounts receivable, net 50,289 56,142Bills receivable 13,197 10,964 63,486 67,106
The ageing analysis of trade accounts and bills receivables (net of impairment losses for bad and doubtful debts) is as follows:
31 December 31 December2016 2015
RMB million RMB million
Within one year 63,051 66,342Between one and two years 233 715Between two and three years 177 36Over three years 25 13 63,486 67,106
Impairment losses for bad and doubtful debts are analysed as follows:
2016 2015RMB million RMB million
Balance at 1 January 525 530Provision for the year 238 40Written back for the year (8) (13)Written off for the year (72) (38)Others — 6Balance at 31 December 683 525
Sales are generally on a cash term. Credit is generally only available for major customers with well–established trading records. Amounts due from Sinopec Group Company and fellow subsidiaries are repayable under the same terms.
Trade accounts receivable and bills receivables (net of impairment losses for bad and doubtful debts) primarily represent receivables that are neither past due nor impaired. These receivables relate to a wide range of customers for whom there is no recent history of default.
25 INVENTORIES
31 December 31 December2016 2015
RMB million RMB million
Crude oil and other raw materials 75,680 59,376Work in progress 14,141 22,762Finished goods 65,772 66,320Spare parts and consumables 1,838 1,552 157,431 150,010Less: Allowance for diminution in value of inventories (920) (4,402) 156,511 145,608
The cost of inventories recognised as an expense in the consolidated income statement amounted to RMB 1,461,285 million for the year ended 31 December 2016 (2015: RMB 1,572,798 million). It includes the write–down of inventories of RMB 430 million (2015: RMB 3,687 million) and the reversal of write–down of inventories made in prior years of RMB 10 million (2015: RMB 34 million), which were recorded in purchased crude oil, products and operating supplies and expenses in the consolidated income statement. The write–down of inventories of RMB 4,021 million for the year ended 31 December 2016 (2015: RMB 2,931 million) was realised primarily with the sales of inventories.

177CHINA PETROLEUM & CHEMICAL CORPORATION Annual Report 2016
NOTES TO THE CONSOLIDATED FINANCIAL STATEMENTS (CONTINUED)for the year ended 31 December 2016
Fina
ncia
l S
tate
men
ts (
Inte
rnat
iona
l)
26 PREPAID EXPENSES AND OTHER CURRENT ASSETS
31 December 31 December2016 2015
RMB million RMB million
Other receivables 26,056 20,183Advances to suppliers 3,749 2,920Value–added input tax to be deducted 18,055 20,299Prepaid income tax 1,145 —Derivative financial instruments 762 7,875 49,767 51,277
27 DEFERRED TAX ASSETS AND LIABILITIES
Deferred tax assets and deferred tax liabilities before offset are attributable to the items detailed in the table below:
Deferred tax assets Deferred tax liabilities Net balance31 December 31 December 31 December 31 December 31 December 31 December
2016 2015 2016 2015 2016 2015RMB million RMB million RMB million RMB million RMB million RMB million
Current Receivables and inventories 347 1,755 — — 347 1,755Accruals 391 413 — — 391 413Cash flow hedges 27 348 (242) (98) (215) 250Non–current Property, plant and equipment 11,264 8,209 (14,615) (17,340) (3,351) (9,131)Tax losses carried forward 2,477 5,883 — — 2,477 5,883Others 133 98 (229) (58) (96) 40Deferred tax assets/(liabilities) 14,639 16,706 (15,086) (17,496) (447) (790)
At 31 December 2016, certain subsidiaries of the Company did not recognise deferred tax of deductible loss carried forward of RMB 19,194 million (2015: RMB 19,338 million), of which RMB 3,833 million (2015: RMB 4,080 million) was incurred for the year ended 31 December 2016, because it was not probable that the future taxable profits will be realised. These deductible losses carried forward of RMB 3,777 million, RMB 2,634 million, RMB 4,870 million, RMB 4,080 million and RMB 3,833 million will expire in 2017, 2018, 2019, 2020, 2021 and after, respectively.
Periodically, management performed assessment on the probability that future taxable profit will be available over the period which the deferred tax assets can be realised or utilised. In assessing the probability, both positive and negative evidence was considered, including whether it is probable that the operations will have sufficient future taxable profits over the periods which the deferred tax assets are deductible or utilised and whether the tax losses result from identifiable causes which are unlikely to recur. During the year ended 31 December 2016, write–down of deferred tax assets amounted to RMB 811 million (2015: RMB 75 million) (Note 10).

178 CHINA PETROLEUM & CHEMICAL CORPORATIONAnnual Report 2016
NOTES TO THE CONSOLIDATED FINANCIAL STATEMENTS (CONTINUED)for the year ended 31 December 2016
Fina
ncia
l S
tate
men
ts (
Inte
rnat
iona
l)
27 DEFERRED TAX ASSETS AND LIABILITIES (Continued)
Movements in the deferred tax assets and liabilities are as follows:
Recognised in Recognisedconsolidated in other
Balance at income comprehensive Balance at1 January 2015 statement income Others 31 December 2015
RMB million RMB million RMB million RMB million RMB million
Current Receivables and inventories 2,883 (1,131) 3 — 1,755Accruals 258 155 — — 413Cash flow hedges 887 — (637) — 250Non–current Property, plant and equipment (8,635) (113) (383) — (9,131)Tax losses carried forward 3,474 2,398 11 — 5,883Embedded derivative component of the convertible bonds 282 — — (282) —Available–for–sale securities 3 1 (4) — —Others 7 33 — — 40Net deferred tax liabilities (841) 1,343 (1,010) (282) (790)
Recognised in Recognisedconsolidated in other
Balance at income comprehensive Balance at1 January 2016 statement income Others 31 December 2016
RMB million RMB million RMB million RMB million RMB million
Current Receivables and inventories 1,755 (1,506) 6 92 347Accruals 413 (22) — — 391Cash flow hedges 250 — (465) — (215)Non–current Property, plant and equipment (9,131) 6,063 (392) 109 (3,351)Tax losses carried forward 5,883 (3,426) 20 — 2,477Available–for–sale securities — (139) (7) 146 —Others 40 (136) — — (96)Net deferred tax liabilities (790) 834 (838) 347 (447)
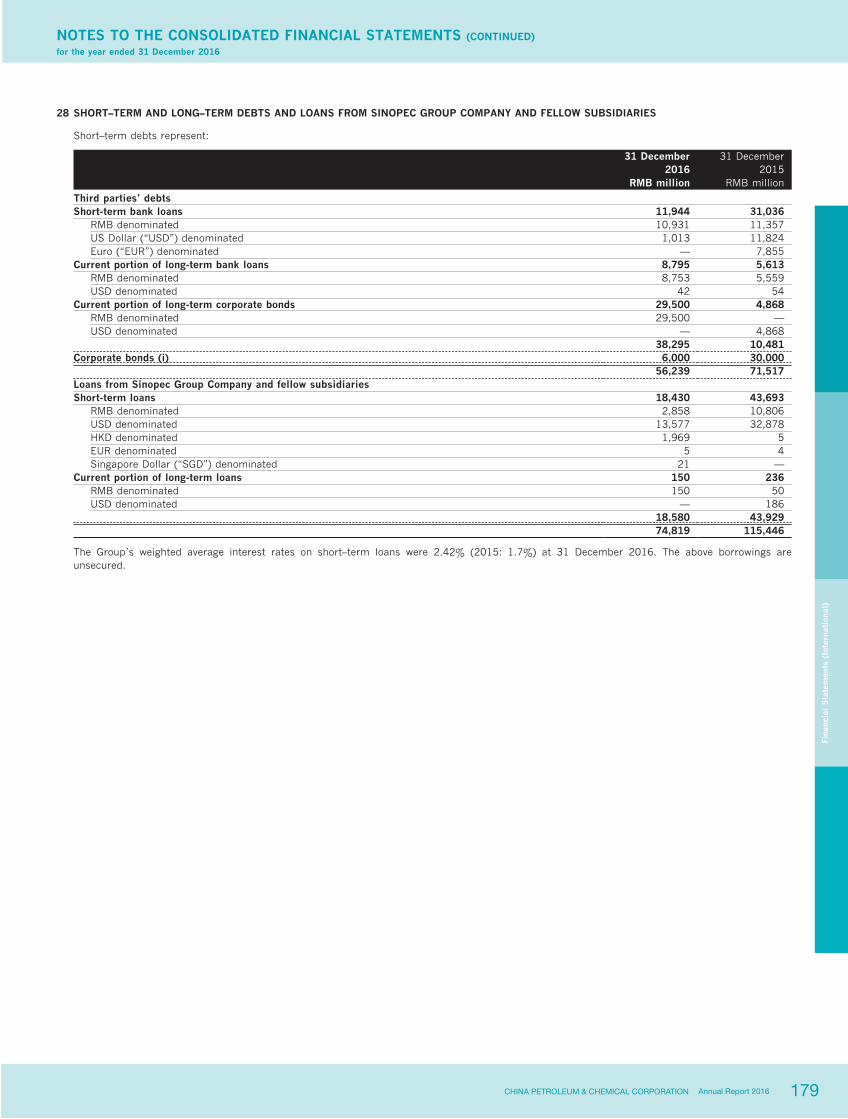
179CHINA PETROLEUM & CHEMICAL CORPORATION Annual Report 2016
NOTES TO THE CONSOLIDATED FINANCIAL STATEMENTS (CONTINUED)for the year ended 31 December 2016
Fina
ncia
l S
tate
men
ts (
Inte
rnat
iona
l)
28 SHORT–TERM AND LONG–TERM DEBTS AND LOANS FROM SINOPEC GROUP COMPANY AND FELLOW SUBSIDIARIES
Short–term debts represent:
31 December 31 December2016 2015
RMB million RMB million
Third parties’ debts Short-term bank loans 11,944 31,036
RMB denominated 10,931 11,357US Dollar (“USD”) denominated 1,013 11,824Euro (“EUR”) denominated — 7,855
Current portion of long-term bank loans 8,795 5,613RMB denominated 8,753 5,559USD denominated 42 54
Current portion of long-term corporate bonds 29,500 4,868RMB denominated 29,500 —USD denominated — 4,868
38,295 10,481Corporate bonds (i) 6,000 30,000 56,239 71,517Loans from Sinopec Group Company and fellow subsidiaries Short-term loans 18,430 43,693
RMB denominated 2,858 10,806USD denominated 13,577 32,878HKD denominated 1,969 5EUR denominated 5 4Singapore Dollar (“SGD”) denominated 21 —
Current portion of long-term loans 150 236RMB denominated 150 50USD denominated — 186
18,580 43,929 74,819 115,446
The Group’s weighted average interest rates on short–term loans were 2.42% (2015: 1.7%) at 31 December 2016. The above borrowings are unsecured.

180 CHINA PETROLEUM & CHEMICAL CORPORATIONAnnual Report 2016
NOTES TO THE CONSOLIDATED FINANCIAL STATEMENTS (CONTINUED)for the year ended 31 December 2016
Fina
ncia
l S
tate
men
ts (
Inte
rnat
iona
l)
28 SHORT–TERM AND LONG–TERM DEBTS AND LOANS FROM SINOPEC GROUP COMPANY AND FELLOW SUBSIDIARIES (Continued)
Long–term debts represent:
Interest rate and final maturity 31 December 31 December2016 2015
RMB million RMB million
Third parties’ debts Long-term bank loans
RMB denominated Interest rates ranging from 1.08% to 4.41% per annum at 31 December 2016
with maturities through 2030 26,058 17,345USD denominated Interest rates ranging from 1.30% to
4.29% per annum at 31 December 2016 with maturities through 2031 426 461
26,484 17,806Corporate bonds (ii)
RMB denominated Fixed interest rates ranging from 3.30% to 5.68% per annum at 31 December 2016
with maturity through 2022 65,500 65,500USD denominated Fixed interest rates ranging from 1.25% to
4.25% per annum at 31 December 2016 with maturities through 2043 18,985 22,621
84,485 88,121Total third parties’ long-term debts 110,969 105,927
Less: Current portion (38,295) (10,481) 72,674 95,446Long-term loans from Sinopec Group Company and fellow subsidiaries
RMB denominated Interest rates ranging from interest free to 5.75% per annum at 31 December 2016
with maturities through 2021 44,922 44,350USD denominated No loans at 31 December 2016 — 186Less: Current portion (150) (236)
44,772 44,300 117,446 139,746
Short-term and long-term bank loans, loans from Sinopec Group Company and fellow subsidiaries are primarily unsecured and carried at amortised cost.
Note:
(i) The Company issued 180-day corporate bonds of face value RMB 10 billion to corporate investors in the PRC debenture market on 23 September 2015 at par value of RMB 100. The effective cost of the 180–day corporate bonds is 2.99% per annum. The short-term bonds were due on 23 March 2016 and have been fully paid by the Group at maturity.
The Company issued 182-day corporate bonds of face value RMB 16 billion to corporate investors in the PRC debenture market on 14 December 2015 at par value of RMB 100. The effective cost of the 182–day corporate bonds is 2.90% per annum. The short-term bonds were due on 14 June 2016 and have been fully paid by the Group at maturity.
The Company issued 180-day corporate bonds of face value RMB 4 billion to corporate investors in the PRC debenture market on 31 December 2015 at par value of RMB 100. The effective cost of the 180-day corporate bonds is 2.75% per annum. The short-term bonds were due on 30 June 2016 and have been fully paid by the Group at maturity.
The Company issued 182-day corporate bonds of face value RMB 6 billion to corporate investors in the PRC debenture market on 12 September 2016 at par value of RMB 100. The effective cost of the 182-day corporate bonds is 2.54% per annum
(ii) These corporate bonds are carried at amotised cost. At 31 December 2016, RMB 18,985 million (USD denominated corporate bonds) are guaranteed by Sinopec Group Company.
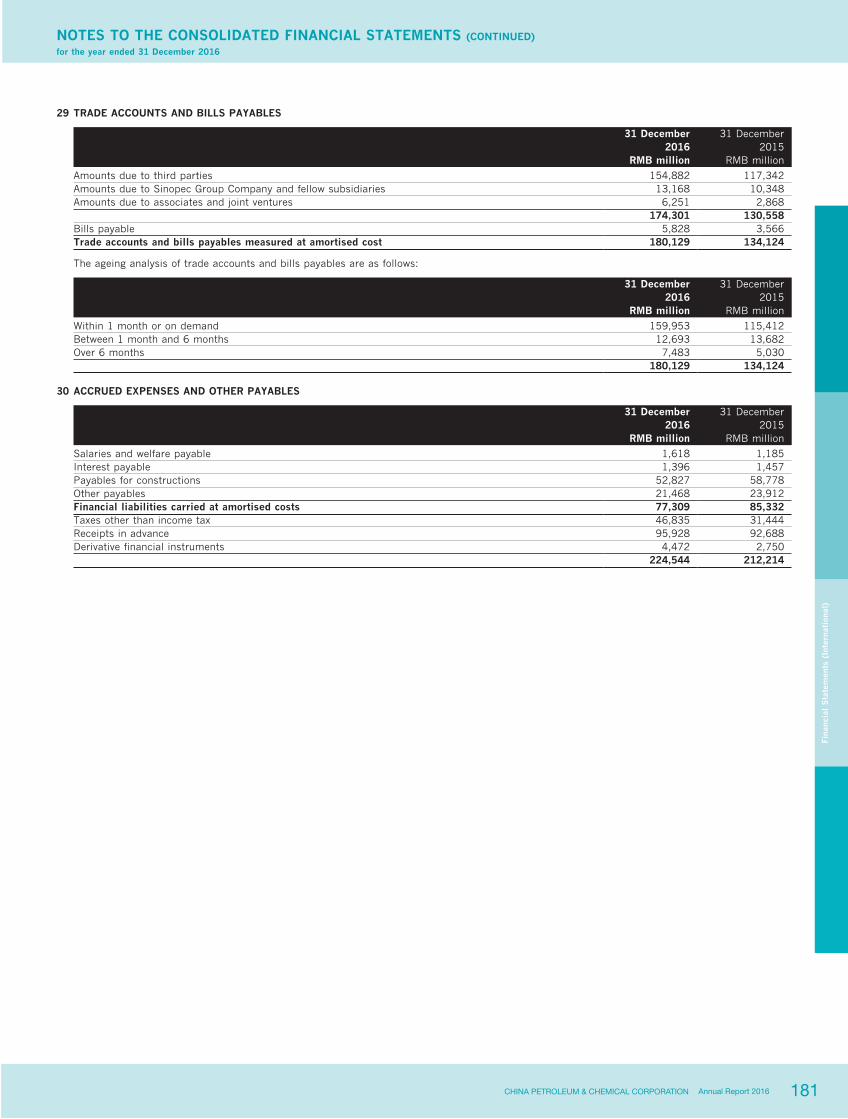
181CHINA PETROLEUM & CHEMICAL CORPORATION Annual Report 2016
NOTES TO THE CONSOLIDATED FINANCIAL STATEMENTS (CONTINUED)for the year ended 31 December 2016
Fina
ncia
l S
tate
men
ts (
Inte
rnat
iona
l)
29 TRADE ACCOUNTS AND BILLS PAYABLES
31 December 31 December2016 2015
RMB million RMB million
Amounts due to third parties 154,882 117,342Amounts due to Sinopec Group Company and fellow subsidiaries 13,168 10,348Amounts due to associates and joint ventures 6,251 2,868 174,301 130,558Bills payable 5,828 3,566Trade accounts and bills payables measured at amortised cost 180,129 134,124
The ageing analysis of trade accounts and bills payables are as follows:
31 December 31 December2016 2015
RMB million RMB million
Within 1 month or on demand 159,953 115,412Between 1 month and 6 months 12,693 13,682Over 6 months 7,483 5,030 180,129 134,124
30 ACCRUED EXPENSES AND OTHER PAYABLES
31 December 31 December2016 2015
RMB million RMB million
Salaries and welfare payable 1,618 1,185Interest payable 1,396 1,457Payables for constructions 52,827 58,778Other payables 21,468 23,912Financial liabilities carried at amortised costs 77,309 85,332Taxes other than income tax 46,835 31,444Receipts in advance 95,928 92,688Derivative financial instruments 4,472 2,750 224,544 212,214
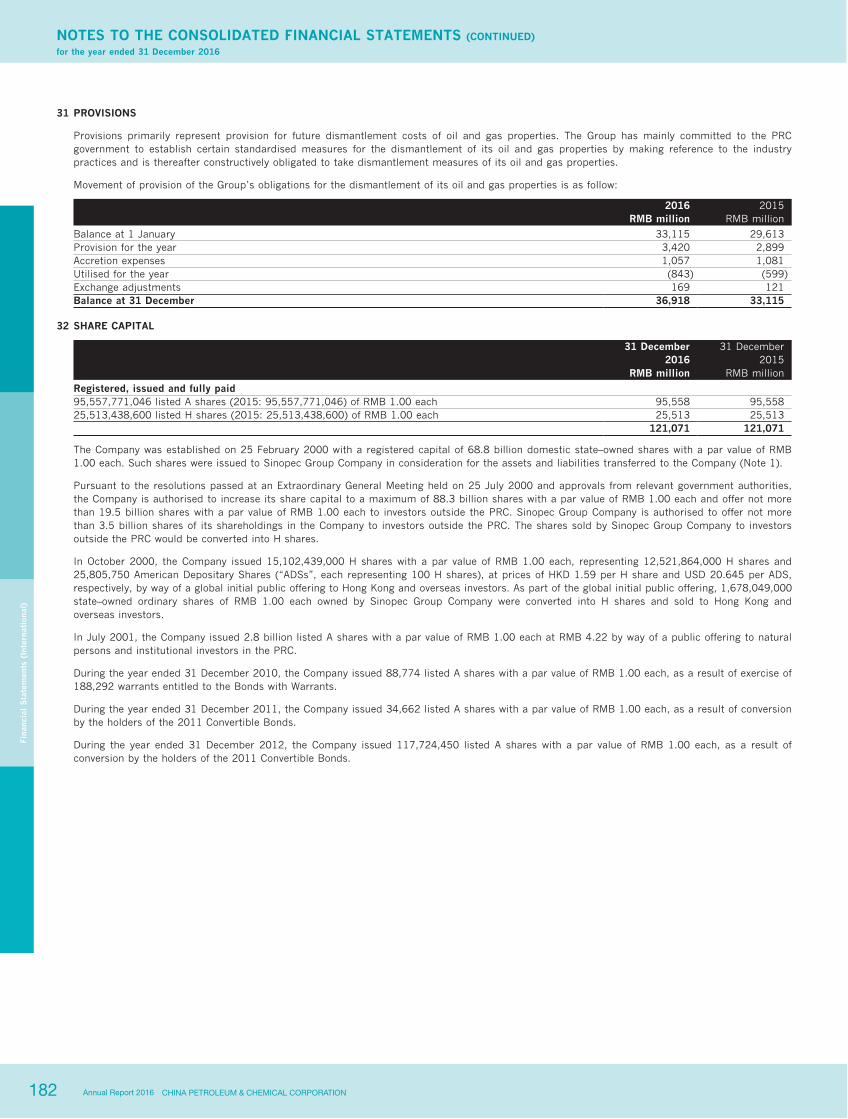
182 CHINA PETROLEUM & CHEMICAL CORPORATIONAnnual Report 2016
Fina
ncia
l S
tate
men
ts (
Inte
rnat
iona
l)
NOTES TO THE CONSOLIDATED FINANCIAL STATEMENTS (CONTINUED)for the year ended 31 December 2016
31 PROVISIONS
Provisions primarily represent provision for future dismantlement costs of oil and gas properties. The Group has mainly committed to the PRC government to establish certain standardised measures for the dismantlement of its oil and gas properties by making reference to the industry practices and is thereafter constructively obligated to take dismantlement measures of its oil and gas properties.
Movement of provision of the Group’s obligations for the dismantlement of its oil and gas properties is as follow:
2016 2015RMB million RMB million
Balance at 1 January 33,115 29,613Provision for the year 3,420 2,899Accretion expenses 1,057 1,081Utilised for the year (843) (599)Exchange adjustments 169 121Balance at 31 December 36,918 33,115
32 SHARE CAPITAL
31 December 31 December2016 2015
RMB million RMB million
Registered, issued and fully paid 95,557,771,046 listed A shares (2015: 95,557,771,046) of RMB 1.00 each 95,558 95,55825,513,438,600 listed H shares (2015: 25,513,438,600) of RMB 1.00 each 25,513 25,513 121,071 121,071
The Company was established on 25 February 2000 with a registered capital of 68.8 billion domestic state–owned shares with a par value of RMB 1.00 each. Such shares were issued to Sinopec Group Company in consideration for the assets and liabilities transferred to the Company (Note 1).
Pursuant to the resolutions passed at an Extraordinary General Meeting held on 25 July 2000 and approvals from relevant government authorities, the Company is authorised to increase its share capital to a maximum of 88.3 billion shares with a par value of RMB 1.00 each and offer not more than 19.5 billion shares with a par value of RMB 1.00 each to investors outside the PRC. Sinopec Group Company is authorised to offer not more than 3.5 billion shares of its shareholdings in the Company to investors outside the PRC. The shares sold by Sinopec Group Company to investors outside the PRC would be converted into H shares.
In October 2000, the Company issued 15,102,439,000 H shares with a par value of RMB 1.00 each, representing 12,521,864,000 H shares and 25,805,750 American Depositary Shares (“ADSs”, each representing 100 H shares), at prices of HKD 1.59 per H share and USD 20.645 per ADS, respectively, by way of a global initial public offering to Hong Kong and overseas investors. As part of the global initial public offering, 1,678,049,000 state–owned ordinary shares of RMB 1.00 each owned by Sinopec Group Company were converted into H shares and sold to Hong Kong and overseas investors.
In July 2001, the Company issued 2.8 billion listed A shares with a par value of RMB 1.00 each at RMB 4.22 by way of a public offering to natural persons and institutional investors in the PRC.
During the year ended 31 December 2010, the Company issued 88,774 listed A shares with a par value of RMB 1.00 each, as a result of exercise of 188,292 warrants entitled to the Bonds with Warrants.
During the year ended 31 December 2011, the Company issued 34,662 listed A shares with a par value of RMB 1.00 each, as a result of conversion by the holders of the 2011 Convertible Bonds.
During the year ended 31 December 2012, the Company issued 117,724,450 listed A shares with a par value of RMB 1.00 each, as a result of conversion by the holders of the 2011 Convertible Bonds.
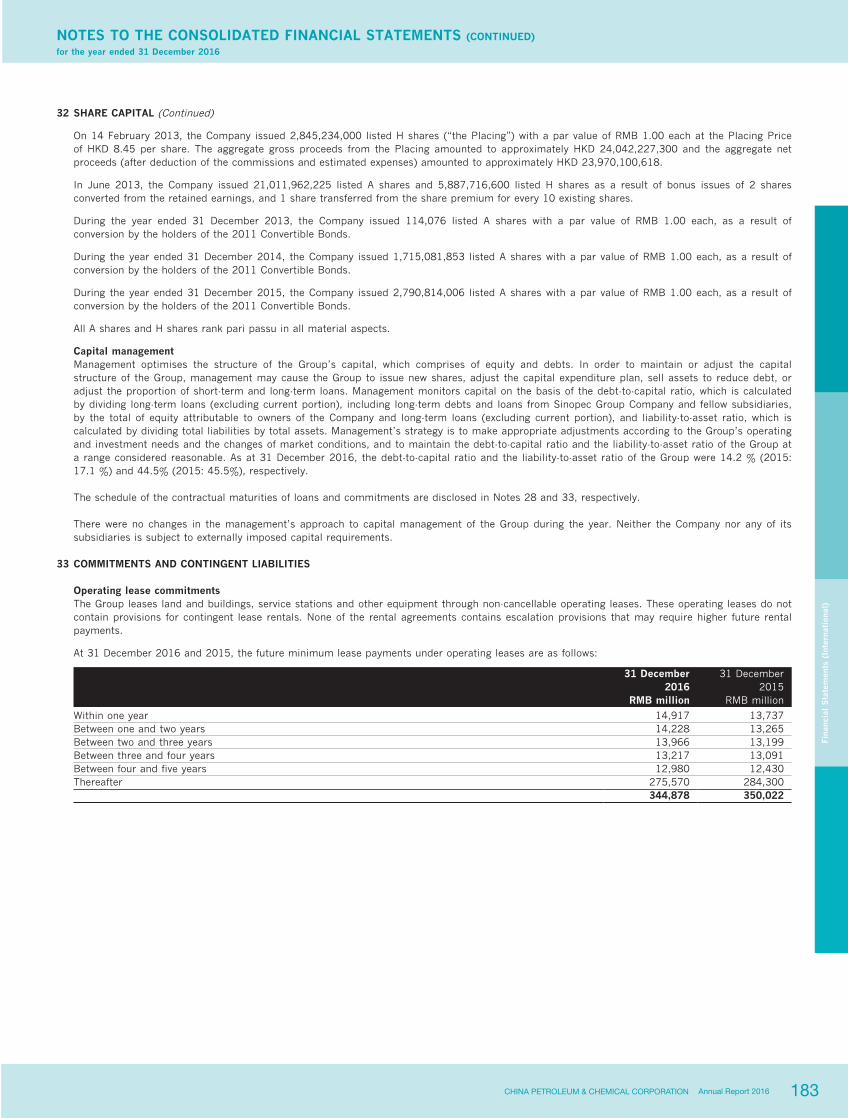
183CHINA PETROLEUM & CHEMICAL CORPORATION Annual Report 2016
Fina
ncia
l S
tate
men
ts (
Inte
rnat
iona
l)
NOTES TO THE CONSOLIDATED FINANCIAL STATEMENTS (CONTINUED)for the year ended 31 December 2016
32 SHARE CAPITAL (Continued)
On 14 February 2013, the Company issued 2,845,234,000 listed H shares (“the Placing”) with a par value of RMB 1.00 each at the Placing Price of HKD 8.45 per share. The aggregate gross proceeds from the Placing amounted to approximately HKD 24,042,227,300 and the aggregate net proceeds (after deduction of the commissions and estimated expenses) amounted to approximately HKD 23,970,100,618.
In June 2013, the Company issued 21,011,962,225 listed A shares and 5,887,716,600 listed H shares as a result of bonus issues of 2 shares converted from the retained earnings, and 1 share transferred from the share premium for every 10 existing shares.
During the year ended 31 December 2013, the Company issued 114,076 listed A shares with a par value of RMB 1.00 each, as a result of conversion by the holders of the 2011 Convertible Bonds.
During the year ended 31 December 2014, the Company issued 1,715,081,853 listed A shares with a par value of RMB 1.00 each, as a result of conversion by the holders of the 2011 Convertible Bonds.
During the year ended 31 December 2015, the Company issued 2,790,814,006 listed A shares with a par value of RMB 1.00 each, as a result of conversion by the holders of the 2011 Convertible Bonds.
All A shares and H shares rank pari passu in all material aspects.
Capital management Management optimises the structure of the Group’s capital, which comprises of equity and debts. In order to maintain or adjust the capital
structure of the Group, management may cause the Group to issue new shares, adjust the capital expenditure plan, sell assets to reduce debt, or adjust the proportion of short-term and long-term loans. Management monitors capital on the basis of the debt-to-capital ratio, which is calculated by dividing long-term loans (excluding current portion), including long-term debts and loans from Sinopec Group Company and fellow subsidiaries, by the total of equity attributable to owners of the Company and long-term loans (excluding current portion), and liability-to-asset ratio, which is calculated by dividing total liabilities by total assets. Management’s strategy is to make appropriate adjustments according to the Group’s operating and investment needs and the changes of market conditions, and to maintain the debt-to-capital ratio and the liability-to-asset ratio of the Group at a range considered reasonable. As at 31 December 2016, the debt-to-capital ratio and the liability-to-asset ratio of the Group were 14.2 % (2015: 17.1 %) and 44.5% (2015: 45.5%), respectively.
The schedule of the contractual maturities of loans and commitments are disclosed in Notes 28 and 33, respectively.
There were no changes in the management’s approach to capital management of the Group during the year. Neither the Company nor any of its subsidiaries is subject to externally imposed capital requirements.
33 COMMITMENTS AND CONTINGENT LIABILITIES
Operating lease commitmentsThe Group leases land and buildings, service stations and other equipment through non-cancellable operating leases. These operating leases do not contain provisions for contingent lease rentals. None of the rental agreements contains escalation provisions that may require higher future rental payments.
At 31 December 2016 and 2015, the future minimum lease payments under operating leases are as follows:
31 December 31 December2016 2015
RMB million RMB million
Within one year 14,917 13,737Between one and two years 14,228 13,265Between two and three years 13,966 13,199Between three and four years 13,217 13,091Between four and five years 12,980 12,430Thereafter 275,570 284,300 344,878 350,022
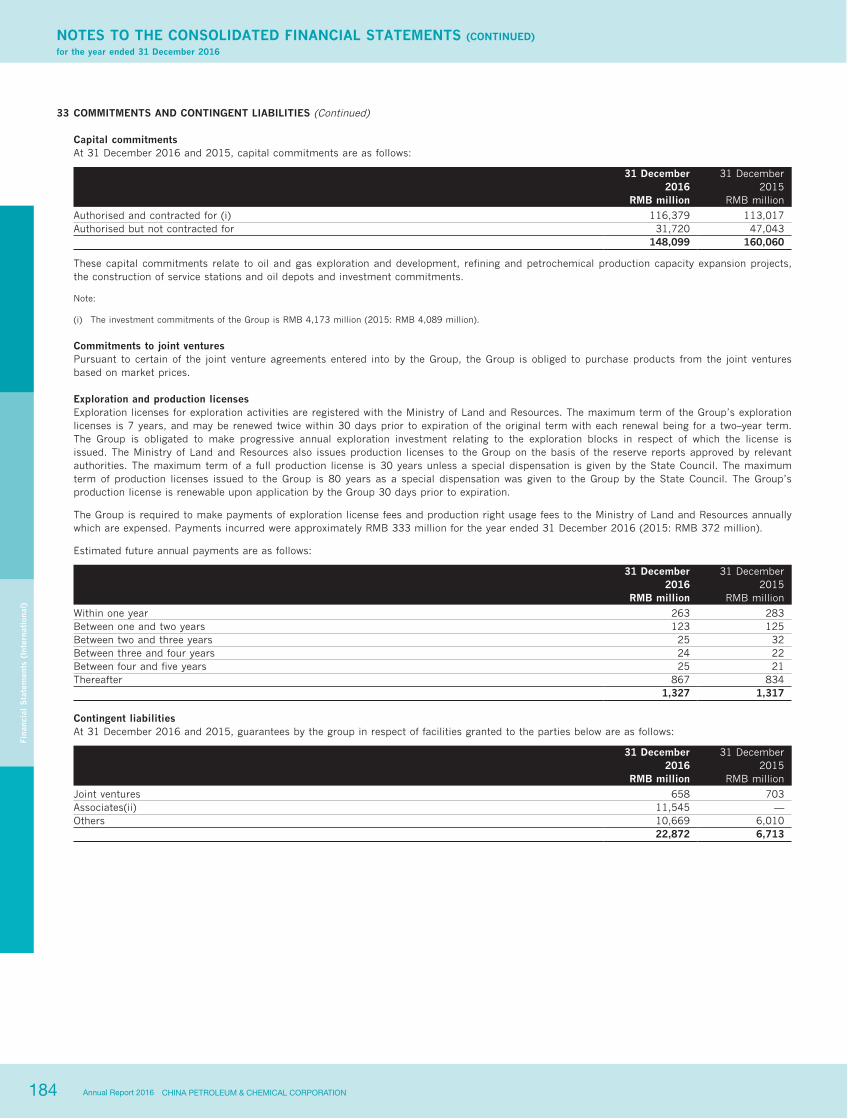
184 CHINA PETROLEUM & CHEMICAL CORPORATIONAnnual Report 2016
Fina
ncia
l S
tate
men
ts (
Inte
rnat
iona
l)
NOTES TO THE CONSOLIDATED FINANCIAL STATEMENTS (CONTINUED)for the year ended 31 December 2016
33 COMMITMENTS AND CONTINGENT LIABILITIES (Continued)
Capital commitmentsAt 31 December 2016 and 2015, capital commitments are as follows:
31 December 31 December2016 2015
RMB million RMB million
Authorised and contracted for (i) 116,379 113,017Authorised but not contracted for 31,720 47,043 148,099 160,060
These capital commitments relate to oil and gas exploration and development, refining and petrochemical production capacity expansion projects, the construction of service stations and oil depots and investment commitments.
Note:
(i) The investment commitments of the Group is RMB 4,173 million (2015: RMB 4,089 million).
Commitments to joint venturesPursuant to certain of the joint venture agreements entered into by the Group, the Group is obliged to purchase products from the joint ventures based on market prices.
Exploration and production licensesExploration licenses for exploration activities are registered with the Ministry of Land and Resources. The maximum term of the Group’s exploration licenses is 7 years, and may be renewed twice within 30 days prior to expiration of the original term with each renewal being for a two–year term. The Group is obligated to make progressive annual exploration investment relating to the exploration blocks in respect of which the license is issued. The Ministry of Land and Resources also issues production licenses to the Group on the basis of the reserve reports approved by relevant authorities. The maximum term of a full production license is 30 years unless a special dispensation is given by the State Council. The maximum term of production licenses issued to the Group is 80 years as a special dispensation was given to the Group by the State Council. The Group’s production license is renewable upon application by the Group 30 days prior to expiration.
The Group is required to make payments of exploration license fees and production right usage fees to the Ministry of Land and Resources annually which are expensed. Payments incurred were approximately RMB 333 million for the year ended 31 December 2016 (2015: RMB 372 million).
Estimated future annual payments are as follows:
31 December 31 December2016 2015
RMB million RMB million
Within one year 263 283Between one and two years 123 125Between two and three years 25 32Between three and four years 24 22Between four and five years 25 21Thereafter 867 834 1,327 1,317
Contingent liabilitiesAt 31 December 2016 and 2015, guarantees by the group in respect of facilities granted to the parties below are as follows:
31 December 31 December2016 2015
RMB million RMB million
Joint ventures 658 703Associates(ii) 11,545 —Others 10,669 6,010 22,872 6,713

185CHINA PETROLEUM & CHEMICAL CORPORATION Annual Report 2016
Fina
ncia
l S
tate
men
ts (
Inte
rnat
iona
l)
NOTES TO THE CONSOLIDATED FINANCIAL STATEMENTS (CONTINUED)for the year ended 31 December 2016
33 COMMITMENTS AND CONTINGENT LIABILITIES (Continued)
Contingent liabilities (Continued)Management monitors the conditions that are subject to the guarantees to identify whether it is probable that a loss has occurred, and recognises any such losses under guarantees when those losses are estimable. At 31 December 2016 and 2015, it was not probable that the Group will be required to make payments under the guarantees. Thus no liabilities have been accrued for a loss related to the Group’s obligation under these guarantee arrangements.
Note:
(ii) The Group provided a guarantee in respect to standby credit facilities granted to Zhongtian Synergetic Energy by banks amount to RMB 17,050 million. As at 31 December 2016, the amount withdrawn by Zhongtian Synergetic Energy and guaranteed by the Group was RMB 11,545 million.
Environmental contingenciesUnder existing legislation, management believes that there are no probable liabilities that will have a material adverse effect on the financial position or operating results of the Group. The PRC government, however, has moved, and may move further towards more rigorous enforcement of applicable laws, and towards the adoption of more stringent environmental standards. Environmental liabilities are subject to considerable uncertainties which affect management’s ability to estimate the ultimate cost of remediation efforts. These uncertainties include (i) the exact nature and extent of the contamination at various sites including, but not limited to refineries, oil fields, service stations, terminals and land development areas, whether operating, closed or sold, (ii) the extent of required cleanup efforts, (iii) varying costs of alternative remediation strategies, (iv) changes in environmental remediation requirements, and (v) the identification of new remediation sites. The amount of such future cost is indeterminable due to such factors as the unknown magnitude of possible contamination and the unknown timing and extent of the corrective actions that may be required. Accordingly, the outcome of environmental liabilities under proposed or future environmental legislation cannot reasonably be estimated at present, and could be material. The Group paid normal routine pollutant discharge fees of approximately RMB 6,358 million in the consolidated financial statements for the year ended 31 December 2016 (2015: RMB 5,813 million).
Legal contingenciesThe Group is defendant in certain lawsuits as well as the named party in other proceedings arising in the ordinary course of business. Management has assessed the likelihood of an unfavourable outcome of such contingencies, lawsuits or other proceedings and believes that any resulting liabilities will not have a material adverse effect on the financial position, operating results or cash flows of the Group.
34 RELATED PARTY TRANSACTIONS
Parties are considered to be related to the Group if the Group has the ability, directly or indirectly, to control or jointly control the party or exercise significant influence over the party in making financial and operating decisions, or vice versa, or where the Group and the party are subject to control or common control. Related parties may be individuals (being members of key management personnel, significant shareholders and/or their close family members) or other entities and include entities which are under the significant influence of related parties of the Group where those parties are individuals, and post-employment benefit plans which are for the benefit of employees of the Group or of any entity that is a related party of the Group.
(a) Transactions with Sinopec Group Company and fellow subsidiaries, associates and joint ventures The Group is part of a larger group of companies under Sinopec Group Company, which is controlled by the PRC government, and has significant
transactions and relationships with Sinopec Group Company and fellow subsidiaries. Because of these relationships, it is possible that the terms of these transactions are not the same as those that would result from transactions among wholly unrelated parties.
The principal related party transactions with Sinopec Group Company and fellow subsidiaries, associates and joint ventures, which were carried out in the ordinary course of business are as follows:
Note 2016 2015RMB million RMB million
Sales of goods (i) 194,179 211,197Purchases (ii) 118,242 92,627Transportation and storage (iii) 1,333 1,299Exploration and development services (iv) 27,201 37,444Production related services (v) 10,816 10,880Ancillary and social services (vi) 6,584 6,754Operating lease charges for land (vii) 10,474 10,618Operating lease charges for buildings (vii) 449 462Other operating lease charges (vii) 456 302Agency commission income (viii) 129 116Interest income (ix) 209 207Interest expense (x) 996 1,194Net deposits placed with related parties (ix) (21,770) (14,082)Net loans repaid to related parties (xi) (24,877) (57,881)
The amounts set out in the table above in respect of the year ended 31 December 2016 and 2015 represent the relevant costs and income as determined by the corresponding contracts with the related parties.

186 CHINA PETROLEUM & CHEMICAL CORPORATIONAnnual Report 2016
Fina
ncia
l S
tate
men
ts (
Inte
rnat
iona
l)
NOTES TO THE CONSOLIDATED FINANCIAL STATEMENTS (CONTINUED)for the year ended 31 December 2016
34 RELATED PARTY TRANSACTIONS (Continued)
(a) Transactions with Sinopec Group Company and fellow subsidiaries, associates and joint ventures (Continued)Included in the transactions disclosed above, for the year ended 31 December 2016 are: a) purchases by the Group from Sinopec Group Company and fellow subsidiaries amounting to RMB 114,526 million (2015: RMB 112,089 million) comprising purchases of products and services (i.e. procurement, transportation and storage, exploration and development services and production related services) of RMB 96,023 million (2015: RMB 93,061 million), ancillary and social services provided by Sinopec Group Company and fellow subsidiaries of RMB 6,584 million (2015: RMB 6,754 million), operating lease charges for land and buildings paid by the Group of RMB 10,474 million and RMB 449 million (2015: RMB 10,618 million and RMB 462 million), respectively and interest expenses of RMB 996 million (2015: RMB 1,194 million); and b) sales by the Group to Sinopec Group Company and fellow subsidiaries amounting to RMB 56,251 million (2015: RMB 77,747 million), comprising RMB 56,010 million (2015: RMB 77,513 million) for sales of goods, RMB 209 million (2015: RMB 207 million) for interest income and RMB 32 million (2015: RMB 27 million) for agency commission income.
At 31 December 2016 and 2015, there was no guarantee given to banks by the Group in respect of banking facilities to related parties, except for the guarantees disclosed in Note 33.
The directors of the Company are of the opinion that the above transactions with related parties were conducted in the ordinary course of business and on normal commercial terms or in accordance with the agreements governing such transactions, and this has been confirmed by the independent directors.
Note:
(i) Sales of goods represent the sale of crude oil, intermediate petrochemical products, petroleum products and ancillary materials.
(ii) Purchases represent the purchase of materials and utility supplies directly related to the Group’s operations such as the procurement of raw and ancillary materials and related services, supply of water, electricity and gas.
(iii) Transportation and storage represent the cost for the use of railway, road and marine transportation services, pipelines, loading, unloading and storage facilities.
(iv) Exploration and development services comprise direct costs incurred in the exploration and development such as geophysical, drilling, well testing and well measurement services.
(v) Production related services represent ancillary services rendered in relation to the Group’s operations such as equipment repair and general maintenance, insurance premium, technical research, communications, firefighting, security, product quality testing and analysis, information technology, design and engineering, construction of oilfield ground facilities, refineries and chemical plants, manufacture of replacement parts and machinery, installation, project management and environmental protection.
(vi) Ancillary and social services represent expenditures for social welfare and support services such as educational facilities, media communication services, sanitation, accommodation, canteens, property maintenance and management services.
(vii) Operating lease charges represent the rental paid to Sinopec Group Company for operating leases in respect of land, buildings and equipment.
(viii) Agency commission income represents commission earned for acting as an agent in respect of sales of products and purchase of materials for certain entities owned by Sinopec Group Company.
(ix) Interest income represents interest received from deposits placed with Sinopec Finance Company Limited and Sinopec Century Bright Capital Investment Limited, finance companies controlled by Sinopec Group Company. The applicable interest rate is determined in accordance with the prevailing saving deposit rate. The balance of deposits at 31 December 2016 was RMB 40,073 million (2015: RMB 18,303 million).
(x) Interest expense represents interest charges on the loans and advances obtained from Sinopec Group Company and fellow subsidiaries.
(xi) The Group obtained or repaid loans from or to Sinopec Group Company and fellow subsidiaries.
In connection with the Reorganisation, the Company and Sinopec Group Company entered into a number of agreements under which 1) Sinopec Group Company will provide goods and products and a range of ancillary, social and supporting services to the Group and 2) the Group will sell certain goods to Sinopec Group Company. These agreements impacted the operating results of the Group for the year ended 31 December 2016. The terms of these agreements are summarised as follows:
• The Company has entered into a non-exclusive “Agreement for Mutual Provision of Products and Ancillary Services” (“Mutual Provision Agreement”) with Sinopec Group Company effective from 1 January 2000 in which Sinopec Group Company has agreed to provide the Group with certain ancillary production services, construction services, information advisory services, supply services and other services and products. While each of Sinopec Group Company and the Company is permitted to terminate the Mutual Provision Agreement upon at least six months notice, Sinopec Group Company has agreed not to terminate the agreement if the Group is unable to obtain comparable services from a third party. The pricing policy for these services and products provided by Sinopec Group Company to the Group is as follows:
(1) the government-prescribed price;
(2) where there is no government-prescribed price, the government-guidance price;
(3) where there is neither a government-prescribed price nor a government-guidance price, the market price; or
(4) where none of the above is applicable, the price to be agreed between the parties, which shall be based on a reasonable cost incurred in providing such services plus a profit margin not exceeding 6%.

187CHINA PETROLEUM & CHEMICAL CORPORATION Annual Report 2016
Fina
ncia
l S
tate
men
ts (
Inte
rnat
iona
l)
NOTES TO THE CONSOLIDATED FINANCIAL STATEMENTS (CONTINUED)for the year ended 31 December 2016
34 RELATED PARTY TRANSACTIONS (Continued)
(a) Transactions with Sinopec Group Company and fellow subsidiaries, associates and joint ventures (Continued)• The Company has entered into a non-exclusive “Agreement for Provision of Cultural and Educational, Health Care and Community Services”
with Sinopec Group Company effective from 1 January 2000 in which Sinopec Group Company has agreed to provide the Group with certain cultural, educational, health care and community services on the same pricing terms and termination conditions as described in the above Mutual Provision Agreement.
• The Company has entered into a series of lease agreements with Sinopec Group Company to lease certain lands and buildings effective on 1 January 2000. The lease term is 40 or 50 years for lands and 20 years for buildings, respectively. The Company and Sinopec Group Company can renegotiate the rental amount every three years for land. The Company and Sinopec Group Company can renegotiate the rental amount for buildings every year. However such amount cannot exceed the market price as determined by an independent third party.
• The Company has entered into agreements with Sinopec Group Company effective from 1 January 2000 under which the Group has been granted the right to use certain trademarks, patents, technology and computer software developed by Sinopec Group Company.
• The Company has entered into a service stations franchise agreement with Sinopec Group Company effective from 1 January 2000 under which its service stations and retail stores would exclusively sell the refined products supplied by the Group.
Amounts due from/to Sinopec Group Company and fellow subsidiaries, associates and joint ventures included in the following accounts captions are summarised as follows:
31 December 31 December2016 2015
RMB million RMB million
Trade accounts receivable 10,978 22,393Prepaid expenses and other current assets 13,430 9,084Long-term prepayments and other assets 20,385 17,760Total 44,793 49,237Trade accounts payable 19,419 13,195Accrued expenses and other payables 21,590 20,457Other long-term liabilities 9,998 8,226Short-term loans and current portion of long-term loans from Sinopec Group Company and fellow subsidiaries 18,580 43,929Long-term loans excluding current portion from Sinopec Group Company and fellow subsidiaries 44,772 44,300Total 114,359 130,107
Amounts due from/to Sinopec Group Company and fellow subsidiaries, associates and joint ventures, other than short-term loans and long-term loans, bear no interest, are unsecured and are repayable in accordance with normal commercial terms. The terms and conditions associated with short-term loans and long-term loans payable to Sinopec Group Company and fellow subsidiaries are set out in Note 28.
The long-term borrowings mainly include an interest-free loan with a maturity period of 20 years amounting to RMB 35,560 million from the Sinopec Group Company (a state-owned enterprise) through the Sinopec Finance. This borrowing is a special arrangement to reduce financing costs and improve liquidity of the Company during its initial global offering in 2000.
As at and for the year ended 31 December 2016, and as at and for the year ended 31 December 2015, no individually significant impairment losses for bad and doubtful debts were recognised in respect of amounts due from Sinopec Group Company and fellow subsidiaries, associates and joint ventures.
(b) Key management personnel emolumentsKey management personnel are those persons having authority and responsibility for planning, directing and controlling the activities of the Group, directly or indirectly, including directors and supervisors of the Group. The key management personnel compensation is as follows:
2016 2015RMB’000 RMB’000
Short–term employee benefits 5,648 5,225Retirement scheme contributions 499 510 6,147 5,735
(c) Contributions to defined contribution retirement plansThe Group participates in various defined contribution retirement plans organised by municipal and provincial governments for its staff. The details of the Group’s employee benefits plan are disclosed in Note 35. As at 31 December 2016 and 2015, the accrual for the contribution to post-employment benefit plans was not material.
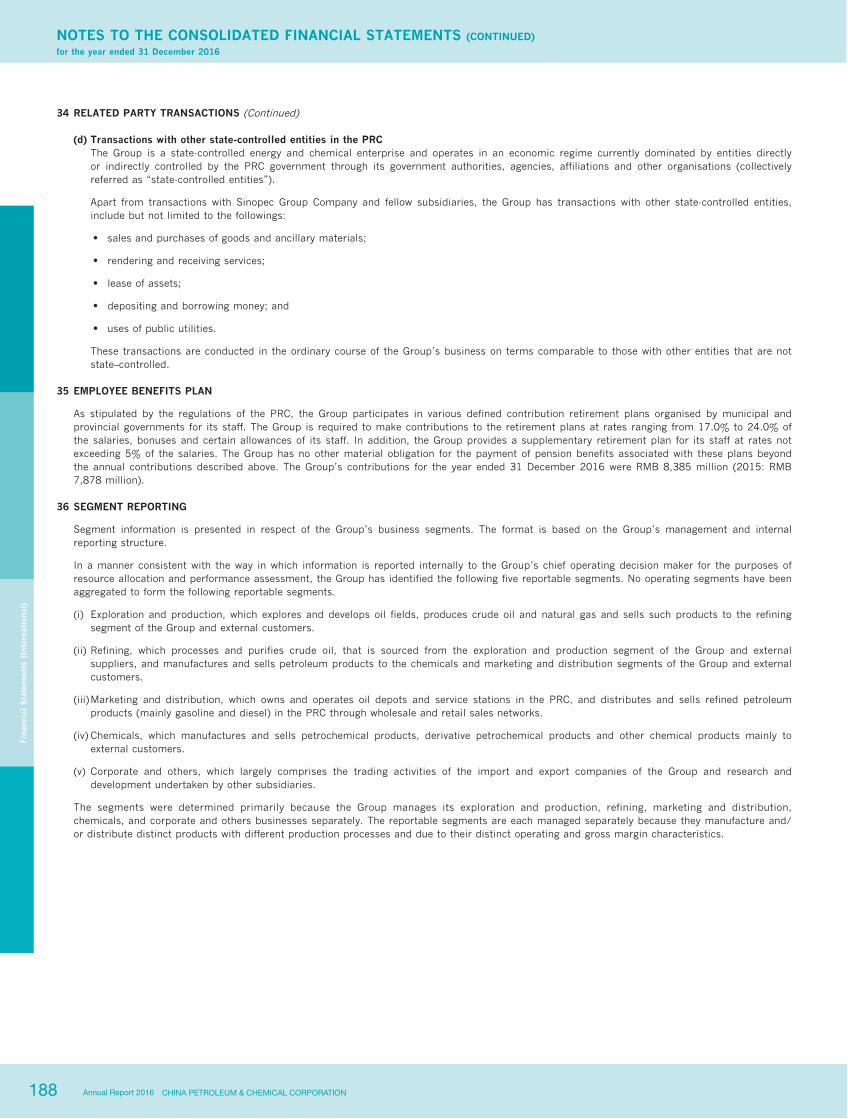
188 CHINA PETROLEUM & CHEMICAL CORPORATIONAnnual Report 2016
Fina
ncia
l S
tate
men
ts (
Inte
rnat
iona
l)
NOTES TO THE CONSOLIDATED FINANCIAL STATEMENTS (CONTINUED)for the year ended 31 December 2016
34 RELATED PARTY TRANSACTIONS (Continued)
(d) Transactions with other state-controlled entities in the PRCThe Group is a state-controlled energy and chemical enterprise and operates in an economic regime currently dominated by entities directly or indirectly controlled by the PRC government through its government authorities, agencies, affiliations and other organisations (collectively referred as “state-controlled entities”).
Apart from transactions with Sinopec Group Company and fellow subsidiaries, the Group has transactions with other state-controlled entities, include but not limited to the followings:
‧ sales and purchases of goods and ancillary materials;
‧ rendering and receiving services;
‧ lease of assets;
‧ depositing and borrowing money; and
‧ uses of public utilities.
These transactions are conducted in the ordinary course of the Group’s business on terms comparable to those with other entities that are not state–controlled.
35 EMPLOYEE BENEFITS PLAN
As stipulated by the regulations of the PRC, the Group participates in various defined contribution retirement plans organised by municipal and provincial governments for its staff. The Group is required to make contributions to the retirement plans at rates ranging from 17.0% to 24.0% of the salaries, bonuses and certain allowances of its staff. In addition, the Group provides a supplementary retirement plan for its staff at rates not exceeding 5% of the salaries. The Group has no other material obligation for the payment of pension benefits associated with these plans beyond the annual contributions described above. The Group’s contributions for the year ended 31 December 2016 were RMB 8,385 million (2015: RMB 7,878 million).
36 SEGMENT REPORTING
Segment information is presented in respect of the Group’s business segments. The format is based on the Group’s management and internal reporting structure.
In a manner consistent with the way in which information is reported internally to the Group’s chief operating decision maker for the purposes of resource allocation and performance assessment, the Group has identified the following five reportable segments. No operating segments have been aggregated to form the following reportable segments.
(i) Exploration and production, which explores and develops oil fields, produces crude oil and natural gas and sells such products to the refining segment of the Group and external customers.
(ii) Refining, which processes and purifies crude oil, that is sourced from the exploration and production segment of the Group and external suppliers, and manufactures and sells petroleum products to the chemicals and marketing and distribution segments of the Group and external customers.
(iii) Marketing and distribution, which owns and operates oil depots and service stations in the PRC, and distributes and sells refined petroleum products (mainly gasoline and diesel) in the PRC through wholesale and retail sales networks.
(iv) Chemicals, which manufactures and sells petrochemical products, derivative petrochemical products and other chemical products mainly to external customers.
(v) Corporate and others, which largely comprises the trading activities of the import and export companies of the Group and research and development undertaken by other subsidiaries.
The segments were determined primarily because the Group manages its exploration and production, refining, marketing and distribution, chemicals, and corporate and others businesses separately. The reportable segments are each managed separately because they manufacture and/or distribute distinct products with different production processes and due to their distinct operating and gross margin characteristics.

189CHINA PETROLEUM & CHEMICAL CORPORATION Annual Report 2016
Fina
ncia
l S
tate
men
ts (
Inte
rnat
iona
l)
NOTES TO THE CONSOLIDATED FINANCIAL STATEMENTS (CONTINUED)for the year ended 31 December 2016
36 SEGMENT REPORTING (Continued)
(1) Information of reportable segmental revenues, profits or losses, assets and liabilities The Group’s chief operating decision maker evaluates the performance and allocates resources to its operating segments on an operating income
basis, without considering the effects of finance costs or investment income. Inter-segment transfer pricing is based on the market price or cost plus an appropriate margin, as specified by the Group’s policy.
Assets and liabilities dedicated to a particular segment’s operations are included in that segment’s total assets and liabilities. Segment assets include all tangible and intangible assets, except for interest in associates and joint ventures, investments, deferred tax assets, cash and cash equivalents, time deposits with financial institutions and other unallocated assets. Segment liabilities exclude short-term, income tax payable, long-term debts, loans from Sinopec Group Company and fellow subsidiaries, deferred tax liabilities and other unallocated liabilities.
Information of the Group’s reportable segments is as follows:
2016 2015RMB million RMB million
Turnover Exploration and production
External sales 47,443 57,740Inter-segment sales 58,954 71,019 106,397 128,759
Refining External sales 102,983 120,650Inter-segment sales 747,317 800,962 850,300 921,612
Marketing and distribution External sales 1,027,373 1,086,098Inter-segment sales 3,480 3,056 1,030,853 1,089,154
Chemicals External sales 284,289 276,640Inter-segment sales 38,614 43,814 322,903 320,454
Corporate and others External sales 418,102 436,749Inter-segment sales 320,367 345,454 738,469 782,203
Elimination of inter-segment sales (1,168,732) (1,264,305)Turnover 1,880,190 1,977,877Other operating revenues
Exploration and production 9,542 9,894Refining 5,486 5,004Marketing and distribution 22,004 17,512Chemicals 12,211 8,417Corporate and others 1,478 1,671
Other operating revenues 50,721 42,498Turnover and other operating revenues 1,930,911 2,020,375

190 CHINA PETROLEUM & CHEMICAL CORPORATIONAnnual Report 2016
Fina
ncia
l S
tate
men
ts (
Inte
rnat
iona
l)
NOTES TO THE CONSOLIDATED FINANCIAL STATEMENTS (CONTINUED)for the year ended 31 December 2016
36 SEGMENT REPORTING (Continued)
(1) Information of reportable segmental revenues, profits or losses, assets and liabilities (Continued)
2016 2015
RMB million RMB million
Result Operating profit/(loss) By segment
– Exploration and production (36,641) (17,418)– Refining 56,265 20,959– Marketing and distribution 32,153 28,855– Chemicals 20,623 19,476– Corporate and others 3,212 384– Elimination 1,581 4,566
Total segment operating profit 77,193 56,822Share of profits/(losses) from associates and joint ventures
– Exploration and production (1,203) 633– Refining 1,075 725– Marketing and distribution 2,362 1,379– Chemicals 5,696 3,343– Corporate and others 1,376 2,282
Aggregate share of profits from associates and joint ventures 9,306 8,362Investment income
– Exploration and production 24 835– Refining (4) (8)– Marketing and distribution 90 70– Chemicals 119 41– Corporate and others 34 350– Elimination — (822)
Aggregate investment income 263 466Net finance costs (6,611) (9,239)Profit before taxation 80,151 56,411
At 31 December At 31 December2016 2015
RMB million RMB million
Assets Segment assets
– Exploration and production 402,476 447,307– Refining 260,903 264,573– Marketing and distribution 292,328 283,416– Chemicals 144,371 151,646– Corporate and others 95,263 108,921
Total segment assets 1,195,341 1,255,863Interest in associates and joint ventures 116,812 84,293Available-for-sale financial assets 11,408 10,964Deferred tax assets 7,214 7,469Cash and cash equivalents and time deposits with financial institutions 142,497 69,666Other unallocated assets 25,337 19,013Total assets 1,498,609 1,447,268Liabilities Segment liabilities
– Exploration and production 95,944 96,773– Refining 82,170 58,578– Marketing and distribution 133,303 118,897– Chemicals 32,072 27,243– Corporate and others 97,080 104,194
Total segment liabilities 440,569 405,685Short-term debts 56,239 41,517Income tax payable 6,051 1,048Long-term debts 72,674 95,446Loans from Sinopec Group Company and fellow subsidiaries 63,352 88,229Deferred tax liabilities 7,661 8,259Other unallocated liabilities 20,828 18,923Total liabilities 667,374 659,107
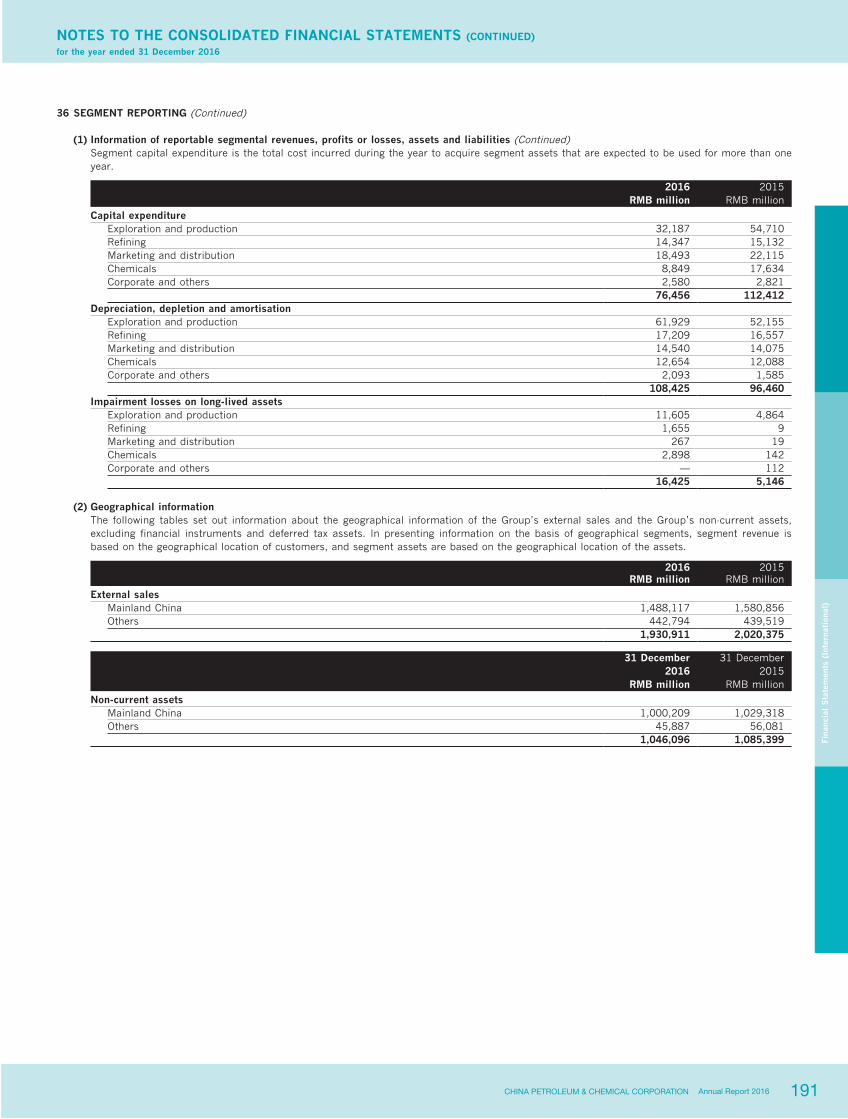
191CHINA PETROLEUM & CHEMICAL CORPORATION Annual Report 2016
Fina
ncia
l S
tate
men
ts (
Inte
rnat
iona
l)
NOTES TO THE CONSOLIDATED FINANCIAL STATEMENTS (CONTINUED)for the year ended 31 December 2016
36 SEGMENT REPORTING (Continued)
(1) Information of reportable segmental revenues, profits or losses, assets and liabilities (Continued) Segment capital expenditure is the total cost incurred during the year to acquire segment assets that are expected to be used for more than one
year.
2016 2015RMB million RMB million
Capital expenditure Exploration and production 32,187 54,710Refining 14,347 15,132Marketing and distribution 18,493 22,115Chemicals 8,849 17,634Corporate and others 2,580 2,821 76,456 112,412
Depreciation, depletion and amortisation Exploration and production 61,929 52,155Refining 17,209 16,557Marketing and distribution 14,540 14,075Chemicals 12,654 12,088Corporate and others 2,093 1,585 108,425 96,460
Impairment losses on long-lived assets Exploration and production 11,605 4,864Refining 1,655 9Marketing and distribution 267 19Chemicals 2,898 142Corporate and others — 112 16,425 5,146
(2) Geographical information The following tables set out information about the geographical information of the Group’s external sales and the Group’s non-current assets,
excluding financial instruments and deferred tax assets. In presenting information on the basis of geographical segments, segment revenue is based on the geographical location of customers, and segment assets are based on the geographical location of the assets.
2016 2015RMB million RMB million
External sales Mainland China 1,488,117 1,580,856Others 442,794 439,519
1,930,911 2,020,375
31 December 31 December2016 2015
RMB million RMB million
Non-current assets Mainland China 1,000,209 1,029,318Others 45,887 56,081
1,046,096 1,085,399

192 CHINA PETROLEUM & CHEMICAL CORPORATIONAnnual Report 2016
Fina
ncia
l S
tate
men
ts (
Inte
rnat
iona
l)
NOTES TO THE CONSOLIDATED FINANCIAL STATEMENTS (CONTINUED)for the year ended 31 December 2016
37 PRINCIPAL SUBSIDIARIES
At 31 December 2016, the following list contains the particulars of subsidiaries which principally affected the results, assets and liabilities of the Group.
Particulars of Interests heldInterestsheld by
issued capital by the non–controllingName of company (million) Company % interests % Principal activities
Sinopec International Petroleum Exploration and Production Limited (“SIPL”)
RMB 8,000
100.00
-
Investment in exploration, production and sale of petroleum and natural gas
Sinopec Great Wall Energy & Chemical Company Limited
RMB 20,739
100.00
-
Coal chemical industry investment management, production and sale of coal chemical products
Sinopec Yangzi Petrochemical Company Limited
RMB 13,203
100.00
-
Manufacturing of intermediate petrochemical products and petroleum products
Sinopec Pipeline Storage & Transportation Company Limited
RMB 12,000
100.00
-
Pipeline storage and transportation of crude oil
Sinopec Yizheng Chemical Fibre Limited Liability Company
RMB 4,000
100.00
-
Production and sale of polyester chips and polyester fibres
Sinopec Lubricant Company Limited
RMB 3,374
100.00
-
Production and sale of refined petroleum products, lubricant base oil, and petrochemical materials
Sinopec Qingdao Petrochemical Company Limited
RMB 1,595
100.00
-
Manufacturing of intermediate petrochemical products and petroleum products
Sinopec Chemical Sales Company Limited
RMB 1,000
100.00
-
Marketing and distribution of petrochemical products
China International United Petroleum and Chemical Company Limited
RMB 3,000
100.00
-
Trading of crude oil and petrochemical products
Sinopec Overseas Investment Holding Limited (“SOIH”) USD 1,638 100.00 Investment holding Sinopec Catalyst Company Limited RMB 1,500 100.00 Production and sale of catalyst productsChina Petrochemical International Company Limited RMB 1,400 100.00 - Trading of petrochemical productsSinopec Beihai Refining and Chemical Limited Liability Company
RMB 5,294
98.98
1.02
Import and processing of crude oil, production, storage and sale of petroleum products and petrochemical products
Sinopec Qingdao Refining and Chemical Company Limited
RMB 5,000
85.00
15.00
Manufacturing of intermediate petrochemical products and petroleum products
Sinopec Zhanjiang Dongxing Petrochemical Company Limited
RMB 4,397
75.00
25.00
Manufacturing of intermediate petrochemical products and petroleum products
Sinopec Hainan Refining and Chemical Company Limited
RMB 3,986
75.00
25.00
Manufacturing of intermediate petrochemical products and petroleum products
Sinopec Marketing Company Limited (“Marketing Company”)
RMB 28,403
70.42
29.58
Marketing and distribution of refined petroleum products
Sinopec–SK(Wuhan) Petrochemical Company Limited (“Zhonghan Wuhan”)
RMB 6,270
65.00
35.00
Production, sale, research and development of ethylene and downstream byproducts
Sinopec Kantons Holdings Limited (“Sinopec Kantons”)
HKD 248
60.34
39.66
Trading of crude oil and petroleum products
Gaoqiao Petrochemical Company Limited (Note 1)
RMB 10,000
55.00
45.00
Manufacturing of intermediate petrochemical products and petroleum products
Sinopec Shanghai Petrochemical Company Limited (“Shanghai Petrochemical”)
RMB 10,800
50.56
49.44
Manufacturing of synthetic fibres, resin and plastics, intermediate petrochemical products and petroleum products
Fujian Petrochemical Company Limited (“Fujian Petrochemical”) (i)
RMB 5,745
50.00
50.00
Manufacturing of plastics, intermediate petrochemical products and petroleum products
Except for Sinopec Kantons and SOIH, which are incorporated in Bermuda and Hong Kong respectively, all of the above principal subsidiaries are incorporated and operate their businesses principally in the PRC. All of the above principal subsidiaries are limited companies.
Note:
(i) The Group consolidated the financial statements of the entity because it is exposed to, or has rights to, variable returns from its involvement with the entity and has the ability to affect those returns through its power over the entity.

193CHINA PETROLEUM & CHEMICAL CORPORATION Annual Report 2016
Fina
ncia
l S
tate
men
ts (
Inte
rnat
iona
l)
NOTES TO THE CONSOLIDATED FINANCIAL STATEMENTS (CONTINUED)for the year ended 31 December 2016
37 PRINCIPAL SUBSIDIARIES (Continued)
Summarised financial information on subsidiaries with material non-controlling interests
Set out below are the summarised financial information which the amount before inter–company eliminations for each subsidiary that has non–controlling interests that are material to the Group.
Summarised consolidated balance sheet
Marketing Company SIPL Shanghai Petrochemical Fujian Petrochemical Sinopec Kantons (ii) Zhonghan WuhanAt 31
DecemberAt 31
DecemberAt 31
DecemberAt 31
DecemberAt 31
DecemberAt 31
DecemberAt 31
DecemberAt 31
DecemberAt 31
DecemberAt 31
DecemberAt 31
December2016 2015 2016 2015 2016 2015 2016 2015 2015 2016 2015RMB RMB RMB RMB RMB RMB RMB RMB RMB RMB RMB
million million million million million million million million million million millionCurrent assets 121,260 102,948 18,116 20,231 14,876 8,144 926 140 1,732 1,489 1,386Current liabilities (168,366) (156,028) (824) (5,468) (8,942) (7,726) (812) (73) (3,488) (7,521) (9,885)Net current (liabilities)/assets (47,106) (53,080) 17,292 14,763 5,934 418 114 67 (1,756) (6,032) (8,499)Non–current assets 246,514 240,312 40,067 40,075 19,070 19,676 7,845 5,487 13,025 14,686 15,815Non–current liabilities (1,460) (1,628) (39,322) (34,320) — — (721) (831) (3,384) — —Net non–current assets 245,054 238,684 745 5,755 19,070 19,676 7,124 4,656 9,641 14,686 15,815Net assets 197,948 185,604 18,037 20,518 25,004 20,094 7,238 4,723 7,885 8,654 7,316Attributable to owners of the Company 134,393 126,100 2,784 4,331 12,500 10,009 3,619 2,361 4,738 5,625 4,755Attributable to non-controlling interests 63,555 59,504 15,253 16,187 12,504 10,085 3,619 2,362 3,147 3,029 2,561
Summarised consolidated statement of comprehensive income
Year ended 31 December Marketing Company SIPL Shanghai Petrochemical Fujian Petrochemical Sinopec Kantons (ii) Zhonghan Wuhan2016 2015 2016 2015 2016 2015 2016 2015 2015 2016 2015RMB RMB RMB RMB RMB RMB RMB RMB RMB RMB RMB
million million million million million million million million million million million
Turnover 1,050,294 1,103,934 4,016 6,557 77,843 80,748 4,968 5,532 1,642 11,703 14,077Profit/(loss) for the year 26,461 23,684 (4,604) (222) 5,981 3,310 2,513 1,456 825 1,558 1,738Total comprehensive income/(loss) 27,385 24,391 (2,481) (4,257) 6,000 3,310 2,513 1,456 302 1,558 1,738Comprehensive income/(loss) attributable to non–controlling interests 9,028 7,755 (3,279) (1,218) 2,964 1,655 1,256 728 120 545 608Dividends paid to non–controlling interests 4,932 7,356 — — 563 10 — — 40 — —
Summarised statement of cash flows
Year ended 31 December Marketing Company SIPL Shanghai Petrochemical Fujian Petrochemical Sinopec Kantons (ii) Zhonghan Wuhan2016 2015 2016 2015 2016 2015 2016 2015 2015 2016 2015RMB RMB RMB RMB RMB RMB RMB RMB RMB RMB RMB
million million million million million million million million million million millionNet cash generated from/(used in) operating activities 50,840 33,196 2,576 4,059 7,182 4,933 617 (179) 1,185 3,636 4,223Net cash (used in)/generated from investing activities (31,573) 21,180 2,729 (4,052) (190) (439) 54 76 (504) (3,080) (4,869)Net cash (used in)/generated from financing activities (20,424) (42,777) (4,414) 637 (2,637) (3,696) (55) (176) (443) (682) 588Net (decrease)/increase in cash and cash equivalents (1,157) 11,599 891 644 4,355 798 616 (279) 238 (126) (58)Cash and cash equivalents at 1 January 14,914 2,682 2,042 1,327 1,077 279 101 380 630 260 337Effect of foreign currency exchange rate changes 616 633 112 71 9 — — — 18 — (19)Cash and cash equivalents at 31 December 14,373 14,914 3,045 2,042 5,441 1,077 717 101 886 134 260
Note:
(ii) This listed company will announce its financial information for the year ended 31 December 2016 later than the Company, therefore its 2016 financial information is not currently disclosed.
194 CHINA PETROLEUM & CHEMICAL CORPORATIONAnnual Report 2016
Fina
ncia
l S
tate
men
ts (
Inte
rnat
iona
l)
NOTES TO THE CONSOLIDATED FINANCIAL STATEMENTS (CONTINUED)for the year ended 31 December 2016
38 FINANCIAL RISK MANAGEMENT AND FAIR VALUES
OverviewFinancial assets of the Group include cash and cash equivalents, time deposits with financial institutions, investments, trade accounts receivable, bills receivable, amounts due from Sinopec Group Company and fellow subsidiaries, amounts due from associates and joint ventures, available–for–sale financial assets, derivative financial instruments and other receivables. Financial liabilities of the Group include short–term and long–term debts, loans from Sinopec Group Company and fellow subsidiaries, trade accounts payable, bills payable, amounts due to Sinopec Group Company and fellow subsidiaries, derivative financial instruments and other payables.
The Group has exposure to the following risks from its uses of financial instruments:
‧ credit risk;
‧ liquidity risk;
‧ market risk.
The Board of Directors has overall responsibility for the establishment, oversight of the Group’s risk management framework, and developing and monitoring the Group’s risk management policies.
The Group’s risk management policies are established to identify and analyse the risks faced by the Group, and set appropriate risk limits and controls and to monitor risks and adherence to limits. Risk management policies and systems are reviewed regularly to reflect changes in market conditions and the Group’s activities. The Group, through its training and management controls and procedures, aims to develop a disciplined and constructive control environment in which all employees understand their roles and obligations. Internal audit department undertakes both regular and ad hoc reviews of risk management controls and procedures, the results of which are reported to the Group’s audit committee.
Credit riskCredit risk is the risk of financial loss to the Group if a customer or counterparty to a financial instrument fails to meet its contractual obligations, and arises principally from the Group’s deposits placed with financial institutions and receivables from customers. To limit exposure to credit risk relating to deposits, the Group primarily places cash deposits only with large financial institutions in the PRC with acceptable credit ratings. The majority of the Group’s trade accounts receivable relate to sales of petroleum and chemical products to related parties and third parties operating in the petroleum and chemical industries. No single customer accounted for greater than 10% of total accounts receivable at 31 December 2016, except the amounts due from Sinopec Group Company and fellow subsidiaries. Management performs ongoing credit evaluations of the Group’s customers’ financial condition and generally does not require collateral on trade accounts receivable. The Group maintains an impairment loss for doubtful accounts and actual losses have been within management’s expectations.
The carrying amounts of cash and cash equivalents, time deposits with financial institutions, trade accounts and bills receivables, derivative financial instruments and other receivables, represent the Group’s maximum exposure to credit risk in relation to financial assets.

195CHINA PETROLEUM & CHEMICAL CORPORATION Annual Report 2016
Fina
ncia
l S
tate
men
ts (
Inte
rnat
iona
l)
NOTES TO THE CONSOLIDATED FINANCIAL STATEMENTS (CONTINUED)for the year ended 31 December 2016
38 FINANCIAL RISK MANAGEMENT AND FAIR VALUES (Continued)
Liquidity risk Liquidity risk is the risk that the Group will not be able to meet its financial obligations as they fall due. The Group’s approach in managing
liquidity is to ensure, as far as possible, that it will always have sufficient liquidity to meet its liabilities when due, under both normal and stressed conditions, without incurring unacceptable losses or risking damage to the Group’s reputation. Management prepares monthly cash flow budget to ensure that the Group will always have sufficient liquidity to meet its financial obligations as they fall due. The Group arranges and negotiates financing with financial institutions and maintains a certain level of standby credit facilities to reduce the Group’s liquidity risk.
At 31 December 2016, the Group has standby credit facilities with several PRC financial institutions which provide borrowings up to RMB 256,375 million (2015: RMB 297,997 million) on an unsecured basis, at a weighted average interest rate of 3.57% per annum (2015: 2.50%). At 31 December 2016, the Group’s outstanding borrowings under these facilities were RMB 36,933 million (2015: RMB 32,991 million) and were included in debts.
The following table sets out the remaining contractual maturities at the balance sheet date of the Group’s financial liabilities, which are based on contractual undiscounted cash flows (including interest payments computed using contractual rates or, if floating, based on prevailing rates current at the balance sheet date) and the earliest date the Group would be required to repay:
31 December 2016Total
contractual Within More than 1 More than 2Carrying undiscounted 1 year or year but less years but less More thanamount cash flow on demand than 2 years than 5 years 5 years
RMB million RMB million RMB million RMB million RMB million RMB million
Short–term debts 56,239 57,515 57,515 — — —Long–term debts 72,674 85,021 2,672 27,277 30,535 24,537Loans from Sinopec Group Company and fellow subsidiaries 63,352 63,678 18,790 2,092 42,796 —Trade accounts payable 174,301 174,301 174,301 — — —Bills payable 5,828 5,828 5,828 — — —Accrued expenses and other payables 81,781 81,781 81,781 — — — 454,175 468,124 340,887 29,369 73,331 24,537
31 December 2015Total
contractual Within More than 1 More than 2Carrying undiscounted 1 year or year but less years but less More thanamount cash flow on demand than 2 years than 5 years 5 years
RMB million RMB million RMB million RMB million RMB million RMB million
Short–term debts 71,517 72,476 72,476 — — —Long–term debts 95,446 110,678 3,747 41,176 41,637 24,118Loans from Sinopec Group Company and fellow subsidiaries 88,229 89,258 44,439 464 8,795 35,560Trade accounts payable 130,558 130,558 130,558 — — —Bills payable 3,566 3,566 3,566 — — —Accrued expenses and other payables 88,082 88,082 88,082 — — — 477,398 494,618 342,868 41,640 50,432 59,678
Management believes that the Group’s current cash on hand, expected cash flows from operations and available standby credit facilities from financial institutions will be sufficient to meet the Group’s short-term and long-term capital requirements.
196 CHINA PETROLEUM & CHEMICAL CORPORATIONAnnual Report 2016
Fina
ncia
l S
tate
men
ts (
Inte
rnat
iona
l)
NOTES TO THE CONSOLIDATED FINANCIAL STATEMENTS (CONTINUED)for the year ended 31 December 2016
38 FINANCIAL RISK MANAGEMENT AND FAIR VALUES (Continued)
Market risk Market risk is the risk that changes in market prices, such as foreign exchange rates and interest rates. The objective of market risk management is
to manage and control market risk exposures within acceptable parameters, while optimising the return on risk.
Currency risk Currency risk arises on financial instruments that are denominated in a currency other than the functional currency in which they are measured. The
Group’s currency risk exposure primarily relates to short–term and long–term debts and loans from Sinopec Group Company and fellow subsidiaries denominated in USD, EUR, SGD and HKD. The Group enters into foreign exchange contracts to manage its currency risk exposure.
Included in short–term and long–term debts and loans from Sinopec Group Company and fellow subsidiaries of the Group are the following amounts denominated in a currency other than the functional currency of the entity to which they relate:
31 December 31 December2016 2015
million million
Gross exposure arising from loans USD USD 126 USD 1,181EUR EUR 1 EUR 1,108SGD SGD 4 —HKD HKD 6 HKD 6
A 5 percent strengthening/weakening of RMB against the following currencies at 31 December 2016 and 2015 would have increased/decreased net profit for the year of the Group by the amounts shown below. This analysis has been determined assuming that the change in foreign exchange rates had occurred at the balance sheet date and had been applied to the foreign currency balances to which the Group has significant exposure as stated above, and that all other variables, in particular interest rates, remain constant. The analysis is performed on the same basis for 2015.
31 December 31 December2016 2015
RMB million RMB million
USD 33 288EUR — 295SGD 1 —
Other than the amounts as disclosed above, the amounts of other financial assets and liabilities of the Group are substantially denominated in the functional currency of respective entity within the Group.
Interest rate risk The Group’s interest rate risk exposure arises primarily from its short–term and long–term debts. Debts bearing interest at variable rates and at
fixed rates expose the Group to cash flow interest rate risk and fair value interest rate risk respectively. The interest rates of short–term and long–term debts, and loans from Sinopec Group Company and fellow subsidiaries of the Group are disclosed in Note 28.
As at 31 December 2016, it is estimated that a general increase/decrease of 100 basis points in variable interest rates, with all other variables held constant, would increase/decrease the Group’s net profit for the year by approximately RMB 44 million (2015: decrease/increase by approximately RMB 91 million). This sensitivity analysis has been determined assuming that the change of interest rates was applied to the Group’s debts outstanding at the balance sheet date with exposure to cash flow interest rate risk, which in part be eliminated by cash holdings on a variable interest rates basis. The analysis is performed on the same basis for 2015.
Commodity price risk The Group engages in oil and gas operations and is exposed to commodity price risk related to price volatility of crude oil, refined oil products and
chemical products. The fluctuations in prices of crude oil, refined oil products and chemical products could have significant impact on the Group. The Group uses derivative financial instruments, including commodity futures and swaps, to manage a portion of this risk. As at 31 December 2016, the Group had certain commodity contracts of crude oil, refined oil products and chemical products designated as qualified cash flow hedges and economic hedges. The fair values of these derivative financial instruments as at 31 December 2016 are set out in Notes 26 and 30.
As at 31 December 2016, it is estimated that a general increase/decrease of USD 10 per barrel in basic price of derivative financial instruments, with all other variables held constant, would impact the fair value of derivative financial instruments, which would decrease/increase the Group’s profit for the period by approximately RMB 634 million (2015: decrease/increase RMB 1,951 million), and decrease/increase the Group’s other reserves by approximately RMB 4,007 million (2015: decrease/increase RMB 3,052 million). This sensitivity analysis has been determined assuming that the change in prices had occurred at the balance sheet date and the change was applied to the Group’s derivative financial instruments at that date with exposure to commodity price risk. The analysis is performed on the same basis for 2015.

197CHINA PETROLEUM & CHEMICAL CORPORATION Annual Report 2016
Fina
ncia
l S
tate
men
ts (
Inte
rnat
iona
l)
NOTES TO THE CONSOLIDATED FINANCIAL STATEMENTS (CONTINUED)for the year ended 31 December 2016
38 FINANCIAL RISK MANAGEMENT AND FAIR VALUES (Continued)
Fair values
(i) Financial instruments carried at fair value
The following table presents the carrying value of financial instruments measured at fair value at the balance sheet date across the three levels of the fair value hierarchy defined in IFRS 7, ‘Financial Instruments: Disclosures’, with the fair value of each financial instrument categorised in its entirety based on the lowest level of input that is significant to that fair value measurement. The levels are defined as follows:
‧ Level 1 (highest level): fair values measured using quoted prices (unadjusted) in active markets for identical financial instruments.
‧ Level 2: fair values measured using quoted prices in active markets for similar financial instruments, or using valuation techniques in which all significant inputs are directly or indirectly based on observable market data.
‧ Level 3 (lowest level): fair values measured using valuation techniques in which any significant input is not based on observable market data.
At 31 December 2016
Level 1 Level 2 Level 3 TotalRMB million RMB million RMB million RMB million
Assets Available–for–sale financial assets:
– Listed 262 — — 262Derivative financial instruments:
– Derivative financial assets 29 733 — 762 291 733 — 1,024
Liabilities Derivative financial instruments:
– Derivative financial liabilities 2,586 1,886 — 4,472 2,586 1,886 — 4,472
At 31 December 2015
Level 1 Level 2 Level 3 TotalRMB million RMB million RMB million RMB million
Assets Available–for–sale financial assets:
– Listed 261 — — 261Derivative financial instruments:
– Derivative financial assets 4,235 3,640 — 7,875 4,496 3,640 — 8,136
Liabilities Derivative financial instruments:
– Derivative financial liabilities 305 2,445 — 2,750 305 2,445 — 2,750
During the years ended 31 December 2016 and 2015, there was no transfer between instruments in Level 1 and Level 2.
(ii) Fair values of financial instruments carried at other than fair value
The disclosures of the fair value estimates, and their methods and assumptions of the Group’s financial instruments, are made to comply with the requirements of IFRS 7 and IAS 39 and should be read in conjunction with the Group’s consolidated financial statements and related notes. The estimated fair value amounts have been determined by the Group using market information and valuation methodologies considered appropriate. However, considerable judgement is required to interpret market data to develop the estimates of fair value. Accordingly, the estimates presented herein are not necessarily indicative of the amounts the Group could realise in a current market exchange. The use of different market assumptions and/or estimation methodologies may have a material effect on the estimated fair value amounts.
The fair values of the Group’s financial instruments carried at other than fair value (other than long-term indebtedness and investments in unquoted equity securities) approximate their carrying amounts due to the short-term maturity of these instruments. The fair values of long-term indebtedness are estimated by discounting future cash flows using current market interest rates offered to the Group that range from 1.06% to 4.90% (2015: 1.08% to 4.90%). The following table presents the carrying amount and fair value of the Group’s long-term indebtedness other than loans from Sinopec Group Company and fellow subsidiaries at 31 December 2016 and 2015:
198 CHINA PETROLEUM & CHEMICAL CORPORATIONAnnual Report 2016
Fina
ncia
l S
tate
men
ts (
Inte
rnat
iona
l)
NOTES TO THE CONSOLIDATED FINANCIAL STATEMENTS (CONTINUED)for the year ended 31 December 2016
38 FINANCIAL RISK MANAGEMENT AND FAIR VALUES (Continued)
Fair values (Continued)
(ii) Fair values of financial instruments carried at other than fair value (Continued)
31 December 31 December2016 2015
RMB million RMB million
Carrying amount 110,969 105,927Fair value 109,308 103,482
The Group has not developed an internal valuation model necessary to estimate the fair values of loans from Sinopec Group Company and fellow subsidiaries as it is not considered practicable to estimate their fair values because the cost of obtaining discount and borrowing rates for comparable borrowings would be excessive based on the Reorganisation, the Group’s existing capital structure and the terms of the borrowings.
Investments in unquoted equity securities are individually and in the aggregate not material to the Group’s financial condition or results of operations. There are no listed market prices for such interests in the PRC and, accordingly, a reasonable estimate of fair value could not be made without incurring excessive costs. The Group intends to hold these unquoted other investments in equity securities for long term purpose.
Except for the above items, the financial assets and liabilities of the Group are carried at amounts not materially different from their fair values at 31 December 2016 and 2015.
39 ACCOUNTING ESTIMATES AND JUDGEMENTS
The Group’s financial condition and results of operations are sensitive to accounting methods, assumptions and estimates that underlie the preparation of the consolidated financial statements. Management bases the assumptions and estimates on historical experience and on various other assumptions that it believes to be reasonable and which form the basis for making judgements about matters that are not readily apparent from other sources. On an ongoing basis, management evaluates its estimates. Actual results may differ from those estimates as facts, circumstances and conditions change.
The selection of critical accounting policies, the judgements and other uncertainties affecting application of such policies and the sensitivity of reported results to changes in conditions and assumptions are factors to be considered when reviewing the consolidated financial statements. The significant accounting policies are set forth in Note 2. Management believes the following critical accounting policies involve the most significant judgements and estimates used in the preparation of the consolidated financial statements.
Oil and gas properties and reservesThe accounting for the exploration and production’s oil and gas activities is subject to accounting rules that are unique to the oil and gas industry. There are two methods to account for oil and gas business activities, the successful efforts method and the full cost method. The Group has elected to use the successful efforts method. The successful efforts method reflects the volatility that is inherent in exploring for mineral resources in that costs of unsuccessful exploratory efforts are charged to expense as they are incurred. These costs primarily include dry hole costs, seismic costs and other exploratory costs. Under the full cost method, these costs are capitalised and written-off or depreciated over time.
Engineering estimates of the Group’s oil and gas reserves are inherently imprecise and represent only approximate amounts because of the subjective judgements involved in developing such information. There are authoritative guidelines regarding the engineering criteria that have to be met before estimated oil and gas reserves can be designated as “proved”. Proved and proved developed reserves estimates are updated at least annually and take into account recent production and technical information about each field. In addition, as prices and cost levels change from year to year, the estimate of proved and proved developed reserves also changes. This change is considered a change in estimate for accounting purposes and is reflected on a prospective basis in relation to depreciation rates. Oil and gas reserves have a direct impact on the assessment of the recoverability of the carrying amounts of oil and gas properties reported in the financial statements. If proved reserves estimates are revised downwards, earnings could be affected by changes in depreciation expense or an immediate write-down of the property’s carrying amount.
Future dismantlement costs for oil and gas properties are estimated with reference to engineering estimates after taking into consideration the anticipated method of dismantlement required in accordance with industry practices in similar geographic area, including estimation of economic life of oil and gas properties, technology and price level. The present values of these estimated future dismantlement costs are capitalised as oil and gas properties with equivalent amounts recognised as provisions for dismantlement costs.
Despite the inherent imprecision in these engineering estimates, these estimates are used in determining depreciation expense, impairment loss and future dismantlement costs. Capitalised costs of proved oil and gas properties are amortised on a unit-of-production method based on volumes produced and reserves.
199CHINA PETROLEUM & CHEMICAL CORPORATION Annual Report 2016
Fina
ncia
l S
tate
men
ts (
Inte
rnat
iona
l)
NOTES TO THE CONSOLIDATED FINANCIAL STATEMENTS (CONTINUED)for the year ended 31 December 2016
39 ACCOUNTING ESTIMATES AND JUDGEMENTS (Continued)
Impairment for long–lived assetsIf circumstances indicate that the net book value of a long-lived asset may not be recoverable, the asset may be considered “impaired”, and an impairment loss may be recognised in accordance with IAS 36 “Impairment of Assets”. The carrying amounts of long-lived assets are reviewed periodically in order to assess whether the recoverable amounts have declined below the carrying amounts. These assets are tested for impairment whenever events or changes in circumstances indicate that their recorded carrying amounts may not be recoverable. When such a decline has occurred, the carrying amount is reduced to recoverable amount. For goodwill, the recoverable amount is estimated annually. The recoverable amount is the greater of the net selling price and the value in use. It is difficult to precisely estimate selling price because quoted market prices for the Group’s assets or cash-generating units are not readily available. In determining the value in use, expected cash flows generated by the asset or the cash-generating unit are discounted to their present value, which requires significant judgement relating to level of sale volume, selling price and amount of operating costs. Management uses all readily available information in determining an amount that is a reasonable approximation of recoverable amount, including estimates based on reasonable and supportable assumptions and projections of sale volume, selling price and amount of operating costs.
DepreciationProperty, plant and equipment, other than oil and gas properties, are depreciated on a straight-line basis over the estimated useful lives of the assets, after taking into account the estimated residual value. Management reviews the estimated useful lives of the assets at least annually in order to determine the amount of depreciation expense to be recorded during any reporting period. The useful lives are based on the Group’s historical experience with similar assets and take into account anticipated technological changes. The depreciation expense for future periods is adjusted if there are significant changes from previous estimates.
Impairment for bad and doubtful debtsManagement estimates impairment losses for bad and doubtful debts resulting from the inability of the Group’s customers to make the required payments. Management bases the estimates on the ageing of the accounts receivable balance, customer credit-worthiness, and historical write-off experience. If the financial condition of the customers were to deteriorate, actual write-offs would be higher than estimated.
Allowance for diminution in value of inventoriesIf the costs of inventories become higher than their net realisable values, an allowance for diminution in value of inventories is recognised. Net realisable value represents the estimated selling price in the ordinary course of business, less the estimated costs of completion and the estimated costs necessary to make the sale. Management bases the estimates on all available information, including the current market prices of the finished goods and raw materials, and historical operating costs. If the actual selling prices were to be lower or the costs of completion were to be higher than estimated, the actual allowance for diminution in value of inventories could be higher than estimated.
40 EVENTS AFTER THE BALANCE SHEET DATE
According to the purchase and sale agreement signed between SOIHL Hong Kong Holding Limited (“SOIHL HK”), a wholly owned subsidiary of the Group, and Chevron Global Energy Inc. (“CGEI”) on 21 March 2017, SOIHL HK is going to acquire the equity shares of and related interest in Chevron South Africa (Proprietary) Limited and the equity shares of Chevron Botswana (Proprietary) Limited (“the Targets”) held by CGEI, in a total consideration approximate to USD 900 million (“the Transaction”). The consideration is subject to adjustment according to the circumstances of the Targets, such as the changes in working capital, at the completion. The Transaction has been approved by the Board of Directors of the Company, and is still subject to the satisfaction of the certain conditions to completion. The Targets’ principle activities are to manufacture and market refined oil products in South Africa and market refined oil products in Botswana.
41 PARENT AND ULTIMATE HOLDING COMPANY
The directors consider the parent and ultimate holding company of the Group as at 31 December 2016 is Sinopec Group Company, a state–owned enterprise established in the PRC. This entity does not produce financial statements available for public use.

200 CHINA PETROLEUM & CHEMICAL CORPORATIONAnnual Report 2016
Fina
ncia
l S
tate
men
ts (
Inte
rnat
iona
l)
NOTES TO THE CONSOLIDATED FINANCIAL STATEMENTS (CONTINUED)for the year ended 31 December 2016
42 BALANCE SHEET AND RESERVE MOVEMENT OF THE COMPANY
BALANCE SHEET OF THE COMPANY (Amounts in million) Note 31 December 31 December2016 2015RMB RMB
Non-current assets Property, plant and equipment, net 373,020 439,477Construction in progress 49,277 72,763Investment in subsidiaries 238,264 191,403Interest in associates 14,691 13,987Interest in joint ventures 15,496 13,840Available-for-sale financial assets 297 297Lease prepayments 6,114 6,492Long-term prepayments and other assets 14,731 16,018
Total non-current assets 711,890 754,277Current assets
Cash and cash equivalents 88,120 46,453Time deposits with financial institutions 10,130 —Trade accounts receivable 38,332 29,512Bills receivable 471 540Inventories 46,942 46,029Prepaid expenses and other current assets 81,840 104,726
Total current assets 265,835 227,260Current liabilities
Short-term debts 50,574 49,131Loans from Sinopec Group Company and fellow subsidiaries 2,703 18,690Trade accounts payable 75,787 85,182Bills payable 2,761 1,852Accrued expenses and other payables 148,997 112,999
Total current liabilities 280,822 267,854Net current liabilities 14,987 40,594Total assets less current liabilities 696,903 713,683Non-current liabilities
Long-term debts 49,676 75,926Loans from Sinopec Group Company and fellow subsidiaries 44,772 44,100Deferred tax liabilities 505 177Provisions 29,767 28,968Other long-term liabilities 3,688 3,382
Total non-current liabilities 128,408 152,553 568,495 561,130Equity
Share capital 121,071 121,071Reserves (a) 447,424 440,059
Total equity 568,495 561,130
201CHINA PETROLEUM & CHEMICAL CORPORATION Annual Report 2016
Fina
ncia
l S
tate
men
ts (
Inte
rnat
iona
l)
NOTES TO THE CONSOLIDATED FINANCIAL STATEMENTS (CONTINUED)for the year ended 31 December 2016
42 BALANCE SHEET AND RESERVE MOVEMENT OF THE COMPANY (Continued)
(a) RESERVES MOVEMENT OF THE COMPANYThe reconciliation between the opening and closing balances of each component of the Group’s consolidated reserves is set out in the consolidated statement of changes in equity. Details of the change in the Company’s individual component of reserves between the beginning and the end of the year are as follows:
The Company2016 2015
RMB million RMB million
Capital reserve Balance at 1 January 9,122 9,122Others 53 —Balance at 31 December 9,175 9,122Share premium Balance at 1 January 55,850 41,824Conversion of the 2011 Convertible Bonds — 14,026Balance at 31 December 55,850 55,850Statutory surplus reserve Balance at 1 January 79,640 76,552Appropriation — 3,088Balance at 31 December 79,640 79,640Discretionary surplus reserve Balance at 1 January 117,000 117,000Balance at 31 December 117,000 117,000Other reserves Balance at 1 January (i) 1,950 1,773Share of other comprehensive loss of associates and joint ventures, net of deferred tax (149) —Cash flow hedges, net of deferred tax 557 47Special reserve 80 81Others — 49Balance at 31 December 2,438 1,950Retained earnings Balance at 1 January (i) 176,497 175,153Profit for the year 23,733 28,727Distribution to owners (Note 13) (16,829) (24,214)Appropriation — (3,088)Special reserve (80) (81)Balance at 31 December 183,321 176,497 447,424 440,059
Note:
(i) In 2014, the International Accounting Standards Board published Amendments to International Accounting Standard 27 (IAS 27) – Separate Financial Statements. These amendments allowed entities to use equity method to account for investments in subsidiaries, joint ventures and associates in their separate financial statements. Entities wishing to change to the equity method must do so retrospectively. The amendment is effective from 1 January 2016. In order to eliminate the difference regarding subsequent measurements on investments in joint ventures and associates between separate financial statements prepared in accordance with ASBE and IFRS, the Company changed its subsequent measurements on investments in associates and joint ventures from cost method to equity method in its separate financial statements prepared in accordance with IFRS from 1 January 2016. By adopting the amendments to IAS 27 – Separate Financial Statements, the balance of investments in associates, investments in joint ventures, retained earnings and other reserves as at 31 December 2015 would be increased by RMB 8,056 million, RMB 644 million, RMB 8,672 million and RMB 28 million in the separated financial statements prepared in accordance with IFRS due to the retrospective adjustment.
202 CHINA PETROLEUM & CHEMICAL CORPORATIONAnnual Report 2016
(C) DIFFERENCES BETWEEN CONSOLIDATED FINANCIAL STATEMENTS PREPARED IN ACCORDANCE WITH THE ACCOUNTING POLICIES COMPLYING WITH ASBE AND IFRS (UNAUDITED)
Fina
ncia
l S
tate
men
ts
(Dif
fere
nces
Bet
wee
n th
e A
SB
E a
nd I
FRS
)(U
naud
ited
)
Other than the differences in the classifications of certain financial statements captions and the accounting for the items described below, there are no material differences between the Group’s consolidated financial statements prepared in accordance with the accounting policies complying with ASBE and IFRS. The reconciliation presented below is included as supplemental information, is not required as part of the basic financial statements and does not include differences related to classification, presentation or disclosures. Such information has not been subject to independent audit or review. The major differences are:
(I) GOVERNMENT GRANTS
Under ASBE, grants from the government are credited to capital reserve if required by relevant governmental regulations. Under IFRS, government grants relating to the purchase of fixed assets are recognised as deferred income and are transferred to the income statement over the useful life of these assets.
(II) SAFETY PRODUCTION FUND
Under ASBE, safety production fund should be recognised in profit or loss with a corresponding increase in reserve according to PRC regulations. Such reserve is reduced for expenses incurred for safety production purposes or, when safety production related fixed assets are purchased, is reduced by the purchased cost with a corresponding increase in the accumulated depreciation. Such fixed assets are not depreciated thereafter. Under IFRS, payments are expensed as incurred, or capitalised as fixed assets and depreciated according to applicable depreciation methods.
Effects of major differences between the net profit under ASBE and the profit for the year under IFRS are analysed as follows:
Note 2016 2015RMB million RMB million
Net profit under ASBE 59,170 43,480Adjustments:
Government grants (i) 114 127Safety production fund (ii) 160 191
Profit for the year under IFRS* 59,444 43,798
Effects of major differences between the shareholders’ equity under ASBE and the total equity under IFRS are analysed as follows:
Note 31 December 31 December2016 2015
RMB million RMB million
Shareholders’ equity under ASBE 832,525 789,565Adjustments:
Government grants (i) (1,290) (1,404)Total equity under IFRS* 831,235 788,161
* The figures are extracted from the consolidated financial statements prepared in accordance with the accounting policies complying with IFRS during the year ended 31 December 2015 and 2016 which have been audited by PricewaterhouseCoopers.
203CHINA PETROLEUM & CHEMICAL CORPORATION Annual Report 2016
(D) SUPPLEMENTAL INFORMATION ON OIL AND GAS PRODUCING ACTIVITIES (UNAUDITED)
Fina
ncia
l S
tate
men
tsS
upple
men
tal
Info
rmat
ion
on O
il a
ndG
as P
roduc
ing
Act
ivit
ies
(Una
udit
ed)
In accordance with the Accounting Standards Update 2010–03, “Extractive Activities – Oil and Gas (Topic 932): Oil and Gas Reserve Estimation and Disclosures” (“ASU 2010–03”), issued by the Financial Accounting Standards Board of the United States, and in accordance with “Industrial Information Disclosure Guidelines for Public Company – No.8 Oil and Gas Exploitation”, issued by Shanghai Stock Exchange, this section provides supplemental information on oil and gas exploration and producing activities of the Group and its equity method investments at 31 December 2016 and 2015, and for the years then ended in the following six separate tables. Tables I through III provide historical cost information under IFRS pertaining to capitalised costs related to oil and gas producing activities; costs incurred in oil and gas exploration and development; and results of operation related to oil and gas producing activities. Tables IV through VI present information on the Group’s and its equity method investments’ estimated net proved reserve quantities; standardised measure of discounted future net cash flows; and changes in the standardised measure of discounted cash flows.
Tables I to VI of supplemental information on oil and gas producing activities set out below represent information of the Company and its consolidated subsidiaries and equity method investments.
Table I: Capitalised costs related to oil and gas producing activities
2016 2015RMB million RMB million
Other Other Total China countries Total China countries
The Group Property cost, wells and related equipments and facilities 650,686 606,493 44,193 613,134 572,446 40,688Supporting equipments and facilities 192,877 192,855 22 204,793 204,773 20Uncompleted wells, equipments and facilities 52,935 52,931 4 70,731 69,873 858Total capitalised costs 896,498 852,279 44,219 888,658 847,092 41,566Accumulated depreciation, depletion, amortisation and impairment losses (528,636) (495,538) (33,098) (465,393) (438,097) (27,296)Net capitalised costs 367,862 356,741 11,121 423,265 408,995 14,270
Equity method investments Share of net capitalised costs of associates and joint ventures 9,337 — 9,337 11,296 — 11,296
Total of the Group’s and its equity method investments’ net capitalised costs 377,199 356,741 20,458 434,561 408,995 25,566
Table II: Costs incurred in oil and gas exploration and development
2016 2015RMB million RMB million
Other OtherTotal China countries Total China countries
The Group Exploration 10,942 10,942 — 11,572 11,572 —Development 32,280 31,918 362 52,229 49,605 2,624Total costs incurred 43,222 42,860 362 63,801 61,177 2,624
Equity method investments Share of costs of exploration and development of associates and joint ventures 719 — 719 1,218 — 1,218
Total of the Group’s and its equity method investments’ exploration and development costs 43,941 42,860 1,081 65,019 61,177 3,842
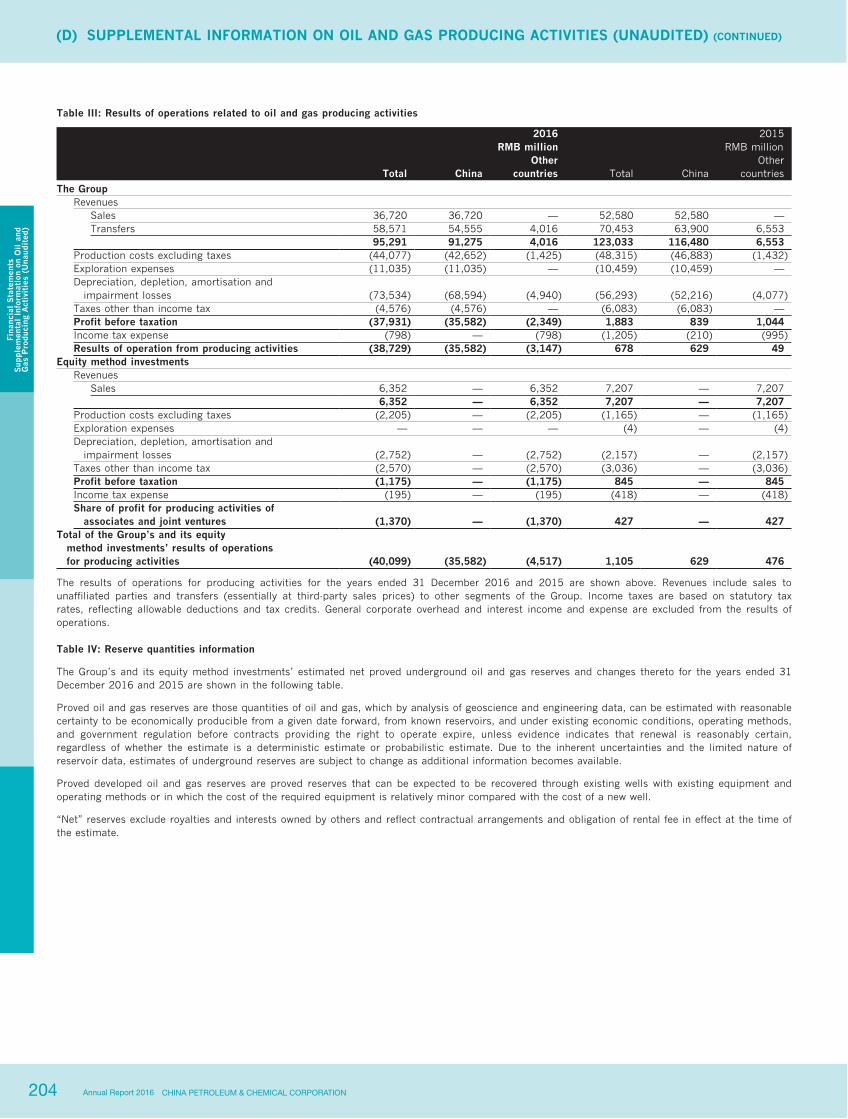
204 CHINA PETROLEUM & CHEMICAL CORPORATIONAnnual Report 2016
(D) SUPPLEMENTAL INFORMATION ON OIL AND GAS PRODUCING ACTIVITIES (UNAUDITED) (CONTINUED)
Fina
ncia
l S
tate
men
tsS
upple
men
tal
Info
rmat
ion
on O
il a
ndG
as P
roduc
ing
Act
ivit
ies
(Una
udit
ed)
Table III: Results of operations related to oil and gas producing activities
2016 2015RMB million RMB million
Other Other Total China countries Total China countries
The Group Revenues
Sales 36,720 36,720 — 52,580 52,580 —Transfers 58,571 54,555 4,016 70,453 63,900 6,553
95,291 91,275 4,016 123,033 116,480 6,553Production costs excluding taxes (44,077) (42,652) (1,425) (48,315) (46,883) (1,432)Exploration expenses (11,035) (11,035) — (10,459) (10,459) —Depreciation, depletion, amortisation and impairment losses (73,534) (68,594) (4,940) (56,293) (52,216) (4,077)Taxes other than income tax (4,576) (4,576) — (6,083) (6,083) —Profit before taxation (37,931) (35,582) (2,349) 1,883 839 1,044Income tax expense (798) — (798) (1,205) (210) (995)Results of operation from producing activities (38,729) (35,582) (3,147) 678 629 49
Equity method investments Revenues
Sales 6,352 — 6,352 7,207 — 7,207 6,352 — 6,352 7,207 — 7,207Production costs excluding taxes (2,205) — (2,205) (1,165) — (1,165)Exploration expenses — — — (4) — (4)Depreciation, depletion, amortisation and impairment losses (2,752) — (2,752) (2,157) — (2,157)Taxes other than income tax (2,570) — (2,570) (3,036) — (3,036)Profit before taxation (1,175) — (1,175) 845 — 845Income tax expense (195) — (195) (418) — (418)Share of profit for producing activities of associates and joint ventures (1,370) — (1,370) 427 — 427
Total of the Group’s and its equity method investments’ results of operations for producing activities (40,099) (35,582) (4,517) 1,105 629 476
The results of operations for producing activities for the years ended 31 December 2016 and 2015 are shown above. Revenues include sales to unaffiliated parties and transfers (essentially at third-party sales prices) to other segments of the Group. Income taxes are based on statutory tax rates, reflecting allowable deductions and tax credits. General corporate overhead and interest income and expense are excluded from the results of operations.
Table IV: Reserve quantities information
The Group’s and its equity method investments’ estimated net proved underground oil and gas reserves and changes thereto for the years ended 31 December 2016 and 2015 are shown in the following table.
Proved oil and gas reserves are those quantities of oil and gas, which by analysis of geoscience and engineering data, can be estimated with reasonable certainty to be economically producible from a given date forward, from known reservoirs, and under existing economic conditions, operating methods, and government regulation before contracts providing the right to operate expire, unless evidence indicates that renewal is reasonably certain, regardless of whether the estimate is a deterministic estimate or probabilistic estimate. Due to the inherent uncertainties and the limited nature of reservoir data, estimates of underground reserves are subject to change as additional information becomes available.
Proved developed oil and gas reserves are proved reserves that can be expected to be recovered through existing wells with existing equipment and operating methods or in which the cost of the required equipment is relatively minor compared with the cost of a new well.
“Net” reserves exclude royalties and interests owned by others and reflect contractual arrangements and obligation of rental fee in effect at the time of the estimate.
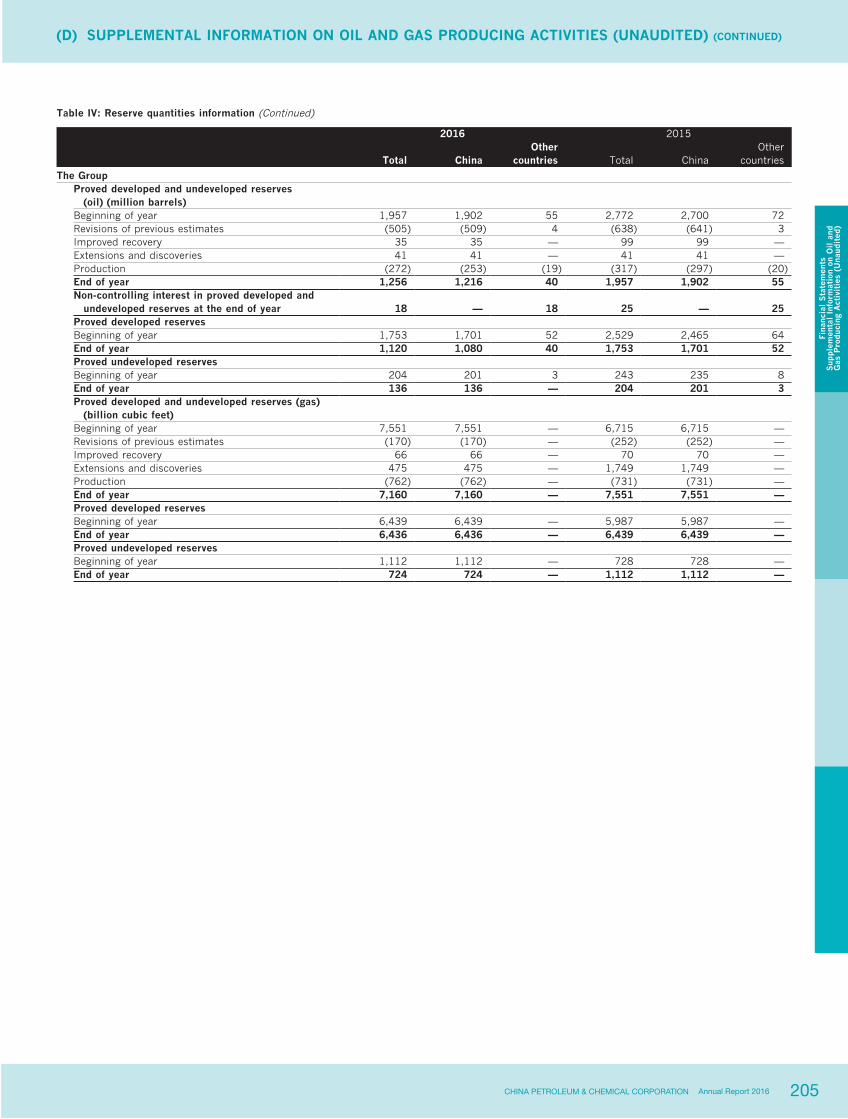
205CHINA PETROLEUM & CHEMICAL CORPORATION Annual Report 2016
(D) SUPPLEMENTAL INFORMATION ON OIL AND GAS PRODUCING ACTIVITIES (UNAUDITED) (CONTINUED)
Fina
ncia
l S
tate
men
tsS
upple
men
tal
Info
rmat
ion
on O
il a
ndG
as P
roduc
ing
Act
ivit
ies
(Una
udit
ed)
Table IV: Reserve quantities information (Continued)
2016 2015Other Other
Total China countries Total China countries
The Group Proved developed and undeveloped reserves (oil) (million barrels) Beginning of year 1,957 1,902 55 2,772 2,700 72Revisions of previous estimates (505) (509) 4 (638) (641) 3Improved recovery 35 35 — 99 99 —Extensions and discoveries 41 41 — 41 41 —Production (272) (253) (19) (317) (297) (20)End of year 1,256 1,216 40 1,957 1,902 55Non-controlling interest in proved developed and undeveloped reserves at the end of year 18 — 18 25 — 25Proved developed reserves Beginning of year 1,753 1,701 52 2,529 2,465 64End of year 1,120 1,080 40 1,753 1,701 52Proved undeveloped reserves Beginning of year 204 201 3 243 235 8End of year 136 136 — 204 201 3Proved developed and undeveloped reserves (gas) (billion cubic feet) Beginning of year 7,551 7,551 — 6,715 6,715 —Revisions of previous estimates (170) (170) — (252) (252) —Improved recovery 66 66 — 70 70 —Extensions and discoveries 475 475 — 1,749 1,749 —Production (762) (762) — (731) (731) —End of year 7,160 7,160 — 7,551 7,551 —Proved developed reserves Beginning of year 6,439 6,439 — 5,987 5,987 —End of year 6,436 6,436 — 6,439 6,439 —Proved undeveloped reserves Beginning of year 1,112 1,112 — 728 728 —End of year 724 724 — 1,112 1,112 —
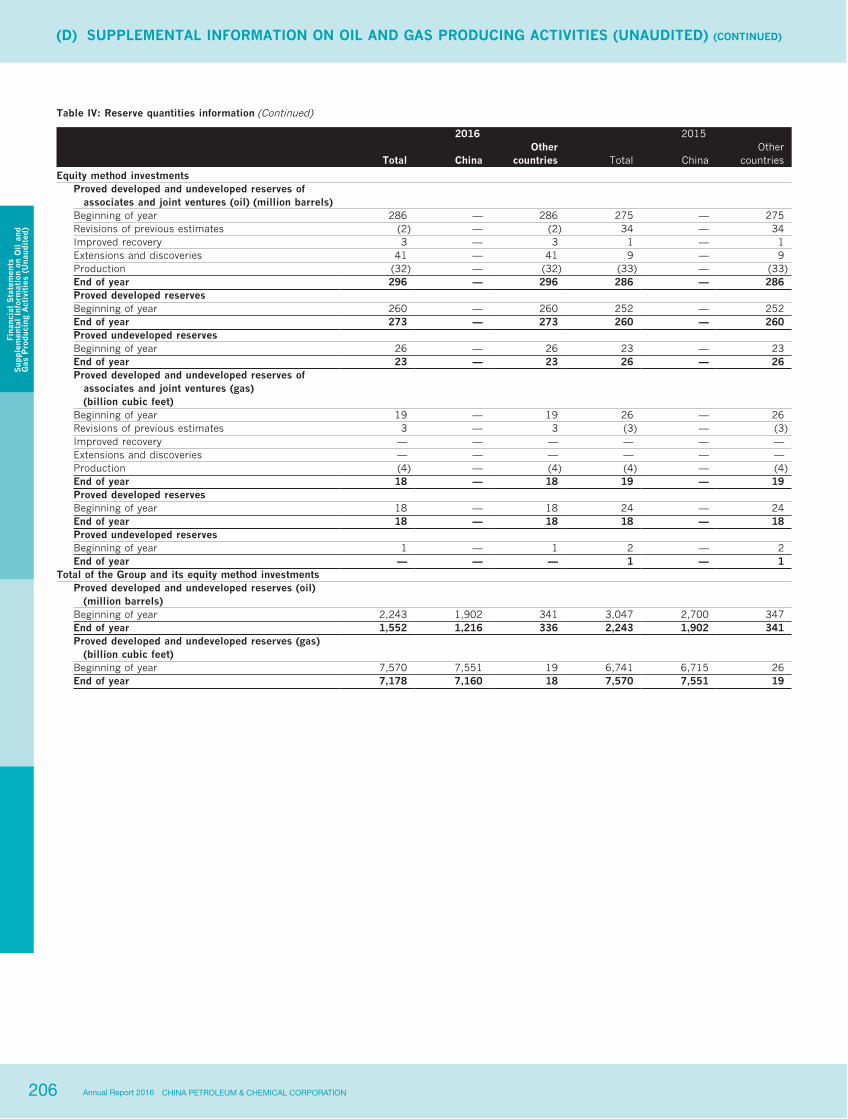
206 CHINA PETROLEUM & CHEMICAL CORPORATIONAnnual Report 2016
(D) SUPPLEMENTAL INFORMATION ON OIL AND GAS PRODUCING ACTIVITIES (UNAUDITED) (CONTINUED)
Fina
ncia
l S
tate
men
tsS
upple
men
tal
Info
rmat
ion
on O
il a
ndG
as P
roduc
ing
Act
ivit
ies
(Una
udit
ed)
Table IV: Reserve quantities information (Continued)
2016 2015Other Other
Total China countries Total China countries
Equity method investments Proved developed and undeveloped reserves of associates and joint ventures (oil) (million barrels) Beginning of year 286 — 286 275 — 275Revisions of previous estimates (2) — (2) 34 — 34Improved recovery 3 — 3 1 — 1Extensions and discoveries 41 — 41 9 — 9Production (32) — (32) (33) — (33)End of year 296 — 296 286 — 286Proved developed reserves Beginning of year 260 — 260 252 — 252End of year 273 — 273 260 — 260Proved undeveloped reserves Beginning of year 26 — 26 23 — 23End of year 23 — 23 26 — 26Proved developed and undeveloped reserves of associates and joint ventures (gas) (billion cubic feet) Beginning of year 19 — 19 26 — 26Revisions of previous estimates 3 — 3 (3) — (3)Improved recovery — — — — — —Extensions and discoveries — — — — — —Production (4) — (4) (4) — (4)End of year 18 — 18 19 — 19Proved developed reserves Beginning of year 18 — 18 24 — 24End of year 18 — 18 18 — 18Proved undeveloped reserves Beginning of year 1 — 1 2 — 2End of year — — — 1 — 1
Total of the Group and its equity method investments Proved developed and undeveloped reserves (oil) (million barrels) Beginning of year 2,243 1,902 341 3,047 2,700 347End of year 1,552 1,216 336 2,243 1,902 341Proved developed and undeveloped reserves (gas) (billion cubic feet) Beginning of year 7,570 7,551 19 6,741 6,715 26End of year 7,178 7,160 18 7,570 7,551 19

207CHINA PETROLEUM & CHEMICAL CORPORATION Annual Report 2016
(D) SUPPLEMENTAL INFORMATION ON OIL AND GAS PRODUCING ACTIVITIES (UNAUDITED) (CONTINUED)
Fina
ncia
l S
tate
men
tsS
upple
men
tal
Info
rmat
ion
on O
il a
ndG
as P
roduc
ing
Act
ivit
ies
(Una
udit
ed)
Table V: Standardised measure of discounted future net cash flows
The standardised measure of discounted future net cash flows, related to the above proved oil and gas reserves, is calculated in accordance with the requirements of ASU 2010–03 and “Industrial Information Disclosure Guidelines for Public Company – No.8 Oil and Gas Exploitation”. Estimated future cash inflows from production are computed by applying the average, first-day-of-the-month price for oil and gas during the twelve-month period before the ending date of the period covered by the report to year-end quantities of estimated net proved reserves. Future price changes are limited to those provided by contractual arrangements in existence at the end of each reporting year. Future development and production costs are those estimated future expenditures necessary to develop and produce year-end estimated proved reserves based on year-end cost indices, assuming continuation of year-end economic conditions. Estimated future income taxes are calculated by applying appropriate year-end statutory tax rates to estimated future pre-tax net cash flows, less the tax basis of related assets. Discounted future net cash flows are calculated using 10% discount factors. This discounting requires a year-by-year estimate of when the future expenditure will be incurred and when the reserves will be produced.
The information provided does not represent management’s estimate of the Group’s and its equity method investments’ expected future cash flows or value of proved oil and gas reserves. Estimates of proved reserve quantities are imprecise and change over time as new information becomes available. Moreover, probable and possible reserves, which may become proved in the future, are excluded from the calculations. The arbitrary valuation requires assumptions as to the timing and amount of future development and production costs. The calculations are made for the years ended 31 December 2016 and 2015 and should not be relied upon as an indication of the Group’s and its equity method investments’ future cash flows or value of its oil and gas reserves.
2016 2015RMB million RMB million
Total ChinaOther
countries Total ChinaOther
countries
The Group Future cash flows 603,785 592,389 11,396 931,637 912,898 18,739Future production costs (271,650) (266,549) (5,101) (440,079) (430,695) (9,384)Future development costs (20,241) (15,615) (4,626) (38,669) (34,092) (4,577)Future income tax expenses (1,405) — (1,405) (11,139) (9,779) (1,360)Undiscounted future net cash flows 310,489 310,225 264 441,750 438,332 3,41810% annual discount for estimated timing of cash flows (102,342) (102,332) (10) (152,031) (150,855) (1,176)Standardised measure of discounted future net cash flows 208,147 207,893 254 289,719 287,477 2,242Discounted future net cash flows attributable to non-controlling interests 114 — 114 1,356 — 1,356
Equity method investments Future cash flows 35,690 — 35,690 41,013 — 41,013Future production costs (10,783) — (10,783) (11,665) — (11,665)Future development costs (3,444) — (3,444) (2,996) — (2,996)Future income tax expenses (3,303) — (3,303) (4,159) — (4,159)Undiscounted future net cash flows 18,160 — 18,160 22,193 — 22,19310% annual discount for estimated timing of cash flows (7,969) — (7,969) (9,828) — (9,828)Standardised measure of discounted future net cash flows 10,191 — 10,191 12,365 — 12,365
Total of the Group’s and its equity method investments’ results of standardised measure of discounted future net cash flows 218.338 207,893 10,445 302,084 287,477 14,607
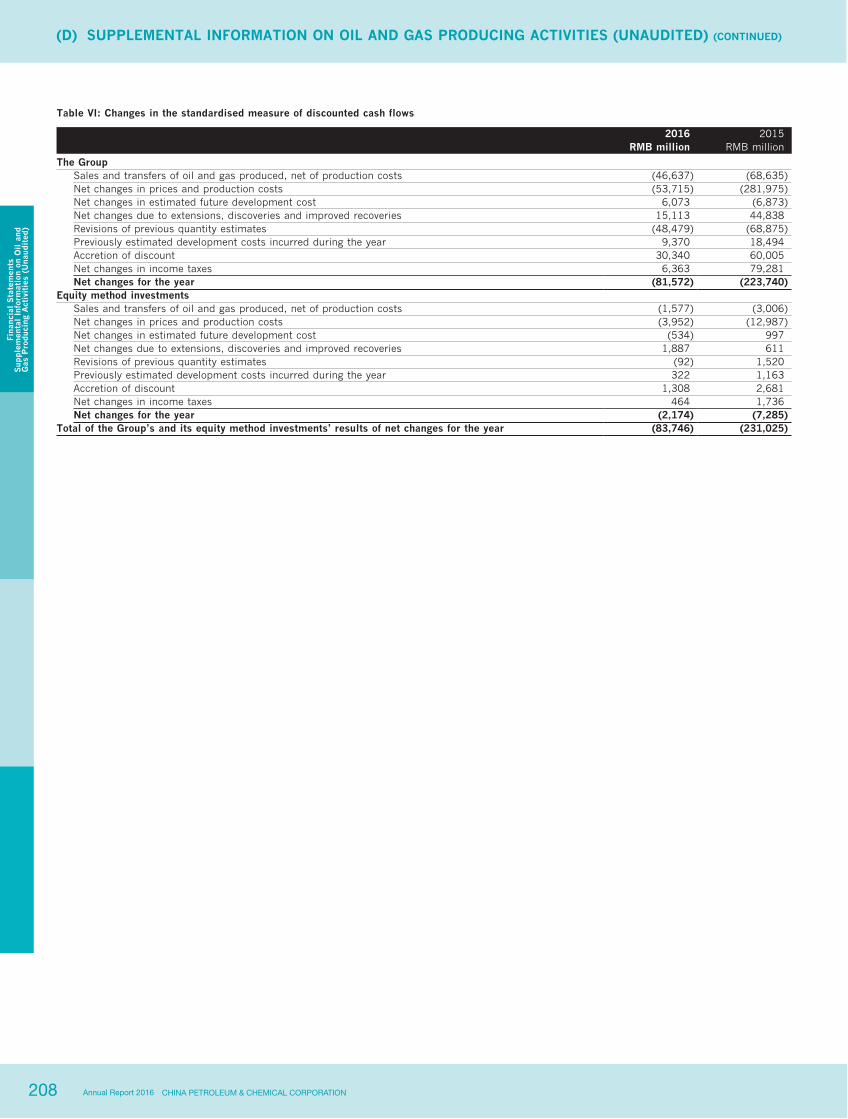
208 CHINA PETROLEUM & CHEMICAL CORPORATIONAnnual Report 2016
(D) SUPPLEMENTAL INFORMATION ON OIL AND GAS PRODUCING ACTIVITIES (UNAUDITED) (CONTINUED)
Fina
ncia
l S
tate
men
tsS
upple
men
tal
Info
rmat
ion
on O
il a
ndG
as P
roduc
ing
Act
ivit
ies
(Una
udit
ed)
Table VI: Changes in the standardised measure of discounted cash flows
2016 2015RMB million RMB million
The Group Sales and transfers of oil and gas produced, net of production costs (46,637) (68,635)Net changes in prices and production costs (53,715) (281,975)Net changes in estimated future development cost 6,073 (6,873)Net changes due to extensions, discoveries and improved recoveries 15,113 44,838Revisions of previous quantity estimates (48,479) (68,875)Previously estimated development costs incurred during the year 9,370 18,494Accretion of discount 30,340 60,005Net changes in income taxes 6,363 79,281Net changes for the year (81,572) (223,740)
Equity method investments Sales and transfers of oil and gas produced, net of production costs (1,577) (3,006)Net changes in prices and production costs (3,952) (12,987)Net changes in estimated future development cost (534) 997Net changes due to extensions, discoveries and improved recoveries 1,887 611Revisions of previous quantity estimates (92) 1,520Previously estimated development costs incurred during the year 322 1,163Accretion of discount 1,308 2,681Net changes in income taxes 464 1,736Net changes for the year (2,174) (7,285)
Total of the Group’s and its equity method investments’ results of net changes for the year (83,746) (231,025)

209CHINA PETROLEUM & CHEMICAL CORPORATION Annual Report 2016
Cor
por
ate
Info
rmat
ion
CORPORATE INFORMATION
STATUTORY NAME中国石油化工股份有限公司
ENGLISH NAMEChina Petroleum & Chemical Corporation
CHINESE ABBREVIATION中国石化
ENGLISH ABBREVIATIONSinopec Corp.
LEGAL REPRESENTATIVEMr. Wang Yupu
AUTHORISED REPRESENTATIVESMr. Dai HouliangMr. Huang Wensheng
SECRETARY TO THE BOARDMr. Huang Wensheng
REPRESENTATIVE ON SECURITIES MATTERSMr. Zheng Baomin
REGISTERED ADDRESS AND PLACE OF BUSINESSNo.22 Chaoyangmen North Street,Chaoyang DistrictBeijing, PRCPostcode : 100728Tel. : 86-10-59960028Fax : 86-10-59960386Website : http://www.sinopec.comE-mail addresses : [email protected]
PLACE OF BUSINESS IN HONG KONG20th Floor, Office TowerConvention Plaza1 Harbour RoadWanchaiHong Kong
INFORMATION DISCLOSURE AND PLACES FOR COPIES OF RELATIVE REPORTSNo change during the reporting period
LEGAL ADVISORSPeople’s Republic of China:Haiwen & Partners20th Floor, Fortune Financial CentreNo. 5, Dong San Huan Central RoadChaoyang DistrictBeijing PRCPostcode: 100020
Hong Kong:Herbert Smith Freehills
23rd Floor, Gloucester Tower
15 Queen’s Road
Central, Hong Kong
U.S.A.Skadden, Arps, Slate, Meagher & Flom LLP
42/F, Edinburgh Tower, The Landmark
15 Queen’s Road, Central, Hong Kong
REGISTRARSA Shares:China Securities Registration and Clearing
Company Limited Shanghai Branch Company
36th Floor, China Insurance Building
166 Lujiazui East Road
Shanghai, PRC
H Shares:Hong Kong Registrars Limited
R1712-1716, 17th Floor, Hopewell Centre
183 Queen’s Road East
Hong Kong
DEPOSITARY FOR ADRSThe US:Citibank, N.A.
388 Greenwich St., 14th Floor
New York NY 10013
United States of America
COPIES OF THIS ANNUAL REPORT ARE AVAILABLE ATThe PRC:China Petroleum & Chemical Corporation
Board Secretariat
No.22 Chaoyangmen North Street,
Chaoyang District
Beijing, PRC
The US:Citibank, N.A.
388 Greenwich St., 14th Floor
New York NY 10013
United States of America
The UK:Citibank, N.A.
Citigroup Centre
Canada Square, Canary Wharf
London E14 5LB, U.K.
PLACES OF LISTING OF SHARES, STOCK NAMES AND STOCK CODESA Shares:Shanghai Stock ExchangeStock name : SINOPEC CORPStock code : 600028
H Shares:Hong Kong Stock ExchangeStock name : Sinopec CorpStock code : 00386
ADRs:New York Stock ExchangeStock name : SINOPEC CORPStock code : SNP
London Stock ExchangeStock name : SINOPEC CORPStock code : SNP
NAMES AND ADDRESSES OF AUDITORS OF SINOPEC CORP.Domestic Auditors : PricewaterhouseCoopers
Zhong Tian LLPAddress : 11th Floor
PricewaterhouseCoopers,2 Corporate Avenue,202 Hu Bin Road,Huangpu District,Shanghai, PRC 200021
Overseas Auditors : PricewaterhouseCoopersAddress : 22nd Floor,
Prince’s Building,Central, Hong Kong

210 CHINA PETROLEUM & CHEMICAL CORPORATIONAnnual Report 2016
DOCUMENTS FOR INSPECTIOND
ocum
ents
for
Ins
pec
tion
The following documents will be available for inspection during normal business hours after 24 March 2017 (Friday) at the registered address of Sinopec Corp. upon requests by the relevant regulatory authorities and shareholders in accordance with the Articles of Association and the laws and regulations of PRC:
a) The original copies of the 2016 annual
reports signed by Mr. Wang Yupu, the
Chairman;
b) The original copies of financial statements
and consolidated financial statements as of
31 December 2016 prepared under IFRS
and ABSE, signed by Mr.Wang Yupu, the
Chairman, Mr. Dai Houliang, Vice Chairman
and President, Mr. Wang Dehua, the Chief
Financial Officer and head of the financial
department of Sinopec Corp.;
c) The original auditors’ report signed by the
auditors; and
d) Copies of the documents and announcements
that Sinopec Corp. has published in the
newspapers stipulated by the CSRC during
the reporting period.
By Order of the BoardWang YupuChairman
Beijing, PRC, 24 March 2017