Embed Size (px)
Citation preview
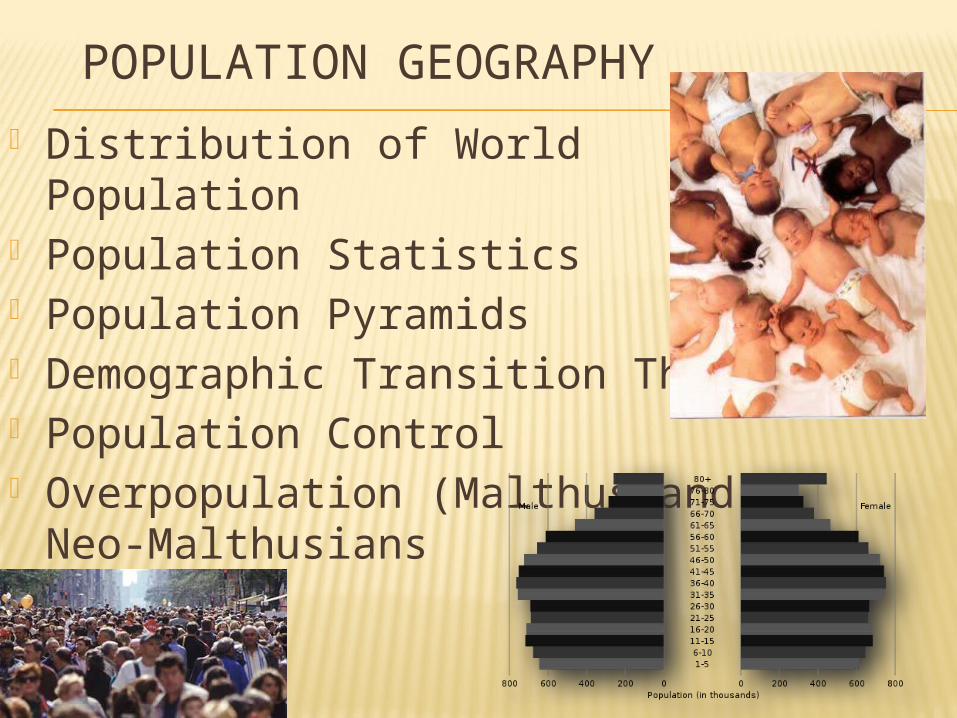
POPULATION GEOGRAPHY
Distribution of World Population Population Statistics Population Pyramids Demographic Transition Theory Population Control Overpopulation (Malthus and Neo-
Malthusians
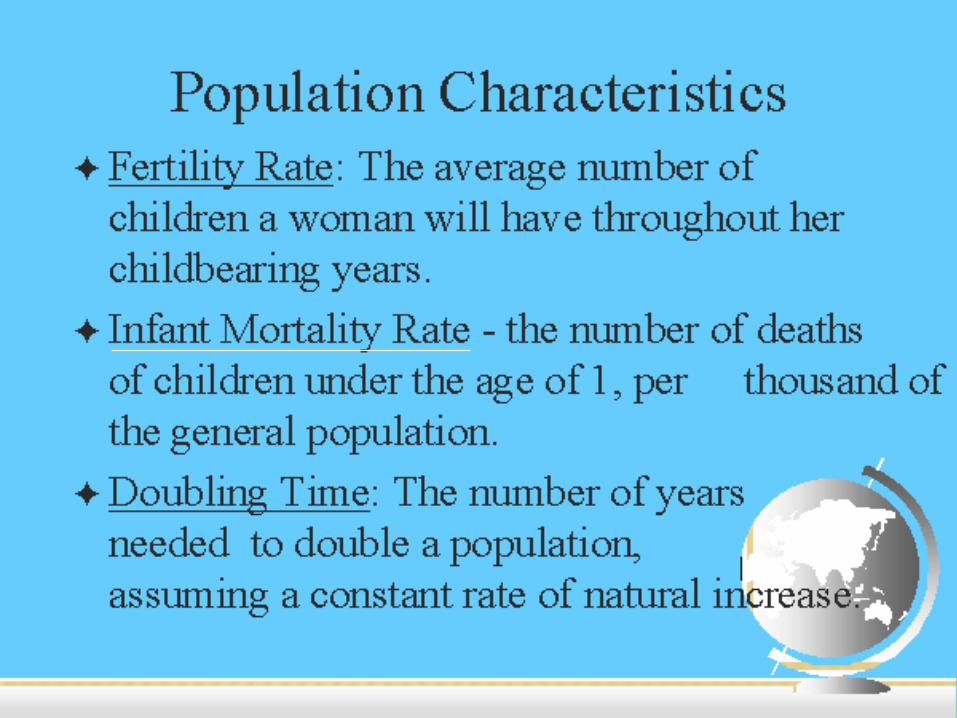
REPLACEMENT LEVEL
# of births needed to keep a population at a stable level w/o immigration of a nation. Yourself and Partner. (2.1)
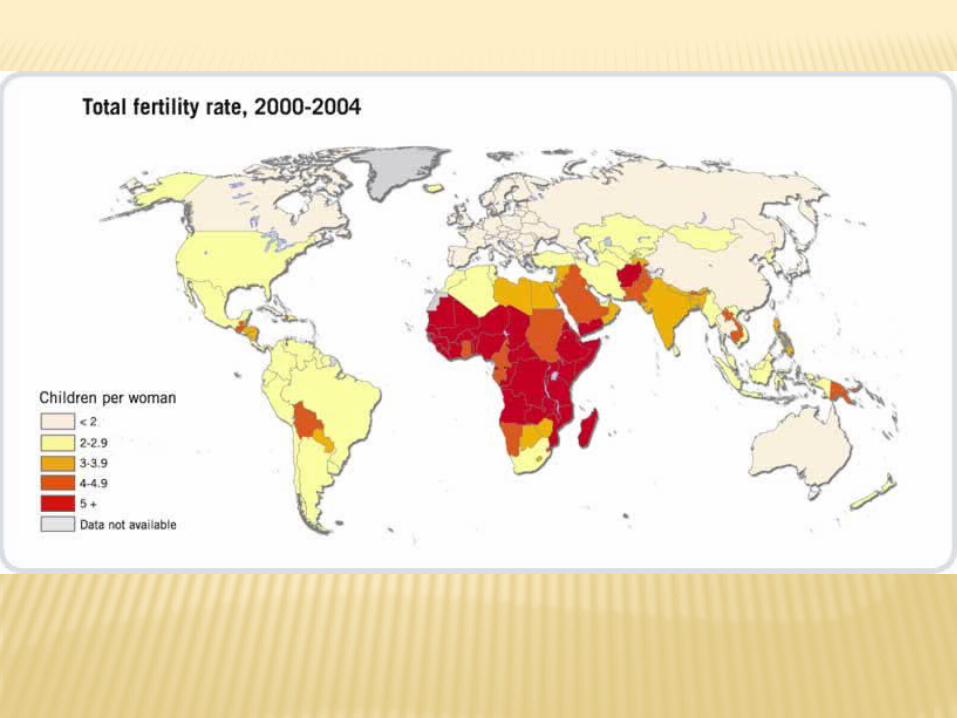
No European countries are at the replacement level.
2.1 vs. 3.32.1 is generally regarded as the replacement rate (the rate at
which a population neither grows nor shrinks) in the developed world. In less developed countries this rate should be higher (2.8?).
High infant mortality tends to result in higher fertility rates as families seek “insurance” for the loss of children.
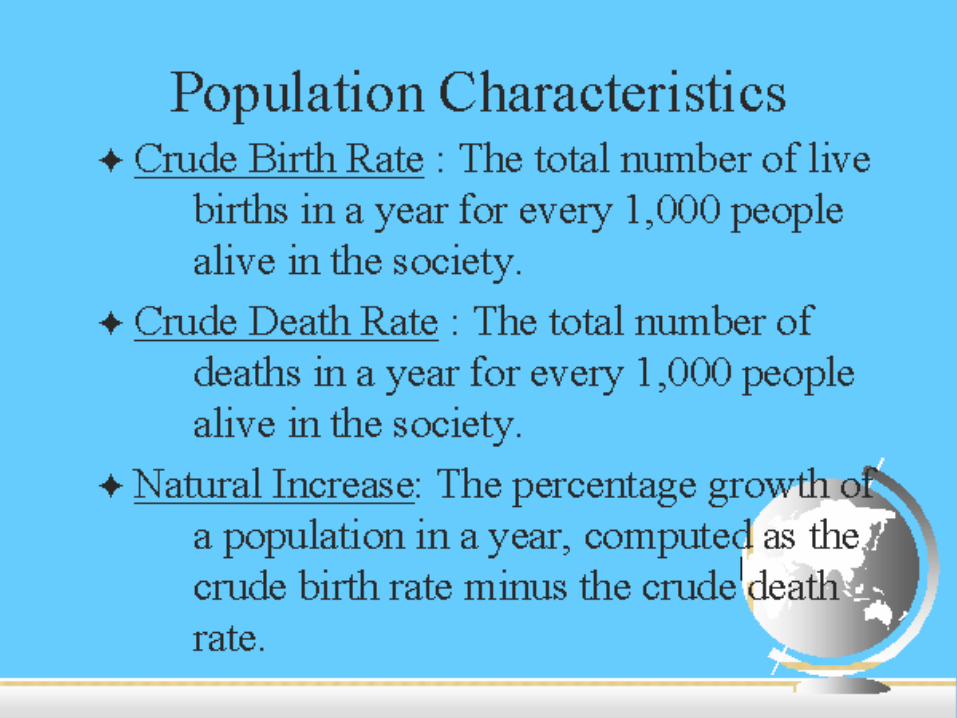
POPULATION EQUATION
Pt+1 = Pt + (B - D) + (I - E) Where Pt and Pt+1 are the sizes of
population in an area at two different points in time, t and t +1 are those points, B is the birth rate, D is the death rate, I is the immigration, and E is the emigration.
AGING POPULATIONS
What is the concern with an aging population?
Wiki Link
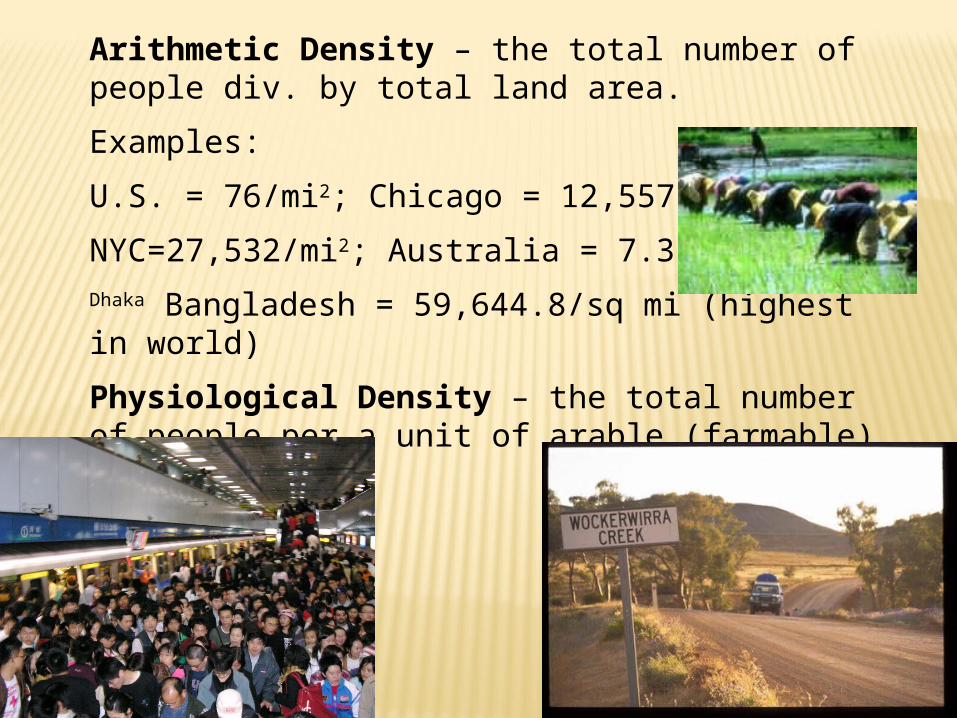
Arithmetic Density – the total number of people div. by total land area.
Examples:
U.S. = 76/mi2; Chicago = 12,557/mi2;
NYC=27,532/mi2; Australia = 7.3/mi2
Dhaka Bangladesh = 59,644.8/sq mi (highest in world)
Physiological Density – the total number of people per a unit of arable (farmable) land.
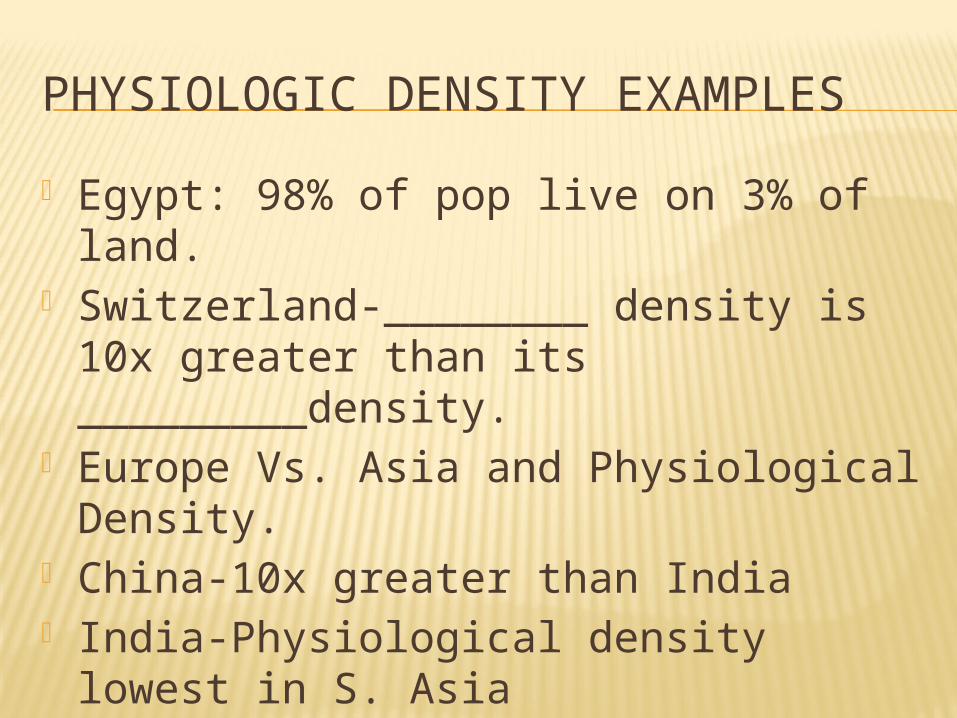
PHYSIOLOGIC DENSITY EXAMPLES
Egypt: 98% of pop live on 3% of land. Switzerland-________ density is 10x
greater than its _________density. Europe Vs. Asia and Physiological
Density. China-10x greater than India India-Physiological density lowest in S.
Asia
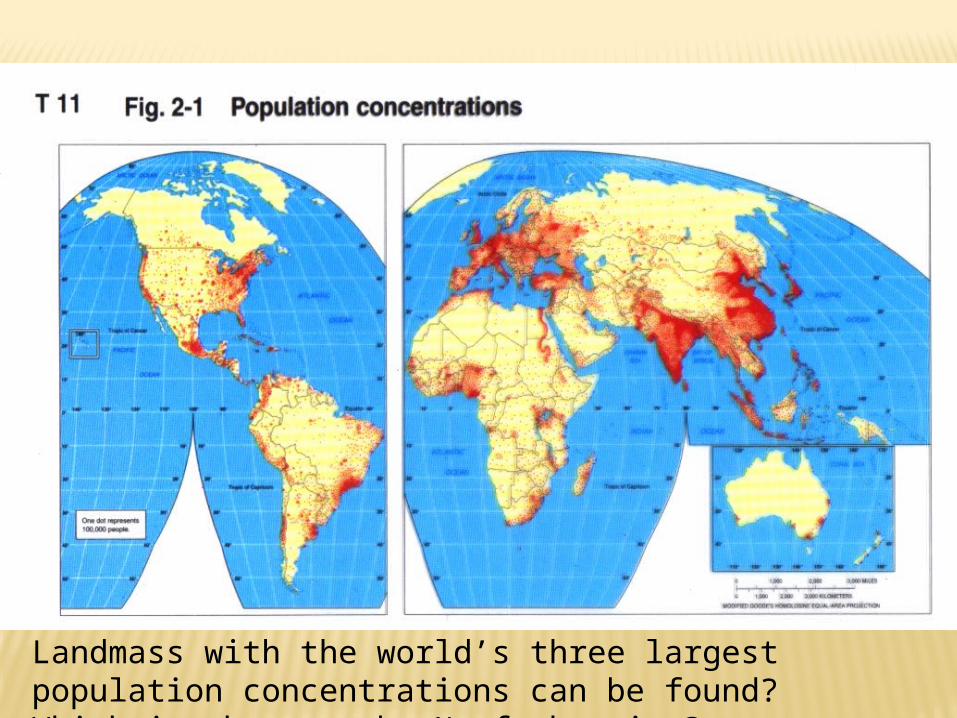
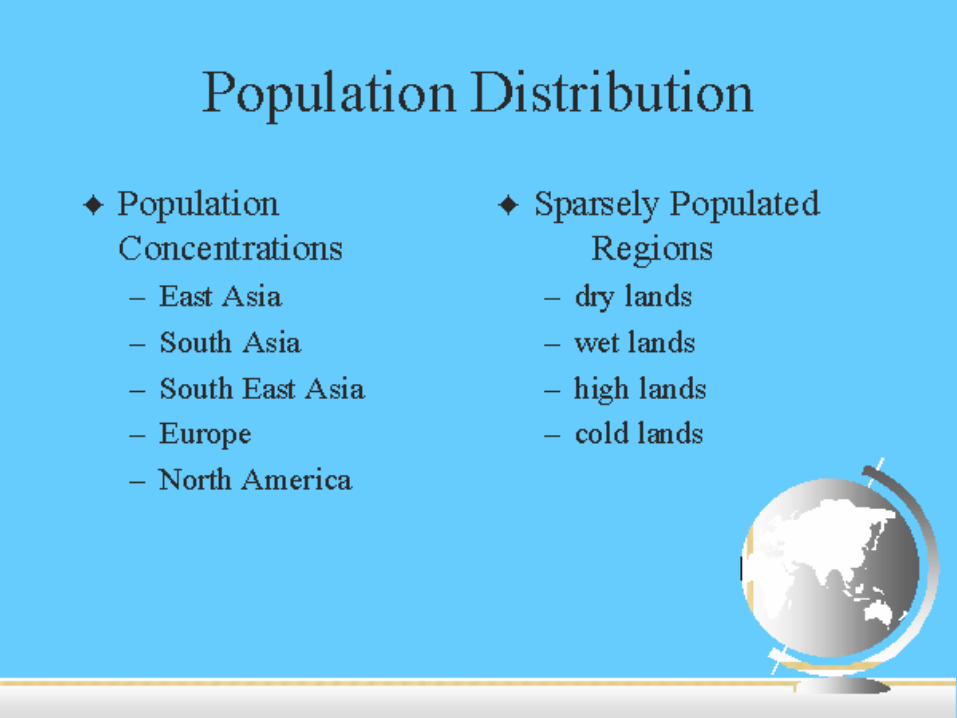
Landmass with the world’s three largest population concentrations can be found? Which is the next by ¼ of the size?
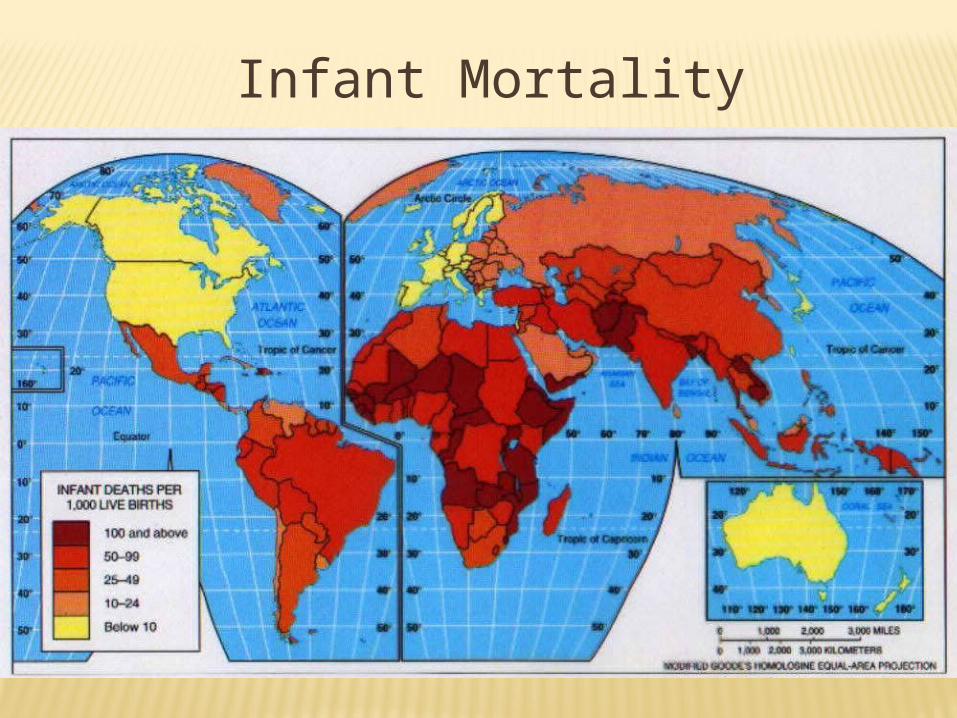
Infant Mortality
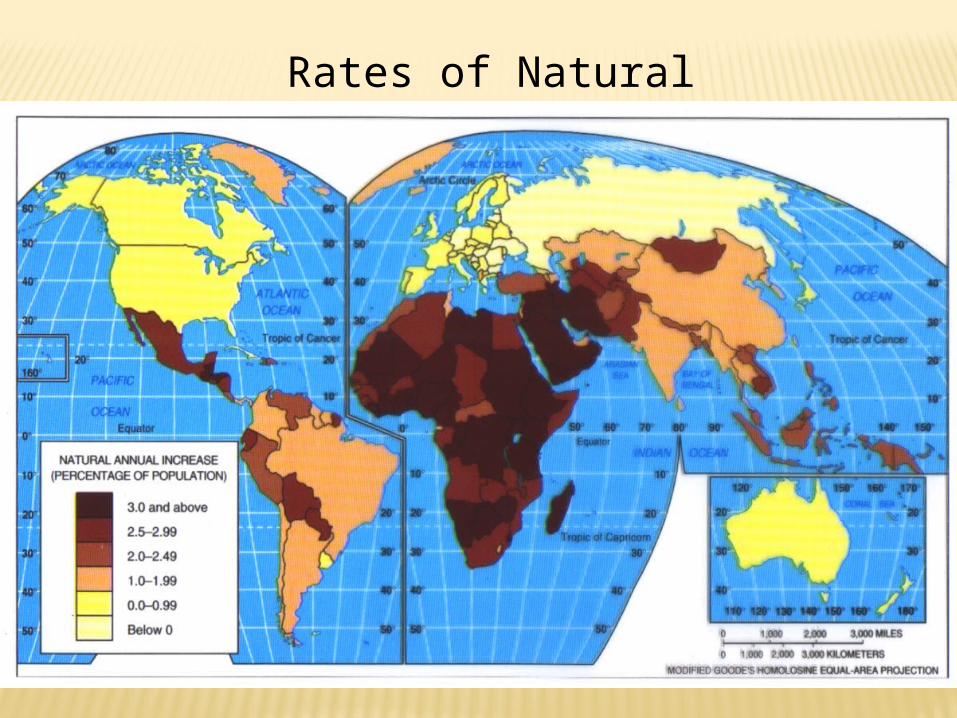
Rates of Natural Increase
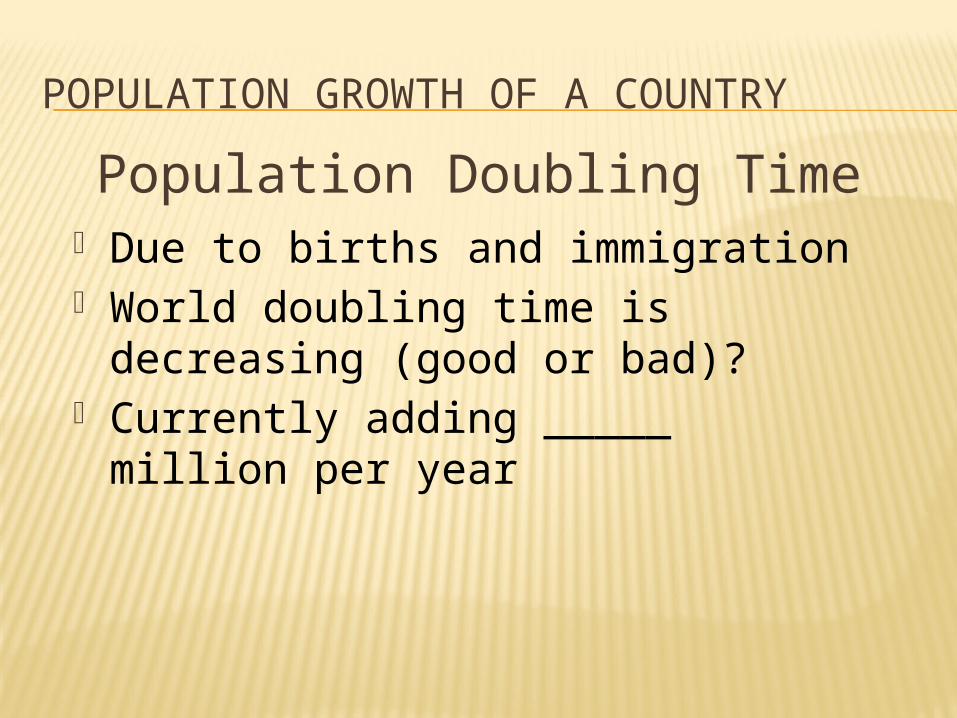
POPULATION GROWTH OF A COUNTRY
Population Doubling Time Due to births and immigration World doubling time is decreasing
(good or bad)? Currently adding _____ million per
year
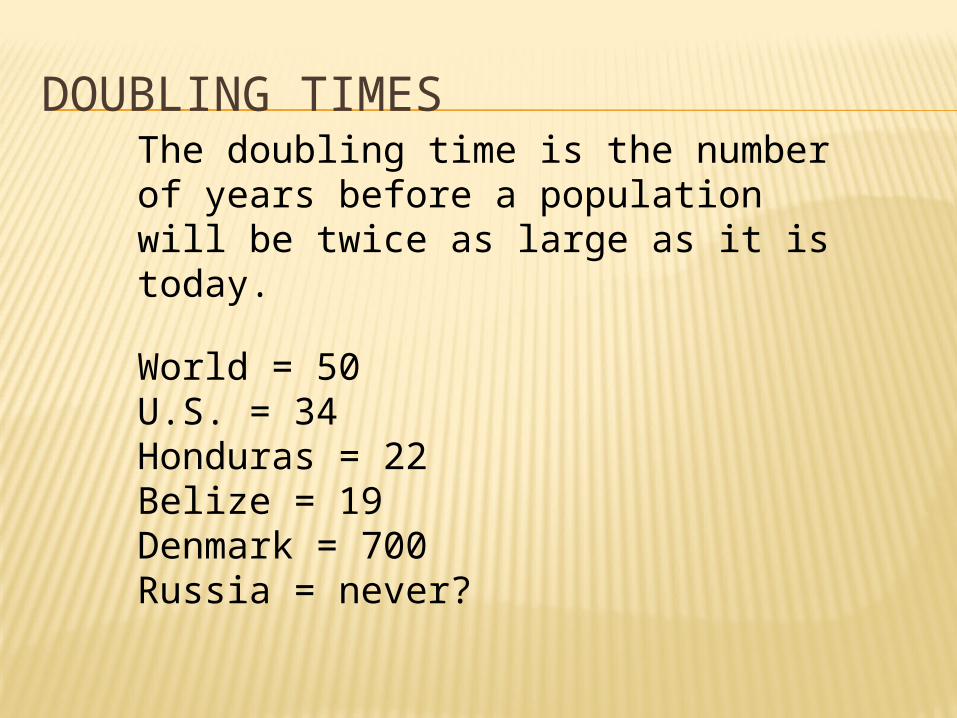
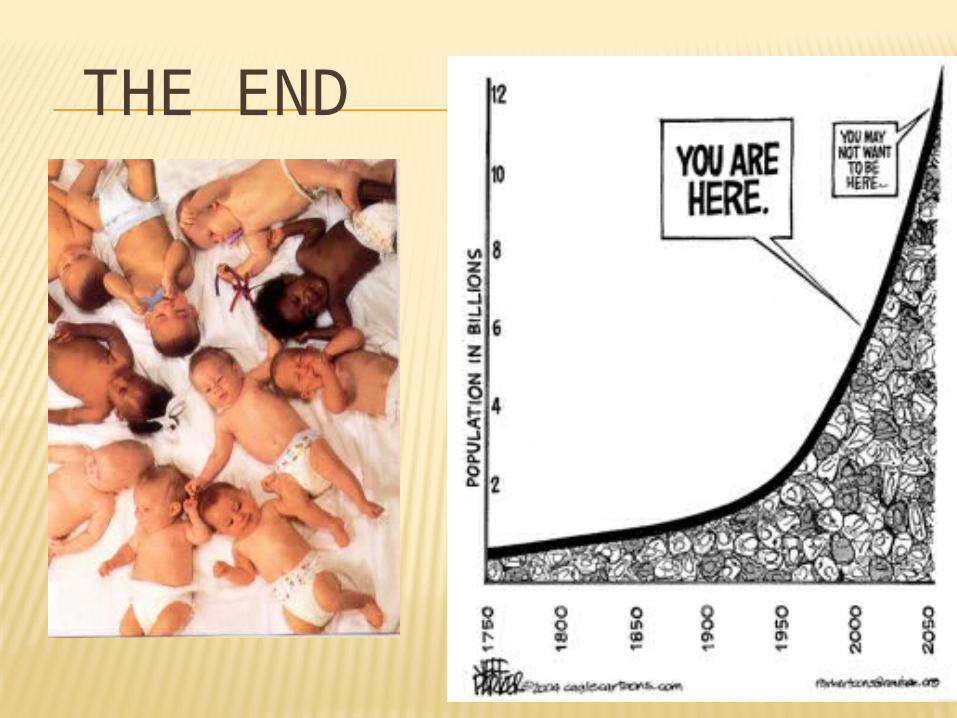
DOUBLING TIMESThe doubling time is the number of years before a population will be twice as large as it is today.
World = 50U.S. = 34Honduras = 22Belize = 19Denmark = 700Russia = never?
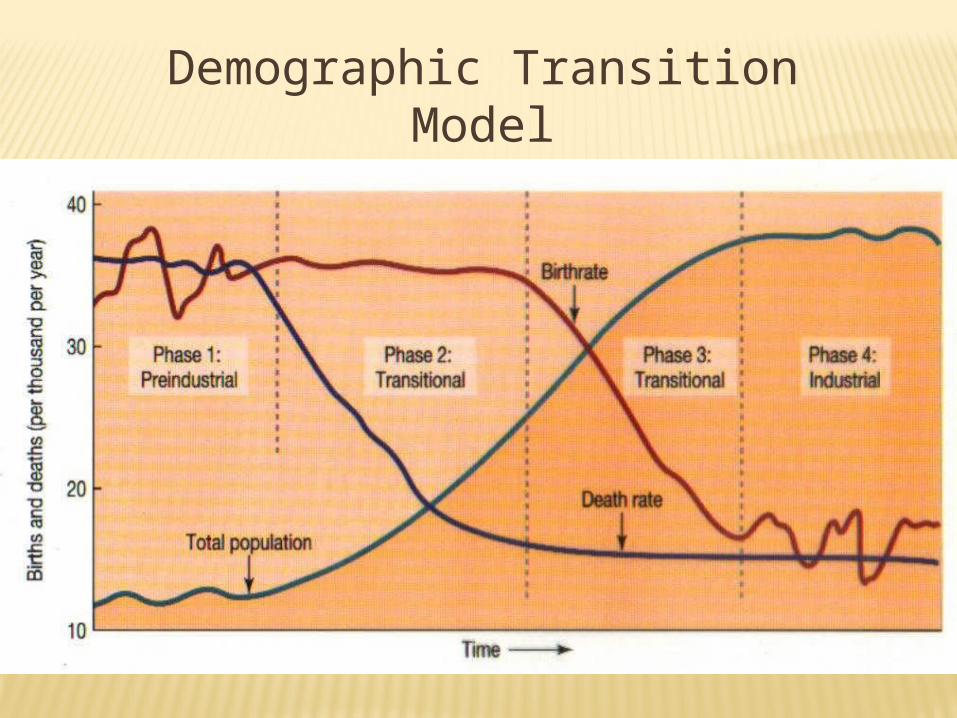
Demographic Transition Model
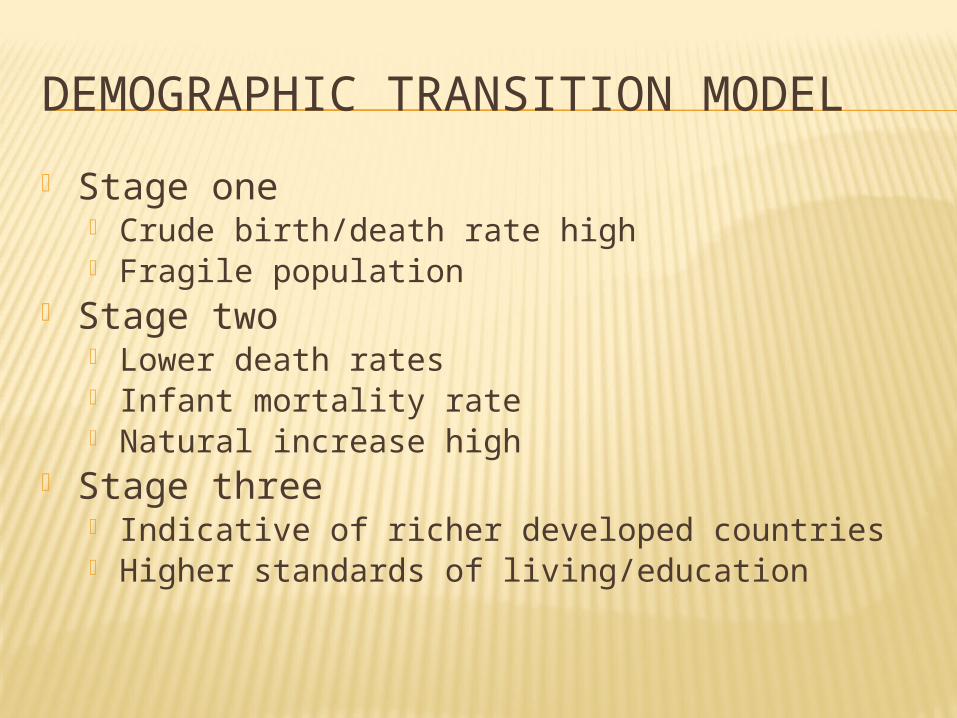
DEMOGRAPHIC TRANSITION MODEL
Stage one Crude birth/death rate high Fragile population
Stage two Lower death rates Infant mortality rate Natural increase high
Stage three Indicative of richer developed countries Higher standards of living/education
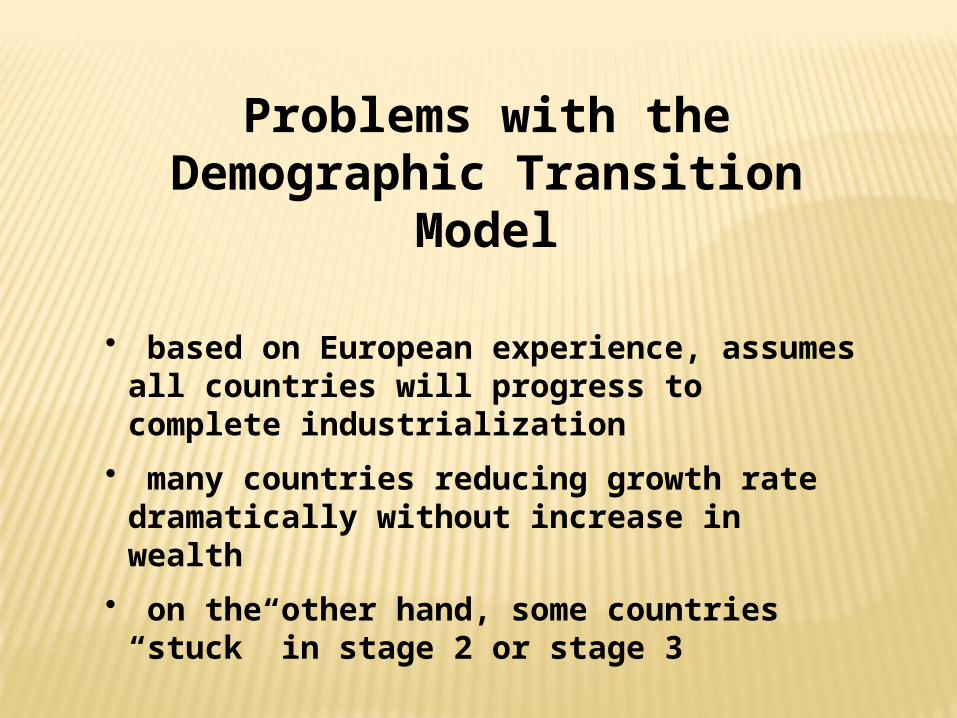
Problems with the Demographic Transition
Model
• based on European experience, assumes all countries will progress to complete industrialization
• many countries reducing growth rate dramatically without increase in wealth
• on the other hand, some countries “stuck” in stage 2 or stage 3
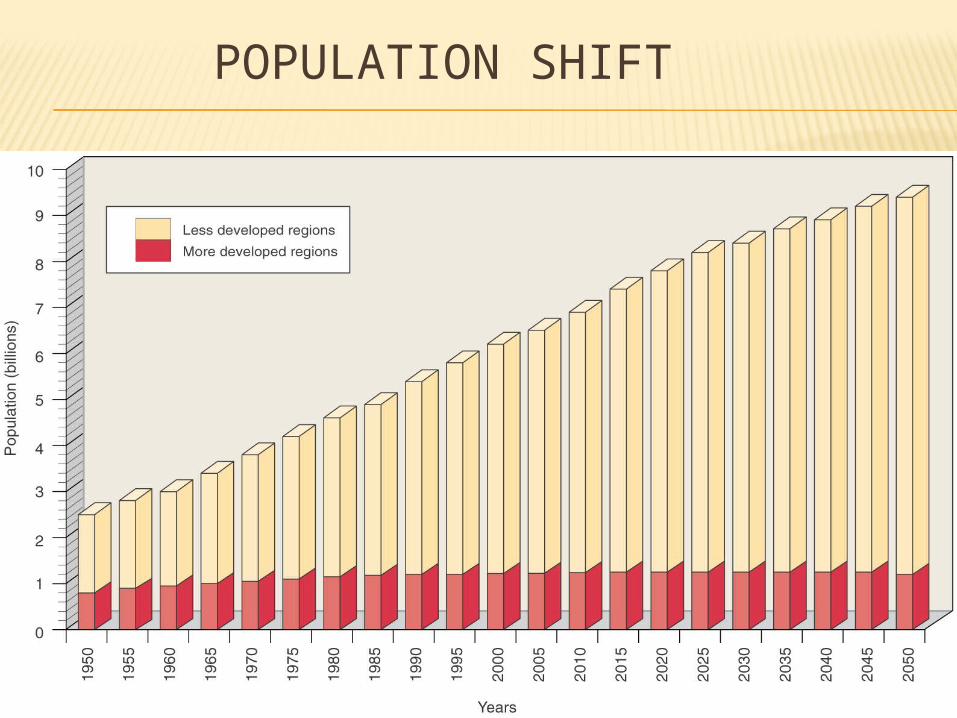
POPULATION SHIFT
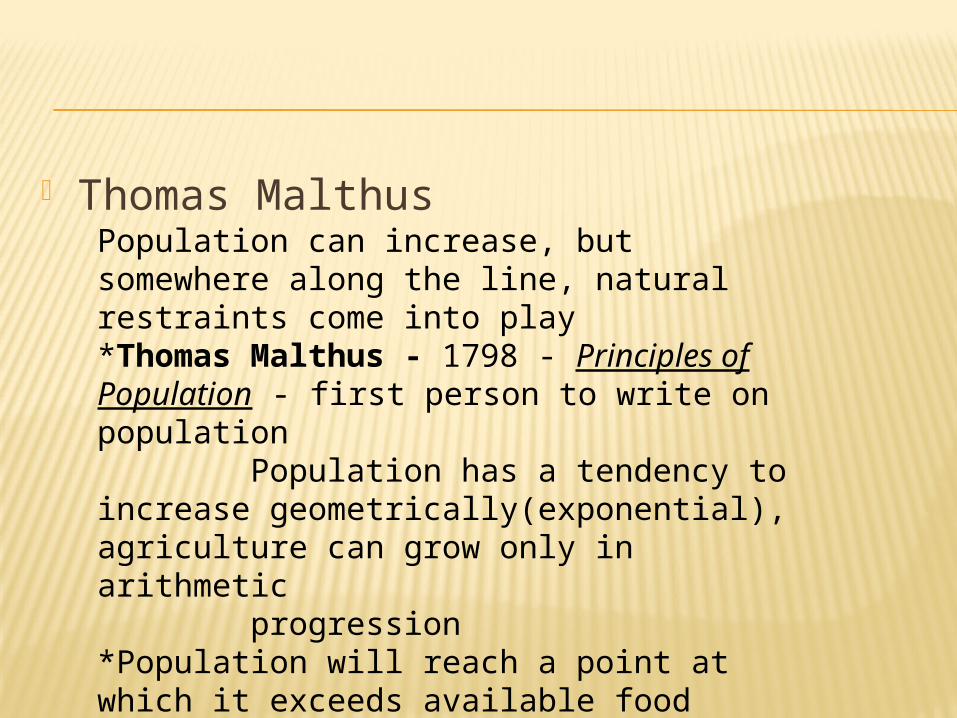
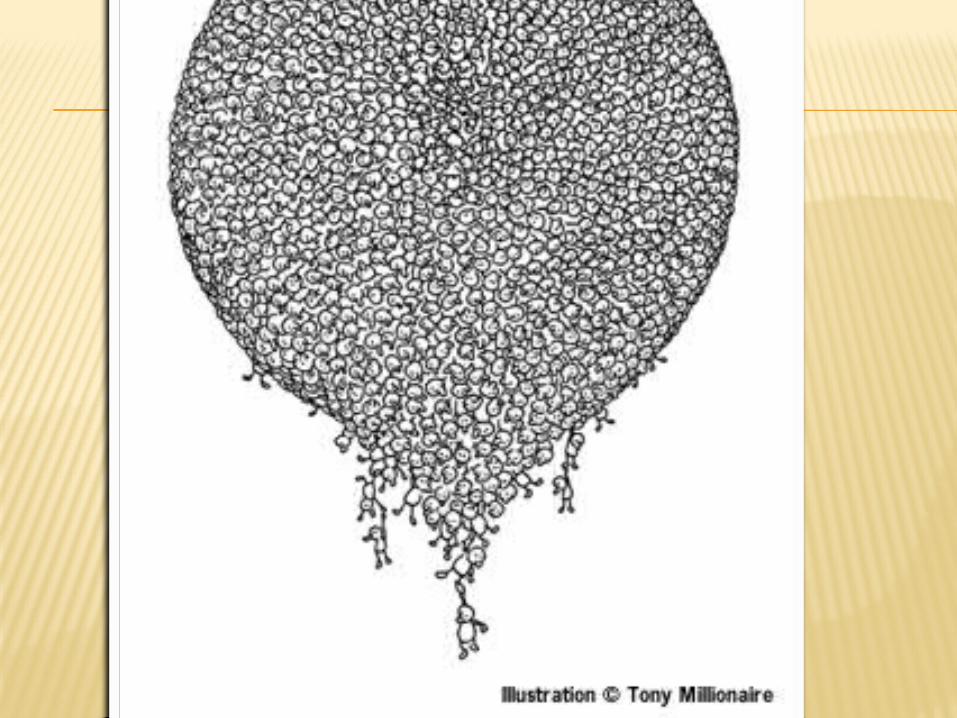
Thomas MalthusPopulation can increase, but somewhere along the line, natural restraints come into play *Thomas Malthus - 1798 - Principles of Population - first person to write on population Population has a tendency to increase geometrically(exponential), agriculture can grow only in arithmetic progression *Population will reach a point at which it exceeds available food supply -Will be held in check by "war, vice, and misery"
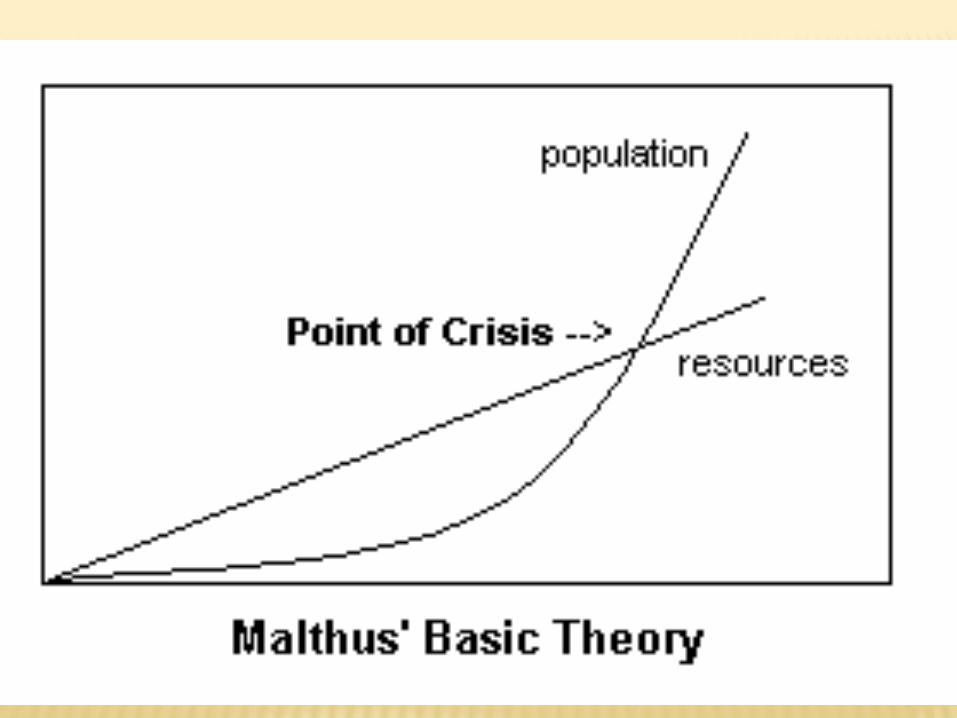
THOMAS MALTHUS
Population increased exponentially (geometrically), food increases _______
But Malthus was wrong due to… Expanded ag. Acreage Improvement in seeds (GMOs) Fertilizers
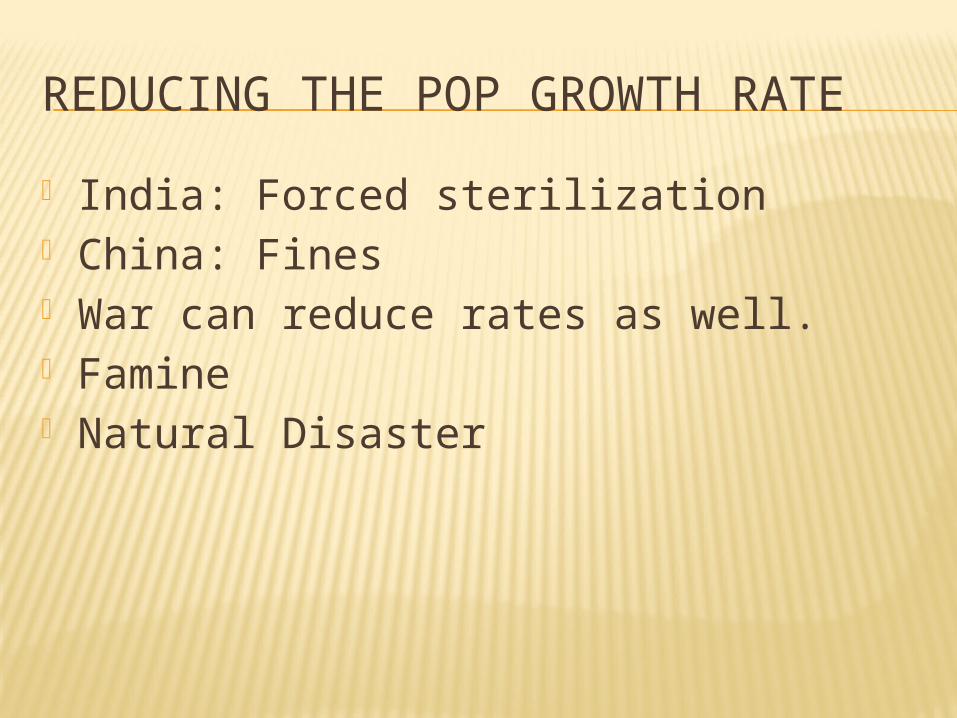
REDUCING THE POP GROWTH RATE
India: Forced sterilization China: Fines War can reduce rates as well. Famine Natural Disaster

BIRTH CONTROL PROGRAMS
One family/one child policies Female infanticide Social compensation fees
Sterilization Loss of status Termination healthcare/food coupons Free birth control Increased literacy
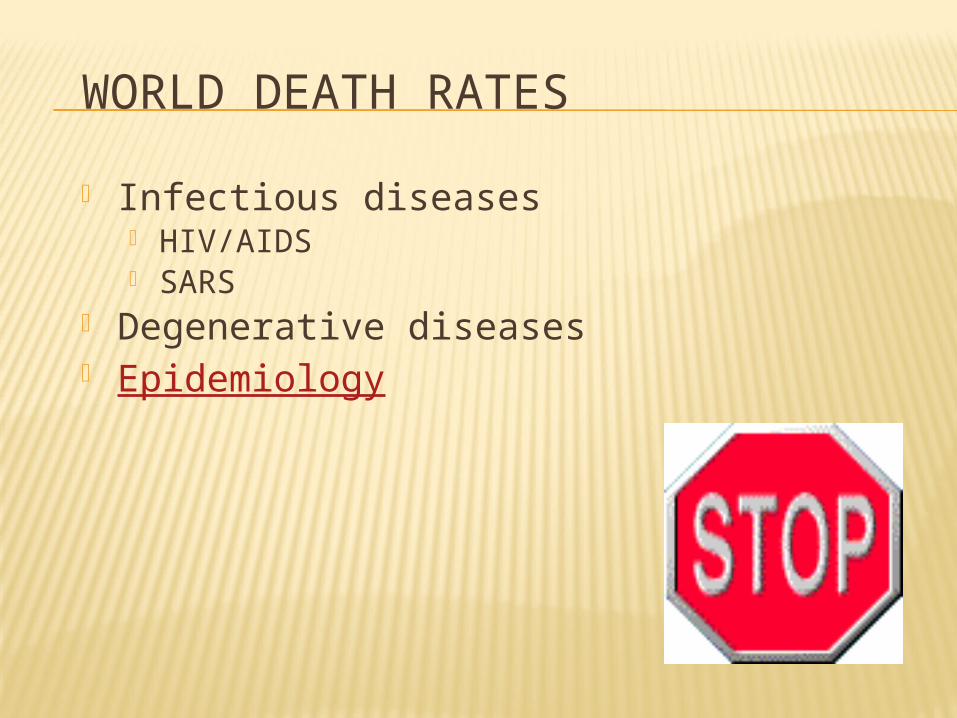
WORLD DEATH RATES
Infectious diseases HIV/AIDS SARS
Degenerative diseases Epidemiology
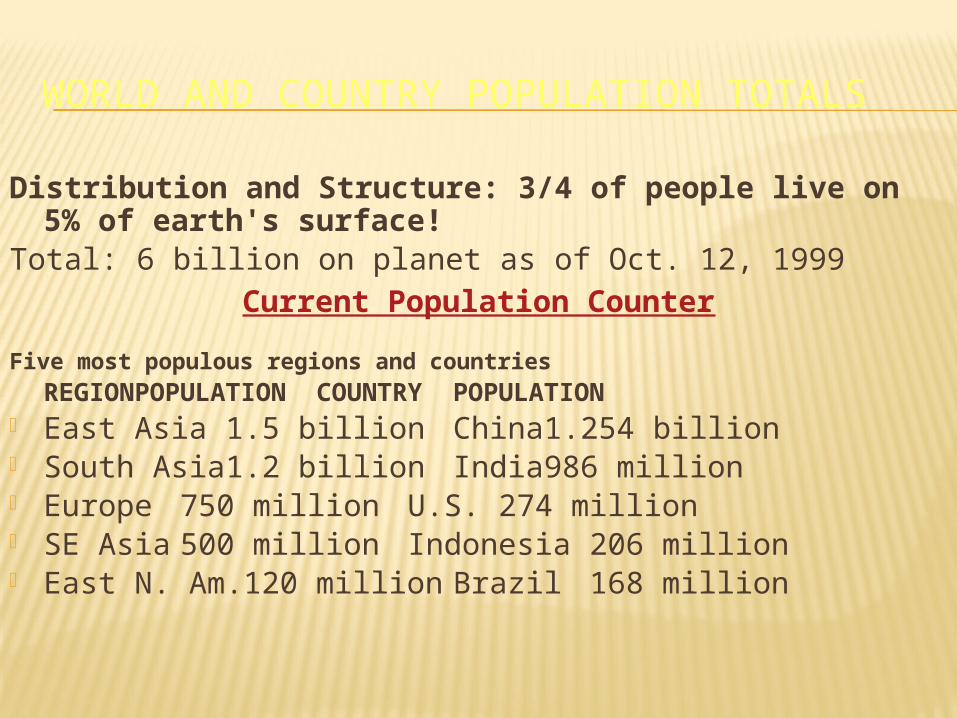
WORLD AND COUNTRY POPULATION TOTALS
Distribution and Structure: 3/4 of people live on 5% of earth's surface!
Total: 6 billion on planet as of Oct. 12, 1999Current Population Counter
Five most populous regions and countriesREGION POPULATION COUNTRY POPULATION
East Asia 1.5 billion China 1.254 billion South Asia 1.2 billion India 986 million Europe 750 million U.S. 274 million SE Asia 500 million Indonesia 206 million East N. Am.120 million Brazil 168 million
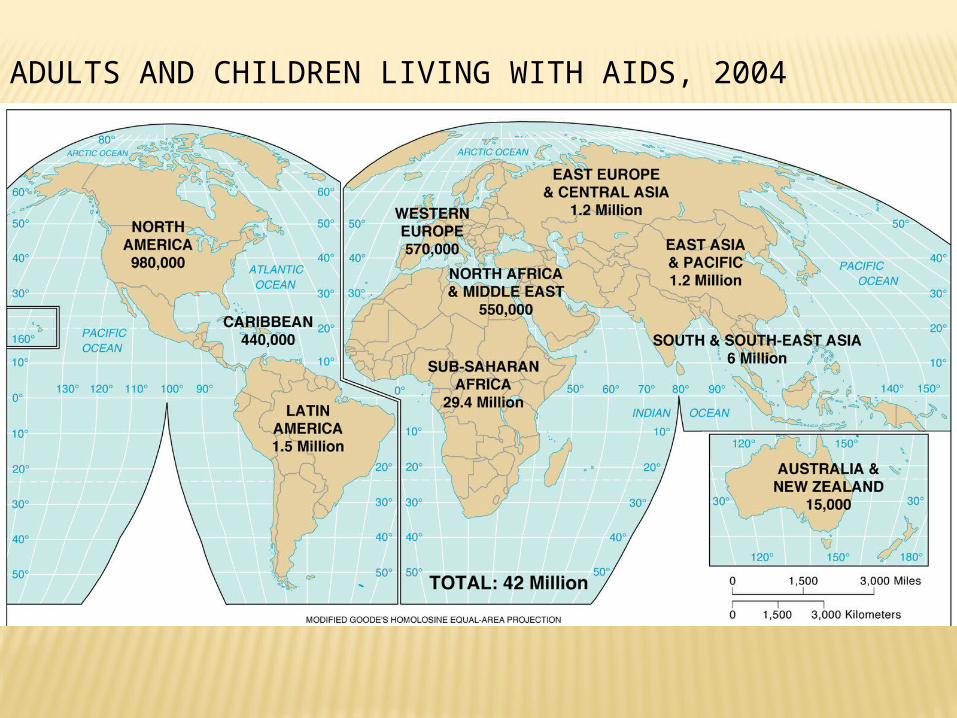
ADULTS AND CHILDREN LIVING WITH AIDS, 2004
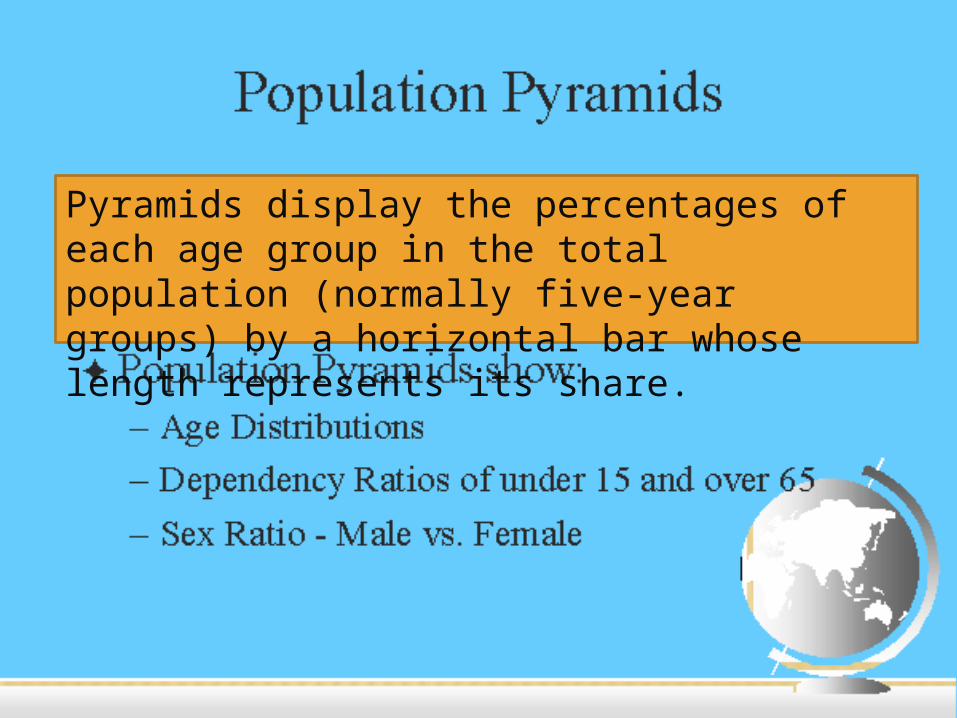
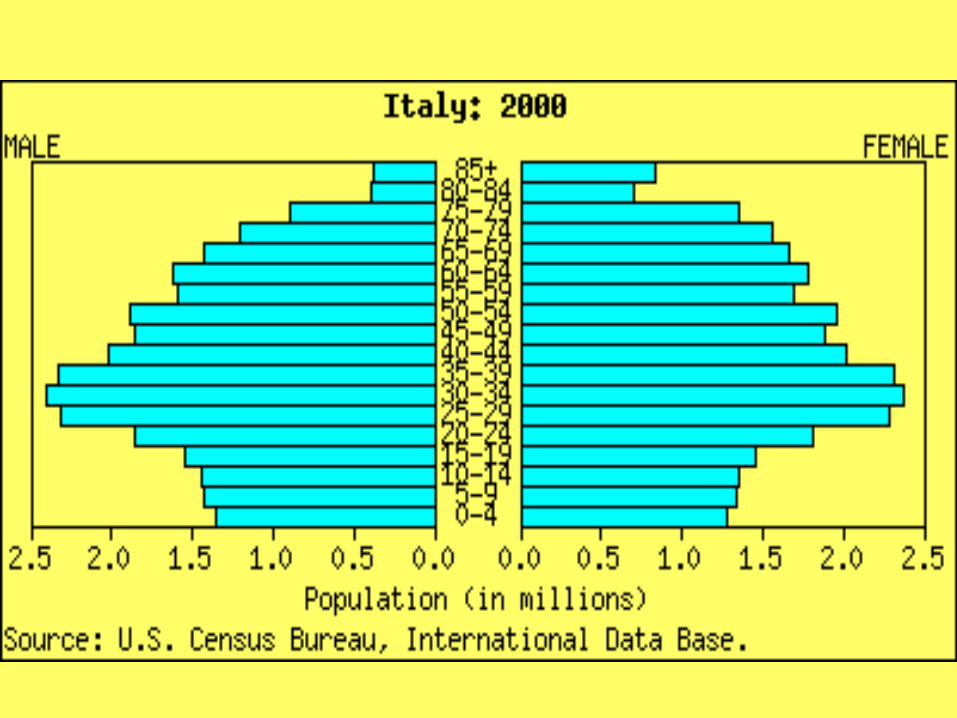
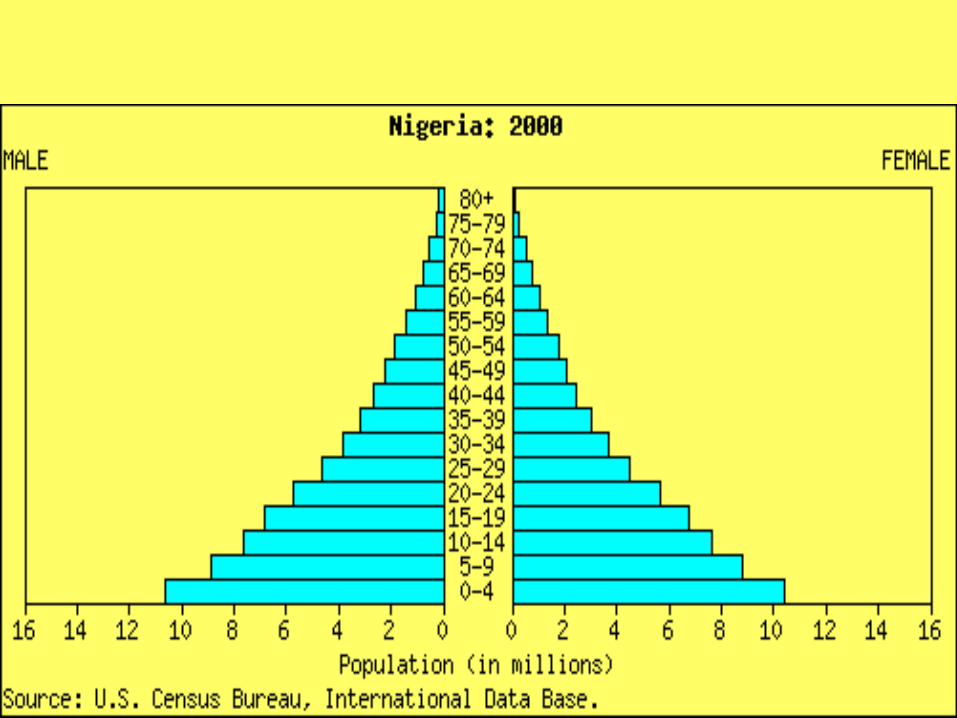
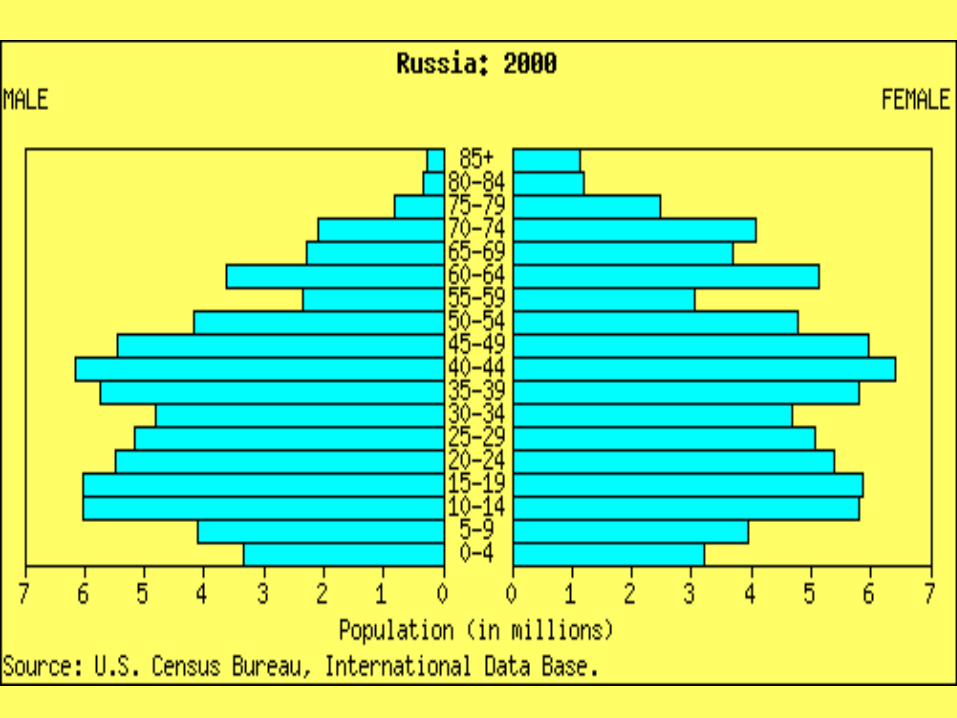
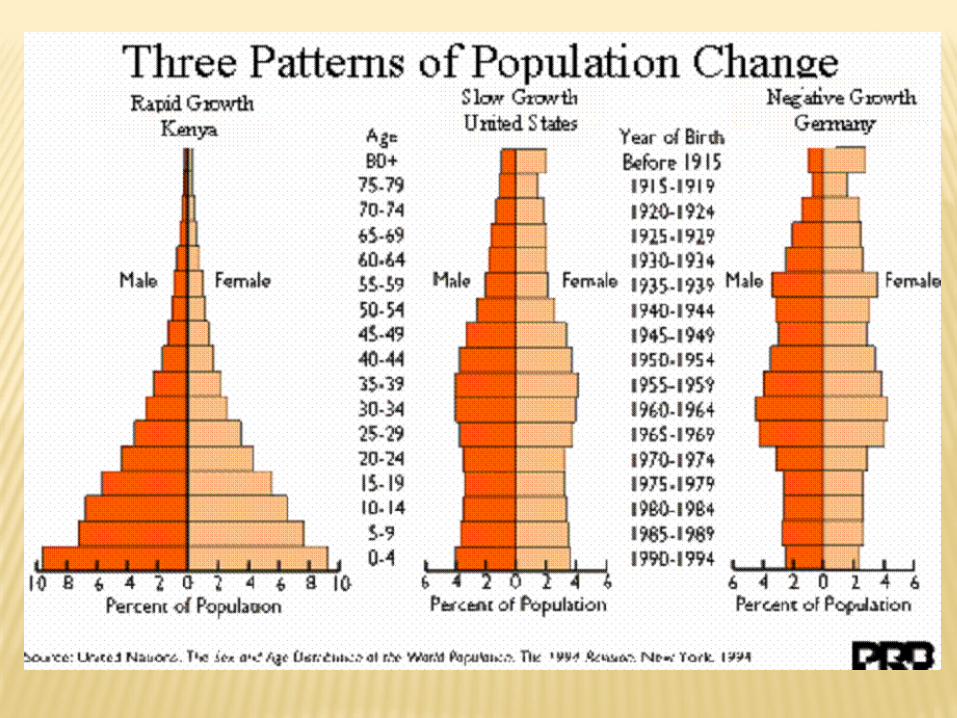
Pyramids display the percentages of each age group in the total population (normally five-year groups) by a horizontal bar whose length represents its share.
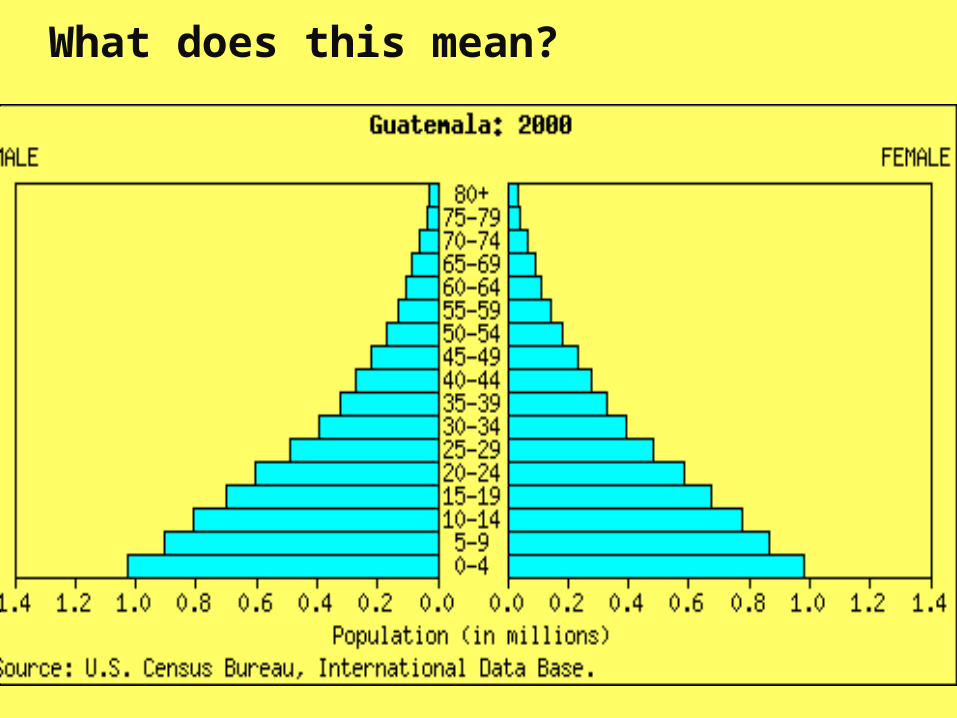
What does this mean?
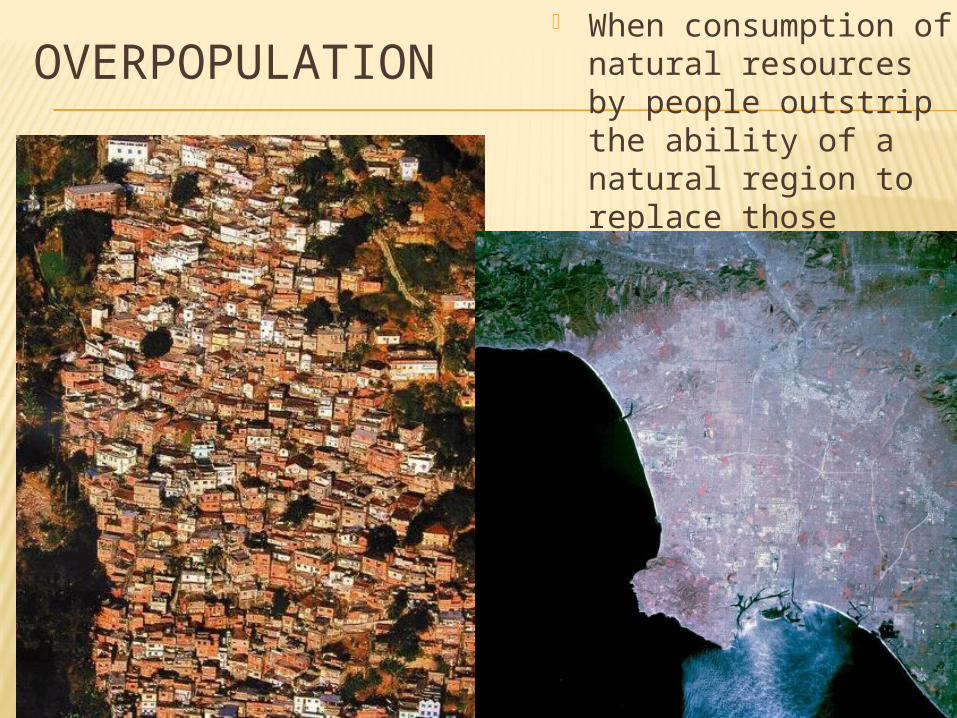
OVERPOPULATION When consumption of
natural resources by people outstrip the ability of a natural region to replace those natural resources.

(1743 – 1794)
• predicted that innovation, resulting increased wealth, and choice would provide food and resources in the future and lead to fewer children per family
• believed that society was perfectable
JEAN ANTOINE CONDORCET
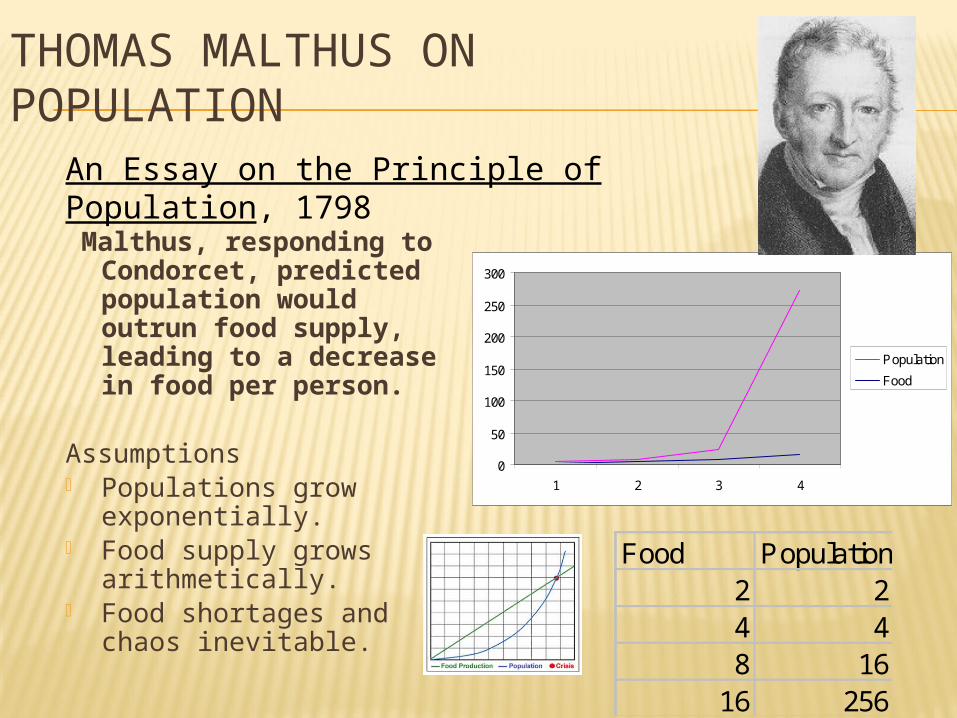
THOMAS MALTHUS ON POPULATION
Malthus, responding to Condorcet, predicted population would outrun food supply, leading to a decrease in food per person.
Assumptions Populations grow
exponentially. Food supply grows
arithmetically. Food shortages and
chaos inevitable.
An Essay on the Principle of Population, 1798
0
50
100
150
200
250
300
1 2 3 4
Population
Food
Food Population2 24 48 1616 256

POPULATION J-CURVE
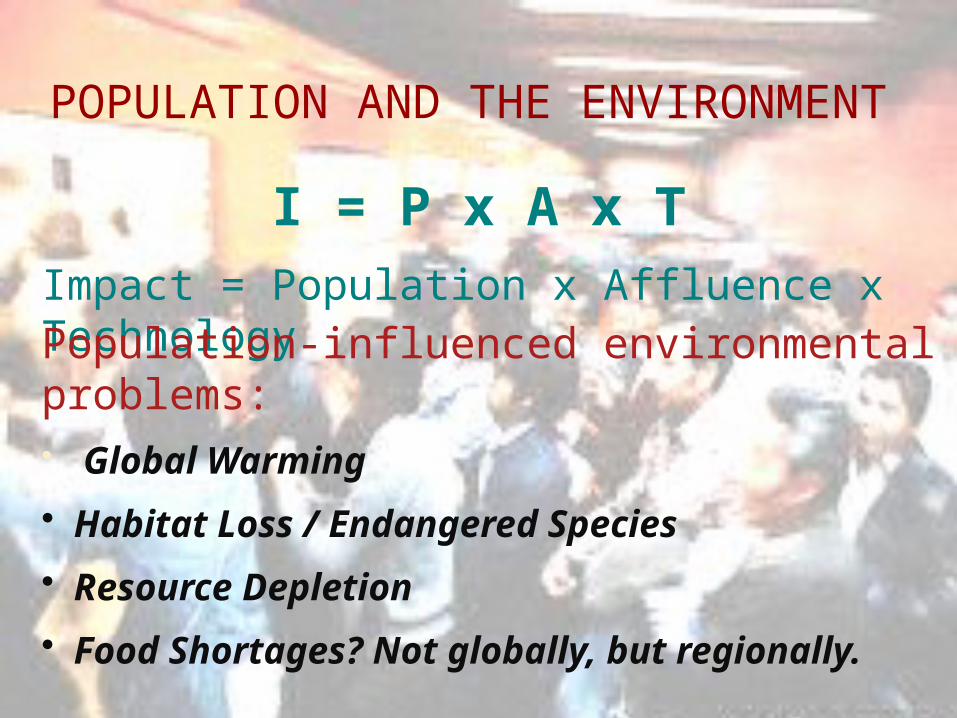
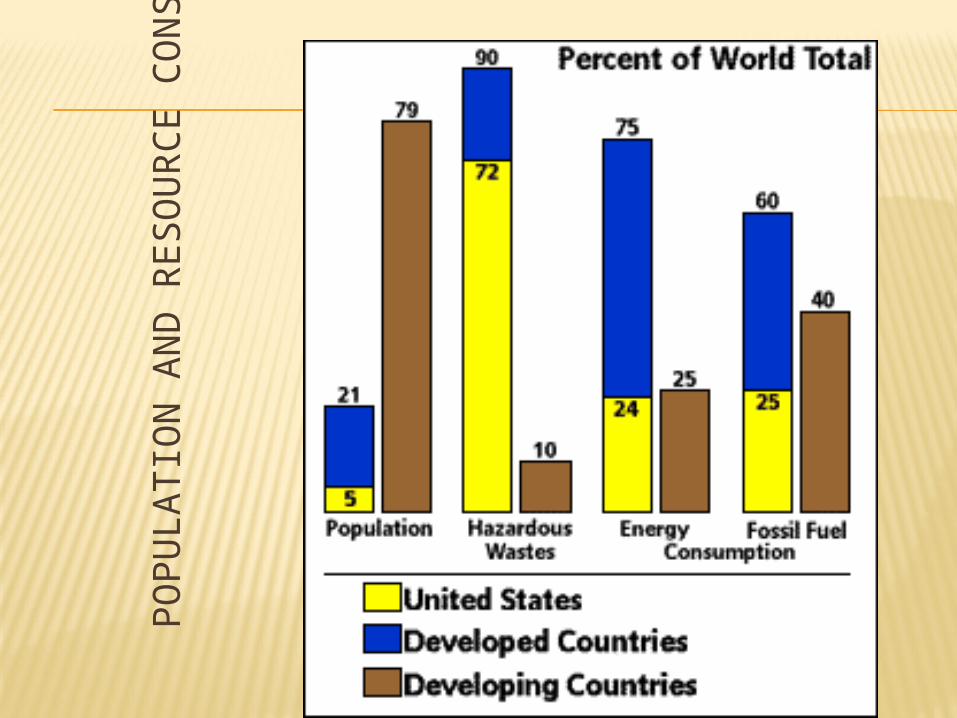
POPULATION AND THE ENVIRONMENT
I = P x A x TImpact = Population x Affluence x TechnologyPopulation-influenced environmental problems:• Global Warming
• Habitat Loss / Endangered Species
• Resource Depletion
• Food Shortages? Not globally, but regionally.
PO
PU
LATIO
N A
ND
RES
OU
RC
E C
ON
SU
MPTIO
N
THE END