Embed Size (px)
Citation preview

© e-Media Research Ltd.
CENTRALITY OF CONTENT IN A CONTEXT OF INCREASING
CONNECTIVITY
THE ROLE OF DIGITAL TERRESTRIAL TELEVISION (DTT) IN THE ITALIAN COMMUNICATIONS
SECTOR AND THE WHOLE NATIONAL ECONOMY
MARCH 2014
DAILY MEDIA REACH IN ITALY(% of total population 14+, average day, Feb / Apr 2013)
85.5%
60.3%
29.5%
48.0%
33.5%
21.7%
27.5%
DTT-native FTA channels
Pay-TV
Radio
Newspaper
Magazines
Internet
Generalist FTA TV channels
DTT
Source: Eurisko. Survey of a nationally representative sample of individuals 14+.

CONTENT CENTRALITY IN A CONTEXT OF INCREASING CONNECTIVITY - March 2014© e-Media Research Ltd. 2
EXECUTIVE SUMMARY / 1
THE ROLE OF DTT IN THE ITALIAN TV AND MEDIA LANDSCAPE
DTT is by far the most widespread mode of TV reception in Italy. The network has ≥95% coverage of the population for most national multiplexes and reaches 96% of all TV households (TVHH), either on the primary or secondary TV set.
DTT is the only TV platform playing a universal role in Italian territory, distributing public service and both national and local commercial free-to-air television channels, as well as pay-TV services. Thanks to its 19 multiplexes, it distributes 76 national free-to-air channels and 37 pay-TV channels. In addition, DTT delivers hundreds of local TV channels and 15 national radio stations. A benchmark of the results achieved by native DTT channels in some of Europe’s largest terrestrial TV markets shows that Italian DTT has been a success story in terms of opening up the TV market. Not only has Italian DTT attracted a larger number of new entrants than has been the case in France or the UK, but these new entrants currently generate the largest aggregate viewership of the three markets.
Not only is DTT the sole platform in Italy with quasi-universal reach, the widest reach of all media and a significantly larger share of the audience than the other TV platforms, it also accounts for a larger proportion of the public’s time than any other medium. Crucially, the amount of time devoted to linear TV viewing is large even among the younger public, which is more exposed to the Internet.
Moreover, it is important to keep in mind that much of the time devoted to content consumption over the Internet is accounted for by professional content produced by publishers and broadcasters. This is a fact of paramount importance, although often overlooked. Assessing the effect of growing non-linear consumption should always come along with careful evaluation of the importance of quality content. Such content is primarily produced by publishers and, in the case of audiovisual content, by broadcasters.
Free-to-air TV (public service and commercial, generalist and thematic, national and local) plays a vital role in nurturing the productive capacity of the editorial system and the quality of the content that is consumed on all platforms, in linear and non-linear mode. In fact, its role is also fundamental in terms of the content that is consumed via the Internet.
ITALIAN DTT ATTRACTS:
84% of total television audience share (p. 10)
70% of total time spent with media (p.18)
48% of total advertising expenditure (p. 21)
58% of total audiovisual sector turnover (p. 25)

CONTENT CENTRALITY IN A CONTEXT OF INCREASING CONNECTIVITY - March 2014
EXECUTIVE SUMMARY / 2
AN IRREPLACEABLE ROLE IN THE COMMUNICATIONS SECTOR AND THE WHOLE NATIONAL ECONOMY
The Italian editorial content sector generated €26 billion in turnover in 2012. The audiovisual industry (cinema, home video and TV) is the most important component of the sector and is worth €11.2 billion or 43% of the sector’s total. With €6.5 billion in turnover and 22,500 employees, free-to-air TV is, in turn, the most important component of the audiovisual industry and the wider editorial content sector.
Beyond its economic size, the free-to-air TV industry has a unique feature that no other medium shares, which is the economic effect (direct economic multiplier) of the sales it activates through advertising. Based on preliminary estimates, the €4 billion spent by advertisers on DTT in 2012 generated €20-36 billion in additional sales, thanks to the medium’s particularly high revenue return on investment (revenue ROI). This means that for every euro spent by advertisers on TV, at least €5-9 has been generated elsewhere in the economy.
3© e-Media Research Ltd.
EDITORIALCONTENT
SECTOR
€26 billion
AUDIOVISUAL INDUSTRIES €11.2 billion
DTT €6.5 billion
ESTIMATED SALESDIRECTLY
ACTIVATEDBY DTT
€25-41 billion (TV advertising R-ROI
+ sales of goods /services
in the CE and ICTsectors)
e-Media Research has found that, on the Italian market, new digital businesses (e.g. e-commerce, online services) enjoy a revenue ROI from TV advertising equal to a multiplier ranging from 18 to 26.
TV has also a significant economic impact on the consumer electronics and ICT sectors. Overall, in these sectors e-Media Research estimates that TV contributed to generating €5 billion in 2012.
On the whole, DTT directly contributed to generating an estimated €31-47 billion in sales volume in 2012, equal to 2-3% of Italy’s GDP.
When further economic, social and cultural externalities generated by DTT are factored in – such as its contribution to social cohesion, and centrality among the creative industries and within the education and knowledge system – it is easy to understand the size of its extended impact on society.
DTT’SECONOMIC IMPACT
31-47 bn (2-3% of GDP)

CONTENT CENTRALITY IN A CONTEXT OF INCREASING CONNECTIVITY - March 2014© e-Media Research Ltd. 4
EXECUTIVE SUMMARY / 3
CENTRALITY OF CONTENT IN A CONTEXT OF INCREASING CONNECTIVITY
Although it is possible to assume that the market for fixed and mobile Internet connectivity, just as the market for access devices, is somewhat independent from the richness and quality of content produced by the national content industries, it seems more plausible to argue that growth in the above-mentioned markets is directly affected by the availability of quality content, and that production of such content provides an essential contribution to economic and social development.
Both free-to-air TV and the entire editorial content sector are going through a critical period – one of strong asymmetry between growing content distribution opportunities, on one side, and decreasing economic resources flowing into the value chain of original content production, on the other. Policy-making in the market for data transmission should, therefore, carefully take into account possible adverse effects on the market for content creation.
It would be desirable that allocation of spectrum in the 700MHz band for other uses than terrestrial broadcasting was carefully evaluated against its potential impact on free-to-air TV, which is one of the main pillars of the editorial content sector, in Italy and elsewhere in Europe.
Should the drastic reduction in the capacity available to terrestrial broadcasting somewhat erode the economic and social value of free-to-air TV, which in turn has a universal role, this could have devastating consequences on the entire content industry and on the economic and social-cultural structures of the nation.
A richer linear /non lineardistribution environment
Larger economic and social development

CONTENT CENTRALITY IN A CONTEXT OF INCREASING CONNECTIVITY - March 2014© e-Media Research Ltd. 5
CONTENTS
INTRODUCTION
1. THE ROLE OF DTT IN THE ITALIAN TV LANDSCAPE
2. DTT: A UNIQUE MASS MEDIUM IN THE COMMUNICATIONS SECTOR
3. THE ECONOMIC, SOCIAL AND CULTURAL IMPORTANCE OF DTT
4. A CRITICAL MOMENT IN THE EVOLUTION OF THE NATIONAL CONTENT INDUSTRY
NOTES AND REFERENCES

CONTENT CENTRALITY IN A CONTEXT OF INCREASING CONNECTIVITY - March 2014© e-Media Research Ltd. 6
INTRODUCTION
A REPORT PREPARED FOR MEDIASET
The present report has been prepared for the Mediaset Group and focuses on the role and socio-economic value of free-to-air terrestrial television in the Italian market. It was drafted with a view to contributing to the current debate on the eventual allocation of the 700MHz band of the radio-electric spectrum to fourth generation mobile and wireless data services (LTE).
A structured research approach employing existing e-Media Research databases was used to prepare the report for further discussion. e-Media Research has also conducted interviews with industry stakeholders such as market participants, research institutions and investors, along with open discussions with key market players. Extensive desk research was also carried out encompassing but not limited to corporate information, annual reports, external market studies and surveys.
It should be noted that in many cases market figures are not released into the public domain by the relevant parties. Where figures from primary sources are lacking, we have used a range of third party estimates after an appropriate evaluation. Where third party estimates have been inconsistent, we have taken the value from the source that appears more to be the most thorough and reliable. Users of this report should be aware that some figures are based on estimates produced by e-Media Research in absence of official data.
DISCLAIMER
Any opinions expressed in this report are solely those of e-Media Research and do not necessarily reflect those of the Mediaset
Group.
While e-Media Research has made every effort to ensure that the information contained herein has been obtained from reliable sources, e-Media Research makes no representation or guarantee as to the accuracy and completeness of such information.
The information reported in this document is not intended to be a comprehensive study or intended to provide strategic, legal or commercial advice to clients or potential clients of e-Media Research. No party receiving this document should act upon the information contained herein without taking appropriate professional advice and after a thorough examination of the particular market situation.

CONTENT CENTRALITY IN A CONTEXT OF INCREASING CONNECTIVITY - March 2014© e-Media Research Ltd. 7
CONTENTS
INTRODUCTION
1. THE ROLE OF DTT IN THE ITALIAN TV LANDSCAPE
2. DTT: A UNIQUE MASS MEDIUM IN THE COMMUNICATIONS SECTOR
3. THE ECONOMIC, SOCIAL AND CULTURAL IMPORTANCE OF DTT
4. A CRITICAL MOMENT IN THE EVOLUTION OF THE NATIONAL CONTENT INDUSTRY
NOTES AND REFERENCES

CONTENT CENTRALITY IN A CONTEXT OF INCREASING CONNECTIVITY - March 2014© e-Media Research Ltd. 8
DTT HAS, AND WILL HAVE, AN IRREPLACEABLE ROLE IN THE ITALIAN TELEVISION LANDSCAPE
DTT is by far the most widespread mode of TV reception in Italy. It reaches 96% of all TV households (TVHH), either on the primary or secondary TV set. According to the latest figures (as of the end of 2013), around 57.6 million individuals receive DTT while satellite TV reaches just under 8 million TVHH (p. 9). In terms of audience, DTT captures over 80% of total viewing in Italy, which is well above the DTT audience in other European countries (p. 10).
Between 2003 and 2012, the migration from analogue to digital broadcasting brought about a significant enrichment and boosted pluralism in the universal TV service. There are now no less than 35 TV publishers operating nationwide on the platform and new entrants collectively attract more than 9% of the total audience. No other DTT platform in Europe has achieved such a rich and diverse offering (p. 11-12).
DTT is the only TV platform playing a universal role in Italian territory. Thanks to its 19 multiplexes, it distributes 76 national free-to-air channels and 30 pay-TV channels. In addition, DTT carries hundreds of local TV channels and 15 national radio stations (p. 11).
DTT’s role will be irreplaceable at least for the next decade, and in the predictable future.
Satellite will continue to be important to pay-TV services, whose overall market potential will remain limited to about 6 million subscribers, but its role in FTA distribution will remain minor (p. 13).
Broadband penetration is still limited and neither the investment plans of network operators nor the evolution of demand for broadband Internet access look sufficient for Italy to achieve Targets n.2 and n.3 of Digital Agenda for Europe (DAE). This means that a transition from DTT to universal, IP-delivered FTA TV during the 2020s is not a realistic option (p. 14).
TV households in Italy by platform – forecast 2014-2020 (millions)
Source: e-Media Research.
25.9 26.2 26.6 26.9 27.1 27.4 27.6
25.5 25.8 26.2 26.5 26.7 26.9 27.1
4.6 5.4
3.4 4.1 0.1 0.1
Dec -14 Dec -15 Dec -16 Dec -17 Dec -18 Dec -19 Dec -20
Total TV HH
DTT TV HH
SATELLITE PAY-TV HH
SATELLITE FTA TV HH IPTV HH
1 - THE ROLE OF DTT IN THE ITALIAN TV LANDSCAPE
KEY POINTS

CONTENT CENTRALITY IN A CONTEXT OF INCREASING CONNECTIVITY - March 2014© e-Media Research Ltd. 9
DIGITAL TV DISTRIBUTION IN ITALY
DTT IS THE ONLY TV PLATFORM THAT REACHES NEARLY 100% OF ITALIAN HOUSEHOLDS
DTT is by far the most widespread mode of TV reception in Italy. The network has ≥95% coverage of the population for most national multiplexes and reaches 96% of all TV households (TVHH), either on the primary or secondary TV set. According to the latest figures (as of the end of 2013), around 57.6 million individuals receive DTT.
Cable television never really took off in Italy, while IPTV has had very limited success. The satellite TV platform, reaching just under 8 million TVHH as of the end of 2013, still mainly serves the pay-TV sector (Sky Italia), while free-to-view distribution has had a limited impact on the market – so far.
TV households in Italy by platform (millions)
Source: e-Media Research on Auditel and various sources.
22.0 22.4 22.7 23.0 23.5 23.9 24.3 24.8 25.2 25.5
1.0 2.2 3.0 3.4
5.8
13.5
19.5 22.4
24.6 96% OF TOTAL
TV HH
3.1 4.5 2.0 3.1
0.2
Dec-04 Dec-05 Dec-06 Dec-07 Dec-08 Dec-09 Dec-10 Dec-11 Dec-12 Dec-13
Total TV HH
DTT TV HH
SATELLITE PAY-TV HHSATELLITE FTA TV HHIPTV HH
SWITCH-OVER SWITCH-OFF (July 2012)
1 - THE ROLE OF DTT IN THE ITALIAN TV LANDSCAPE

CONTENT CENTRALITY IN A CONTEXT OF INCREASING CONNECTIVITY - March 2014© e-Media Research Ltd. 10
TV AUDIENCE SHARE IN ITALY BY PLATFORM
DTT ACCOUNTS FOR OVER 80% OF TOTAL TV VIEWING IN ITALY
In terms of the audience attracted by each TV platform, DTT accounts for over 80% of total viewing, which is well above the DTT audience in other European countries. In the UK, for instance, DTT is the most popular way of watching TV, but its viewing share (44.8% in 2012) is much lower than in Italy. 1
Sky Italia’s relaunch of satellite pay-TV services in 2003, coupled with the more recent development of a free-to-view satellite service integrating DTT reception (TivuSat), have contributed to raising satellite TV’s audience share close to 16%.
TV audience share in Italy by platform (% of total TV viewing)
ANALOGUE TERRESTRIAL TV
DIGITALTERRESTRIAL TV
(DTT)
SATELLITE TV (FTA + PAY)0.1% - IPTV
84%
90%
40.2%
62.9%
83.9%
12.7%
10.0% 15.9%
5.5%
Dec-04 Jun-08 May-09 May-10 May-11 Nov-12 Nov-13Source: e-Media Research on Auditel data. Note: figures for 2004-2007 are estimates.
1 - THE ROLE OF DTT IN THE ITALIAN TV LANDSCAPE

CONTENT CENTRALITY IN A CONTEXT OF INCREASING CONNECTIVITY - March 2014© e-Media Research Ltd. 11
THE ROLE OF DTT IN THE ITALIAN TV MARKET
DTT IS THE SOLE UNIVERSAL FREE-TO-AIR TV PLATFORM, DELIVERING HUNDREDS OF NATIONAL AND LOCAL CHANNELS
DTT is the only TV platform playing a universal role in Italian territory, distributing public service and both national and local commercial free-to-air television channels, as well as pay-TV services. Thanks to its 19 multiplexes, it distributes 76 national free-to-air channels and 37 pay-TV channels. In addition, DTT carries hundreds of local TV channels and 15 national radio stations.
Between 2003 and 2012, the migration from analogue to digital broadcasting brought about a significant enrichment and boosted pluralism in the universal TV service. There are now no less than 35 TV broadcasters operating nationwide on the platform. No other DTT platform in Europe has achieved such a rich and diverse offering.
Number of national TV channels available on terrestrial television in Italy (units)
13 11 10 10 10 10
1828
5266
12
32
42
37 NATIVE DTT PAY-TV CHANNELS(incl. PPV services)
NATIVE DTT FREE-TO-AIRCHANNELS
NATIONAL ESTABLISHEDTERRESTRIAL CHANNELS
xxNumber of TV broadcastersdistributing their programmes over the terrestrial platform
16
31
35
Dec-90 Dec-04 Dec-07 Mar-10 Feb-14Sept-12Source: e-Media Research.
Note: data exclude regional / local, time-shifted and service channels.
1 - THE ROLE OF DTT IN THE ITALIAN TV LANDSCAPE

CONTENT CENTRALITY IN A CONTEXT OF INCREASING CONNECTIVITY - March 2014© e-Media Research Ltd. 12
Total audience share of DTT channels broadcastby new entrants in terrestrial TV (%, total TV HH)
Number of national DTT FTA channels by broadcaster category (units, Oct-13)and audience share on total TV Households (%, Sept-13)
NATIONAL DTT FTA CHANNELS (TOTAL)25 50 75
7 (65.4%) 5 (51.6%) 10 (59.7%)10 (16.0%)
18(18.6%)
35(14.2%)8 (7.0%)
27(7.0%)
30(9.1%)
FRANCE UK ITALY
Channels published by new entrantsin terrestrial TV
Historical analogue terrestrial channels
Native DTT channels published by historical analogue terrestrial broadcasters
(xx%) Audience share
Number of DTT broadcasters
3.9%
5.4%
4.0%
7.0% 7.0%
9.1%
May-12
Sep-13
GROWTH+3.1 p.p. +1.6 p.p. +5.1 p.p.
FRANCE UK ITALY
Source: e-Media Research on various sources.
6 18 21 New entrantsin terrestrial TV
5 4 6 Historical analogue terrestrial broadcasters
MARKET DEVELOPMENT IS FURTHER PROOF OF ITALIAN DTT SUCCESS STORY
A benchmark of the results achieved by native DTT channels in some of Europe’s largest terrestrial TV markets shows that Italian DTT has been a success story in terms of opening up the TV market. Not only has Italian DTT attracted a larger number of new entrants than has been the case in France or the UK, but these new entrants currently generate the largest aggregate viewership of the three markets. 2
In Italy, DTT has also allowed for a more competitive pay-TV market, which would have otherwise been a monopoly (Sky Italia).
COMPETITION IN THE ITALIAN TV MARKET
1 - THE ROLE OF DTT IN THE ITALIAN TV LANDSCAPE

CONTENT CENTRALITY IN A CONTEXT OF INCREASING CONNECTIVITY - March 2014© e-Media Research Ltd. 13
THE ROLE OF DTT OVER THE NEXT TEN YEARS
TV households in Italy by platform – forecast to 2024 (millions)
Total TV HH
SATELLITE PAY-TV HH
SATELLITE FTA TV HH
IPTV HH
(actual) (estimate)(forecast)
Even in 2024, more than 95% of Italian
TV HH will receive DTT
25.2 25.5 25.9 26.2 26.6 26.9 27.1 27.4 27.6 27.8 27.9 28.1 28.1
24.6 25.1 25.5 25.8 26.2 26.5 26.7 26.9 27.1 27.4 27.4 27.6 27.7m
4.6 5.8
2.5 4.3
0.2 0.1
Dec-12 Dec-13 Dec-14 Dec-15 Dec-16 Dec-17 Dec-18 Dec-19 Dec-20 Dec-21 Dec-22 Dec-23 Dec-24
DTT TV HH
DTT HAS, AND WILL HAVE, AN IRREPLACEABLE ROLE IN THE ITALIAN TELEVISION LANDSCAPE
Being the sole TV platform with nationwide coverage, DTT plays a unique role in the current Italian TV landscape.
DTT’s role will be irreplaceable at least for the next decade, and in the predictable future. Satellite distribution will continue to be important to pay-TV services, whose overall market potential will remain limited to about 6 million subscribers, but its role in FTA distribution will remain marginal.
Source: e-Media Research on Auditel data.
1 - THE ROLE OF DTT IN THE ITALIAN TV LANDSCAPE

CONTENT CENTRALITY IN A CONTEXT OF INCREASING CONNECTIVITY - March 2014© e-Media Research Ltd. 14
BROADBAND PENETRATION FORECAST 2020
Evolution of demand for broadband Internet access in Italy – forecast to 2020 (fixed broadband subscriptions in thousands and per 100 people) 3
0.0
4.0
8.0
12.0
16.0
20.0
24.0
28.0
32.0
0
2,000
4,000
6,000
8,000
10,000
12,000
14,000
16,000
2004 2005 2006 2007 2008 2009 2010 2011 2012 2013 2014 2015 2016 2017 2018 2019 2020
Tota
l fixe
d br
oadb
and
subs
crip
tions
(000
)
Subscriptions/100 people
22.9 subscriptions/100 people
EU average: 28.7 subscriptions/100 people
ACTUAL(CAGR 2004-12 = 14%)
FORECAST(CAGR 2012-20 = 1%)
Next generation access (NGA) lines in the EU-5 (% of total fixed
broadband lines, Jan-13) 3
25%
22%
20%
14%
7%
2%
UK
ES
EU avg.
DE
FR
ITSource: e-Media Research on EC DAE Scoreboard data and WIK estimates.
FAST AND ULTRAFAST BROADBAND DEVELOPMENT IN ITALY PROSPECTIVELY LIMITED
According to Achieving the Objectives of the Digital Agenda for Europe (DAE) in Italy, the report presented by Commissioner Francesco Caio to the Italian Government on 30 January 2014, neither the investment plans of network operators nor the evolution of demand for broadband Internet access look sufficient to achieve Targets n.2 and n.3 of the DAE (respectively, 100% of the population covered by broadband above 30Mbps, and 50% of the population subscribing to broadband above 100Mbps by 2020).
While Target n.1 of the DAE (universal basic broadband, i.e. >144Kbps) has been achieved (98.4% of homes covered as of the end of 2013), the current trajectory of fast and ultrafast broadband development in Italy does not make the case for a transition from DTT to universal, IP-delivered FTA TV a realistic option during the 2020s. Progress towards Target n.2 is still limited and significantly late compared to the EU average, i.e. only 50% of fixed lines covered by 30Mbps service by 2016/17 and possibly 70% by 2020.
Presently, a significant proportion of Italian territory has no prospect of achieving Target n.2. Furthermore, there is no actual coordinated industry-wide plan to develop ultrafast broadband (100Mbps and above).
1 - THE ROLE OF DTT IN THE ITALIAN TV LANDSCAPE

CONTENT CENTRALITY IN A CONTEXT OF INCREASING CONNECTIVITY - March 2014© e-Media Research Ltd. 15
CONTENTS
INTRODUCTION
1. THE ROLE OF DTT IN THE ITALIAN TV LANDSCAPE
2. DTT: A UNIQUE MASS MEDIUM IN THE COMMUNICATIONS SECTOR
3. THE ECONOMIC, SOCIAL AND CULTURAL IMPORTANCE OF DTT
4. A CRITICAL MOMENT IN THE EVOLUTION OF THE NATIONAL CONTENT INDUSTRY
NOTES AND REFERENCES

CONTENT CENTRALITY IN A CONTEXT OF INCREASING CONNECTIVITY - March 2014© e-Media Research Ltd. 16
DTT CONTENT DOMINATES THE PUBLIC’S MEDIA DIET EVEN IN THE PRESENCE OF STRONGLY GROWING INTERNET VIDEO CONSUMPTION
FTA DTT has by far the widest daily reach of the population of any medium, with national historical FTA generalist channels displaying a daily reach of 85% of the Italian population in 2013 and native DTT FTA channels daily reaching 60% of the population on average. FTA TV also reaches younger demographics, the greatest consumers of Internet content, with ratios of over 80% (p. 17).
DTT also accounts for a larger proportion of the public’s time than any other medium. Crucially, the amount of time devoted to linear TV viewing is large even among the younger public, which is more exposed to the Internet (p.18).
The total amount of time devoted to linear content consumption on a TV set does not appear to decrease in panel-based audience data, even in the face of growing Internet video consumption. In fact, linear content consumption has been growing steadily since 2010, when audiovisual content consumption via mobile devices took off (p.19).
Assessing the effect of growing non-linear consumption should always be conducted alongside careful evaluation of the importance of quality content. Crucially, much of the time devoted to content consumption over the Internet is accounted for by professional content produced by publishers (p. 20).
The consumer’s preference for TV in general, and DTT FTA TV in particular, is also reflected in the preferences of advertisers, who spend most of their budgets on FTA TV. In 2013, 48% of above-the-line advertising expenditure was attracted by national and regional/local channels distributed on DTT (p. 21).
2 - DTT: A UNIQUE MASS MEDIUMIN THE COMMUNICATIONS SECTOR
KEY POINTS
TV and online video consumption evolution in Italy
18.9
24
28.5
2.0
5.7
12.8
253 257 260
2011 2012 2013
Daily TV viewing (minutes per head, annual figure)
Monthly online video unique viewers (PC, millions)
Monthly online video unique viewers (smartphones and tablets, millions)
31 minutes daily per user
27 minutes daily per user
Source: e-Media Research on Auditel and comScore data.

CONTENT CENTRALITY IN A CONTEXT OF INCREASING CONNECTIVITY - March 2014© e-Media Research Ltd. 17
85.5%
60.3%
29.5%
48.0%
33.5%
21.7%27.5%
NativeDTT FTAchannels
Pay-TV Radio
Newspapers
Magazines
Internet
Generalist FTA TV
channels
TOTAL POPULATION 14+
79.0%82.9% 84.5% 83.8%
60.7% 58.2% 60.6%65.0%
32.6% 33.3%29.6% 29.3%
53.6%
43.4%47.9%
54.9%
10,6%17.4% 28.7% 28.8%
6.9%15.4%
20.0%16.1%
42.4%35.5%
39.1% 38.9%
Native DTT FTA channels
Pay-TV
Radio
Newspapers
Magazines
Internet
Generalist FTA TV channels
14-17 18-24 25-34 35-44
Daily media reach in Italy (% of total population, average day, Feb / Apr 2013) AGE GROUPS
DAILY REACH BY MEDIUM IN ITALY
FTA TV – AND DTT WITH IT – HAVE THE WIDEST REACH OF THE POPULATION OF ANY MEDIUM
Recent data from Eurisko shows that FTA DTT, including generalist and thematic channels, has by far the widest daily reach of the population of any medium. National established FTA generalist channels displayed a daily reach of 85% of the Italian population in 2013, while native DTT FTA channels daily reached 60% of the population on average.
FTA TV also reaches younger demographics, the greatest consumers of Internet content, with ratios of over 80%.
Source: Eurisko. Note: Survey of a nationally representative sample of individuals 14+.
2 - DTT: A UNIQUE MASS MEDIUMIN THE COMMUNICATIONS SECTOR

CONTENT CENTRALITY IN A CONTEXT OF INCREASING CONNECTIVITY - March 2014© e-Media Research Ltd. 18
Time spent with media in Italy (minutes, average day, Feb / Apr 2013)
Source: Eurisko. Note: Survey of a nationally representative sample of individuals 14+.
TIME SPENT WITH MEDIA IN ITALY
TERRESTRIAL FREE-TO-AIR TV ACCOUNTS FOR THE LARGEST SHARE (70%) OF TIME SPENT WITH MEDIA
Not only is DTT the sole platform in Italy with quasi-universal reach, the widest reach of all media and a significantly larger share of the audience than the other TV platforms, it also accounts for a larger proportion of the public’s time than any other medium. Crucially, the amount of time devoted to linear TV viewing is large even among the younger public, which is more exposed to the Internet.
Clearly, the amount of time captured by FTA TV determines its economic and social value, not only for the audiovisual industries and the editorial content and communications sectors at large, but also for society as a whole.
160
45
192514428 Internet
Magazines
Newspapers
Radio
Pay-TV
Native DTT FTA channels
Generalist FTA TV channels
102 111137
116
40 40
515724 20
191728 15
22302 5
9 9
1 2
3 238 36
39 46
TOTAL POPULATION 14+14-17 18-24 25-34 35-44
295 235 229 280 277TOTAL MINUTES
205
142151
188 173
TOTALFree-To-Air TV
AGE GROUPS
2 - DTT: A UNIQUE MASS MEDIUMIN THE COMMUNICATIONS SECTOR

CONTENT CENTRALITY IN A CONTEXT OF INCREASING CONNECTIVITY - March 2014© e-Media Research Ltd. 19
TV and online video consumption evolution in Italy
LINEAR VS NON LINEAR CONTENT CONSUMPTION
LINEAR TV CONSUMPTION DOMINATES THE PUBLIC’S MEDIA DIET EVEN IN THE PRESENCE OF STRONGLY GROWING INTERNET VIDEO CONSUMPTION
The total amount of time devoted to linear content consumption on a TV set does not appear to decrease in panel-based audience data (Auditel), even in the face of growing Internet video consumption, which suggests that Internet video is additive, rather than substitutive for linear TV time.
Linear content consumption remains predominant and has continued to grow steadily even after 2010, when audiovisual content consumption via mobile devices took-off.
Source. Daily TV viewing: Auditel, 4+ individuals. Online video: comScore, 15+ individuals for May-11 and May-12; 6+ individuals for Oct-13.
2 - DTT: A UNIQUE MASS MEDIUMIN THE COMMUNICATIONS SECTOR
18.9
24.0
28.5
< 2.0
5.7
12.8
229 234 238246
253 257 260
2007 2008 2009 2010 2011 2012 2013
Monthly online video unique viewers (PC, millions)
Monthly online video unique viewers(smartphones and tablets, millions)
Daily TV viewing (minutes per head, annual figure)
+31 MINUTES(+13.5%)
(May-11)
(May-12)
(Oct-13)27 minutes
daily per video unique viewer
31 minutes daily per videounique viewer

CONTENT CENTRALITY IN A CONTEXT OF INCREASING CONNECTIVITY - March 2014© e-Media Research Ltd. 20
Main sources of news in Italy in 2013 (% of actively informed individuals)
QUALITY PROFESSIONAL INTERNET CONTENT IS
MAINLY PRODUCED BY PUBLISHERS AND BROADCASTERS
A CONSIDERABLE SHARE OF THE CONTENT CONSUMED ON THE INTERNET IS PUBLISHER OR BROADCASTER-PRODUCED
Crucially, much of the time devoted to content consumption over the Internet is accounted for by professional content produced by publishers. This is a fact of paramount importance, although often overlooked. Assessing the effect of growing non-linear consumption should always be conducted alongside careful evaluation of the importance of quality content. Such content is primarily produced by publishers and, in the case of audiovisual content, by broadcasters.
A large share of Internet content consumption, although often not properly valued in monetary terms, is attracted by services and audiovisual content created by publishers and broadcasters, who are among the prime distributors of professional content online.
Source: Agcom / SWG Note: consumer research, base: 10,000 individuals 4+. Max 3 answers allowed.
2 - DTT: A UNIQUE MASS MEDIUMIN THE COMMUNICATIONS SECTOR
79.6%
45.4%
42.1%
18.5%
11.3%
10.8%
3.6%
Free-to-Air TV(national + local
channels, net)
Newspapers(national + local, net)
Internet(net)
Radio
Pay-TV
Magazines
Other
28.7%
6.0%
12.8%
12.7%
9.1%
Publishersand broadcasters
Internet-nativepublishers
Aggregators / searchengines, portals
Social networks
Blogs
Repubblica, Corriere della Sera, TGCOM 24, Il Sole 24 Ore, La Stampa
Huffington Post, Blogo, Nanopress
Facebook, Twitter
Google News, Libero, Yahoo!, Tiscali, MSN News
MAIN EXAMPLES
Use / aggregate quality content produced by publishers / broadcasters
A significant share of social interactions over the Internetis based on content produced by publishers / broadcasters 4

CONTENT CENTRALITY IN A CONTEXT OF INCREASING CONNECTIVITY - March 2014© e-Media Research Ltd. 21
2 - DTT: A UNIQUE MASS MEDIUMIN THE COMMUNICATIONS SECTOR
DTT SHARE OF TOTAL
ADVERTISING EXPENDITURE
DTT ATTRACTS THE LARGEST PART (48%) OF ADVERTISING EXPENDITURE AND MORE THAN 80% OF TV AD. EXPENDITURE
The consumer’s preference for TV in general, and DTT FTA TV in particular, is also reflected in the preferences of advertisers, who spend most of their budgets on FTA TV.
In 2013, 48% of above-the-line advertising expenditure was attracted by national and regional/local channels distributed on DTT.
Net advertising expenditure in Italy in 2013 – share by medium (%)
53%
12%
7%
5%3%
20% TV
Newspapers
Magazines
Radio
OutdoorCinema
Internet
TOTAL€7.55
BILLIONTOTAL€4.0
BILLION
National DTT channels (incl. generalist TV ch.)
SatellitePay-TV
channels
Local TV channels
43%
5%5%
About €3.2 billion(> 80% of total
TV adspend)
Source: e-Media Research estimates on various sources, including Nielsen Media Research, Assocomunicazione, IAB Italia.

CONTENT CENTRALITY IN A CONTEXT OF INCREASING CONNECTIVITY - March 2014© e-Media Research Ltd. 22
CONTENTS
INTRODUCTION
1. THE ROLE OF DTT IN THE ITALIAN TV LANDSCAPE
2. DTT: A UNIQUE MASS MEDIUM IN THE COMMUNICATIONS SECTOR
3. THE ECONOMIC, SOCIAL AND CULTURAL IMPORTANCE OF DTT
4. A CRITICAL MOMENT IN THE EVOLUTION OF THE NATIONAL CONTENT INDUSTRY
NOTES AND REFERENCES

CONTENT CENTRALITY IN A CONTEXT OF INCREASING CONNECTIVITY - March 2014© e-Media Research Ltd. 23
3 - THE ECONOMIC , SOCIAL AND CULTURAL IMPORTANCE OF DTT
THE LARGER ECONOMIC, SOCIAL AND CULTURAL IMPACT OF DTT
At around €10 billion, TV (including FTA and pay-TV services) represents the largest editorial content industry in Italy (p. 24).
At €6.5 billion, DTT accounts for more than half of all public and private expenditure generated by the wider national audiovisual industry, which is estimated at €11.2 billion for 2012. In that same year, 22,500 workers were estimated to be directly employed in the DTT segment (p. 25).
There is a vast body of research in the field showing that TV has the largest economic footprint of any mass medium, thanks to the direct effect it exerts on business activity through advertising. Even in the absence of specific field research, e-Media Research estimates that advertising expenditure on DTT generates a revenue ROI equal to a multiplier ranging from 5 to 9.
This means that the €4 billion spent by advertisers on DTT in 2012 is estimated to have had a direct effect of between €20 and €36 billion, in terms of sales activated by advertising (p. 26).
It is also reasonable to assume that DTT has a direct effect on the consumer electronics and ICT sectors. In the first instance, assuming DTT generates a share of all TV set sales in the market that is equivalent to its share of total TV viewing, at least €1.8 billion in consumer electronics revenue is attributable to DTT.
In the second instance, using 10% as an estimate of the share of the ICT market that is linked to distribution and consumption of audiovisual content and then applying DTT’s share of the audiovisual market (58%), a yield of €3.2 billion in ICT revenue can be attributable to DTT (p. 27).
Finally, TV makes a key economic contribution to all other editorial industries, as well as to marketing and the wider creative industry. It also has an impact on education and knowledge, areas where audiovisual content has had an increasing role over the years (p. 28).
25%
75%Other editorial content industries
DTT
DTT share of total turnover in the editorial content sector (€ billion and %)
TOTAL€26 BN
Source: e-Media Research on various sources.
KEY POINTS

CONTENT CENTRALITY IN A CONTEXT OF INCREASING CONNECTIVITY - March 2014© e-Media Research Ltd. 24
Source: e-Media Research on various sources.Note: data measured at expenditure level (household, enterprise and state subsidies).
DTT IS ONE OF THE MAIN COMPONENTS OF THE LARGER EDITORIAL CONTENT SECTOR
When measured as the sum of consumer and advertiser expenditure and state subsidies, the market for editorial content was worth €26 billion in 2012. At around €10 billion, TV (including FTA and pay-TV services) represents the largest editorial content industry in Italy.
DTT, in turn, attracts a total of €6.5 million in expenditure from the private and public sectors.
3 - THE ECONOMIC , SOCIAL AND CULTURAL IMPORTANCE OF DTT
Editorial content sector turnover (consumer and advertiser expenditure, licence fee, state subsidies) by industry(€ billion and %)
€26 billion2012
estimates
TV (FTA + pay-TV, all platforms)€9.9 billion
MAGAZINE (B2C, B2B)& NEWSPAPER PUBLISHING
€8.2 billion
BOOK PUBLISHING€2.8 billion
MULTIMEDIA PUBLISHING (ON-LINE AND OFF-LINE, INCL. VIDEOGAMES)€3.0 billion
CINEMA / HOME VIDEODIRECTORIES MUSIC PUBLIHING + RADIO
DTT €6.5 billion
25%of total
editorial content sector
of which
DTT IN THE EDITORIAL CONTENT SECTOR

CONTENT CENTRALITY IN A CONTEXT OF INCREASING CONNECTIVITY - March 2014© e-Media Research Ltd. 25
TOTAL AUDIOVISUAL INDUSTRIES (TV, cinema, home video, online video) €11.2 billion
DTT €6.5 billion
TV (FTA + pay-TV, all platforms)
€9.9 billion
58%of total audiovisual sector
of which
of which
About 70,000employees
About 22,500employees
2012estimates
CINEMA(THEATRICAL)
HOME VIDEO
INTERNET VIDEO
Source: e-Media Research on various sources.Note: data measured at expenditure level (household, enterprise and state subsidies). Employment data are estimates.
DTT IS THE LARGEST COMPONENT OF THE AUDIOVISUAL INDUSTRY, ACCOUNTING FOR MORE THAN HALF OF ITS REVENUE
At €6.5 billion, DTT also accounts for more than half of all public and private expenditure generated by the wider national audiovisual industry, which is estimated at €11.2 billion for 2012.
In that same year, 22,500 workers were estimated to be directly employed in the DTT segment.
3 - THE ECONOMIC , SOCIAL AND CULTURAL IMPORTANCE OF DTT
Audiovisual industries turnover (€ billion, % and employees in units)
THE DTT IN THE LARGER
AUDIOVISUAL INDUSTRY

CONTENT CENTRALITY IN A CONTEXT OF INCREASING CONNECTIVITY - March 2014© e-Media Research Ltd.
TOTAL DTT TURNOVER
€6.5 bn
ADVERTISERS
Sales return delivered by DTT8.70
7.70
5.80
4.90
2.00
TV
Radio
Press
Online
Outdoor
Average revenue ROI by medium in the UK (£)
Source: e-Media Research on RAB data.
FOR EVERY EURO SPENT ON ADVERTISING ON DTT, ADVERTISERS RECEIVE BETWEEN €5 AND €9 BACK
There is a vast body of research in the field showing that TV has the largest economic footprint of any mass medium, thanks to the direct effect it exerts on business activity through advertising.
e-Media Research has not carried out any specific ROI field research on TV campaigns on the Italian market but believes it is reasonable to conservatively estimate that advertising expenditure on DTT generates a revenue ROI equal to a multiplier ranging from 5 to 9. This means that for every euro spent by advertisers on DTT, at least €5 to €9 is generated in terms of sales. This seems a reasonable value range. Furthermore, e-Media Research has found that, on the Italian market, new digital businesses (e.g. e-commerce, online services) enjoy a revenue ROI from TV advertising equal to a multiplier ranging from 18 to 26.
The €4 billion spent by advertisers on national and local DTT channels in 2012 is estimated to have had a direct effect (i.e. excluding any other “halo effect” on other media) of between €20 and €36 billion, in terms of sales activated by advertising.
In the absence of specific research on TV’s revenue ROI, e-Media Research has reviewed numerous studies carried out in other countries – including a recent study by the Radio Advertising Bureau, that compares average revenue ROI across media, and studies by Deloitte and Ebiquity – all of which focused on the UK. Data from a study by Microsoft Advertising was also used as a comparison. 5
3 - THE ECONOMIC , SOCIAL AND CULTURAL IMPORTANCE OF DTT
+ €20 / €36 billion
DTT turnover and advertiser sales volume directly activated by DTT (€ billion)
Source: e-Media Research estimates.
26
THE ECONOMIC IMPACT OF DTT
ON THE ADVERTISER SIDE

CONTENT CENTRALITY IN A CONTEXT OF INCREASING CONNECTIVITY - March 2014© e-Media Research Ltd.
TOTAL DTT TURNOVER
€6.5 bn
ADVERTISERS
+ €20 / €36 billion
Sales return delivered by DTT
CE & ICT SECTORS
+ €5 billion
Sales of goods and services
SALES VOLUME DIRECTLY ACTIVATED BY DTT €31-47 billion
It is therefore reasonable to assume that multi-platform distribution of content originating from DTT contributes to ICT turnover. Using 10% as a conservative working estimate of the share of the ICT market that is directly or indirectly linked to distribution and consumption of audiovisual content, and then applying DTT’s share of the audiovisual market (58%), the result is €3.2 billion in ICT revenue that is activated by DTT.
DTT GENERATES DIRECT SALES OF AROUND €5 BILLION IN THE CONSUMER ELECTRONICS AND ICT SECTORS
In 2012, the Italian TV set market was worth €2.1 billion 6. Assuming the DTT share of this market to be equal to the platform’s share of total TV viewing means €1.8 billion in TV set sales are directly attributable to DTT reception. This adds to the value of the market for terrestrial antennas, installation and maintenance, which are also significant in terms of induced business activity.
A share of the wider ICT market (networks, devices and services), valued at €56 billion in 2012 7, is linked to video consumption, part of which is certainly driven by content that is created and distributed by DTT broadcasters. Although it is possible to assume that the market for fixed and mobile Internet connectivity, just as the market for access devices, is somewhat independent from the richness and quality of content produced by the national content industries, it seems more plausible to argue that growth in the above-mentioned markets is directly affected by the availability of quality content.
3 - THE ECONOMIC , SOCIAL AND CULTURAL IMPORTANCE OF DTT
DTT turnover and total sales volume directly activated by DTT (€ billion)
Source: e-Media Research estimates.
27
THE ECONOMIC IMPACT OF DTT
ON CONSUMER ELECTRONICS AND ICT SECTORS

CONTENT CENTRALITY IN A CONTEXT OF INCREASING CONNECTIVITY - March 2014© e-Media Research Ltd.
ADVERTISERS
+ €20 / €36 billion
Sales return delivered by DTT
CE & ICT SECTORS
+ €5 billion
Sales of goods and services TOTAL DTT TURNOVER€6.5 billion
SOCIETYLARGER ECONOMIC, SOCIAL AND CULTURAL IMPACT
CREATIVE AND KNOWLEDGE SECTORS
SALES VOLUME DIRECTLY ACTIVATED BY DTT €31-47 billion
Economic contribution catalyst / adjuvant
Social cohesion and cultural development
DTT SOCIAL AND CULTURAL CONTRIBUTION HAS AN ECONOMIC VALUE
TV makes a key economic contribution to all other editorial industries, as well as to marketing and the wider creative industry. It also has an impact on education and knowledge, areas where audiovisual content has had an increasing role over the years.
In addition to its large economic contribution, TV – particularly FTA TV, owing to its particularly wide reach – has a broad social and cultural impact, which is widely recognised although difficult to quantify in economic terms.
3 - THE ECONOMIC , SOCIAL AND CULTURAL IMPORTANCE OF DTT
DTT turnover, total sales volume directly activated by DTT (€ billion) and DTT’s larger economic, social and cultural impact
Source: e-Media Research estimates.
28
THE LARGER ECONOMIC, SOCIAL
AND CULTURAL IMPACT OF DTT

CONTENT CENTRALITY IN A CONTEXT OF INCREASING CONNECTIVITY - March 2014© e-Media Research Ltd. 29
CONTENTS
INTRODUCTION
1. THE ROLE OF DTT IN THE ITALIAN TV LANDSCAPE
2. DTT: A UNIQUE MASS MEDIUM IN THE COMMUNICATIONS SECTOR
3. THE ECONOMIC, SOCIAL AND CULTURAL IMPORTANCE OF DTT
4. A CRITICAL MOMENT IN THE EVOLUTION OF THE NATIONAL CONTENT INDUSTRY
NOTES AND REFERENCES

CONTENT CENTRALITY IN A CONTEXT OF INCREASING CONNECTIVITY - March 2014© e-Media Research Ltd. 30
4 - A CRITICAL MOMENT IN THE EVOLUTION OF THE NATIONAL CONTENT INDUSTRY
WITHOUT CURRENTLY AVAILABLE SPECTRUM, DTT WILL LOSE ITS ECONOMIC AND SOCIAL VALUE
FTA TV broadcasters are by far the greatest actors and contributors to original audiovisual content production (film, drama and other TV genres). Broadcasters spend around €500 million a year on film content, including investment in production and rights acquisition (p. 31). As observed in other European countries, investment in drama production has declined from €510 million in 2007 to just €289 million in 2013 (p. 32).
The reduction of investment in original content production was caused by an industry-wide decline in the amount of resources available. In real terms, advertising expenditure on traditional media (TV, press and radio) declined by 46% between 2000 and 2012. The Internet, on the other hand, is the sole medium to see ad spend grow in real terms (p. 33). In-depth analysis of advertising expenditure on content-based media (newspapers, magazines, radio and the Internet) shows an emerging trend – one that will tend to intensify over the coming years. The share of advertising expenditure that is captured by non-publishers (i.e. market operators that do not invest in content production) is growing (p. 34).
This set of factors creates a critical context for the content industry and for FTA DTT, which is currently the TV platform with the highest economic and social value (ESV). A high ESV is the joint result of DTT being the platform with the widest audience on the market and one enjoying a high level of quality, i.e. a rich channel line-up and high technical quality of service (p. 36).
In this context, the debate on the allocation of radio-electric spectrum in the 700MHz band to fourth generation mobile services should evaluate with the greatest scrutiny the hypothesis of cutting available terrestrial broadcasting capacity by one third.
Although it has not carried out any specific technical analysis in this respect, e-Media Research suggests that DTT’s ESV could drop significantly in case spectrum that is currently available to broadcasting is not preserved. In this case, FTA terrestrial TV would gradually revert to delivering a poor service compared to pay-TV, thus losing its universal platform role (p. 37). 2012 2014 2016 2018 2020 2022 2024
SATELLITE PAY-TV
The 30% rationing in the available UHF spectrum could cause
a proportional decrease in the terminal value
of the ESV
Decreasing quality and richness cause more consumers to turn to pay-TV in order to receive a higher-standard service, further eroding DTT’s ESV
ESV= 46.2
Projected evolution of DTT’s economic and social value (ESV) – DTT frequency rationing
DTT
Source: e-Media Research.
KEY POINTS

CONTENT CENTRALITY IN A CONTEXT OF INCREASING CONNECTIVITY - March 2014© e-Media Research Ltd. 31
45%
16%
18%
21%TV Broadcasters
State, European and regional funds / direct investments
Productioncompanies
Others
Around€150
million
PRODUCTION SIDE DISTRIBUTION SIDE
Breakdown of domestic investmentin the production of Italian movies (€ million and %, 2011)
Film industry (retail and wholesale) revenue breakdown (€ million and %, 2011)
4 - A CRITICAL MOMENT IN THE EVOLUTION OF THE NATIONAL CONTENT INDUSTRY
THE BROADCASTERS’ UNIQUE CONTRIBUTION TO THE FILM INDUSTRY
FTA TV broadcasters contribute significantly to national audiovisual production and their contribution is not limited to the genres that are peculiar of TV.
The contribution of broadcasters to the development and vitality of the film industry is a fundamental one in Italy, both in terms of the direct investment in content production and co-production (around €150 million in 2011) and in terms of the acquisition of rights to national and foreign films (€330-360 million in the same year).
Source: e-Media Research on Anica, Fondazione Ente dello Spettacolo, Univideo, various sources. Note: (*) denotes estimates.
% of box office revenues
THEATRICAL HOME VIDEO
FTA TV + PAY-TV
FILM INDUSTRY REVENUES*RETAIL LEVEL: €1.8 BILLION
~40% ~20% ~40%
Rightsacquisition
% of revenues from rentals,
purchases
FILM DISTRIBUTORS’ REVENUES* : €0.85 BILLION
Around€330-360
million
THE BROADCASTERS’ VITAL CONTRIBUTION
TO THE FILM INDUSTRY

CONTENT CENTRALITY IN A CONTEXT OF INCREASING CONNECTIVITY - March 2014© e-Media Research Ltd. 32
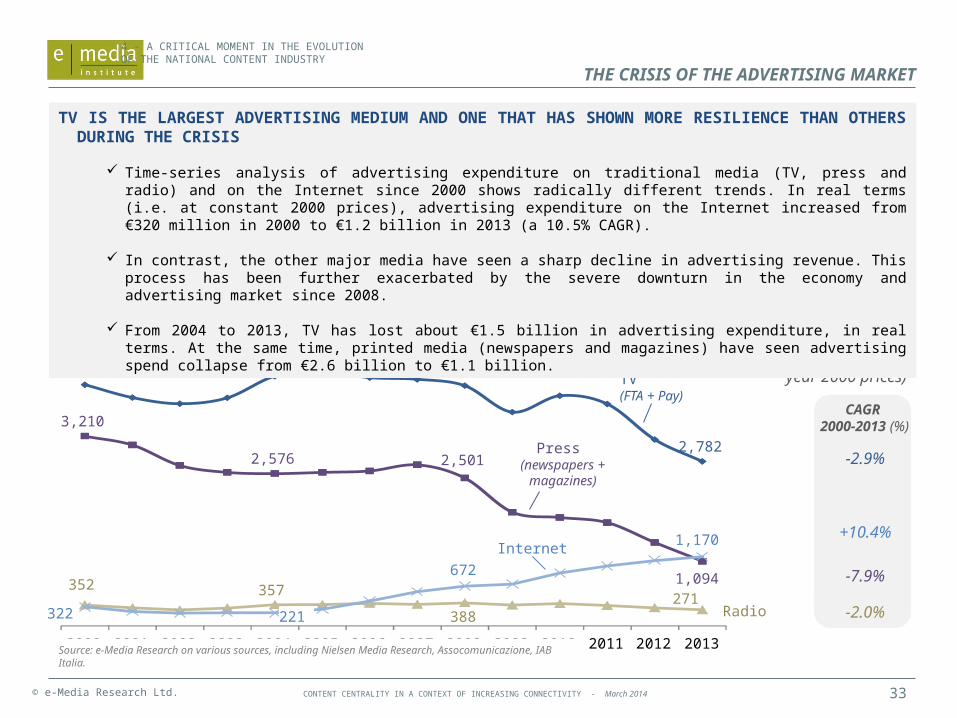
Revenue of national DTT channels and expenditure on original commissioned drama (€ million)
5,039
3,961
510289
85.3% 83.4% 84.0%
2007 2008 2009 2010 2011 2012 2013e
-21%
-43%
4,888
366
Revenue of national DTT free-to-air channels (€ million)
Total expenditure of broadcasters on original commissioned drama (€ million)
Audience share of terrestrial TV platform (analogue + digital, in %, total TV HH)
Historical analogue broadcasters commission
the vast majority of Italian original drama
4 - A CRITICAL MOMENT IN THE EVOLUTION OF THE NATIONAL CONTENT INDUSTRY
THE BROADCASTERS’ UNIQUE CONTRIBUTION TO NATIONAL CONTENT PRODUCTION
In most European countries, FTA TV broadcasters play a crucial role in the audiovisual industry with significant investments in production across various genres.
In Italy, in recent years, investment in original production has declined due to the economic downturn and its adverse effect on advertising expenditure. For instance, historical terrestrial broadcasters commission the vast majority of Italian original drama but investment has shrunk from €510 million in 2007 to just €289 million in 2013. The UK has seen a similar trend, with investment plummeting from £1.16 billion in 2007 to £809 million in 2013.
Source: e-Media Research on Auditel, Agcom, APT, various sources.
BROADCASTERS’ CONTRIBUTION
TO AUDIOVISUAL ORIGINAL PRODUCTION
CONTENT CENTRALITY IN A CONTEXT OF INCREASING CONNECTIVITY - March 2014
4,079 4,224
4,062
2,782
3,210
2,576 2,501
1,094 352 357
388 271
322 221
672
1,170
2000 2001 2002 2003 2004 2005 2006 2007 2008 2009 2010 2011 2012 2013
TV(FTA + Pay)
Internet
Press (newspapers +
magazines)
Radio
-2.9%
+10.4%
-7.9%
-2.0%
CAGR 2000-2013 (%)
Source: e-Media Research on various sources, including Nielsen Media Research, Assocomunicazione, IAB Italia.
© e-Media Research Ltd. 33
4 - A CRITICAL MOMENT IN THE EVOLUTION OF THE NATIONAL CONTENT INDUSTRY
Net advertising expenditure by medium in Italy – 2000-2013 (€ million, at constant
year 2000 prices)
TV IS THE LARGEST ADVERTISING MEDIUM AND ONE THAT HAS SHOWN MORE RESILIENCE THAN OTHERS DURING THE CRISIS
Time-series analysis of advertising expenditure on traditional media (TV, press and radio) and on the Internet since 2000 shows radically different trends. In real terms (i.e. at constant 2000 prices), advertising expenditure on the Internet increased from €320 million in 2000 to €1.2 billion in 2013 (a 10.5% CAGR).
In contrast, the other major media have seen a sharp decline in advertising revenue. This process has been further exacerbated by the severe downturn in the economy and advertising market since 2008.
From 2004 to 2013, TV has lost about €1.5 billion in advertising expenditure, in real terms. At the same time, printed media (newspapers and magazines) have seen advertising spend collapse from €2.6 billion to €1.1 billion.
THE CRISIS OF THE ADVERTISING MARKET

CONTENT CENTRALITY IN A CONTEXT OF INCREASING CONNECTIVITY - March 2014© e-Media Research Ltd. 34
4 - A CRITICAL MOMENT IN THE EVOLUTION OF THE NATIONAL CONTENT INDUSTRY
Advertising expenditure in Italy – 2000-2013: publishers vs. non-publishers (%)
2000 2002 2004 2006 2008 2010 2012 2014f 2016f 2018f 2020f
27%
100% 73%
10% 14%21%
PUBLISHERS & BROADCASTERS- Publishers (newspapers, magazines)- Broadcasters- Internet-native publishers
NON-PUBLISHERSSearch engines, aggregators, social networks etc.
24%19%
TOTAL ADVERTISING EXPENDITURE ON CONTENT-BASED MEDIA
(newspapers, magazines,TV, radio, Internet)€ 8.0 bn € 8.8 bn € 7.7 bn € 8.5 bn
A large share of this expenditure is directly reinvested in original content production
Despite losing advertising spend, TV is one of the few content-based media that maintained its audience
A GROWING SHARE OF ADVERTISING EXPENDITURE ON CONTENT-BASED MEDIA IS BEING CAPTURED BY NON-PUBLISHERS
Analysis of the share of advertising expenditure on content-based media (newspapers, magazines, radio and the Internet) that is captured by operators, with and without publisher functions, shows that the latter (i.e. share of non-publishers) is growing. In the UK, as early as 2012, the share of advertising expenditure that was captured by non-publishers had reached 34% of the total. Moreover, non-publishers enjoy a competitive advantage in that they tend to operate in a virtually unregulated market context.
The result of this process is a severe decline in the ability of national publishers to produce original content, with consequent weakening not only of the content industry but also of the country’s entire socio-cultural system.
Source: e-Media Research estimates on various sources.
ADVERTISING EXPENDITURE:
PUBLISHERS VS. NON-PUBLISHERS 2000 - 2020

CONTENT CENTRALITY IN A CONTEXT OF INCREASING CONNECTIVITY - March 2014
21%
31%27%
21%
Home video (rental)
FILM PIRACY – ECONOMIC IMPACT
Economic impact of film piracy in Italy – revenue loss by channel (€ million and %, 2010)
© e-Media Research Ltd. 35
4 - A CRITICAL MOMENT IN THE EVOLUTION OF THE NATIONAL CONTENT INDUSTRY
AT LEAST €0.5 BILLION IN FILM REVENUES ARE LOST TO AUDIOVISUAL PIRACY EVERY YEAR
According to a January 2011 FAPAV-IPSOS research, 37% of Italian consumers have used the unlawful copy of a film at least once during the previous 12 months. This behaviour was estimated to have caused €500 million in lost revenues to lawful film distribution in 2010, with retail home video being the hardest hit channel. Furthermore, due to strong growth in both demand for Internet video and penetration of broadband Internet, this impact is likely to have been higher in 2012 or 2013.
Although no estimate of adverse economic impact is available, the research also shows that over 10% of Italian consumers had unlawfully watched or exchanged TV content in the period. Thirteen percent had done so with a TV series.
Source: FAPAV, IPSOS estimates.
TV (Sat+DTT) and VoD
Home video (sell-through)
Cinema
TOTALECONOMIC
IMPACT OF FILM PIRACY
€496 MILLION
TOTALPOPULATION
15+13% Illegally watch / download /
exchange TV SERIES
11%TOTAL
POPULATION15+
Illegally watch / download / exchange OTHER TV SHOWS(INCLUDING SPORTING EVENTS)
TV SHOW PIRACY – CONSUMER ATTITUDE
Consumer attitude towards TV show piracy by category (% of population,
Jan 2011, last 12 months)
Source: FAPAV, Ipsos. Note: consumer research, base: 2,017 individuals 15+, January 2011. Share of population that has illegally consumed TV content over the last 12 months.
AUDIOVISUAL PIRACY HAS A SIGNIFICANT
ECONOMIC IMPACT ON THE MARKET

CONTENT CENTRALITY IN A CONTEXT OF INCREASING CONNECTIVITY - March 2014© e-Media Research Ltd. 36
WITH CURRENTLY AVAILABLE SPECTRUM, DTT WILL MAINTAIN ITS CURRENT SUPPLY CAPACITY AND ATTRACTIVENESS
The economic and social value (ESV) of a mass medium can be measured as a function of its degree of adoption within a community and the quality (including technical quality) of the service it delivers, which is normally contingent on the technical set-up prevailing at any given time. For instance, during the transition from black-and-white to colour TV, the latter was undoubtedly accepted as the highest quality standard. If one service delivers the highest quality given the current standards, no consumer can realistically aspire to get a better offer. To take another example, nowadays a TV platform must be able to offer a package of at least 90-100 generalist and thematic channels to be considered very attractive by the viewer. If it offered only a dozen channels, it would deliver significantly less value to the consumer.
It is possible to attribute a score to this richness on a 1 to 5 scale, where 5 approximates the richest offer, meeting the highest expectations and standards in the market, and 1 approximates the least attractive offer. At the same time, it is possible to attribute a 1 to 5 score to the offer’s technical quality of service. Currently, for instance, a TV platform that does not carry any HD channels would certainly not receive the top score. By compiling a time series for these values for each individual platform and then multiplying them by the corresponding diffusion data (aggregate audience), it is possible to calculate an index that proxies the evolution of its ESV. Analytically, the index is equal to the sum of richness (R) and technical quality (Q) multiplied by the platform’s audience (A) in any given period: ESV = (R + Q) A.
Legend for richness (R) and technical quality (Q)
5) Highest standard in the market
4) Slightly lower than the top standard in the market
3) Not sufficiently competitive with existing offers
2) Inadequate
1) Strongly inadequate to market expectations (out of market)
Migration to digital revamps the terrestrial platform, raising both quality of vision and the number of services available
and consequently its attractiveness
to the consumerNew frequencies (3 multiplexes carrying up to
18 new SD channels) to be auctioned during Q2 2014 mean DTT will further expand, likely
with new HD services, and operators will be able to plan a smooth transition to the new
standard over 3 to 10 years.
1984 1986 1988 1990 1992 1994 1996 1998 2000 2002 2004 2006 2008 2010 2012 2014 2016 2018 2020 2022 2024
ESV= 100
SATELLITE PAY-TV
DTT
ANALOGUE TERRESTRIAL TV (ATT)
Given the prevailing standards of the time, analog terrestrial TV (ATT) was the best offer available on the market, both in terms of channels available and quality of service. The platform also accounted for 100% of the audience.
The launch and development of multichannel pay-TV caused a decline in the ESV of ATT, which was increasingly perceived as offering a “poor” or “poorer” service compared to the competing platform
ESV= 72.9
4 - A CRITICAL MOMENT IN THE EVOLUTION OF THE NATIONAL CONTENT INDUSTRY
Economic and social value (ESV) of TV platforms in Italy – no DTT frequency rationing
Source: e-Media Research.
ESTIMATED EVOLUTION OF DTT’S ECONOMIC
AND SOCIAL VALUE (ESV) / 1

CONTENT CENTRALITY IN A CONTEXT OF INCREASING CONNECTIVITY - March 2014© e-Media Research Ltd. 37
WITHOUT CURRENTLY AVAILABLE SPECTRUM, DTT WILL REVERT BACK TO DELIVERING A POOR SERVICE WITH TWO MAIN CONSEQUENCES: LOSS OF THE SOLE UNIVERSAL TV PLATFORM AND REDUCTION IN TV PLATFORM COMPETITION
A visual representation of DTT’s relative loss of value deriving from rationing of available broadcasting spectrum is shown below.
The exercise assumes, as the standard hypothesis, a reduction of about 30% in broadcasting capacity (channels 49-60 of UHF spectrum, i.e. the entire 700MHz band) from 2018 onwards, causing proportional decreases in both the number of services available below the 100 channel threshold and perceived quality of service, owing to slower development of HD services that is only partly offset by gradual transition to DVB-T2. This drop in the Q and R components of DTT’s ESV will also cause more consumers to turn to pay-TV in order to receive a richer-standard service, so the number of satellite pay-TV subscribers will increase more than would otherwise be the case, therefore impacting DTT’s audience and further eroding its ESV, along with its role as a universal FTA TV platform.
It should be noted that the actual trajectory of decline in the ESV index for DTT is contingent upon a number of factors, including but not limited to the speed of transition to DVB-T2, and the actual share of the 700MHz band that is handed to mobile services. These factors should be accounted for as new information becomes available to fine-tune the ESV approach.
Decreasing quality and richness cause more consumers to turn to pay-TV in order to receive a higher-standard service, further eroding DTT’s ESV
Proposed handover of channels 49-60 of UHF to mobile services causes a reduction of 30% in available broadcasting capacity, scaling the number of available services back to below 100 and inhibiting further development of HD services from 2018 onwards.
Terrestrial TV gradually reverts to delivering a poor service (decreasing ESV), which adversely affects the market and the consumer in two ways:
1) Loss of a universal TV platform;
2) Reduction of competition among TV platforms.
The 30% rationing in the available UHF spectrum could cause a proportional decrease
in the terminal value of the ESV
ESV= 46.2
1984 1986 1988 1990 1992 1994 1996 1998 2000 2002 2004 2006 2008 2010 2012 2014 2016 2018 2020 2022 2024
ESV= 100
SATELLITE PAY-TV
DTT
ANALOGUE TERRESTRIAL TV (ATT)
4 - A CRITICAL MOMENT IN THE EVOLUTION OF THE NATIONAL CONTENT INDUSTRY
Source: e-Media Research.
Economic and social value (ESV) of TV platforms in Italy – DTT frequency rationing Legend for richness (R) and technical quality (Q)
5) Highest standard in the market
4) Slightly lower than the top standard in the market
3) Not sufficiently competitive with existing offers
2) Inadequate
1) Strongly inadequate to market expectations (out of market)
ESTIMATED EVOLUTION OF DTT’S ECONOMIC
AND SOCIAL VALUE (ESV) / 2

CONTENT CENTRALITY IN A CONTEXT OF INCREASING CONNECTIVITY - March 2014© e-Media Research Ltd. 38
INTRODUCTION
1. THE ROLE OF DTT IN THE ITALIAN TV LANDSCAPE
2. DTT: A UNIQUE MASS MEDIUM IN THE COMMUNICATIONS SECTOR
3. THE ECONOMIC, SOCIAL AND CULTURAL IMPORTANCE OF DTT
4. A CRITICAL MOMENT IN THE EVOLUTION OF THE NATIONAL CONTENT INDUSTRY
NOTES AND REFERENCES
CONTENTS

CONTENT CENTRALITY IN A CONTEXT OF INCREASING CONNECTIVITY - March 2014© e-Media Research Ltd. 39
NOTES
1 Source: Ofcom on BARB data. Share of total TV viewing hours, by platform signal. Digital satellite accounts for 40.9% of total share and digital cable for 13.6%. Other platforms (mainly IPTV) for the remaining 0.1%.
2 The number of DTT channels excludes showcase, time-shifted, paid-for, Internet-delivered OTT TV, as well as regional / local channels. For all three countries, data only include channels available via nationwide multiplexes. Viewership data only include channels whose audience share data are publicly available (23 channels in France, 37 in the UK and 52 in Italy).
3 Data are year-end estimates except for next generation access (NGA) lines. NGA lines include fibre-to-the-home (FTTH), fibre-to-the-building (FTTB), very-high-bit-rate digital subscriber line (VDSL), Cable Docsis 3.0 and other technologies.
4 According to Nielsen SocialGuide, which tracks Twitter conversation about over 250 TV networks in the US, 17.2 million people tweeted about TV between August and October of 2013.
5 See studies by Deloitte and the Radio Advertising Bureau in the References.
6 Gfk. Technical Consumer Equipment: consumer choice in 2012 and the perspective of 2013, presentation by Alessandro Bardi, Business Director, Gfk Retail and Technology Italia.
7 See study by Assinform in the References.

CONTENT CENTRALITY IN A CONTEXT OF INCREASING CONNECTIVITY - March 2014© e-Media Research Ltd. 40
REFERENCES
AGCOM. Relazioni annuali , 2010, 2011, 2012, 2013.
Analysis Mason. The Role of DTT and mobile technologies using UHF, 2013.
APWPT (Association of Professional Wireless Production Technology). Cultural Europe will not survive a second digital dividend, 2013.
Assinform. Il Rapporto Assinform 2013: 44 anni di innovazione tecnologica in Italia, 2013.
CENSIS. Undicesimo rapporto sulla comunicazione, 2013.
Communications Chambers for Digital UK. The value of Digital Terrestrial Television in an era of increasing demand for spectrum, 2014.
Deloitte for the Advertising Association;. Advertising Pays. How advertising can unlock UK growth potential, 2013.
Deloitte for the Advertising Association;. Advertising Pays. How advertising fuels UK economy, 2012
Ebiquity for ThinkBox. Why TV ads deliver the most profit, 2012.
e-Media Research for ACT (Association of Commercial Televisions). Creative Media Europe. Audiovisual Content and Online Growth, 2013
IPSOS for FAPAV. La pirateria audiovisiva in Italia, 2011.
OFCOM. Communications Market Report, 2013.
RAB (Radio Advertising Bureau). Radio: the ROI Multiplier, 2013.
Report of the expert advisory team. Achieving the Objectives of the Digital Agenda for Europe (DAE) in Italy, 2014.
Symbola. Italian Quality and Beauty. Report on the Cultural and Creative Industries in Italy, 2013.
Unindustria; Camera di Commercio Roma. L’impatto economico dell’industria audiovisiva in Italia, 2012.
WPP Italia; The European House Ambrosetti. Il ruolo della comunicazione perla società di domani, 2013.

CONTENT CENTRALITY IN A CONTEXT OF INCREASING CONNECTIVITY - March 2014© e-Media Research Ltd. 41
CONTACT DETAILS
e-Media Research Ltd Hoxton Mix 3rd Floor, 341 – 345 Old St, London EC1V 9LL TELEPHONEVoice: +44 (0)20 3239 1736 [email protected]
Emilio PucciDirector