Embed Size (px)
Citation preview
INTERNATIONAL JOURNAL OF SPECIAL EDUCATION Vol 27, No: 2, 2012
ISSN 0827 3383
International Journalof
Special EducationVOLUME 27 2012 NUMBER 2
An Investigation of Social Support and Burnout Among Special Education Teachers in the United Arab Emirates
Anger in Children with Autism Spectrum Disorders: Parents’ Perspectives Attributions of the Educational Outcomes of Students with Learning Disabilities in China BOOK REVIEW - Supporting Children with Learning Difficulties, Holistic Solutions for
Severe, Profound and Multiple Disabilities: London: Continuum International Publishing Group: Christine Turner
Comparing Special Education in the United States and China Counseling Gifted and Talented Students in Jordanian Inclusive Schools: Conclusion and
Implication Educational Outcomes for Children At-Risk: The Influence of Individual Differences in
Children's Temperaments Including Students with Disabilities in UAE Schools: A Descriptive Study Insights into Self-Concept of the Adolescents Who Are Aisually Impaired in India International Views of Inclusive Education: A Comparative Study of Early Childhood
Educator’s Perceptions in Jordan, United Arab Emirates, and the United States of America
Let’s Ask the Kids: Consumer Constructions of Co-teaching Listening to Their Voices: Factors that Inhibit or Enhance Postsecondary Outcomes for
Students’ with Disabilities Mapping the Early Entervention System in Ontario, Canada National Regulations and Guidelines and the Local Follow-up in the Chain of Actions in
Special Education On the Dirt Road to Inclusion Social inclusion: Teachers as Facilitators in Peer Acceptance of Students with Disabilities
in Regular Classrooms in Tamil Nadu, India The Role of Auditory Cues in the Spatial Knowledge of Blind Individuals Towards a Framework for Understanding the Process of Educating the ‘Special’ in
Special Education Using Inquiry-Based Instruction for Teaching Science to Students with Learning
Disabilities Validity and Reliability of Turkish Version of Gilliam Autism Rating Scale-2: Results of
Preliminary Study Who sinned? Parents’ Knowledge of the Causes of Disability in Tanzania
International Journal of Special Education
1
INTERNATIONAL JOURNAL OF SPECIAL EDUCATION Vol 27, No: 2, 2012
EDITORIAL POLICY
The International Journal of Special Education publishes original articles concerning special education. Experimental as well as theoretical articles are sought. Potential contributors are encouraged to submit reviews of research, historical, and philosophical studies, case studies and content analyses in addition to experimental correlation studies, surveys and reports of the effectiveness of innovative programs.
Send your article to [email protected] or [email protected] as attachment by e-mail, in MSWORD for IBM format ONLY .
Articles should be double spaced (including references). Submit one original only. Any tables must be in MS-WORD for IBM Format and in the correct placement within the article. Please include a clear return e-mail address for the electronic return of any material. Published articles remain the property of the Journal.
E-mailed contributions are reviewed by the Editorial Board. Articles are then chosen for publication. Accepted articles may be revised for clarity, organisation and length.
Style: The content, organisation and style of articles should follow the Publication Manual of the American Psychological Association, Sixth Edition. An article written in an obviously deviating style will be returned to the author for revision.
Abstracts: All articles will be preceded by an abstract of 100-200 words. Contributors are referred to the Publication Manual of the American Psychological Association, Sixth Edition for assistance in preparing the abstract.
Word Processing Guidelines: All articles (including tables and figures) must fit within size A4 paper, 1.2” in left-right margins, 1.2” top/bottom margins, and be in portrait orientation.
Responsibility of Authors: Authors are solely responsible for the factual accuracy of their contributions. The author is responsible for obtaining permission to quote lengthy excerpts from previously published material. All figures and tables must be included within the document.
JOURNAL LISTINGSAnnotated and Indexed by the ERIC Clearinghouse on Handicapped and Gifted Children for publication in the monthly print index Current Index to Journals of Special Education (CIJE) and the quarterly index, Exceptional Child Education Resources (ECER).IJSE is also indexed at Education Index (EDI).
The journal appears at the website: www.internationaljournalofspecialeducation.com
The editor, Dr. Marg Csapo, may be reached at [email protected] co-editor, Dr. Iris Drower, may be reached at [email protected]
VOLUME 27 2012 NUMBER 2
2
I N D E X
INTERNATIONAL JOURNAL OF SPECIAL EDUCATION Vol 27, No: 2, 2012
An Investigation of Social Support and Burnout Among Special Education Teachers in the United Arab Emirates……………………………………………………………………..5Osamah Bataineh and Ahmed Alsagheer
Anger in Children with Autism Spectrum Disorders: Parents’ Perspectives.............................................14Betty P. V. Ho, Jennifer Stephenson and Mark Carter
Attributions of the Educational Outcomes of Students with Learning Disabilities in China………………………………………………………………………………………32Stuart Woodcock and Han Jiang
BOOK REVIEW - Supporting Children with Learning Difficulties, Holistic Solutions for Severe, Profound and Multiple Disabilities: London: Continuum International Publishing Group: Christine Turner………………………………………………………46Shelly Gupta
Comparing Special Education in the United States and China…………………………………………51 Jeffrey B. Kritzer
Counseling Gifted and Talented Students in Jordanian Inclusive Schools: Conclusion and Implication…………………………………………………………………………………………..56 Ibrahim A. El-Zraigat
Educational Outcomes for Children At-Risk: The Influence of Individual Differences in Children's Temperaments………………………………………………………………………………63Maha Al-Hendawi and Evelyn Reed
Including Students with Disabilities in UAE Schools: A Descriptive Study……………………………74Nisreen M. Anati and Al Ain
Insights into Self-Concept of the Adolescents Who Are Visually Impaired in India…………………….85Santoshi Halder and Poulomee Datta
International Views of Inclusive Education: A Comparative Study of Early Childhood Educator’s Perceptions in Jordan, United Arab Emirates, and the United States of America…………93Diala Hamaidi, Moayyad Homidi and Luis V. Reyes
Let’s Ask the Kids: Consumer Constructions of Co-teaching…………………………………………..101Dusty Columbia Embury and Stephen D. Kroeger
Listening to Their Voices: Factors that Inhibit or Enhance Postsecondary Outcomes for Students’ with Disabilities……………………………………………………………………………..112Dorothy F. Garrison-Wade
Mapping the Early Intervention System in Ontario, Canada……………………………………………125 Kathryn Underwood
National Regulations and Guidelines and the Local Follow-up in the Chain of Actions in Special Education.................................................................................................................................................135 Sven Nilsen Camilla Herlofsen
On the Dirt Road to Inclusion………………………………………………………………………….147 Jaroslaw Wiazowski
Social inclusion: Teachers as facilitators in peer acceptance of students with disabilities in regular classrooms in Tamil Nadu, India……………………………………………………………………….156Ruffina David and Ahmed Bawa Kuyini
3
INTERNATIONAL JOURNAL OF SPECIAL EDUCATION Vol 27, No: 2, 2012
The Role of Auditory Cues in the Spatial Knowledge of Blind Individuals……………………………168 Konstantinos Papadopoulos, Kimon Papadimitriou and Athanasios Koutsoklenis
Towards a Framework for Understanding the Process of Educating the ‘Special’ in Special Education…………………………………………………………………………181 Rune Sarromaa Hausstätter and Steven Connolley
Using Inquiry-Based Instruction for Teaching Science to Students with Learning Disabilities………………………………………………………………………………..…189Mehmet Aydeniz, David F. Cihak, Shannon C. Graham and Larryn Retinger
Validity and Reliability of Turkish Version of Gilliam Autism Rating Scale-2: Results of PreliminaryStudy……………………………………………………………………………………207Ibrahim H. Diken, James E. Gilliam, Avsar Ardic, Ozlem Diken and Dwight Sweeney
Who sinned? Parents’ Knowledge of the Causes of Disability in Tanzania………………………….216Frida D. Tungaraza
4
INTERNATIONAL JOURNAL OF SPECIAL EDUCATION Vol 27, No: 2, 2012
AN INVESTIGATION OF SOCIAL SUPPORT AND BURNOUT AMONG SPECIAL EDUCATION TEACHERS IN THE UNITED ARAB EMIRATES
Osamah BatainehAhmed Alsagheer
University of Sharjah, Sharjah
This study aimed at investigating which source of social support (supervisors, colleagues, friends, spouse, or family) would be most effective in reducing burnout among special education teachers. A sample of 300 special education teachers (50 males and 250 females) completed Burnout and Sources of Social Support questionnaires. Pearson correlation coefficients and ANOVA procedures were utilized to analyze the data. Results revealed significant positive correlations between family support, colleagues support, and personal accomplishment. Demographic variables sex, age, marital status, and teaching experience were not significantly related to any of the three burnout dimensions. Results were interpreted and implications for special education teachers were suggested.
The United Arab Emirates (UAE) is comprised of seven emirates. It is situated on the Arabian Gulf, east of Saudi Arabia and north of Oman. The economy is driven by oil and gas and recently tourism. There is a large expatriate population in the country.
In 1951, the Trucial States Council was formed, bringing all the leaders of the various groups throughout the region together. In 1971 the formal joining of the seven emirates (Abu Dhabi, Dubai, Sharjah, Ras Al-Kahaimah, Umm Al Qaiwain, and Ajman) was completed in Dubai. There are no political parties or elections since the country is ruled by appointed families established with the formation of the UAE.
The Education System in United Arab EmiratesThe United Arab Emirates Ministry of Education and Youth is responsible for both the public and the private education systems that operate within the country's seven emirates. For the public school system, the Ministry of Education and Youth assumes a broad set of roles, similar to Ministries of Education in other countries. It builds new buildings, hires staff, determines the standards of education, and provides curricular materials and support. The Ministry also coordinates a variety of educationally relevant activities and ensures that adequate programs are operating. On the other hand, the roles of the Ministry of Education and Youth with the private education system are mainly concerned with licensure and supervision. The Ministry ensures that the basic requirements for the physical components of schools are met and that the private schools provide sound educational programs (Bradshaw, Tennant, & Lydiatt, 2004).
Special Education in United Arab EmiratesSpecial Education in United Arab Emirates has witnessed a massive development since 1979. The provision of special education programs and services in the UAE has evolved and expanded to recognize a wider variety of categories of special education, which is also available to students at higher grades, and to promote inclusive education, or access to educational opportunities. The categories of special education now include the gifted and talented individuals whose abilities, talents and potential for accomplishments are so exceptionally advanced that special education and support services are needed for the students to meet educational objectives and goals in the general education classrooms. In addition, in 2006, special education programs and services in the UAE were expanded to include the delivery of services to students up to the 9th grade.
5
INTERNATIONAL JOURNAL OF SPECIAL EDUCATION Vol 27, No: 2, 2012
In the past, the Ministry of Education in the UAE primarily provided special education programs and services to students with intellectual disabilities in community or center-based educational programs, while students with sensory and physical disabilities received their education in general education classrooms and received support from regular and special education teachers. The UAE Federal Law, No. 29, 2006, regarding the rights of Persons with Special Needs has resulted in an increase in the number of students with intellectual disabilities being included in the general education schools (Ministry of Education, 2010).
The primary function of a special education teacher in United Arab Emirates is to accept students with special needs and provide them with equal opportunities to learn. The instructor is also required to monitor the implementation of special education programs and provide periodic reports on the status of these programs and services, to participate in the meetings, training courses, workshops and special activities aimed at improving the quality and delivery of special education programs and services. Furthermore, a special education teacher is expected to conduct assessment to determine a student's level of academic performance, to perform the necessary diagnosis of the children with learning disabilities, measure the forms of disabilities and coordinate regular classes with parents, school administrators, and the educational counselor in order to identify the case and the need for joining a special resource room (Ministry of Education, 2010).
In recent years, teacher stress has increasingly been recognized as a widespread problem and has become a global concern (Kim, Lee, & Kim, 2009; Chan, 2007).Almost one third of the teachers surveyed in various studies around the world have reported that they regard teaching as a highly stressful job (Borg, 1990). Researchers have attempted to identify occupational stressors within the teaching environment. These include work overload, role ambiguity and conflict, pressures of the teachers' role, inadequate resources, poor working conditions, lack of professional recognition, low remuneration, lack of involvement in decision-making, lack of effective communication, staff conflicts, and student misbehavior (Kim, Lee, & Kim, 2009).
Burnout is a major problem in education, teaching in particular has been identified as a stressful situation. Burnout in the teaching profession is described as similar to burnout at work in general. In a number of studies concerning teacher burnout, the latter is identified as resulting from ongoing stress (Kim, Lee, & Kim, 2009; Talmor, Reiter, & Feigin, 2005). The symptoms are mainly headaches, migraines, hypertension, nervous stomach, loss of appetite, weight loss and bowel difficulties (Alkhrisha, 2002).
Friedman (2000) found that the main components of burnout among teachers are: exhaustion, a sense of lacking professional fulfillment and an attitude of de-personalization that is expressed by blaming the student. He found that the essence of burnout among teachers is the feeling of professional failure as a result of the gap between the actual feelings of personal professional competence and the ideal competence to which the teacher aspires. The personal competence of teachers relates not only to teaching tasks and interpersonal relationship between teachers and students, but also to the teacher’s performance in the school organization.
Talmor et al., (2005) identified several signs of burnout. They reported that the outward expressions of teacher burnout are usually extreme reactions of anger, anxiety, depression, fatigue, cynicism, guilt, psychosomatic reactions and emotional breakdown. Thus, based on this study, the trained observer should be able to easily recognize burnout.
According to Schamer and Jackson (1996), burnout can cause teachers to develop negative attitudes towards students and lose their idealism, energy, and purpose. Furthermore, it can make teachers behave rigidly and show an overly tough attitude towards their students, and have negative and low expectations of students, and they may feel exhausted, emotionally and physically, and show low levels of involvement in teaching or concern for their students( Hoffman, Palladino, & Barnett, 2007).
Platsidou and Agaliotis (2008) reported average to low levels of burnout among special education teachers in Greek. They found teacher burnout may be caused by various factors, including excessive work, work conditions and low satisfaction with prospects of promotion and pay.
6
INTERNATIONAL JOURNAL OF SPECIAL EDUCATION Vol 27, No: 2, 2012
Kokkinos (2007) investigated the association between burnout and job stressors among primary school teachers. The conclusions of the investigation indicate that managing students' misbehavior, teachers' appraisal by students' work load, and the time constraints are predictors of dimensions of burnout.
Researchers have identified several factors that contribute to the teacher burnout syndrome. Of importance to teachers, particularly special educators are performance of custodial and managerial tasks, excessive amount of direct contact with children, a perceived lack of job success, program structure, and work overload (Sari, 2004; Friedman, 2000). Teacher burnout may be caused by various factors, including excessive work, lack of administrative and parental support, inadequate salaries, disciplinary problems, lack of students' interest, overcrowded classrooms, and public criticism of teachers and their work (Sari, 2004). In other studies (Hoffman, Palladino, & Barnett, 2007; Kokkinos, 2007; & Friedman, 1995), it has been found out that burnout among teachers is often caused by high levels of prolonged stress related to inordinate time demands, large class size, lack of recourses, role ambiguity, lack of support, involvement in decision making, and student behavioral problems. According to Alkhrisha (2002), major sources of stress of Jordanian teachers are workload, low salary, lack of self-esteem, lack of in-service training opportunities, lack of access to new information and knowledge. Also, this study found that demographic variables are the major sources of teacher burnout. In addition, some demographic variables, such as age, marital status, experience and sex, were found to be related to burnout (Kokkinos, (2007); Miller, Brownell, & Smith, 1999; Wisniewski & Gargiulo, 1997; Alkhrisha, 2002).
First introduced by Freudenberger (1980), professional burnout occurs in response to prolonged work tensions and stressors. Pine and Keinan (2005) reported that it happens most often among those who work with people and results from the emotional stress that arises during the interaction with them (p. 387).According to Maslach and Jackson (1986), burnout is comprised of three dimensions: emotional exhaustion, lack of personal accomplishment and feelings of depersonalization. Leung, Siu, and Spector (2000) reported that burnout symptoms include recurrent bouts of flu, headaches, fatigue, poor self-esteem, difficulty in interpersonal relationships, substance abuse, inability to concentrate on a subject, rigidity and a tendency to blame others for one's problems.
Although different definitions of burnout exist, this long-term stress reaction is most commonly described as a psychological syndrome of emotional exhaustion, depersonalization, and reduced personal accomplishment that can occur among individuals who work with other people in some capacity. Emotional exhaustion refers to feelings of being emotionally over extended and depleted of one’s emotional resources.
Depersonalization refers to a negative callous or excessively detached response to other people, who usually, are, the recipients of one’s service or care. Reduced personal accomplishment refers to a decline in one’s feelings of competence and successful achievement in one’s work (Hastings, Horne, & Mitchell, 2004, p. 268).
Consequences of burnout include significant decrease in the quality of teaching, long absenteeism, early leaving of the profession, diminished job satisfaction and reduced teacher–pupil rapport. Decreased teacher effectiveness in meeting educational goals and reduced pupil motivation also result from burnout (Abel & Sewell, 1999).
Several studies have recently addressed various issues related to teachers and children with special needs. For example; Dababseh (1993) found moderate levels of burnout among teachers of children with special needs. In another study, morale of special education teachers was most satisfied with relations to community, rapport with students, and satisfaction with teaching and least satisfied with work load and financial incentives (Al-Khateeb, Hadidi, & Elayyan, 1996). Alkhrisha (2002) found high levels of burnout among Jordanian teachers. Also, this study found that demographic variables are the major sources of burnout in Jordan.
Several studies reviewed show that professionals working with special needs students are apt to develop the burnout syndrome, which leads to an impairment in the quality of the services provided by the organization (Cherniss, 1988; Eichinger, Heifetz, & Ingraham, 1991). Of the variables identified as antecedents of the syndrome within professionals working with special needs students, variables of a socio-demographic style, lack of social support at work, autonomy, and work overload, among others, are mentioned (Sari, 2004).
7
INTERNATIONAL JOURNAL OF SPECIAL EDUCATION Vol 27, No: 2, 2012
Burnout has a negative effect not only on work performance and satisfaction but also on one’s social life and personal relationships (Hastings et al., 2004). For instance, Olsson and Hwang (2001) showed that, special education teachers experienced a high prevalence of depression, burden and psychological distress and role conflict. Consequently, staff stress has been found to be associated with intended turnover and absenteeism from work.They suggest that it is reasonable to conclude that a causal relationship exists between these role dysfunctions and the burnout syndrome within this kind of profession.
Social support has been defined as processes of social exchange that contribute to the development of individuals’ behavioral patterns, social cognition, and values (p.433). Tracy and Whittaker (1990) defined social support as the means by which people give assistance to each other.
Research findings concerning the relationship between social support and burnout have been inconsistent (Haddad, 1998). Some research has suggested that social support has a negative relationship with burnout (i.e., high levels of social support are associated with low levels of burnout (Maslach & Jackson, 1986).
Russell, Altmaier, and Velzen (1987) found that social support is not associated with any of the MBI dimensions at a significant level. Later, however, Price and Spence (1994) showed that sources of social support are significantly associated with all the MBI dimensions.
In regards to the sources of social support, research has not clarified which source of social support is more closely related to burnout and its dimensions. Some studies (e.g., Richardsen, Burke, & Leiter, 1992; Gil-Monte et al., 1993) found that the relationship between supervisors’ social support and emotional exhaustion is not significant. However, some other studies (e.g., Price & Spence, 1994; Turnipseed, 1994) found that the relationship between this source of support and personal accomplishment is not significant, but that it is significant for the rest of the MBI and its dimensions. Ross et al., (1989) found that the relationship between supervisors’ social support and all three dimensions of burnout is significant, while colleagues’ social support was significant to none. Similarly, Russell et al., (1987) found supervisors’ social support related significantly to burnout dimensions, whereas colleagues’ social support was related to none.
In regard to teaching experience, workers who had few years of experience reported more burnout (Ross et al., 1989; Kruger et al., 1991). The results of other studies indicate that there is no significant difference in the burnout level in respect to teaching experience (Bataineh, 2005; Haddad, 1998).
As far as marital status is concerned, married workers experience greater emotional exhaustion than those who are not married (Ross et al., 1989). The results of other studies suggest that married workers experience less burnout (Bataineh, 2005; Haddad, 1998; Russell et al., 1987).
Concerning gender differences, some studies reported that men tend to experience higher levels of burnout than women (Bataineh, 2005; Kruger et al., 1991; Russell et al., 1987), whereas other studies reported no differences between men’s and women’s levels of burnout (Haddad, 1998; Ross et al., 1989). However, Bataineh (2005) found age to be related to burnout levels, while other studies found age to be unrelated to burnout levels (Haddad, 1998; Keener, 1986).
Based on the review of social support and burnout research, the main purpose of the study was to examine which source of support is most effective in reducing burnout. Specifically, two questions were formulated: Which source of social support (supervisors, colleagues, friends, spouse, family) would be more closely related to the burnout scale and its dimensions and whether there are significant differences in burnout dimensions among special education teachers due to: gender, age, marital status, or teaching experience.
MethodSubjectsData were collected from 300 special education teachers holding full-time positions in special classes in public schools or private schools across the seven emirates (Abu Dhabi, Dubai, Sharjah, Ras Al-Kahaimah, Umm Al Qaiwain, and Ajman) as to their views on the sources of social support and levels of burnout. Three hundred special education teachers participated in this study during the second semester
8
INTERNATIONAL JOURNAL OF SPECIAL EDUCATION Vol 27, No: 2, 2012
of the academic year 2009/2010. Participating teachers were certified special education teachers who taught in primary or secondary government and private schools or centers for children with special needs. Participating teachers were certified special education teachers. There were 250 special education female teachers (83.3% of the sample) and 50 special education male teachers (16.6% of the sample). The age range of the sample was 22-45 years, Two hundred participants were married (66.6%), 90 participants (30%), were single and ten participants (3.3%) were divorced (and not re-married). Years of experience ranged from 4-17 years. The sample was randomly selected and the variables of age, sex, marital status, and years of teaching experience were not controlled.
MeasuresSocial support. Social support was assessed through a questionnaire designed based on measures used in previous research on social support (Haddad, 1998; Tracy & Whittaker, 1990, & Zimet et al., 1988). The measures focused on support received from five sources of the special education teacher's social network: supervisors, colleagues, friends, spouse and family.
Respondents were requested to rate, on a five point Likert scale, the degree of support received from each of the sources listed above. Potential responses on the 5-point scale are: no support (1), low support (2), moderate support (3), much support (4), and very much support (5).
The questionnaire consisted of 18 items that reflect three aspects of social support. These aspects are: Advice and Guidance (5 items), Acceptance and Belonging (7 items), and Feedback (6items). Reliability coefficients (Cronbach's Alpha) for each source of social support were found to be 0.88 for supervisor support, 0.89 for colleague support, 0.88 for friends support, 0.91 for spouse support, and 0.90 for family support.
The Maslach Burnout Inventory (MBI) as developed by Maslach and Jackson (1986) was administered. The MBI consists of 22 items which cover three subscales: depersonalization (5 items), personal accomplishment (8 items), and emotional exhaustion (9 items). Each item is rated on a 6-point Likert-type scale on the frequency of occurrence and a 7-point scale on the intensity of occurrence only because of the very high correlation between frequency and intensity ratings (Constable & Russell, 1986; Maslach & Jackson, 1986). Maslach and Jackson (1986) reported reliability coefficients ranging from 0.71 to 0.90 for the three subscales. They also demonstrated validity of the MBI in several ways (Haddad, 1998).
For the purpose of this study, the MBI was translated into Arabic and some words were modified to make the items relevant to resource room teachers (see appendix 1). Reliability coefficients for the frequency of Arabic version (Cronbach’s alpha) were 0.83 for emotional exhaustion, 0.72 for depersonalization, and 0.86 for personal accomplishment, while the reliability coefficients for the strength of Arabic version (Cronbach’s alpha) were 0.86 for emotional exhaustion, 0.60 for depersonalization, and 0.84 for personal accomplishment.
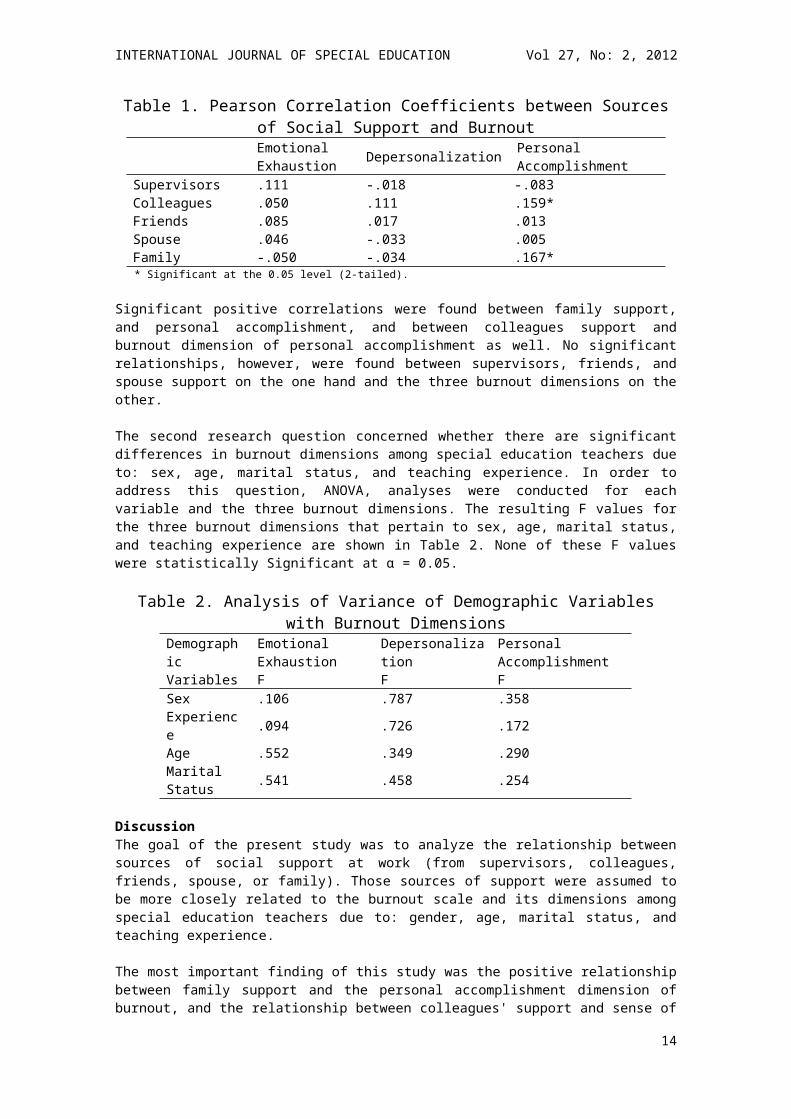
ResultsPearson Correlation coefficients were calculated between scores of each of the subscales of the burnout questionnaire and scores obtained from source of social support: supervisor, colleagues, friends, spouse, and family as shown in Table 1. There was a significant correlations found to be statistically significant.
Table 1. Pearson Correlation Coefficients between Sources of Social Support and Burnout
Emotional Exhaustion Depersonalization Personal Accomplishment
Supervisors .111 -.018 -.083Colleagues .050 .111 .159*Friends .085 .017 .013Spouse .046 -.033 .005Family -.050 -.034 .167*
* Significant at the 0.05 level (2-tailed).
Significant positive correlations were found between family support, and personal accomplishment, and between colleagues support and burnout dimension of personal accomplishment as well. No significant
9
INTERNATIONAL JOURNAL OF SPECIAL EDUCATION Vol 27, No: 2, 2012
relationships, however, were found between supervisors, friends, and spouse support on the one hand and the three burnout dimensions on the other.
The second research question concerned whether there are significant differences in burnout dimensions among special education teachers due to: sex, age, marital status, and teaching experience. In order to address this question, ANOVA, analyses were conducted for each variable and the three burnout dimensions. The resulting F values for the three burnout dimensions that pertain to sex, age, marital status, and teaching experience are shown in Table 2. None of these F values were statistically Significant at α = 0.05.
Table 2. Analysis of Variance of Demographic Variables with Burnout Dimensions
Demographic Variables
Emotional ExhaustionF
DepersonalizationF
Personal AccomplishmentF
Sex .106 .787 .358Experience .094 .726 .172Age .552 .349 .290Marital Status .541 .458 .254
DiscussionThe goal of the present study was to analyze the relationship between sources of social support at work (from supervisors, colleagues, friends, spouse, or family). Those sources of support were assumed to be more closely related to the burnout scale and its dimensions among special education teachers due to: gender, age, marital status, and teaching experience.
The most important finding of this study was the positive relationship between family support and the personal accomplishment dimension of burnout, and the relationship between colleagues' support and sense of personal accomplishment. The significant relationship between family support and the personal accomplishment reflects the importance of family in United Arab Emirates society. The family, which is the most important unit to Arabs, satisfies many affiliation needs. It provides its members with love, affection, advice, feedback, and practical assistance. The family is considered the most accessible and preferred source of assistance for Arabs. Thus, it is easier for them to accept help from members of their natural networks than from strangers. In general, family bonds are extremely strong, and the individual relies on family for social, emotional and material support. This is an important cultural aspect that may be further highlighted through a comparison with Western cultures.
Contrary to Arab culture, Western cultures rewards individuality, independence, self-reliance, autonomy, and freedom (Dillard, 1983, p.15). Westerners often stress less reliance on the family for support, advice, and encouragement (McClintock, 1974, p. 348). This result is consistent with the findings of Platsidou and Agaliotis (2008); Bataineh (2005); Haddad (1998); Rimmerman (1989) who found that family support was positively associated with sense of personal accomplishment.
On the other hand, collegial support was also found to be positively associated with personal accomplishment. This result might indicate that supportive relations with colleagues provided teachers with help, acceptance, and participation. This finding is consistent with those of Platsidou and Agaliotis (2008), Haddad (1998) and Kruger et al., (1991). However, no significant relationships between the other sources of social support (supervisors, friends, and spouse support) and burnout were detected.
A possible explanation of the absence of a significant relationship between supervisor support and burnout is that supervisors represent authority and do not interact with teachers on an equal basis. It is possible that supervisors are insensitive to teacher-related problems, judgmental, critical and perhaps have a limited view of their role-orientation and professional feedback rather than providing support for teachers. Supervisors usually provide social support of a formal nature (e.g., feed-back information on the task, chances of promotion, praise, etc) The lack of relationship between supervisors support and burnout in this study is consistent with the findings of (Kim, Lee, & Kim, 2009; Chan, 2007; Platsidou & Agaliotis, 2008; Bataineh, 2005; Haddad, 1998; Price & Spence, 1994; Turnipseed, 1994; Kruger et al., 1991; & Rimmerman, 1989).
Regarding socio-demographic variables, results showed no significant differences in burnout dimensions between males and females. Perhaps this is due to the homogeneity of the sample, and to the fact that
10
INTERNATIONAL JOURNAL OF SPECIAL EDUCATION Vol 27, No: 2, 2012
both males and females are placed in similar life and work conditions. These results are consistent with previous research (Kim, Lee, & Kim, 2009; Chan, 2007; Platsidou & Agaliotis, 2008; Bataineh, 2005; Haddad, 1998; Ross et al., 1989) which reported that there were no statistically significant differences in burnout dimensions between males and females.
In addition to that, there were no significant differences in burnout levels in respect to marital status and teaching experience. These findings contradict other burnout studies (Ross et al., 1989; Kruger et al., 1991) which found out that fewer years of experience resulted in more burnout; but support Russell et al., (1987) who suggested that married teachers experienced less burnout. This result is consistent with the findings of Platsidou and Agaliotis (2008); Bataineh (2005) and Haddad (1998) who found that there were no statistically significant differences in burnout levels in respect to marital status and teaching experience.
Also, it was found that there were no statistically significant differences in burnout levels in respect to age. This result is consistent with the findings of Bataineh (2005) and Haddad (1998) and Keener (1986).
Conclusion and implicationsThe present study was designed to investigate the relationship between social support and the dimensions of burnout among special education teachers in the United Arab Emirates. Teachers who participated in this investigation were able to elaborate on causes, effects, and current problems that bring about burnout in the teaching profession. In the case of social support, special education teachers who had more social support reported less burnout and therefore had more personal accomplishment.
The findings of this study have important implications for special education teachers in the United Arab Emirates. First, intervention programs in cooperation with the school health personnel can help develop, implement, and evaluate early detection and prevention of burnout through in-service training regarding teacher stress and burnout. An important area for future research concerns designing and evaluating the effects of social support intervention programs in preventing teacher burnout.
Another implication is that if special education teachers are to be the persons designated to provide social skills interventions, training institutions must consider expanding their curricula. Those curricula should include specific training in social skills interventions. Likewise, implementation of professional support networks should be carried out to overcome a sense of feeling isolated in the classroom.
Finally, supervisors must be trained to improve their supervisory skills. The gap between supervisors and school teachers should be bridged so that those teachers are offered assistance whenever they need it. The development of support forms is a major challenge, but alleviation of burnout is critically important for ensuring maximum job performance, health and well-being among United Arab Emirates teachers.
ReferencesAbel, M., & Sewell, J. (1999). Stress and burnout in rural and urban secondary school teachers. Journal of Educational Research, 92, 287-295.Al-khateeb, J., Hadidi, M., &Elayyan, K. (1996). Morale of teachers of special education teachers. Dirasat, Educational Sciences, 18, 62-79 (in Arabic).Alkhrisha, M. (2002).Burnout among a selective sample of American and Jordanian teachers. Dirasat, Educational Sciences, 29(2), 405-414.Bataineh, O. (2005). Burnout among resource room teachers in northern Jordan. Jordan Journal of Educational Sciences, 1(1), 105-113.Borg M. G., & Riding, R. S. (1991). Towards a model for the determinants of occupational stress among school Teachers. European Journal of psychology of Education, 6, 355-373.Borg, M. (1990). Occupational stress in British educational settings: A review. Educational Psychology, 10, 103-126.Bradshaw, K., Tennant, L., &Lydiat, S. (2004). Special Education in the United Arab Emirates: Anxieties, Attitudes and Aspirations. International Journal of Special Education, 19(1), 49-57.Chan, D. (2007). Burnout, self-efficacy, and successful intelligence among Chinese prospective and in-service school teachers in Hong Kong. Educational Psychology, 27, 33-49.Cherniss, C. (1988). Observed supervisory behavior and teacher burnout in special education. Exceptional Children, 54(5), 449-454.Constable, J., & Russell, D. (1986).The effect of social support and the work environment upon burnout among nurses. Journal of Human Stress, 12, 20-26.
11
INTERNATIONAL JOURNAL OF SPECIAL EDUCATION Vol 27, No: 2, 2012
Dababseh, M. (1993). Burnout among special education teachers in Jordan. Unpublished Master’s thesis. The University of Jordan: Amman.Dillard, J. (1983). Multicultural Counseling: Towards Ethnic and Cultural Relevance in Human Encounters. Chicago: Nelson-Hall.Eichinger, J., Heifetz, L., & Ingraham, C. (1991). Situational shifts in sex role orientation: Correlates of work satisfaction and burnout among women in special education. Sex Roles, 25(718), 425-440.Freudenberger, H.J. (1980). Burnout. New York: Doubleday.Friedman, I. (2000). Burnout: shattered dreams of impeccable professional performance. Journal of Clinical Psychology, 56, 595-606.Friedman, I. (1995). Student behavior patterns Contributing to teacher burnout. The Journal of Educational Research, 84, 325-333.Gil-Monte, P., Peiro, J., & Valcarcel, P. (1993).Work overload, social support and self-confidence as burnout antecedents in nursing professionals. Work presented at the "Third ENOP Workshop on Personal Psychology in Health care Organizations”, KKrakow (Poland).Haddad, A. (1998). ‘Sources of social support among school counselors in Jordan and its relationship to burnout. International Journal for the Advancement of Counseling, 20,113-121.Hastings, R. P., Horne, S., & Mitchell, G. (2004). Burnout in direct care staff in intellectual disability services: a factor analytic study the Maslach burnout inventory. Journal of Intellectual Disability Research, 48, 268-273.Hoffman, S., Palladino, J., & Barnett, J. (2007).Compassion Fatigue as a theoretical framework to help understand burnout among special education teachers. Journal of Ethnographic & Qualitative Research, 2, 15-22.Keener, R. (1986).The effect of a social support group on counselor burnout. Dissertation Abstracts International, 47(6), 2026A.Kim, Mi., Lee, J., & Kim, J. (2009).Relationships among burnout, social support, and negative mood regulation expectancies of elementary school teachers in Korea. Asia Pacific Educ.Rev.10, 475-482.Kokkinos, C. (2007). Job stress, personality and burnout in primary school teachers. British Journal of Educational Psychology, 77(1), 229–243.Kruger, L., Botman, H., & Goodenow, C. (1991).‘An investigation of social support and burnout among residential counselors’, Child and Youth Care Forum, 20(1), 335-352.Leung, T., Siu, O. & Spector, P. E. (2000). Faculty stressors, job satisfaction, and psychological distress among university teachers in Hong Kong: the role of locus of control. International Journal of Stress Management, 7 (2), 121-138.Maslach, C.,& Jackson, S. (1986). Maslach Burnout Inventory Manual (2nd ed.). Palo Alto, CA: Consulting psychologists Press.McClintock, G. (1974). The development of social motives in Anglo-American and Mexican children. Journal of Personality and Social Psychology, 29,348-354.Miller, M., Brownell, M., & Smith, S. (1999). Factors that predict teachers staying in, leaving, or transferring from the special education classroom. Exceptional Children, 65, 201-218.Ministry of Education. (2010). The Educational System in United Arab Emirates. Olsson, M. B., & Hwang, C. P. (2001). Depression in mothers and fathers of children with intellectual disability. Journal of Intellectual Disability Research, 45, 535-543.Pines, A., &Keinan, G. (2005).Stress and burnout: The significant difference. Personality and Individual Difference, 39, 625-635.Price, L., & Spence, S. (1994). Burnout symptoms amongst drug and alcohol service employees. Gender differences in the interaction between work and home stressors. Anxiety, Stress and Coping, 7, 67-84.Platsidou, M., & Agaliotis, I. (2008). Burnout, Job Satisfaction and Instructional Assignment-related Sources of Stress in Greek Special Education Teachers. International Journal of Disability, Development and Education, 55(1), 61-76.Richardsen, A., Burke, R., & Leiter, M. (1992). Occupational demands, psychological burnout and anxiety among hospital personnel in Norway. Anxiety, Stress and Coping, 5(1), 55-68.Rimmerman, A. (1989). Burnout among beginning rehabilitation workers in Israel and its relationship to social support, supervision, and job satisfaction. Rehabilitation Counseling Bulletin, 32, 243-247.Ross, R., Altmaier, E., & Russell, D. (1989). ‘Job stress, social support, and burnout among counseling centre staff'. Journal of Counseling Psychology, 36(4), 464-470.Russell, D., Altmaier, E., & Van Velzen, D. (1987). Job stress, social support, and burnout among counseling center staff. Journal of Counseling Psychology, 36(4), 464-470.Sari, H. (2004). An analysis of burnout and job satisfaction among Turkish special school headmasters and teachers, and the factors effecting their burnout and job satisfaction. Educational Studies, 30(3), 291-306.
12
INTERNATIONAL JOURNAL OF SPECIAL EDUCATION Vol 27, No: 2, 2012
Savicki, V.,& Cooley, E. (1987).The relationship of work environment and client contact to burnout in mental professionals. Journal of Counseling and Development, 65, 249- 252.Schamer, L., Jackson, M. (1996).Coping with stress. Common sense about teacher burnout. Education Canada, 36(2), 28-31.Talmor, R., Reiter, S., & Feigin, N. (2005). Factors relating to regular education teacher burnout in inclusive education. European Journal of Special Needs Education, 20(2), 215-229.Tracy, E., & Whittaker, J. (1990). The social network map: Assessing social support in clinical practice. Families in Society, 71(8), 461-470.Turnipseed, D. (1994). An analysis of the influence of work environment variables and moderators on the burnout syndrome. Journal of Applied Social Psychology, 8, 221-246.Wisniewski, L., & Gargiulo, R. (1997). Occupational stress and burnout among special educators: A review of the literature. The Journal of Special Education, 31, 325-346.Zimet, G., Dahlem, S, Zimet, C.,& Farley, G. (1988).The Multidimensional Scale of Perceived Social Support. Journal of Personality Assessment, 52(1), 30-41.
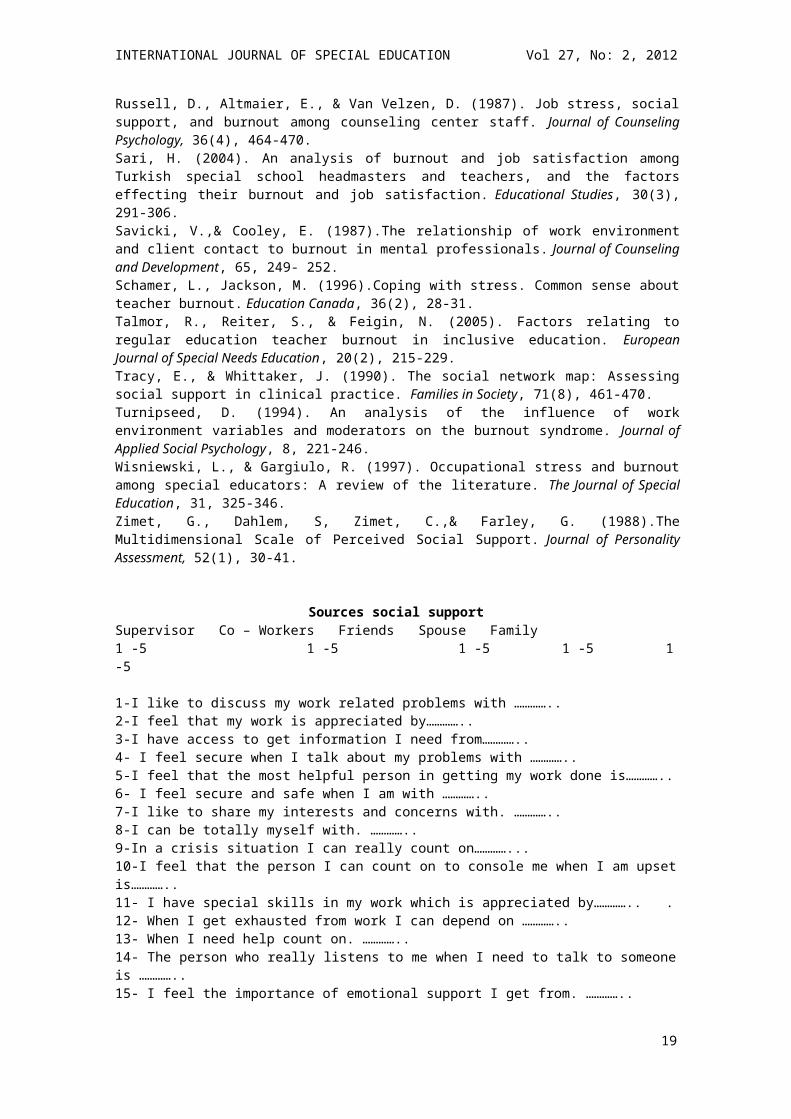
Sources social supportSupervisor Co – Workers Friends Spouse Family1 -5 1 -5 1 -5 1 -5 1 -5
1-I like to discuss my work related problems with …………..2-I feel that my work is appreciated by…………..3-I have access to get information I need from…………..4- I feel secure when I talk about my problems with …………..5-I feel that the most helpful person in getting my work done is…………..6- I feel secure and safe when I am with …………..7-I like to share my interests and concerns with. …………..8-I can be totally myself with. …………..9-In a crisis situation I can really count on…………...10-I feel that the person I can count on to console me when I am upset is…………..11- I have special skills in my work which is appreciated by………….. .12- When I get exhausted from work I can depend on …………..13- When I need help count on. …………..14- The person who really listens to me when I need to talk to someone is …………..15- I feel the importance of emotional support I get from. …………..16- I feel that the person who cares about problems I face in my work is …………..17- I feel I am accepted and loved as a person by…………..18- I like to get advice and guidance when it is needed from…………..
13
INTERNATIONAL JOURNAL OF SPECIAL EDUCATION Vol 27, No: 2, 2012
ANGER IN CHILDREN WITH AUTISM SPECTRUM DISORDER: PARENT’S PERSPECTIVE
Betty P. V. HoJennifer Stephenson
Mark CarterMacquarie University
Anger related behaviours such as aggression are known to be an area of difficulty for children with autism spectrum disorders (ASD). A national internet forum for parents of children with ASD was selected out of other similar forums from six English speaking countries. Information about the angry episodes of 121 children with ASD as described by 120 parents on this forum was analysed. From the parents’ perspective, children with ASD were angry frequently with aggressive behaviours, their anger was target and context specific, and they could not control their own behaviours during their angry episodes but some were apologetic afterward. These behaviours impacted on the whole family, their parents, their siblings and the children with ASD. These episodes were influenced by their being physically or emotionally unwell, and antecedents included inaccessibility to preferred items, and changes in routines/environments. There might be improvement over time and possible gender difference in these behaviours.
Characteristics of children with ASD There is strong evidence that children with autism spectrum disorders (ASD) have generally higher levels of emotional and behavioural problems such as physical aggression, hostility, temper tantrums and self-injurious behaviours (Brereton, Tonge, & Einfeld, 2006; Dominick, Davis, Lainhart, Tager-Flusberg, & Folstein, 2007; Farmer & Aman, 2010; Myrbakk & Von Tetzchner, 2008). This may plausibly be related to their social and communication impairments; and restricted, repetitive behaviours as well as higher rates of co-morbidity of ASD with mental disorders (Leyfer et al., 2006; Mandell, 2008; Simonoff et al., 2008; Wing & Gould, 1979).
One specific social deficit in people with ASD is comprehension of emotions (Baron-Cohen, 1991). It is suggested that children with ASD have difficulties in identifying their own emotions and differentiating their anger from other negative emotions, and difficulties in recognising other people’s facial expressions, in particular expressions of anger (Bal et al., 2010; Rieffe, Terwogt, & Kotronopoulou, 2007; Volker, Lopata, Smith, & Thomeer, 2009). In typically developing children, the ability or inability to recognise important social cues of emotions is directly related to appropriate social behaviours and inversely related to behavioural problems (Blair & Coles, 2000; Izard et al., 2001). Given the severity of social deficits exhibited by children with ASD (Bishop, Gahagan, & Lord, 2007), their manifested inability to recognise emotions, in particular anger, may partly account for their increased behavioural problems.
Some specific communication deficits found in children with ASD may also be associated with their emotional and behavioural problems. These deficits have been found in their pragmatic language processing, nonverbal communications, responses in conversations, understanding of complex social communications such as teasing, and in the intonation and expression of emotions in their speech (Bishop et al., 2007; Hale & Tager-Flusberg, 2005; Heerey, Capps, Keltner, & Kring, 2005; Hubbard & Trauner, 2007; Tesink et al., 2009). Miscommunications and resultant frustration may trigger negative emotions including anger, and there is evidence that challenging behaviours are associated with impaired communication skills and a diagnosis of ASD (Holden & Gitlesen, 2006).
14
INTERNATIONAL JOURNAL OF SPECIAL EDUCATION Vol 27, No: 2, 2012
Restricted and repetitive behaviours are common in children with ASD (Wing & Gould, 1979) Insistence on sameness may also present as resistance to changes, while changes cause feelings of fear, upset and distress together with aggressive, disruptive and angry behaviours (Banda, Grimmett, & Hart, 2009; De Bildt et al., 2005; Eisenberg & Kanner, 1956; Leekam et al., 2007; Norton & Drew, 1994; Schreibman, Whalen, & Stahmer, 2000).
Common mental disorders found in children with ASD may also make angry responses more likely (Leyfer et al., 2006). For example, people with phobic disorders have a tendency to exhibit anxiety (Hurtig et al., 2009; Kelly, Garnett, Attwood, & Peterson, 2008), which may be associated with anger (Carver & Harmon-Jones, 2009); people with obsessive compulsive disorder (OCD) with attachment to rituals or routines, may over-react to changes with frustration, which can be a source of anger (VandenBos, 2007); and people with attention deficit hyperactivity disorder (ADHD) may be impulsive and lack self-regulation in provocative situations. So, these common co-morbid disorders may be associated with anger emotions and behaviours in people with ASD.
Possible causes and impact of anger in children with ASDIn different populations, specific antecedents for anger have been identified including conflicts in communication, behaviours being controlled or managed, and actual or perceived offences (Cheng, Mallinckrodt, & Wu, 2005; Chipperfield, Perry, Weiner, & Newall, 2009; Honig, 2007; Tam, Heng, & Bullock, 2007; Uphill & Jones, 2007). These common antecedents in other populations also occur in the daily life of children with ASD and their impact may be exacerbated due to their social and communication deficits.
Once triggered, an individual’s angry responses will possibly be determined by the individual’s cognition in social information processing, in identifying emotions and resolving social problems. Regarding the cognition of children with ASD in social situations, deficits have been found in many aspects (Channon, Charman, Heap, Crawford, & Rios, 2001; Dennis, Lockyer, & Lazenby, 2000; Embregts & Van Nieuwenhuijzen, 2009). While there seem to be some basically intact knowledge/skills developed (Barbaro & Dissanayake, 2007; Embregts & Van Nieuwenhuijzen, 2009; Rieffe, Terwogt, & Stockmann, 2000), these may often be underused (Channon et al., 2001; Embregts & Van Nieuwenhuijzen, 2009; Rieffe et al., 2000). Whether due to actual cognitive deficiency or poor performance of the acquired skills in social situations, an obvious consequence will be inappropriate display of emotion (e.g., anger) and reactive problematic behaviours.
In short, children with ASD have an increased risk of experiencing anger and displaying associated behaviours. These difficulties with emotion and behaviour, particularly with challenging behaviours (i.e., aggression, property destruction and self injury) can be persistent and stable over time (Matson, Mahan, Hess, Fodstad, & Neal, 2010). Due to their externalising behaviours, children may be deprived of access to effective education and social opportunities; their social relationships, home environments, and community activities may all be affected (Horner, Carr, Strain, Todd, & Reed, 2002; Horner, Diemer, & Brazeau, 1992). Internalising anger can cause health problems including chronic stress and associated physiological disorders to the individuals (Long & Averill, 2002).
Inappropriate expressions of anger by children with ASD impact on their families. The major impact on their parents is the stress in managing their children’s anger and challenging behaviours (DeMyer, 1979; Rao & Beidel, 2009; Sharpley, Bitsika, & Efremidis, 1997). The levels of stress these parents experience are reported to be higher than that experienced by parents of children with other disabilities, together with high levels of anxiety and depression (Dabrowska & Pisula, 2010; Hamlyn-Wright, Draghi-Lorenz, & Ellis, 2007). Siblings of children with ASD may also suffer stress from the aggression and property damage displayed by children with ASD (Ross & Cuskelly, 2006; Bågenholm & Gillberg, 1991).
Study objectivesInformation about anger related issues of children with ASD has been largely extracted from studies with a focus on general emotions, mental health and other general issues, which have employed experimental assessments, surveys and interviews (Bal et al., 2010; Bryson, Corrigan, McDonald, & Holmes, 2008; Cederlund, Hagberg, & Gillberg, 2010; Herring et al., 2006; Hubbard & Trauner, 2007). Experimental assessments typically investigate specific isolated skills (e.g. recognition and expression of emotions), providing accurate but very limited information that is collected under highly controlled conditions (Bal et al., 2010; Hubbard & Trauner, 2007). Surveys and interviews can provide large amounts of naturalistic
15
INTERNATIONAL JOURNAL OF SPECIAL EDUCATION Vol 27, No: 2, 2012
data (e.g. experience in expressions/management of emotions and the circumstances around it), but they are usually structured with the use of checklists and questionnaires (Bryson et al 2008; Cederlund et al., 2010; Herring et al., 2006). Standard checklists or rating scales provide systematic information for easy comparison across multiple participants, but again they are restrictive and directive, designed for particular purposes. Questionnaires are usually based on the researchers’ presumptions and respondents may only respond to questions that are posed. For example, Fung (2007, 2008) interviewed parents based on three specific hypothetical contexts in which the researcher presumed that children with ASD would exhibit reactive aggression.
The present study examined publicly available narratives by parents of children with ASD on informal internet discussion forums. Mackintosh, Myers, and Goin-Kochel (2005) found that 86% of parents of children with ASD used web pages to obtain information and support about ASD, thus it appears that the level of use of internet by parents of children with ASD is high. Parents have been found to be acceptable informants in a number of previous studies (Hurtig et al., 2009; Kooij et al., 2008; Murray, Ruble, Willis, & Molloy, 2009). An advantage of the approach taken in the study reported here is that the absence of presumptions allows identification of spontaneously emerging themes and genuine parental concerns about the anger emotions of children with ASD, which come from parents’ real life observations and experiences. Fleischmann (2004) used this strategy when exploring the adjustment process of parents having children with ASD. Drawing on parents’ narratives posted on the internet, he was able to distinguish core issues in the parents’ adjustment process.
The objectives of this project were to explore parent perceptions of the anger exhibited by children with ASD in their daily life settings and the related issues through an analysis of informal parent reports in a parent forum. The focus was on: 1) parent perceptions of anger related behaviours and cognitions of the children; 2) the impacts on individual children and their families; 3) the ranges of antecedents and internal influences of anger in children reported by parents; and 4) the strategies to manage their children’s anger described by parents and the reported effects.
MethodologyThe forum used in this study was located by using the Google search engine to search for parent forums in six English speaking countries including Australia, Canada, New Zealand, South Africa, United Kingdom, and United States. The descriptors parents, family, autism, autistic, ASD, Asperger, forum were used in combination with the full names and short form of the names of the six chosen countries. For countries such as Canada, South America, United Kingdom, United States, where this search strategy failed, the sites of national organisations representing the parents of the children with ASD were searched. The search engine and descriptors used were the same as in searching for national forums except the descriptor forum was replaced by national, organisation, society. Each site was checked to locate links to parent discussion forums.
The search for appropriate forum was carried out in August 2009. Forums returned were considered for inclusion if they used English, if their contents were publicly accessible without any registration, if their membership was primarily for parents or carers of individuals/ children with ASD, and if their discussions were relevant to issues in supporting and /or parenting individuals with ASD. Forums were excluded if they were designed for only one sub-category of ASD (e.g. Asperger’s’ symptoms), if they had a focus on dietary interventions or supplements to cure or decrease the symptoms of ASD, if they had a focus on medical interventions, if they were not national forums or were limited to a particular population (e.g. families of personnel serving in the military).
Out of the forums appropriate for review, the forum with most members was selected for further investigation. The detailed conditions of use of the discussions on the selected forum were checked to ensure that the forum was open to all. While the discussions in the forum were completely publicly accessible and searchable without any form of registration, additional measures were taken to ensure anonymity of participants and confidentiality of data. Each parent was assigned an author’s number for identification of their reports in the analysis. No authors’ or children’s names are reported. Direct quotations from participants and specific details (e.g. names of places, organisations, and specific behaviours) are not used. Further, access to the database for the study was limited to the authors.
Threads relevant to the research topic were located by using the forum’s search engine and the descriptors angry and anger. Threads containing these words were downloaded and individual posts were examined to decide if they were related to the child’s angry emotions, behaviours, and cognitions;
16
INTERNATIONAL JOURNAL OF SPECIAL EDUCATION Vol 27, No: 2, 2012
if the author was the parent, step-parent or adoptive parent of the child being discussed; if the child discussed had a confirmed diagnosis of ASD; and if the post was based on the author’s first-hand experience or knowledge.
One hundred and twenty two threads were retrieved between August 19, 2009, and September 1, 2009. The content of every appropriate post for each suitable thread was decomposed into meaningful units corresponding to answers for each of the research questions. These data units were grouped under each child discussed to avoid duplication. The children were then grouped into four age groups based on their ages as at the date of the last report made by their parents. There were four age-related groups: 3 to 6 years old, 7 to 10 years old, 11 to 15 years old and, 16 years old and above. Further, for each individual child, only behaviours and other related issues reported within two years of the last report were included. This was to minimise the chance of having the same child exhibiting differing characteristics over time and masking any potential age patterns in the analysis. The authors agreed on the initial categorisations, and ongoing review on the categorised data by the authors resulted in the final categories used to organise the data.
ResultsA total of 1,469 posts dated July 2005 to July 2009 in the first 100 relevant threads meeting inclusion criteria were analysed. Not every parent posted reports that contained information relevant to each of the four research questions.
Authors of Posts and their ChildrenThe 120 parents composing the selected posts were mostly mothers (n=111, 92%), and one of them discussed two children. The children discussed were mostly boys (n=107, 88%). The majority of them were aged 7 to 10 years (n=53, 44%), followed by aged 11 to15 years (n=36, 30%), some aged 3 to 6 years (n=22, 18%), and only a few aged 16 to 20 years (n=10, 8%). The most commonly reported co-morbid mental disorder was ADHD (n=24, 20%), followed by ODD (n=6, 5%), OCD (n=5, 4%) and anxiety issues (n=4, 3%).
Angry Behaviours and Episode DetailsThe anger-related behaviours displayed by the children are categorised and summarised in Table 1. Most of the behaviours reported by parents during their children’s angry episodes were classified into six categories: physical aggression, verbal aggression, use of threats, self-injurious behaviours, other disruptive behaviours (e.g. spitting, hiding under furniture), and socially appropriate behaviours (e.g. move away, retreat into own room, request others to avoid triggering conversation topic). The oldest children displayed fewest problematic behaviours and the most socially appropriate behaviours. Children under the age of 11 years displayed most physical aggression, threatening behaviours, and disruptive behaviours; and were most likely to throw or use objects (e.g. toys, tools, appliances, and cutlery) as weapons.
Parents reported behaviour changes of their children over time, with more angry behaviours around 7 to 8 years old and 11 to 13 years old (mean age = 9 years old) and improvement occurring only after age 8 years old (mean age = 13.5 years old) with more socially acceptable behaviours, such as physical aggression being replaced by verbal aggression or moving away, and aggression at people being replaced by aggression directed at objects. Parents attributed improvement in behaviour to increased emotional maturity, improvement in speech, and improvement in the ability to express feelings. Events related to the worsening of angry episodes often mentioned by parents were transition periods, emotional and behaviour problems and sleep problems.
Around a third of the parents described their child’s episodes as constant or with other similar descriptors (e.g. regular, a lot, frequent, all the time, daily); but the use of these descriptors decreased with the older children. A few parents of the older children described their children’s episodes as being occasional, few, and far and few between. Most angry behaviours reported were being displayed at home, with nearly twice as many episodes as at school. Parents also reported that behaviours were displayed outside home and school environments, nearly as frequently as at school. The most frequently reported target of the behaviours was the mother. The youngest children targeted their mothers most often and displayed most aggression towards persons. The oldest children displayed the least aggression towards persons and only directed aggression at their own immediate family members, equally at either parent.
17
INTERNATIONAL JOURNAL OF SPECIAL EDUCATION Vol 27, No: 2, 2012
Table 1. Details of Angry Behaviours Displayed by Children in Different Age Groups as Reported by Parents
Age n (%)Total no. of children exhibiting the behaviour n (%)3 to 6 7 to 10 11 to 15 16 to 20
Categories of behaviour
Physical aggression 16 (73) 39 (74) 19 (53) 3 (30) 77 (64)
Verbal aggression 11 (50) 27 (51) 19 (53) 5 (50) 62 (51)
Threats 4 (18) 10 (19) 5 (14) 1 (10) 20 (17)Self injurious
behaviours 3 (14) 7 (13) 6 (17) 0 (0) 16 (13)
Throwing or using objects as weapons 5 (23)
18 (34) 4 (11) 2 (20)29 (24)
Other disruptive behaviours 10 (45) 11 (21) 4 (11) 0 (0) 25 (21)
Socially appropriate behaviours 0 (0) 2 (4) 4 (11) 2 (20) 8 (7)
Changes of behaviours over time when angry
Worsening 0 (0) 11 (21) 8 (22) 1 (10) 20 (17)
Improving 0 (0) 4 (8) 6 (17) 3 (30) 13 (11)
Cognition and Reactions of Children Related to the Angry EpisodesThe parents reported on their perceptions of the cognition of their children related to their angry episodes as summarised in Table 2. These included the children’s cognitive difficulties or insightful cognitive abilities in managing situations during their angry episodes, and their various reactions after their angry episodes.
The most often reported cognitive difficulties displayed by the children were being unable to control their own behaviours or for their behaviours to be controlled by others; followed by children being unable or finding it difficult to reason about anger and to communicate or express themselves. Most of these cognitive difficulties were observed in children aged 7 to 15 years. A few parents (n=6, 5%) reported that their children, mostly the oldest children and none under the age 7 years, did have some insight and were able to recognise and deal with the triggers for their anger, recognise their own anger and communicate about their feelings.
About a quarter of parents reported that after the angry episodes their children realised their behaviours were unacceptable and were apologetic, showing sorrow and shame. Smaller numbers of parents indicated that their children denied or forgot the events, while other parents reported that their children did not realise their behaviours were unacceptable and thus were not concerned. A few children were able to discuss their behaviours and understood that some behaviours were unacceptable.
18
INTERNATIONAL JOURNAL OF SPECIAL EDUCATION Vol 27, No: 2, 2012
Table 2. Reported Cognition and Reactions of Children Related to their Angry Episodes
Age n (%) Total no. of children exhibiting the behaviour n (%)3 to 6 7 to 10 11 to 15 16 to 20
Children’s cognitive abilities during their angry episodes
Cognitive difficulties
Unable to control own emotion/behaviour or to be controlled
4 (18) 13 (25) 8 (22) 0 (0) 25 (21)
Unable or difficult to reason, communicate or express oneself
2 (9) 9 (17) 7 (19) 0 (0) 18 (15)
Biased thinking, misunderstanding, misinterpretation or lack of understanding
2 (9) 5 (9) 4 (11) 1 (10) 12 (10)
Insightful cognitive abilities
Can reason, be talked to and listen
0 (0) 2 (4) 1 (3) 1 (10) 4 (3)
Can recognise when getting angry or going to have angry episodes
0 (0) 2 (4) 0 (0) 0 (0) 2 (2)
Able to identify trigger
0 (0) 0 (0) 1 (3) 1 (10) 2 (2)
Able to remove trigger appropriately or remove oneself away from trigger
0 (0) 0 (0) 0 (0) 1 (10) 1 (1)
Age n (%)Total no. of children exhibiting the behaviour n (%)3 to 6 7 to 10 11 to 15 16 to 20
Children’s reactions after the angry episodes
Child realised their behaviours being unacceptable and were concerned
3 (14) 17 (32) 7 (19) 1 (10) 28 (23)
Denial, forgetful about what happened
2 (9) 6 (11) 4 (11) 0 (0) 12 (10)
Children didn't seem to realise implication of their own behaviours or were not concerned
1 (5) 7 (13) 3 (8) 0 (0) 11 (9)
Children were able to discuss and understand one's own angry episodes
2 (9) 3 (6) 4 (11) 1 (10) 10 (8)
19
INTERNATIONAL JOURNAL OF SPECIAL EDUCATION Vol 27, No: 2, 2012
and implication
Impacts of Angry EpisodesTable 3 summarises the impact on families, parents, siblings, the children with ASD themselves and the damage caused. The major impact on the whole family due to the children’s episode as reported by a quarter of parents was disturbance to family life. The major impact on individual parents as reported was actual injury and health problems, followed by emotional disturbance. The most reported impact on siblings was emotional disturbance. The most reported impact on the children themselves was exclusion from school due to their angry episodes, followed by actual injuries and health issues. A third of the parents reported damage to property, furniture or possessions caused by their children’s destructive behaviour. Overall, most reports of negative impact and damage were made by parents of children aged 11 to 15 years while fewest reports were made by parents of the oldest children.
In addition, half of the parents admitted their negative feelings towards their children’s angry episodes and aggression, and more than one third felt unable to improve the situations. These negative feelings and feelings of helplessness generally increase with children’s ages. A few parents shared their positive feelings about their children’s improvement in behaviour.
Table 3. Reported Impact of Children’s Angry Episodes
Age n (%) Total no. of children exhibiting the behaviour n (%)Impact of the angry episodes 3 to 6 7 to 10 11 to 15 16 to 20
On family 6 (27) 12 (23) 13 (36) 3 (30) 34 (28)
Disturbance to family life
6 (27) 11 (21) 10 (28) 2 (20) 29 (24)
Parents’ marriage or relationship
0 (0) 1 (2) 3 (8) 1 (10) 5 (4)
Relationship with extended family
1 (5) 0 (0) 1 (3) 0 (0) 2 (2)
On individual parents 8 (36) 9 (17) 13 (36) 2 (20) 32 (26)
Actual injuries or health problem
5 (23) 2 (4) 8 (22) 2 (20) 17 (14)
Emotional disturbance 2 (9) 3 (6) 4 (11) 0 (0) 9 (7)
Deprived of sleep 1 (5) 1 (2) 2 (6) 1 (10) 5 (4)
Unpleasant experience in public
1 (5) 3 (6) 0 (0) 0 (0) 4 (3)
Career or work 0 (0) 1 (2) 2 (6) 0 (0) 3 (2)
Age n (%) Total no. of children exhibiting the behaviour n (%)Impact of the angry episodes 3 to 6 7 to 10 11 to 15 16 to 20
On sibling 3 (14) 10 (19) 10 (28) 2 (20) 25 (21)
20
INTERNATIONAL JOURNAL OF SPECIAL EDUCATION Vol 27, No: 2, 2012
Emotional disturbance 1 (5) 6 (11) 5 (14) 2 (20) 14 (12)
Actual injuries 1 (5) 5 (9) 1 (3) 0 (0) 7 (6)
Restricted freedom e.g. hide or lock up in
separate room
2 (9) 3 (6) 1 (3) 0 (0) 6 (5)
Exposed to inappropriate and /
aggressive behaviours and languages
2 (9) 0 (0) 3 (8) 1 (10) 6 (5)
On children with ASD 2 (9) 13 (25) 9 (25) 1 (10) 25 (21)
Being excluded from school
1 (5) 7 (13) 5 (14) 1 (10) 14 (12)
Other impact on school life
1 (5) 0 (0) 2 (6) 0 (0) 3 (2)
Injuries or health problems
0 (0) 3 (6) 3 (8) 0 (0) 6 (5)
Impact on social life 0 (0) 3 (6) 1 (3) 0 (0) 4 (3)
Impact on sleep 0 (0) 3 (6) 0 (0) 0 (0) 3 (2)
Age n (%)Total no. of children exhibiting the behaviour n (%)Impact of the angry episodes 3 to 6 7 to 10 11 to 15 16 to 20
Damage caused 6 (27) 20 (38) 13 (36) 1 (10) 40 (33)
Damage to building i.e. broken windows, holes
on wall etc
6 (27) 14 (26) 9 (25) 1 (10) 30 (25)
Damage to furniture/fixtures
3 (14) 12 (23) 4 (11) 0 (0) 19 (16)
Damage to possessions 1 (5) 7 (13) 4 (11) 1 (10) 13 (11)
Internal Influences and External Antecedents of the Angry EpisodesThe perceived internal influences and external antecedents for the angry emotions or behaviours of children reported are detailed in Table 4. Nearly one third of the parents mentioned children being overstimulated, being emotionally or physically unwell as precedents for angry episodes. Other reported internal influences of angry episodes were lack of understanding and skills, or misinterpretation and biased thinking in social situations. A third of the parents reported that the inaccessibility of preferred activities, items or daily routines triggered their children’s episodes. A quarter of the parents considered changes in routines or environments were antecedents. Other major antecedents reported were children losing control over a situation or resisting control by other persons.
21
INTERNATIONAL JOURNAL OF SPECIAL EDUCATION Vol 27, No: 2, 2012
Table 4. Parents’ Perceived Internal Influences and Environmental Antecedents on Children’s Angry Episodes
No. of children n (%)
Children’s internal influences
Overstimulated, emotionally or physically unwell 37 (31)
Lack of understanding, self control, and skills in social situations 26 (21)
Misinterpretation or biased thinking regarding social situations 24 (20)
Teenage issues 11 (9)
Environmental antecedents leading to children’s angry episodes
Access to preferred activities /items, daily routines being denied, refused or unavailable
39 (32)
Actual or expected changes in daily routines and/or physical environments 32 (26)
Lose power or control over situation, or struggle not to be controlled 26 (21)
Being actually provoked or agitated 20 (17)
Parents used trivial, little, simplest, slightest, minor, many things, everything, anything or similar descriptors for causes of angry episodes
18 (15)
Parents’ Management Strategies for Angry Episodes The various strategies parents reported for managing their children’s behaviours are summarised in Table 5. The most commonly reported strategies to deal with internal influences were teaching children about emotions, social situations, and teaching social skills either through informal discussions on alternative behaviours, social stories or structured anger management training. More than half of the parents who reported using these strategies considered them effective. A few parents reported the use of medication for their child and most of them observed benefits including reduction in frequency and duration of episodes. The most frequently reported strategies to manage the environmental antecedents were to change or control external environments such as placing children in schools with more intensive support, modifying daily routines and storing away valuables or dangerous items in their houses. Half of the parents who changed or controlled external environments considered this strategy effective.
In the presence of immediate antecedents, there were two basic strategies that were most frequently reported as parents’ attempts to prevent the episode. These were passively avoiding or minimising contact with the child, and actively taking steps to calm down the child. More positive effects were reported for the calming strategies than for the avoiding strategies.
During the actual episodes, there were three basic strategies that were most commonly reported for managing the situations. These were passively avoiding the children, actively calming down the children, and confronting the children. Parents reported more positive effects and fewer negative effects for avoiding than for actively calming down. More than half of the parents who confronted their child during the episodes, reported negative effects. Some parents reported the administration of punitive consequences after the episodes, and fewer parents encouraged self control with rewarding consequences. A few parents also mentioned calm talk to explain the situation to the children or giving reassurance to children that they were still loved.
22
INTERNATIONAL JOURNAL OF SPECIAL EDUCATION Vol 27, No: 2, 2012
Table 5. Parent’s Management Strategies for Anger and Angry BehavioursNo. of children n %
Strategies to minimise the children’s internal arousal of anger
Teaching the children an understanding of emotions, social situations and social skills
28 (23)
Using Medication 17 (14)
Using Psychological or mental health consultation services 14 (12)
Calming or relaxing activities 11 (9)
Strategies to manage the environmental antecedents
Changing or controlling external environments 23 (19)
Establishing and referring to rules 11 (9)
Using visual aids for communication 10 (8)
Strategies to prevent angry episodes with presence of immediate antecedents
Avoiding or minimising interaction with children 17 (14)
Taking action to calm down children 13 (11)
Strategies taken during the angry episodes
Avoiding or minimising interaction with children 36 (30)
Confronting children 32 (26)
Making active attempts to calm down children using non-confrontational approaches
32 (26)
No. of children n %
Actions taken after the angry episodes
Giving punitive consequences after child has calmed down 27 (22)
Giving rewarding consequences when child has demonstrated self control 14 (12)
Calming talk or reassuring child after child has calmed down 12 (10)
Overall from the parents’ perspective, children with ASD were angry frequently, mostly with aggression, more at home, directed mostly at their mothers and more during the holidays. Parents observed that their children were unable to control their own behaviours during their episodes and were apologetic after their episodes. Parents reported that the major impact from their children’s episodes were actual injuries to themselves, emotional disturbance to sibling, exclusion of the children from school, and disturbance to
23
INTERNATIONAL JOURNAL OF SPECIAL EDUCATION Vol 27, No: 2, 2012
family life. They reported feeling negative and helpless towards their children’s episodes. Parents reported different influences and antecedents to their children’s angry episodes including children being emotionally or physically unwell, children having a poor understanding in social situations, inaccessibility of preferred activities, changes in routines or environments, as well as children losing power over a situation. Parents reported a wide range of strategies to manage their children’s anger, mostly teaching about emotions, social situations and social skills and controlling children’s environments. They also used calming down or avoiding strategies with different effects at different stages of the episodes.
DiscussionThis study collected information from the informal discussions in a forum for parents of children with ASD regarding the angry episodes of their children. The majority of forum participants were mothers. The children discussed were mainly aged 7 to 15 years, with gender ratio twice that reported in prevalence studies of ASD. The rates of co-morbidity with other mental disorders (20% for ADHD, 5% for ODD and 4% for OCD) as reported by parents in this forum are much lower than rates reported in other studies, which were around 30% to 40% (Leyfer et al., 2006; Mandell, 2008; Simonoff et al., 2008).
From these parents’ perspectives, their children’s expression of anger improved over time. Parents reported both pro-active strategies and passive strategies to deal with threatened and actual episodes. Children’s anger-related behaviours were reported to impact on the whole family, causing physical injuries, emotional distress and damage to the household. The results indicated a possible gender difference in the expression of anger and that anger-related behaviours might be contextual and target specific in children with ASD, and they might reflect the characteristics of individuals with ASD.
Angry Behaviours and Episodes CharacteristicsFrom their parents’ perspective, many children with ASD were angry frequently, and most of them were physically (64%) and verbally (51%) aggressive. Some of them were disruptive (21%) and a few were self-injurious (13%). This accords with other studies that reported that children with ASD were quick to become angry, and physical aggression was more common with them than with children having other disabilities (Dominick et al., 2007; Farmer & Aman, 2010). Hurtig et al. (2009) also noted that parents of high functioning adolescents with Asperger Syndrome or autism reported significantly higher level of aggressive behaviours in their children than did parents of typically developing adolescents.
Of the children being discussed in the selected posts, the gender ratio (boys : girls = 7.5 : 1) is much higher than expected from figures given in prevalence studies (boys : girls = 3:1 to 4:1) (Baird et al., 2006; U.S. Department of Health and Human Services & Centers for Disease Control and Prevention, 2009; Volkmar, Lord, Bailey, Schultz, & Klin, 2004), and there was a higher percentage of girls (29%) than boys (11%) reported as exhibiting self-injurious behaviours. This may suggest that boys with ASD display their anger externally more than girls with ASD. These findings are consistent with other studies on individuals with ASD. Hartley and Sikora (2009) found female toddlers with ASD tended to internalise their emotional problems, and Cohen et al. (2010) reported young female adults with ASD exhibited more than twice as many self-injurious behaviours as male adults with ASD.
Parents in this study reported improvement over time in their children’s behaviours during their episodes and these reports were supported by comparing the various data between different age groups, with parents of the oldest children reporting least problem behaviours, least cognitive difficulties and most insights into their angry emotions and behaviours. Similarly, Shattuck et al. (2007) noted parents’ reports of reduction over time of maladaptive behaviours of adolescents and adults with ASD. In contrast, aggressive behaviours were found to be chronic in children and adolescents with ASD based on reports from primary caregivers (Matson et al., 2010).
The most commonly reported specific cognitive deficit was children being unable to control their own emotions and/or behaviours. A possibly related observation by parents was children acknowledging their behaviours as being unacceptable and being regretful after their episodes. There appear to be no studies of parent report on the cognitive abilities of children with ASD relating to self-control during their angry episodes.
It was commonly reported that angry episodes happened more at home than at school, and aggression was mostly targeted at mothers (n=59). In two other studies on children with ASD, parents also reported
24
INTERNATIONAL JOURNAL OF SPECIAL EDUCATION Vol 27, No: 2, 2012
more emotional and behavioural problems than teachers and themselves as being the most frequent targets of their children’s aggression (Dominick et al., 2007; Kanne, Abbacchi, & Constantino, 2009).
Impact on Individuals and their FamiliesAlthough emotional distress (7%) was less reported by parents than physical injuries and health problems (14%) as an immediate impact on parents when managing their children’s behaviours, many parents also expressed their emotional reactions in general. Their most frequently expressed emotional reactions (48%) were negative in nature towards their children’s behaviours, while their second most frequently expressed emotional reaction (37%) of feeling helpless, hopeless or unable to cope was shared by the participants of another study in parents of children with ASD (Sharpley et al., 1997).
Contrary to the impact on parents, the major immediate impact reported on siblings was emotional distress (12%), followed by actual injuries (6%). Some parents reported that they consciously kept siblings away from the children with ASD during their angry episodes. Although less reported, few parents (5%) were deeply concerned with the siblings being exposed to the inappropriate behaviours and language of the child with ASD. On the other hand, a few parents noted some siblings’ mature reactions during these episodes of the child with ASD.
The most commonly reported impact on the individual children was exclusion from school. Individual parents noted different reactions from children, including having no understanding of the reasons for being excluded, feeling ashamed, lowered self-esteem, and refusing school afterward. It was clear from the parents’ perspective that exclusion from school did not help their children at all and this viewpoint was supported by Skiba and Peterson (2000). A UK national survey (Batten, Corbett, Rosenblatt, Withers, & Yuille, 2006) confirmed that children with ASD were frequently excluded from school, with around 20% of them having such experience.
From the parents’ perspective, the major impact of the children’s episodes on the whole family was disturbance to family life (n=29), such as daily routines, family gatherings and outings. Similarly, the behavioural difficulties of preschoolers with ASD were reported by most families in another study as having a major impact on their family life (Cassidy, McConkey, Truesdale-Kennedy, & Slevin, 2008). Some parents discussed the unpleasant experiences when their children had an episode in public and they either had to finish the family outings earlier or found the outings less enjoyable. Families of children with high functioning autism have been found to participate less in social and recreational activities (Rao & Beidel, 2009), and this may be partly due to similar unpleasant experiences.
Parents’ Perceived Internal Influences and External AntecedentsParents nominated different internal influences on their children’s angry emotions and behaviours. The most often cited internal influences on anger were children being overstimulated, emotionally or physically unwell, followed by lack of understanding, self control and skills in social situations, as well as misinterpretation or biased thinking. The most frequently reported external antecedent was denial of access to preferred activities or items. The second most common antecedent was actual or expected changes in routines or environments. This accords with the data that most episodes happened in July and August, the long summer holiday when there may have been actual changes in children’s daily routines and expected changes after the holidays. Parents of pre-schooler with ASD also reported their children’s common problems in adapting to change (Cassidy et al., 2008).
No studies based on parents’ reports or real life observations focusing on the internal influence or external antecedents of angry episodes and behaviours of children with ASD were found. Loveland and Tunali-Kotoski (2005) noted the frequent observations that children with ASD have low frustration tolerance and excessive insistence on requests be met, which may be associated with their ADHD. Matson (2009) commented that there is essentially no research on the causes of aggression in these children.
Parents’ Management Strategies and their Effects Parents in this study reported a range of strategies to manage their children’s anger with the targets of minimising the children’s internal arousal, managing the external environment to prevent the episodes, managing the situation during the episodes, and giving consequences after the episodes.
In this study, only a relatively small portion of parents (14%) reported medicating their children to manage their behaviours, compared to one report of 35% of children with ASD being medicated
25
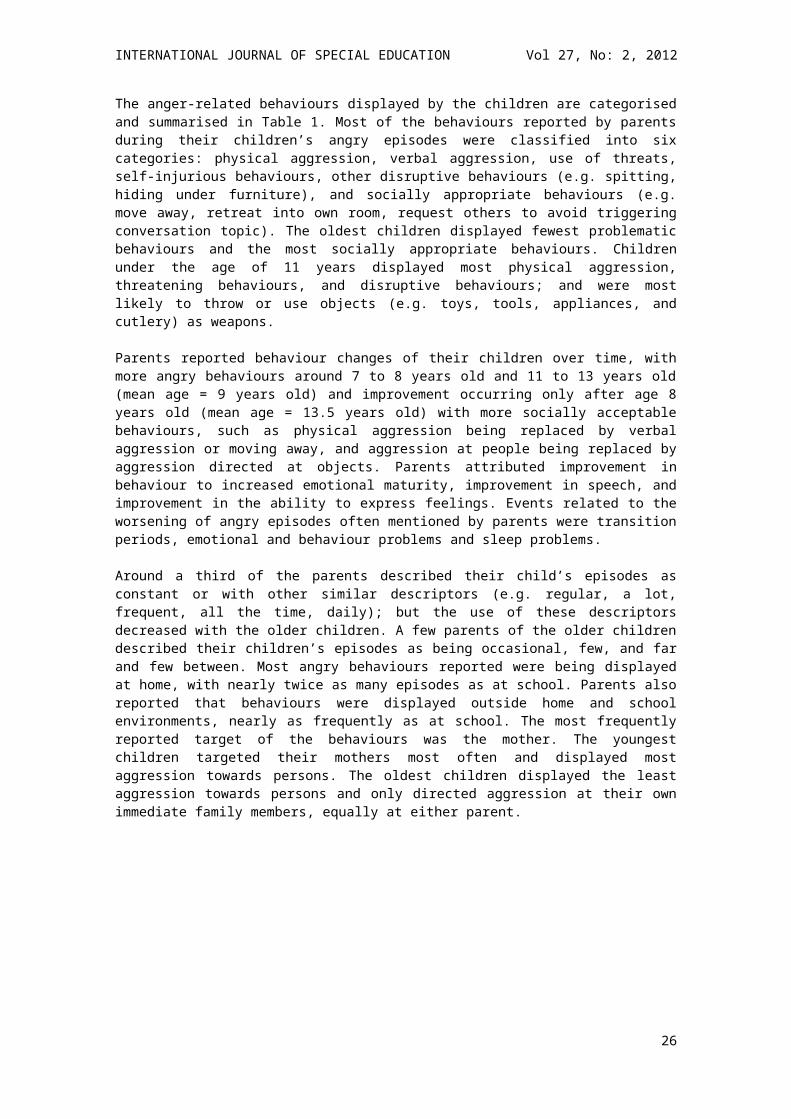
INTERNATIONAL JOURNAL OF SPECIAL EDUCATION Vol 27, No: 2, 2012
(Rosenberg et al., 2010). Although a high percentage of parents using medication reported improvement in behaviour, the most commonly reported strategies were teaching children about emotions and social skills directly. An even smaller percentage of children (12%) received professional mental health services and parents raised issues of insufficient and inappropriate mental health services for their children, including a lack of understanding regarding ASD by mental health professionals. Similar views were expressed by parents in a survey carried out by The National Autistic Society (2008). Relevant to parents’ perceptions on mental health services, a survey by Bryson et al. (2008) indicated that children with ASD might be underserviced by the mental health service systems
Parents reported use of calming strategies at three stages; firstly, trying to maintain a calm mood of their child; secondly, avoiding specific antecedents that may possibly trigger episodes; and thirdly, dealing with the crisis during the episodes. According to parents’ reports, calming down was more effective when used to avoid episodes than for general mood calming, and was least effective when used to attempt to address the actual crisis. One parent recalled that with help his/her child was able to realise that he/she was getting angry at 5 years old.
Another common strategy parents used at different stages was avoiding contact with the children, both in the presence of immediate antecedents and during the actual episode. Again, this strategy was reported to be more effective when used before episodes than during episode. Parents who avoided contact with their children stated that any contact would only fuel the aggression instead of any calming effect. Confronting the children either with strong negative verbal responses or physical restraint was another commonly reported strategy used during episodes but was also not effective based on parents’ reports.
The delivery of punitive consequences was the most often reported strategy used after children’s episodes. Some parents, however, suggested that because their children were unable to control their own behaviours during the episodes and that some children might have problems in linking the behaviours with the consequence, it was meaningless to deliver any punitive consequence. Overall, parents reported a wide range of strategies to manage their children’s anger. There appear to be no other parent reports on the strategies they used to manage the anger of their children with ASD in the literature. Relevant to the parents’ use of many strategies and their effects, medicated children with ASD gained less from social skills training than un-medicated children with ASD (Frankel, Myatt, & Feinberg, 2007), while parents’ teaching about anger emotions and appropriate strategies to cope with anger was positively correlated with socio-emotional functioning in typically developing children (Morgan, 2007).
Strengths of the MethodologyIn this study, the absence of structured frameworks to dictate and channel information allowed free-flow reporting by parents. Accordingly, there is arguably a greater potential with this methodology to capture the issues related to the anger of children with ASD that are of most direct concern to parents. The reports were based on parental observation of behaviours spontaneously displayed in real life situations where there was natural interaction between the children and their environments. Another strength of this methodology is the immediate nature of most of the reports. Although information regarding the angry emotions and behaviours of children can be collected via interviews or questionnaires retrospectively, this data would be subject to the limitation of informants’ memories. It has been suggested that the retrospective reports by parents of children with ASD exaggerated and distorted their children’s behaviour problems (Abmayr & Day, 1992). In this study most parents posted their stories online the same day of their children’s episodes anticipating some social support from other parents; a few reports were even made during the children’s episodes.
Limitations of the MethodologyWith the nature of the methodology employed in this study, there are some inherent limitations in the sample of parents and the data generated. All parents in the study were internet users who were willing to participate in the forum, being computer literate, and with access to internet. They formed a self-selected sample. The majority of them were mothers who may provide different perspectives from fathers.
The reported rates of medication and co-morbidity in the current sample were much lower than in other studies. This may indicate selective public disclosure of private or sensitive issues such as the diagnoses of mental issues or the parents’ perception that such information is not relevant to their post. Although parents can directly observe the externalising behaviours of their children and make instant reports, their perceptions of emotions and cognitions may be inaccurate or incomplete. It has been suggested that some
26
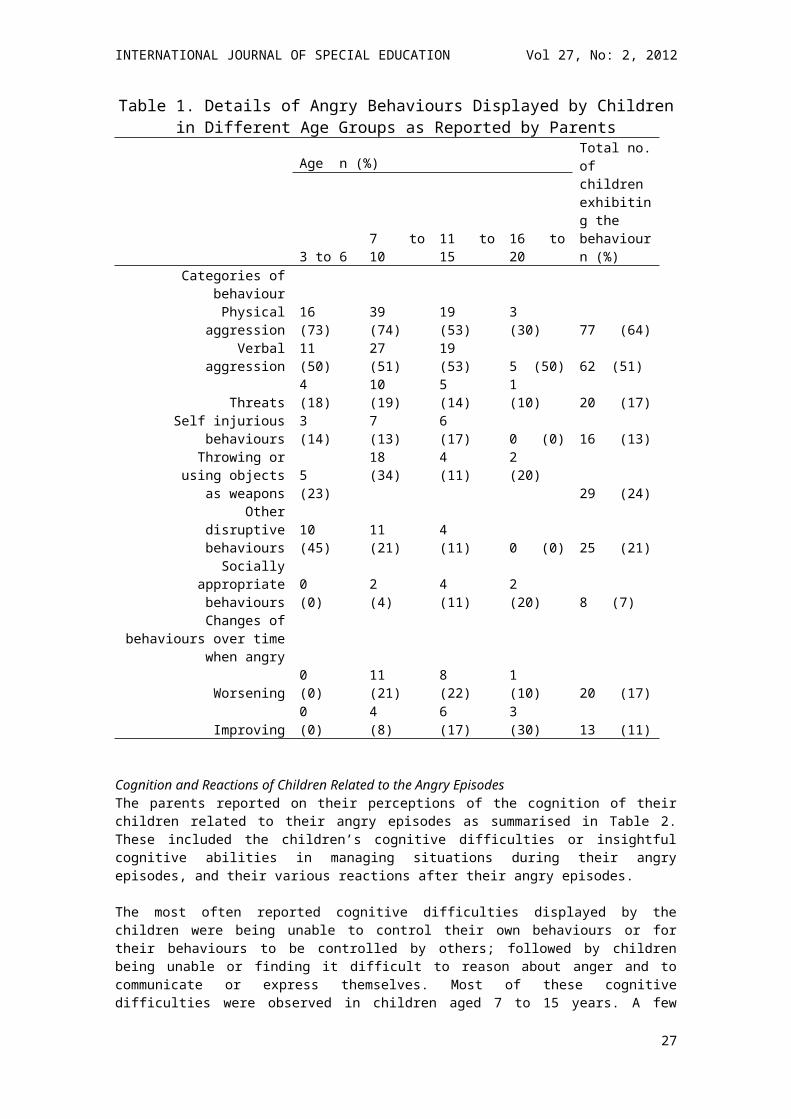
INTERNATIONAL JOURNAL OF SPECIAL EDUCATION Vol 27, No: 2, 2012
emotional distress of high functioning adolescents with Asperger syndrome or autism might be hidden from their parents (Hurtig et al., 2009).
All these limitations in sampling, possible selective disclosure, and inaccurate or incomplete observations have to be considered carefully when interpreting the results. Nevertheless, many of the parent perceptions are in accordance with current literature. For example, children with ASD get angry frequently, express their anger in aggression, and their anger expressions are usually context and target specific. Parents experienced feeling of helplessness, their siblings experienced emotional stress and children with ASD experienced high rates of exclusion from school. This study also raised several issues that require further exploration such as the gender differences in children with ASD in expressing their anger; parental observation on the internal causes, environmental antecedents, and cognitive abilities of the children related to their anger; and the strategies parents used to manage their children’s anger and their effects. The study has provided further information on an issue that needs to be clarified, that is, the contradicting results from different studies regarding improvement in behaviours of children with ASD over time.
ConclusionThe present study of parents’ perspectives on the anger in their children with ASD provides information drawn from natural and instantaneous forum posts on the issues concerned, further enriching the current literature. Interpretation of the parents’ perspectives should, however, be treated cautiously due to the specific characteristics of the self-selected sample and other limitations in the research methodology. Although results of this study may tentatively indicate possible improvement with age and gender difference in the expression of anger by children with ASD, overall such a possibility is yet to be confirmed. In addition, it is also recommended that further research be conducted to investigate the internal influences and external antecedents of anger in children with ASD, the cognitive abilities of children with ASD in controlling their own angry behaviours, and effective strategies for parents to manage their children’s anger.
ReferencesAbmayr, S. B., & Day, H. D. (1992). Differences in retrospective and prospective parental reports of children's behaviours. Paper presented at the Thirty-eighth Annual Convention of the Southwestern Psychological Association, Austin, TX. Bågenholm, A., & Gillberg, C. (1991). Psychosocial effects on siblings of children with autism and mental retardation: A population-based study. Journal of Mental Deficiency Research, 35, 291-307. Baird, G., Simonoff, E., Pickles, A., Chandler, S., Loucas, T., Meldrum, D., & Charman, T. (2006). Prevalence of disorders of the autism spectrum in a population cohort of children in South Thames: The Special Needs and Autism Project (SNAP). Lancet, 368, 210-215. doi: 10.1016/S0140-6736(06)69041-7Bal, E., Harden, E., Lamb, D., Van Hecke, A., Denver, J., & Porges, S. (2010). Emotion recognition in children with autism spectrum disorders: Relations to eye gaze and autonomic state. Journal of Autism and Developmental Disorders, 40, 358-370. doi: 10.1007/s10803-009-0884-3Banda, D. R., Grimmett, E., & Hart, S. L. (2009). Activity Schedules: Helping students with autism spectrum disorders in general education classrooms manage transition issues Teaching Exceptional Children, 41(4), 16-21. Barbaro, J., & Dissanayake, C. (2007). A comparative study of the use and understanding of self-presentational display rules in children with high functioning autism and asperger's disorder. Journal of Autism and Developmental Disorders, 37, 1235-1246. doi: 10.1007/s10803-006-0267-yBatten, A., Corbett, C., Rosenblatt, M., Withers, L., & Yuille, R. (2006). Autism and education: The reality for families today. London, UK: The National Autistic Society.Bishop, S., Gahagan, S., & Lord, C. (2007). Re-examining the core features of autism: A comparison of autism spectrum disorder and fetal alcohol spectrum disorder. Journal of Child Psychology and Psychiatry, 48, 1111-1121. doi: 10.1111/j.1469-7610.2007.01782.xBlair, R. J. R., & Coles, M. (2000). Expression recognition and behavioural problems in early adolescence. Cognitive Development, 15, 421-434. doi: 10.1016/S0885-2014(01)00039-9Brereton, A. V., Tonge, B. J., & Einfeld, S. L. (2006). Psychopathology in children and adolescents with autism compared to young people with intellectual disability. Journal of Autism & Developmental Disorders, 36, 863-870. doi: 10.1007/s10803-006-0125-yBryson, S. A., Corrigan, S. K., McDonald, T. P., & Holmes, C. (2008). Characteristics of children with autism spectrum disorders who received services through community mental health centers. Autism, 12, 65-82. doi: 10.1177/1362361307085214
27
INTERNATIONAL JOURNAL OF SPECIAL EDUCATION Vol 27, No: 2, 2012
Carver, C. S., & Harmon-Jones, E. (2009). Anger is an approach-related affect: Evidence and implications. Psychological Bulletin, 135, 183-204. doi: 10.1037/a0013965Cassidy, A., McConkey, R., Truesdale-Kennedy, M., & Slevin, E. (2008). Preschoolers with autism spectrum disorders: The impact on families and the supports available to them. Early Child Development and Care, 178, 115-128. doi: 10.1080/03004430701491721Cederlund, M., Hagberg, B., & Gillberg, C. (2010). Asperger syndrome in adolescent and young adult males. Interview, self - and parent assessment of social, emotional, and cognitive problems. Research in Developmental Disabilities, 31, 287-298. doi: 10.1016/j.ridd.2009.09.006Channon, S., Charman, T., Heap, J., Crawford, S., & Rios, P. (2001). Real-life-type problem-solving in asperger's syndrome. Journal of Autism and Developmental Disorders, 31, 461-469. Cheng, H.-L., Mallinckrodt, B., & Wu, L.-C. (2005). Anger expression toward parents and depressive symptoms among undergraduates in Taiwan. The Counseling Psychologist, 33, 72-97. doi: 10.1177/0011000004270343Chipperfield, J. G., Perry, R. P., Weiner, B., & Newall, N. E. (2009). Reported causal antecedents of discrete emotions in late life. The International Journal of Aging and Human Development 68, 215-241. doi: 10.2190/AG.68.3.c Cohen, I., Tsiouris, J., Flory, M., Kim, S.-Y., Freedland, R., Heaney, G., . . . Brown, T. W. (2010). A large scale study of the psychometric characteristics of the IBR modified overt aggression scale: Findings and evidence for increased self-destructive behaviours in adult females with autism spectrum disorder. Journal of Autism and Developmental Disorders, 40, 599-609. doi: 10.1007/s10803-009-0908-zDabrowska, A., & Pisula, E. (2010). Parenting stress and coping styles in mothers and fathers of pre-school children with autism and down syndrome. Journal of Intellectual Disability Research, 54, 266-280. doi: 10.1111/j.1365-2788.2010.01258.xDe Bildt, A., Serra, M., Luteijn, E., Kraijer, D., Sytema, S., & Minderaa, R. (2005). Social skills in children with intellectual disabilities with and without autism. Journal of Intellectual Disability Research, 49, 317-328. doi: 10.1111/j.1365-2788.2005.00655.xDeMyer, M. K. (1979). Parents and children in autism. Washington, D.C.: V. H. Winston & Sons.Dennis, M., Lockyer, L., & Lazenby, A. L. (2000). How high-functioning children with autism understand real and deceptive emotion. Autism, 4, 370-381. doi: 10.1177/1362361300004004003Dominick, K. C., Davis, N. O., Lainhart, J., Tager-Flusberg, H., & Folstein, S. (2007). Atypical behaviours in children with autism and children with a history of language impairment. Research in Developmental Disabilities, 28, 145-162. doi: 10.1016/j.ridd.2006.02.003 Eisenberg, L., & Kanner, L. (1956). Childhood schizophrenia symposium, 1955. 6. Early infantile autism, 1943-55. American Journal of Orthopsychiatry, 26, 556-566. doi: 10.1111/j.1939-0025.1956.tb06202.xEmbregts, P., & Van Nieuwenhuijzen, M. (2009). Social information processing in boys with autistic spectrum disorder and mild to borderline intellectual disabilities. Journal of Intellectual Disability Research, 53, 922-931. doi: 10.1111/j.1365-2788.2009.01204.xFarmer, C. A., & Aman, M. G. (2010). Psychometric properties of the children's scale of hostility and aggression: Reactive/proactive (C-SHARP). Research in Developmental Disabilities, 31, 270-280. doi: 10.1016/j.ridd.2009.09.014Fleischmann, A. (2004). Narratives published on the internet by parents of children with autism: What do they reveal and why is it important? Focus on Autism & Other Developmental Disabilities, 19, 35-43. Frankel, F., Myatt, R., & Feinberg, D. (2007). Parent-assisted friendship training for children with autism spectrum disorders: Effects of psychotropic medication. Child Psychiatry and Human Development, 37, 337-346. doi: 10.1007/s10578-007-0053-xFung, A. L. C. (2007). A qualitative evaluation of social-cognitive changes in children with reactively aggressive behaviours. Journal of School Violence, 6, 45-64. doi: 10.1300/J202v06n01_04 Fung, A. L. C. (2008). Developing prosocial behaviours in early adolescence with reactive aggression. International Journal of Progressive Education, 4(3), 34-52. Hale, C. M., & Tager-Flusberg, H. (2005). Brief report: The relationship between discourse deficits and autism symptomatology. Journal of Autism and Developmental Disorders, 35, 519-524. doi: 10.1007/s10803-005-5065-4Hamlyn-Wright, S., Draghi-Lorenz, R., & Ellis, J. (2007). Locus of control fails to mediate between stress and anxiety and depression in parents of children with a developmental disorder. Autism, 11, 489-501. doi: 10.1177/1362361307083258Hartley, S., & Sikora, D. (2009). Sex differences in autism spectrum disorder: An examination of developmental functioning, autistic symptoms, and coexisting behaviour problems in toddlers. Journal of Autism and Developmental Disorders, 39, 1715-1722. doi: 10.1007/s10803-009-0810-8
28
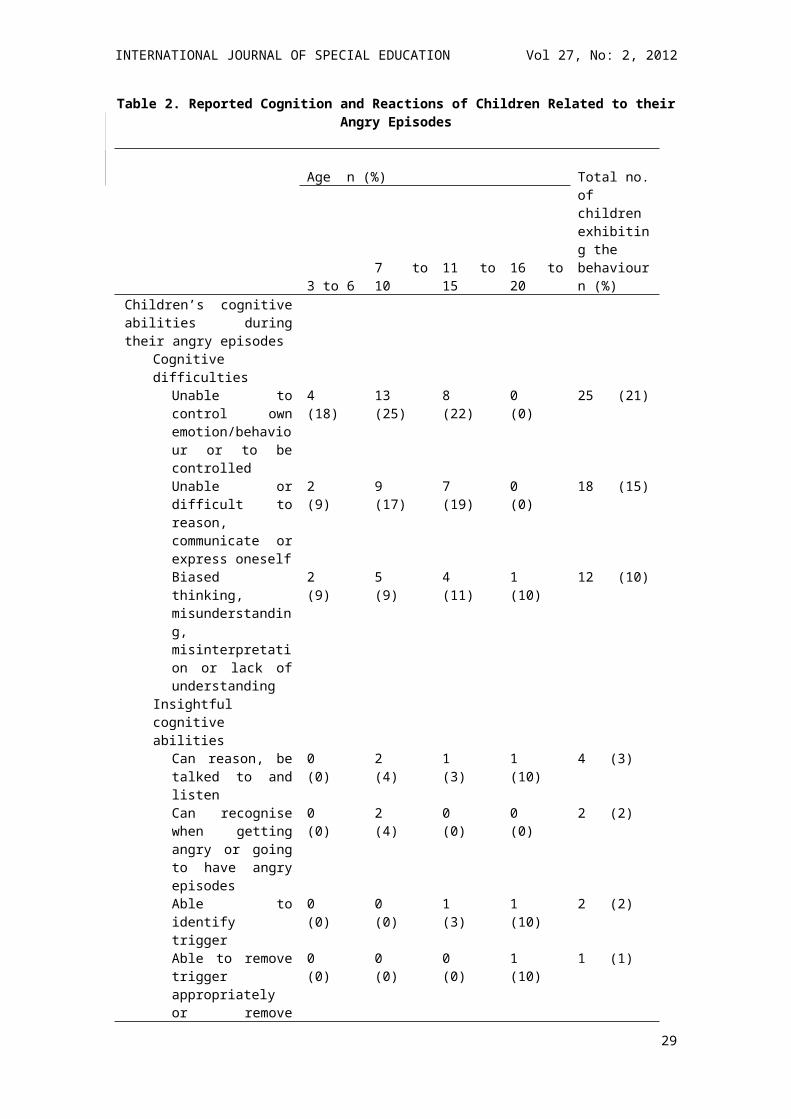
INTERNATIONAL JOURNAL OF SPECIAL EDUCATION Vol 27, No: 2, 2012
Heerey, E. A., Capps, L. M., Keltner, D., & Kring, A. M. (2005). Understanding teasing: Lessons from children with autism. Journal of Abnormal Child Psychology, 33, 55-68. doi: 10.1007/s10802-005-0934-zHerring, S., Gray, K., Taffe, J., Tonge, B., Sweeney, D., & Einfeld, S. (2006). Behaviour and emotional problems in toddlers with pervasive developmental disorders and developmental delay: Associations with parental mental health and family functioning. Journal of Intellectual Disability Research, 50, 874-882. doi: 10.1111/j.1365-2788.2006.00904.xHolden, B., & Gitlesen, J. P. (2006). A total population study of challenging behaviour in the county of Hedmark, Norway: Prevalence, and risk markers. Research in Developmental Disabilities, 27, 456-465. doi: 10.1016/j.ridd.2005.06.001Honig, A. S. (2007). Ages & stages: Understanding children's anger. Early Childhood Today, 21(4), 27-28. Retrieved from http://teacher.scholastic.com/products/ect/ Horner, R. H., Carr, E. G., Strain, P. S., Todd, A. W., & Reed, H. K. (2002). Problem behaviour interventions for young children with autism: A research synthesis. Journal of Autism and Developmental Disorders, 32, 423-446. Horner, R. H., Diemer, S. M., & Brazeau, K. C. (1992). Educational support for students with severe problem behaviours in Oregon: A descriptive analysis from the 1987-1988 school year. Journal of The Association for Persons with Severe Handicaps, 17, 154-169. Hubbard, K., & Trauner, D. (2007). Intonation and emotion in autistic spectrum disorders. Journal of Psycholinguistic Research, 36, 159-173. doi: 10.1007/s10936-006-9037-4Hurtig, T., Kuusikko, S., Mattila, M.-L., Haapsamo, H., Ebeling, H., Jussila, K., . . . Moilanen, I. (2009). Multi-informant reports of psychiatric symptoms among high-functioning adolescents with asperger syndrome or autism. Autism, 13, 583-598. doi: 10.1177/1362361309335719Izard, C., Fine, S., Schultz, D., Mostow, A., Ackerman, B., & Youngstrom, E. (2001). Emotion knowledge as a predictor of social behaviour and academic competence in children at risk. Psychological Science, 12, 18-23. doi: 10.1111/1467-9280.00304Kanne, S. M., Abbacchi, A. M., & Constantino, J. N. (2009). Multi-informant ratings of psychiatric symptom severity in children with autism spectrum disorders: The importance of environmental context. Journal of Autism and Developmental Disorders, 39, 856-864. doi: 10.1007/s10803-009-0694-7Kelly, A., Garnett, M., Attwood, T., & Peterson, C. (2008). Autism spectrum symptomatology in children: The impact of family and peer relationships. Journal of Abnormal Child Psychology, 36, 1069-1081. doi: 10.1007/s10802-008-9234-8Kooij, J. J. S., Boonstra, A. M., Swinkels, S. H. N., Bekker, E. M., De Noord, I., & Buitelaar, J. K. (2008). Reliability, validity, and utility of instruments for self-report and informant report concerning symptoms of ADHD in adult patients. Journal of Attention Disorders, 11, 445-458. doi: 10.1177/1087054707299367 Leekam, S., Tandos, J., McConachie, H., Meins, E., Parkinson, K., Wright, C., . . . Le Couteur, A. (2007). Repetitive behaviours in typically developing 2-year-olds. Journal of Child Psychology and Psychiatry, 48, 1131-1138. doi: 10.1111/j.1469-7610.2007.01778.xLeyfer, O. T., Folstein, S. E., Bacalman, S., Davis, N. O., Dinh, E., Morgan, J., . . . Lainhart, J. E. (2006). Comorbid psychiatric disorders in children with autism: Interview development and rates of disorders. Journal of Autism and Developmental Disorders, 36, 849-861. doi: 10.1007/s10803-006-0123-0Long, C. R., & Averill, J. R. (2002). Anger. In V. S. Ramachandran. (Ed.), Encyclopedia of the human brain (Vol. 1, pp. 131-136). San Diego: Academic Press.Loveland, K. A., & Tunali-Kotoski, B. (2005). The school age child with an autistic spectrum disorder. In F. R. Volkmar, R. Paul, A. Klin & D. Cohen (Eds.), Handbook of autism and pervasive developmental disorders: Diagnosis, development, neurobiology, and behaviour (3rd ed., Vol. 1, pp. 247-287). Hoboken, NJ: John Wiley & Sons.Mackintosh, V. H., Myers, B. J., & Goin-Kochel, R. P. (2005). Sources of information and support used by parents of children with autism spectrum disorders. Journal on Developmental Disabilities, 12, 41-51. Mandell, D. S. (2008). Psychiatric hospitalization among children with autism spectrum disorders. Journal of Autism and Developmental Disorders, 38, 1059-1065. doi: 10.1007/s10803-007-0481-2Matson, J. (2009). Aggression and tantrums in children with autism: A review of behavioural treatments and maintaining variables. Journal of Mental Health Research in Intellectual Disabilities, 2 , 169-187. doi: 10.1080/19315860902725875Matson, J. L., Mahan, S., Hess, J. A., Fodstad, J. C., & Neal, D. (2010). Progression of challenging behaviours in children and adolescents with autism spectrum disorders as measured by the autism spectrum disorders-problem behaviours for children (ASD-PBC). Research in Autism Spectrum Disorders, 4, 400-404. doi: 10.1016/j.rasd.2009.10.010
29
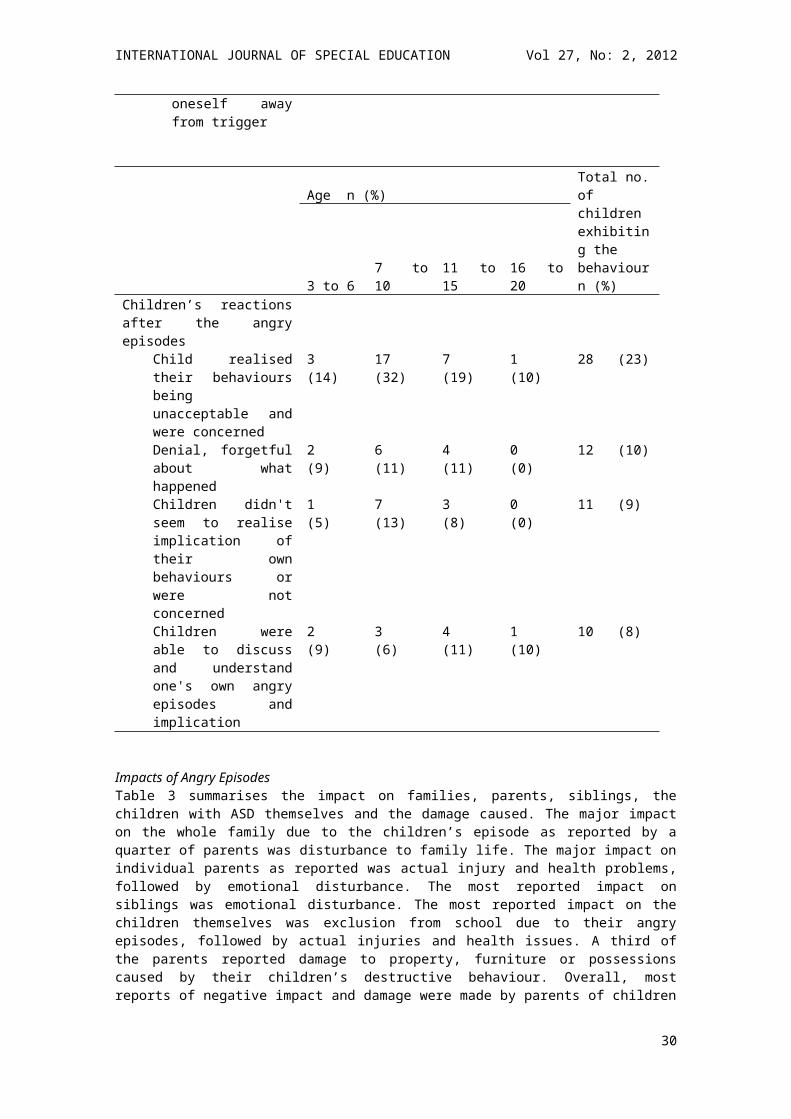
INTERNATIONAL JOURNAL OF SPECIAL EDUCATION Vol 27, No: 2, 2012
Morgan, J. K. (2007). Parental discipline style: Relation of physical punishment and emotion socialization to adaptive and maladaptive child outcomes. (Master's thesis). Available from ProQuest Dissertations and Theses database. (UMI No. 1444647) Murray, D. S., Ruble, L. A., Willis, H., & Molloy, C. A. (2009). Parent and teacher report of social skills in children with autism spectrum disorders. Language, Speech & Hearing Services in Schools, 40, 109-115. doi: 10.1044/0161-1461(2008/07-0089)Myrbakk, E., & Von Tetzchner, S. (2008). The prevalence of behaviour problems among people with intellectual disability living in community settings. Journal of Mental Health Research in Intellectual Disabilities, 1, 205-222. doi: 10.1080/19315860802115607Norton, P., & Drew, C. (1994). Autism and potential family stressors. The American Journal of Family Therapy, 22, 67-76. doi: 10.1080/01926189408251298 Rao, P. A., & Beidel, D. C. (2009). The impact of children with high-functioning autism on parental stress, sibling adjustment, and family functioning. Behaviour modification, 33, 437-451. doi: 10.1177/0145445509336427Rieffe, C., Terwogt, M. M., & Kotronopoulou, K. (2007). Awareness of single and multiple emotions in high-functioning children with autism. Journal of Autism and Developmental Disorders, 37, 455-465. doi: 10.1007/s10803-006-0171-5Rieffe, C., Terwogt, M. M., & Stockmann, L. (2000). Understanding atypical emotions among children with autism. Journal of Autism and Developmental Disorders, 30, 195-203. Rosenberg, R., Mandell, D., Farmer, J., Law, J., Marvin, A., & Law, P. (2010). Psychotropic medication use among children with autism spectrum disorders enrolled in a national registry, 2007-2008. Journal of Autism and Developmental Disorders, 40, 342-351. doi: 10.1007/s10803-009-0878-1Ross, P., & Cuskelly, M. (2006). Adjustment, sibling problems and coping strategies of brothers and sisters of children with autistic spectrum disorder. Journal of Intellectual and Developmental Disability, 31, 77-86. doi: 10.1080/13668250600710864Schreibman, L., Whalen, C., & Stahmer, A. C. (2000). The use of video priming to reduce disruptive transition behaviour in children with autism. Journal of Positive Behaviour Interventions, 2, 3-11. Sharpley, C. F., Bitsika, V., & Efremidis, B. (1997). Influence of gender, parental health, and perceived expertise of assistance upon stress, anxiety, and depression among parents of children with autism. Journal of Intellectual and Developmental Disability, 22, 19-28. doi: 10.1080/13668259700033261Shattuck, P., Seltzer, M., Greenberg, J., Orsmond, G., Bolt, D., Kring, S., . . . Lord, C. (2007). Change in autism symptoms and maladaptive behaviours in adolescents and adults with an autism spectrum disorder. Journal of Autism and Developmental Disorders, 37, 1735-1747. doi: 10.1007/s10803-006-0307-7Simonoff, E., Pickles, A., Charman, T., Chandler, S., Loucas, T., & Baird, G. (2008). Psychiatric disorders in children with autism spectrum disorders: Prevalence, comorbidity, and associated factors in a population-derived sample. Journal of the American Academy of Child & Adolescent Psychiatry, 47, 921-929. doi: 10.1097/CHI.0b013e318179964fSkiba, R. J., & Peterson, R. L. (2000). School discipline at a crossroads: From zero tolerance to early response. Exceptional Children, 66, 335-347. Tam, K. Y., Heng, M. A., & Bullock, L. M. (2007). What provokes young people to get into trouble: Singapore stories. Preventing School Failure, 51(2), 13-17. Tesink, C. M. J. Y., Buitelaar, J. K., Petersson, K. M., Van der Gaag, R. J., Kan, C. C., Tendolkar, I., & Hagoort, P. (2009). Neural correlates of pragmatic language comprehension in autism spectrum disorders. Brain, 132, 1941-1952. doi: 10.1093/brain/awp103The National Autistic Society. (2008). Our response to the child and adolescent mental health services review. Retrieved from http://www.autism.org.uk/get-involved/campaign-for-change/our-work-with-government/westminster/consultation-responses-to-westminster/consultation-responses-to-westminster-on-health-and-mental-health/our-response-to-the-child-and-adolescent-mental-health-services-review.aspxUphill, M. A., & Jones, M. V. (2007). Antecedents of emotions in elite athletes: A cognitive motivational relational theory perspective. Research Quarterly for Exercise and Sport, 78, 79-89. U.S. Department of Health and Human Services, Centers for Disease Control and Prevention. (2009). Prevalence of autism spectrum disorders: Autism and Developmental Disabilities Monitoring Network, United States, 2006. Surveillance Summaries, Morbidity and Mortality Weekly Report, 58 (No. SS10), 1-24. Retrieved from http://www.eric.ed.gov/PDFS/ED508122.pdfVandenBos, G. R. (Ed.). (2007). APA dictionary of psychology. Washington, DC: American Psychological Association.
30
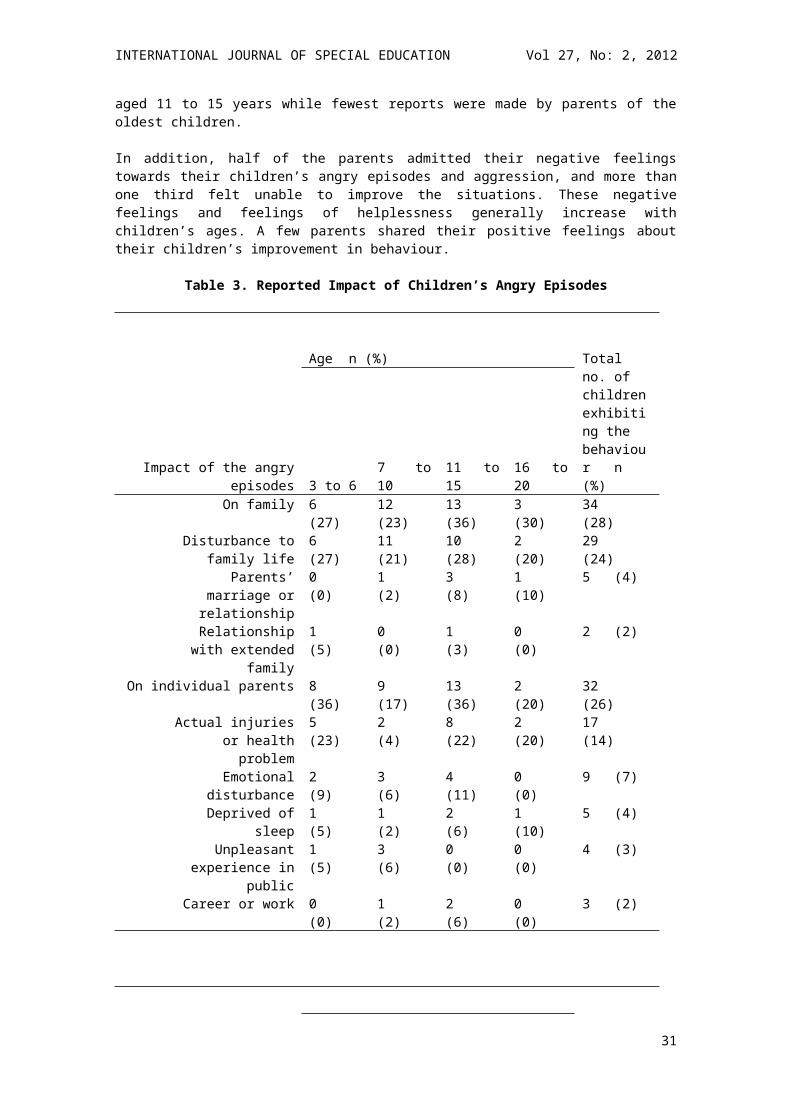
INTERNATIONAL JOURNAL OF SPECIAL EDUCATION Vol 27, No: 2, 2012
Volker, M. A., Lopata, C., Smith, D. A., & Thomeer, M. L. (2009). Facial encoding of children with high-functioning autism spectrum disorders. Focus on Autism and Other Developmental Disabilities, 24, 195-204. doi: 10.1177/1088357609347325Volkmar, F. R., Lord, C., Bailey, A., Schultz, R. T., & Klin, A. (2004). Autism and pervasive developmental disorders. Journal of Child Psychology & Psychiatry, 45, 135-170. doi: 10.1046/j.0021-9630.2003.00317.xWing, L., & Gould, J. (1979). Severe impairments of social interaction and associated abnormalities in children: Epidemiology and classification. Journal of Autism and Developmental Disorders, 9, 11-29.
31
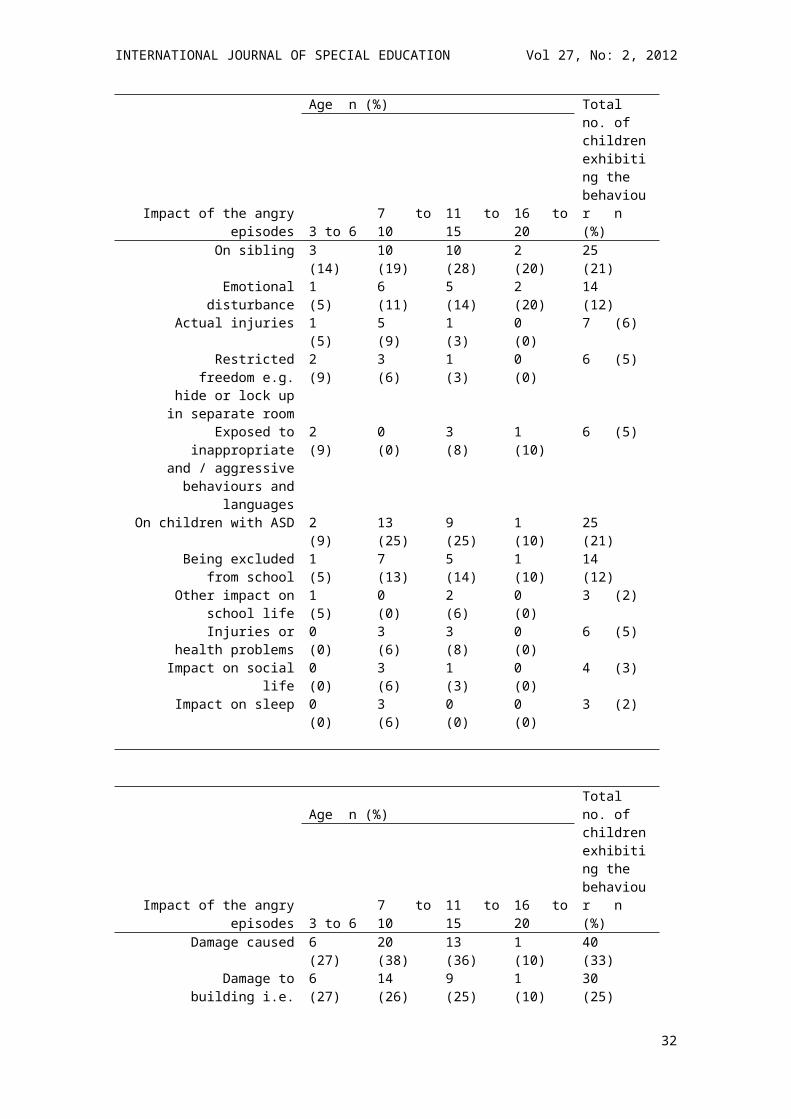
INTERNATIONAL JOURNAL OF SPECIAL EDUCATION Vol 27, No: 2, 2012
ATTRIBUTIONS OF THE EDUCATIONAL OUTCOMES OF STUDENTS WITH LEARNING DISABILITIES IN CHINA
Stuart Woodcock Han Jiang
University of Wollongong
This paper aims to raise awareness of the importance of attributional beliefs in relation to the educational outcomes of students with a learning disability (LD) in China. The study presented in this paper examined the attributional beliefs that Chinese pre-service teachers had developed towards students with LD, in comparison to students without LD. The findings show that Chinese pre-service teachers did not differ in their attributional beliefs between students with and without LD. Implications from the findings, and future research recommendations are also presented.
Students with learning disabilities (LD), or learning difficulties, form a large significant group in China. Research has shown that the prevalence rate in young people up to the age of 18 ranges from a low of 4.86% to a high of 31.62% (He, 2005; Liu, 2000; Wang, 2003; Yao, 2009). A major reason for such a wide discrepancy is the plethora of definitions and diagnostic criterion, none of which have been widely adopted across China. The more simplified the criterion used, the higher the rate of identified students. However, no matter which rate is referred, given such a large country, the population of students with LD will always be large. For the purpose of this paper, LD will be used referring to the World Health Organization (WHO) definition that there is a significant disability of learning that cannot be solely accounted for by mental retardation, visual acuity problems, or inadequate schooling (2010, p196).
In China over the past two decades, LD has increasingly received attention from many research fields such as education, psychology and medicine. The current research LD follows two basic tracks: one is to explore the cognitive development, and the mechanisms of information processing of students with LD, as well as to design effective interventions to solve problems and disabilities that occurred during their cognitive development; the other is to explore their social development, including mind and behaviour, emotional development, social competence, and social cognition, and so on (Yu, 2005). The latter is more recent, but has become a hot topic, in which the research on attribution and motivation of students with LD is a new focus (Chen, 2007; Li, Liu & Dong, 2006; Zhao, 2010). Among the various theories of attribution, Weiner’s (1979, 1985, 1986) Attribution Theory is one of the most popular and has been commonly applied by Chinese researchers on LD among different populations (e.g., Luo, 2000; Zhao, Zhang, Geng & Shen, 2005) and in different subjects (e.g., Chang, 2010; Hu, 2009).
Weiner’s Attribution TheoryAttribution theorists assume that individuals seek to understand why events have occurred (Schuster, Forsterlung, & Weiner, 1989, p. 192). Weiner and his colleagues originally developed the research on the causes of success and failure. Guided by Heider’s causal structure (1958), they initially assumed that ability, effort, task difficulty, and luck were perceived as the most responsible causes for success and failure in achievement-related contexts, among which ability and effort were the most dominant determiners (Weiner, 1985). Later, they put forward that factors such as mood, fatigue, illness, biases of others, and unique factors to specific situations were necessary causes (Weiner, Russell,& Lerman, 1978).
In the centre of Weiner’s Attribution Theory, are two related models. First, the theory categorized the perceived causes into three dimensions: locus of causality, stability, and controllability (Weiner, 1979, 1986). Locus of causality is concerned as a backward-looking belief, thus, it focuses on whether the cause is internal or external to the individual (Linnenbrink & Pintrich, 2002). For example, among the four most important causes, ability and effort are internal to the individual, whereas task difficulty and
32
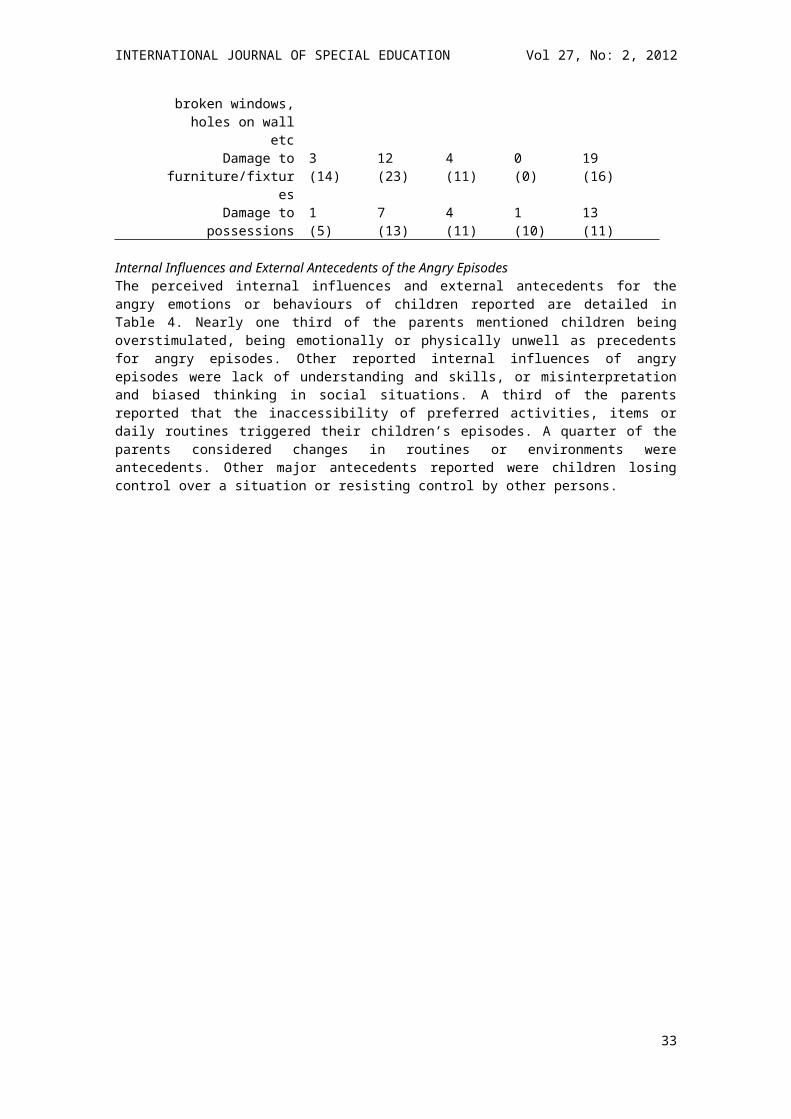
INTERNATIONAL JOURNAL OF SPECIAL EDUCATION Vol 27, No: 2, 2012
luck are external. Stability defines the cause as either a stable (invariant) trait or an unstable (variant) trait. Based on the general agreement, ability and task difficulty are stable causes, whereas causes such as effort, luck, mood, and fatigue are unstable causes. Controllability is concerned with whether an individual has control over the cause, such as, can they increase or decrease the effort expenditure (which is perceived as controllable) over the cause (Weiner, 1985). Aptitude, by contrast, is typically perceived as uncontrollable (Schuster et al., 1989). According to the three dimensions, therefore, a specific cause can be located to one of eight cells, that is two levels of locus of causality by two levels of stability by two levels of control (Weiner, 1979). For example, a student who fails a test may explain it is due to the teacher’s bias (external, stable and uncontrollable).
The three dimensions of causality link to psychological consequences, respectively, which forms the second model of Weiner’s Attribution Theory (Weiner, 1979). Locus of causality has primary implications for self-esteem and affect as the secondary implication. If a failure is ascribed to internal causes, self-esteem may be lowered, and feelings of incompetent, guilt and resignation can be generated. If a failure is ascribed to external causes, self-esteem may be maintained, and feelings of aggression may be generated (Weiner et al., 1978). Stability relates to the degree of expectancy. A greater amount of expectancy might be produced if an individual ascribes a successful outcome to stable causes rather than unstable causes or unsuccessful outcomes to unstable causes. Finally, controllability may result in interpersonal judgment such as helping, evaluation and liking. Such an inference reminds of self- and other-perceptions for success and failure. Although the processes can be complex, these psychological consequences have significant influences on individual behaviours (Schunk, Pintrich, & Meece, 2008).
As indicated, attribution of success and failure happens in both the self and others. From this perspective, Weiner’s Attribution Theory relates to two achievement motivations. First, an intrapersonal theory is presented, which addresses how individuals interpret their successes or failures. Second, an interpersonal theory is presented, which addresses how individuals explain others’ success or failure (Tollefson, 2000). In school contexts, it can beteachers and students who explain the current outcomes and predict future results. It is also useful for teachers to use the theory to analyze students’ patterns of attribution, and then to enhance their motivations and efforts. This is especially so when a student fails at a task.
A negative and unexpected student outcome such as test failure may frequently result in an attributional search by teachers (Clark, 1997). They likely use their prior knowledge or antecedent cues (Graham, 1991), such as performance history and social norms, to infer the causes (Kelley & Michaela, 1980). In most cases, teachers view ability and effort as the most significant causes of success and failure in school (Graham, 1991; Tollefson, 2000). Several studies found that effort was rated more important than ability (e.g., Graham & Weiner, 1986; Rolison & Medway, 1985). Further, effort is considered to having greater significance than ability for teachers to determine punishment (as well as to reward) (Matteucci & Gosling, 2004; Matteucci, 2007). Weiner (1977) proposed two reasons to explain this discrepancy. First, effort elicits strong moral feelings that are socially valued. Second, effort is believed to be subject to volitional control whereas ability is viewed as stable and uncontrollable. Therefore, when a teacher ascribes a student’s failure to lack of ability, sympathy may be elicited toward the student, and supportive behaviors may be followed. If lack of effort is perceived as the cause of failure, feelings of frustration may be elicited, and punitive actions may be followed (Weiner, 1979; 1994). In addition, teachers do not have to elicit emotion in self-examination whether they are responsible for the student’s failure or not (Major, Kaiser,& McCoy, 2003).
In some cases, teachers ascribe students’ success as being influenced by their teaching and personality, particularly, when they perceive a student who has low ability but has a sudden success (Bennett & Bennett, 1994). A study by Rolison and Medway (1985) also concluded that teachers are prone to attribute performance increment of students with special needs to their effort rather than the students’ effort, ability or task difficulty. When such an attributional linkage establishes, teachers are more likely to be intrinsically rewarded. By carrying the belief that they are good teachers, effort expenditure will likely be put forth (Bennett & Bennett, 1994).
In general, normally achieving (NA) students tend to attribute their success to internal causes such as ability and effort, and failure to lack of effort and unstable external causes (Tollefson, 2000). Students who follow this attributional style when successful are also likely to have higher self-esteem (Yan & Li, 2008). On the other hand, students who follow the attributional style when they fail can protect their self-worth (Linnenbrink & Pintrich, 2002). However, individual differences can be existent in the perception of causality. For example, the study by Weiner and Kukla (1970) concluded distinctly that students who
33
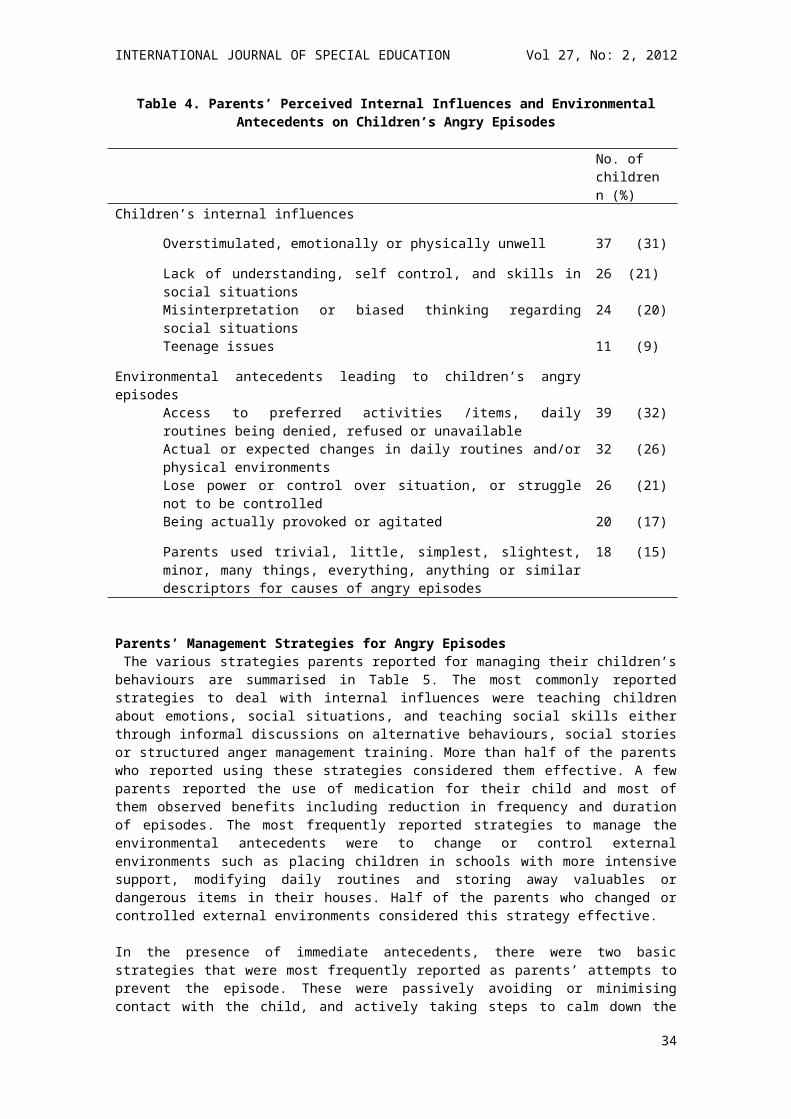
INTERNATIONAL JOURNAL OF SPECIAL EDUCATION Vol 27, No: 2, 2012
have high achievement motivation attribute success to internal causes more than those who have low achievement motivation.
Research on students with LD, has resulted with different findings. For example, Waheeda and Grainger (2002) found that students with LD have a negative attributional style, where they attribute success to external causes, and failure to internal and stable causes (Boersma & Chapman, 1981). Comparative studies between students with LD and NA students also have shown that the former are more likely to ascribe external causes such as task difficulty and luck to success than the latter (Jacobson, Lowery & DuCette, 1986; Pearl, Bryan & Donahue, 1980), as well as to ascribe internal causes such as lack of ability to failure more than the latter (Jacobson, Lowery & DuCette, 1986; Palmer, Drummond, Tollison & Zinkgraff, 1982). Consequently, students with LD may have lower self-esteem (Borkowski, Weyhing & Carr, 1988) and academic self-concept (Stone & May, 2002; Nunez et al., 2005) than NA students.
The Influence of Teacher ExpectationsTeachers’ expectations play a vital role in students’ motivation and academic performance (Graham, 1991; Hinnant, O’Brien & Ghazarian, 2009). A teacher’s affective cues followed by a student’s success or failure may have a significant influence on a student’s perception of causality over the case (Graham, 1984). Weiner, Graham, Stem and Lawson (1982) studied affect-attribution relations and found that sympathy and ability, as well as frustration and effort are positively correlated. The study also indicated that even the five-year olds understood the affect-attribution relations. Furthermore, these affects convey teachers’ expectations to students (Clark, 1997). Consequently, a student who receives sympathy from the teacher may attribute their failure to low ability (internal, stable and uncontrollable) and interpret the affect as a low expectation from the teacher. Alternatively, a student who receives frustration from the teacher may attribute the failure to low effort (internal, unstable and controllable) and interpret the affect as a high expectation from the teacher. These in turn, can influence students’ motivation and achievement strategies (Reyna, 2000). In particular, when continual sympathy is paid by teachers, students’ long-term motivation may be negatively impacted; as they see it as a signal that teachers believe they are incapable of success (Reyna & Weiner, 2001).
Similarly, teachers’ praise can function as an attributional cue as well. Praise and blame from others can allow an individual to infer whether effort or ability is a cause for success or failure (Meyer et al., 1979). Nevertheless, the praise by a teacher following the success in easy tasks can lead the target of such feedback to infer low ability (Barker & Graham, 1987; Graham and Barker, 1990). Further, the praise or reward following a failure implies that the teacher believes the student will do no better and should not expect to improve (Clark, 1997). In contrast, an absence of praise following the success in easy tasks can lead the student to infer a higher ability (Schunk et al., 2008). To sum up, sympathetic help and generous praise has positive intentions by teachers and may be prevalent, but they are antecedents to perceptions of low ability (Graham and Barker, 1990; Woodcock & Vialle, 2010, Woodcock & Vialle, 2011). Further, although it may be seldom use in class, praise that focuses on the ability to successful situations will help to build up students’ motivation, while blame that focuses on effort in failed situations can maintain the motivation (Foote, 1999).
Teachers may likely view students with LD as internal, stable, and uncontrollable (Clark, 1997). Such a statement implies that teachers may be more generous, less stringent and hold lower expectations to these students. Clark’s research with general elementary teachers in the United States found that the teachers tended to reward students with LD more than students without LD in failed situations; expressed more sympathy and less frustration towards students with LD; and held the belief that students with LD would fail more in the future (1997). Similar findings have been reached by Tollefson and Chen’s (1988) research with K-12 teachers, Georgiou, Christou, Stavrinides and Panoura’s (2002) research with elementary teachers in Cyprus, and Woodcock and Vialle’s research with pre-service secondary school teachers (2010) and pre-service elementary school teachers (2011) in Australia. Thus, it can be generally concluded, at least in Western societies, attributional cues that teachers convey to students with LD are that they have lower ability than NA students and should expect less achievement. Certainly the signal can be harmful to the students’ motivation and future performance.
Research on cross-cultural comparisons has shown that, in Eastern societies, low achievement or failure tends to be attributed to low effort on the part of students (Georgiou et al., 2002). The difference may be due to subgroups in demographic variables such as religion and values, which further underline the need for caution in generalizing from the data (Yan & Gaier, 1994). Adapted from Clark’s (1997) research, Zhang, Zhao, Shen and Geng (2007) conducted a similar study with 167 elementary school teachers and
34
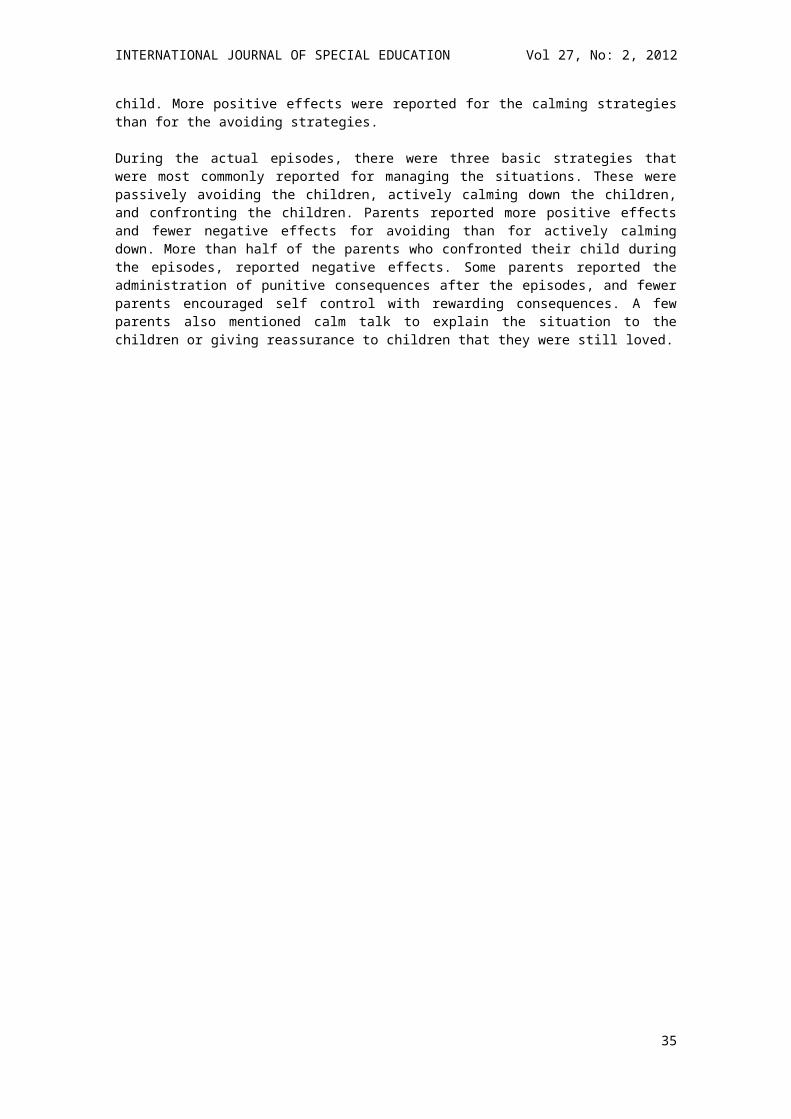
INTERNATIONAL JOURNAL OF SPECIAL EDUCATION Vol 27, No: 2, 2012
166 secondary school teachers in China. They found that the teachers tended to reward low ability and high effort students without LD more than low ability and low effort students with and without LD, were angrier to low effort students with and without LD than high effort students, and expected more failure to low ability and low effort students without LD than low ability and low effort students with LD. In particular, elementary school teachers believed high ability and low effort students without LD would fail more than high ability and low effort students with LD in the future. Zhang and colleagues concluded that Chinese teachers were less generous than Western teachers to students with LD. Further, they might perceive LD as an unstable cause, which can enhance students’ motivation.
With the exception of the above study, research on teachers’ interpersonal attributions of students with LD is limited in China. In particular, the research identifying pre-service teachers’ interpersonal attributions of students with LD is rare. As teachers’ efficacy beliefs are less likely to change throughout their teaching career (Woolfolk-Hoy & Spero, 2005), identifying pre-service teachers’ interpersonal attribution is necessary. Accordingly, the aim of the present study was to identify the causal dimensions of students with LD as perceived by pre-service teachers, and whether Chinese pre-service elementary school and secondary school teachers subscribe them to a positive or negative attribution pattern.
MethodThe study aimed to investigate to what extent Chinese pre-service teachers’ knowledge of the presence or absence of a LD would influence: (a) the feedback given to a hypothetical boy based on his ability and the effort expended, (b) the frustration and sympathy felt towards each boy, and (c) the future expectations held for each boy. Participants were 101 pre-service teachers (17 male and 84 female) who would teach either in elementary schools or secondary schools. Among them, 81 participants were drawn from a local vocational university and were undertaking the final year of the Diploma of Elementary Education, which prepares graduates to teach students in elementary schools. The structure of program combines theoretical and practical elements of teaching, which helps students to develop professional knowledge and classroom practice. However, none of the special education content is included as an individual subject to the program. Therefore, these pre-service teachers did not have a conceptualized map of special education in their mind. Alongside their diploma studies, they had successfully completed two practicum experiences which had lasted for two weeks, and was at the end of year one and two, respectively. The other 20 participants were drawn from a short term (2-month) pre-teaching training program. Unlike the diploma program, it focuses on current issues and teaching methodology associated with secondary education in China. The pre-service teachers all held, at the minimum, a baccalaureate degree which excludes the degree in secondary education. All of them had passed the exams and an interview which was required by Teachers Law of the People’s Republic of China (Ministry of Education of the People’s Republic of China [MOE], 2009) and had their teaching license registered.
The survey instrument was adapted from Woodcock and Vialle’s (2010) study which examined comparisons between students with and without LD, and whether Australian pre-service secondary school teachers perceived them to a positive or negative attribution cycle. In their study, eight vignettes were adapted slightly from the original version created by Clark (1997), in order to fit within an Australian context. Each vignette described a hypothetical boy who had just taken a typical classroom test and failed. The vignettes did not specifically identify the cause of the hypothetical boys’ failures in order to stimulate causal explanations by the participants. The description of each vignette provided three types of information: a statement of student ability, the typical pattern of effort expended by the student in the classroom, and information on academic performance. The descriptions identified half of the boys as LD and half as NLD, half as high ability and half as low ability, and, half as expending high effort and half as expending low effort, but specific terms were not used. The boys were matched on ability (high/low), on typical effort (high/low), and the presence/absence of a LD (LD/NLD). Finally, a matrix of 2 (ability) by 2 (effort) by 2 (LD/NLD) were formed.
An example of a vignette (high ability/low effort/NLD) is: Phillip is a student in your class. He has greater aptitude for academic tasks than most children in the class. Although he occasionally does excellent work, he is usually off task and does not participate in class often. He rarely completes class assignments and does not do much of his homework.
After respondents had read the vignettes, they were presented with four questions which asked them: (a) what feedback they would give to the child, (b) the degree of frustration that they would feel towards the child, (c) the degree of sympathy that they would feel towards the child, and, (d) their expectation of the
35
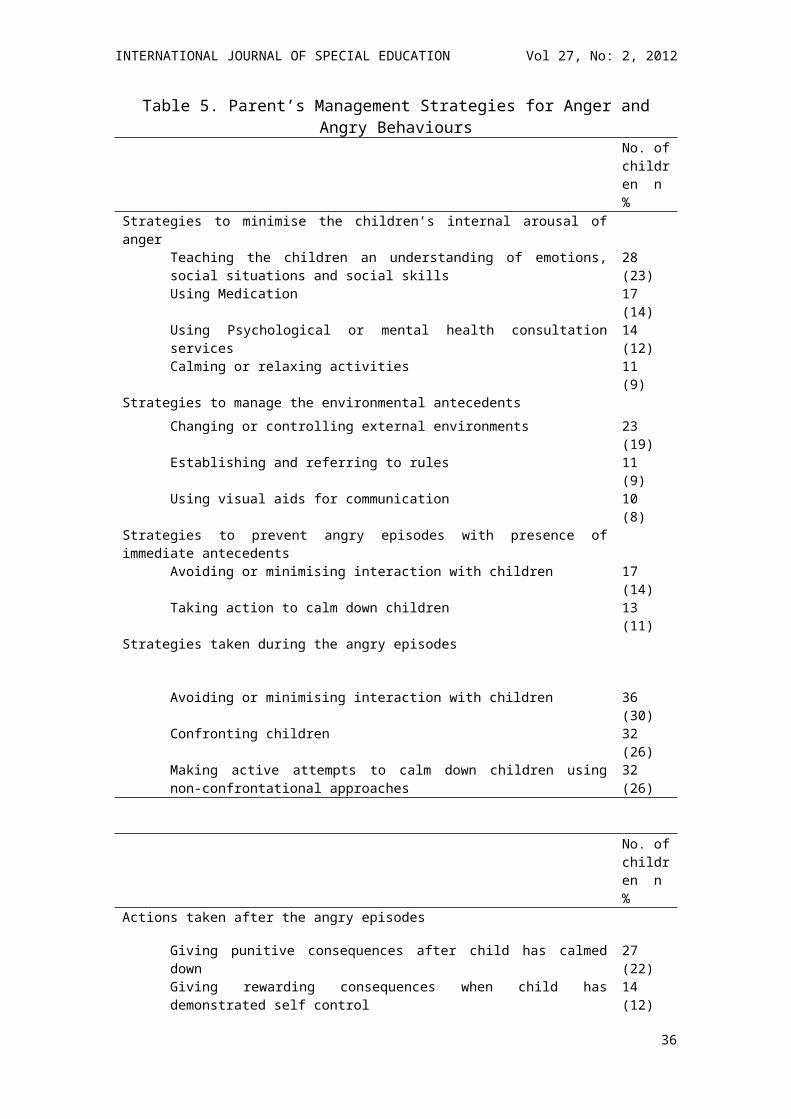
INTERNATIONAL JOURNAL OF SPECIAL EDUCATION Vol 27, No: 2, 2012
likelihood of the boy’s future failure. Each of the four questions of that followed the vignettes was presented as a Likert-scale item.
In the present study, the instrument including eight vignettes was adapted from Woodcock and Vialle’s (2010), and following revisions were made: 1. The whole instrument was translated from English to Chinese. After the instrument had been translated to Chinese, it was assessed by experts in the field of TESOL, who were fluent in both written English and Chinese, and familiar with Australian and Chinese society which gave a bilingual check.2. WHO’s definition of LD is adopted as the definition of LD referred by the instrument.3. Minor revisions were made to fit Chinese context. For example, in Woodcock and Vialle’s version, boys are called by their first names such as Thomas and Andrew, which are common in Western society. In the present version, boys are called by their surnames, such as (Mǎ) and (Lǔ), which are common in Chinese society
ResultsA two (N/LD) by two (ability) by two (effort) multivariate analysis of variance with repeated measures was conducted for the four dependent measures (feedback, frustration, sympathy, and expectation of future failure). The following sections report the results of the repeated measures for feedback, frustration, sympathy, and expectation of future failure. Each section reports the results of the repeated measures analysis by discussing the main effects for each variable (LD status, ability level, and effort expended) and combined two and three-way interactions. The effect sizes used and measured in this paper reflect upon Cohen’s suggested small, medium, and large effect sizes where ηp2sizes are equal to 0.10, 0.25, and 0.40 respectively (Cohen, 1969, cited in Richardson, 2011).
Overall, significant main effects, from the multivariate analysis of variance repeated measures, for LD status, F (1, 101) = 5.060, p< .001,ηp2= .177; ability, F (1, 101) = 19.802, p< .001, ηp2= .457; and, effort, F (1, 101) = 57.822, p< .001, ηp2 = .711, were found for attributional response. In particular, a three-way interaction of LD, ability and effort was significant and produced a small-medium main effect, F (1, 101) = 6.691, p< .001,ηp2= .222. Moreover, LD status and effort (F (1, 101) = 6.562, p< .001,ηp2= .218), and LD status and ability (F (1, 101) = 7.235, p< .001,ηp2= .235), also resulted in interaction small-medium effects. The following sections report the univariate analysis of variance using repeated measures for each individual attributional response.
FeedbackTable 1. Pre-service Teachers’ Feedback
LD NLDM SE M SE
LD Status 2.689 .158 2.615 .135
Low HighM SE M SE
Ability 2.378 .169 2.926 .126
Effort 1.408 .222 3.895 .092
LD LA LD HA NLD LA NLD HAM SE M SE M SE M SE
LD*Ability 2.168 .208 3.209 .145 2.587 .164 2.643 .162
LD LE LD HE NLD LE NLD HEM SE M SE M SE M SE
LD*Effort 1.704 .233 3.673 .139 1.112 .259 4.117 .083
LA LE LA HE HA LE HA HELD*Ability*Effort M SE M SE M SE M SE
LD 1.020 .300 3.316 .207 2.388 .233 4.031 .116NLD 0.990 .310 4.184 .107 1.235 .305 4.051 .104
36
INTERNATIONAL JOURNAL OF SPECIAL EDUCATION Vol 27, No: 2, 2012
As indicated in Table 1, there was no significant main effect for LD status (F (1, 101) = .336, p> .01, ηp2= .003), found for feedback. As Figure 1 shows, this can be noticed in theηp2 and mean score differences between feedback given to the students with and without LD.However, a significant small main effect for ability, F (1, 101) = 16.298, p< .001,ηp2 = .144, was found for feedback. This can be seen in the differences in feedback between the ηp2 and mean scores of low and high ability students (M1 – M2 = .548). Greater positive feedback was given to the high ability students. Finally, a large significant main effect for effort, F (1, 101) = 137.186, p< .001, ηp2= .586, was found for feedback. The level of effort expended was the most highly significant main effect found for feedback. This can be seen in theηp2 and mean feedback scores given to low effort students (M = 1.408) and high effort students (M = 3.895) with greater positive feedback given to students who expend high effort.
Figure 1. Pre-service Teachers’ Feedback to Students
As can be noticed in Figure 1, Chinese pre-service teachers considered a two-way interaction between a boy’s level of ability and his LD status (F (1, 101) = 19.174, p< .001,ηp2= .165) (small effect size) when giving feedback. Furthermore, Chinese pre-service teachers also considered a two-way interaction between a boy’s level of effort expended and LD status (F (1, 101) = 16.865, p< .001,ηp2= .148) (small effect size) when giving feedback.
FrustrationThere was no significant main effect for LD status, (F (1, 101) = .287, p> .01, ηp2= .003), found for pre-service teacher frustration. Furthermore, there were no significant main effects for ability, F (1, 101) = 7.397, p> .01,ηp2 = .003. Thus, there were no differences in pre-service teachers’ frustrations towards high or low ability level students. Moreover, a large significant main effect found for frustration was effort, F (1, 101) = 96.883, p< .001,ηp2 = .500. This can be seen in theηp2and mean scores of frustration felt towards low effort students (M = 3.712) and high effort students (M = 2.459). Consequently, greater frustration was felt towards students who expend low effort.
37
INTERNATIONAL JOURNAL OF SPECIAL EDUCATION Vol 27, No: 2, 2012
Table 2. Levels of Pre-service Teachers’ FrustrationLD NLD
M SE M SELD Status 3.107 .091 3.064 .092
Low HighM SE M SE
Ability 3.224 .097 2.946 .096
Effort 3.712 .115 2.459 0.091
LD LA LD HA NLD LA NLD HAM SE M SE M SE M SE
LD*Ability 3.383 .208 2.832 .105 3.066 .105 3.061 .121
LD LE LD HE NLD LE NLD HEM SE M SE M SE M SE
LD*Effort 3.643 .116 2.571 .107 3.781 .140 2.347 .115
LA LE LA HE HA LE HA HELD*Ability*Effort M SE M SE M SE M SE
LD 3.837 .153 2.929 .138 3.449 .127 2.214 .128NLD 3.918 .170 2.214 .136 3.643 .167 2.480 .146
Thus, as can be seen in Figure 2, the frustration felt towards students was governed by the level of effort expended, not the LD status, nor the ability level. Pre-service teachers felt greater frustration towards students when they expend low effort, and yet less frustration towards students who expend high effort.
Figure 2. Pre-service Teachers’ Frustrations towards Students
38
INTERNATIONAL JOURNAL OF SPECIAL EDUCATION Vol 27, No: 2, 2012
There were no significant two-way or three-way interactions between LD status and ability, nor LD status and effort with regards to Chinese pre-service teachers’ feelings of frustration.
SympathyTable 3. Pre-service Teachers’ Sympathy
LD NLDM SE M SE
LD Status 3.622 .123 3.298 .120
Low HighM SE M SE
Ability 3.640 .123 3.281 .121
Effort 3.416 .125 3.505 .138
LD LA LD HA NLD LA NLD HAM SE M SE M SE M SE
LD*Ability 3.837 .135 3.408 .142 3.444 .138 3.153 .137
LD LE LD HE NLD LE NLD HEM SE M SE M SE M SE
LD*Effort 3.658 .138 3.587 .139 3.173 .139 3.423 .168
LA LE LA HE HA LE HA HELD*Ability*Effort M SE M SE M SE M SE
LD 3.592 .163 4.082 .165 3.724 .150 3.092 .175NLD 3.235 .161 4.653 .204 3.112 .162 3.194 .194
A significant (small) main effect for LD status, F (1, 101) = 13.974, p< .001, ηp2 = .126, was found for sympathy with mean differences in pre-service teacher sympathy towards students with and without LD (M1 – M2 = .324). Figure 3 shows that greater sympathy was felt by pre-service teachers towards students with LD than their NLD counterparts. A significant (small) main effect for ability, F (1, 101) = 15.971, p< .001,ηp2 = .141, was also found for sympathy. This can be seen in theηp2and mean differences in pre-service teacher sympathy towards low ability and high ability students (M1 – M2 = .359). Pre-service teachers felt greater sympathy for low ability students than for their high ability counterparts. There was no significant main effect for effort, F (1, 101) = 0.446, p> .01,ηp2 = .005, found for sympathy. Thus, sympathy levels did not change due to the effort expended by students.
Figure 3. Pre-service Teachers’ Sympathy towards Students
39
INTERNATIONAL JOURNAL OF SPECIAL EDUCATION Vol 27, No: 2, 2012
There were no significant two-way or three-way interactions between LD status and ability, nor LD status and effort with regards to Chinese pre-service teachers’ sympathy.
Expectancy of Future FailureTable 4. Pre-service Teachers’ Expectations of Future Failure
LD NLDM SE M SE
LD Status 3.776 .088 3.503 .088
Low HighM SE M SE
Ability 4.026 .088 3.253 .090
Effort 4.224 .091 3.054 .090
LD LA LD HA NLD LA NLD HAM SE M SE M SE M SE
LD*Ability 4.327 .117 3.224 .099 3.724 .102 3.281 .144
LD LE LD HE NLD LE NLD HEM SE M SE M SE M SE
LD*Effort 4.219 .104 3.332 .110 4.230 .124 2.776 .105
LA LE LA HE HA LE HA HELD*Ability*Effort M SE M SE M SE M SE
LD 4.612 .141 4.041 .138 3.827 .119 2.622 .136NLD 4.684 .152 2.765 .129 3.776 .148 2.786 .148
No significant main effect for LD status, F (1, 101) = 6.079, p> .01,ηp2= .068, was found for pre-service teachers’ expectations of a student’s future failure. However, a large significant main effect for ability, F (1, 101) = 67.806, p< .001,ηp2= .411, was found for pre-service teachers’ expectations of a student’s future failure. The differences inηp2and mean scores between the expectations of future failure for high ability and low ability students (M1 - M2 = .773) shows this. Pre-service teachers had a considerably greater expectation of future failure for students of low ability than for their high ability counterparts. A large significant main effect for effort, F (1, 101) = 140.976, p< .001, ηp2= .592, was found for pre-service teachers’ expectations of a student’s future failure. The level of effort expended was the most highly significant main effect found for expectation of future failure. This can be seen in theηp2and mean expectation scores given to students who expend low effort (M = 4.224) and students who expend high effort (M = 3.054). Thus, pre-service teachers held higher expectations of future failure for students who expend low effort than their high effort counterparts (see Figure 4).
As Figure 4 shows, there were no significant two-way or three-way interactions between LD status and ability, nor LD status and effort with regards to Chinese pre-service teachers’ expectations of future failure. Thus, although effort and ability were found to be significant in the pre-service teachers’ expectations, LD status was not significantly influential.
40
INTERNATIONAL JOURNAL OF SPECIAL EDUCATION Vol 27, No: 2, 2012
Figure 4. Pre-service Teachers’ Expectations of Future Failure of Students
DiscussionThe results demonstrate that as students’ ability levels increase, the pre-service teachers’ reported feedback becomes more positive, their sympathy levels decrease, and the expectation of future failure decreases. As students’ expended efforts increase, the feedback becomes more positive, the frustration decreases, and the expectation of future failure decreases. Further, the only significant effect regarding LD status was sympathy. Pre-service teachers were more sympathetic to students with LD than their non-LD counterparts.
In summary, then, the current study suggests that, with the exception of sympathy, LD status does not generally influence Chinese pre-service school teachers’ responses to students’ test failures. As Weiner (1986) highlighted, teachers’ response to students with LD can be seen as a ‘norm to be kind’ which is often felt towards those having limitations (such as those with LD). The greatest frustration and most negative feedback were assigned to the low effort, students. Clearly, the Chinese pre-service teachers perceived the boys’ failures to be within their personal control and held them responsible. Conversely, the least frustration, and most positive feedback were given to the high effort students. It would seem that the pre-service teachers responded more positively to these students because the cause was seen to be out of their control. The findings of this study support Zhang and colleagues’ (2007) findings in that the pre-service teachers reward students who expend high effort (who are of a low and high ability) more than those who expend low effort (who are of a low and high ability), with little difference occurring as to whether students have a learning disability or not. Furthermore, The findings also show that pre-service teachers feel more frustrated towards students who expend low effort (who are of a low and high ability) more than those who expend high effort (who are of a low and high ability level), with little difference occurring as to whether students have a learning disability or not. Thus, the expectations of future failure are highest amongst students of a low ability who expend low effort, than students who expend high effort (and are of a low and high ability level) (Zhang et al., 2007).
Chinese pre-service school pre-service teachers tend to respond to the failure of students through what Jacobson, Lowery, and DuCette (1986) termed a ‘normal self-esteem attribution’. This is where failure is seen to be due to an external uncontrollable cause such as bad luck or internal controllable cause such as effort. Thus behavioural responses towards the students indirectly inform them that expectations are high and that they have the potential to achieve in the future.
Emphasizing expended effort in students with LD can increase expectations about what these students can accomplish through hard work. The beliefs that ability and LD are largely fixed can lead educators to be reluctant to demand higher levels of performance from students with LD. In regards to Chinese pre-
41
INTERNATIONAL JOURNAL OF SPECIAL EDUCATION Vol 27, No: 2, 2012
service teachers this does not seem to be the case. The identification and label of LD does not influence their expectations of future failure, feedback that they give to students, or their level of frustration towards them. The identification and label of LD only seems to influence their level of sympathy towards these students.
In conclusion the data indicate that the attributional message that Chinese pre-service school teachers transmit to students with LD is that they have the same ability as their peers without LD, and should have the same expectations as a result. These findings suggest that Chinese teachers were less generous than Western teachers to students with LD. The only difference was the sympathy felt towards students with LD. Further, the results show that they perceive LD students’ failure as more of an unstable cause of failure, which can enhance students’ motivation; which supports previous research (Zhang et al., 2007).
Although these results suggest that pre-service school teachers respond to students with and without LD similarly, there are some limitations of the current research. The use of vignette scenarios may produce responses which differ from the responses teachers would make in natural settings (Lee, Hallahan & Herzog, 996). The responses pre-service teachers make to such scenarios may be those they feel they should make given a similar situation rather than those they might actually make. However, the current study sought to advance research built on the foundation of methods similar to that employed in numerous studies involving attribution and achievement (Clark, 1997; Weiner & Kukla, 1970; Zhang et al., 2007).
ConclusionPerceptions, understandings, and expectations within Eastern countries of those with LD, have raised issues over the years. The greatest difficulties have been in the search for how best to understand students with LD within the education system, to meet their needs and to teach them the necessary skills for adulthood. The interpersonal attributional traits that pre-service teachers in China place on students with LD form a positive pattern to some extent, as they perceive LD as an unstable cause of failure. Therefore, it can enhance students’ motivation. Nevertheless, it can be harmful under the circumstance that pre-service teachers lack proper understanding of LD since they may hold inappropriate expectations on students. As a result, they bring these students with high pressure. Thus, it is essential that pre-service teachers be trained to understand the attributional information that they convey to students with LD, and how does it affect the students’ attitudes, motivation, expectations, etc. Further, how the aptitudes of the students can be enhanced by teaching.
Consequently, this study proposes that teacher training institutions need to prepare future teachers with perceptions, knowledge and skills to teach students with LD. By providing better training programs and practicum experiences to the teachers, the needs and opportunities within the academic arena of students with LD can be met. Secondly, the educational departments need to put more efforts to develop a clear and widely accepted definition of LD. Furthermore, they should ensure adequate policy, curriculum, personnel resource and technologies to teach students with LD.
ImplicationsThese findings have practical implications for pre-service teacher education, and for policy makers and educational departments. Perceiving LD as an unstable cause by pre-service teachers may have some positive influences to students’ self-efficacy, so as to increase their achievement motivations (Zhang et al., 2007). On the other hand, it can be harmful to students with LD when teachers lack knowledge and instructional skills. If pre-service teachers understand these students, and then design interventions, e.g. a positive behavior support plan, such an attributional style may become an accelerant to the students’ future achievements (Zheng & Zhang, 2007). According to a study by East China Normal University, 82.6% teachers feel lacking achievability toward students with special needs (including LD), and 81.8% have some awareness of these students but feel incapable to teach them (Li, Li & Fan, 2002).
It is, therefore, essential for teacher training institutions to better prepare pre-service teachers with perceptions, knowledge and skills to teach students with LD. Most professionals identify children with LD as not intellectually impaired, not emotionally disturbed, not impaired in the modalities, and has had an opportunity to learn. LD is often referred to as a ‘hidden handicap’ (Lavoie, 1996), which could be a significant impediment to prevent pre-service teachers from recognizing problems and designing interventions. An essential first step to address the issue is to develop training and practicum programs to future teachers. How will they ascribe academic failure and success by students with LD, so as to their
42
INTERNATIONAL JOURNAL OF SPECIAL EDUCATION Vol 27, No: 2, 2012
expectations and behaviours followed by? Understanding the direct and indirect messages that they may send to these students may then lead to attitudinal changes that will help the student with LD achieve.
The educational departments need to face squarely at LD. As indicated at the beginning of the article, LD is variously defined across China. Besides, it has been used in parallel with many other sayings such as learning difficulties, learning disabled, underachiever, and academically poor students (Han & Zhang, 2010). These conceptual confusing and misunderstandings could be an impediment to obstruct national efforts to improve the educational outcome for students with LD. Therefore, the first step is to address the definition of LD towards having a unified understanding, at least in the educational arena.
Second, educational departments need to assist teachers and schools by ensuring that students with LD is properly identified and educated. Currently, one of the top issues that impede schools and teachers to teach students with special needs are the limited support from the government (Liu, Du & Yao, 2000; Zhang & Chen, 2002). Solving the problem may require the departments providing the up-to-date technologies and devices to facilitate teaching processes at schools. However, more importantly, they need to make policy, design curriculum and provide sufficient personnel resources specifically for students with special needs (including LD). If more attention is addressed to LD by educational departments, then teachers and schools would more likely be able to increase awareness, perceptions and skills towards the students.
Future ResearchThe results from this research, and the previous discussion of the limitations of the research, have highlighted a number of issues which warrant further investigation. Future research might focus upon the range of data collection methods employed, and the groups examined in such studies. There needs to be a greater focus on the Western and Eastern philosophical educational view of students in general, and in particular, on students with LD. Finally, there is a need to compare responses from pre-service teachers before and after they have received a certain amount of training on how to teach students with LD. The data also can be compared to the data from Eastern countries to the Western countries.
Further studies in China could compare in-service teachers’ and pre-service teachers’ perceptions and expectations of students with LD. As a final point, the future research studies discussed here could also be carried out cross-nationally to provide comparative data.
ReferencesBarker, G., & Graham, S. (1987). Developmental study of praise and blame as attributional cues.Journal of Educational Psychology, 79, 62–66.Bennett, C. & Bennett, J. (1994). Teachers’ attributions and beliefs in relation to gender and success of students. Paper presented at the annual meeting of the American Educational Research Association, New Orleans, LA. (ERIC Document Reproduction Service No. ED375 127).Boersma, F. J.& Chapman, J. W. (1981). Academic self-concept, achievement expectations, and locus of control in elementary learning-disabled children. Canadian Journal of Behavioral Science, 13(4), 349-358.Borkowski, J. G., Weyhing, R. S. & Carr, M. (1988). Effects of attributional retraining on strategy-based reading comprehension in learning-disabled students. Journal of Educational Psychology, 80, 46-53.Chang, Y. (2010). Research on elementary students’ attribution to success and failure in the subject of Chinese language (in translation).New Curriculum Research, 191, 126-127.Chen, L (2007). Concept of learning disabilities and relative research (in translation). Journal of Leshan Teachers College, 22(5), 123-125.Clark, M. (1997). Teacher response to learning disability: A test of attributional principles. Journal of Learning Disabilities, 30, 69-79.Foote, C. (1999). Attribution feedback in the elementary classroom. Journal of Research in Childhood Education, 13(2), 155-166.Georgiou, S., Christou, C., Stavrinides, P., & Panoura, G. (2002). Teacher attributions ofstudent failure and teacher behavior toward the failing student. Psychology in the Schools, 39(5), 583-595.Graham, S. (1984). Communicating sympathy and anger to black and white students: The cognitive (attributional) consequences of affective cues. Journal of Personality and Social Psychology, 47, 40-54.Graham, S. (1991). A review of attribution theory in educational contexts. Educational Psychology Review, 3, 5-39.Graham, S.& Barker, G. P. (1990). The down-side of help: An attributional-developmental analysis of helping behavior as a low-ability cue. Journal of Educational Psychology,82, 7–14.
43

INTERNATIONAL JOURNAL OF SPECIAL EDUCATION Vol 27, No: 2, 2012
Graham, S.& Weiner, B. (1986). From attribution theory to developmental psychology: A round-trip ticket?Social Cognition, 4(2), 152-179.Han, Qiu-Shi & Zhang, Guo-Jin. (2010). A research on the development of definitions of LD (in translation). Journal of JingdezhenCollege, 25, 73-75.He, Er-Shi. (2005). Review on the researches of cognitive characteristics of children with learning disability.Chinese Journal of Special Education (Monthly), 57, 85-89.Heider, F. (1958). The psychology of interpersonal relations. New York: Wiley.Hinnant, B. J., O’Brien, M. & Ghazarian, S. (2009). The longitudinal relations of teacher expectations to achievement in the early school years.Journal of Educational Psychology, 101(3), 662-670.Hu, Qiong. (2009). The Weiner’s Attribution Theory used in the ideological and political education for college student. Journal of Hefei Univeristy of Technology (Social Sciences), 23(6), 124-128.Jacobson, B., Lowery, B., DuCette, J. (1986). Attributions of learning disabled children. Journal of Educational Psychology, 78, 59-64.Kelley, H., Michaela, J. (1980). Attribution theory and research. Annual Review of Psychology, 31, 457-501.Lavoie, R. (1996). When the chips are down? [video recording].Alexandria, VA: PBS Video.Li, Chuan-Yin, Liu, Feng-Yue & Dong, Ji-He. (2006). Attribution and regulation strategies of adult learning barriers. Open Education Research, 12(6), 91-94.Li, Jie., Li Zhi-Min. & Fan, Jing-Jing. (2002). The research on the school building environment for limb and trunk disables: An analysis causes preventing limb and trunk disables from entering schools. J.Xi’an Univ. of Arch. & Tech. (Natural Science Edition), 34:4, 313-316.Linnenbrink, E., Pintrich, E. (2002). Motivation as an enabler for academic success. School Psychology Review, v31(3), 313-327.Liu, Chun-Ling., Du, Xiao-Xin. &Yao, Jian. (2000). A study of regular primary school teachers’ acceptance of special needs children. Chinese Journal of Special Education (Quarterly), 34, 34-36.Liu, Lin. (2000). Research on factors of children with learning disabilities (in translation). Chinese Journal of School Health, 21: 4, 329-330.Luo, Li-Fang. (2000). Applying attributional theory to students with LD (in translation). Journal of Fuqing Branch of Fujian Normal University, 46, 67-69, 74.Major, B., Kaiser, C., & McCoy, S. (2003). It’s not my fault: When and why attributions to prejudice protect self-esteem. Personality and Social Psychology, Bulleting 29, 772-781.Matteucci, M. (2007). Teachers facing school failure: The social valorization of effort in the school context. Social Psychology of Education, 10, 29-53.Matteucci, M., Gosling, P. (2004). Italian and French teachers faced with pupil’s academic failure: The norm of effort. European Journal of Psychology of Education, 19(2),147-166.Meyer, W., Bachmann. M., Biermann. U., Hempelmann. M., Ploger, F. & Spiller, H. (1979). The informational value of evaluative behavior: Influence of praise and blame on perceptions of ability. Journal of Educational Psychology, 71(2), 259-268.Ministry of Education of the People’s Republic of China. (2009). Teachers Law of the People’s Republic of China. Retrieved on 2011/2/12 from http://202.205.177.9/edoas/en/index.jspNunez, J., Gonzalez-Pienda, J., Gonzalez-Pumariega, S., Roces, C., Alvarez, L., Gonzalez, P., Cabanach, R., Valle, A., Rodriguez, S. (2005). Subgroups of attributional profiles in students with learning difficulties and their relation to self-concept and academic goals. Learning Disabilities Research and Practice, v20(2), 86-97.Palmer, D. J., Drummond, F., Tollison, P., & Zinkgraff, S. (1982). An attributional investigation of performance outcomes for learning-disabled and normal-achieving pupils. The Journal of Special Education,16, 207-219.Pearl, R. A., Bryan, T., & Donahue, M. (1980). Learning disabled children's attributions for success and failure. Learning Disability Quarterly,3, 3-9.Reyna, C. (2000). Lazy, dumb, or industrious: When stereotypes convey attribution information in the classroom. Educational Psychology Review, 12, 85-110.Reyna, C., Weiner, B. (2001). Justice and utility in the classroom: An attributional analysis of the goals of teachers’ punishment and intervention strategies. Journal of Educational Psychology, 93(2), 309-319.Richardson, J. (In Press). Eta squared and partial eta squared as measures of effect size in educational research. Educational Research Review (2011), doi:10.1016/ j.edurev.2010.12.001.Rolison, M., Medway, F. (1985). Teachers’ expectations and attributions for student achievement: Effects of label, performance pattern and special education intervention. American Educational Research Journal, 22(4), 561-573.Schunk, D., Pintrich, P., Meece, J. (2008). Motivation in education: Theory, research, and applications. Sydney, Pearson.
44
INTERNATIONAL JOURNAL OF SPECIAL EDUCATION Vol 27, No: 2, 2012
Schuster, B., Forsterlung, F. & Weiner, B. (1989). Perceiving the causes of success and failure: A cross-cultural examination of attributional concepts. Journal of Cross-Cultural Psychology, 20(2), 191-213.Stone, C., May, A. (2002). The accuracy of academic self evaluations in adolescents with learning disabilities. Journal of Learning Disabilities, 35(4), 370-383.Tollefson, N. (2000). Classroom applications of cognitive theories of motivation. Educational Psychology Review, 12, 63-83.Tollefson, N., Chen, J. (1988). Consequences of teachers’ attributions for Student failure. Teaching and Teacher Education, 4(3), 259-265.Waheeda, T., Grainger, J. (2002). Self-concept, attributional style and self-efficacy beliefs of students with learning disabilities with and without attention deficit hyperactivity disorder. Learning Disability Quarterly, 25(2), 141-151.Wang, Shu-Quan. (2003). A study on diagnosis of learning disabilities among elementary school students (in translation). Education Exploration, 146, 91-94.Weiner, B.(1977). Attribution and affect: Comments on Sohn's critique. Journal of Educational Psychology, 69(5), 506-511.Weiner, B. (1979). A theory of motivation for some classroom experiences. Journal of Educational Psychology, 71, 3-25.Weiner, B. (1985). An attributional theory of achievement motivation and emotion. Psychological Review, 92(4), 548-573.Weiner, B. (1986). An attributional theory of motivation and emotion. New York, Sringer-Verlag.Weiner, B. (1994). Integrating social and personal theories of achievement striving. Review of Educational Research,64(4), 557–573.Weiner, B., & Kukla, A. (1970). An attributional analysis of achievement motivation. Journal of Personality and Social Psychology, 5, 1–20.Weiner, B., Russell, D., & Lerman, D. (1978). Affective consequences of causal ascriptions. In J.H. Harvey, W.J. Ickes, & R.F. Kidd (Eds.), New directions for attribution research, v2.Hillsdale, N.J.: Erlbaum, 59-90.Weiner, B., Graham, S., Stern, P., &Lawson, M. E. (1982). Using affective cues to infer causal thoughts. Developmental Psychology, 18(2), 278-286.Woodcock, S., Vialle, W. (2010). Attributional beliefs of students with learning disabilities. The International Journal of Learning, 17(7), 177-191.Woodcock, S., Vialle, W. (2011). Are we exacerbating students’ learning disabilities? An investigation of pre service teachers’ attributions of the educational outcomes of students with learning disabilities. Annals of Dyslexia, 61(2), 223-241.Woolfolk-Hoy, A. & Spero, R. (2005). Changes in teacher efficacy during the early years of teaching: A comparison of four measures. Teaching and Teacher Education, 21, 343-356.World Health Organization (2010). The ICD-10 Classification of Mental and Behavioral Disorders: Clinical Descriptions and Diagnostic Guidelines. Geneva, World Health Organization.Yan, H., Li, X. (2008). Causal attribution and its conceptions by non-English major postgraduates in China: A case study. Canadian Center of Science and Education,4(4), 77-85.Yan, W., & Gaier, E. (1994). Causal attributions for college success and failure: An Asian American comparison. Journalof Cross Cultural Psychology, 25, 146–158.Yao, J. (2009). Chinese research on social development of learning disabilities: A Review.Journal of Zhejiang Normal University(Social Sciences), 160, 2-7.Yu, G. (2005). Learning disabilities: A field waits further exploration and promotion (in translation). Advances in Psychological Science, 13(5), 545-546.Zhao, J., Zhang, N., Geng, W,. & Shen, J. (2005). A research on the relationship between elementary school teachers’ self-efficacy and their attributional style (in translation).Journal of Educational Studies, 1(4), 71-77.Zhao, Z. (2010). Literature review of domestic research on students with learning disabilities (in translation). Journal of MudanjiangCollege of Education, 119, 82-83.Zhang, N., & Chen, L. (2002). A review of integration: The attitudes of primary school teacher toward students with special need learning in regular schools. Chinese Journal of Special Education (Quarterly), 34, 1-6.Zhang, N., Zhao J., Shen J,. & Geng W. (2007). A research on response models of teachers attribution to students’ academic failure in primary schools and middle schools.Chinese Journal of Special Education (Monthly), 79, 73-78.Zheng, Z., & Zhang J. (2007). A research on learning motivations of students with LD. Journal of Guang Xi College of Education, 92:6, 51-53.
45
INTERNATIONAL JOURNAL OF SPECIAL EDUCATION Vol 27, No: 2, 2012
BOOK REVIEW
CHRISTINE TURNER’S SUPPORTING CHILDREN WITH LEARNING DIFFICULTIES, HOLISTIC SOLUTIONS FOR SEVERE, PROFOUND AND MULTIPLE DISABILITIES:
LONDON: CONTINUUM INTERNATIONAL PUBLISHING GROUP.
Shelly Gupta
In recent decades, with the advent of the holistic approach for the worldwide education systems in its entirety and focused on the needs of the special needs children has been proposed, with many organizations and individuals coming forward to propose reforms to education. For instance, The No Child Left Behind law has brought sweeping changes to education across the nation in US. The world, both socially and economically, has become interconnected and more interdependent; this is a fact that is undisputed.
Christine Turner, teacher and author of Supporting Children with Learning Difficulties- Holistic Solutions for Severe, Profound and Multiple Disabilities, has spent over 25 years teaching children with profound and severe multiple disabilities across special schools in the United Kingdom. She currently serves as curriculum coordinator for children with disabilities in the United Kingdom. Turner attempts to look at the child with an overall complete view, by increasing awareness by focusing on the disability and how this impacts his/her ability to learn. Furthermore, she explores ways on which educators, parents, paraprofessionals and allied health staff can develop a better understanding of the child with profound, severe and/or multiple learning disability and explores ways to optimize his/her learning. The book also serves as a stepping stone for those who wish to increase their knowledge and skills as they interact and work with disabled children.
To some extent the book serves as a practical handbook packed with strategies to handle and work with learning disabled children aged 3-19. Children with learning disabilities do not follow set patterns of learning, and yet often they are expected to learn in the same way as their more able counterparts. Turner draws on 25 years' experience of working with learning disabled children and young people to provide an introduction to learning disabilities and the effect they have on the individual and their family. She proposes holistic strategies to ensure that every child makes progress, regardless of the extent of their disability. All aspects of learning, from the simplest forms of non-verbal communication to the way ICT {Information, communication & technology} can motivate and inspire are explored in this informal guide for anyone wanting to support a child with learning difficulties.
Education, like many aspects of culture, goes through its many phases. Often these trends trickle down from the university world to high schools, then to middle schools. Previous trends emphasized points of passion – a focus on fewer areas of interest; in the current era, a holistic experience emphasizing the whole child approach is in vogue. As Turner lays it out, the system needs to speak, not just to the limited offerings in academics, but the complete experience and impact on a student’s learning and growth from a young child to a young adult. The current trends in education require that it lays a foundation for academic success, almost a given in any good independent school; but also one that includes a thread of character education, service, and leadership. It also needs to value personal connections, as students learn to advocate for themselves with caring faculty that make time to know who they are as people as well as students. This approach is to be harnessed in the education base systems for special needs children. Globalization is a powerful and emergent influence on education that has made its way into educational policies…and is influencing teaching practices and teacher education. (Wang, Lin, Spalding, Odell, & Klecka, 2011, p. 119). If one were to name an issue near the top of the list of crucial topics within the critical education literature, it would be globalization…what counts as responsive and effective education, what counts as appropriate teaching…all of these social and ideological dynamics are now fundamentally restructuring what education does…and who benefits from it throughout the world. (Apple, 2011, pp. 222-223).
The author begins with a preface discussing why she was inspired to write the book. The book is broken down into 14 chapters. The book flows well from ideas in thought, providing insightful case studies, and figures that support the author’s argument. The book is visually well organized which made it easily readable containing powerful quotes, subtopics, highlighted subheadings, figures and case studies
46
INTERNATIONAL JOURNAL OF SPECIAL EDUCATION Vol 27, No: 2, 2012
relating to the topic of discussion within that specific chapter. Throughout the book, author cleverly grabs the reader’s attention by allowing the reader to first relate to the concept/idea to him/her, and then ties the point to making parallels on how the same concept impacts children with learning disabilities. This strategy allows for the reader to develop a better understanding and perspective of children with learning disabilities.
The first chapter highlights a brief introduction to learning disabilities to the reader. Learning disabilities is very common among the human race irrespective of caste, creed, race or status. Throughout history, people have had varied perspectives towards children with learning disabilities. They were regarded as either a gift from God, and/or the extreme opposite in that they were considered to be the source of a horrendous punishment. In the past, children with learning disabilities had a shortened life span due to lack of medical care and knowledge of the disability. Although, it is highly likely that children with a progressive degenerative disorder will likely have a shortened life span.
Learning disabilities can be described as being mild, moderate, profound and severe. There are a variety of causes towards learning disability these can occur prior to birth such as substance abuse, and genetic disorder, perinatal, such as anoxia, prematurity of the infant and/or post natal which include traumatic brain injury, and meningitis. All of these causes can impact the physical, intellectual, emotional being of the child. Despite the multiple causes, there is no cure for a child with a learning disability. Each child varies in severity of the disability which in turn will impact and vary the skill asset that they acquire. Thus it is vitally important that intervention strategies be individualistic as it relates to the child’s needs. The author does a great job of providing a generic introduction to learning disabilities, and purposely avoids discussing the history and movement of policy and legislative changes towards people with disabilities, since these laws are quite dynamic and will vary across different countries.
In chapter 2, the focus of the book shifts to understanding how the disability impacts the child. The author begins by first describing how each being; regardless of disability are unique, have their own personality, likings and disliking. The educator would need to modify/adapt the lesson so as to take into the account the child’s unique learning needs keeping in mind; the way in which a child learns best, the amount of information that the child learns and the rate at which he/she learns. Children with learning disabilities often take longer to develop new ideas/concepts, and they have difficulty generalizing and transferring this new acquired skill. To develop these skills the author emphasizes the importance of continuous repetition of the new skill. The author cautions the possibility of having a misdiagnosis if the unique personality of the child is not taken into account. For instance, Turner described a typical Down’s syndrome child as someone who is generally happy with a jaunty attitude; however, if this child were an introvert, they would prefer the company of themselves rather than those around him/her. This can lead to a misdiagnosis of autism spectrum disorder. This point is very relevant and in itself thought provoking, as one cannot help but question if children truly have been misdiagnosed!
Chapter 3 discusses the impact of the disability of a child within a family. It is common for mixed emotions to arise when one has a child with learning disabilities: confusion, shock, anger, sorrow, and guilt. The author discusses the emotions and challenges of dealing with children with special needs. In particular, she highlights the challenges on how a child with learning disabilities can impact the family dynamics, adapting to new routines and lifestyle stages and how this can impact the emotions of non-disabled siblings. In addition, the child may require external services from allied health staff personal including: pediatricians, Physical therapists (PT), Occupational Therapists (OT), Speech Language Pathologists (SLP), dieticians, ophthalmologists, audiologists, and educational psychologists which would require more adaptations to the family timetable. There is a wide gap that exists between children with disabilities and non-disabled peers/siblings. This gap continues to widen as non-disabled peers meet age appropriate developmental milestones. Eventually these peers reach a level of independency: self-care, making friends etc. This level of independence is much more difficult for students with severe/profound disabilities to achieve.
The author provides insightful case studies of the importance on educating the special needs child on puberty and sexual education as he/she enters adolescence. She recommends that the parents start thinking about the future of the child earlier on in order to ensure that his/her social, emotional, vocational needs are met. Her point is valid as it will allow for the adolescent to have a better understanding of him/herself as it relates to the bodily and hormonal changes.
47
INTERNATIONAL JOURNAL OF SPECIAL EDUCATION Vol 27, No: 2, 2012
The author transitions into discussing in depth details of profound multiple learning disabilities specifically addressing physical capabilities, single sensory impairment, dual sensory impairment and multi-sensory impairments in Chapter 4. The author addresses her concern on how children who are less mobile have limited access to exploring their environment for learning purposes. Single and dual sensory impairment involves the impairment of one or more of the senses generally impacting vision and/or hearing. The author addresses how the visual impairment can impact the child’s pragmatic abilities of not being able to initiate and/or sustain eye contact. Children with multiple sensory impairments rely on tactile cues to help them explore their environment. The author also mentions that children with these deficits may react differently to tactile stimulation activities as compared to non-disabled peers since they may be fearful of the activity. It is important to keep in mind that these children face many struggles in their efforts as they try to make sense of the world around them, thus any aids (amplification, hearing aides, glasses) should be considered as low incidence services.
Although the author mentions hearing and visual impairments, she does not address the needs of children who have visual processing and/or auditory processing issues and how this can greater impact the intervention services towards children with severe, profound and/or multiple disabilities. Furthermore, she briefly mentions the use of a sensory room in attempts to help reduce self-stimulating behaviors, however then stresses that the child will revert back to the behavior once the stimulus/environment is removed. The author does not go into detail how a sensory room can be established and used within the classroom setting or within the home environment. The author indicates that the self-stimulating behaviors are the result of the child’s way of passing time when other stimuli are not available. Personally, I feel that this statement undermines the importance of the child’s sensory need.
Chapter 5 discusses the importance of front-loading information to special needs children so as to allow for transitions to run smoother, she encourages parents to bring the student initially to school to guide him/her through this new experience. Information should be communicated between parents and teachers and to those who are working with the child so as to better serve and adapt to the child’s needs. This helps the educator in determining if there are any new changes to the child’s environment and/or new behaviors that have resulted due to the change.
From my experience as a SLP, I cannot help but stress the importance of training individuals and/or providing educational resources for those working with the child; this includes the parent, 1:1 paraprofessionals, and mainstream teachers. The author does not mention this within her book nor does she mention the role that mention support personals can play in providing resources to educators, staff personals, and/or the parent, these include individuals like a behaviorist, and the school nurse.
In her book, Turner indicates that frequent visits to hospitals, medical centers, clinics and GP surgeries will result in a long and detailed medical records, much of which is neither relevant nor accessible to those outside the medical profession (Turner, 42). As a practicing SLP, I completely disagree with this point. A child could have a history of epileptic seizures, and/or has a history of recurrent ear infections, medical reports are highly relevant for individuals working with the child. Any individual working with the child should be well aware of the symptoms the child could experience should a seizure attack occur, so as to prevent devastating results. If the child has an ear infection, and/or requires Pressure Equalization tube surgery then it can affect his/her behavior and his/her ability to follow directions. If the information is not readily available then it is the role of the educator to ensure that release of information is signed by parents so as to have medical information readily accessible in the student’s file. Consistent communication is absolutely crucial between parents, teachers, practitioners, and allied health staff.
Chapter 6 describes ways in which the learning environment can be adjusted to help suit the child’s needs, visually, auditory and physical environment. The author mentions insightful strategies to address all three areas including: using contrasting colored backgrounds, adequate lighting, using padded portable visual dividers to eliminate visual distraction, picture cues along with the label on furniture, placing rubber feet on tables and chairs to reduce noise, using soft furnishings to absorb sound, and adjusting the table height and chairs as per the requirement of the student. The author also mentions specialized learning facilities such as Snoezelen, hydrotherapy pools and spa pools. This chapter is particularly helpful for both parents and educators as all of these learning environments need to be considered for the benefit of the child.
Children with disabilities generally have deficits in the areas of communication particularly impacting both their speech and language abilities. Chapter 7 and 8 discusses communication impairments, non-
48
INTERNATIONAL JOURNAL OF SPECIAL EDUCATION Vol 27, No: 2, 2012
verbal communication and use of alternative augmentative communication devices: gestures, picture exchange communication system, objects of reference, and voice output speech generating devices. The author also mentions the use of Makaton, which uses British Sign Language (BSL). BSL is not commonly used across the world as a form of communication, which makes it more difficult to apply the communication mode to perhaps students in America who use American Sign Language (ASL).
The author briefly mentions the role of Speech Language Pathologists in Chapter 7. Although augmentative communication should be considered with non-verbal children, the author makes it seem that the educator should be able to apply the use of these communication systems but does not inherently mention the importance of consulting with the SLP prior to applying or utilizing the augmentative communication systems. Furthermore, the author does not mention the importance of consulting and communicating with the IEP team to: avoid communication breakdowns towards the child, to ensure consistency of communication demands placed upon the child as well and to discuss any behavioral observations seen across child’s environments.
Chapters 9 to 11 discuss ways in which the curriculum should be modified to cater to the child’s needs. The author mentions creative ways in which the curriculum can be modified and enhanced. Firstly, she mentions the importance of making the lessons meaningful to the child. The educator can apply the use of cause and effect and/or battery operated toys along with music to enhance the lesson. Turner also mentions the importance of breaking down tasks such that children are given the opportunity to learn through the use of their senses. Also breaking the tasks into smaller units will enable the child in becoming more successful and eliminate room for frustration.
Chapter 12 explores the use of information technology and communication devices can be used to help develop cognitive, sensory, and motor skills as well it promotes interaction and cooperation among communication partners. Turner emphasizes the need to utilizing technology across the curriculum. The information provided in this chapter is applicable both parents of children with learning disabilities and to educators in specialized environments.
The importance of assessments, prompting and rewards were discussed in Chapter 13. Assessments provide an opportunity of developing a baseline and identifying the child’s areas of strengths and weaknesses. The author thoroughly outlines the three areas in prompting that can be utilized across environments: physical, gestural and verbal prompts. She also emphasizes the importance of providing immediate rewards to the child after the child achieves the desired result. This would hold more value for the child with severe/profound learning disabilities. Moreover, the rewards should be of interest to the child and should be used consistently.
Chapter 14 discusses ways of presenting information in the classroom environment. Some strategies discussed involve using visual timetables, photos, symbols and pictures to help with the ease of transitions between activities. The author also mentions how different handwriting styles can confuse the child and hinder his/her learning. Though it may be difficult to find consistent fonts across reading books, worksheets or signs within the community, the author indicated the importance of trying to maintain consistent handwriting styles within the classroom environment. Although I question whether child can generalize the concept/skill across different environments if he/she is not exposed to different styles as it may not be functional in the long run since the child will be exposed to many different signs, and handwriting styles in the broader community. The same applies to picture cues, if the child is only shown one particular picture of a cookie, he/she may not be able to generalize the concept to other pictures of cookies. Perhaps, consistency can be established first and then the educator can create opportunities of introducing different picture cues, signs, and handwriting styles. The author also mentions the importance of seeking out opportunities to practice emerging skills across different contexts and situations. This will create room for allowing children to enhance and practice the skill.
In a related book by Barbara Prashnig's The Power of Diversity: New Ways of Learning and Teaching Through Learning Styles describes ways in which educators become aware and adapt to student’s learning style. Her book provides a description of a student's preferences, personalities, flexibilities and non-preferences during the learning process (p. 13). The book further provides an in depth analysis of assessing elements related to 1) left/right brain dominance; 2) sensory modalities like auditory, visual, tactile and kinesthetic preferences; 3) physical needs like mobility, intake/mouth stimulation and time of day preferences for learning; 4) environment preferences for sound, light, temperature and work area; 5) social grouping like pairs, teams, with authority figures or without a group; and 6) attitude factors like
49
INTERNATIONAL JOURNAL OF SPECIAL EDUCATION Vol 27, No: 2, 2012
motivation, persistence, conformity, structure and variety. Prashnig further describes how a teacher's learning style can impact the student and provides a method for teachers to analyze their teaching style. Parents can use their child's learning styles to adapt the same concepts within the home environment. Although this book is not specifically catered to children with learning disabilities, the strategies discussed and analyzes provide great avenues for adapting the child’s learning environment thus enabling them to become more successful as suggested by Turner.
Professor Bowder and Spooner’s book Teaching Students with Moderate and Severe Disabilities provides an in depth description of children with learning disabilities as it provides clear explanations of common terminology used describing students with profound and severe disabilities. The book further emphasizes the importance of using alternative assessments, and utilizing evidence based intervention methods. Furthermore, the authors highlight the continuous monitoring of progress towards the child’s Individualized Educational Plan to ensure that the goals are relevant to child’s growth and progress. The book then explores specific ways of modifying the curriculum to adapt to the child’s needs. It also helps support ways of utilizing and applying functional daily skills as the student progresses to adulthood. Turner’s book in contrast does not mention specifics in terminology which would have been helpful to the reader. Furthermore, she presents ideas and intervention strategies but does not indicate supported evidences as practice besides highlighting a few case studies. The book does not discuss specific details on how the curriculum should be modified to cater to the child’s needs like Bowder and Spooner. Turner, however, has consistently emphasized the importance of catering the lessons as per the child’s level of interest and motivation. Her book does not explore specifics in applying daily functional needs and how this relates to supporting the students vocational needs as the student enters adulthood and sustains a job within the broader community.
Overall Turner’s book provides a good source of preliminary information for both educators and parents. It is easily readable and visually well organized. The author stresses the importance of being sensitive the child’s needs. I particularly liked the chapter dedicated to the broader impact of learning difficulties, so often ignored, which is written sensitively. It is an excellent book for a teacher's professional bookshelf. Suggestions throughout the book can be implemented in most classrooms even by inexperienced teachers based on its simple layout of ideas and limited use of jargons.
This is recommended reading to understand innovation in the understanding and teaching of learning disabled children and how it is disseminated in a basic introductory level ; I would suggest reading other similar books to understand concrete and in depth plans to innovative education.
Reviewed by Shelly Gupta, SLP, who has extensive experience serving children in the educational arena. She is currently pursuing her doctoral studies at the California Institute of Integral Studies.
ReferencesApple, M. W. (2011). Global crises, social justice, and teacher education. Journal of Teacher Education, 62(2), 222-234.Browder, D.M, and Spooner (March 2011). Teaching Students With Moderate and Severe Disabilities. New York. The Guilford Press. Christine Turner (2011).Supporting Children with Learning Difficulties, Holistic Solutions for Severe, Profound and Multiple Disabilities. London: Continuum International Publishing Group.Prashnig, Barbara (2008). The Power of Diversity: New Ways of Learning and Teaching Through Learning Styles. Third edition. London: Continuum Publishing Group.Wang, J., Lin, E., Spalding, E., Odell, S. J., & Klecka, C. L. (2011). Understanding teacher education in an era of globalization. Journal of Teacher Education, 62(2), 115-120.
50
INTERNATIONAL JOURNAL OF SPECIAL EDUCATION Vol 27, No: 2, 2012
COMPARING SPECIAL EDUCATION IN THE UNITED STATES AND CHINA
Jeffrey B. KritzerUniversity of Nebraska at Kearney
Despite the fact that China has a deep-rooted history of sympathetic attitudes toward individuals with disabilities, and has begun to serve individuals with disabilities in their public schools, Special Education in China today is much like it was in the United States prior to the implementation of the Education for all Handicapped Children Act of 1975. China has little of the uniformity that is evident in special education programs across the United States. This paper compares special education as it is implemented in these two nations. A survey is conducted to ascertain the support that teachers in these countries receive for teaching struggling students.
IntroductionThere is little doubt that the United States and China are two of the most powerful and progressive countries in the world today. But, as far as Special Education is concerned, the United States serves as a model for other countries.
Special Education in ChinaSpecial education in China is quite similar to that of the United States prior to the implementing of the Education for All Handicapped Children Act (PL. 94-142) in 1975. There is a lack of consistency, not only in comparing urban and rural services, but within cities as well (Kritzer, 2011).
There were some important laws that have influenced the evolution of special education in China. In 1982, the newly revised constitution of China stated the country’s responsibility for educating people with disabilities, the first legal mandate for the provision of special education in China. However, the firm foundation did not come until the National People’s Congress adopted the 1986 Compulsory Education Law of the People’s Republic of China (Worrell & Taber, 2009), mandating that all children are entitled to nine years of free public education— six years of elementary education and three years of secondary school education.. Special schools were organized for children with visual, hearing and mental impairments. In 1990, the Law on the Protection of the Disabled Persons (1990) emphasized that families, work units and community organizations must share the responsibility for caring for individuals with disabilities. In 1994, this law was strengthened by the Ordinance of Educations for Persons with Disabilities which required a qualification certificate system for the special education teacher (Deng & Harris, 2008). Furthermore, the Teachers’ Law of the People’s Republic of China (1993), and the Education Law of the People’s Republic of China (1995) both call for offering educational undertakings for individuals with disabilities.
China is attempting to do much more, compared to their past history, in the way of educating children with disabilities. China recognizes six classes of disability: visual, hearing, intellectual, physical, psychiatric and multiple impairments. Surprisingly, the prevalence of people with disabilities appears to be lower in China than other countries (Worrell & Taber, 2009). However, this difference might be due to the fact that China does not recognize all of the categories of disability that other countries do (Deng & Harris, 2008). In addition, China is an agriculturally based culture and the majority of people live in rural areas. Physical labor is the primary work in these rural areas where people can function productively even if they cannot read or write. Therefore, many people with disabilities (e.g. autism, learning disabilities, and mental retardation) may not even attend school in rural and remote areas (Worrell & Taber, 2009).
51
INTERNATIONAL JOURNAL OF SPECIAL EDUCATION Vol 27, No: 2, 2012
Because most of China’s population lives in rural areas, the cost of funding special schools for most children with disabilities in these areas is quite prohibitive. Influenced by inclusion in western countries, the Learning in the Regular Classroom (LRC) movement gained popularity in the early 1990s (Ellsworth & Zhang, 2007). The use of this setting to serve students with disabilities has grown astronomically. In 1990, there were 105,000 students with disabilities in school and about 18% of them were placed in general education classrooms. In 2003, LRC programs served approximately 67% of all students identified with disabilities in regular schools (Deng & Harris, 2008).
Children with disabilities are now welcome in Chinese general education classrooms; however, results are at best mixed. Eligibility for the LRC placements are for those students who can adapt to studies and life in public schools (Worrell & Taber, 2009). At present, three categories of disability are being served in the regular education setting: visually impaired, hearing impaired, and mental retarded.. The most notable achievement made by China’s LRC programs is the significant increase in numbers of children enrolled (Worrell & Taber, 2009).
Still, China has several major hurdles to overcome. First is the reality of large class sizes. Typically classes have between 50-70 students thus making it extremely difficult to individualize instruction for those students who need it. Additionally, teacher training is problematic as well. Many teachers in ordinary schools have never had training in special education (Worrell & Taber, 2009). Students with disabilities are often ignored in the classroom and may not receive appropriate instruction, because the teachers have neither enough time nor adequate knowledge and skills to help them (Deng & Harris, 2008; Pang & Richey, 2006).
Special Education in the United StatesSince 1975, and the Education for All Handicapped Children Act (P.L.94-142) the United States has guaranteed a free and appropriate education for all students with disabilities. Under this act, there are 13 recognized categories of disability, and they are autism, developmental delay, visual impairment, hearing impairment, emotional disturbance, traumatic brain injury, language and speech disorders, deaf-blindness, multiple handicap, physically handicapped, mental retardation, other health impaired and specific learning disability. Of these categories, by far the highest incidence is those with learning disabilities (disabilitycompendium.org, 2011).
The Special Education Process is consistently implemented in American schools. After first trying some strategies of their own, teachers will refer a struggling student’s case to the Student Study Team. The Student Study Team is a problem-solving body that exists in all elementary schools in the United States. It is also sometimes referred to as a Child Study Team or Student Success team. It is a multidisciplinary team consisting of a school principal (or other person given the authority by the principal), the referring teacher of the student under concern, the parent of the child, a special education professional, a school psychologist, a nurse, and other personnel if appropriate, such as a bilingual coordinator (if the child is being educated in his second language). The team analyzes samples of the child’s class work and brainstorms solutions to help the child. They would not, under best practices, immediately begin testing the child to see if he/she is qualified for special education services. They would try other strategies first. If unsuccessful, the Student Study team will then refer the child for special education testing. If the child ends up qualifying for special education services, an Individualized Educational Program (IEP) is constructed.
The IEP provides the student with all of the support that they might need to be successful academically. These supports include appropriately designed academic and functional goals for the child, placement in their least restrictive environment, and services such as counseling, assistive technology, testing modifications and accommodations, behavior support, transitional services, transportation, and extended school year if necessary.
The student’s IEP remains in effect for one year. At least once a year, the IEP is reviewed to determine if changes need to be made to the child’s educational program. Parents are given progress reports several times during the school year (at every grading period) detailing how the student is progressing on his or her special education goals. Every three years, the student must be reevaluated to determine if he or she is still eligible for special education services. This involves having the school psychologist and special education professional complete the same testing again.
52
INTERNATIONAL JOURNAL OF SPECIAL EDUCATION Vol 27, No: 2, 2012
The special education process for children with learning disabilities, in the United States, can be a cumbersome exercise, with much paperwork to keep in order to stay in compliance with existing laws and regulations. However, it has ensured a consistency across the country with regard to the services provided.
Comparing Special Education in China and the United StatesThere is a remarkable consistency in how special education is implemented in the United States. This is due to the federal prescriptive law governing special education in the United States, the Individuals with Disabilities Education Improvement Act of 2004. Services are quite similar no matter where one attends school, whether that school be urban or rural, largely middle class or largely poor.
China, on the other hand, is a model of inconsistency when it comes to special education. Attempts to compare the two systems are very difficult due to the inconsistency of services and the different context in which schools in China are run. There are IEPs in some Chinese schools, and there are disabled students in some regular Chinese schools, but the paper work and identification processes have yet to be standardized, as they are in the USA.
MethodsWhile the context of special education is quite different in China and the United States, one can compare the support that American and Chinese teachers receive to help deal with struggling students. Thanks to the support of faculty at Hebei Normal University, the author was taken to two Chinese public primary schools in Shijiazhuang City and allowed to visit with faculty at these schools. In order to find out the differences between special education services in China and the United States, a brief survey was administered to teachers at these two Chinese primary schools and three American primary schools. First through fifth grade teachers participated voluntarily, and were asked the following research questions:1. How many students are in your class?2. Does an expert come into your class to assist you with struggling students?3. Do struggling students leave your room for help from an expert in a special room?
Research ResultsTeachers in the United States had remarkably smaller class sizes than did their counterparts in China, with a mean for United States class sizes being 22.62 as opposed to China’s 59.46. See Table 1 for results. While 74.3% of American classrooms surveyed implemented inclusion, none of the Chinese classrooms surveyed did the same. See Table 2 for results. While 89.7% of American classrooms surveyed sent children to pullout rooms for help from an expert, none of the Chinese classrooms surveyed did the same. See Table 3 for results. 100% of the American classrooms surveyed benefited from either or both Inclusion and Pullout Services, but none of the Chinese classrooms surveyed did either. See Table 4 for results.
Table 1. Mean Class Size by Country, Standard Deviation, and Number of ClassesCountry M SD nUnited States 22.62 2.65 26China 59.46 8.42 26Note. The difference between the two means (22.62 vs. 59.46) was significant, t(50) = -21.292, p < .001.
Table 2. Number of Classrooms by Country, Percentage Implementing InclusionCountry Number of Classrooms Percentage Implementing InclusionUnited States 26 74.3%China 26 0%Note. The difference between the two percentages (74.3 vs. 0) was significant, chi-square (1, N=52) = 25.26, p < .001.
Table 3. Number of Classrooms by Country, Percentage Implementing PulloutCountry Number of Classrooms Percentage Implementing PulloutUnited States 26 89.7%China 26 0%Note. The difference between the two percentages (89.7 vs. 0) was significant, chi-square (1, N=52) = 41.24, p < .001.
53
INTERNATIONAL JOURNAL OF SPECIAL EDUCATION Vol 27, No: 2, 2012
Table 4. Number of Classrooms by Country, Percentage Implementing Inclusion and/or PulloutCountry Number of Classrooms Percentage Implementing Inclusion and/or PulloutUnited States 26 100%China 26 0%Note. The difference between the two percentages (100 vs. 0) was significant, chi-square (1, N=52) = 52, p < .001.
DiscussionThe small class sizes depicted in the survey results are typical of elementary classrooms in the United States (OECD, 2009). There are state laws that limit class size, and it is rare for a 1 st-5th grade classroom to have as many as 30 in the room. In fact, some states forbid class sizes greater than 20 in grades 1-3. China’s class sizes are reflective of their country’s huge population and the fact that there is limited diversity in a typical Chinese classroom.
The consistency of services in the United States and the lack of consistency in China demonstrated in this survey is due to several factors. For one, schools in the United States are required to offer a continuum of placements which accounts for services being provided both in the general education classroom and in a special room. Furthermore, all schools have at least one special education professional and access to a school psychologist, thus ensuring compliance.
Despite the similar appearance of the Chinese Learning in the Regular Classroom movement, and the United States’ trend toward Inclusion, there are many differences. The United States’ policy is based on the philosophy of equality of opportunity and diversity from a liberal political system and a pluralistic culture, whereas China had a long tradition of a hierarchal pyramid of social relationships. Equality and decentralization are not a priority in China. The primary goal of China is to give most children with disabilities the opportunity to go to school (i.e., the right to be educated). The primary goal of Inclusion in the United States is to give children the right to be equally educated. China does not require a free and appropriate education. Children with severe and multiple disabilities and many children with moderate disabilities are still excluded. Most of them do not get the opportunity to go to school at all. China’s system is simpler and less systematic. The Individualized Education Program, Least Restrictive Environment, and parental involvement are not strongly emphasized in China (Deng, Poon-McBrayer & Farnsworth, 2001). Furthermore, China emphasizes a remedial model more than an educational needs model, and it stresses identification and compensation for deficits more than identification and development of competence and potential (Deng, Poon-McBrayer & Farnsworth, 2001). Finally, this Learning in the Regular Classroom movement does not necessarily reflect allegiance to the concept of inclusion, rather it more accurately reflects a shortage of personnel, limited fiscal resources and facilities, in addition to geographical considerations (Deng & Manset, 2000).
ConclusionThe uniformity of the process by which disabled students are served in the United States helps ensure that all children have access to an appropriate education. The United States can serve as a model for other countries attempting to do the same. China could make some specific changes to their special education process that would be an immediate benefit to their students with disabilities. For one, a continuum of available placements would be more appropriate for a wider range of abilities than just inclusion in a general education classroom. Additionally, personnel needs to be allocated to assist general education teachers who have students with disabilities in their highly populated classrooms. Teacher training is also an important issue. More colleges of education in China need to have special educators on their faculties. Not only that, but general education teachers need training in inclusive methods, similar to the training that pre-service teachers in the United States receive. Finally, laws that would reduce the large class sizes in China would provide a relief to teachers of struggling students.
With all of the challenges listed, the future is still brighter for children with exceptional needs in China. Teachers are being trained in more flexible methods, and in addition to the traditional whole-class lecture model of instruction, a model that combines whole-class teaching, tutoring outside of class, and cooperative learning has been widely applied (Deng & Manset, 2000). Additionally, parental advocacy is on the rise in China. In the United States, the advocacy efforts of parents (including litigation) were a main factor in bringing about a system of free and appropriate public education, including education in inclusive settings, for children with disabilities. Today in China, parents are beginning to address the same issues that parents in the United States addressed more than 25 years ago—the right to an education
54
INTERNATIONAL JOURNAL OF SPECIAL EDUCATION Vol 27, No: 2, 2012
for their children of different abilities (McCabe, 2003). Finally, programs to prepare special education teachers are developing rapidly (Ellsworth & Zhang, 2007).ReferencesAnnual Disability Statistics Compendium. (2011). Retrieved from http://disabilitycompendium.org/Compulsory Education Law of the People’s Republic of China. (1999). Chinese Education andSociety, 32(3), 14-18.Deng, M. and Harris, K. (2008). Meeting the needs of students with disabilities in generaleducation classrooms in China. Teacher Education and Special Education, 31(3), 195-207.Deng, M. and Manset, G. (2000). Analysis of the learning in regular classroom movement inChina. Mental Retardation, 38(2), 124-130.Deng, M., Poon-McBrayer, K., & Farnsworth, E. (2001). The development of special educationin China: a sociocultural review. Remedial and Special Education, 22(5), 288-298.Education Law of the People’s Republic of China. (1999). Chinese Education and Society, 32(3), 30-46.Ellsworth, N. and Zhang, C. (2007). Progress and challenges in China’s special educationdevelopment: observations, reflections, and recommendations. Remedial and Special Education, 28(1), 58-64.Individuals with Disabilities Education Improvement Act of 2004, P.L. 108-146, Statute 601 et seq., 118 Stat. 2647 (2005).Kritzer, J.B. (2011). Special Education in China. Eastern Education Journal, 40(1), 57-63.Murdick, N., Gartin, B., and Crabtree, T. (2002). Special Education Law, Merrill Prentice Hall:Upper Saddle River, New Jersey. Organization for Educational Development. Education at a Glance 2010: OECD Indicators. Retrieved fromhttp://www.oecd.org/document/52/0,3746,en_2649_39263238_45897844_1_1_1_1,00.htmlPang, Y. and Richey, D. (2006). The development of special education in China. InternationalJournal of Special Education, 21(1), 77-85.Polloway, P., Patton, J., & Serna, L. (2008). Strategies for Teaching Learners with Special Needs. Merrill Prentice Hall: Upper Saddle River, New Jersey. Teachers’ Law of the People’s Republic of China. (1999). Chinese Education and Society, 32(3), 19-29.Worrell, J. and Taber, M. (2009). Special education practices in China and the United States:What is to come next? International Journal of Special Education, 24(3), 132-142.
55
INTERNATIONAL JOURNAL OF SPECIAL EDUCATION Vol 27, No: 2, 2012
COUNSELING GIFTED AND TALENTED STUDENTS IN JORDANIAN INCLUSIVE SCHOOLS: CONCLUSION AND IMPLICATION
Dr. Ibrahim A. El-ZraigatUniversity of Jordan
The primary purpose of this study was to review counseling services for students who are gifted and talented at Jordanian inclusive schools in relation to theoretical counseling literature. The present study is considered a theoretical study. Gifted and talented students exhibit a wide range of characteristics, among of which are intellectual abilities and high achievement. The review indicated that counseling this group of students at Jordanian inclusive schools still faces a variety challenges. Foremost were lack of qualified teachers, few of gifted educational programs, and lack of skilled counselors. The study ended by offering a number of conclusions and implications. Basically, there is a need to establish a specialized counseling program for this group of students in the areas of psychological, academic, and career counseling.
Giftedness and talent are considered a potential for high academic achievement. Students with giftedness and talents do not have visible obstacles that challenge their abilities to learn and participate at schools and in society; however, they can be handicapped by the educational system and attitudes of the society. The unique intellectual abilities of this population enable them to obtain high performance and accomplishments (Smith, 2007). Most of those students get their education in regular or inclusive schools, and because of their advanced cognitive capabilities, they face barriers to accomplish their full potential. In regular classroom, these students are usually characterized by responding quickly and appropriately to questions than their classmates, they tend to select accurate performance that exhibit their unique abilities, and clearly define the final goal and outcome of their activities (Vaughn, Bos, & Schumm, 2007).
In inclusive schools, the challenges are rising when the teachers should teach all students at the level of average students, students with giftedness and talents will be neglected because the curricula are designed for regular students. For example, some of these students may display their creativity in science, writing, or other areas of personal interest, and because of regular curricula are designed to meet the needs of average classmates, these groups of students may face barriers in their development (Kirk, Gallagher, & Anastasiow, 2003; Vaughn, Bos, & Schumm, 2007). In spite of these and because of unusual rapid development some of them face challenges to enhance their giftedness. Because they usually get their schooling at regular or inclusive schools, they fail to thrive without modifications. It is clear that students who are gifted and talented are significantly different from the norm, so they are considered as exceptional learners. Therefore, they need special provision and counseling services in order to respond to their unique needs (Silverman, 1993).
Teacher of students who are gifted and talented face difficulties to facilitate each student’s development because of lack availability of appropriate educational programs. On the other hand, parents need to know how to guide their gifted and talented child especially to hold realistic expectations for his or her self and making suitable decisions about future career choices (Hallahan, Kauffman, & Pollen, 2012; Smith, 2007; Vaughn, Bos, & Schumm, 2007). Therefore, defining giftedness is very important in order to identify who will educate gifted and talented students and specify the quality of educational services that must be offered to them. Nowadays, many definitions commonly used to identify gifted and talented, foremost is introduced by Renzulli (2003) who describes giftedness as consists of interaction of
56
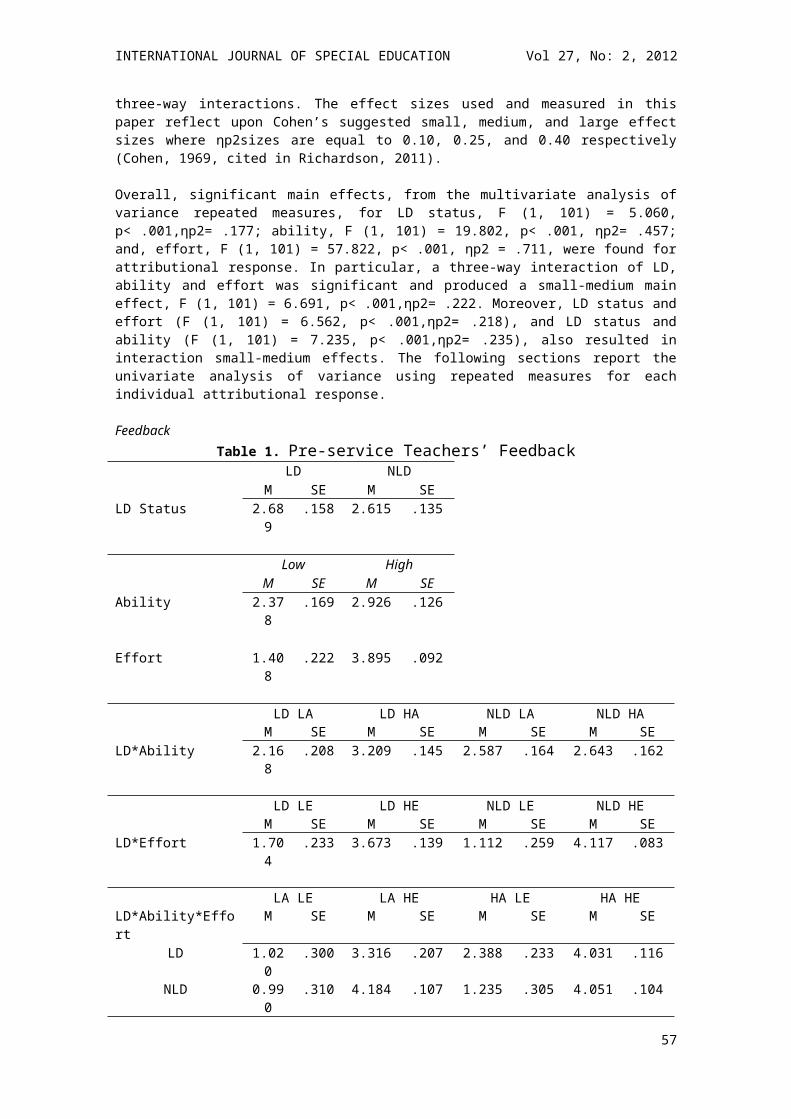
INTERNATIONAL JOURNAL OF SPECIAL EDUCATION Vol 27, No: 2, 2012
above average general intellectual abilities, high level of task commitment, and creativity. On the other hand, a federal definition reported by Marland (1972) indicates that gifted and talented children exhibit general intellectual ability, specific academic aptitude, creative or productive thinking, leadership ability, ability in the visual or performing arts, and psychomotor ability (Heward, 2006). A conclusion emerged from these definitions are that gifted and talented students considered as special needs and requires special services in order to respond to their giftedness and talent.
Students who are gifted and talented display a wide range of intellectual abilities, behavior patterns and personality types. Among of these characteristics: intellectual abilities, higher academic achievement, emotional stability, moral character, positive self-concept and self-sufficient, sensitive to their own feeling, others feel depressed and isolated and have behavioral problems. The nature of giftedness affects the individual’s social and emotional adjustment and educational and psychological needs (Hallahan, Kauffman, & Pullen, 2012). Some experts view gifted students as are more at risk for adjustment problems, and others suggest that gifted students are better adjusted that their non-gifted peers (Kirk, Gallagher, & Anastasiow, 2003). Because emotional development is important as academic achievement, counseling plays a crucial role to help them obtain optimal healthy emotional development.
Nowadays, there are many commonly educational options used to address the unique needs of students who are gifted and talented like inclusive practices and co-teaching that can enhance their intellectual capabilities and ensure equal access to appropriate education. Like all students, those who struggle to learn because of their intellectual ability are to be taught by using research based practices and they are expected to reach the same standards as all students. Therefore, teachers, administrators, parents, and other professional are primary responsible for meeting the special needs of students who are gifted and talented (Friend & Bursuck, 2009).
On the other hand, Frederickson and Cline (2009) maintain that inclusive education describes the process by which a school attempts to respond to all pupils as individuals by responding and reconstructing its curricular organization and provision and allocating resources to enhance equality of opportunity. Through this process the school builds its capacity to accept all pupils from the local community who wish to attend, in so doing, reduces the need to exclude pupils (p.71).
Inclusionary practices view labeling students with special needs as harmful and ineffective (Hallahan, Kauffman, & Pullen, 2012). Therefore, establishing effective inclusive schools require sensitive and acceptable educational context to the needs of all students including those with special needs. Also, the personnel staff should take into their account the different factors that shape and contribute to students unique needs. Thus, teachers, students, and family members must be aware of inclusionary practices. In addition, obtaining inclusive schools require encourage acceptance, awareness, sensitiveness, collaboration, and response to the unique needs of the students (Salend, 2005).
Educating students who are gifted and talented at inclusive schools may face variety of challenges such as the curriculum is not modified, the slow of instructional pace, repetition of mastered facts and information, lack of opportunities available to study personal interest topics, and lack of focusing on thinking skills (Smith, 2007). On the other hand, Kim (2006) states that addressing the needs of pupils are a strategic goal for every educational system; therefore, the teachers of gifted and talented students must be sensitive to the unique characteristics and needs of this population. Schroth and Helfer (2009) conclude that administrators, gifted education teachers, general education teachers need support especially in areas of making available resources, refining of programs, and using effective planning.
Educating gifted and talented students in JordanJordan is a developing country suffering from limited resources. Therefore, Jordan depends more on the development of the human resources than economic resources. Like other countries in development, our social and educational systems face a variety of barriers that challenge equal access to education for all students. Despite these limitations and restrictions, the Jordanian Ministry of Education has been paid special attention to gifted education and established Alreyadi Centers for Caring Gifted and Talented Students in each Governorate and resource rooms supervised by special education teachers. These teachers were prepared and trained to meet the special needs of disabled learners in general. Furthermore, their special education teacher programs offered at Jordanian Universities have lack of courses and training in education of giftedness, however, these programs are not designed for counseling students who are gifted and talented or included special courses in counseling this group of students. Thus, those teachers are not able to teach or meet educational needs of this population. On the other
57
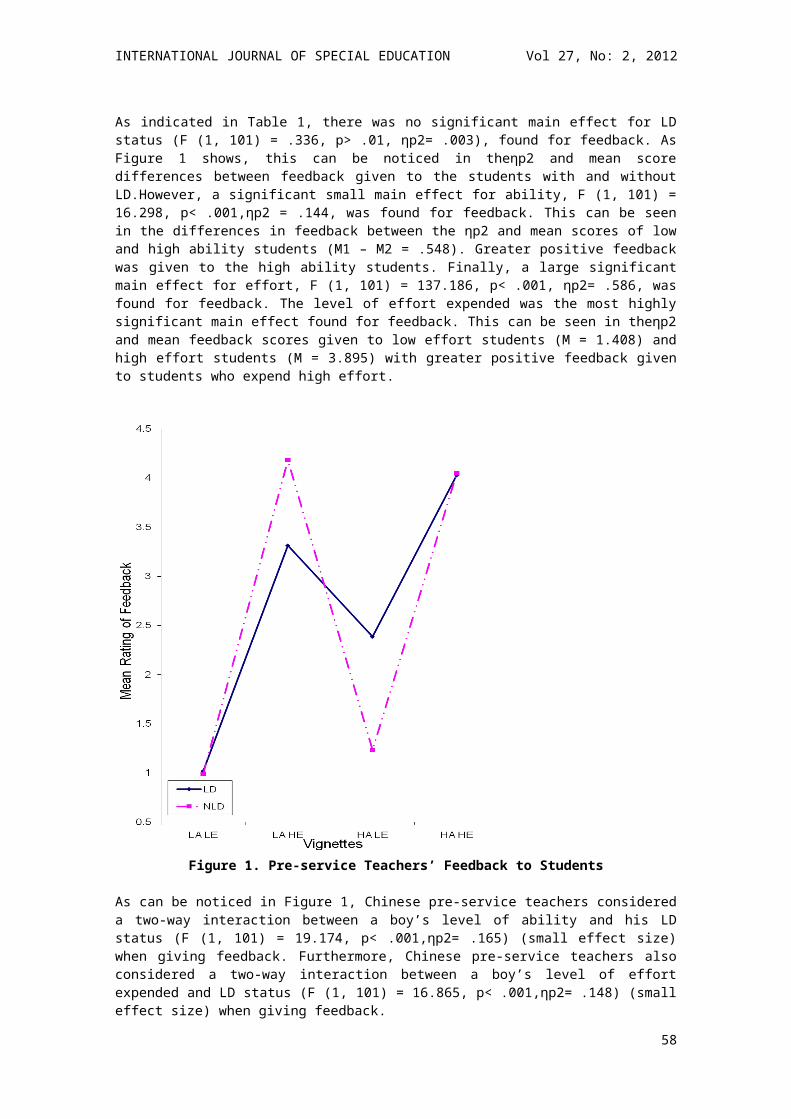
INTERNATIONAL JOURNAL OF SPECIAL EDUCATION Vol 27, No: 2, 2012
hand, the regular teachers lack the skills needed to teach this group of students and challenge their advanced cognitive abilities. Indeed, these teachers prepared and trained to teach regular students not students who are gifted and talented. In addition, Jordanian curriculum prepared to meet the needs of normal developmental milestones of normal students. The regular teachers are not prepared to make the changes and modifications needed in the curricula to address the unique needs of this group of students. Thus, our Jordanian inclusive schools are not able to foster the advanced cognitive abilities of gifted and talented students.
The goal and the methodology of the studyThe primary purpose of this study was to review the process of counseling students who are gifted and talented at Jordanian inclusive schools in relation to theoretical counseling literature. Therefore this study is considered as a theoretical study. To achieve the goal of the study, the investigator reviewed the theoretical literature of counseling gifted and talented students as well as the reality of counseling this group of students in Jordanian inclusive schools. The investigator reviewed the data bases available in the universities of Jordan, published articles and proceedings of conferences focuses on gifted counseling, documents available at The Ministry of Education in Jordan, and the content of counseling preparation programs offered at the local state and private universities. Throughout this review, the investigator try to answer the following questions: What are the counseling services offered for students who are gifted and talented at Jordanian inclusive schools? What is the type of counseling does the students who are gifted and talented need at Jordanian inclusive schools? Answering these questions will be obtained by reviewing the theoretical counseling literature and the comments made about the reality of counseling this group of students in Jordanian inclusive schools.
Theoretical review of counseling students who are gifted and talented and commentsThe unusual rapid of cognitive development of students who are gifted and talented influences the other developmental milestones such as psychomotor, language and speech, imaginational, intellectual, emotional, moral, social, and emotional aspects. Some of those students may display their unusual developmental in extra physical energy, which may be shown in rapid speech and gestures, and highly active especially in executing their daily life activities and personal projects (Dulit, 1992; Friend & Bursuck, 2009; Silverman, 1993). Also, Hong, Perkins, and Milgram (1993) stresses that gifted students´ prefer to work with peers and learning by carrying out personal activities and doing experiential projects. In addition, Hull-Blanks, Kerr, and Kurpius (2004) indicates that some talented students´ display impulsivity, aggression, and lower self-esteem. These characteristics may explain and prove why special provisions and counseling students who are gifted and talented are needed to help them in managing their unique needs. Jordan as a developing country needs well skilled and qualified teachers and counselors to meet the unique needs of students who are gifted and talented. Despite the limited resources of Jordan, The Ministry of Education started including special needs students at public and private schools.
Very little literature has been written about counseling students with special gifts in Jordan and this may reflect the importance and necessity of targeting counseling this group of students. A review of the published articles and proceedings of conferences focuses on gifted and talented counseling; only one study found and carried out by Dababnah (1998). The study was aimed to develop an assessment tool for identifying problems and needs of students who are gifted. The results of the study revealed that problems and needs of this group of students were more than of those of normal students. School counselors who work at Jordanian inclusive schools were prepared and trained to deal with the counseling needs of regular students.
According to Gladding (2009) counseling aims to understand psychological life of the person through applying mental health and human development principles. Therefore, a counselor is a professional person who listens to people and helps them solve their adjustment difficulties through using specific procedures. In case of counseling gifted and talented students, the counselor must be skilled, trained, and have the potential to understand inner life and differentiated counseling needs of this group of students. Stephen, Jain, and Kim (2010) maintains that counseling techniques are effective in meeting a variety of social problems that can exhibited by special needs students within the school context. Robbins, Tonemah, and Robbins, (2002) emphases the importance of participation in the social activities and interaction with parents for students who are gifted and talented. Landrum (1987) stresses the authority role of multidimensional and collaborative counseling including school counselors, teachers, administers, and parents; and effective counseling strategies in the emotional/social, academic, career, and family area. The following discussion highlights these counseling services.
58
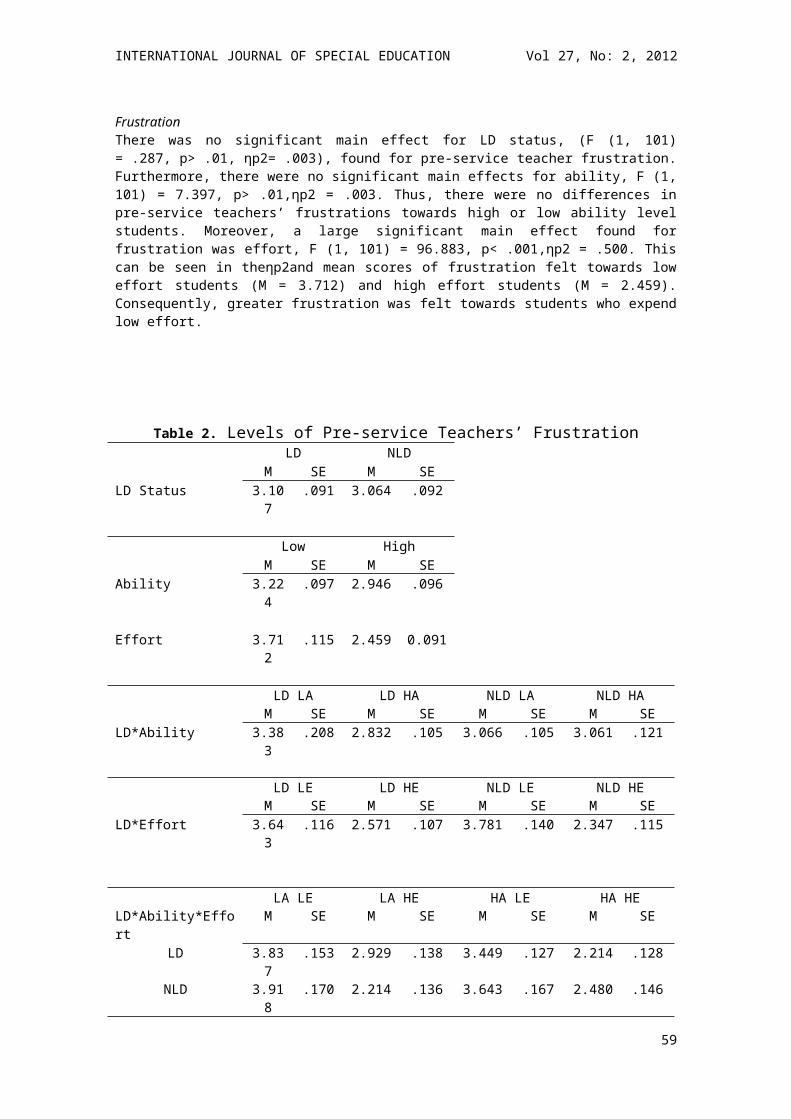
INTERNATIONAL JOURNAL OF SPECIAL EDUCATION Vol 27, No: 2, 2012
Unfortunately, and in the educational setting, students who are gifted and talented may feel that they are usually neglected, which in turn influences their motivation, social development, emotional development, and sense of self-worth. Therefore, counselors and teachers must be aware and sensitive enough in responding to their educational needs. In order to optimize their progress, counselors can provide emotional support to the students themselves and their parents, establish preventive group counseling, and work with teachers to maintain building appropriate educational programs (Silverman, 1993; Tassel-Baska, 1993). Academic counseling helps students who are gifted and talented students in order to: provide alternative instructional activities that meet their interests, offer enrichment activities such as field trips, supplying instructional activities that encouraging thinking skills and creative problem solving, allow students to move through the curriculum according to their own speed, and encourage independent learning opportunities (Ysseldyke & Algozzine, 1995), using assistive and instructional technology to meet the student's strengths, using flexible learning arrangements that allow the students to work in different groups, and providing students with opportunities to work on assignments that require different learning styles (Salend, 2005).
Emotional and social development of students who are gifted and talented crystallizes through interaction between the variables of the home, the school, the peer relationships, and the society. These students are our future leaders, and the counselors play a crucial role in facilitating their development. The ultimate goal of developmental counseling is self-actualization. Thus, the counselors should recognize the developmental potential of this group of students (Silverman, 1993a). In summary, developmental counseling aims to understand strength and weakness aspects of the students, help students to perceive and aware of their difficulties, acquire student's problem solving skills, develop personal skills, develop self awareness and self assertiveness, and provide students with stress management skills.
Career counseling is described as dynamic, creative, and highly individualized process, and plays an important role in the economic recovery and response to the labor market needs (Gysbers, Heppner, & Johnston, 2003). The term career counseling includes all activities and procedures which will be used to assist the student's interest, abilities and aptitudes to work in order to facilitate transition related careers (Bimrose, 2000). Greene (2003) calls for adequate career counseling services and recommended necessary of changing the nature of these services for students who are gifted and talented, he found throughout his study that this population were suffering from inappropriate career counseling. On the other hand, Greene (2006) maintains that school counselors must take in their minds the importance of modifying complexity and intensity of career counseling activities to respond to advanced level of cognitive development of students who are gifted and talented. Career planning for students who are gifted and talented has not been smooth, especially most of those they do not know what to do for the rest of their lives (Colangelo, 2002). School counselor helps gifted and talented in acquiring them life planning and decision making skills, understanding the process of selecting careers, meeting other gifted persons, understanding their career values and believes (Alreihani, El-Zraigat, & Tannous, 2010).
In Jordan, very limited attention has been paid to the career counseling of students who are gifted and talented at inclusive schools, those students have not always been have the information for planning for a future career. School counselor plays a crucial role in helping gifted and talented students to understand their challenges that result from their giftedness or talent especially when they exhibit early indicators of low achievement, lack of motivation, adolescence challenges, and problems of career choices. Parents of gifted and talented students play an important role in discovering their children problems. Colangelo (2002) views counseling with families of gifted as an area of challenge and reflects the important roles that they play in the relationship with their gifted child and school, he states: high ability students tend to become from families that are cohesive, child-centered, authoritative, and in which parents engage with their children (p. 10). Exum (1983) delineates that family counseling with students who are gifted and talented must consider the crucial role of family members other than parents, he demonstrates that school counselors should give their attention and interests for the family as a whole. In fact, the family can help the child in respecting and encouraging his or her giftedness, helping the child to understand his or her giftedness and individual differences, and finally helping the child to understand his or her special needs and how to meet it (Alreihani, El-Zraigat, & Tannous, 2010).
Unfortunately, cooperation between the families of gifted and talented students and Jordanian inclusive schools described at the minimum level, and this collaboration between both sides consider very important and play an important role in understanding the unique needs of this group of students. Thus, activating family counseling plays a crucial role in rebuilding relationship between the families and schools.
59
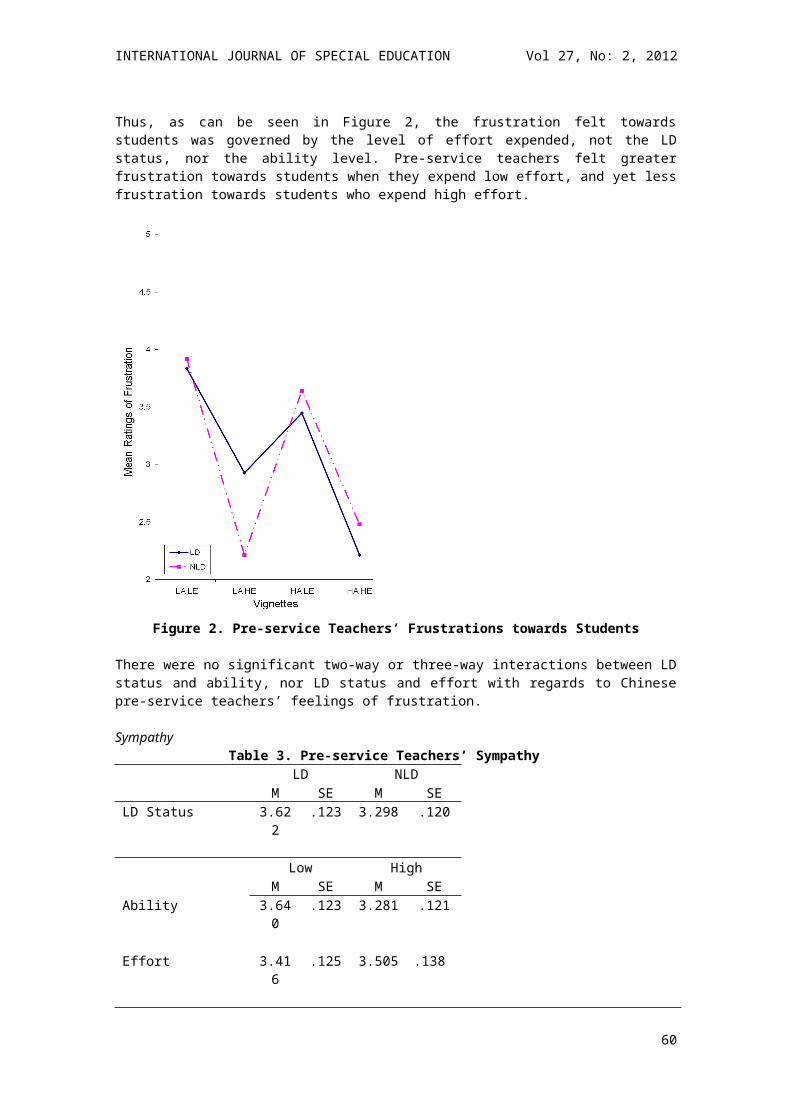
INTERNATIONAL JOURNAL OF SPECIAL EDUCATION Vol 27, No: 2, 2012
Conclusion Little literature has been written about counseling students who are gifted and talented. The Ministry of Education, through the directorate of special education is currently responsible for the education of students who are gifted and talented. Despite the tremendous work of the directorate of special education in providing special education services to students with special needs, this directorate still faces various challenges like lack of screening and diagnostic tools, inadequately prepared teachers, lack of instructional adaptations, lack of teacher training and support, and lack of parental involvement.
The Ministry of Education in Jordan suffering from screening instruments used in identifying gifted and talented students, and educational programs in order to respond to their unique needs. This group of students needs a variety of educational, vocational, and psychological services. Unfortunately, specialized counseling is not included in established educational programs for students who are gifted and talented.
Indeed, the Ministry of Education through the directorate of special education has established educational programs to meet the special needs of this group of students, but unfortunately, these programs only focusing on academic needs rather than counseling needs. In other words, counseling needs of students who are gifted in talented has limited attention compared to addressing educational needs. Educating students who are gifted and talented follow top-down approach, so the programs established came as a result of educational policy-makers. Their aim was to encouraging the cognitive development of students who are gifted and talented. Students who are gifted and talented have unique characteristics and needs that call for assessment and establishment specialized programs in counseling and education. Surely, successful educational programs require comprehensive assessment, flexibility, and specialized and collaborative counseling. Therefore, the needs of this population may be understood better through understanding their variety characteristics especially emotional aspects that distinguish them from their normal peers.
The difficulties of students who are gifted and talented in accomplishing their emotional health may cause unstable in their inner life and difficulties of achieving their interests and futures wishes and hopes, this may explain low self-concept and lack of executing their personal project. Therefore, it is very important to meet the unique emotional needs of these students throughout appropriate counseling services. These services can prevent them from experience variety problems and help in expanding their personal needs perception.
Focusing on academic achievement of students who are gifted and talented with limited attention toward meeting their emotional needs may create a problem of making decisions about their future career. One conclusion that can be drawn from reviewing counseling programs offered by the universities of Jordan is that counselors preparation programs offered at Jordanian universities are grounded well in counseling process but not in education of giftedness, which means that our school counselors are not prepared to address the unique inner life needs of students who are gifted and talented.
Career counseling and career planning plays a crucial role in responding to the labor market needs through matching student's interest, abilities and aptitudes to work in order to facilitate transition related careers. Lack of skilled and trained career counselor and lack of assessment tools in area of interests and aptitudes make this process difficult to achieve. Limited appropriate career counseling leads this group of students to select unsuitable specialties at the universities or working with not interest jobs. This may lead to experience hopeless feeling and increase their suffering. However, counseling students who are gifted and talented should be supplied by gifted and talented counselor who can understand their inner unique life and future. Fostering success of gifted and talented students in Jordanian inclusive schools needs availability of appropriate gifted education programs, skilled counselors, qualified teachers, and understanding professionals who work with this group of students.
ImplicationReviewing related literature tell us about the necessarity of counseling students who are gifted and talented. Numerous implications can be obtained throughout this review. Foremost is the importance of establishing specialized counseling programs for this group of students in area of psychological, academic, and career aspects. Academic counseling should focus on encouraging thinking skills and utilizing creative problem solving. In addition, students who are gifted and talented mostly have mixed feelings about their giftedness or talent, therefore, school counselors must focus on helping those
60
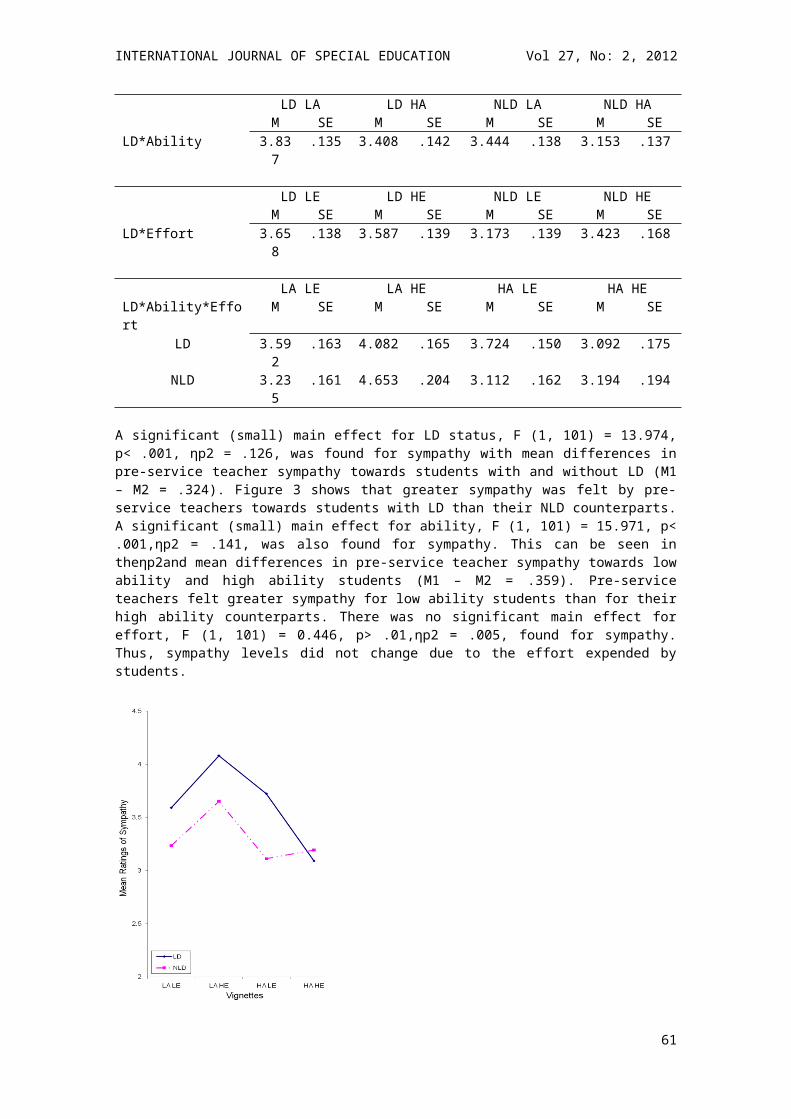
INTERNATIONAL JOURNAL OF SPECIAL EDUCATION Vol 27, No: 2, 2012
students express their feelings, as well as respect striving for the future goals. Greene (2003, 2006) claims the importance of oriented career counseling activities for the gifted. Thus, career counseling should improve the awareness of local labor market needs though establishing appropriate career counseling programs supervised by skilled counselors.
One of the most important implications is adding specialized courses in counseling students who are gifted and talented into counselors preparation programs offered universities of Jordan. As suggested by Colangelo (2002) successful counselors of gifted should have the knowledge and expertise both in counseling and gifted and talented education. Another implication drawn from Dababnah (1998) is developing appropriate screening and diagnosis tools in area of interests, aptitudes, and other special needs of students who are gifted and talented.
An important implication that is supported by Colangelo (2002) is that necessary of establishing families counseling programs to enable families with gifted children addressing their needs. Further implications posited by Ysseldyke and Algozzine (1995), Salend (2005), and Schroth and Helfer (2009) reflect the importance role of helping teachers to understand students who are gifted and talented, connecting the curricula with unique special interests of this group of students, and including counseling in gifted and talented educational programs.
References Alreihani, S., El-Zraigat, I. & Tannous, A. (2010). Counseling special needs and their families. Amman: Dar Afiker.Bimrose, J. (2000). Careers counseling. In Colin Feltham & Ian Horton (Eds.), handbook of counseling and psychotherapy (pp. 585-591). London: Sage Publication.Colangelo, N. (2002). Counseling gifted and talented students. The National Research Center on the Gifted and Talented: U.S.A.Dababnah, K. (1998). Developing an assessment tool for the identification of problems and needs of gifted student’s at the 10th grades of basic education in Jordan. Unpublished thesis. University of Jordan: Amman.Dulit, E. (1992). The gifted adolescent. In Stanford B. Friedman, Martin Fisher, & S. Kenneth Schonberg (Eds.), Comprehensive adolescents heath care (pp. 876-881). Missouri: Quality Medical Publishing, INC.Exum, H. (1983). Key issues in family counseling with gifted and talented black students. Roeper Review, 5 (3), 28-31.Frederickson, N. & Cline, T. (2009). Special educational needs, inclusion and diversity. London: Mc Graw Hill.Friend M. & Bursuck, W. (2009). Including students with special needs: A practical guide for classroom teachers. Upper Saddle River: Merrill – Pearson.Gladding, S. (2009). Counseling: A comprehensive profession. Upper Saddle River: Merrill.Greene, M. (2006). Helping build lives: Career and life development of gifted and talented students. Professional School Counseling, 10 (1), 43-42.Greene, M. (2003). Gifted adrift? Career counseling of the gifted and talented. Roeper Review, 25 (2), 66-72.Gysbers, N., Heppner, M. & Johnston, J. (2003). Career counseling: Process, Issues, and Techniques. Boston: Allyn & Bacon.Hallahan, D., Kauffman, J. & Pullen, P. (2012). Exceptional learners: An introduction to special education. Boston: Allyn & Bacon.Heward, W. (2006). Exceptional children: An introduction to special education. Upper Saddle River: Memill & Prentice Hall.Hong, E., Perkins, P., & Milgram, K. (1993). Learning styles of gifted adolescents with in-school versus out of school accomplishments in literature. Percept Mot Skills, 76 (3), 99-102.Hull-Blanks, E., Kerr, B., & Kurpius, S. (2004). Risk factors of suicidal ideations and attempts in talented, at risk girls. Suicid Life Threat Behav, 34 (3), 267-76. Kim, S. (2006). Meeting the needs of gifted mathematics students. APMC, 11 (3),27-32.Kirk, S., Gallagher, J., & Anastasiow, N. (2003). Educating exceptional children. Boston: Houghton Mifflin Company.Landrum, M. (1987). Guidelines for implementing a guidance/counseling program for gifted and talented students. Roeper Review, 10 (2), 103-107.
61
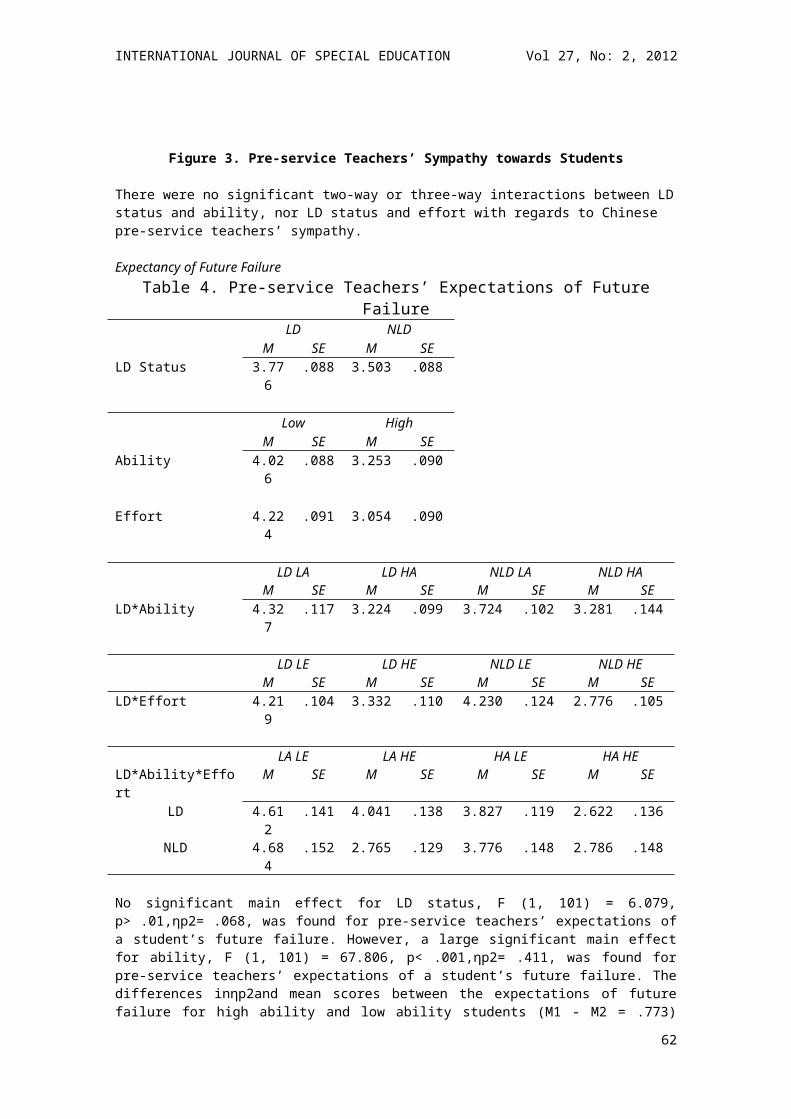
INTERNATIONAL JOURNAL OF SPECIAL EDUCATION Vol 27, No: 2, 2012
Renzulli, J. (2003). Conception of giftedness and its relationship to the development of social capital. In N. Colangelo & G. A. Davis (Eds.), Handbook of gifted education (pp. 75-87). Boston: Allyn & Bacon.Robbins, R., Tonemah, S., & Robbins, S. (2002). Project Eagle: techniques for multi-Family psycho-educational group therapy with gifted American Indian adolescents and their parents. Am Indian Alsk Native Ment Health Res, 10 (3), 56-74. Salend, S. (2005). Creating inclusive classrooms: Effective and reflective practices for all students. Upper Saddle River: Merrill – Pearson.Schroth, S. & Helfer, J. (2009). Practitioners΄ conceptions of academic talent and giftedness: Essential factors in deciding classroom and school composition. Journal of Advanced Academics, 20 (3), 384-403. Silverman, L. (1993). The gifted individual. In Linda Kreger Silverman (Ed.), Counseling gifted and talented (pp. 3-28). Denver: Love Publishing Company.Silverman, L. (1993a). The developmental model for counseling the gifted. In Linda Kreger Silverman (Ed.), Counseling gifted and talented (pp. 50-78). Denver: Love Publishing Company.Smith, D. (2007). Introduction to special education: Making a difference. Boston: Allyn & Bacon.Stephen, D., Jain, S. & Kim, K. (2010). Group counseling: Techniques for teaching social skills to students with special needs. Education, 130 (3), 509-513.Tassel-Baska, J. (1993). Academic counseling for the gifted. In Linda Kreger Silverman (Ed.), Counseling gifted and talented (pp. 201-214). Denver: Love Publishing Company.Vaughn, S., Bos, C. & Schumm, J. (2007). Teaching students who are exceptional, diverse, and at risk in the general education classroom. Boston: Allyn & Bacon.Ysseldyke, J. & Algozzine, B. (1995). Special education: A practical approach for teachers. Boston: Houghton Mifflin Company.
62
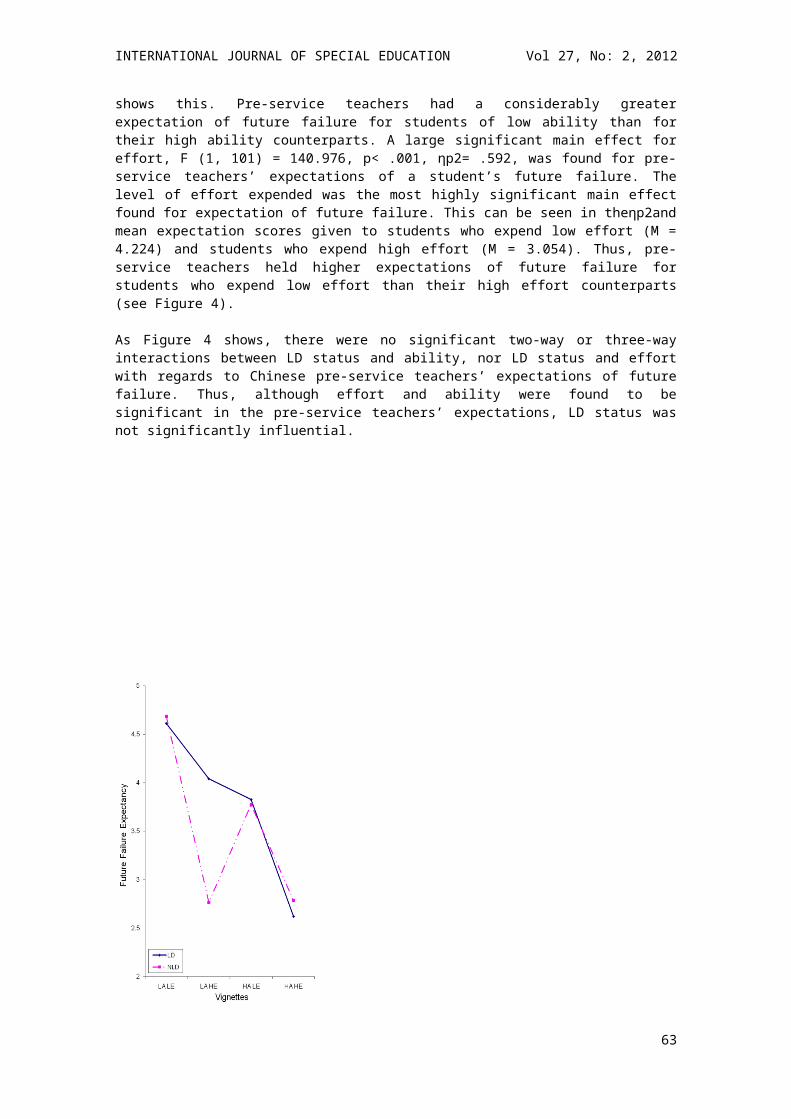
INTERNATIONAL JOURNAL OF SPECIAL EDUCATION Vol 27, No: 2, 2012
EDUCATIONAL OUTCOMES FOR CHILDREN AT-RISK: THE INFLUENCE OF INDIVIDUAL DIFFERENCES IN CHILDREN'S TEMPERAMENTS
Maha Al-HendawiQatar University
Evelyn ReedVirginia Commonwealth University
Individual differences in temperament can be protective or risk factors that may enhance or interfere with children’s healthy development and educational success. This study examined the concurrent and predictive relationships between temperament, school adjustment, and academic achievement in children at-risk. Seventy-seven children at-risk, ages five to 11 years, were assessed in this study. The results for the concurrent relationships showed significant relationships between children's temperament and their school adjustment; negative emotionality significantly correlated with and predicted school adjustment. Children's temperament was also found to have a significant relationship with academic achievement; persistence and activity level had significant correlations with academic achievement. Implications for practice and considerations for future research directions are discussed.
IntroductionEducational research into the role of children’s temperaments began in the 1980s. In particular, academic achievement and school adjustment were among the first variables to be examined in educational settings. The significance of understanding a child’s temperament as it relates to school can be explained by the concept of goodness of fit (Thomas & Chess, 1977). That is, a school's environment must be compatible with a child's temperament for the child to have optimal development, healthy adjustment, and positive educational outcomes. The environment should work with, not against, the child's temperament (Kristal, 2005). Children's individual differences in temperament as well as their teachers’ effectiveness in promoting goodness of fit between children’s needs and classroom environments are factors that can influence the children's adjustment as well as their learning and academic achievement (Keogh, 2003; Martin & Bridger, 1999).
Definition of temperament. Several theories about child temperament have emerged and have shaped models of temperament that define it and identify its traits. There is no consensus about a definition of the term temperament and its traits, but almost all models include several constructs, specifically that temperament (a) has a biological root, (b) appears early in life and can be identified as early as infancy, and (c) is characterized by behavioral tendencies rather than by discrete behavioral acts (Goldsmith et al., 1987). The clinical model by Thomas and Chess (1977) and the developmental model by Rothbart and Derryberry (1981) are the ones most widely used in educational research (Zentner & Bates, 2008). In the clinical model, temperament is defined as biologically based, individual differences in the behavioral tendencies of an individual that indicate the person's pattern of responding to others and to situations in the environment. In children, temperament refers to the behavioral style or tendencies that affect how a child responds to a situation. It is not so much a matter of why or what, in that why refers to the motivation behind an action and what involves the ability of a person to perform a task (Thomas & Chess, 1977). In this model, three typologies were developed to describe the temperament of a child: the difficult child, the easy child, and the slow-to-warm-up child. The difficult child was described as showing behaviors associated with a negative mood, withdrawal, low adaptability, high intensity, and low regularity; in contrast the easy child exhibited a positive mood, adaptive reactions to new situations,
63

INTERNATIONAL JOURNAL OF SPECIAL EDUCATION Vol 27, No: 2, 2012
and mild to moderate intensity; the third typology was the slow-to-warm-up child who was found to display a mildly negative response to new situations and a slow adaptability to change. The developmental model of temperament, however, focuses on emotion and emotion regulation; a strong emphasis is placed on attentional and neurobiological mechanisms (Zentner & Bates, 2008). Temperament, in the developmental model, is defined as constitutional differences in reactivity and self-regulation. Constitutional refers to biological differences and is influenced by heredity, maturation, and experience over time. Reactivity refers to biological arousability (responses) to changes in the environment that can be measured by a threshold of reactivity, latency and intensity of an individual's reaction, rise time, and recovery time. Self-regulation refers to the ability to modulate (regulate) their biological arousability (reactivity) and is the ability to utilize effortful control in situations to regulate the biological arousability (Rothbart & Derryberry, 1981).
Multiple dimensions of temperament comprise each model. Dimensions of temperament are clustered and measured differently by researchers and have also been used differently depending on what was appropriate for the specific developmental level of the children. However, while definitions differ across models of temperament, most of the temperament dimensions exist across the models but were labeled differently. For instance, reactivity in the clinical model can be referred to as negative emotionality in the developmental model (Nelson, Martin, Hodge, Havill, & Kamphus 1999; Sanson et al., 2009).
Temperament Studies in North America (US and Canada)Research in North America has demonstrated that a child's temperament influences their teacher’s attitudes, interactions, and decisions as well as the child’s school adjustment and academic achievement. A child's intelligence is often overestimated for children with temperament traits that are perceived as positive and underestimated for children with traits that are seen as negative (Pullis & Cadwell, 1982). A child who is inhibited is often underestimated academically, whereas a child's greater task orientation often influences his/her teacher to assign higher grades (Martin, Drew, Gaddis, & Moseley, 1988). Teachers’ behaviors towards children with different temperament profiles tend to differ systematically. For instance, teachers have been found to use task orientation information across classroom management decision-making situations; that is, children with a higher level of task orientation were less monitored for inappropriate or disruptive behaviors than were children with a low level of task orientation (Pullis & Cadwell, 1982). Children’s temperaments significantly correlated with the amount of time that teachers spend with children, in particular with the frequency of teachers' praise and criticism, physical contact, and directive behaviors (Nelson, 1987).
Temperament and school adjustment. Previous studies have examined the relationship between children’s temperaments and school adjustment (Blair, Denham, Kochanoff, & Whipple, 2004; Coplan, Bowker, & Cooper, 2003). School adjustment was indicated by school competence, social competence, and/or internalizing and externalizing behavior problems. Nelson et al. (1999) found that negative emotionality in parent-rated temperament of five year old children was a predictor of third grade teacher-rated adjustment difficulties. Their results showed that negative emotionality predicted all four adjustment outcome measures: school performance problems, internalizing problems, positive social behaviors, and externalizing problems, the last of which had the strongest relationship with negative emotionality in that it accounted for 16.6% of the variance in teacher rated externalizing problems. Similar findings that negative emotionality is a dimension of temperament that fundamentally influences school adjustment have been reported (Bouffard, Roy, & Vezeau, 2005; Coplan et al., 2003; Reed-Victor, 2004). Children with negative emotionality are prone to intense emotions, such as intense crying or anger in response to frustration, prolonged emotional upset as a result of changes in plans, and a general tendency toward irritability. Those negative emotion patterns were shown to be associated with both internalizing and externalizing problems which influenced the children’s adjustment to school. Research has found that correlations based on parent reports of their children’s temperaments were stronger than those from teachers. Bouffard et al. (2005) compared the relationship between children’s temperaments and school adjustment, as evaluated by parents and teachers. Significant correlations between parent-rated adjustment and teacher-rated adjustment were found in all dimensions of temperament, and all pairs of relationships were in the same direction. That is, they were alike in being either positive or negative, but the correlations that were based on parent reports were stronger than those from teachers.
Temperament and academic achievement. Research has examined the relationship between children’s temperaments and academic achievement by assessing children's performance on subject matter (e.g., reading, math, writing, and science) using two methods: standardized achievement tests and/or teacher
64
INTERNATIONAL JOURNAL OF SPECIAL EDUCATION Vol 27, No: 2, 2012
rated achievement (Bramlett, Scott, & Rowell, 2000; Martin et al., 1988). Keogh, Pullis, and Cadwell (1982) categorized the dimensions of temperament into the three categories, which they considered to be the most significant for academic success: task orientation, personal-social flexibility, and reactivity. Task orientation includes the following dimensions: activity level, distractibility, and persistence; personal-social flexibility includes adaptability, approach/withdrawal, and positive mood; and reactivity is comprised of three dimensions of temperament: intensity, threshold, and negative mood. Task orientation has consistently been shown to have the most significant relationship with academic achievement in studies that utilized the clinical model. For example, Martin and Holbrook (1985) examined 104 first graders using both teachers’ ratings achievement and standardized measures of reading and math and found that the teachers’ ratings of activity level and persistence were significant predictors of reading and math achievement. Subsequent studies have found similarly significant relationships between task orientation and academic achievement (Bramlett et al., 2000; Guerin, Gottfried, Oliver, & Thomas, 1994; Newman, Noel, Chen, & Matsopoulos, 1998).
Studies that utilized the developmental model of temperament reported temperament dimension of effortful control as having the most significant relationship with academic achievement (Deater-Deckard, Mullineaux, Petrill, & Thompson, 2009). Both standardized achievement tests and teacher rated achievement have been found to show significant relationships with children's temperament. Nevertheless, teacher rated achievement had a more significant relationship with temperament traits than did standardized achievement tests (Bramlett et al., 2000; Guerin et al., 1994; Martin et al., 1988; Martin & Holbrook, 1985). This difference in the strength of the relationships may be due to the nature of each test, in that standardized tests tend to be objective measures of achievement, whereas teacher rated achievement tends to be a subjective measure. However, teacher ratings of temperament have been found to be better predictors of achievement as measured by either assigned grades or standardized tests than have parent ratings (Bramlett et al., 2000; Neman et al., 1998; Martin & Holbrook, 1985; Martin et al., 1988) because teachers’ ratings may be influenced by the teacher's observations of the child's performance. This may particularly be true when the same teacher provides data on temperament as well as providing teacher assigned grades (Newman et al., 1998). Environmental context may influence the strength of such correlations; different temperament characteristics tend to be salient in the home, whereas others are likely to be salient in the school setting. For example, task persistence can be more apparent in the classroom than at home. In the classroom, the child interacts with peers and teachers and is expected to work on a task and complete it. Similarly, task orientation temperament traits may not be as disturbing or as noticeable in the home as they are in the classroom in which structured activity and specific rules are in place (Bramlett et al. 2000; Keogh et al., 1982; Liew, Eisenberg, & Reiser, 2004).
Temperament Studies in the International LiteratureResearch in other regions of the world, including Europe, the Middle East, and Asia, has also examined the relationships between temperament and academic achievement, and temperament and school adjustment. For example, Bruni et al. (2006) investigated the relationship between temperament and academic achievement for 264 children, aged eight to 11, in urban areas of Rome. This research found that the temperament dimension of task orientation strongly correlated with school achievement index (SAI) and that personal–social flexibility moderately correlated with school achievement. They reported that these two dimensions of temperament accounted for about 51% of the total variance, making them the most predictive factors for SAI. Reactivity was found to have a weak negative correlation with the SAI. Bruni et al.,’s findings are in line with the findings reported in the North American studies discussed above. Similar findings were found intwo other international studies (Taiwan and Israel). Li, Onaga, Shen, and Chiou (2009) examined 211 Taiwanese elementary level children. Their findings indicated a significant relationship between science achievement and both persistence and distractibility. Mevarech (1985) investigated 191 second and fourth grade Israeli children. Their findings showed significant relationships with math achievement for all the temperament dimensions that they examined. However, Mevarech found that correlations between teachers’ rating of achievement and task oriented behavioral style (adaptability, persistence, distractibility, and threshold) were higher for second graders than for fourth graders. Another interesting study by Chen, Chen, Li, and Wang (2009) examined the relationship between temperament and school adjustment for 200 seven year old children in urban areas of China. They found the temperament dimension of inhibition correlated significantly with school adjustment, but in a way that was very different from what is typically found in Western children. Chen et al. used an observational method to obtain data on inhibition as a temperament dimension while employing teacher and peer reports about school adjustment. Inhibition was positively associated with later cooperative behavior, peer liking, perceived social integration, school attitudes, teacher-rated competence, and distinguished studentship. Inhibition was also negatively associated with later teacher-
65
INTERNATIONAL JOURNAL OF SPECIAL EDUCATION Vol 27, No: 2, 2012
rated learning problems. This pattern of relationship between inhibition and later adjustment outcomes in Chinese children, which was different from those typically found in Western children, conveys the role of culture and environmental context. Specifically, inhibition is perceived as a positive aspect of temperament that Chinese children are encouraged to have.
Gender Differences in TemperamentVery few studies have reported gender differences in temperament. In a couple that did, girls were higher than boys in one dimension of temperament, effortful control (Liew et al., 2004). Other studies found no significant differences in gender (Blair et al., 2004; Bouffard et al., 2005); gender differences, when they were found to exist, were differences in strength rather than in the nature of the effects (Prior, Smart, Sanson, & Oberklaid, 2001). Newman et al., (1998) examined gender as a moderating variable, but their findings did not support their hypothesis that gender was a moderating variable between any temperament dimension and reading achievement in first grade. Deater-Deckard et al., (2009) examined the influence of children's gender on the investigated variables. Only two notable findings were reported for gender differences, that is, girls were higher than boys in effortful control, and lower than boys in surgency, which indicates high-energy activation and includes impulsivity, high intensity pleasure, activity level, and low levels of shyness.
However, existing research that investigated the relationship between temperament, school adjustment, and academic achievement, whether from studies developed in North America or internationally, has primarily examined predominantly middle class children who were basically developing typically (Bramlett et al., 2000; Nelson et al., 1999). Very few studies have examined children at-risk, those of low income families, minorities, and/or children with disabilities (Prior et al., 2001). The number of children at-risk is high in the US and is increasing; approximately one-third of the children in the US are at risk for school failure before they even enter kindergarten (Lerner, Lowenthal, & Egan, 2003). Children at-risk are likely to have single or multiple risk factors, which can cause serious problems early in life. Sources of early risk in children's lives can be classified into three categories: biological, familial, and environmental (Edwards, Mumford, & Serra-Roldan 2007; Werner, 2000). Thus, individual differences in temperament can present potential risks or protective factors for healthy development. Certain temperament profiles can be difficult temperaments which can predict adjustment problems, low achievement, and difficulties for individuals in later life (Thomas & Chess, 1977). For example, temperament dimensions such as high activity level, negative emotionality, and impulsivity can add an additional stressor to at-risk children. However, a child with a difficult temperament can adjust to the demands of the environment with appropriate support. If the classroom environment can be made to be compatible with the child's temperament, the child can be well adjusted and, therefore, academically and behaviorally competent and more likely to succeed. Therefore, identifying children's temperaments' profile at an early age so that appropriate modifications of the classroom environment can occur is necessary. International data have also indicated that children at-risk exist in all parts of the world and that these children almost always encounter obstacles to adequate educational opportunity. For instance, in many Middle Eastern and African countries children at-risk may be denied opportunities to learn or may be provided with low equality education and exposed to social stigmas (UNESCO, 2010). In Germany and England children at-risk are usually from immigrant backgrounds and/or have a low socioeconomic status (Dyson & Gallannaugh, 2008; Werning, Löser, & Urban, 2008).
This research examined temperament in children at-risk, who were primarily African Americans with low income/poverty and/or disability. The purpose of this study was to identify individual differences in temperament and assess their relationship to positive school outcomes for children at-risk. Specifically, we examined children's temperament traits that are associated with and predict school adjustment and academic achievement for children at-risk. Three research questions were investigated to determine the concurrent and predictive relationships between children's temperament, school adjustment, and academic achievement for children at-risk. The research questions were as follows: 1. What is the relationship between the four dimensions of temperament (inhibition, persistence, negative emotionality, and activity level), school adjustment, and academic achievement among children at-risk? 2. To what extent do these four dimensions of temperament explain variations in concurrent school adjustment and academic achievement among children at-risk? 3. Do temperament differences exist between boys and girls with regards to academic achievement and school adjustment?
66
INTERNATIONAL JOURNAL OF SPECIAL EDUCATION Vol 27, No: 2, 2012
MethodParticipantsThe participants in this study were 77 children who were eligible for Title I, special education, and/or homeless education. The sample consisted of 42 (54.5%) boys and 35 (45.5%) girls; their ages ranged from five to eleven years. The risk groups included 49 (64%) who were economically disadvantaged, ten (13%) who had developmental delays, and 18 (23%) who had both economic disadvantage and developmental delay. The majority of the children were African Americans 57 (74%); 13 (16.9%) were Caucasians; five (6.5%) were Hispanic; and 2 (2.6%) were other. The children were identified as being at risk based on school system data that included their eligibility for specific educational programs, i.e., Title 1 (based on low family income), Special Education (based on identified disabilities), and/or Homeless Education (based on instability of family housing). Risk group eligibility was determined based on categorical risk related programs as identified by Virginia Department of Education regulations and local education agencies' policies.
MeasuresThe Temperament Assessment Battery for Children -Revised (TABC-R; Martin & Bridger, 1999). The TABC-R was designed to assess four temperament traits of children and contains both parent and teacher forms. The current study used the teacher form of the TABC-R, which includes 29 items describing behaviors reflective of four dimensions of temperament: Activity Level, Inhibition, Negative Emotionality, and Task Persistence. The inhibition scale assesses the child’s tendency to physically withdraw or to become emotionally upset when in an unfamiliar social situation. The negative emotionality scale measures individual differences in the tendency for children to become emotionally upset. For example, it shows whether the child cries, screams, or subtly expresses upset emotions such as by an angry look or a frowning face (Martin & Bridger, 1999). The activity level scale assesses the child’s energetic gross motor activity, such as active/quiet play and difficulty/ease of controlling gross motor activity to complete a task. The task persistence scale measures attention and the ability to continue a task that is difficult. A high score on each scale is indicative of a high tendency toward negative behavior. Specifically, a high score on the inhibition scale indicates a high tendency to withdraw and feel stressed, a high score on negative emotionality is indicative of intense emotional expression, and a high score on the task persistence scale indicates a short attention span and a low ability to continue a difficult task (Martin & Bridger, 1999).
The Likert-type ratings that were used are based on the frequency of behaviors for individual children (1 = ‘hardly ever’ through 7 = ‘almost always’). The items that were used represent bipolar aspects of temperament dimensions (e.g., high and low activity levels). Temperament dimension raw scores were calculated for the students based on the factor analyses and scoring procedures outlined in the most recent TABC-R manual (Martin & Bridger, 1999).
The Adaptive Skills Scale of the Behavior Assessment System for Children-Teacher Rating Scales (BASC-TRS) (Reynolds & Kamphaus, 1992). The BASC-TRS is a multidimensional measure that assesses aspects of personality, behavioral function, externalizing, internalizing problems and adaptive skills. For the purpose of this study, only the adaptive scale was employed to measure school adjustment. The adaptive scale measures positive behaviors of children from preschool to adolescence, using three different forms for three age levels: preschool ages from four to five, child ages from six to eleven, and adolescent ages from twelve to eighteen. For the purpose of this study the version that measures children’s age from six to eleven was used. The adaptive skills scales used four indicators (a) the adaptability scale assesses the ability to adjust to changes in routine, tasks, people, and situations, (b) the social skills scale assesses individual prosocial behaviors such as helping and/or complementing others, and admitting mistakes, (c) the leadership scale measures behaviors that may be associated with leadership potential, such as participating in extracurricular activities, and (d) the study skills scale relates to learning and academic behavior skills, such as completing homework (Reynolds & Kamphaus, 1992). High scores on those scales indicate positive or desirable behaviors. Teachers were asked to rate the children on a four point scale ranging from Never to Almost Always. The BASC-TRS provides three different norm samples for scoring: general norms, female and male norms, and clinical norms. For this study, the general norms scoring was employed because these were normalized using large populations of United States children across wide categories of gender, race/ethnicity, and clinical or special education needs (Reynolds & Kamphaus, 1992).
67
INTERNATIONAL JOURNAL OF SPECIAL EDUCATION Vol 27, No: 2, 2012
Academic achievement measure. Data on children's academic achievement was gathered by asking the teacher to rate the children on a four point scale: failing, below average, average, or above average in the following core subjects: reading or language arts, math, science, and social studies. Scoring for each question ranged from failing = 1, to above average = 4. Subsequently, a total academic achievement score was calculated by summing a child's score in all the subjects. This total academic achievement score was used in the statistical analyses and throughout this study to indicate academic achievement. Academic Achievement is defined as the academic performance of students in specific subject matters (reading or language arts, math, science, and social studies).
ProceduresWith the approval of school administrators, the current teachers of these children were asked to participate in this study. Of those contacted, 72 teachers agreed to participate by completing the TABC-R rating scale, the Adaptive Skills Scale, and the academic achievement rating for a total of 77 children in their public school classrooms. The classroom teachers completed the ratings during a two to three week period. The data collection procedures were conducted in the second semester of the school year in order to allow sufficient time for the teachers to get to know the children and to have sufficient interactions with them in order for the teachers to be able to provide credible information about the children’s temperaments and their academic and social behaviors.
DesignThis study employed a non-experimental correlational design to examine the concurrent and predictive relationships between four dimensions of temperament (inhibition, persistence, negative emotionality, and activity level), and two educational outcomes (school adjustment and academic achievement). Two statistical analyses were used to address the research questions: bivariate correlations and multiple regressions.
ResultsTable 1 presents the means and standard deviations for the predictive variables. For the outcome variables, the academic achievement scores of the participants ranged from 4 to 16 (M = 10.18, SD = 3.14) indicating an average achievement across all subjects of a below average grade. The adaptive skills ranged from 43 to 148 (M = 80.62, SD = 23.43) indicating that the children had inadequate skills on adaptability, study skills, social skills, and leadership skills. Both means indicate low adaptive skills and low levels of academic achievement. These results were expected as at-risk children have been shown to have adjustment difficulties and achievement problems (Hamre & Pianta, 2005; Edwards et al., 2007). Additionally, means and standard deviations were obtained by gender for the examined variables. Only activity level was found to be higher in boys than in girls (M = 17.98, SD = 4.06) and (M = 15.80, SD = 4.58), respectively. All other temperament dimensions showed no significant differences between the girls and boys.
Table 1. Means and Standard Deviations of the TABC scaleTABC Scale Mean Standard Deviation
Inhibition 36.60 9.96
Persistence
29.86 9.62
Negative Emotionality 31.04 10.87
Activity Level 16.99 4.41
Note. N = 77.
Table 2 shows that negative emotionality had a significant correlation with adaptive skills (r = -.23, p < .05). When correlations were performed by gender, adaptive skills significantly correlated for girls with negative emotionality, persistence, and activity level. No significant correlations were found for boys.
68
INTERNATIONAL JOURNAL OF SPECIAL EDUCATION Vol 27, No: 2, 2012
Table 2. Correlations between TABC Scale and the Adaptive Skills for the Total Sample and by Gender
TABC Scale
Adaptive Skills Inhibition Negative Emotionality
Persistence Activity Level
Total -.18 -.23* .22 -.19
Boys -.09 .06 -.01 .26
Girls -.25 -.46** .38* -.52**
Note. N = 77 (Boys = 42; Girls = 35).* p < .05, ** p < .01.
Table 3 shows that persistence (r = .31, p < .01) and activity level (r = -.27, p < .05) were found to have significant relationships with academic achievement. Three significant correlations were found for girls: negative emotionality, persistence, and activity level (r = .39, .42, ps < .05) and (r = -.62, p < .01), respectively.
Table 3. Correlation Coefficients between TABC Scale and Academic Achievement for the Total Sample and by Gender
TABC Scale
Achievement Inhibition Negative Emotionality Persistence Activity Level
Total -.10 -.12 .31** -.27*
Boys .06 .13 .19 .08
Girls -.30 -.39* .42* -.62**
Note. N = 77 (Boys = 39; Girls = 33).* p < .05, ** p < .01.
Two stepwise multiple regression analyses were performed to examine the predictive relationships. The first was for the academic achievement score against the four temperament dimension scores, and the second was for the adaptive skills against the four temperament dimensions. Prior to conducting these procedures, the assumptions relating to these analyses were checked for multicollinearity and for linear relationships between the predictors and the outcome variables. The results indicated the presence of linear relationships between the variables and detected no multicollinearity problems.
Table 4 shows that persistence was the only predictor which entered the first regression model for academic achievement against the four temperament dimensions; it had a statistically significant direct influence on academic achievement, accounting for 9.8% of the variance (R2 = .098, adjusted R2 = .085, p < .01). The remaining variables (inhibition, negative emotionality, and activity level) failed to significantly predict academic achievement.
Table 4. Stepwise Multiple Regression for TABC Scale Predicting Academic Achievement
TABC Scale B Standard Error of B β
Persistence 2.95 1.07 .314
Note: N = 72, R2 = .098, adjusted R2 = .085, p < .01.
69
INTERNATIONAL JOURNAL OF SPECIAL EDUCATION Vol 27, No: 2, 2012
Table 5 shows that negative emotionality was the only predictor which entered the regression model in the second stepwise regression in which adaptive skills were regressed against the four temperament variables; it had a statistically significant direct influence on the adaptive skills scale, accounting for 5.3% of the variance (R2 = .053, adjusted R2 = .040, p < .05).
Table 5. Stepwise Multiple Regression for TABC Scale Predicting School AdjustmentTABC Scale B Standard Error of B β
Negative Emotionality -.006 .003 -.230
Note. N = 77, R2 = .053, adjusted R2 = .040, p < .05.
DiscussionThe aim of this study was to investigate the concurrent and predictive relationships between temperament, school adjustment, and academic achievement. In this study, we examined children from low income families, minorities, and/or children with disabilities; the majority of the participants were African Americans. Three major findings were consistent with previous research, which has primarily examined middle class children (Blair et al., 2004; Liew et al., 2004; Martin et al., 1988). First, significant relationships were found for both areas of interest, school adjustment and academic achievement, in relation to children's temperament. Second, the magnitude of the relationships primarily fell within a weak to moderate range. Third, negative emotionality and persistence were found to be the most significant and predictive variables for school adjustment and academic achievement, respectively.
Temperament and School AdjustmentTemperament was found to have a significant association with school adjustment. Specifically, negative emotionality had a significant negative correlation (r = -.23, p < .05) with school adjustment. This level of correlation is considered weak. The findings of this study are in line with previous research (Blair et al., 2004; Liew et al., 2004). This finding of the influence of negative emotionality on school adjustment is expected because a child with negative emotionality can present a challenge in social situations such as the classroom. According to Martin and Bridger (1999), negative emotionality is the most single predictive temperament trait for negative social outcomes and is often associated with externalizing and internalizing behaviors. Children with this temperament are more likely to exhibit inappropriate behaviors and have difficulty regulating their emotions in ways that would allow them to adhere to the demands of the classroom environment. Such classroom demands often require some level of regulation of emotion and the ability to delay the fulfillment of individual desires, both of which may be difficult for children with higher negative emotionality.
Temperament and Academic AchievementSimilar to the findings about school adjustment in relation to temperament, the results of the influence of temperament on academic achievement were found to be consistent with those found in previous research (Bramlett et al., 2000; Li et al., 2009; Martin et al., 1988; Martin & Holbrook, 1985). Significant associations were found between temperament and academic achievement. Specifically, persistence and activity level were significantly correlated with academic achievement at r = .31, p < .01 and r = -.27, p < .05, respectively, yet both correlations are considered weak. Persistence was found to be the only predictor of academic achievement, accounting for 9.8% of the variance (R2 = .098, adjusted R2 = .085, p < .01). Both persistence and activity level can be expected to have significant relationships with academic achievement because achievement in the academic realm requires a child's attention as well as his/her ability to continue in a task that is difficult. In addition, academic success requires that a child be able to control their gross motor activity so that they can sit still to complete a task. Research has indicated that the abilities to focus attention, persist at tasks, and regulate emotions are essential for healthy development and academic success (Kerns, Esso, & Thompson, 1999; Semrud-Clikeman, Nielsen, & Clinton, 1999). Children at-risk who can self-regulate their emotions and behaviors have higher scores in reading, math and vocabulary (McClelland et al., 2007).
Temperament and gender. Differences based on gender were found in this study, as described in the results section. Gender differences have been found across countries and cultures, with boys rated with higher levels of activity, impulsivity, emotional intensity, and lower levels of shyness (Blair et al., 2004;
70
INTERNATIONAL JOURNAL OF SPECIAL EDUCATION Vol 27, No: 2, 2012
Nelson et al., 1999; Prior et al., 2001; Whiting & Edwards, 1988). The significant correlations that were found for girls may be explained by common perceptions about gender differences, which have also been supported by empirical research. Girls are rated higher in effortful control skills than boys as well as higher in social competence and adjustment (Liew et al., 2004). Girls have also been rated higher in cooperative behavior, peer liking, and positive school attitudes (Chen et al., 2009). As a result, teachers may be more tolerant of boys with high levels of activity and negative emotionality; therefore those behaviors may go unnoticed when boys exhibit them and may be considered within the normal acceptable range. If a girl, on the other hand, displays similar tendencies toward hyperactivity and negative emotionality, the teacher may easily notice it and consider it to be unacceptable behavior.
Implications for Practice This study investigates research into children's individual differences in temperament, specifically for children at-risk, including those with family poverty, low income, and/or disabilities. Our results indicate that certain temperament traits can have a positive or a negative association with children's educational outcomes. For educational practitioners, therefore, a knowledge of a child's temperament is essential. Practitioners must understand that children's behaviors have biologically-based, individual differences which appear in their behavioral patterns. These behavioral patterns vary from one child to another, but even some extreme patterns may be considered to be within the normal range. This understanding increases awareness of the fact that not all inappropriate behaviors indicate disorders. Practitioners also need to understand that variations in temperament are characteristic of children, including those with disabilities (Gosling et al., 2003). A child with a disorder can display a range of temperament characteristics, and no single temperament profile exists for all children with disabilities. Practitioners’ awareness of individual differences in children’s temperament may help them understand that the same environment will be experienced differently by children based on their individual differences in temperament characteristics (Rothbart, Ahadi, & Hershey, 1994). For example, some children will be more easily overwhelmed by intense levels of stimulation, such as noise or fast paced activities, than others. The resulting feeling of discomfort during classroom instruction can influence engagement and learning. Children with a positive affect, however, may become excited about upcoming positive events and engage in learning and classroom activities more than children with other temperament dimensions (Rothbart & Jones, 1998). Temperament-based behaviors and interactions can also form the basis for children's affective memories and evaluations of the classroom. Accordingly, children will perceive and evaluate teacher behaviors based on their own personal appraisal, so that some children will be tuned into their teacher's cues about discipline, whereas others may fail to interpret these correctly and as a result may miss the point of what the teacher is saying and doing (Rothbart & Jones, 1998). Finally, teachers' perceptions about the teachable child must be revised based on their understanding of their students’ temperaments. Teachers tend to have certain ideas about what constitutes a teachable child. However, an understanding of the goodness of fit concept that undesirable behavior, such as possessing a high level of activity or negative emotionality, can be controlled with modifications in the classroom's demands and can lead to successful learning. A child who is high in persistence can present difficulties for the teacher, peers, and classroom management, as this child is more likely to have difficulty switching between tasks and transitioning from one lesson to another. Such a child can easily be frustrated if he has to stop a task that he wants to complete. This child may act out as a result of his frustration or may become anxious in the classroom. Therefore, a sensitive teacher may select an activity that requires a shorter time to complete when there is a need for transitioning. In this way, knowledge of the influence that a child’s temperament may bring into the classroom should be embedded in teacher education and preparation programs.
Directions for Future ResearchRecommendation for future research stem from the fact that this study, as well as previous studies, employed a correlational research design. The findings of this type of study are descriptive in nature; they do not report functional relationships and only allow causal inferences. Therefore multiple research designs are needed, especially ones that examine other possibly contributing variables, such as the role of classroom context, including teacher behavior (e.g., praise, reprimands), instructional strategies, and/or difficulty/ease of tasks, or any interactions between those variables. Second, an attempt was made to obtain data from various information sources (parents, students, school records). However, the participating school systems restricted the researchers’ access to only the children’s teachers, and that was based on principal and teacher consent. Therefore, the limited sources of information as well as the methods that were used to measure the examined variables may have influenced the results. Third, identifying the profile of children's temperaments can be most effective if it is integrated into other educational interventions. That is, re-evaluating educational interventions in light of individual
71
INTERNATIONAL JOURNAL OF SPECIAL EDUCATION Vol 27, No: 2, 2012
differences in temperament may be able to contribute to some of the unexplained variations in their results. Individual differences in temperament can direct the selection of interventions based on children's individual differences and their needs.Information about a child’s temperament profile is useful for prevention and intervention approaches that promote goodness of fit for each child in the classroom. Future studies should address areas such as helping the child understand his/her own responses to various experiences, and providing teachers with strategies for changing the environmental demands to more effectively accommodate children’s individual differences (Reed-Victor, 2004). Future studies should also address the cultural context of children’s temperament and the role of the interaction between the child and the environment. Exploring children’s temperaments within various cultural contexts is essential. For example, inhibition is a temperament’s dimension which has been shown in the US and western culture to have a negative influence on a child’s adjustment and achievement. However, research has shown that these negative effects that inhibition may present to a western child do not necessarily apply to Chinese children (Chen et al., 2009). Inhibited Chinese children were found to have a higher level of academic achievement and a higher level of school adjustment. Examining the role of the interaction between children’s temperament and the classroom environment can help in understanding factors in the classroom environment that can promote positive temperament qualities which are associated with good adjustment and learning and factors that can minimize the effects of negative temperament qualities (Putnam, Sanson, & Rothbart, 2002).
In conclusion, temperament can be a biological risk factor that can add additional stressors or can be a protective factor that can either increase or minimize the negative effects of other risks that a child at-risk may have. An understanding of children’s temperaments is necessary if the teacher is to provide a classroom environment that is compatible with that temperament. The environment should work with, not against, the child's temperament (Kristal, 2005). If goodness of fit (Thomas & Chess, 1977) exists between the demands and expectations of the environment and a child's temperament, healthy development is likely to occur (Kristal, 2005). Although the findings of this study were in line with previous studies that examined children's temperaments for predominant, middle class groups, this study helps to pinpoint the particular need for temperament evaluations in at-risk children early in their school career.
ReferencesBlair, K. A., Denham, S. A., Kochanoff, A., & Whipple, B. (2004). Playing it cool: Temperament, emotion regulation, and social behavior in preschoolers. Journal of School Psychology, 42, 419-443.Bouffard, T., Roy, M., Vezeau, C. (2005). Self-perceptions, temperament, socioemotional adjustment and the perceptions of parental support of chronically underachieving children. International Journal of Educational Research, 43, 215-235.Bramlett, R. K., Scott, P., & Rowell, R. K. (2000). A comparison of temperament and social skills in predicting academic performance in first graders. Special Services in the Schools, 16, 147-158.Bruni, O., Ferini-Strambi, L., Russo, P. M., Antignani, M., Innocenzi, M., Ottaviano, P., Valente, D., & Ottaviano, S. (2006). Sleep disturbances and teacher ratings of school achievement and temperament in children. Sleep Medicine, 7, 43-48.Chen, X., Chen, H., Li, D., & Wang, L. (2009). Early childhood behavioral inhibition and social and school adjustment in Chinese children: A 5- year longitudinal study, Child Development, 80(6), 1692-1704.Coplan, R. J., Bowker, A., & Cooper, S. M. (2003). Parenting daily hassles, child temperament and social adjustment in preschool. Early Childhood Research Quarterly, 18, 376-395.Deater-Deckard, K., Mullineaux, P., Petrill, S. A., & Thompson, L. A. (2009). Effortful control, surgency, and reading skills in middle childhood. Reading and Writing, 22, 107-116.Dyson, A. & Gallannaugh, F. (2008). Disproportionality in special needs education in England The Journal of Special Education, 42, 26-46. Edwards, O. W., Mumford, V. E., & Serra-Roldan, R. (2007). A positive youth development model for students considered at-risk. School Psychology International, 28, 29-45.Goldsmith, H. H., Buss, A. H., Plomin, R., Rothbart, M. K., Thomas, A., Chess, S., Hinde, R., & McCall, R. (1987). Roundtable: What is temperament? Four approaches. Child Development, 58, 505-529.Guerin, D. W., Gottfried, A. W., Oliver, P. H., Thomas, C. W. (1994). Temperament and school functioning during early adolescence. Journal of Early Adolescence, 14, 200-225.Hamre, B. K., & Pianta, R. C. (2005). Can instructional and emotional support in the first grade classroom make a difference for children at risk of school failure? Child Development, 76, 949-967.
72
INTERNATIONAL JOURNAL OF SPECIAL EDUCATION Vol 27, No: 2, 2012
Keogh, B. K. (2003). Temperament in the classroom: Understanding individual differences. Baltimore: MD: Paul H. Brookes.Keogh, B. K., Pullis, M. E. & Cadwell, J. (1982). A short form of the teacher temperament questionnaire. Journal of Educational Measurement, 19(4), 323-327.Kerns, K. A., Esso, K., & Thompson, J. (1999). Investigation of a direct intervention for improving attention in young children with ADHD. Developmental Neuropsychology, 16, 273-295.Kristal, J. (2005). The Temperament Perspective: Working with Children's Behavioral Styles. Baltimore: Brookes.Lerner, J.W., Lowenthal, B., & Egan, R.W. (2003). Preschool children with special needs: Children at risk and children with disabilities. (2nd ed.). Boston: Allyn and Bacon.Li, I., Onaga, E., Shen, P. S., & Chiou, H. H. (2009). Temperament characteristics and science achievement: A longitudinal study of elementary students in Taiwan. International Journal of Science Education, 31, 1175-1185. Liew, J., Eisenberg, N., & Reiser, M. (2004). Preschoolers’ effortful control and negative emotionality, immediate reactions to disappointment, and quality of social functioning. Journal of Experimental Child Psychology, 89, 298–313.Martin, R. P., & Bridger, R. C. (1999). The Temperament Assessment Battery for Children-Revised. Athens: University of Georgia. Martin, R. P., & Holbrook, J. (1985). Relationship of temperament characteristics to the academic achievement of first grade children. Journal of Psychoeducational Assessment, 3, 131-140.Martin, R. P., Drew, D., Gaddis, L., & Moseley, M. (1988). Prediction of elementary school achievement from preschool temperament: Three studies. School Psychology Review, 17, 125–137. McClelland, M. M., Cameron, C. E., Connor, C. M., Farris, C. L., Jewkes, A. M., & Morrison, F. J. (2007). Links between behavioral regulation and preschoolers’ literacy, vocabulary, and math skills. Developmental Psychology, 43, 947-959.Mevarech, Z. R. (1985). The relationships between temperament characteristics, intelligence, task-engagement and mathematics achievement. British Journal of EducationalPsychology, 55, 156–163.Nelson, J. N. (1987). Child temperament, gender and teacher-child interactions: An observational study. Early Child Development and Care, 29, 343-365. Nelson, B., Martin, R. P., Hodge, S., Havill, V. & Kamphus, R. (1999) Modeling the prediction of elementary school adjustment from preschool temperament, Personality and Individual Differences, 26, 687–700. Newman, J., Noel, A., Chen, R., & Matsopoulos, A. S. (1998). Temperament, selected moderating variables and early reading achievement. Journal of School Psychology, 36, 215–232.Prior, M., Smart, D., Sanson, A., & Oberklaid, F. (2001). Longitudinal predictors of behavioural adjustment in pre-adolescent children. Australian and New Zealand Journal of Psychiatry, 35, 297-307.Pullis, M. & Cadwell, J. (1982). The influence of children's temperament characteristics on teachers' decision strategies. American Educational Research Journal, 19(2), 165-181.Reed-Victor, E. (2004). Individual differences and early school adjustment: teacher appraisals ofyoung children with special needs. Early Child Development and Care, 174, 59–79.Reynolds, C. R., & Kamphaus, R. W. (1992). The Behavior Assessment System for Children. Manual. Minnesota: American Guidance Service.Rothbart, M. K., & Derryberry, D. (1981). Development of individual differences in temperament. In M. E. Lamb & A. L. Brown (Eds), Advances in developmental psychology (Vol. I, pp. 37-86). Hillsdale, N. J.: Erlbaum. Sanson, A. V., Letcher, P., Smart, D., Prior, M., Toumbourou, J. W., & Oberklaid, F (2009). Associations between early childhood temperament clusters and later psychosocial adjustment. Merrill Palmer Quarterly, 55(1), 26-54.Semrud-Clikeman, M., Nielsen, K. H., & Clinton, A. (1999). An intervention approach for children with teacher and parent-identified attentional difficulties. Journal of Learning Disabilities, 32, 581–589.Thomas, A., & Chess, S. (1977). Temperament and Development. New York: Brunner-Mazel.UNESCO (2010). Reaching the marginalized. Retrieved from http://www.unesco.org/fileadmin/MULTIMEDIA/HQ/ED/GMR/pdf/gmr2010/gmr2010-ch3.pdfWerner, E. E. (2000). Protective factors and individual resilience. In J. P. Shonkoff & S. J. Meisels (Eds.), Handbook of early childhood intervention (2nd ed., pp. 115-132). New York: Cambridge University Press.Werning, R., Löser, J.M. & Urban, M. (2008). Cultural and social diversity: an analysis of minority groups in German schools. The Journal of Special Education, 42, 47-54.
73
INTERNATIONAL JOURNAL OF SPECIAL EDUCATION Vol 27, No: 2, 2012
Whiting, B. B. & Edwards, C. P. (1988). Children of different worlds: The formation of social behavior. Cambridge, MA: Harvard University Press. Williams Institute.Zentner, M. & Bates, J. E. (2008). Child Temperament: An integrative review of concepts, research programs, and measures. European Journal of Developmental Science, 2, 7-37.
INCLUDING STUDENTS WITH DISABILITIES IN UAE SCHOOLS: A DESCRIPTIVE STUDY
Nisreen M. AnatiAl Ain
University of Science and Technology
The United Arab Emirates is devoted to inclusive education, which respects the right for all learners, regardless of their strengths or weaknesses in any area, to become part of the mainstream school. This study describes the current practices that shape the nature of inclusive education in UAE schools from the teachers’ perspective. Data drawn from the questionnaire that was directed to 26 teachers in UAE private and public schools indicated that such teachers were concerned about inclusive education in their schools. Teachers’ dissatisfaction was due to a lack of qualified special education professionals to deal with students with disabilities, a lack of proper training for teachers in mainstream classrooms, a lack of knowledge about inclusion among senior-level administrators, a lack of financial support for resources and services specifically in private schools, and a lack of awareness of the inclusion issues that students with and without disabilities may face in inclusive settings.
The entire structure of special education services has been undergoing significant change over the past 20 years in the UAE. Globally, several laws have been issued across different countries in the world to maximize the participation of students with disabilities in mainstream schools (Salend, 2005). However, special needs educators had never reached to an agreement on the extent and nature of including students with disabilities in mainstream schools. Three major beliefs were proposed as a result of this debate among educators to include students with disabilities in mainstream schools: restricted belief (resists inclusion); least restricted belief (allows inclusion under certain conditions); unrestricted belief (accepts inclusion with no or few restrictions), (Friend & Bursuck, 2002).
Many educators questioned the belief that students who needed extra services should routinely be pulled out to receive them in a separate environment such as a resource room or a special education classroom (Stanovich, 1999; Salend & Duhaney, 1999; Wladron & McLeskey, 1998). They stressed that pull-out services are stigmatizing and cause fragmentation of learning (Friend & Bursuck, 2002). Some educators argue that it is extremely feasible to provide almost all necessary supports for students with disabilities in general classrooms when teachers and school professionals are effectively trained and well prepared to work with such students and related concerns are tackled (Pearman, Haung, & Mellblom, 1997). As a result of this belief, the inclusion philosophy was proposed by such educators as an alternative for the mainstreaming assumption which hypothesizes that settings determine the quality and quantity of services. According to Friend and Bursuck (2002), inclusion stands for the philosophy that students with disabilities should be fully integrated into general education classrooms as long as they are making progress toward the achievement of IEP goals, even if they cannot meet classroom or content demands (p.4). Some educators such as Ryan and Paterna, (1997) and Wilson, (1999) added that inclusion comprises physical integration, placing students with disabilities in the same classroom as non-disabled
74

INTERNATIONAL JOURNAL OF SPECIAL EDUCATION Vol 27, No: 2, 2012
peers; social integration, nurturing student relationships with peers and adults; and instructional integration, teaching students based on their needs and not on a predetermined set of curricular standards (as cited in Friend & Bursuck, 2002, p. 4)
Proponents of inclusion such as Schattman and Benay (1992) found that students with disabilities in an inclusionary setting are exposed to talented teachers, refine new social relationships with the same-age peer group, and experience more quality programs in a regular education classroom. Stainback and Stainback (1990) concluded that inclusion is an appropriate instructional model because students with disabilities are accepted and supported by their peers and other members of the school community while having their educational needs met.
On the other hand, there are some educators who are concerned about inclusion. They argue that students with disabilities involved in inclusionary teams make small and moderate gains in academic and social settings. Teacher time is taken away from the other students in the inclusive classroom. Some teachers lack the training, resources and other necessary supports to teach students with disabilities. Teachers have to take more time when planning lessons in order to adapt the lesson to the student or students with special needs (Baker, Wang, & Walberg, 1995; Cohen, 1994; Tornillo, 1994; Lieberman, 1992). Opponents of inclusion further noted that classroom management is harder because of the addition of more students, students with disabilities were monopolizing an inordinate amount of time and resources and, in some cases, creating violent classroom environments (Sklaroff, 1994, p. 7). One additional concern is that students with disabilities may not feel comfortable because they feel that they are different from other students (Sklaroff, 1994).
Stronger concern about and resistance to inclusion has been raised by Skrtic (1991). He argued that special education system emerged precisely because of the non-adaptability of regular classrooms and that, since nothing has happened to make contemporary classrooms any more adaptable ..., [inclusion] most likely will lead to rediscovering the need for a separate system in the future (p. 160).
Both opponents and proponents of inclusion can find convincing research to support their respective views. Today many research studies exist to show positive and negative results for both special and general education students, including academic and social benefits and consequences. Currently, the philosophy of inclusion appears to be debatable; some are in agreement with this educational philosophy (e.g., Schattman & Benay, 1992; Stainback & Stainback, 1990; Friend & Bursuck, 2002) and others are against it (e.g., Skrtic, 1991; Sklaroff, 1994; Baker, Wang, & Walberg, 1995; Cohen, 1994; Tornillo, 1994; Lieberman, 1992). It is up to the country’s legislation to support or oppose the practice. If the country is in agreement with the values and merits of inclusion, then it will facilitate the process of implementing it across its schools by providing the necessary support needed for the establishment of efficient inclusion.
Teachers’ attitudes toward inclusion and students with disabilities were found to be a critical factor in inclusive practices (Salend, 2005; Friend & Bursuck, 2002; Bender et al., 1995; Scruggs & Mastropieri, 1996). However, the findings from previous studies have been mixed. El-Ashry (2009) reviewed several studies that identified teachers’ attitudes toward inclusion, and then he classified their attitudes into three groups; negative, positive, and neutral:Some researchers have found that general education teachers were not in favor of inclusion (Coates, 1989; Gersten, Walker, & Darch, 1988; Larrivee & Cook, 1979; Semmel, Abernathy, Butera, & Lesar, 1991). Similarly, in their 1996 review, Scruggs and Mastropieri found that ten studies, only 33% of general education teachers agreed that the general education classroom was the best social or academic placement for students with disabilities, although about two thirds of the participants supported the concept of inclusion. On the other hand, other researchers reported that teachers had more positive attitudes toward inclusion (Avramidis et al., 2000a; Villa, Thousand, Meyers, & Navin, 1996; Ward et al., 1994; York, Vandercock, MacDonald, Heise-Neff, & Caughey, 1992). In addition, few researchers reported that teachers had uncertain or neutral attitudes (Bennett, Deluca, & Bruns, 1997; Leyser & Tappendorf, 2001) (p. 23).
Generally speaking, inclusion protects students’ human right to be educated with peers, maximize the potential of most students, and is the ultimate goal whenever possible. Later in this section, the issue of including students with disabilities in mainstream schools will be addressed from the United Arab Emirates’ perspective.
75
INTERNATIONAL JOURNAL OF SPECIAL EDUCATION Vol 27, No: 2, 2012
According to the UAE Ministry of Education, the development of education in the UAE started effectively in 1962, where the number of schools then was barely 20 schools, in which less than 4000 students studied, mostly male students (2011, Para. 1). Upon the exploration of Oil and the beginning of development, the UAE focused a lot of attention on education. The country sat a plan to raise the rate of nationals in the educational sector into 90% by the year 2020. Several departments were established to ensure the right of education for all without discrimination; women, adults, young youths, and students with special needs are welcomed in the UAE schools. Consequently, a special department was established in the Ministry of Education to cater for children with special needs, to empower them for positive contributions to their communities. This department started to record some success such as: The establishment of a special farm runs completely by a group of physically challenged students. The farm was called Zayed Agricultural Center for the challenged (Ministry of Education, 2011, Education in UAE, para. 15). The project received huge attention and praise on an international level.
The United Arab Emirates (UAE) has always been keen to provide all means of comprehensive welfare for people with special needs in the field of education. Federal Law No. (29) of 2006 is the first law to be issued in UAE to protect the rights of people with special needs (Abu Dhabi Government, 2011, para. 1). The UAE Ministry of Education released a School for All or General Rules for the Provision of Special Education Programs and Services guidebook in 2010 in collaboration with the UAE Ministry of Social Affairs, with information and rules about special needs education in the UAE. The handbook also includes certain sections about the country’s vision toward the inclusion philosophy. Particularly, article 13 of the same law (Law No. 29 of 2006) comes in agreement with educators’ principles of effective inclusion. It emphasized that the UAE Ministry of Education shall be committed to secure the complete participation of students having disabilities in mainstream schools (Abu Dhabi.ae, 2011a). According to the UAE Minister of Education, Inclusive education means that all students in a school, regardless of their strengths or weaknesses in any area, become part of the school community (Hassan, 2008, p.8).
Although there are several supportive attempts that are made to promote effective inclusive education in the UAE schools, there are some challenges that are in the way. My contact with teachers in inclusive schools indicated that such teachers bemoan the fact that their schools and staff were not ready yet to include students with disabilities. Consequently, it became my goal to conduct this study to describe the experiences and perspectives of a sample of UAE teachers towards the inclusive education in the country. Another goal was to highlight the current practices that are shaping the process of inclusive education in UAE.
Over the past few years, a great number of students with disabilities were integrated into public and private schools, as well as in nurseries throughout the UAE. In a major renovation of special education policy, the Ministry of Education published that it is to develop special needs programs in 110 public schools (Lewis & Shaheen, 2010, para. 1). Private schools will also be required to accept children with mild and moderate disabilities, though they will be permitted to charge higher fees to fund the development of their own special education programs. The General Secretariat Executive Council Emirate of Abu Dhabi reported that many students from Abu Dhabi Rehabilitation and Care Center for People with disabilities have been integrated into public schools this year [2010] in addition to 23 students who had no previous schooling…In addition, 15 students have been integrated into higher education institutions (Lewis & Shaheen, 2010). It was posted on ADEC’s official website on 1/3/2010 a total of 173 students with special needs have been integrated into Abu Dhabi’s mainstream schools (Tahnoon, 2011, para. 5). The available data indicated that the number of inclusive schools in the country is increasing.
It is important to mention here that the governmental (public) schools are free for citizens and compulsory for students aged 6–12. Non-UAE nationals may attend governmental schools as fee-paying students. Governmental schools are gender-segregated, but private schools are co-educational. It is worth mentioning here also that the UAE Ministry of Education is responsible for all levels of government schooling, as well as supervision of the private sector. Private schools at all levels must be licensed by the Ministry and their programs accredited. About 25% of total government expenditure is directed towards education. There is also a large network of private schools operating at all levels on a fee-paying basis (Abu Dahbi.ae, 2011b).
MethodParticipants
76
INTERNATIONAL JOURNAL OF SPECIAL EDUCATION Vol 27, No: 2, 2012
The study targeted 26 teachers in 26 schools; this sample represents 30 % of the total number of inclusive schools in Abu Dhabi, UAE. All teachers in the inclusive schools received a letter from the researcher to invite them to participate in the study. The sample was randomly selected from the list of those who positively responded to the invitation. The majority of the teachers and students in these schools were Muslim-Arabs with diverse socioeconomic status.
Teachers. The sample included 26 teachers in 26 inclusive schools in UAE. An application had been submitted to Abu Dhabi Education Council (ADEC), UAE to allow me to carry out a survey of teachers who teach in inclusive settings. An IRB approval was obtained from ADEC to survey teachers in any of the participant schools. The Council also sent a memo to all participant schools to cooperate with the researcher upon request. Teachers were invited to contact me if they were interested in participating. Teachers were assured that participation was voluntary, and they signed consent forms. No incentives were offered. All expect two teachers in this sample were Muslim-Arabs, Arabic was their first language and English was their second language. Only two teachers were Americans with English tongue.
Schools. The sample included 26 randomly selected governmental (public) and private schools (9 private and 17 governmental) across all cycles (elementary, preparatory, and secondary). The sample, unintentionally, included six female schools, ten male schools, and ten co-educational schools.
InstrumentThe researcher created a bilingual English-Arabic survey to target teachers who were involved in teaching students with disabilities in UAE inclusive schools. The participant teachers would select the language of their preference. The responses expected were identical for both languages. The survey began with five general questions to gather information about the participant schools (e.g., school’s name; location; sector (public/private); level (elementary, preparatory, secondary); and category (male, female, co-educational). Section two of the survey asked eight general questions about inclusion in UAE schools. Each question had a stem that started with the statement Place a tick next to…, and each question was followed by a number of choices to select from. All the questions ended with this choice: Other, this option was included to allow the respondents to add any further items if they needed so. The following were the stems of the questions included in the survey: (a) Place a tick next to the kinds of disabilities that the students in your school have; (b) Place a tick next to the inclusion services that are implemented in your school; (c) Place a tick next to the staff who is/are responsible for teaching students with disabilities in your school; (d) Place a tick next to the special education professionals if employed in your school; (e) Place a tick next to the educational tools, equipment, or services if available in your school; (f) Place a tick next to the accommodations that are made in your school’s buildings to facilitate the movement of students with disabilities; (g) Place a tick next to the professional development courses or training programs that you received to teach students with disabilities; and (h) Place a tick next to the item that represents your overall perspective toward inclusion as an educational philosophy.
ProcedureTwenty-six schools were randomly selected from the seventy-five inclusive schools in Abu Dhabi-UAE. The researcher contacted these schools and invited teachers to contact her if they were willing to share their experiences as teachers in inclusive education. At least one positive response was received from each school to end up with 26 participants from 26 distinct schools. The 26 respondents were teachers of children who were either fully included in general education classes or were in self-contained settings in general education schools and were included to a lesser degree in some classes. The participants were either general classroom teachers or special education teachers. All expect two teachers in this sample were Muslim-Arabs, Arabic was their first language and English was their second language. Only two teachers were Americans with English tongue.
Survey Distribution After an IRB approval from Abu Dhabi Education Council (ADEC), was obtained, to survey teachers in the participating schools, and after these schools received a memo from ADEC- requesting them to allow the researcher to carry out the survey in their schools, the researcher would send an invitation, via E-mail or phone, asking these teachers if they were interested in participating in this study. Once their acceptance to answer the survey was received, the researcher would visit their schools in order to conduct the survey. All respondents could read and answer the questionnaire within 30 minutes.
Data Analysis
77
INTERNATIONAL JOURNAL OF SPECIAL EDUCATION Vol 27, No: 2, 2012
This descriptive study was conducted to shed the light on the nature of inclusive education in UAE schools. The primary data collection instrument used in this study was a bilingual Arabic-English survey to target teachers in inclusive settings. After the data collection had been completed, the data were analyzed qualitatively in four major steps of data translation: (a) initial tabulation and coding; (b) separate analysis of individual and groups of questions; (c) counting and analyzing the responses using designed tables; and (d) synthesis, interpretation, and discussion of results. Each question in the survey was followed by a number of choices to select from. Simply, the researcher would count the number of responses made by the participant teachers next to each choice. To analyze the responses drawn from the questionnaire, a table was made for each question to count the number of responses placed next to each item. For example, one of the questions asked if the school was private or governmental. For this question, the table had two columns: column one had the title Private School and column two had the title Governmental school. Next, the researcher would refer to that particular question across all the surveys to place a tick under column one if the respondent chose Private School or a tick under column two if the respondent chose Governmental School. Later the number of ticks that were marked by the researcher in each column would be tallied to conclude that the sample included 9 private schools and 17 governmental schools. This process of placing classified data into tables facilitated the process of data interpretation. For data interpretation, a separate analysis of individual and groups of questions was made. The units of meaning were compared with each other and subsequently grouped with similar units of meaning.
Based on the responses made on each question in the survey the following five major themes emerged to describe the nature of inclusive education in UAE public and private schools: (a) the existence of students with disabilities in mainstream schools and the kinds of disabilities they have; (b) types of teachers and school professionals in the inclusive schools; (c) learning tools, equipment, and electronic services; (d) school services and accommodations designed to facilitate the mobility of students with disabilities; and (e) professional development courses and training programs for staff to improve their experiences in inclusive settings.
To enhance reliability and internal validity, appropriate sampling techniques were used and build a trail of evidence (hard copies of the answered surveys with raw data, schedules of schools’ visits, electronic messages with respondents, data reduction and data construction products, soft copies of tables created for data analysis). In order to have error- free results, the data analysis procedure was repeated two times by the researcher.
ResultsThis descriptive study was conducted to shed the light on the nature of inclusive education in UAE schools. The survey covered five major areas to describe the nature of inclusive education in UAE public and private schools: (a) the existence of students with disabilities in mainstream schools and the kinds of disabilities they have; (b) the availability of qualified teachers and school professionals in the inclusive schools; (c) the availability of necessary learning tools, equipment, and electronic services; (d) the availability of school services and accommodations designed to facilitate the mobility of students with disabilities; and (e) the accessibility of professional development courses and training programs for staff to improve their experiences in inclusive settings.
Students with DisabilitiesReferring to the questionnaire, all participant teachers emphasized that their schools included students with different disabilities. Table 1 below classifies such types of disabilities:
Table 1. Types of Disabilities in UAE SchoolsType of Disability Number of Studentslearning disabilities 10 speech or language impairments 7emotional impairments 2autism 3hearing impairments 5visual impairments 8orthopedic impairments 2attention deficit-hyperactivity disorder 10
78
INTERNATIONAL JOURNAL OF SPECIAL EDUCATION Vol 27, No: 2, 2012
The data indicated that these UAE schools mainly included students with mild and moderate disabilities. None of the respondents reported the existence of the following severe disabilities in their schools: traumatic brain injury (TBI); multiple disabilities; developmental disabilities; deaf-blindness; and mental retardation. Participant teachers expected that their schools will include more students with disabilities in the coming few years.
Inclusive Services The questionnaire discussed the types of inclusive services and the kinds of educational placements implemented in the participant schools. The list of inclusive educational services that were implemented in the participant schools were as shown in Table 2 below:
Table 2. Kinds of Inclusive Educational Services in UAE SchoolsKinds of inclusive educational services Number and sector of schoolsOption 1. Full-time special education classroom (restrictive educational placement, moderate educational need).
2, Governmental
Option 2. Special education classroom with part time in general education classroom (restrictive educational placement, moderate educational need)
5, Governmental
Option 3. General education classroom, placement with resource room assistance (restrictive educational placement, moderate educational need)
2, Governmental
Option 4. General education classroom, placement with itinerant specialist assistance (least restrictive educational placement, mild educational need)
2, Governmental
Option 5. General education classroom placement with collaborative teacher assistance (least restrictive educational placement, mild educational need)
2, Governmental2, private
Option 6. General education classroom placement with few or no supportive services (least restrictive educational placement, mild educational need)
4, Governmental7, private
Note: The list of inclusive educational services & educational placements was adapted from Salend’s continuum of educational services (2005, p 13).
It is important to mention here that the participant schools used a continuum of educational placements ranging from the highly integrated setting of the general classroom to the highly segregated setting where instruction is delivered in special education classrooms or resource rooms. It is no surprise that the majority of the private schools in this sample placed special needs students in the general education classrooms because it is the least costing program. Such private schools cannot afford the expenses for employing additional personnel or for providing any supportive curricular services and facilities in their schools. For example, few or no special education professionals were employed in the participant private schools as the regular teachers were usually the only personnel who were in charge of helping and teaching their special needs students.
School Professionals The participant teachers were also asked to identify the special education professionals employed in their schools. The teachers’ responses were as shown in Table 3.
Table 3. The kind and Number of Special Education Professionals Employed in the Participant Schools
Professionals No. Governmental sector No. Private sector Total No.Special education teachers 14 2 16 Audiologists 0 (available upon request) 0 (available upon request) 0 Counselors 8 (visit schools on a regular
basis)0 8
Occupational therapists 0 (available upon request) 0 (available upon request) 0 Psychologists 17 9 26Recreational therapists 0 (available upon request) 0 (available upon request) 0 Social workers 17 9 26Speech-language pathologists 8 (visit schools on a regular 0 8
79

INTERNATIONAL JOURNAL OF SPECIAL EDUCATION Vol 27, No: 2, 2012
basis) Teacher assistants 5 2 7
It is no surprise that the schools which placed students in least restrictive environment to be the ones which also assigned the teaching responsibility to the general classroom teachers because such schools include students with mild educational needs. The questionnaire also addressed the availability of other professionals who may work collaboratively with the school team to diagnose, plan, teach, and assess students with disabilities. According to the teachers’ responses, none of the schools in this sample employed audiologists, occupational therapists, or recreational therapists; however, they might be available upon request. Eight schools indicated that itinerant speech-language pathologists may visit schools on a regular basis (once a week) or upon request. The same applies to counselors who may be consulted if needed. As for the following professionals: psychologists and social workers, they were usually available in each school in the UAE, and they had a share in the inclusion process.
Training ExperiencesIn regard to training, data drawn from the questionnaire indicated that almost two thirds of the participants received some training. On the other hand, the in-service teachers indicated that they had not taken the necessary training to facilitate their roles as teachers in inclusive schools. In many cases, participant teachers were unsatisfied about the sketchy training sessions that they had received. They expressed their urgent need for more specialized intensive courses and training programs on the proper care for students with disabilities.
Tools and Equipment As for the availability of special equipment and tools in the participant schools, the data drawn from the questionnaire indicated that the accessibility of the developed tools and equipment is limited in these schools. The participant teachers were asked to place a tick next to the items that were available in their schools and the responses were as shown in Table 4.
Table 4. Learning Tools and EquipmentTools & Equipment Availability in SchoolsSpecial laptops available in 2 schoolsSmart Boards available in 3 schoolsData Shows available in 15 schoolsBraille Printers available in 1 schoolElectronic Magnification Kits available in 3 schoolsPortable Magnifiers available in 3 schoolsTalking calculator available in 2 schoolsPerkins Braille available in 2 schoolsTactile globe available in 1 schoolDerbi Share Language Test Kit available in 1 school
When participating teachers were asked to identify if other tools, equipment, or services existed in their schools, they listed the following: FM, I Pad, AirWriter, large screen TV, Solo liberty low vision aids, and various manipulatives such as ORT stories, blocks, balls, play dough, etc. Interestingly, almost all of the schools that claimed the availability of supportive services and electronic educational tools and equipment were from the governmental sector. It is obvious that the Ministry of Education is paying special efforts to develop successful inclusive environment in the governmental schools, however less attention had been made to support the private sector.
AccommodationsConcerning the design of the school building, seven teachers responded that their schools have ramps for wheel chairs. No other accommodations were described by the participant teachers. The rest of the respondents in this sample reported that their schools were not really designed to include students with disabilities.
Teachers’ Perspective Surprisingly, when the participant teachers were asked to express their overall perspective toward the philosophy of inclusive education, all except three teachers agreed that it is a positive step toward the future of special education in UAE. However, all participant teachers were more likely to support
80
INTERNATIONAL JOURNAL OF SPECIAL EDUCATION Vol 27, No: 2, 2012
inclusive education when: (a) Schools employ a team of specialized professionals to deal with inclusive issues; (b) Schools create warm learning environments by emphasizing the values of diversity among students with and without disabilities and in the whole society; (c) Schools are supported with all necessary developed learning tools, equipment, and electronic services; (d) Schools design their classrooms and the whole school building to facilitate the mobility of students with disabilities; and (e) Schools promote ongoing specialized training for teachers and other professionals to develop professionally.
DiscussionData drawn from the questionnaire that was directed to 26 teachers in UAE inclusive schools indicated that the participant schools used a continuum of educational placements ranging from the highly integrated setting of the general classroom to the highly segregated setting where instruction is delivered in special education classrooms and resource rooms. This finding is consistent with previous research results (Salend, 2005; Friend, & Bursuck, 2002), they suggested full or partial placement in general classrooms based on student’s special needs and disability status. El-Ashry (2009) found in his study that many Egyptian teachers claimed to support inclusion. However, these teachers believed in the importance of maintaining separate settings based on the students’ academic performance and based on the severity of students’ disabilities. Indeed, similar concerns were raised by the teachers in the present study.
In regard to the number of students included in mainstream schools, data showed that the number of students ranged from three to ten in each school. It is relatively a small number; however, the number is increasing every year since UAE had adopted the philosophy of inclusion in 2006. It was reported in the Al Manal specialized magazine that the UAE Ministry of Education works endlessly to adjust 600 schools [to become inclusive schools], which represents 62% of the population [schools], in the coming three years (Al Manal, 2011, para., 2). This attitude of including a small number of students with disabilities in mainstream schools is consistent with other studies that described inclusion in Egypt, Jordan, and Palestine; they reported that these Arab countries implemented inclusion in a limited number of schools at the experimental levels, later on, the number would be increased gradually (Alghazo, Dodeen, &Algaryouti, 2003; Gumpel & Awartani, 2003; Romi & Leyser, 2006).
Data also showed that the types of disabilities that the students had were mainly moderate and minor. None of the participant schools in the present study included students with severe disabilities. This finding affirms the previous research results that schools are more inclined to include students with minor and mild disabilities than students with more severe intellectual and emotional and behavioral disabilities (El-Ashry, 2009; Wladron, & McLeskey, 1998; Ward et al., 1994). This specific attitude might be based on a common belief that students with mild disabilities require less modification of curriculum and instruction (Mastropieri &, Scruggs, 2000). It is reasonable for UAE schools, which had not implemented inclusion for long, to include students with minor disabilities until they become competent to include students with severe disabilities- such children need special care and attention.
In regard to training and professional development opportunities, all the teachers who participated in this study were concerned about the available trainings. Although there is evidence that positive attitudes about inclusion correlate with feelings of being well prepared (Mastropieri &, Scruggs, 2000; Bender et al., 1995), all teachers in this study reported a lack of confidence and unpreparedness to teach in inclusive classrooms. All what they received were sketchy training sessions which did not necessarily prepare them to teach in inclusive settings. This is hardly surprising given that the structure of their general education program did not include a single course about exceptional learners in general or inclusive education in particular. Previous literature has documented the positive effect of special education coursework and professional training in relation to teachers’ perspectives toward inclusion and increased awareness of techniques for successful inclusive practices (as cited in El-ashry 2009; Carroll et al., 2003; Scruggs & Mastropieri, 1996; Shade & Stewart, 2001; Shippen, Crites, Houchins, Ramsey, & Simon, 2005). It is necessary that UAE undergraduate programs consider including courses on teaching exceptional learners in inclusive settings. In a study by Bender et al., (1995) a positive correlation was found between teachers attitudes and the number of courses taken in teaching students with disabilities.
Although research emphasized that ongoing observation and evaluation by specialists are essential elements for improving students’ learning (Mastropieri &, Scruggs, 2000; Hines & Johnston, 1997), the participant teachers reported that their schools lacked special education professionals and personnel. For
81
INTERNATIONAL JOURNAL OF SPECIAL EDUCATION Vol 27, No: 2, 2012
example, none of the schools in this sample employed audiologists, occupational therapists, or recreational therapists.
The participating teachers in the present study were unsatisfied due to a lack of necessary educational resources, tools and equipment in their classrooms. Similarly, previous studies reported that teachers considered the absence of appropriate materials and equipment in general education schools as barriers to successful inclusion (Alghazo, Dodeen, & Algaryouti, 2003; El-Ashry, 2009).
The majority of the schools in this sample were not efficiently designed to facilitate the movement of children with exceptional disabilities. Although previous research has documented the relationship between successful inclusion and efficient accommodations in school’s physical environment (Salend, 2005; Mastropieri &, Scruggs, 2000; Salend, & Duhaney, 1999), teachers reported that insufficient accommodations were made to support inclusion. The only accommodation that was reported by the participants in this sample was ramps for wheel chairs. No other accommodations or services were described by the respondents.
In regard to the teachers’ overall perspective toward the concept of inclusion, the participating teachers shared the same perceptions about inclusion with other teachers in other earlier studies. The primary findings are that teachers agree in principle with the goals of inclusion, but many do not feel prepared to work in inclusive settings (Mastropieri & Scruggs, 2000; Hines & Johnston, 1997). May be this is due to the fact that inclusion is relatively a new practice in the UAE and teachers are not necessarily capable of dealing with the inclusion issues.
ConclusionIn order to get a clear image of the nature of inclusive education in UAE schools, it is necessary to conduct a study that describes the issues related to inclusion from teachers’ perspectives. A bilingual Arabic-English questionnaire was developed to target teachers in 26 public and private schools in the UAE. The results drawn from this questionnaire indicated that a variety of public and private organizations under the umbrella of the UAE Ministry of Education are committed to secure the complete participation of students having special needs in mainstream schools. Generally speaking, the participant teachers in this study agreed in principle with the concept of inclusion, yet they lacked confidence and preparedness to work in inclusive settings. Their dissatisfaction about the inclusion process in the UAE schools was due to a lack of appropriate training for teachers in mainstream classrooms, ignorance about inclusion among senior-level administrators, a general lack of funding for resources and training, and a lack of society awareness regarding the issues they may face during the inclusion process. These findings are consistent with those of other studies conducted in other countries. For example, Alghazo, Dodeen, and Algaryouti (2003) found that Jordanian teachers, in general, are concerned about teaching in inclusive settings for the lack of professional development training to teach in inclusive environments. Similarly, Palestinian and Egyptian Arab teachers reported anxious attitudes toward inclusion at both in-service (Gumpel & Awartani, 2003) and pre-service (El-Ashry, 2009; Romi & Leyser, 2006) levels due to their limited expertise to teach students with different disabilities. This attitude might be attributed to the fact that inclusion is a relatively new phenomenon and it is less widely practiced in the Arab countries as compared to Western countries like the US, Germany, and Canada. In their cross-cultural study, Leyser and colleagues (1994) found that teachers in the United States and Germany expressed the most positive attitudes toward inclusion. Data showed that none of the UAE schools included students with severe disabilities (e.g., severe mental impairments or emotional impairments). Some of the teachers in this study expressed concerns about the inclusion of such types of disabilities as they need extra support and effort during the teaching process. Similarly, Romi and Leyser (2006) found that although teachers supported inclusion and believed in the benefits of inclusion for all students, they expressed concerns about behavior problems and management issues in inclusive settings. Although inclusion in the UAE still at the experimental level, it would be insightful to study how students with and without disabilities accept each other in the inclusive classroom. This would be an important study because teaching strategies that utilize peer assistance are integral part of the inclusive settings.
Participant teachers did emphasize that there is a great need for extra efforts to create a culture of team work, one hand can’t clap. They added that the UAE inclusive schools should encourage the effective involvement of special need students, parents, school professionals, educators, and community stakeholders in the inclusion process. It’s only by team work spirit that we will be able to achieve the
82
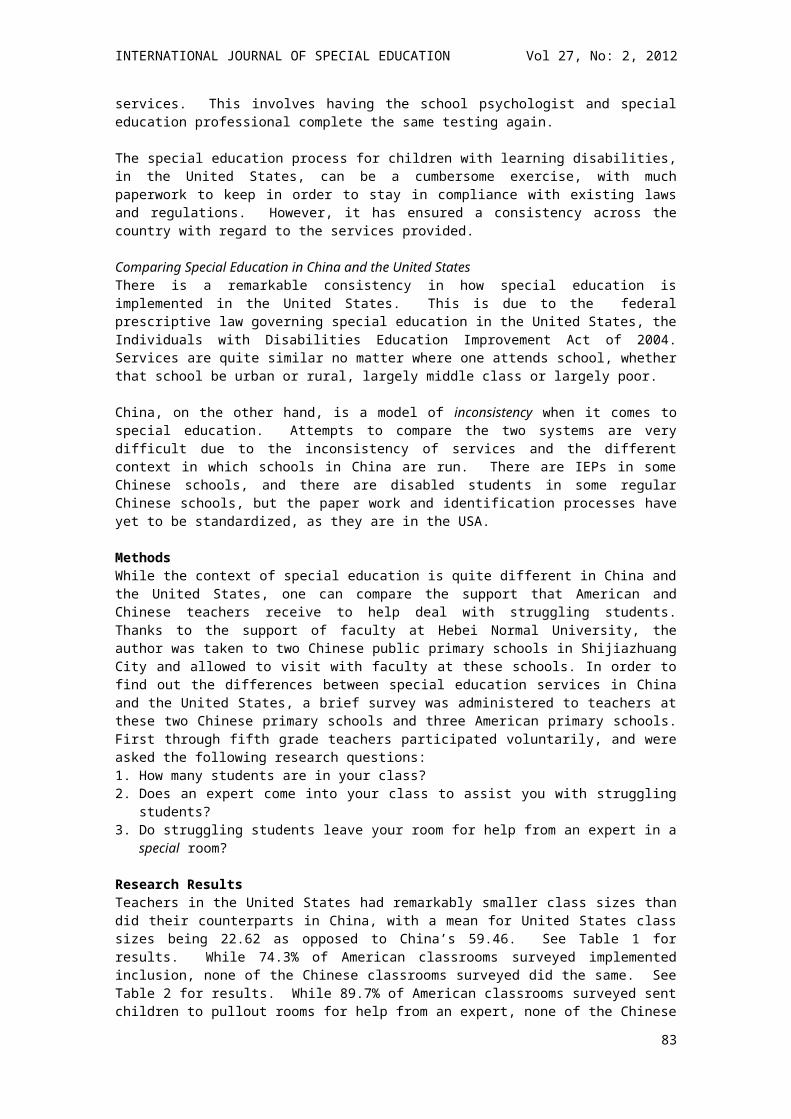
INTERNATIONAL JOURNAL OF SPECIAL EDUCATION Vol 27, No: 2, 2012
ultimate goal of the UAE Ministry of Education, to craft a School for All and to ensure that no student with disability is left behind.
References ADEC. (2010). ADEC organizes a training program on the use of special needs equipment [Press Release file]. Retrieved from http://www.adec.ac.ae/English/Pages/PressRelease.aspx.Alghazo, E. M., Dodeen, H., & Algaryouti, I. A. (2003). Attitudes of pre-service teacherstowards persons with disabilities. College Student Journal, 37(4), 515–522. Abu Dahbi.ae. (2011a). Federal Law No. (29) [Service Topics file]. Retrieved from http://www.abudhabi.ae/egovPoolPortal_WAR/appmanager/ADeGP/Citizen?_nfpb=true&_pageLabel=P1200125611281857352633&did=231072&lang=enAbu Dahbi.ae. (2011b). Abu Dahbi Education System [Service Topics file]. Retrieved from http://www.abudhabi.ae/egovPoolPortal_WAR/appmanager/ADeGP/Citizen?_nfpb=true&_pageLabel=p19654&lang=enAl Manal 251st. (2011, February 28). News. Al Manal Magazine, 251. Retrieved from http://www.schs.ae/news/newsDisplay.aspx?NewsID=120Baker, E.T., Wang, M.C., & Walberg, H.J. (1995). Synthesis of research: The effects of inclusion on Learning. Educational Leadership, 52 (4), 33-34. Bender, W. N., Vail, C. O., & Scott, K. (1995). Teachers’ attitudes toward increasedmainstreaming: Implementing effective instruction for students with learning disabilities.Journal of Learning Disabilities, 28, 87-94.Cohen, O. (1994, April 20). Inclusion should not include deaf students. Education Week, 35.Etscheidt, S.K, & Bartlett, L. (1999). The IDEA amendment: A four-step approach for determining supplementary aids and services. Exceptional Children, 65, 163-174. El-Ashry, F. (2009). General education pre-service teachers’ attitudes toward inclusion in Egypt. (Doctoral dissertation). Retrieved from http://etd.fcla.edu/UF/UFE0024244/elashry_f.pdf Friend, M., & Bursuck, W. D. (2002). Including students with special needs: A practical guide for classroom teacher (3rd ed.). USA, Boston: Allyn & Bacon.Gumpel, T. & Awartani, S. (2003). A comparison of special education in Israel andPalestine:Surface and deep structures, Journal of Special Education, 37, 33–48. General Secretariat Executive Council Emirate of Abu Dhabi. (2010). ADEC Provides Educational Equipments [Government News file] Retrieved from http://gsec.abudhabi.ae/Sites/GSEC/Navigation/EN/MediaCentre/government-news,did=153746.htmlHines, R. A., & Johnston, J. H. (1997). Inclusion. In J. L. Irvin (Ed.), What current research says to the middle level practitioner (pp. 109-120). Columbus, OH: NMSA. Hassan, H. (2008). Inclusion in the UAE [PDF document]. Retrieved from http://www.ibe.unesco.org/fileadmin/user_upload/Policy_Dialogue/48th_ICE/Presentations/IBE_ICE_Workshop_3B_Presentation_EN_Hanif_Hassan_Nov08.pdfLieberman, L. M. (1992). Preserving special education…for those who need it. In W. Stainback, & S. Stainback (Eds.), Controversial issues confronting special education: Divergent perspectives. Boston: Allyn and Bacon. Leyser, Y., Kapperman, G., & Keller, R. (1994). Teacher attitudes toward mainstreaming: Across cultural study in six nations. European Journal of Special Needs Education, 9, 1-15. Lewis, K. & Shaheen, K. (2010, May 21). Schools told to make room for special needs pupils. The National. Retrieved from http://www.thenational.ae/news/uae-news/education/schools-told-to-make-room-for-special-needs-pupils#Mastropieri, M. A., & Scruggs, T. E. (2000). The inclusive classroom: Strategies for effective instruction. Upper Saddle River, NJ: Prentice-Hall. Ministry of Education. (2011). Education in the UAE. Retrieved from http://www.moe.gov.ae/English/Pages/UaeEdu.aspx. Pearman, E. L., Haung, A. M., & Mellblom, C. I. (1997). The inclusion of all students: concerns and incentives of educators. Education and Training in Mental Retardation and Developmental Disabilities, 32, 11-20. Ryan, S., & Paterna, L. (1997). Junior high can be inclusive: Using natural supports and cooperative learning. Teaching Exceptional Children, 30 (2), 36-41. Romi, S.& Leyser, Y. (2006) Exploring inclusion preservice training needs: A studyof variables associated with attitudes and self-efficacy beliefs. European Journal ofSpecial Needs Education. 21(1), 85-105.Stanovich, P. J. (1999). Conversations about inclusion. Teaching Exceptional Children, 31 (6), 54-58.
83
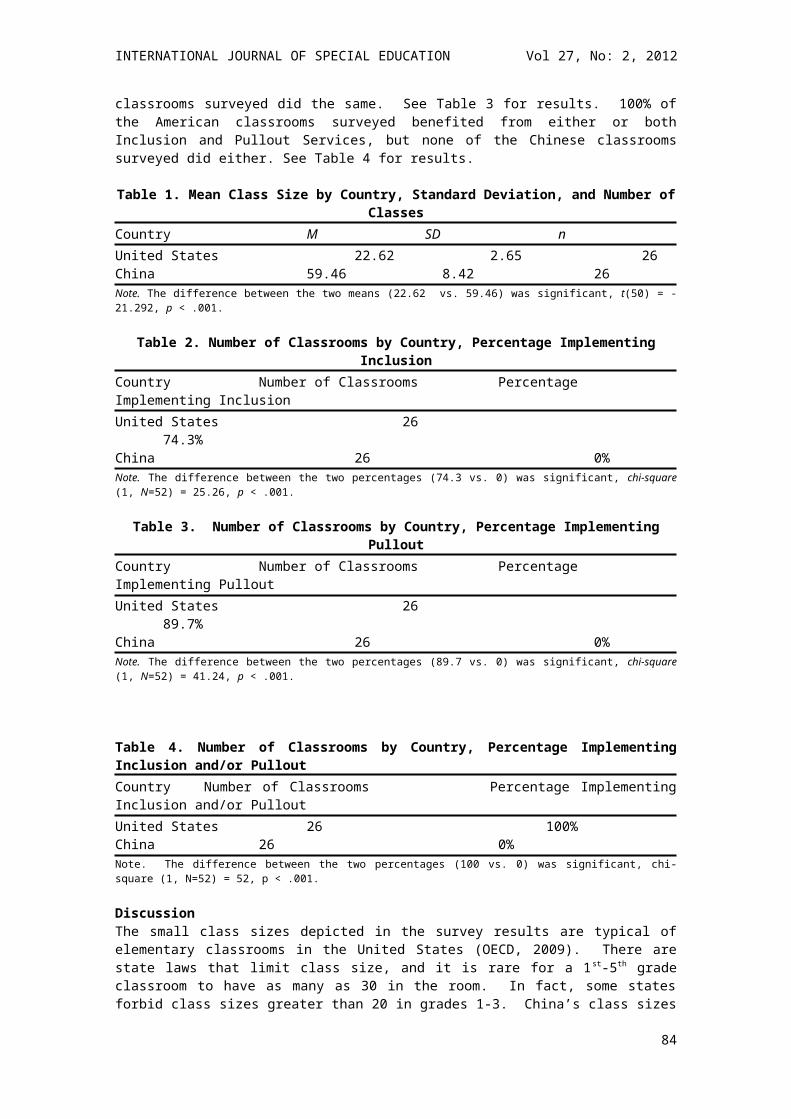
INTERNATIONAL JOURNAL OF SPECIAL EDUCATION Vol 27, No: 2, 2012
Salend, S. J., & Duhaney, L. M. G. (1999). The impact of inclusion on students with and without disabilities and their educators. Remedial and Special Education, 20, 114-126. Salend, S. J. (2005). Creating inclusive classrooms: Effective and reflective practices for all students (5 th
ed.). Upper Saddle River, New Jersey, NJ: Pearson Prentice Hall. Scruggs, T. E., & Mastropieri, M. A. (1996). Teacher perceptions of mainstreaming/inclusion,1958-1995: A research synthesis. Exceptional Children, 63, 59-74.Schattman, R., and Benay, J. (1992). Inclusive practices transform special education in the 1990's, The School Administrator, 49 (2), 8-12. Stainback, W. & Stainback, S. (1990). Support networks for inclusive schooling. Baltimore: Brookes.Skrtic, T. M. (1991, May). The special education paradox: Equity as the way to excellence. Harvard Educational Review, 61(2), 148-206.Sklaroff, S. (1994, January 12). A.F.T. urges halt to ‘full inclusion’ movement. Education Week, p. 7.Tornillo, P. (1994, March 6). A lightweight fad bad for our schools? OrlandoSentinel. Tahnoon, N. (2011). Special needs students [News Catalog file] Retrieved from http://www.adec.ac.ae/NewsCatalog/Forms/DispForm.aspx?ID=110Wladron, N. L., & McLeskey, J. (1998). The effects of an inclusive school program on students with mild and severe learning disabilities. Exceptional Children, 64, 395-405. Wilson, B. A. (1999). Inclusion: Empirical guidelines and unanswered question. Education and Training in Mental Retardation and Developmental Disabilities, 34, 119-133. Yssel, Nina; Engelbrecht, Petra; Oswald, Magdalena; Eloff, Irma; and Swart, Estelle. (2007). Views of inclusion: A comparative study of parents’ perceptions in South Africa and the United States. Remedial and Special Education, 28, 356-365. Ward, J., Center, Y., & Bochner, S. (1994). A question of attitudes: Integrating children withdisabilities into regular classrooms? British Journal of Special Education, 21, 34–39.
84
INTERNATIONAL JOURNAL OF SPECIAL EDUCATION Vol 27, No: 2, 2012
INSIGHTS INTO SELF-CONCEPT OF THE ADOLESCENTS WHO ARE VISUALLY IMPAIRED IN INDIA
Santoshi HalderThe University of Calcutta
Poulomee DattaThe University of Adelaide
The study aims to explore the nature of selected domains of self-concept (namely behaviour, Intellectual and school status, physical appearance and attributes, anxiety, happiness and satisfaction) of the sighted adolescents and the adolescents with a visual impairment. The sample (N = 160) have been drawn by simple random sampling from 100 sighted adolescents and 60 adolescents who are visually impaired from the selected schools of West Bengal (Eastern Part of India). Mean, Standard Deviation and Student’s t-test has been computed for analyses of data. Significant differences were noted among the adolescents who are sighted and visually impaired with respect to the overall self-concept scores including the domains namely physical appearance, popularity, happiness and satisfaction. The results of this study will assist parents, advocacy groups and special educators to comprehend the areas in which the sighted students and students with visual impairment need help and support, in order to develop positive self-concept.
Self-concept has an important implication for positive existence, and is a significant variable for achievement and positive development in the society in every sphere irrespective of being challenged or non-challenged. Recognizing its wider coverage than any other trait of personality self-concept has been chosen for the present investigation for its important implication in general well-being of the adolescents who are visually impaired.
One of the most obscure terms, found in psychology is self. The exact time of its origin is still unknown. However, it appeared long before the beginning of the systematic explanation of personality the origin of which can be no doubt be traced to the philosophers. According to Carl Rogers (1959) self is the portion of the personality which consists of perceptions of I or me and develops out of the organism’s interaction with the environment. By self Freud (1945) used the term years ago to refer to this organized aspect of personality and numerous other theorists have adhered to this usage (Warren, 1962; James, 1890, 1902). Self-concept is the cognitive or thinking aspect of self (related to one’s self-image) and it is generally considered to be the totality of a complex, organized, and dynamic system of learned beliefs, attitudes and opinions that each person holds to be true about his or her personal existence (Purkey, 1988). Franken states there is a great deal of research which shows that the self-concept is perhaps, the basis for all motivated behaviour (1994, p. 443). It is the self-concept that creates the motivation for
85
INTERNATIONAL JOURNAL OF SPECIAL EDUCATION Vol 27, No: 2, 2012
behaviour. Adler (1930) says that it gives meaning to life creating the goal as well as helping to fulfill it. This supports the idea that one’s paradigm or world view and one’s relationship to that view provide the boundaries and circumstances within which we develop our vision about possibilities. When people know themselves they can maximize outcomes because they know what they can and cannot do. Self-concept is based on accumulated perceptions throughout the lifespan and is strongly influenced by the interplay between their own actions, the reactions of others, and one’s perceptions of the events and their surrounding behaviours and outcomes (Byrne, 1996; Davis-Kean & Sandler, 2001). This dynamic aspect of self –concept is important because it indicates that it can be modified or changed (Franken, 1994). As the individual achieves a sense of his own identity he tends to view each situation in the light of his own motives, assumptions and feelings. Thus the effects of a particular environment become increasingly dependent upon the way it is experienced by the individual. Self-concept as a construct has had a long history within psychology and education because it provides a gauge to determine the effects of academic and social functioning on the emotional well-being of the individual (Vaughn et al., 2001, p. 54). Self-concept is generally viewed as a valued educational outcome. Self-concept is typically defined as a person’s general composite or collective view of themselves across multidimensional sets of domain specific- perceptions, based on self-knowledge and evaluation of value or worth of one’s own capabilities formed through experiences with and interpretations of the environment (Eccles, 2005; Snow et al., 1996).
During the pre-school years, many sources play an increasingly important role in the formation of self, such as family, teachers, classmates, playmates and friends. Self-concept remains relatively stable in adolescence over a two year period. In adult years, one’s occupational associates and sweet hearts, spouse and children influence this process. There are a several different components of self-concept: physical, academic, social and transpersonal. It includes the perception an individual has of one’s physical appearance and of the tangible properties of himself as a person. It covers beliefs, conviction and values he holds. Further it includes the attitudes- has concerning himself as a person, his worth, his right to have his own feelings and thoughts and to make his own choices. The physical aspect of self-concept relates to that which is concrete: what we look like, our sex, height, weight, etc.; what kind of clothes we wear; what kind of car we drive; what kind of home we like in; and so forth. Our academic self-concept relates to how well we do in school or how well we learn. The social self-concept describes how we relate to other people and the transpersonal self-concept describes how we relate to the supernatural or unknowns. For students with disabilities, it may be difficult for them to form their physical, academic, social or transpersonal self-concept because of the negative image and perceptions they have due to their disability.
Self-Concept and the Physical ImpairmentPhysical disability in itself may not be as bad physical experience as the social one, especially in those cases where the handicap is visible. It is only recently that the Disability has been termed as a Challenge, impediment for an individual. Such individuals grow up with a very negative self-image resulting in low motivation and aspiration (Sharma et al., 2004). They grow up they cannot do where as when the disability is offered as a challenge their outlook towards life changes (Joiner et al., 1989).
Physical disability adversely affects the self-concept (Elbaum & Vaughn, 2001). Successes, fame and enjoyable events in life lead to the enhancement of self-concept while failure, disharmony and discontentment tend to lower the concept of one (Blomquist et al., 1998). Self-concept is considered to be the most significant factor in human life as everyone is continuously striving towards self-actualization, self-realization and self-enhancement, and is constantly wishing to avoid self-condemnation and self-lowering experience.
Self-concept develops through childhood. Children with disabilities often experience that their development is slower as compared to the normal child. So these children with disabilities possess very poor self-concept (Sharma et al., 2004). Being given a name and being addressed by it is a basic part of the development of a concept of oneself. Studies conducted by Joiner et al., (1989) show that there is a positive relationship between assertive behavior and degree of acceptance of disability among person's disabilities.
Fichten et al., (1991) concludes that in everyday social encounters, the individuals with disabilities, their thoughts and feelings were more negative. It was also seen that the mental health too was affected by the poor physique. Studies conducted by Varni and James (1996) indicated that the affect of perceived physical appearance on psychological adjustment distress is mediated by general self-esteem.
86
INTERNATIONAL JOURNAL OF SPECIAL EDUCATION Vol 27, No: 2, 2012
Emergence of the ProblemSelf-concept has been taken as an important aspect of personality of a person and is perhaps one of the important domains for the development of individuation of a person causing effect on various part and parcel of everyday life. The self-concept has always been examined and looked upon by various researchers in India and abroad from not only from a psychologist’s point of view but also from an educationist and sociologist’s point of view. Considering its importance the present study is an attempt to compare the adolescents who are sighted and visually impaired with respect to their selected domains of self-concept.
Selected Domains of the Self-Concept for the Present StudyThe six dimensions selected for the study were Behavior, Intellectual and school status, Physical appearance and attributes, Anxiety, Popularity, Happiness and Satisfaction (Piers-Harris, Children’s Self-Concept Scale, 1969). Behavior is the outcome of personality. Confidence of a man is reflected by his behaviour and vice versa. A persons feeling about his own self will have an impact on his future achievement, learning, decision making etc.
Intellectual and School Status constitutes as having good understanding, knowledge and reasoning. The status of a person in school provides more opportunity to think and reason and gives broader outlook about himself and his life and develops his self-concept.
Physical Appearance and Attributes is based on how an individual perceives himself and his surroundings determined by his effort and goals, his strivings and aspirations. One’s view or picture of himself, his ideas about his physical appearance and characteristics or quality incorporates his/her self-concept. Since others perceive and react to the individual at least partially in terms of his physical appearance, it is not surprising that the individual’s body image may continue to be an important component of his identity and self-concept throughout his life.
Anxiety is fear acquired as a result of many frustrating and denigrating experiences encountered by the individual. Most often the child is not aware of the cause of his anxiety or misery. If this anxiety and misery turns severe one may develop disturbances of bodily function which may disrupt responses and behavior in life.
Popularity includes all those aspects or areas of life in which an individual is personally involved in his/her acceptance in family, peer group, school, community etc and is an important aspect of a person’s self-concept. Popularity means how well someone is liked or disliked by everyone, however, in the real world, popular means the people everyone aspires to be.
Happiness and Satisfaction is being lucky, fortunate, contented and pleased. A child who feels wanted and loved by his mates, is eager and confident to learn, to adjust to the demands of life but a child who is dissatisfied and unhappy casts a negative influence on his self-concept. Happiness is a mental state of well-being characterized by positive emotions ranging from contentment to intense joy. Satisfaction is realistically defined as enjoyment of whatever may be desired. Happiness and Satisfaction towards life have an integral role to play on a person’s self-concept.
The objective of this study is to explore the nature of the self-concept with respect to the adolescents who are sighted and visually impaired. This study also aimed to ascertain whether self-concept of the sighted adolescents differ significantly with that of the adolescents who are visually impaired with respect to the selected domains of self-concept. The Hypothesis is there will be significant differences between the adolescents who are sighted and visually impaired with respect to the selected domains of self-concept considered for the study.
MethodThe sample (N = 160) have been drawn by random sampling from 100 sighted adolescents and 60 adolescents who are visually impaired from the selected schools of West Bengal. Only those adolescents with vision impairment were included whose visual acuity did not exceed 6/60 or 20/200 and partially sighted individuals have been excluded from the study. The schools included were from all the districts of West Bengal (Eastern part of India) selected on the basis of stratified random sampling. The samples were matched in terms of age, school, location and socioeconomic status. The sample’s age ranged
87
INTERNATIONAL JOURNAL OF SPECIAL EDUCATION Vol 27, No: 2, 2012
between 15- 18 years, only students who attended government schools were selected. The location of the schools was in the urban metropolitan areas and the socio economic status of the samples was moderate.
The tools used were General Information Schedule (GIS) indicating demographic and personal information (prepared by the researcher) was administered on participants. The Piers-Harris, Children’s Self-Concept Scale (1969) was also used. The test contains 80 items in all Yes or No responses. The six sub-scales which are included in the self-concept scale are considered to be important in the Psychological world of childhood and adolescence. The subscales of the scale are: Behavior, Intellectual and School status, Physical appearance and attributes, Anxiety, Popularity, Happiness and Satisfaction. Pilot study has been done on 25% of the sample and the test has been standardized again on the expected sample. The results of the pilot study indicated the reliability coefficient of the scale between 0.79 - 0.88. The validity has been determined by estimating; (a) face validity (b) concurrent validity and factorial validity. Descriptive analysis has been done for the study. Mean, Standard Deviation and Student’s t-test have been used.
ResultsTable 1 represent the mean, S.D and t test score of the two groups of sample namely adolescents with visual impairment (N = 60) and sighted adolescents (N = 100). Significant differences (t = 2.11) were noted among the adolescents who are sighted and visually impaired with respect to over all self-concept score. The sighted adolescent students (M = 51.12) were found to be having much positive self-concept about themselves than the adolescents with visual impairment (M = 48.17).
Table 1. Mean (M), Standard Deviation (S.D), and t-test Values for Self-Concept Scale Along with its Six Component Scores of the Adolescents (Sighted and Visually Impaired)
Variables Mean andStandard Deviation
t-values for meandifference between gender
Sighted(N = 100)
Visually Impaired(N = 60)
SightedAnd Visually Impaired
Behaviour M = 10.30S.D = 3.13
M = 10.58S.D = 2.08
0.56 NS
Intellectual and school status
M = 10.62S.D = 2.19
M = 10.98S.D = 2.43
0.86 NS
Physical Appearance M = 7.82S.D = 1.59
M = 6.42S.D = 2.53
3.59 **
Anxiety M = 7.08S.D = 2.55
M = 7.32S.D = 2.74
0.49 NS
Popularity M = 8.78S.D = 1.68
M = 8.00S.D = 2.13
2.36**
Happiness and satisfaction M = 6.52S.D = 1.02
M = 4.87S.D = 1.32
7.50 **
Total Self-concept Score M = 51.12S.D = 7.18
M = 48.17S.D = 8.26
2.11*
** Significant at 0.01 level; *significant at 0.05 level.
No significant differences (t = 0.56), (t = 0.86) and (t = 0.49) were noted among the adolescents who are sighted and visually impaired with respect to Behavior, Intellectual and school capacity and Anxiety domain of self-concept. Significant differences (t = 3.59) and (t = 2.36) were noted among the adolescents who are sighted and visually impaired with respect to Physical appearance and attributes and Popularity domain of self-concept. The sighted adolescent students were found to have more positive concept (M = 7.82) about their physical appearance and attributes when compared to the adolescent students who are visually impaired (M = 6.42). The sighted adolescents (M = 8.78) were found to be more popular than the adolescents with visual impairment (M = 8.00). In the Happiness and Satisfaction
88
INTERNATIONAL JOURNAL OF SPECIAL EDUCATION Vol 27, No: 2, 2012
domain of self-concept there was significant differences (t = 7.50) among the adolescents who are sighted and visually impaired. The sighted adolescents (M = 6.52) were found to be more happy than the adolescent students who are visually impaired (M = 4.87)
The Graphical distribution (Figure 1) gives a picture some view of the self-concept domain wise description of the adolescents who are sighted and visually impaired. The sighted adolescents indicated high scores in over all self-concept score and also in some of the selected domains namely physical attributes, happiness satisfaction and popularity. Only in the Intellectual and school status domain the adolescents with visual impairment portrayed their strength.
Figure 1. Graphical Representation of Self-Concept Scale along with its Six Component Scores of the Adolescents (Sighted and Visually Impaired)
DiscussionThe adolescents who are sighted scored higher in the total self-concept scores as compared to the adolescents who are visually impaired. Therefore, the hypothesis which stated that sighted adolescents differ significantly in their self-concept scores as compared to adolescents who are visually impaired was confirmed. This data points in the same direction as those of other investigators (Beaty, 1992; Lifshitz, Hen & Weisse, 2007). Beaty (1992) indicated that the students who are visually impaired were prone to feelings of inadequacy and inferiority which in turn resulted in their low self-concept scores. Lifshitz, Hen, and Weisse (2007) found significant differences between the self-concept scores of the adolescents with visual impairments and that of their sighted peers.
However, other studies found no significant differences in the self-concept scores between the adolescents who are sighted and visually impaired (Fok & Fung, 2004; Garaigordobil & Bernarás, 2009; Jervis, 1959; Obiakor & Stile, 1989; Shirley & Nes, 2005). The differences in the results of the studies may be due to the factors of self-concept investigated, the way the groups were selected, and the method of gathering data. The differences may be related to the instruments employed because some of them assess global self-concept, whereas others explore the differentiated dimensions of self-concept.
Individual with disabilities are still considered a burden to the Indian society and are neglected (Ghai, 2002 & Halder, 2008, 2009). The Self-concept represents the personality at large. A child with disabilities may be exposed from birth of their inferiority and incapability which is reflected in every sphere. The societal pressure on adolescents who are disabled is believed to contribute to loss of self esteem (Kef, 2002). As a result, their Self-concept suffered in comparison to the sighted individuals. Since others perceive and react to the individual at least partially in terms of their physical appearance, so in the case of the adolescents with visual impairment this aspect was low when compared to their sighted peers (Varni & James, 1996). They were also found to be low on the scale of popularity and also in happiness and satisfaction measure, an important requirement for the development of positive self-concept in an individual. Thus in overall estimation of self-concept score they were found to be low from the sighted (Fitchen et al., 1991). The adolescents with visual impairment were found to be low on the
89
0102030405060
Behavior Intellectualand
SchoolStatus
PhysicalAttributes
Anxiety Popularity Happinessand
Satisfaction
SelfConcept
Total
Sighted
V. Impaired
INTERNATIONAL JOURNAL OF SPECIAL EDUCATION Vol 27, No: 2, 2012
Popularity domain when compared to their sighted peers because they were too shy to interact as a result of their disability perceived by others. Kef (1997) reached similar conclusions that adolescents who were blind and attended regular schools had the smallest social network. Evans et al., (1992) also suggested that the number of social interactions between students with and without disabilities in an inclusive setting declined as the school year progressed. However, Sale and Carey (1995) had contradictory findings indicating that increased learning and social competence of children with disabilities occur from placement in integrated settings. Literature in the areas of wellbeing, depression, mental health, and studies of the psychosocial impacts of visual impairment on adolescents suggest that social isolation and perceptions of disability by peers can impact on the self-esteem of adolescents with visual impairment (Hatlen, 2004; Kef, 2002). This has exactly been the case in this study where the social interaction of the adolescents with visual impairment had been considerably poor, reflecting low on the Popularity domain of self-concept which in turn led to their overall self-concept score to be weak. Their welfare can be positively affected by physical wellbeing, strong friendship and family networks, and encouragement by adults towards independence (Kef & Devkovic, 2004; Koenes & Karshmer, 2000; Rosenblum, 2000). Positive perceptions of disability and inclusion can also have helpful impact (Kef, 2002).
Since the sighted adolescents were found to be higher in most of the domains of self-concept (namely Physical appearance and attributes, Popularity domain) and overall self-concept score, so they were happier and content in life as compared to the adolescents with visual impairment. The very fact that visual impairment was perceived negatively and as a disability made the adolescents with visual impairment quite dissatisfied and unhappy in life, thus reflecting low scores in the Happiness and Satisfaction domain of self-concept. Though no significant differences were noted in behaviour and anxiety dimension, in Intellectual and school status they were found to be interestingly high when compared with the sighted portraying their average or above average potential which is a positive indication.
ConclusionA person with a positive self-concept does not necessarily have more skills than a person with a poor self-concept. The potential for a positive self-concept lies within each of us. Self-concept is not carved in stone, it can be changed. Children learn about themselves through their relationships with others. One’s ideas about one self are influenced by others ideas about them. It is from other people that we learn what we are good at and what we are bad at and whether we are lovable or unlovable, clever or unintelligent, wanted or unwanted, which there on become the raw materials for our self-concept. Adolescence is a complex stage of life in which physiological and psychological changes begin and is characterized by a period of heightened storm and stress (Broderick & Blewitt, 2006). Some psychologists believe that adolescents’ self-concept are abstract, complex and differentiated (Inhelder & Piaget, 1948). It can be more critical to develop a positive self-concept for adolescents with vision impairment. Thus this becomes imperative that with proper interventions by parents, teachers and other significant people the self-concept of the individuals who are visually impaired can also be transformed towards developing more positive concept about their own which later on adds to forming self-confidence, healthy personality and multi-faceted development in life.
Further ImplicationsThis research has great implications for parents, teachers and schools dealing with students with visual impairment. The society, family, and the important members cause significant contribution to one’s development of self-concept (Vashistha, 2004). Mishra (2004) revealed that the adolescents with visual impairment who receive parental encouragement excel in their self-concept. Parents can make their ward with disabilities feel positive about their physical appearance making them realize that looking good is not just externally based but rather being good internally.
Parents/ teachers can help students with visual impairment to develop a positive self-concept and appropriately high self-esteem by doing things together, encouraging them and praising them for their efforts and their achievements and by giving them opportunities to do things they feel proud of. This is based on firm foundations when adults get to know children well, taking care to learn about their individual likes, dislikes, and interests. It is very important for children to have their efforts and their achievements noticed and recognized. It gives them feelings of success and confidence, which enable them to risk more learning. Talking and listening to children in an interesting and accepting way can make as much difference. Adult expectations have a big influence on children’s self-concept; it matters very much how adults view the capabilities of the children in their care. Positive feedback like genuine appreciation, expressing acceptance, encouraging doing simple things through constant communication
90
INTERNATIONAL JOURNAL OF SPECIAL EDUCATION Vol 27, No: 2, 2012
creating an environment of mutual support and caring may boost up their moral and confidence and thus may add positively in the development of positive self-concept.
ReferencesAdler, A. (1930). The Education of Children. George Allen and Unwin, London.Blomquist, K.B., Brown, G., Peersen, A., & Presler, E.P. (1998). Transitioning to independence: Challenges for young people with disabilities and their caregivers. Orthopaedic Nursing, 17(3), 27-35.Broderick, P.C., & Blewitt, P. (2006). The Life Span: Human Development forHelping Professionals. Second Edition. New Jersey: Pearson Merrill Prentice Hall.Byrne, B. (1990). Self-concept and academic achievement: Investigating their importance as discriminators of academic track membership in high school. Canadian Journal of Education, 15(2), 173-182.Byrne, B.M. (1996). Measuring self-concept across the life-span: Issues and instrumentation. American Psychological Association, Washington, DC.Chubb, N. H., Fertman, C. I., & Ross, J. L. (1997). Adolescent self-esteem and locus of control: A longitudinal study of gender and age differences. Adolescence, 32, 113-129. Davis-Kean, P.E., & Sandler, H.M. (2001). A meta-analysis of measures of self esteem for young children: a framework for future measures. Child Development, 72, 887- 906.Devi, T.K., & Latha, B.M. (2004). Self-concept of adolescence in scheduled tribes and non-tribes. Indian Journal of Psychometry and Education, 35(1), 21-25.Eccles, J.S. (2005). Influences of parents’ education on their children’s educational attainments: the role of parent and child perceptions. London Review of Education, 3, 191-204.Elbaum, B., & Vaughn, S. (2001). School-Based Interventions to Enhance the Self-Concept of Students with Learning Disabilities: A Meta-Analysis. The Elementary School Journal, 101(3), Special Issue: Instructional Interventions for Students with Learning Disabilities, 303-329.Evans, I. M., Salisbury, C. L., Palombaro, M. M., Berryman, J., & Hollowood, T. M. (1992). Acceptance of elementary-aged children with severe disabilities in an inclusive school. Journal of the Association for Persons with Severe Handicaps, 17, 205-212.Fichten, C.S., Amsel, R., Robillard, K., & Tagalakis, V. (1991). Thoughts about encounters between nondisabled and disabled peers: Situational constraints, states-of-mind, valenced thought categories. Cognitive Therapy and Research, 15(3), 345-369. Franken, R. (1994). Human motivation (3rd ed.). Brooks/Cole Publishing Co., Pacific Grove, CA.Freud, A. (1945). Indications for Child Analysis. The Psychoanalytic Study of the Child, 1, 127-149.Gage, N., & Berliner, D. (1992). Educational psychology (5th ed.). Houghton Mifflin, Boston. Ghai, A. (2002). Disabled Women: An excluded agenda of Indian Feminism. The Journal hyptia, 17 (3), 49-66.Halder, S. (2008). Rehabilitation of Women with Physical Disabilities in India: A Huge Gap. Australian Journal of Rehabilitation Counselling, 14(10), 1-15.Halder, S. (2009). Prospects of Higher Education of the Challenged Women in India. International Journal of Inclusive Education, 13(6), 633-646.Hamachek, D. (1995). Self-concept and school achievement: Interaction dynamics and a tool for assessing the self-concept component. Journal of Counseling & Development, 73(4), 419-425. Hatlen, P. (2004). Is social isolation a predictable outcome of inclusive education? Journal of Visual Impairment and Blindness, 98(11), 676-679.Hoge, R. D., & Mcsheffrey, R. (1991). An Investigation of Self-Concept in Gifted Children. Exceptional Children, 57, 238 - 245. Huitt, W. (2004). Becoming a Brilliant Star: An introduction. Presentation at the Forum for Integrated Education and Educational Reform sponsored by the Council for Global Integrative Education, Santa Cruz, CA, available online at http://chiron.valdosta.edu/whuitt/brilstar/chapters/BrilStarintro.pdf, accessed 11/2/2009.Inhelder, B., & Piaget, J. (1958). The growth of logical thinking from childhood to adolescence. New York: Basic Books.James, W. (1890). Principles of psychology. New York: Henry Holt. Joiner, J.G., Lovett, P.S., & Goodwin, L.K. (1989). Positive Assertion and Acceptance among Persons with Disabilities. The Journal of Rehabilitation, 55, 22-29.Hassan, K. Ei. (2004). Structure and Correlates of Self-Concept in Lebanon. International Journal of Testing, 4(1), 1-17Kef, S. (1997). The personal networks and social supports of blind and visually impaired adolescents. Journal of Visual Impairment and Blindness, 91(3), 236-44.
91
INTERNATIONAL JOURNAL OF SPECIAL EDUCATION Vol 27, No: 2, 2012
Kef, S. (2002). Psychosocial Adjustments and the Meaning of Social Support for Visually Impaired Adolescents. Journal of Visual Impairment and Blindness, 96(1), 22-37.Kef, S., & Dekovic, M. (2004). The role of parental and peer support in adolescents well-being: a comparison of adolescents with and without a visual impairment. Journal of Adolescence, 27(4), 453-466.Koenes, S.G., & Karshmer, J.F. (2000). Depression: A comparison study between blind and sighted adolescents. Issues in Mental Health Nursing, 21(3), 269-279.King, G. A., Shultz, I. Z., Steel, K., Gilpin, M., & Cathers, T. (1993). Self-evaluation and self-concept of adolescents with physical disabilities. American Journal of Occupational Therapy, 47, 132-140.Marsh, H. (1992). The content specificity of relations between academic self-concept and achievement: An extension of the Marsh/Shavelson model. ERIC NO: ED349315. Marsh, H.W., & Yeung, A.S. (1997). The Causal Effects of Academic Self-Concept on Academic Achievement: Structural Equation Models of Longitudinal Data. Journal of Educational Psychology, 89, 41-54.Mishra,U. (2004). Effect of parental encouragement on self-concept of higher secondary girls. Indian Journal of Psychometry and Education, 35(1), 81-83.Nanda, A.K. (2004). A study on self esteem of adolescents. Indian Journal of Psychometry and Education, 35(2), 118 -122Purkey, W. (1988). An overview of self-concept theory for counselors. ERIC Clearinghouse on Counseling and Personnel Services, Ann Arbor, Mich. (An ERIC/CAPS Digest: ED304630). Available online at http://www.edpsycinteractive.org/files/selfconc.html, accessed 11/6/2009.Rogers, C.R. (1959). A theory of therapy, personality, and interpersonal relationships. In S. Koch (ed.), Psychology: A Study of a Science, (Vol. 3, pp. 184-256). New York: Mc Graw Hill.Rosenblum, L.P. (2000). Perceptions of the Impact of Visual Impairment on the Lives of Adolescents. Journal of Visual Impairment and Blindness, 94(7), 434-445.Sale, P., & Carey, M.D. (1995). The Sociometric Status of Students with disabilities in a full-inclusion School. Exceptional Children, 62, 6-19. Sharma, N., Vaid, S., & Jamwal, Z. (2004). The concept of self in physically challenged institutionalized children (5-13 years). Journal of Disability India.Snow, R.E., Como, L., & Jackson, D. (1996). Individual differences in affective and conative functions. In D.C. Berliner & R.C. Calfee (Eds.), Handbook of Educational Psychology (pp. 243-310). Simon & Schuster Macmillan, New York.Song, I.S., & Hattie, J. (1984). Home environment, Self-Concept, and academic achievement: A causal modeling approach. Journal of Educational Psychology, 76 (6), 1269-1281. Vashistha, K.C. (2004). Parental encouragement as a determinant of self-concept and scholastic achievement in visually challenged. Indian Journal of Psychometry and Education, 35(2), 148-152.Vaughn, S., Elbaum, B., & Boardman, A.G. (2001). The social functioning of students with learning disabilities: Implications for inclusion. Exceptionality, 9(1), 49-67.Warren, H.C. (1962). Dictionary of Psychology, 1934/1962 (renewed). The Riverside Press, Cambridge.
92
INTERNATIONAL JOURNAL OF SPECIAL EDUCATION Vol 27, No: 2, 2012
INTERNATIONAL VIEWS OF INCLUSIVE EDUCATION: A COMPARATIVE STUDY OF EARLY CHILDHOOD EDUCATOR’S PERCEPTIONS IN JORDAN, UNITED ARAB
EMIRATES, AND THE UNITED STATES OF AMERICA
Diala HamaidiThe University of Jordan
Moayyad HomidiKing Abdulaziz University
Luis V. ReyesNew Mexico State University
The purpose of this research was to explore and describe early childhood educators' perceptions of academic aspects and social and emotional aspects of inclusion practices. In this comparative international quantitative research an attitudinal demographic survey was distributed to 300 early childhood educators in mandated kindergartens and primary public schools in urban areas of Amman/Jordan, Sharjah and northern areas/United Arab Emirates, and Southwestern/U.S.A. The main highlighted themes included: teachers’ attitudes toward academic aspects of inclusion practices, teachers’ attitudes toward social and emotional aspects that affect inclusive practices in different contexts.
According to Billings and Kowalski (2008), in successful inclusive schools, students with different kinds of disabilities have the services and the support they need. Also, they gain the opportunity to be full members and to grow in productive ways in the social and learning contexts of their non-disabled peers. This comparative study added new insights that provide an understanding of the complexity of practices of inclusive education. Although all educators in the study agreed and advocated for the idea of inclusive education, the practices varied among them. One reason for this difference could be the difference in the history of inclusive education in Jordan, UAE, and USA. Historically most of the students with disabilities have been served in segregated special education classes. In the United States inclusion received clear attention across the States since the national passage of the Education for All Handicapped Children Act of 1975 (PL 94-142) (Downing & Peckham-Hardin, 2007). Prior to this time few students with disabilities were provided services in public schools. Those students were served in separated classrooms. The following improvement was the legislation that students with disabilities should be provided education in the least restrictive environment. In the 1980s more integrated services were provided. In 1990 the Individuals with Disabilities Education Act (IDEA) legislation highlighted that instead of taking students with disabilities out of the general education classroom and providing them with special instruction in a resource room, the supporters of total inclusion proposed that all students with moderate to severe disabilities should be educated in the general education program. As a result, the students with special needs were eligible to receive the services they need in the general schools, whereas the passage of the Handicapped Law of 1993 in Jordan was the first step towards assuring the rights of persons with disabilities. The law emphasized that individuals with disabilities are entitled to equal
93
INTERNATIONAL JOURNAL OF SPECIAL EDUCATION Vol 27, No: 2, 2012
education, training, work, and care (as cited in Alghazo, Dodeen, & Algaryouti, 2003). In the United Arab Emirates (UAE) however, until 2003 there were no laws that are geared specifically toward persons with disabilities. Yet, in the UAE constitution there are several sections that address the needs of persons with disabilities. Section 16, for example, emphasizes the issue of rehabilitating and caring for persons with disabilities. Section 25 also dictates that all individuals are equal (Alghazo et al., 2003). This difference in history affects the practices of individuals. As a result, hearing from different contexts may help improve the current practices in the developing countries. In addition, understanding these complex ecologies may influence the policy makers in these different countries to improve their own practices in the field of inclusion. This understanding may influence other countries to improve and enhance their practices. They can benefit from the experiences of these countries in establishing a well-rounded policy that match their own context.
Research QuestionThe purpose of this research was to explore and describe early childhood educators' perceptions of the inclusive practices in their classrooms. The central research questions were: What are early childhood educators' inclusive experiences and What are the factors that contribute to or hinder their success in inclusive classrooms?. Specifically, the research explores the perceptions of early childhood educators regarding the academic and social and emotional aspects of inclusive practices in kindergarten.
The hypotheses of this research are: H1: There is no significant relationship between teachers' negative attitude towards academic aspects and the demographic variables (areas, gender, ages, level of education, general teaching experience, grade level taught, previous inclusive teaching experience, and the number of college courses taken in inclusion). H2: There is no significant relationship between teachers' positive attitude towards social and emotional aspects and the demographic variables (areas, gender, ages, level of education, general teaching experience, grade level taught, previous inclusive teaching experience, and the number of college courses taken in inclusion). H3: There are no significant differences between the negative attitude of Emirate, Jordanians, and Americans'' teachers towards academic aspects. H4: There are no significant differences between the positive attitude of Emirate, Jordanians, and Americans'' teachers towards social and emotional aspects.
In this comparative research an attitudinal demographic survey was distributed to a sample of early childhood educators in primary public schools and kindergartens in three different countries: Jordan, United Arab Emirates and the Southern United States of America in demographically similar settings.
Theoretical FrameworkThe framework of this research was built on the constructivist theoretical base. With this in mind, inclusive education provides the arena where general and special educators, students, and parents can come together to create quality, democratic schools (Causton-Theoharis & Theoharis, 2009; Skrtic, Sailor, & Gee, 1996; Wotherspoon, 2004). The teacher's role in such a process is to model and think aloud the thoughts and strategies of effective communication in the process of seeking for truth (Vygotsky, 1986) and how they construct and reconstruct their personal experiences with inclusive education. According to Dewey (1976) as cited in (Skrtic et al., 1996) the goal of public education should be to prepare citizens for democracy by turning schools into communities of inquiry. As constructivist researchers our role was to construct data with informants, so their interviews will likely include more participation… and more active sharing (Hatch, 2002, p. 110). In this research we specifically utilized the constructivist principles of voice, collaboration, and inclusion that are implicit in the school restructuring and inclusive education reform movements (McHatton & McCray, 2007; Skrtic et al., 1996; Wotherspoon, 2004). By honoring the voice of early childhood teachers from different geographical contexts we examined the perceptions within and across complex social and cultural ecologies. By doing so we opened new windows of collaboration.
A second lens that we utilized in this research was the deconstruction theory. According to Kincheloe (2005) inquiry and the knowledge it produces are never neutral but are constructed in specific ways that privilege particular logic and voices while silencing others (p. 35). Like Kincheloe, Bourdieu’s (1977) social theory highlights the same thought. Perna and Titus (2005) mentioned that the amount of social capital to which an individual may gain access through social networks and relationships depends on the size of the networks as well as on the amounts of economic, cultural, and social capital that individuals in the network possess (p. 488). Based on this social theory, we as researchers tried to expand the size of the research-networks to include different contexts where the individuals within these networks bring
94
INTERNATIONAL JOURNAL OF SPECIAL EDUCATION Vol 27, No: 2, 2012
varied economic, cultural, and social power. In this situation all of the participants had an equal opportunity to voice their visions, thoughts, and attitudes toward inclusive education. We hoped that by inviting these parties a clearer picture of inclusive education could be presented. Furthermore, Cannella (1997) discussed critical issues in regards to early childhood education and how we as early childhood educators need to problematize what we know (p. 12) and started to deconstruct the dominant discourse. Deconstruction from Cannella’s point of view is a method of reading and interpreting (the word and/or the world) that reveals hidden meanings, silences, contradictions, and sites of power (p. 16). These thoughts connected with the idea of this research that focuses on problematizing how early childhood educators perceived the idea of inclusive education.
Dahlberg, Moss and Pence (1999) focus on the narrow meaning of interpreting early childhood issues that present the ready recipe for teachers, administrators, families and students without giving them the opportunity to be creative based on their own experiences and knowledge. Our hope, as researchers in this study, was to give early childhood educators from different contexts the opportunity to construct their own meaning toward inclusive education. Cannella’s (2002) critique of the current dominant discourse in early childhood education is that dominant discourse does not allow for ambiguity, uncertainty, freedom, or the construction of multiple new worlds and ways of being (Cannella, 2002, p. 107). So, our intention through this study was to open new windows for early childhood teachers in different contexts to construct their own experiences and perspectives toward what was currently happening in their practice of inclusive education.
MethodsParticipantsTo test the research's hypotheses, 300 questionnaires were randomly distributed to solicit data from early childhood teachers who taught in mandated kindergartens and primary schools in specific areas of Jordan, United Arab Emirates and the Southwestern United States of America. Specifically, the questionnaires covered Amman city kindergartens and primary schools. Amman is the capital of Jordan and 100 questionnaires were sent to the schools of this city. With regard to the United Arab Emarites, Sharjah and the northern areas kindergartens and primary schools of the United Arab Emirates participated in this research. When it comes to the United States of America the focus was on a specific area in the Southwestern/U.S.A. The teachers were informed that the purpose of the research was to learn about early childhood teachers' perceptions about the inclusive practices in their classrooms of students who may have disabilities in the regular educational system. The participant teachers were also assured that their responses would remain anonymous. Several questionnaires were dropped from the analysis since teachers returned them late or lacked certain data, leaving a total of 225 respondents. No monetary incentive was given to the respondents who completed the questionnaire.
In relation to the sample characteristics, the sample was predominantly female (90%). When it comes to the field of early childhood education, the majority of teachers were female. Almost half of the teachers who participated in this research ranged from 30-39 years of age (49%). The demographic data showed that the majority of the participants had a bachelor's degree (85%). When it comes to the participants’ teaching experiences, half of the teachers had general experiences ranging from 8 years and above (50%). Almost half of the participants had three years and above as a previous inclusive teaching experience (47%), and none college courses taken in special education formed (46%) of a research sample.
Measures The research method included a questionnaire survey. The survey was designed to determine the extent to which variables such as training, experience, and program factors were related to teachers’ attitudes. As a result, the researchers designed the survey that included two major aspects. The first aspect was teachers’ attitudes toward academic aspects and the second focus was teachers’ attitudes toward social and emotional aspects.
In this survey twenty-two items on a five-point Likert-type scale with 12 items reverse scores were used to measure the scale of teachers' attitude towards academic aspects and Cranach's Alpha coefficient for these items = 0.81. Typical items include, inclusion does not meet the needs of children with special needs due to the lack of qualified teachers and regular education teachers receive little assistance from special education teachers in modifying instruction for children with special needs. On the other hand, teachers positive attitude towards social and emotional aspects were measured by twenty-seven items on a five-point Likert-type scale with 13 items reverse scores and Cranach's Alpha coefficient for these
95
INTERNATIONAL JOURNAL OF SPECIAL EDUCATION Vol 27, No: 2, 2012
items = 0.93. Typical items included, inclusion does not cause aggressive behaviour among children and inclusion practices do not reduce the level of competition of general learners.
The questionnaire survey included demographic questions about early childhood teachers' educational experiences with inclusive education. Sub areas of the survey included background information of inclusive education, demographic information, and open-ended questions about teachers' satisfaction and attitudes of inclusive practices. One hundred questionnaires were distributed through the researchers to 20 kindergartens and primary public schools in Amman (Jordan). Another 100 questionnaire were distributed to 20 kindergartens and primary public schools in Sharjah and northern areas (UAE). Furthermore, 100 questionnaires were sent to 20 kindergartens and primary public schools in Las Cruces, New Mexico in the USA.
ResultsThe first hypothesis of this research indicated that there was no statistically significant relationship between teachers' negative attitude towards academic aspects of inclusion practices and the demographic variables (areas, gender, ages, level of education, general teaching experience, grade level taught, previous inclusive teaching experience, and the number of college courses taken in inclusion). The results indicated that the finding that teachers who had negative attitudes towards academic aspects of inclusion practices was positively related to the areas (United Arab Emirates, Southwestern USA, and Jordan); Chi-square value = 164.909, df = 102, P = 0.00 < 0.01, r = 0.38; P = 0.00 < 0.05, grade level taught; Chi-square value = 237.360, df = 204, P = 0.00 < 0.01, r = 0.18; P = 0.008 < 0.01. While this finding was positively related to previous inclusive teaching experience; Chi-square value = 201.358, df = 153, P = 0.005 < 0.01, r = 0.28; P = 0.00 < 0.05, it was negatively related to the number of college courses taken in inclusion; Chi-square value = 223.691, df = 153, P = 0.000< 0.01, r = - 0.31; P = 0.00 < 0.05. On the other hand, teachers who had negative attitude towards academic aspects of inclusion practices was not related to teachers gender; Chi-square value = 37.233, df = 51, P = 0.92 > 0.05), teachers ages; Chi-square value = 166.331, df = 153, P = 0.22 > 0.05, educational levels; Chi-square value = 140.983, df = 153, P = 0.75 > 0.05, general teaching experience; Chi-square value = 177.890, df = 153, P = 0.08 > 0.05. However, these results lead to accept the null hypothesis partially. Specifically, there was a statistically significant relationship between teachers' negative attitude towards academic aspects of inclusion practices and areas, grade level teaching, previous inclusive teaching experience, and the number of college courses taken in inclusion. In contrast, there was no statisticallysignificant association with teachers' gender, ages, educational levels, general teaching experience, and level of education.
The second hypothesis indicated that there was no statistically significant relationship between teachers' positive attitude towards social and emotional aspects of inclusion practices and the demographic variables (areas, gender, ages, level of education, general teaching experience, grade level taught, previous inclusive teaching experience, and the number of college courses taken in inclusion). The results indicated that teachers' positive attitudes towards social and emotional aspects of inclusion practices were not related to (1) teachers gender; Chi-square value = 46.463, df = 69, P = 0.98 > 0.05), (2) teachers ages; Chi-square value = 234.656, df = 207, P = 0.09 > 0.05, and (3) educational levels; Chi-square value = 204.234, df = 207, P = 0.54 > 0.05. In addition, teachers’ positive attitudes toward social and emotional aspects of inclusion practices were not related to (1) the general teaching experience; Chi-square value = 194.921, df = 207, P = 0.71 > 0.05, (2) grade level taught; Chi-square value = 239.008, df = 276, P = 0.95 > 0.05, and (3) the number of college courses taken in inclusion; Chi-square value = 236.268, df = 276, P = 0.08 > 0.05.
However, these results lead to accept the null hypothesis partially. That is, there were statistically significant associations between teachers' positive attitudes towards social and emotional aspects of inclusion practices and areas, as well as negatively related to previous inclusive teaching experience. On the other hand, there was no statistically significant association between this dimension and teachers' gender, ages, general teaching experience, grade level taught, and the number of college courses taken in inclusion.
To test the third and fourth hypotheses Mean values were examined initially by country. As Table 1 shows, Jordanian teachers held more negative attitude towards academic aspects of inclusion practices than Southwestern USA and United Arab Emirates' teachers who participated in this research. Similarly, United Arab Emirates teachers showed more negative attitude towards academic aspects of inclusion practices than Southwestern USA teachers did. While the United Arab Emirates teachers exhibited more
96
INTERNATIONAL JOURNAL OF SPECIAL EDUCATION Vol 27, No: 2, 2012
positive attitude towards social and emotional aspects than Southwestern USA's and Jordanian teachers did, the Southwestern USA teachers held more positive attitude than Jordanian teachers did. Sine these indications are not enough to determine the statistically significant differences, One-way Analysis of Variance (ANOVA) techniques associated with Tukey-HSD were employed to examine hypotheses 4 and 5.As shown in Table 2, the (F) ratios suggested that at least one nation differed from others across the dependent variables. The F ratios ranged from 46.34 to 60.92 and were statistically significant at the level P = 0.00, df = 2. The size of F ratios reflects a high variability of the three nations' attitudes towards research dimensions but does not reflect which nation (s) has the superiority across the dependent variables. Therefore, Tukey’s HSD paired comparisons tests were used.
Table 1. Mean Comparison between the Participating CountriesCountry Academic aspect Social and emotional aspects
Mean Std. Deviation Mean Std. Deviation
United Arab Emirates 62.63 10.07 99.85 99.85
Jordan 74.80 9.66 77.28 14.46
Southwestern USA 59.33 6.15 88.16 6.79
Total 67.87 11.53 89.20 18.46
Table 2. ANOVA ResultsDependent variables Sum of Squares df Mean Square F Sig.
Teachers negative attitude towards academic aspects.
8771.209 2 4385.605 46.34 .000
Teachers' positive attitude towards social and emotional aspects
27058.439 2 13529.219 60.92 .000
As shown in Table 3, Tukey’s HSD test shows that the Emirate teachers are more likely to have positive attitudes towards academic aspects than Jordanians teachers (Mean diff. = -12.16283, P = 0.00 < 0.01) and American teachers have more positive attitudes than Jordanian teachers (Mean diff. = 15.46667, P = 0.00 < 0.01) but there is no difference between Emirate and American teachers who have the same attitudes (P = 0.50 > 0.01). Similarly, Emirate teachers are more likely to have more positive attitudes towards social and emotional aspects than Jordanians teachers (Mean diff. = 22.58, P = 0.00 < 0.01) and Southwestern USA teachers who participated in this research (Mean diff. = 11.69, P = .028 < 0.01). Jordanians teachers have less positive attitudes towards social and emotional aspects than American teachers (Mean diff. = -10.88667, P = 0.046 < 0.05). These results would partially reject the null hypotheses.
Table3. The Pair Wise Comparisons of the Group’s Means (Tukey HSD)
Dependent Variable (I) Group name (J) Group name Mean Difference (I-J)
Sig.
Teachers negative attitude towards academic aspects.
Emirate Jordan -12.16283(*) .000USA 3.30383 .504
Jordan USA 15.46667(*) .000
Teachers' positive attitude towards social and emotional aspects
Emirate Jordan 22.57841(*) .000USA 11.69174(*) .028
Jordan USA -10.88667(*) .046
* The mean difference is significant at the .05 level.
97
INTERNATIONAL JOURNAL OF SPECIAL EDUCATION Vol 27, No: 2, 2012
DiscussionSome of the findings in this study corroborated the results of earlier studies (Causton-Theoharis & Theoharis, 2009; Yssel et al., 2007) that highlighted the components of inclusive education that involve being responsive to the diversity of the classroom and helping the students to focus on their culture, attitudes, and beliefs while working with other classmates. The other findings of this research highlighted specific issues related to the specific context of this study.
Responses on survey items indicated that Emirate teachers were more likely to have positive attitudes towards academic aspects of inclusion practices than Jordanian teachers, Southwestern USA teachers had more positive attitudes than Jordanian teachers. However, there was no Statistically significant difference between Emirate and Southwestern USA teachers. As a result, this study showed that Emirate and Southwestern early childhood educators were committed to implementing inclusion practices and were prepared to alter services for students as students' needs changed. One reason of this result could be the lack of pre-service training that Jordanian teachers received prior to the work with children with Special needs comparing to the pre-service preparation that is provided in USA or UAE. In this regard, the mean values of teachers' negative attitude towards academic aspects ranged from 1.99 to 4.10. Specifically, teachers scored the highest Mean on survey items that highlights curriculum issues (Mean = 4.10, Std. 1.126). From the survey items teachers believed that the curriculum does not meet the needs of children with special needs followed by the survey item that states general teachers do not have the adequate training to deal with children with disabilities (Mean = 4.07, Std. 1.099). This result agreed with previous research that emphasized the need for general education faculty to be trained in order for the inclusion movement to be successful (Hammond, 2003; Praisner, 2003).
When it comes to the survey items that related to the attitudes toward the academic aspects of inclusive practices, the majority of Jordanian and UAE teachers highlighted that special and general educators do not collaborate enough to provide services to students in their schools. Southwestern USA early childhood teachers were more positive and more than half of them stated that collaboration with special education was a big success for their inclusion work. This success was due to the support of administration. With the same line of thought, Praisner (2003) demonstrates the importance of principals' attitudes for the successful inclusion of students with disabilities.
On the other hand, the findings of this study revealed that the lowest mean value of teachers' negative attitude towards academic aspects is associated with teachers who believe that the resource rooms and facilities do not support inclusive efforts (Mean = 1.98 Std. 1.013). Conversely, teachers believed that inclusion created discipline problems portrays the lowest mean of score on the social and emotional aspects (Mean = 2.40 Std. 1.057). In general, the overall mean values showed that teachers were more likely to have positive attitude towards social and emotional aspects (Mean = 89.20, Std. 18.46) than negative attitude towards academic aspects (Mean = 67.87, Std. 11.53).
Like Freire (2009) this study revealed many contradictions on the legislative level that made the implementation of the teachers' new ideas of inclusion difficult to achieve. In addition, the invisible parts of teaching such as philosophy and value as well as attitude of early childhood educators in three different geographical contexts were different. For example, the previous research about Arab teachers' attitudes toward inclusion showed negative attitudes toward the idea of inclusion (Alghazo, Dodeen, & Algaryouti, 2003). This study described the shift in the attitudes to a more positive values and more understanding that the basic role in teaching children with special needs is the responsibility of regular education and not special education.
In general, there was a support of the idea of inclusion but there were many obstacles in Jordan and UAE schools. For example, there was an agreement that curriculum does not meet the needs of children with special needs. So, when it comes to implementation and demonstration general education teachers do not know how to modify the guidelines of this specific curriculum to the individual needs in their classrooms. This fact increases the instructional load of regular education teachers.
The study revealed an important difference between Southwestern USA, Jordan, and UAE contexts with regard to family support of inclusion practices. In Southwestern USA, early childhood educators mentioned that children’s parents play an important role in facilitating teacher’s efforts with their child whereas UAE teachers and Jordanian teachers did not show the same level of family support regarding inclusion practices.
98
INTERNATIONAL JOURNAL OF SPECIAL EDUCATION Vol 27, No: 2, 2012
On the other hand, the study's findings showed that Emirate teachers were more likely to have more positive attitudes towards social and emotional aspects than Jordanians teachers (mean diff. = 22.58, P = 0.00 < 0.01) and American teachers (Mean diff. = 11.69, P = .028 < 0.01). Jordanians teachers have less positive attitudes towards social and emotional aspects than American teachers (Mean diff. = -10.88667, P = 0.046 < 0.05). Although teachers from three different countries shared their attitudes and thoughts about different inclusion practices, all of them shared similar goals and values with regard to the equity that can be achieved in the quality inclusive classroom. But when it comes to practice there was gap between the theory of inclusive education and the actual practices which were influenced by economic factors, especially in Jordan and the UAE which negatively affected the adequate services that were needed to achieve successful inclusion. In this regard, one recommendation from teachers of this study was that in order to achieve a successful inclusion practices complex issues needed to be addressed. These issues include: adequate training for general early childhood teachers and families and the principals, class load, support, time and collaboration.
ConclusionThe main aim of this study was to explore teachers' perceptions toward inclusion practices in different places of this world. The importance of international collaboration and dialogue cannot be overemphasized (Yssel, et al., 2007). The findings of the study highlights that inclusion movement as an international trend needs more challenging efforts to have its philosophy being heard. It needs more collaboration efforts starting from the child with special needs, his or her family, regular children and their families, general early childhood educators, special education educators, principals, and the whole community. As the study findings highlighted that the general attitudes toward social and emotional aspects of inclusion idea were positive. The teachers shared similar goals and values with regard to the equity that can be achieved in the quality inclusive classroom. But when it comes to practice there was gap between the theory of inclusive education and the actual practices which are influenced by economic factors, especially in Jordan and the UAE. This fact negatively affected the adequate services that are needed to achieve successful inclusive practices.
Inclusion philosophy reflects hope and positive values but more efforts are needed to bridge the gap between the theory and practice of inclusion. This can be achieved by improving the services and the physical environment of the classrooms to be more welcoming. In addition, more investment should be given to improve the academic aspects of inclusion practices. Specifically, general early childhood teachers in UAE and Jordan need more training in order to be prepared to adjust their practices to meet the inclusion needs. This highlights an important implication which is the importance of revisiting study programs at the university level and revising it. In this way institutions of higher education should offer more courses about inclusion practices. Also, policymakers should revise curricula and edit it to meet the requirements of inclusion philosophy. The success of inclusion movement is a success of the nation where every child’s needs are met. As a result, administrators, special education teachers need to be more understanding and open-minded to further professional development opportunities by continuously providing in-service training for general education early childhood teachers.
When it comes to the relationship with parents of children in the inclusive classrooms, this study showed a gap between the American early childhood educator’s practices and UAE and Jordanian practices. The success of inclusion practices is strongly related to parents' support. So, American teachers who participated in this research felt more comfortable in finding supports from parents whereas UAE and Jordanian teachers who responded to the questionnaires still find hardship in communicating and getting more support from parents of children in their classroom. This lack of communication hinders the possibility of implementing successful inclusive practices. These new insights from different contexts that presented in this research can help improve the current practices in the developing countries that need to work more on parent involvement if they aim to implement inclusive practices in early childhood settings. Understanding these complex ecologies hopefully can influence the policy makers in different countries to improve their own practices in the field of inclusion by establishing a well-rounded inclusion policy that matches their own context.
ReferencesAlghazo, E. M., Dodeen, H., & Algaryouti, I. A. (2003). Attitudes of Pre-Service Teachers towards Persons with Disabilities: Predictions for the Success of Inclusion. College Student Journal, 37, (4) 515- 523. Retrieved July 02, 2009 from Questia Media America, Inc. www.questia.com
99
INTERNATIONAL JOURNAL OF SPECIAL EDUCATION Vol 27, No: 2, 2012
Billings, D. M. & Kowalski, K. (2008). Inclusive teaching. The Journal of Continuing Education in Nursing, 39, (7) 296-297. Retrieved June 10, 2009 from Wilson Select Database. Bourdieu, P. (1977). Outline of a theory of practice; translated by Richard Nice. Cambridge ; New York : Cambridge University Press.Causton-Theoharis, J. & G. Theoharis (2009). Creating inclusive schools for all students. The Education Digest, 74, (6) 43-47. Retrieved July 05, 2009 from Wilson Select database.Cannella, G. S. (2002). Deconstructing early childhood education: Social justice & revolution. New York Peter Lang. Dahlberg, G., Moss, P. & Pence, A. (1999). Beyond quality in early childhood education and care: Postmodern perspectives. London: Falmer Press.Dewey, J. (1976). The school and society. In J. A. Boydston (Ed.), John Dewey: Vol. 1. The middle works, 1899-1924 (pp. 1-109). Carbondale: Southern Illinois University Press. (Original work published 1899).Downing, J. E., & Peckham-Hardin, K. D. (2007). Inclusive educations, what makes it a good education for students with moderate to severe disabilities? Research & Practice for Persons with Severe Disabilities, 32, (1) 16-30. Retrieved June 19, 2009 from Wilson Select Database.Freire, S. (2009). Creating inclusive learning environments: Difficulties and opportunities within the new political ethos. Journal of Deaf Studies and Deaf Education, 14, (1) 131-135. Retrieved June 15, 2009 from Wilson Select Database.Hammond, H. (2003). Attitudes toward inclusion: Survey results from elementary school teachers in three Southwestern rural school districts. Rural Special Education Quarterly, 22, (2) 32-41. Retrieved January 12, 2010 from Questia Media America, Inc. www.questia.comKincheloe, J. L. (2005). Critical constructivism. New York: Peter Lang. McHatton, P. A. & McCray, E. D. (2007). Inclination toward inclusion: perceptions of elementary and secondary education teacher candidates. Action in Teacher Education, 29, (3) 25-32Perna, L. W. & Titus, M. A. ( 2005). The Relationship between Parental Involvement as Social Capital and College Enrollment: An Examination of Racial/Ethnic Group Differences. The Journal of Higher Education, 76, (5) 85-118. Praisner, C. L. (2003). Attitudes of Elementary School Principals toward the Inclusion of Students with Disabilities. Exceptional Children, 69, (2) 22-36. Retrieved January 18, 2010 from Questia Media America, Inc. www.questia.comSkrtic, T., Sailor, S., & Gee (1996). Voice, collaboration, and inclusion: democratic themes in educational and social reform initiatives. Remedial and Special Education, 17, (1), 42-57. Vygotsky, L. (1986). Thought and language. Cambridge: MIT Press.Wotherspoon, T. (2004). Education as public place and inclusive space. Education Canada, 44, (1) 12-51. Retrieved June 30, 2009 from Wilson Select database.Yssel, N., Engelbrecht, P., & Oswald, M., Eloff, I., & Swart, E. (2007). Views of inclusion: A comparative study of parents’ perceptions in South Africa and the United States. Remedial and Special Education, 28, (6) 356- 363. Retrieved June 28, 2009 from Wilson Select Database
100
INTERNATIONAL JOURNAL OF SPECIAL EDUCATION Vol 27, No: 2, 2012
LET’S ASK THE KIDS: CONSUMER CONSTRUCTIONS OF CO-TEACHING
Dusty Columbia EmburyEastern Kentucky University
Stephen D. KroegerUniversity of Cincinnati
The purpose of this study was to investigate student perceptions of co-teachers. Students with disabilities are more than twice as likely as their peers without disabilities to leave school early (Kortering & Braziel, 2002; Wilson & Michaels, 2006). Students in two inclusive classrooms in an urban middle school participated in interviews about their perceptions of being in a co-taught class. Data from the student interviews indicated that students were positive about having two adults in the classroom, however, willingness to ask for assistance varied across environments. Acceptance of instruction and discipline from either teacher also varied from classroom to classroom. The findings from this study illustrated the need for inclusion to apply to all members of the classroom—students and teachers. When teachers’ roles are reduced to that of an assistant or aide in the classroom, the students show an awareness of that power differential and status. Implications of the study suggested that parity in co-teaching was in the best interest of the teachers and students.
Responding to a Mandate for ChangeClassrooms across the country continue to change, increasing in complexity and diversity, in response to mandates enacted in federal legislation. No Child Left Behind (NCLB) (2001) increased school accountability for the performance of students with disabilities and the Individuals with Disabilities Education Act (2004) mandated the inclusion of students with disabilities and required access to the general curriculum. Advocates of students with disabilities have urged the inclusion of students with disabilities in the general curriculum; much of the impetus for co-teaching, a method to support inclusion, can be traced directly to NCLB and its requirements for student performance on mandatory state tests (Cramer & Nevin, 2006).
The attempt by schools to implement these laws has resulted in a surge of students with disabilities receiving education in general education classrooms. Students with identified educational disabilities need an individualized education in order to meet students’ specialized educational needs and the mandates of compulsory education and special education law. Is it realistic to expect individualization to be addressed in general education classrooms?
Many schools have chosen to work toward inclusivity and individualization through the use of co-
101
INTERNATIONAL JOURNAL OF SPECIAL EDUCATION Vol 27, No: 2, 2012
teaching. Co-teaching is, in fact, the most common service delivery model for students with disabilities receiving instruction in the general education classroom (City University of New York, National Center on Educational Restructuring and Inclusion, 1995). Responding to these new complexities many schools sought instructional strategies that supported students with disabilities in the general education classroom (Weiss & Lloyd, 2002).
Co-Teaching Co-teaching can be defined as two professional educators delivering substantive instruction to a diverse group of students, including students with disabilities, within a single space—typically a shared classroom (Cook & Friend, 1995). During co-teaching, special and general educators are partners in planning, delivery of instruction, and evaluation of diverse groups of students (Cook & Friend, 1995). While some research has been unclear as to the efficacy of co-teaching regarding student outcomes (Weiss & Brigham, 2000; Murawski & Swanson, 2001), and others have expressed concerns that co-teaching may not be effective for improving academic achievement of any students (Klinger, et al., 1998; Zigmond & Magiera, 2001), still others have illustrated benefits of co-teaching for teachers and students (Schwab & Learning, 2003; Villa, et al., 2004).
Cook and Friend (1995) described six variations of co-teaching and noted that no particular genre or mode of co-teaching should be used exclusively by a teaching team. The five variations are described in Table 1. One of the most well known models of co-teaching was described by Cook and Friend (1995) who delineated six strategies for co-teaching. They are: One teach/one assist; One teach/one observe, Station teaching, Parallel teaching, Alternative teaching, and Teaming; and will be discussed in detail below. No particular strategy for co-teaching is meant to be used exclusively by a teaching team (Cook & Friend, 1995). Each of these strategies has strengths and weaknesses and one may work better for a particular lesson or teaching partnership than another. Furthermore, teacher familiarity, comfort, and competence in using all of the strategies is essential to maintain parity and to ensure that the each teacher uses her or his specific areas of expertise in order to meet the needs of the individual students (Dieker & Little, 2005).
Table 1. Six Co-teaching ModelsCo-teaching Model DefinitionOne Teach/One Assist One teacher has primary responsibility for
teaching while the other circulates through the room providing unobtrusive assistance to students as needed.
One Teach/One Observe One teacher teaches while the other teacher observes/gathers data. Teachers decide in advance what information needs to be gathered and how data will be collected. Both teachers analyze the information together.
Station Teaching Teachers divide content students rotate from one teacher to another to an independent station. Each teacher repeats instructions three times and students access both teachers and the independent station.
Alternative Teaching Large group completes the planned lesson while smaller group completes an alternative lesson or the same lesson taught at different levels or for different purposes.
Parallel Teaching Both co-teachers teach the same information, but they divide the class and conduct the lesson simultaneously.
Team Teaching Both teachers deliver the same instruction at the same time. Each teacher speaks freely during large-group instruction and moves among all
102
INTERNATIONAL JOURNAL OF SPECIAL EDUCATION Vol 27, No: 2, 2012
students in the class. Instruction becomes conversation, not turn taking.
One teaches and one assists. In this type of co-teaching, both educators are present, but one takes the lead while the other teacher moves about the room assisting students and providing support as needed (Cook & Friend, 1995). This approach requires little planning and allows one teacher to provide individual support for students. However, this model does not encourage teacher parity and could force one teacher into the role of an aid (Friend & Cook, 2003; Vaughn, Schumm, & Arguelles, 1997; Weiss & Lloyd, 2002). Friend and Cook (1995) suggest that this problem could be overcome if teachers alternate roles between lead and support.
One teaches and one observes. This type of co-teaching appears similar to the one teach/one assist model in that one teacher takes the role of a lead teacher. The second teacher then engages in a detailed observation of the students or teacher and actively collects data. This approach requires teachers to plan in advance what type of data needs to be collected, how to gather the data, and how the data will be analyzed and used by both teachers (Cook & Friend, 1995). The same concerns with teacher parity and one teacher falling into the role of an aid exist with this model as with the one teach/one assist model. Care must be taken to avoid static roles with this strategy.
Station teaching. Station teaching allows teachers to divide instructional content into two, three, or more segments and present that content at different locations in the classroom support (Cook & Friend, 1995). Two teachers may divide content into two stations and teach half of the material to half of the class and then trade and repeat the instruction with new students. Teachers may also choose to add a third independent station where students may work independently or with a partner. Station teaching requires teachers to share responsibility for planning and content delivery. Station teaching may help new co-teachers feel more comfortable, students may benefit from the lower student-teacher ratio, and the integration of students with disabilities. Station teaching is appropriate for all grade levels. Moreover, equal teacher status in the classroom is not a serious concern because both teachers have active teaching roles. Challenges to station teaching include increased noise and activity level as well as maintaining the pace of the lesson to match the other teacher for transitions (Cook & Friend, 1995).
Parallel teaching. Parallel teaching involves each teacher delivering instruction to a heterogeneous group made up of half of the class support (Cook & Friend, 1995). Parallel teaching lowers the student-teacher ratio and may be used when students would benefit from hands-on activities, peer interaction, or responding aloud. Co-teachers plan instruction jointly, but deliver the lesson independent of the other teacher. Considerable planning may be needed to ensure that both groups of students receive the same instruction in the same amount of time. Similar to station teaching approaches, noise and activity levels may be problematic.
Alternative teaching. Alternative teaching allows one teacher to work with a small group of students (e.g., 3-8 students) while the other teaches the large group support (Cook & Friend, 1995). Students with disabilities may benefit from this approach more than the station or parallel teaching approaches. Alternative teaching may be used for enrichment interest groups, assessments as well as pre-teaching and re-teaching. Alternative teaching does risk stigmatizing students those students grouped for re-teaching often; but the risk can be reduced by varying groupings (Cook & Friend, 1995).
Team teaching. Team teaching allows both teachers to share the planning and instruction of students support (Cook & Friend, 1995). Teachers may role-play, take turns leading discussion, demonstrate a concept while the other teacher speaks, or model note-taking or other skills. While many veteran co-teachers find this type of teaching effective and rewarding, some teachers are not comfortable with it. Team teaching requires mutual commitment, trust, and communication (Cook & Friend, 1995).
Co-teaching and Student PerceptionsCurrent co-teaching research has focused on types of co-teaching and implementation of co-teaching (Bouck, 2007; Cook & Friend, 1995; Morocco & Aguilar, 2002), co-teacher behavior (Harbort, et al., 2007), and teacher attitudes and perceptions (Trent, 1998). Research on student perceptions of co-teaching strategies is limited and it warrants further investigation. Educational research addressing student perceptions in inclusive classrooms has focused on routines and procedures (Klinger, 1999; Lloyd, 1995), placement (Whinnery, 1995), individualization of homework and adaptations (Bryan & Nelson, 1994; Fulk & Smith, 1995; Lloyd, 1995), and grading practices (Bursuck, Munk, & Olson,
103

INTERNATIONAL JOURNAL OF SPECIAL EDUCATION Vol 27, No: 2, 2012
1998). As the body of literature regarding co-teaching in inclusive classrooms builds, research including student perceptions must be addressed because student understandings may lead to more effective practice and increased student engagement in the learning process (King, 2003; Kortering & Braziel, 1999; Wentzel, 1997).
Student perceptions of teachers and school environments can have a profound influence on student interaction, motivation, and effort (Kortering & Braziel, 1999; Wentzel, 1997). Recognizing the popularity of co-teaching as a model for inclusion, it is imperative to consider student perceptions because these insights can act as an indicator for program effectiveness (King, 2003). Student perceptions are an important resource for teachers (Keefe, Moore, and Duff, 2004; Klinger and Vaughn, 1999; Kortering and Braziel, 2002) and those perceptions may influence motivation and success (Wilson and Michaels, 2006).
Students are consumers (Skrtic, 2005) and as such are a valuable and untapped resource in determining effectiveness of strategies such as co-teaching. Examination of student perceptions may change implementation of co-teaching as a method of inclusion and a means to access to the general curriculum for students with disabilities. Wiggins and McTighe (2005) drew comparisons to architects, engineers, and builders to teachers as designers who depend on the consumer, who are the end users, for their basic design purposes and features. Teachers are constrained not only by professional and content standards, but also by the needs of their consumers—the students.
Purpose and Research QuestionThe cost of student disengagement is substantial. Students with disabilities are more than twice as likely as their peers without disabilities to leave school early (Kortering & Braziel, 2002; Wilson & Michaels, 2006). Given the significance of student perceptions and their influence on educational outcomes (Kortering & Braziel, 1999), there is a critical need for research in this area. The purpose of this study was to investigate student perceptions of co-teachers. The questions that guided this investigation were: What are student perceptions of co-teachers and co-teaching? Does the co-teaching behavior of the teachers influence the students’ perceptions?
MethodologyContext This study was conducted at a suburban, public middle school serving 678 seventh and eighth grade students. The site was selected as a convenience sample because the researcher taught in the district, although not in these classes. Nearly 40% of all students in the building met the qualification for economically disadvantaged, meaning that just under half of the student body had family incomes of 130% to 185% of the federal poverty guidelines. For example, in this community a family of four would have an annual income of less than $38,203 to qualify for reduced lunch and the same family would have an income of less than $26,845 to qualify for free lunch. The percentage of students identified with a disability in this district is 14.8%. Table 2 illustrates demographic data regarding the student population.
Table 2. School DemographicsAfrican-American
Multi-racial
Caucasian Hispanic Limited English
Students with Disabilities
Economically Disadvantaged
70% 9.2% 15% 4.2% 3.1% 16.6% 39.7%Note. Ohio Department of Education
ParticipantsSeven students in grades seven and eight participated in individual interviews. Three seventh grade students, Malik, Alyssia, and Aysha (pseudonyms), participated. Four eighth grade students, Shakir, Shandra, Javonda, and Terrell (pseudonyms), to protect anonymity, participated. Alyssia and Shandra had identified learning disabilities. All participants received instruction in Reading and Language Arts in an inclusive and co-taught with a general and special educator.
The school administration implemented inclusion practices one year prior to the study at the start of the school year. Teachers were not consulted and neither planning nor preparation was employed. Students that had formerly received all instruction in a self-contained resource setting were rescheduled to attend co-taught classes with their typically developing peers. Resource class sections, where students with disabilities were pulled out for special instruction, were significantly reduced. Only students identified as
104
INTERNATIONAL JOURNAL OF SPECIAL EDUCATION Vol 27, No: 2, 2012
having a cognitive disability or significant behavioral concerns received separate instruction in the resource room.
This study looked at students in a seventh grade language arts class and an eighth grade language arts class. Both classes were co-taught by two different teams of teachers. These teams used different co-teaching approaches. The teachers of the seventh grade co-taught language arts class taught together daily and employed only the one teach/one assist model of co-teaching. The general education teacher maintained the teach role while the special educator utilized the assist role. According to the students and the teachers, the general education teacher prepared and delivered lectures, monitored grading, and communicated with parents. The special education teacher assisted students individually with work and testing and monitored IEP goals and progress.
The teachers of the eighth grade co-taught language arts class taught together daily and employed a variety of strategies, self-disclosing that they most often used the station, parallel, and team teaching strategies. Both general and special education teachers stated that they were interchangeable in the roles and shared time presenting information equally. Both teachers communicated with parents and monitored grades. The special education teacher maintained responsibility for IEP goal monitoring, but the general education teacher provided input on progress.
Data collection and AnalysisSemi-structured interviews with students were conducted at the middle school during a non-graded resource bell used for completing homework and reading time. Each student was asked to respond to a series of questions that explored the roles of teachers in their classrooms. For example, students all responded to the question: What are the roles of your teachers? See figure 1 in Appendix A for the complete interview protocol.
The interviews took place during the spring quarter, after students had received mid-term grades and before mandatory state achievement testing. Kortering and Braziel (1999) suggest that interviewing students at this time of the school year when students had established sufficient experiences with co-teachers to form perceptions. Due to the age of the participants, assent and parental consent were also obtained.
Data analysis for this study was multi-level and consisted of inductive analysis (Hatch, 2002) and open coding (Strauss & Corbin, 1998). Interview transcripts were analyzed for common themes. Open codes were created by the first and second author individually and then discussed together. Disagreements were analyzed and re-coded and then axial codes were identified. Data was organized into displays and both authors discussed and analyzed emergent themes.
Trustworthiness and CredibilityPeer debriefing and member checking ensured the trustworthiness of this study (Hatch, 2002). Peer debriefing with a colleague and mentor at the university occurred at each stage of analysis. Interviews were digitally recorded and field notes were taken. All responses were transcribed. Student participants had the opportunity to review transcripts from interviews and give feedback (Brantlinger, et al., 2005; Hatch, 2002).
Narrative of FindingsSeveral themes emerged from the interview data. Student responses to the interviews were categorized as relating to role and perception of ability. Role and perception of ability were further delineated to role of general educator and role of special educator and perception of the student’s own ability and perception of other students’ abilities. When students described their teachers’ roles, they did so in terms of what each teacher did or functions that he or she performed. Students identified jobs or tasks that were categorized into five roles: teach, re-teach, discipline, organize, and support. Table 3 illustrates the roles with samples of student responses.
Table 3. Roles and sample responsesTeacher Role Student ResponseGeneral Educator Teach To teach… Language Arts.
Re-teachYou have somebody extra in there to explain it more to you.Makes sure people is paying
105

INTERNATIONAL JOURNAL OF SPECIAL EDUCATION Vol 27, No: 2, 2012
Special Educator Discipline attention and makes sure people ain’t talking; Keep us out of trouble, like to stop talking and stuff like that.
OrganizeShe gets everything prepared and together.
SupportShe helps them go over the test before they take it; To help us understand
All student responses regarding teacher roles were categorized as one of the five tasks shown above. Students attributed the majority of the roles to both teachers in varying degrees, and significant differences in attribution arose when comparing the seventh grade class, which exclusively used the one teach/one assist model, to the eighth grade class, which used several co-teaching models. Other responses were categorized as student perception of student ability. Students made some statements indicating their assurance in their own abilities while other statements were intended to separate the responding student from other students that did require additional help from teachers. Some examples can be seen in Table 4.
Table 4. Student Perception of AbilityStudent’s own ability Others’ abilityThe only time I need a tutor is in math. Everything else I’m good
the people that don’t learn as fast; people that need help on mostly the stuff that we be doing
Another category, validity, emerged from the descriptors students used to describe either the teacher or location of teaching from particular teachers. Students in the seventh grade class, where co-teaching was less complex and roles were not shared, repeatedly referred to their general educator as the real or regular teacher. These descriptions indicated what we interpreted as a student perception that there was a lack of parity between the teachers and the perception of the special educator as not real or not valid as a teacher. Because these same students referred to those students that needed assistance as other indicated that this perception may have carried over from the teacher to students. This distinction is important because students’ perceptions of the teacher as valid or conversely, invalid, may ultimately indicate a perception of their own learning needs or abilities as legitimate or illegitimate.
The co-teaching approaches used by the teaching pairs varied significantly and student perceptions of teacher performance showed great disparity between the two classrooms. Tables 5-8 illustrate the types of words and number of times a word was referenced by students in relation to particular teachers. In table 5, words and phrases used by the seventh grade students indicated the type of roles they perceived the general and special education teachers to have had. The words and phrases listed were used by the students and the number in the column to the right of the word indicates the number of times students used the word or phrase to describe the teacher’s role.
The three seventh grade students, Malik, Alyssia, and Aysha, indicated that their general education teacher taught, organized, and disciplined students. Malik said, Mrs. S, she’s like the head teacher and she gets everything prepared and together. These students also differentiated between the general education teacher and the special education teacher by describing her class as the real class. Alyssia describes the teachers saying, [She is the] teacher who’s always in the real class instead of taking other people to a different class to help them. These same seventh grade students indicated that their special education teacher’s role was to re-teach, organize, and support students. Aysha said of the special educator, Mrs. D, she’s like a helper and she helps out on the Daily Sponge and things and people who need help. Malik described the special educator’s role saying, Mrs. D, she’ll come over and go over it again and make sure we understand it and then we get all the answers. That makes it easier. The role delineation was clear between the two teachers with the general educator holding a lead teacher status. The students viewed the special educator as an adult who helped students, but not someone in control of learning process or the classroom (see Tables 5 and 6).
Table 5. Key words used to describe 7th grade general educator in co-taught classroomTeacher Role Student Examples Coded
106
INTERNATIONAL JOURNAL OF SPECIAL EDUCATION Vol 27, No: 2, 2012
General Educator Teach Real class (1)Goes over (3)Head/lead/main teacher (1)
DisciplineMakes sure [procedures] (2)Enforces rules (1)
OrganizeHands/passes out [home work, assignments] (3)Get’s everything prepared (1)Gets class in order (1)
Reward Give us [rewards] (1)Table 6. Key words used to describe 7th grade special educator in co-taught classroom
Teacher Role Student Examples CodedSpecial Educator Teach other Different [class] (2)
Re-teachGoes over (3)Explains (1)
In Table 7 and Table 8, words and phrases used by the eighth grade students indicated the type of roles they perceived the general and special education teachers to have had. The four eighth grade students, Shakir, Shandra, Javonda, and Terrell, indicated that their general education teacher taught, helped or supported students, and enforced rules. Three of the four students responded that both teachers had the same job. One eighth grade student, Shakir, responded, They got the same job…to teach us and make sure we understanding what we learning. [They] make sure we are following school rules and enforcing them. In fact, three of the four eighth grade students interviewed indicated that both the general and special education teachers had identical jobs. The fourth student, Shandra, described the general education teacher’s role saying, It’s Mrs. S’s job to teach and Mrs. G’s (special education teacher) to help people. But when asked what the special education teacher did Shandra stated that she taught reading. Shandra also described the role of the special education teacher saying, She [special education teacher] do both [teach and help in reading and language arts]. The roles of the teachers in the eighth grade classroom appear to be much more interchangeable than the roles of the teachers in the seventh grade classroom.
Table 7. Key words used to describe 8th grade general educator in co-taught classroomTeacher Role Student Examples CodedGeneral Educator Teach Teach (6)
Head/main/real teacher (1)Same as the co-teacher (3)Regular class (2)
Re-teachHelp us get better at (1)Makes sure [understanding](2)
DisciplineEnforces rules (2)
SupportHelps [other] students (1)Helps (5)Asks questions (1)Makes it easier (1)
Table 8. Key words used to describe 8th grade special educator in co-taught classroomTeacher Role Student Examples CodedSpecial Educator Teach Teach (8)
Main teacher (1)Not regular teacher (1)Regular class (2)
Re-teachGives attention (1)Breaks it down (1)Makes sure (2)Take people out (1)
DisciplineEnforce rules (1)Keeps students out of trouble (1)
107
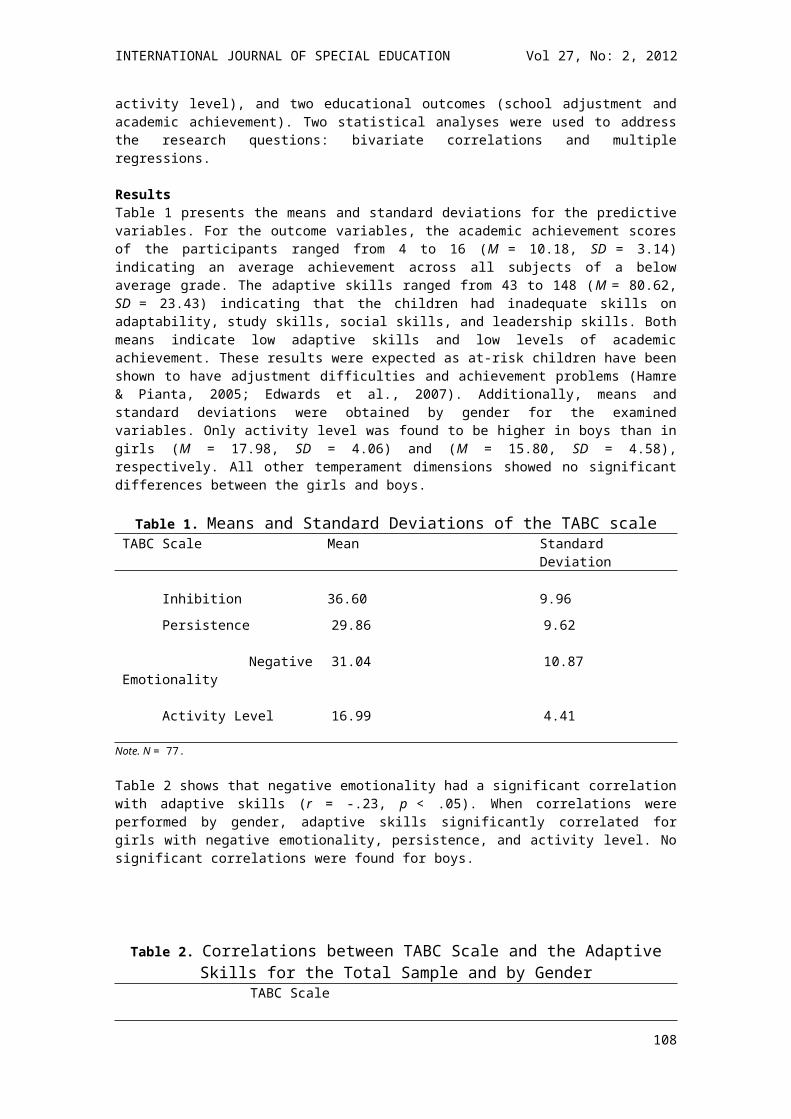
INTERNATIONAL JOURNAL OF SPECIAL EDUCATION Vol 27, No: 2, 2012
SupportHelps/helper (8)Helps other students (2)Help us get better at (1)Asks questions (1)Makes it easier (1)
Responses to other question such as whether or not students liked having two teachers or why they thought there were two teachers held no significant distinction between the two classrooms. Students generally appreciated having two teachers in the classroom because it decreased wait time for assistance and students that needed help could get help. Students indicated that the reason for having two teachers was to maintain order and discipline in the classroom.
DiscussionBecause the teachers received no professional development in various approaches to co-teaching, and administration and expectation from administration regarding implementation was unclear, co-teaching practice in classrooms was diverse. As a result, students in the two classrooms perceived their teachers in different ways. The disparity was evident when students discussed the roles of the teachers. The significant difference between the two classrooms concerned co-teaching strategies used by the co-teaching team. The use of co-teaching strategies by both teachers affected how the students perceived each teacher. Researchers engaged in exploration of co-teaching consistently mention parity as a significant issue in co-teaching (Dieker & Little, 2005; Cook & Friend, 1995; Boudah, Schumacher, & Deshler, 1997; Walther-Thomas, et al., 1999). Parity is a prerequisite for effective co-teaching and learning. The strategies that each teaching pair employed and their implementation of those strategies had a direct impact on student perceptions of teacher roles and may have led to negative student perceptions of themselves as learners.
The seventh grade students consistently used words or phrases in their descriptions of their general education teacher that indicated that she was the main teacher, in charge, and controlled learning, assignments, and grading. This is not surprising given that the only strategy used for co-teaching by the pair was the one teaches and one assists model and that teachers did not alternate roles for teach and assist. Rather, the special educator was always assigned the assist role. Furthermore, it was in these seventh grade interviews that the student views of their teachers could be divided into categories of either legitimate or illegitimate based on which teacher engaged in the activity.
Students referred to the general education teacher as the real or head teacher and referred to her work space as the real class. Students labeled the special education teacher as a helper and referred to her work and students as other. One seventh grade student, Malik, stated that the special educator’s job was to work with specific students that don’t learn as fast. This kind of perception among students regarding a classroom teacher could have had a significant and negative impact on learning for all students. Students may be hesitant to ask for assistance when needed or refuse accommodations and differentiation that may make students successful in order to not be one of the others.
Students in the eighth grade co-taught class differentiated between the two teachers much less than their seventh grade counterparts as evidenced by their choices of words and phrases to describe their roles. Students insisted that their jobs were the same and that both teachers taught all students. It is interesting to note that students in the eighth grade co-taught class use the words teach/teacher more often to describe their special education teacher than their general education teacher and used the words help/helper/helping nearly equally for both teachers. While at least one student described the general education teacher as the main teacher and the special educator as not the regular teacher, that may be attributed to the fact that the particular student answering the question received special education services and the same special educator co-taught in her science class in the one teach/one assist role. That is, she may have differentiated the teachers based on her other experiences with inclusive education in a situation with less parity.
Limitations Certain limitations existed for this study that limits the ability to make generalizations about the results. First, the student sample was small with only seven students representing two grades participating in the interviews. Two of the students that participated had identified disabilities and may have struggled with understanding the questions being asked and/or expressing themselves adequately. Questions and student
108
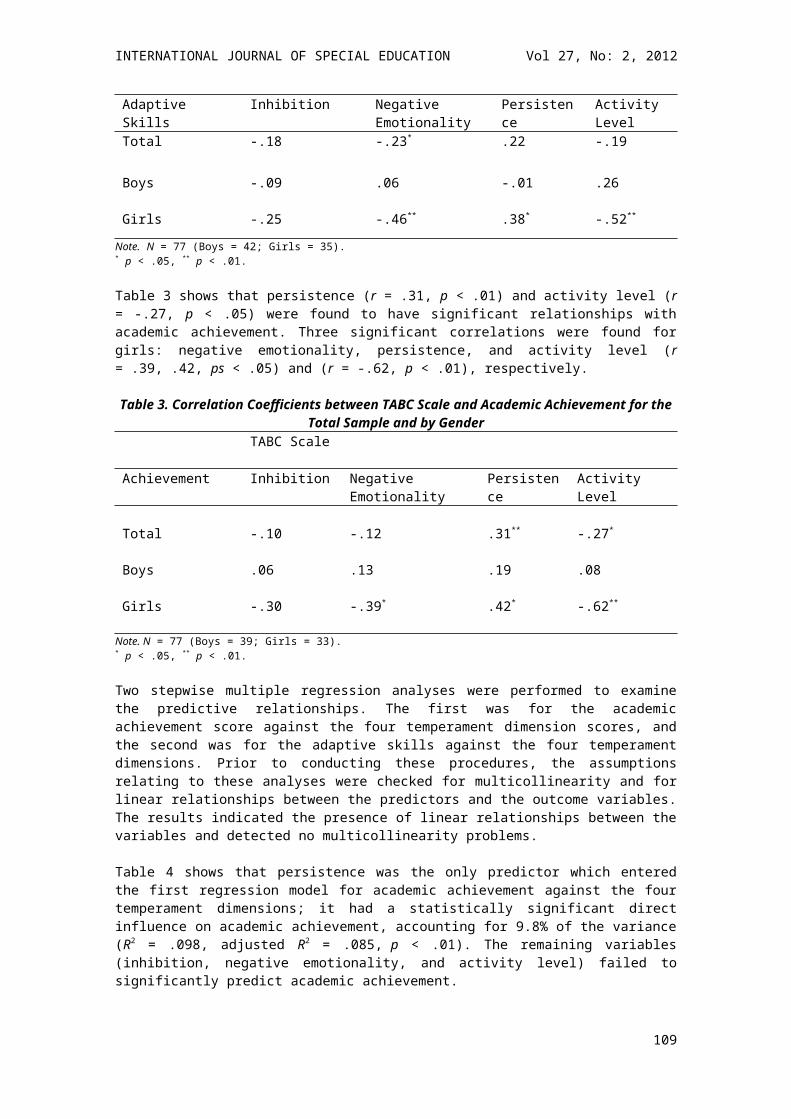
INTERNATIONAL JOURNAL OF SPECIAL EDUCATION Vol 27, No: 2, 2012
responses were rephrased for confirmation with those two students. The student population was not racially diverse. All students that participated in the study were African-American, and while a disproportionate number of African American students receive special education services, the student sample did not represent (racially) the proportions of the district. It should also be noted that observations were not conducted to verify the co-teaching strategies implemented. Rather, the teachers independently and anecdotally self-reported their teaching patterns. This information, along with student voice triangulation indicated agreement in what the teachers and students perceived to be their implementation of teaching strategies and techniques.
Implications for practiceCo-teaching approaches to instructional delivery may support the moral imperative to address the learning needs of all students in increasingly diverse classrooms. Previous research about student perceptions concerning strategies used in classrooms suggests that consumer perceptions cannot be ignored. The findings from this study illustrate the need for inclusion to apply to all members of the classroom—students and teachers. In order for students to be and feel fully included in the classroom, general and special teachers must demonstrate inclusion as equal and contributing members of the classroom community as well. When teachers’ roles are reduced to that of an assistant or aide in the classroom, the students show an awareness of that power differential and status. Students who view their special educator in the classroom as other also view fellow students as other; and this was particularly clear in the seventh grader interviews.
ConclusionFrequent role changes by the teachers and use of multiple strategies to fit the needs of the lesson and classroom are behaviors that the teachers can control and have an impact on the student perceptions of the teachers and themselves as learners. The students in the eighth grade classroom showed little difference in their perceptions of the two teachers in their classroom and recognized, received, and appreciated help from either teacher. Teacher behavior affects more than just what students learn about their content area. Findings from this study indicate that the power of teacher behavior may lie in what teachers may view as unintentional teaching. Teacher behavior toward one another can create a visible us versus them mentality among students or it can create a community of inclusive learners and teachers, as evidenced in the eighth grade class.
More work, however, needs to be done in this area. Larger samples with teachers using multiple strategies for co-teaching would show if these findings are unique. Additional research should also consider student work samples and performance in connection with teacher behaviors and student perceptions. Additional research in the area of co-teaching will build the body of literature and regarding this practice and will add to the strength of these findings. Also, while perception is important, is not enough. Further research investigating both perception and performance is necessary to draw further conclusions about the effectiveness of co-teaching as a strategy for teaching all learners. The information yielded from this further research will contribute to a growing foundation for co-teaching as an effective and evidence based practice in inclusive classrooms. Assessing the impact of the co-teaching model on student learning has been under researched (Morrocco and Aguilar, 2002), and given the prolific nature of co-teaching as an intervention for inclusion the student factor cannot continue to be overlooked.
ReferencesBouck, 2007 Book, E. (2007). Co-teaching…Not just textbook term: Implications for practice. Preventing School Failure, 51(2), 46-51.Boudah, D.J., Schumacher, J.B., & Deshler, D.D.(1997). Collaborative instruction: Is it an effective option for inclusion in secondary classrooms? Learning Disability Quarterly, 20, 293-316.Brantlinger, E., Jimenez, R., Klingner, J., Pugach, M., & Richardson, V.(2005). Qualitative studies in special education. Exceptional Children, 71, 181-194.Bryan, T., & Nelson, C.(1994). Doing homework: Perspectives of elementary and junior high school students. Journal of Learning Disabilities, 27, 488-499.Bursuck, W.D., Munk, D.D., & Olson, M.(1998). The fairness of report grading adaptations: What do students with and without disabilities think? Manuscript submitted for publication. Cited in Exceptional Children, 66(1), 23-37.Cook, L., & Friend, M. (1995). Co-teaching: Guidelines for creating effective practices. Focus on Exceptional Children, 28(3), 1-16.
109
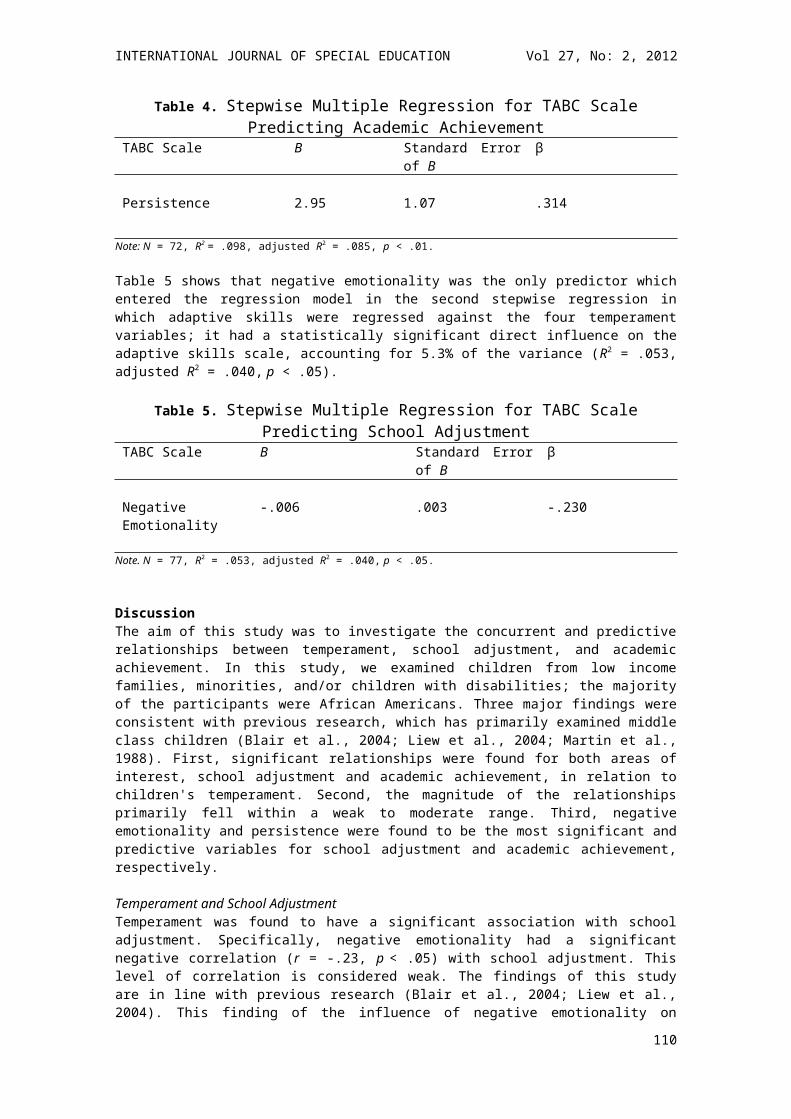
INTERNATIONAL JOURNAL OF SPECIAL EDUCATION Vol 27, No: 2, 2012
Cramer, E., & Nevin, A.(2006). A mixed methodology analysis of co-teacher assessments. Teacher Education and Special Education, 29(4), 261-274.Dieker, L., & Little, M.(2005). Secondary Reading: Not just for reading teachers anymore. Intervention in School and Clinic, 40(5), 276-283.Education for All Handicapped Children Act, 20 U.S.C. Sections 1400-1461 (1975).Friend, M., & Cook, L.(2003). Interactions: Collaboration skills for school professionals (4th ed.). New York, NY: Allyn and Bacon.Friend, M. (2007). Successful Co-teaching Strategies Increasing the Effectiveness of Your Inclusive Program: A Resource Handbook. Bureau of Education and Research, Bellevue, WA.Fulk, C.L., & Smith, P. J.,(1995). Students Perceptions of teachers’ instructional and management adaptations for students with learning or behavior problems. The Elementary School Journal, 95, 409-419. Gerber, P., & Popp, P. (1999). Consumer perceptions on the collaborative teaching model: Views of students with and without learning disabilities and their parents. Remedial and Special Education, 20(5), 288-296.Hatch, J.A. (2002) Doing Qualitative Research in Education Settings. Albany: State University of New York Press.Harbort, G., Gunter, P., Hull, K., Brown, Q., Venn, M., Wiley, L., & Wiley, E.(2007). Behaviors of Teachers in Co-taught Classes in a Secondary School. Teacher Education and Special Education, 30(1), 13-23. IDEA (2004) Individuals with Disabilities Education Improvement Act. PL 108-446, 108th Cong., 20 U.S.C. 1400 et seq. (2004) (enacted).Keefe, E., Moore, V., & Duff, F.(2004). The Four “Knows” of Collaborative Teaching. TEACHING Exceptional Children, 36(5), 36-42.King, I.C. (2003). Examining middle school inclusion classrooms through the lens of learner-centered principles. Theory into Practice, 42(2), 151-157.Klinger, J. (1999). Students Perceptions of Instruction in Inclusion Classrooms: Implications for Students with Learning Disabilities. Exceptional Children, 66(1), 23-37.Kortering, J. & Braziel, P.(1999). School dropout from the perception of former students: Implications for secondary special education programs. Remedial and Special Education, 20(2), 78–83.Kortering, J. & Braziel, P.(2002). A look at high school programs as perceived by youth with learning disabilities. Learning Disability Quarterly, 25(3), 177-188.Leafstedt, J, Richards, C., LaMonte, M., & Cassidy, D.(2007). Perspectives on co-teaching: views from high school students with learning disabilities. Learning Disabilities, 14(3), 177-184.Lloyd, S. R. (1995, April). Teacher traits students find helpful or bothersome: Implications for the inclusive classroom. Paper presented at the annual meeting of The Council for Exceptional Children, Indianapolis, IN. (ERIC Document Reproduction Service No. ED 386 842)Morocco, C. & Aguilar, C.(2002). Co-teaching for content understanding: a school-wide model. Journal of Educational and Psychological Consultation, 13(4), 315–347.Murawski, W., & Swanson, H.(2001). A meta-analysis of co-teaching research: Where are the data? Remedial and Special Education, 22(4), 258-267.No Child Left Behind Act of 2001. Pub.L.107-110. (2001). Retrieved November 21, 2007 from http://www.access.gpo.gov/nara/publaw/107publ.htmlSchwab Learning. (2003). Collaboratively speaking: A study on effective ways to teach children with learning differences in the general education classroom. The Special Edge, 16(3), 1-4. Skrtic, T., Harris, K. & Shriner, J.(2005). Special education policy and practice: Accountability, instruction, and social challenges. Denver, CO: Love Press.Strauss, A., & Corbin, J.(1998). Basics of qualitative research: Techniques and procedures for developing grounded theory (2nd ed.). Thousand Oaks, CA: Sage.Trent, S. (1998). False starts and other dilemmas of secondary general education collaborative teacher: A case study. Journal of Learning Disabilities, 31, 503-513.Villa, R., Thousand, J., & Nevin, A.(2004). A guide to co-teaching: Practical tips for facilitating student learning. Thousand Oaks, CA: Corwin Press.Walther-Thomas, C., Korinek, L, & McLaughlin, V. (1999). Collaboration to support students' success. Focus on Exceptional Children, 32, 1-18.Wentzel, K. (1997). Student motivation in middle school: The role of perceived pedagogical caring. Journal of Educational Psychology, 89(3), 411–419.Weiss, M. & Brigham, F.(2000). Co-teaching and the model of shared responsibility: What does the research support? In T.E. Scruggs & M.A. Mastropieri (Eds), Educational Interventions: Advances in learning and behavioral disabilities (Vol.14, pp.217-245). Stamford, CT: JAI.
110
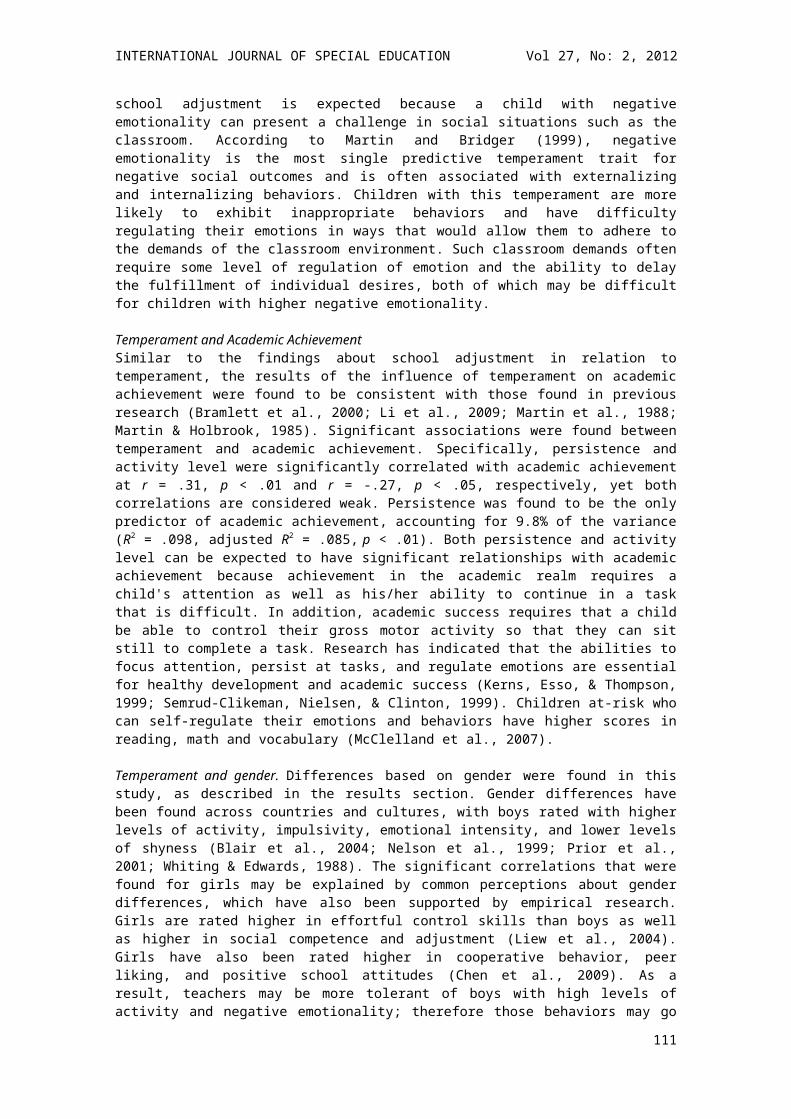
INTERNATIONAL JOURNAL OF SPECIAL EDUCATION Vol 27, No: 2, 2012
Weiss, M & Lloyd, J.(2002). Congruence between roles and actions of secondary special educators in co-taught and special education settings. Journal of Special Education, 36, 58-69.Whinnery, K, & King, M.(1995). Perceptions of students with learning disabilities. Preventing School Failure, 40, 5–9. Wiggins, G., & McTighe, J. (2005). Understanding by design (Second ed.). Alexandria, VA: Association for Supervision and Curriculum Development.Wilson, G. & Michaels, C.(2006). General and special education students’ perceptions of co-teaching: Implications for secondary-level literacy instruction. Reading & Writing Quarterly 22, 205-222.Zigmond, N., & Magiera, K.(2001). Co-teaching. Current Practice Alerts 6, 1-4.
Interview Protocol
1. What are the roles of your teachers?2. Do you like having two teachers?3. Why do you think you have two teachers?4. How would you feel if one of your teachers was a special education teacher?
Responses to these questions did not appear to have any impact on the students’ understanding of roles or perceptions of teachers. Six of the seven participating students indicated that they liked having two teachers because it allowed them to understand work better and get help more often with less wait time. All students indicated that they thought they had two teachers to maintain classroom control and help students understand material better. Two students indicated that they found having two teachers mildly frustrating because they had to work harder to not get caught misbehaving or avoiding work; but both of those students also said that they appreciated having an extra teacher to help with questions and work. Only one student of the seven clearly understood and was able to articulate what a special education teacher was. The other students asked for an explanation of what a special education teacher is and does, so no real significance can be drawn from those responses.
111
INTERNATIONAL JOURNAL OF SPECIAL EDUCATION Vol 27, No: 2, 2012
LISTENING TO THEIR VOICES: FACTORS THAT INHIBIT OR ENHANCE POSTSECONDARY OUTCOMES
FOR STUDENTS’ WITH DISABILITIES
Dorothy F. Garrison-WadeUniversity of Colorado Denver
Although an increasing number of students with disabilities are considering postsecondary educational opportunities, many of these students find the challenges daunting as compared to their secondary educational experiences. The purpose of the qualitative case study reported herein was to learn more about students’ perceptions of services received in college in order to develop a clearer understand of how to better ensure positive outcomes. Fifty-nine students with various disabilities and six disability resource coordinators from five two-year community colleges and three four-year universities participated in the study. Three major themes emerged from the data, including: (a) capitalizing on student self-determination skills, (b) implementing formalized planning processes, and (c) improving postsecondary support. The author developed a preliminary framework based on the analysis of the data. This framework included three key factors that contribute to the success of students with disabilities in postsecondary institutions; (1) self-determination, (2) planning efforts, and (3) postsecondary supports. The article concluded with recommendations for improving postsecondary outcomes for students with disabilities.
While attendance by students with disabilities in postsecondary institutions has increased in past decades (National Center for Educational Statistics, 2006), only 12% of individuals with disabilities graduated from college (Dowrick, Anderson, Heyer, & Acoster, 2005). Research suggests that high school experiences of students with disabilities do not adequately prepare many of them for postsecondary success (Bangser, 2008). Inadequate transition planning while in secondary school is one reason for the low graduate rate (Gill, 2007), indeed; Kochhar-Bryant, Bassett and Webb (2009) refer to the transition from secondary to postsecondary settings as a transition cliff for young people with disabilities (p. 23). Key differences between secondary and postsecondary educational settings include the roles and responsibilities of support staff (e.g., those of disability specialists in postsecondary settings versus those of special education teachers in secondary settings), legal protections for students with disabilities, and greater demands for students’ self-reliance (Mellard, 2005). Another major difference between secondary and postsecondary services for students is a shift of responsibility from special educators and parents to the students themselves with regard to obtaining information and advocating for services.
The article examined some of the challenges many students with disabilities encountered in postsecondary educational settings through a qualitative case study. First, a brief overview of these challenges and supports reported from other researchers are presented. Then, through an analysis of the
112

INTERNATIONAL JOURNAL OF SPECIAL EDUCATION Vol 27, No: 2, 2012
case study findings, a preliminary framework was developed that included supports needed to facilitate students’ success. The article concluded with suggestions from students in the study to educators to aid in improving outcomes of students with disabilities as they transition into postsecondary education. The ultimate purpose of this article was to offer effective strategies on how to support students’ with disabilities in their transitions from secondary to postsecondary educational experiences and improve their chances of success.
Challenges in PostsecondaryEven though students with disabilities have gained increased access to higher education, significant access and retention barriers continue to plague these students in postsecondary institutions (National Council on Disability, 2003; Stodden, 2001). For over a decade, researchers have been examining challenges for students with disabilities in their transition to postsecondary (see Fairweather & Shaver, 1991; Lehmann, Bassett, & Sands, 1999; Wagner & Blackorby, 1996) in an effort to mitigate those challenges and increase their access and retention. These barriers fall into categories: architectural/access, programmatic, informational, and attitudinal (Garrison-Wade, 2007; Lehmann, Davies, & Laurin, 2000).
Architectural impediments that students with disabilities encounter include inadequate access to public transportation, university facilities, and technology. Hart, Zafft, and Zimbrich (2001) reported transportation-related issues for students with disabilities learning to use public transportation; needing support to identify and arrange for transportation, such as car pooling with other college students; and obtaining travel vouchers, accessible transportation, and driving lessons. Once students overcome the architectural hurdles preventing their presence in the learning environment, they may face programmatic barriers. These include support services that are either unavailable or inadequate to assist students in meeting academic and nonacademic responsibilities (Dowrick et al., 2005; Stodden & Conway, 2003). Additionally, informational barriers impede students’ capabilities to succeed in the higher education environment. Important information to which students may have limited access includes their knowledge about differences in federal law between secondary and postsecondary services (Skinner & Lindstrom, 2003), the types of campus services available to them, and how to access those services (Getzel, 2005; Gill, 2007). Most importantly, students lack the information and preparation necessary to meet the academic expectations of postsecondary institutions (Kochhar-Bryant et al., 2009). Indeed, many students are not prepared emotionally or academically to handle the rigorous college work load (Mellard, 2005). Finally, students may experience attitudinal challenges, such as negative attitudes among faculty toward students with disabilities (Garrison-Wade & Lehmann, 2007; Mellard, 2005); misperceptions about their skills and abilities by faculty, staff, and their nondisabled peers (Kochhar-Bryant et al., 2009); and professors and school personnel who lack sensitivity concerning students’ needs (Burgstahler, Crawford, & Acosta, 2001; Carney, Ginsberg, Lee et al., 2007; Garrison-Wade & Lehmann, 2007).
Support FactorsResearch on experiences of students with disabilities in postsecondary education also yields information about what support factors are essential for these students to be successful. Key support factors include self-awareness, self determination and advocacy, self management, adequate preparation for college, and assistance technology. Hallahan and Kauffman (2006) define self-determination as the ability to make personal choices, regulate one’s own life, and be a self-advocate (p. 538). Researchers have long advocated the importance of students with disabilities developing self-advocacy and self determination skills. Stodden and Conway (2003) state self-advocacy and self-determination skills are important skills for students with disabilities to have prior to their postsecondary experience. Furthermore, Skinner, and Lindstrom (2003) encourage students’ with disabilities participation in postsecondary preparation programs and developing self-advocacy skills.
Current research confirms the importance of students with disabilities developing self-determination and self-advocacy skills (Getzel & Thoma, 2008). Self determination is viewed by some researchers as a common characteristic present in students who successfully enter and complete college (Finn, Getzel, & McManus, 2008). A study conducted by Anctil, Ishikawa, and Scott (2008) offers a model of academic identity development for college students with disabilities from the integrative self-determination of persistence, competence, career decision making, and self-realization. The researchers’ findings revealed evidence of self-determination as a predictor of transition success. Carney et al., (2007) also confirm a need for students themselves to increase self-advocacy skills. Hadley (2006) states, students with learning disabilities who do not self advocate have a very difficult time adjusting to college life (p.10).
113
INTERNATIONAL JOURNAL OF SPECIAL EDUCATION Vol 27, No: 2, 2012
In addition to support in developing self determination and self advocacy, students with disabilities need support in self management, college preparation, and exposure to assistive technology to augment their learning. Getzel (2008) presents four characteristics of support services that effectively help students to persist and remain in college; (a) services that develop students’ self-determination skills, (b) services that teach self-management skills, (c) services that expose students to assistive technology, and (d) services that and promote career development by providing internships or other career-related services. Garner (2008) found similar results in her study of three postsecondary students with learning disabilities. She also stresses the importance of students having planners to manage their schedules and assignments, and the development of self-advocates skills. Similarly, through a content analysis of literature on support factors, Webb, Patterson, Syverud, and Seabrooks-Blackmore (2008) found five skills students need to acquire. These skills include: (a) becoming more self-determined, (b) developing self-advocacy and social skills, (c) having strong academic preparation, and (d) understanding the accommodations they need and becoming familiar with assistive technology. Webb and colleagues concluded that students with disabilities were unprepared for postsecondary academic requirements and learning strategies; they lacked strategies around effective studying and note-taking, time-management, test-taking, and information retention necessary for academic success.
As illustrated in the literature review, researchers have already found key factors that support students with disabilities’ positive outcomes in postsecondary institutions. This study contributes to the existing body of evidence on the importance of student self-determination and pre-college preparation program in postsecondary outcomes. Additionally, the author recommends improvements in postsecondary supports to facilitate successful outcomes for students with disabilities including architectural accessibility, academic accommodations, mentoring supports, and responsive financial aid policies. This study models other studies (Lehmann et al., 2000; Quick, Lehmann, Deniston, 2003; Stodden & Conway, 2003; Toma & Getzel, 2005) that incorporated authentic voices of students who had first-hand experiences with the challenges of pursuing a postsecondary education and supports needed for positive college outcomes. These voices offer common sense solutions to enhance other students’ with disabilities postsecondary outcomes.
MethodThis research project was part of a larger study involving the Exceeding Expectations Model Demonstration Project (EEP). EEP implemented a demonstration model for increasing the access and retention of students with disabilities in postsecondary institutions in five states: Colorado, Idaho, Iowa, South Dakota, and Wyoming (Lehmann & Davies, 2001). The project incorporated a four step process-oriented model addressing: 1) students’ concerns in regards to access and retention in postsecondary education by providing vital information and strategies for preparation for the postsecondary educational system, 2) key secondary educators were targeted to receive training and support to facilitate students’ readiness for the postsecondary educational experience, 3) postsecondary institutions (support personnel, instructors, etc.) were given support and encouragement to create an environment conducive to serving students with disabilities; thereby, minimizing the attrition rate, and 4) the project developed products and strategies for enhancing students’ access and retention in postsecondary institutions. This qualitative study used a single case (embedded) design with the EEP as the single case; the various sites were embedded units (Yin, 2003). The primary source of data collection included student focus group discussions and disability resource coordinators individual in-depth interviews. The study was conducted in five two-year community colleges and three four-year universities in five Midwestern states.
Participants Fifty-nine students and six Disability Resource Coordinators (coordinators) volunteered to participate in the study. The only student selection criterion was that they had to have received support services at a participating EEP site. The level of services and support provided to students varied at each participating institution; however, all the institutions provided special accommodations, tutoring, vocational rehabilitation, student focused meetings, technology assistance, academic coaching, career counseling, other counseling services, and self-advocacy training. The student participants were males (n = 29) and females (n = 30). Eighty-nine percent were White, of non-Hispanic origin. The highest minority representatives were Hispanic/Latino (5.5%). Participants’ ages ranged from 18 to 56, with 19 as the mode. Eighty-four percent were enrolled as full-time students. Respondents’ enrollment statuses were as follows: 27 students in two-year junior colleges, 18 students in four-year universities, and 14 students in community colleges (four of these students were in a high school to college transition program). In terms of disabilities, students’ self-identified types of disabilities varied from cognitive, intellectual, physical,
114
INTERNATIONAL JOURNAL OF SPECIAL EDUCATION Vol 27, No: 2, 2012
or multiple disabilities, including: 49% (n=29) learning disability, 27% (n=16) multiple disabilities, and 24% (n=14) various physical impairments (e.g., hearing, orthopedic, speech and language, and vision) .
The researcher formally collected data from six coordinators and informally talked with nine additional site coordinators regarding activities and services available to students with disabilities at their institutions. Of the six coordinators, five were female and one was male, and only one was not Caucasian. To be included in the study, coordinators were required to have at least two years experience working with students with disabilities. Years of experience ranged from three to 17, with a mean of eight years.
Data Collection and AnalysisThe researcher conducted nine focus group discussions with postsecondary students with disabilities at the participating sites. The group sizes ranged from three to eleven students. The main purpose of the sessions was to determine if students perceived they were receiving adequate support and the training needed to promote their postsecondary success. Refer to table 1 for the focus group questions. The coordinators responded to interview questions regarding their perceptions of students’ needs during college. Refer to Table 2 for a list of interview questions.
Next, the researcher coded all qualitative data collected line-by-line using the constant comparative analysis process (Strauss & Corbin, 1998). This process involved reviewing data to compare information collected from interviews and focus groups. Interview and focus group questions provided the initial coding organization. Open codes were grouped into axial codes. Axial coding involved linking the open codes together. In the final step, selective coding, explicated themes were developed and compared. A second researcher reviewed the data to verify the original coding by confirming (or disconfirming) themes.
Table 1. Students’ Focus Group Questions
Focus Group Questions
1. Who helped you decide to apply for college?
2. What barriers did you encounter in applying for college?
3. What high school experiences, and or resources prepared you for college?
4. How could your high school have helped you to better prepare for college?
5. What skills and training do you think students need prior to entering college to be successful?
6. What do you know about the services on your campus that provide accommodations to students with disabilities?
7. Discuss your level of satisfaction with these services.
8. What has been the most important help you have received so far in college?
9. Which support and/or resources have been the most helpful?
10. What barriers have you encountered in completing your postsecondary (College) program?
11. Tell me about specific experiences, positive and/or negative, that you have had regarding disability-related access issues with faculty and staff in high school and/or at college.
12. Share any information you think could be helpful to faculty and staff, students, and Exceeding Expectations project to better provide services and activities to assist students with disabilities.
115
INTERNATIONAL JOURNAL OF SPECIAL EDUCATION Vol 27, No: 2, 2012
Table 2. Disabilities Resources Coordinators’ Interview Questions
Interview Questions1. Tell me what goals do you consider to be most useful in preparing students with disabilities for postsecondary education opportunities?
2. What goals do you consider to be least beneficial in supporting students to successfully complete college?
3. Which interventions do you consider to be most useful in preparing students with disabilities for postsecondary education opportunities?
4. Which interventions do you consider to be least beneficial in supporting students to successfully complete college?
5. What ongoing concerns do you have regarding supporting students with special needs entrance into postsecondary education?
6. In an ideal world what would the best way to support students with disabilities in their transition from high school to college?
7. How is your site or situation unique in any way that may influence how you perceive these issues?
8. What has the Exceeding Expectation Grant Project done for your transition program?
9. What support do you need from the Exceeding Expectation Project?
10. What other thoughts would you like to share about your project?
FindingsThree themes emerged from student identification of factors that inhibited or enhanced their prospects for postsecondary success. These themes were (a) capitalizing on student self-determination skills, (b) implementing formalized planning processes, and (c) improving postsecondary support. Participants offered a bleak picture of their high school experiences and their entrance into and progress towards successful completion of postsecondary education as is shown in the quotes below.
Capitalizing on Student Self-determination Facilitating postsecondary educational success involved capitalizing on students’ self determination by creating high expectations. The attitudes and characterizations secondary teachers, postsecondary instructors, and families held concerning these students were important because they influenced these students perception about their capabilities. Low expectations, lack of understanding of students’ disabilities, and self-awareness impacted some students’ ability to capitalize on their self-determination skills. The quotes below demonstrate how three students managed their challenges by having exhibiting strong self-determination skills.
I’ve learned that you have to rely on yourself before you learn to rely on others. You learn how to do things by yourself first before having other people doing things for you. I’ve known for most of my life that when I have to do things by myself, I have to believe in myself and actually do what I want to do. Just follow your dreams.
I hate it when people tell me I can’t do something because then it makes me want to do it even more. It increases my motivation. I will go at it until I actually succeed in doing what I want. I’ll push my way through. I’ve been in school for ten years. I’m just taking it one step at a time.
There is no shame. We’re our own self-advocate. We need to go out and learn to do these things ourselves and be independent. That’s something that each one of us wants to be. We want to take care of
116
INTERNATIONAL JOURNAL OF SPECIAL EDUCATION Vol 27, No: 2, 2012
ourselves. I tried everything that the college has to offer and there is no program to help me with my disability. I have to figure it out on my own.
When students’ self determination was not fully encouraged by their teachers and families, or capitalized upon, it eroded students’ self-confidence and ability to succeed as illustrated in the following quotes:
My teachers let me slide through classes. I had some teachers who wanted me to succeed, go on and make it through college, and they were more than willing to give me oral exams or give me extra time on the test. But I also had teachers who would say not to worry about the test. Then there were others who said not to bother because I wasn’t going to make it.
My step-mother and brother really teased me about the way I talk, so if I don’t know you, I don’t really speak up because I’m scared.
Many students in the study had similar experiences at the beginning of high school which further decreased their self-confidence Students were not explicitly asked to reflect upon their earlier educational experiences; however, one student stated:
My peers were mean and called me retarded. High school was really hard. I didn’t want to go and I hated it during my junior year, I didn’t care. I knew they didn’t know what they were talking about. It took a while to get over it. They were really mean to me. My parents told me not to listen to them but it was hard not to.
Low expectations. Students shared that, over time, low expectations of others and a lack of understanding about their disability by others and by themselves contributed to self doubt and marginalization. The attitudes students found the most difficult to overcome involved the secondary educators’ low expectations of them. One student stated:
The expectations need to be the same, both for students with disabilities and students without, and making sure to help those students reach the expectations we have set for them. There are instances where we tell the student with disabilities it is okay …foreign language is really difficult for you. So don’t worry about taking foreign language. If we expect less of the students, we will get less. If we expect a lot, we will get a lot.
Students were just as hurt when their high school peers vocalized teachers’ attitudes. Participants reported that teachers had low to no expectations for them: …Then there were others [teachers] who said not to bother because I wasn’t going to make it.
Being branded by teachers as someone who …wasn’t going to make it seemed to give peers permission to deprive them as well. According to one participant, My peers were mean and called me retarded. High school was really hard. I didn’t want to go and I hated it… The majority of the participants echoed this student’s sentiment. These taunts left students feeling unsure about entering college and fueled fear and self doubt: The biggest problem was that I was afraid I couldn’t achieve. Another student stated: It’s quite frequent when I get overstressed and over tired. So I was very much afraid that I would spend the money, come here, do the entire stressful thing, and basically get nothing out of it.
Lack of Understanding. Dowrick, Anferson, Heyer, and Acosater ( 2005) state postsecondary faculty need to become better educated about disability needs and rights of accommodation. Additionally, the authors identified negative attitudes toward and low expectations of people with disabilities as a concern. Their findings were confirmed by students in the present study who arrived at college to find that some faculty lacked understanding of their disabilities. Several students identified instructors’ ignorance, lack of training, refusal to accept differences, and prejudices as impeding their success. These students felt stigmatized. They reported thinking that others saw them as being the problem rather than merely having a problem. One student illustrated how others perceived her: People [college instructors and fellow students] think it’s their [the students with the disabilities] fault. They’re having identity issues. They’re not working hard enough or applying themselves. Many student felt stigmatized and alienated from their peers, as illustrated in one student’s comments: They thought I was a freak because I wore hearing aids. Additionally, students believed that others perceived their disabilities as a way to avoid work: If people can’t see your disability, they assume it’s not there or that you’re exaggerating. These students internalized others’ perceived beliefs, and thus began to further doubt their abilities to succeed: To me
117
INTERNATIONAL JOURNAL OF SPECIAL EDUCATION Vol 27, No: 2, 2012
there was definitely a fear of having to drop out for health reasons or falling behind in classes because of some sort of cognitive problem.
Student self-awareness. Once in postsecondary education, students’ limited awareness about their abilities and needs compromised their willingness to ask for help and advocate for themselves. Disability Resource Coordinators considered students’ poor academic preparation and lack of self awareness a significant deterrent to academic success. According to a coordinator:
Students are not knowledgeable enough about their disabilities. They have no idea the effect of the disability on their learning and they may not even know the types of accommodations they need. They don’t know how to request those accommodations.
Another coordinator noted that when students do talk about themselves it is about their weaknesses and not their strengths:
When students come, I ask them what their strengths are. They have no idea. But when I ask what some of the challenges are or what some of their difficulties are, they say, I cannot spell. I cannot write. I cannot do math. I cannot, cannot, cannot, becomes the sentence they give rather than, I may not be able to spell, but I have a lot of ideas.
However, despite a general lack of self-awareness, these students described their own fortitude and persistence as driving forces in entering postsecondary education. Several students explained that they reacted to others’ lowered expectations by approaching life as a series of challenges. One student shared a similar motto that emphasized persistence:
I hate it when people tell me I can’t do something because then it makes me want to do it even more. It increases my motivation. I will go at it until I actually succeed in doing what I want. I’ll push my way through. I’ve been in school for ten years. I’m just taking it one step at a time.
Implementing a Formalized Planning ProcessStudents and coordinators identified college preparation as a major high school system weakness. One student states, During my junior and senior years in high school, my English classes were pretty much jokes. There weren’t any writing classes. Academic planning for college was inadequate, as well, because students were not required to take requisite college preparatory classes, as evident by this student statement: Geometry wasn’t easy. It was just because I didn’t have a very strong finance and math background when I left high school. When I came here, I just had the basic levels . Further, students were confused about how high school and college environments differed in delivery of supports and service obligations. Even if they knew the support services that existed for them, they would not know (1) what they needed, and (2) how to access them. Students; general lack of knowledge about college and about their own needs diminished their potential for having positive successful experiences, as illustrated by the following statement: There was nothing to help me transition into college and I had to kind of feel myself around blindly, trying to figure out.
Some students assumed that college support would be like the high school special education services they received. One student stated, I thought my freshman year here would be easy. I thought the classes would be all accommodated. Students’ naiveté extended beyond their assumptions. One coordinator characterized students she served as barely being able to function independently:
When they get to the postsecondary environment, especially those students who come and live in the dormitories, they might not be ready to face the challenges before them. They don’t know how to live with people. They don’t know how to make sure boundaries are set. They don’t know how to study. They don’t know how to ask for what they need. They always rely on their parents to do it and the parents are always willing to do it.
Clearly, setting boundaries for themselves and others, preparing for rigorous college classes, and asking for what they need to better address their academic and personal responsibilities are necessary steps that students must take in order to move away from home and into communal housing situations. It is essential for these students to self-advocate to professors for their learning related needs (Hadley, 2006).
118
INTERNATIONAL JOURNAL OF SPECIAL EDUCATION Vol 27, No: 2, 2012
Students reported they were not prepared for the rigors of college classes: I wasn’t prepared. I expected to fail. In fact, I’m very surprised I haven’t. When asked to elaborate on their perceptions about their level of skills, many students indicated they were not trained adequately in mathematics or English prior to coming to college. One student stated, I wasn’t prepared for math and English. History was no problem but I was behind in math. I had to start at the bottom and work my way up . In fact the majority of students who participated in the study had not taken advanced or college preparatory courses in high school. Repeatedly, students said their high school classes were not challenging and did little to prepare them for college. Students used terminology such as watered-down, dumb, dumb, math, too easy, and slide through classes to describe their secondary classes. In addition, students described how being placed in lower level high school math and English courses put them at a disadvantage as they began their college experience. Most took developmental courses upon admission effectively removing them from the major they chose to pursue, or they earned low grades in classes for which they had no preparation.
Coordinators confirmed students’ impressions; they emphasized students’ lack of academic preparation as a primary problem, particularly during their first year of college. Specifically, they noted that students lacked study skills, mathematical skills, and writing skills. Coordinators believed that students anticipated that the college courses would be easy and that they would receive highly structured support showing them how to complete course requirements. One coordinator stated:
Many students I’ve met with will tell me their high school experience was a joke. They really did not prepare well. They got extra credit for some work and they wonder why they are not going to get those types of extra credits within the university.
In contrast, families’ vision for their children’s future bolstered students’ self confidence: I grew up believing I could do anything…. that led to college becoming a viable future option. Family members were the first to say, it’s really important for you to go to college.
Improving Postsecondary Support The abilities of some of the institutions in this study to welcome and support students with disabilities were questioned. The areas reported by students with the most systemic issues were accommodations, architectural accessibility, and financial assistance. These issues must be addressed in order to improve postsecondary supports for students. On a positive note, students revealed the mentoring they received from Disability Services as most helpful in improving their postsecondary supports. The following statements present students’ experiences in each of these areas.
Accommodations. Students described the complexity of their accommodation experiences as ranging from the faculty’s incomprehension of the essential support provided by the disability resource programs to over accommodating. For example:
I would say that professors need to believe you. I have a disability. I’m pretty forthright, if someone wants to ask me a question, I’ll answer it. I’m fairly open in talking about stuff but when they just assume that I’m lying, I can’t get accommodations.
I had one professor who was over accommodating. He like gave it away too much. He gave me excessive time. It was just kind of funny. Once in a blue moon you’ll find someone who goes overboard. It’s like him opening up the door for me and pulling out the chair for me. I can do that myself.
Some faculty were perceived by the students as having negative attitudes because of their unwillingness to accommodate students. A sense of powerless was detected in students’ remarks about these instructors. They usually wanted to avoid these instructors’ classes even if the course was important to their majors. One student stated, There were two teachers … who refused to help. They really made it virtually impossible for anybody with a disability to pass.
Architectural Accessibility. Students identified physical accessibility (e.g. architectural barrier) concerns in relation to transportation and conveniences taken for granted by most other students. The following statement by one student participant summarizes the level of frustration with barriers within a classroom building: I had a three hour lab my first semester and unfortunately there was no handicap restroom . In addition to inaccessible restrooms, many students remarked about the lack of public transportation available to take them from one part of campus to another, or even to the dining hall.
119
INTERNATIONAL JOURNAL OF SPECIAL EDUCATION Vol 27, No: 2, 2012
Financial Assistance. Finances were another major obstacle. Students were concerned about funding needed for special services/resources, medical needs, transportation, housing, and special equipment to enhance learning. Several students indicated the financial aid they had received was based on a traditional four-year college completion schedule. However, many students anticipated taking longer to complete college because they had to take prerequisite courses that were either not provided or that they had not taken in high school. Further, many had to retake courses not passed initially.
Mentoring support. Students spoke highly about the assistance they received from disability services. Staff in these offices acted as mentors, advocates, and guides within the postsecondary institution. For example, counselors advised students on how to become more assertive as illustrated in the following statement from one student participant:
T. [disability counselor] has been a big help to me. I’ve come to him and say hey, what do I do about this? He says, This is what you do. I go to my teachers, this is the deal. I’ve got to have this done; otherwise I’m not going to succeed.
This statement also illustrates how effectively coordinators advocated for students; I get a lot of support from them [disability resource coordinators]. Some of the accommodations I get are early registration. I also get my courses moved to places where I can access the classes.
In addition to advocacy, the coordinators offered emotional support to students, leading one participant to say, They gave me the confidence to go on. The importance of this level of emotional support was most evident in this student’s comment: If B. [disability coordinator] hadn’t come to my rescue, I probably would have left school. I was so close to leaving and walking out.
Discussion The findings of this study align with the literature review that discusses the challenges for students with disabilities in postsecondary as architectural/access (Hart et al., 2001), programmatic (Dowrick et al., 2005; Stodden & Conway, 2003), informational (Getzel, 2005; Gill, 2007; Skinner & Lindstrom, 2003), and attitudinal (Burgstahler et al., 2001; Carney et al., 2007; Mellard, 2005). The architectural and accessibility barriers identified by student participants ranged from difficulties accessing their classes, to lack of accessible bathrooms, to one professor refusing to use a microphone which prevented the student from hearing the lecture. Student voiced programmatic barriers as a major challenge as many expected the same supports and services in college as they received in high school. Many students were perplexed by the services that they ultimately received in college and thereby uncertain of how to get the services needed to support their learning. In addition, some students didn’t know how to access the new services and/or may have been embarrassed to seek the services. Other findings suggest that many students with disabilities are unprepared for their college experiences. The lack of preparation in mathematics, English, and other college prep classes really hindered learning and introduced an informational barrier for many of the students in the study. Previous research in the area of college preparedness in students with disabilities supports the current study’s findings (Getzel, 2008; Gill, 2007; Kochhar-Bryant et al., 2009; Mellard, 2005; Rattin, 2001).
Another major challenge for many of the students in the study was an attitudinal barrier. The findings suggest that some postsecondary faculty had negative attitudes toward students with disabilities and lacked understanding of their needs and their rights to special accommodations and other supportive services (Burgstahler et al., 2001; Dowrick et al., 2005; Lehmann et al., 2000). The study findings also suggest that students lack the skills necessary to self-advocate for the services needed to help them to be successful. Researchers from other studies (Dowrick et al., 2005; Garner, 2008; Lehmann et al., 2000; Skinner & Lindstrom, 2003; Stoddon & Conway, 2003) agree that students with disabilities need to advocate for the services needed to support their success. Self determination was revealed in the present study as an area needed to support students’ success. Anctil et al. (2008) study showed evidence of self-determination as a predictor of transition success. According to Garner (2008), self-advocacy skills are crucial to early academic develop (Garner, 2008, p.9). To address these issues, planning efforts for postsecondary should be coordinated early in secondary school (Dowrick et al., 2005; Stodden & Whelley, 2004). Students need to be aware of the postsecondary supports necessary and to develop self-advocacy and self-determination skills to enhance their postsecondary outcome.
120
INTERNATIONAL JOURNAL OF SPECIAL EDUCATION Vol 27, No: 2, 2012
There was agreement among participants that postsecondary education success or positive outcomes requires the following formula: supporting and capitalizing on student self-determination plus the provision of transition planning facilitate students’ success within an institution. Additionally, institutions of higher learning need to examine potential architectural, programmatic, informational, and attitudinal barriers in their institutions and increase the knowledge of their personnel about disabilities to improve learning opportunities of students. These findings are represented in figure 1 in a preliminary framework for better understanding the dynamic relationship between these factors.
The preliminary framework presents three major factors that contribute toward success in postsecondary institutions for students with disabilities: self-determination, planning efforts, and postsecondary supports. Success in the framework is defined as having a positive postsecondary outcome that promotes completion of a postsecondary degree.
Figure 1. Preliminary Transition to Postsecondary Education Framework.
Self-determination. It appears that at least five areas must be addressed to facilitate the success of students interested in attending postsecondary education. First, students themselves need to acquire the skills associated with self-determination. According to Wehmeyer (1996), self-determination is acting as the primary casual agent in one’s life and making choices and decisions regarding one’s quality of life free from undue external influence or interference (p. 24). Specifically, according to these participants, self-awareness and self advocacy are inextricably linked to students’ ability to request accommodations. This finding is supported by Gill (2007) who states that Self determination is a key skill that can be developed to assist student with disabilities in becoming strong advocates as they move through their educational experience (p.14.). As evidenced in an earlier study, students’ lack of self-awareness made them feel helpless when faced with analyzing their accommodation needs and recognizing potential strategies that might lead to success (Lehmann et al., 2000). Quick et al. (2003) concluded that there is a continued need to teach and study self-determination skills at the postsecondary level. Furthermore, students voiced the importance of self-determination and self-advocacy as a key component of being successful in college.
Planning efforts. Both students and coordinators in this study confirmed there is a need to better prepare students for college. Coordinators saw preparatory activities as being the responsibility of secondary teachers, families, and students themselves. A formalized and structured process addressing the preparation needs of students may be one of the key ingredients for a successful college experience. Preparation activities, such as offering orientation workshops at the institutions of higher education, may help to alleviate some students’ fears about attending college (Garrison-Wade & Lehmann, 2009). Planning crosses institutional boundaries, building venues for dialog, and offering a process for
121
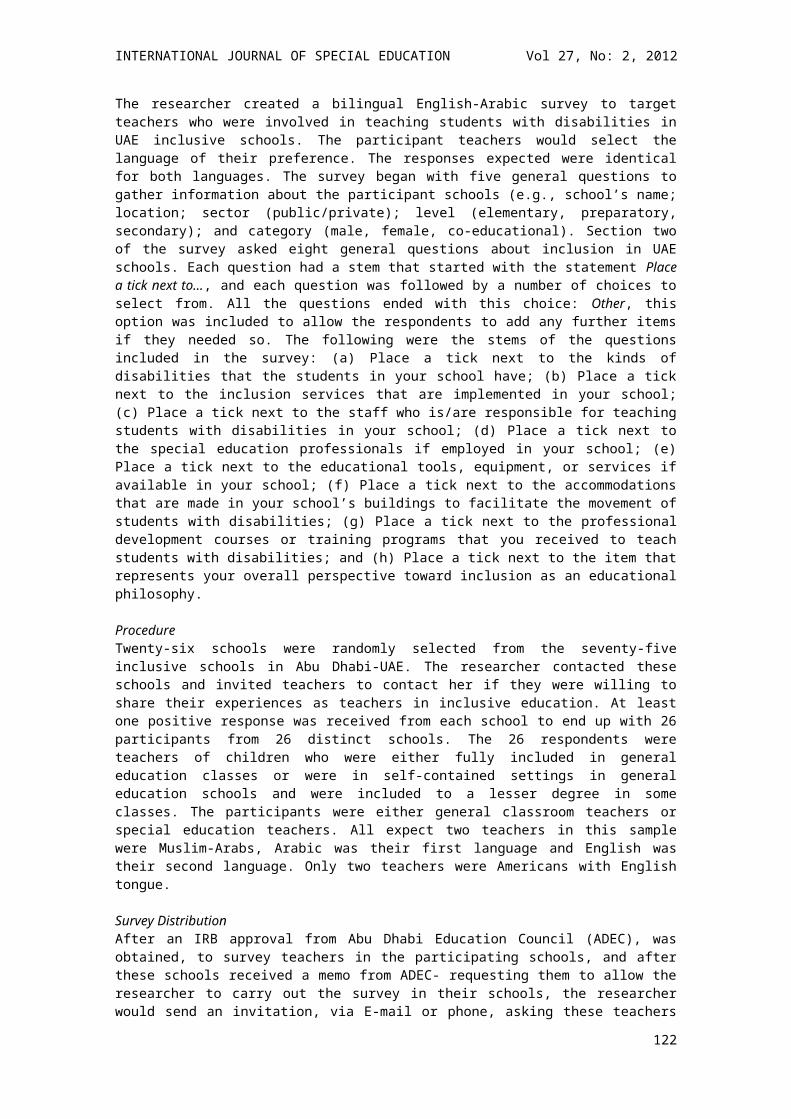
INTERNATIONAL JOURNAL OF SPECIAL EDUCATION Vol 27, No: 2, 2012
accountability. Clearly, participants in this study confirmed Johnson et al.’s, (2002) conclusion about the importance for all involved in supporting students to establish and maintain high academic expectations.
Postsecondary Supports. Participants in this study confirmed that networking and mentoring were critical for achieving college success. Terms associated with mentoring and networking were used interchangeably, but the key features reported related to receiving guidance and support to help navigate both personal and institutional barriers present for students with disabilities in higher education. This support included other students, coordinators, faculty, and parents. Other studies have emphasized the importance of parental involvement as a predictor of school success for students with disabilities (Dowrick et al., 2005; Eckes & Ocha, 2005). Getzel (2008) notes that students with disabilities benefit from faculty that have increased awareness and knowledge of the characteristics and needs of students with disabilities, and from faculty that incorporate concepts of universal design into their instruction and curriculum.
Recommendations for Supporting Students with Disabilities in Postsecondary Education Both students and coordinators who participated in this study presented several strategies for improving students’ with disabilities postsecondary education outcomes. Although these recommendations may echo what has already been presented in other research studies (e.g. Lehmann et al., 2000; Stodden & Conway, 2003; Webb et al., 2008), they do offer authentication to the existing knowledge base on support needed to enhance students’ with disabilities postsecondary outcomes. The first of these recommendations is to establish high expectations for students with disabilities; specifically, encouraging these students to take rigorous classes within high school to meet the perquisite necessary for advance-level college course. Two students stated:
Students should avoid some of those easy classes to keep expectations high. Setting high expectations for students right away and informing parents of what needs to happen in order for students to be successful at the next level is important.
We should make sure expectations are high enough for every single student, within the high school environment, within the postsecondary environment, on the job, and even at home.
The second recommendation is to help students develop individual comprehensive transition plans that support access and successful postsecondary outcomes. These plans should include college campus visits and guidance counseling, that includes discussion about the courses students should take to prepare them for college. One student suggested:
If students are considering pursuing postsecondary education, they really are in need of intense transitional guidance before they enter the postsecondary setting, during the process of entering it, and after they enter the postsecondary setting. It’s really important in making these plans to determine who is responsible for them so there is a clear continuity and students are getting the help they need to make that difficult transition.
This suggestion supports Gill’s (2007) suggestion to schedule a transition night where representatives from area colleges and from school districts collaborate and disseminate vital information regarding student actively participate in IEP process to enhance self-determination skills. During these transition nights, students also should be encouraged to develop a portfolio or a transition file that includes copies of disability documentation, Transition IEP, high school transcripts, and other relevant information. Several coordinators offered the additional strategies to help with transition to college: Mentoring, coaching, role playing are effective tools to enhance students’ transition in college. Additionally,
Monitor student progress (i.e. grades, IEP goals, attendance), maintain close connection with student’s parents and high school, hold high standards (attendance, assignments, test prep, and communication), self-determination/self advocacy expectations (student led IEP; student interviews instructors every 4 weeks to monitor progress, student meets weekly with SAVE Coordinator to monitor progress, student responsible for writing quarterly reports sent to school), give more independence to students as they successfully progress, spend considerable time with students before they begin their first day of classes, have an extensive routine for Jr. year and Sr. year visits to college for students and parents, attend student’s senior year IEP meeting at their high school and again spend time talking about postsecondary
122
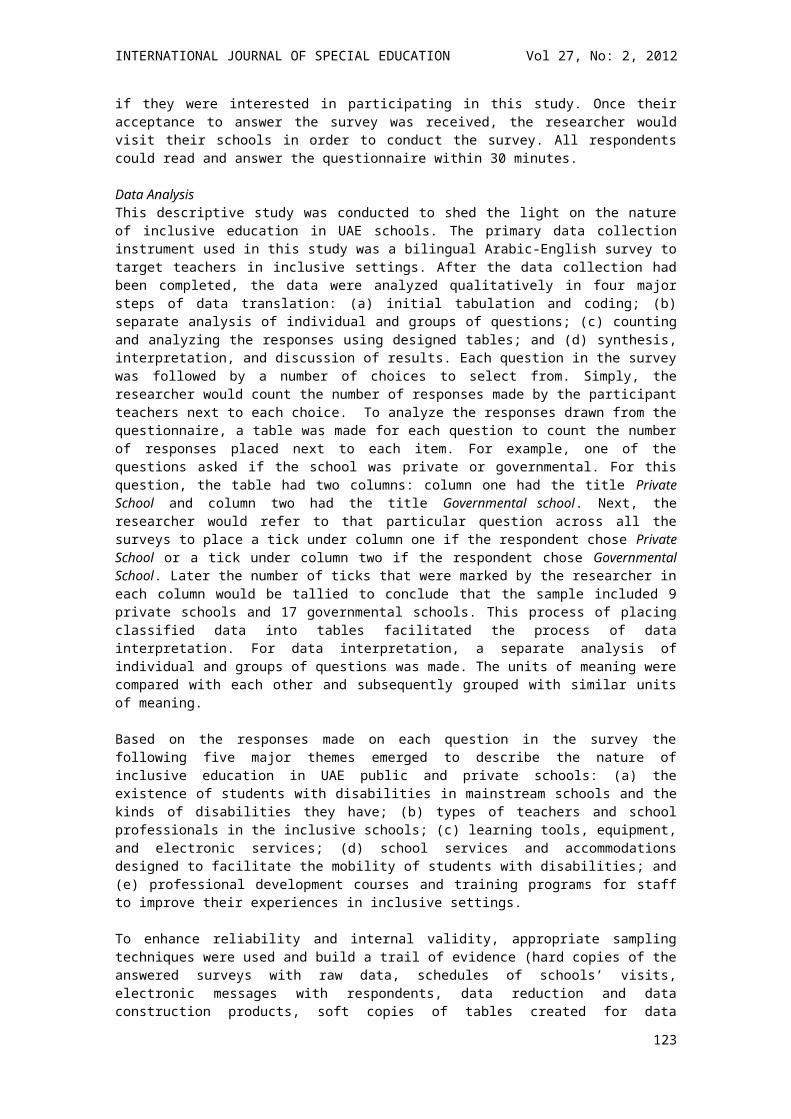
INTERNATIONAL JOURNAL OF SPECIAL EDUCATION Vol 27, No: 2, 2012
expectations and assist the as they develop goals. I hold a college orientation session and throughout the year, hold seminar sessions. Mentors for 2nd semester are aligned with new students.
The third recommendation illuminated by the current study is for parents, teachers, coordinators, and guidance counselors to empower students with disabilities to make their own decisions. Empowering students will help them each develop a strong sense of self as well as self-advocate skills. Yet, there is a fine line between empowering students and enabling them as seen by the student statement:
Another personal area with me, the one I feel very strongly about, is to try to make sure we’re empowering students and not enabling them. That’s kind of a fine line, but we should always try to work on empowerment.To avoid this situation, educators and parents should not lower their expectations of students with disabilities; most students are very capable of making sound decisions on their own. They just need encouragement and strategies to cultivate self-advocacy skills.
Study LimitationsWhile there are no indications that participation with EEP influenced participants’ responses, a broader sample may have yielded different results. Another limitation of the study is the lack of ethnic and racial diversity of the study’s participants. A more diverse participants’ pool may have yielded different types of challenges that were not presented in this study.
ConclusionIn conclusion, this study offered a preliminary framework that emphasized self- determination skills and coordinating, planning, and improving postsecondary support as key factors that may enhance postsecondary outcomes for students with disabilities. For this to happen, collaboration is needed to support students’ progress towards college. Teachers, families, higher education personnel, and students all have a responsibility to contribute to the postsecondary educational success of students. Preparation seems to be a collaborative process that minimally involves students and their families, high school teachers and coordinators, and college faculty and staff. The findings that emanated from this study provided a framework for considering what a successful transition process to postsecondary education should resemble. However, the researcher acknowledges that the model is only preliminary and additional research is needed to test the validity of the model.
ReferencesAnctil, T.M., Ishikawa, M.E., & Scott, A. T. (2008). Academic identity development through self-determination: Successful college students with learning disabilities.Career Development for Exceptional Individuals, 31(3), 164-174.Bangser, M. (2008). Preparing high school students for successful transitions to postsecondary Education and employment. U.S. Department of Education, The National High School Center. Retrieved from http://www.betterhighschools.orgBurgstahler, S., Crawford, L., & Acosta, J. (2001). Transition from two-year institutions for students with disabilities. Disability Studies Quarterly, 21(1), 25-37.Carney, K., Ginsberg, S., Lee, L., Li, A., Orr, A., Parks, L. & Schulte, K. (2007). Meeting the needs of students with disabilities in higher education: How well are we doing? The Delta Kappa Gamma Bulleting, 35-38.Dowrick, P.W., Anderson, J., Heyer, K. & Acoster, J. (2005). Postsecondary education across the USA: Experiences of adults with disabilities. Journal of VocationalRehabilitation, 22, 41-47.Eckes, S.E. & Ochoa, T.A. (2005). Student with disabilities: Transitioning from high school to higher education. American Secondary Education, 33(3), 6-20.Fairweather, J. S., & Shaver, D. M. (1991). Making the transition to postsecondary education and training. Exceptional Children, 57, 264-270.Finn, D., Getzel, EE., & McManus, S. (2008). Adapting the self-determined learning model for instruction of college students with disabilities. Career Development for Exceptional Individuals, 31(2), 85-93. Doi:10.1177/0885728808318327Garner, D.B. (2008). Postsecondary education success: Stories of three students with learning disabilities. TEACHING Exceptional Children Plus, 4(4). Retrieved from http://escholarship.bc.edu/education/tecplus/vol4/issue4/art4Garrison-Wade, D., & Lehmann, J.P. (2007). Students’ perceptions about successfully transitioning into postsecondary institutions. Review of Disability Studies: An International Journal, 2(4), 37-49.
123
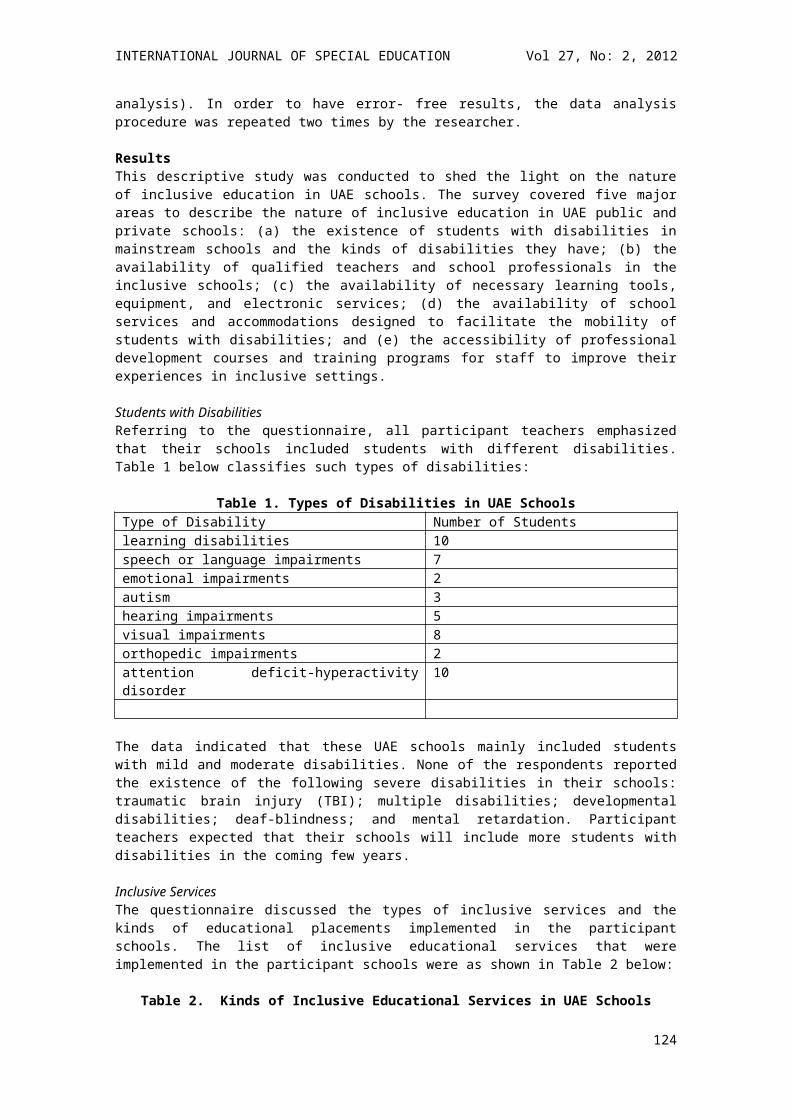
INTERNATIONAL JOURNAL OF SPECIAL EDUCATION Vol 27, No: 2, 2012
Garrison-Wade, D.F., & Lehmann, J.P. (2009). A conceptual framework for understanding students with disabilities transition to community college. Community College Journal of Research and Practice, 33(5), 415-443. Doi: 10.1080/10668920802640079Getzel E.E. (2008). Addressing the persistence and retention of students with disabilities in higher education: Incorporating key strategies and supports on campus. Exceptionality, 16(4), 207-219.Getzel, E.E. (2005). Preparing for college. In E.E. Getzel & P. Wehman (Eds.), Going to College: Expanding opportunities for people with disabilities (p.89). Baltimore, MD:Brooke Publishing Co.Getzel, E.E. & Thoma, C.A. (2008). Experiences of college students with disabilities and the importance of self-determination in higher education settings. Career Development for Exceptional Individuals, 31(2), 77-84. Doi:10.1177/0885728808317658Gill, L.A. (2007). Bridging the transition gap from high school to college: Preparing students with disabilities for a successful postsecondary experience. Teaching Exceptional Children, 40(2), 12-15.Hadley, W.M. (2006). L.D. students’ access to higher education: Self-advocacy and support. Journal of Developmental Education, 30(2), 10-16.Hart, D., Zafft, C., & Zimbrich, K. (2001). Creating access to college for all students. The Journal for Vocational Special Needs Education, 23 (2), 19-31.Hallahan, D.P. & Kauffman, J.M. (2006). Exceptional Learners: An Introduction to Special Education. Boston, MA: Pearson Education, Inc.Horn, L. & Berktold, J. (1999). Students with Disabilities in Postsecondary Education: A Profile of Preparation, participation, and Outcomes, U.S. Department of Education. National Center for Education Statistics.Individuals with Disabilities Education Act Amendment of 2004 (IDEA), 20 U.S.C., 1400.Johnson, D. R., Stodden, R.A., Emanuel, E.J., Luecking, R., & Mack, M. (2002). Current challenges facing secondary education and transition services: What research tells us. Council for Exceptional Children, 68 (4), 519-531.Kochhar-Bryant, C., Bassett, D.S., & Webb, K.W. (2009). Transition to postsecondary education for students with disabilities. Thousand Oaks, CA: Corwin Press.Lehmann, J. P., Bassett, D., & Sands, D.J. (1999). Students' participation in transition-related actions: A qualitative study. Remedial and Special Education, 20, 160-169.Lehmann, J. P., & Davies, T. (2001). Exceeding Expectations: A model demonstration project 2001-2005 (No. CFDA 84.324M). Unpublished manuscript. Colorado State University, Fort Collins.Lehmann, J. P., Davies, T. G., & Laurin, K. (2000). Listening to student voices about postsecondary education. TEACHING Exceptional Children, 32, (5), 60-65. Mellard, D. (2005). Strategies for transition to postsecondary educational settings. Focus on Exceptional Children, 37(9), 1-19.National Center for Education Statistics (2006). Profile of Undergraduates in U.S. Post Education Institutions: 2003-2004, U.S. Department of Education, Retrieved August from http://nces.ed.gov/fastfactsNational Council on Disability. (2004, March). Higher education act. Retrieved from http://www.ncd.govNational Council on Disability. (2003). People with disabilities and postsecondary education. Retrieved from http://www.ncd.gov Quick, D., Lehmann, J., & Deniston, T. (2003). Opening doors for students with disabilities on community college campuses: What have we learned? What do we still need to know? The Community College Journal of Research and Practice, 278, 15-27. Rattin, S. E. (2001). An investigation of factors associated with academic success, persistence, and satisfaction of community college students with learning disabilities. Unpublished doctoral dissertation, University of Illinois at Urbana-Champaign, Urbana-Champaign.Skinner, M.E., Lindstrom, B.D. (2003). Bridging the gap between high school and college: Strategies for the successful transition of students with learning disabilities. Preventing School Failure, 47(3), 132-137.Stodden, R. A. (2001). Postsecondary education supports for students with disabilities: A review and response. The Journal for Vocational Special Needs Education, 23(2), 4-9.Stodden, R.A. & Conway, M.A. (2003). Supporting individuals with disabilities in postsecondary education. American Autumn Rehabilitation, 27(1), 24-33.Stodden, R.A., & Whelley, T. (2004). Postsecondary education and persons with intellectual disabilities: An introduction. Education and Training in Developmental Disabilities, 39 (1), 6-15. Thoma, C.A., & Getzel, E.E. (2005). Self determination is what it’s all about: What post-secondary students with disabilities tell us are important considerations for success. Education and Training in Mental Retardation and Developmental Disabilities, 40, 35-48.
124
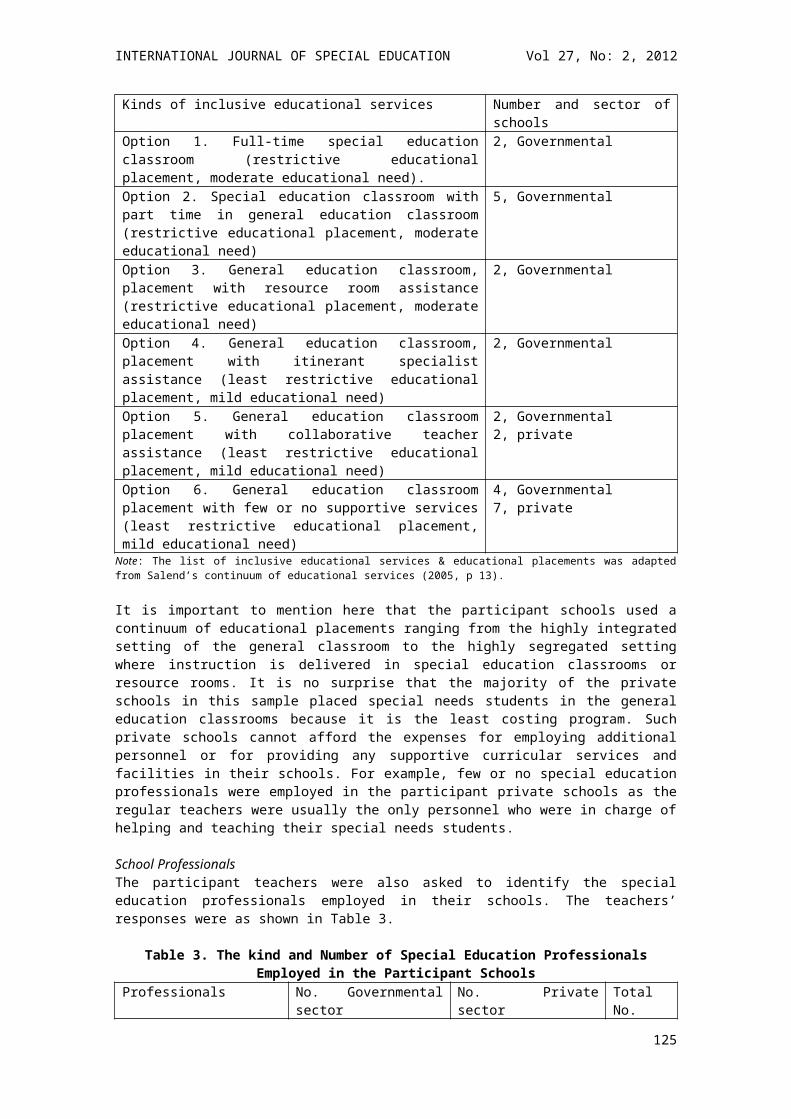
INTERNATIONAL JOURNAL OF SPECIAL EDUCATION Vol 27, No: 2, 2012
Strauss, A., & Corbin, J. (1998). Basics of qualitative research techniques and procedures for developing grounded theory. London: Sage Publications. Wagner, M. M., & Blackorby, J. (1996). Transition from high school to work or college: How special education students fare. The Future of Children, 6(1), 103-119. Webb, K.W., Patterson, K.B., Syverud, S.M., & Seabrooks-Blackmore, J.L. (2008). Evidenced based practices that promote transition to postsecondary education: Listening to a decade of expert voices. Exceptionality, 16(4), 192-206. Wehmeyer, M. L. (1996). Self-determination as an educational outcome: Why is it important to children, youth and adults with disabilities? In D. J. Sands & M. L. Wehmeyer (Eds.), Self-determination across the life span: Independence and choice for people with disabilities (pp. 15-34). Baltimore: Paul H. Brookes.Yin, R. K. (2003). Case study research: Design and methods (3rd ed. Vol. 5). Thousand Oaks, CA: Sage Publications.
MAPPING THE EARLY INTERVENTION SYSTEM IN ONTARIO, CANADA
Kathryn UnderwoodRyerson University
This study documents the wide range of early intervention services across the province of Ontario. The services are mapped across the province showing geographic information as well as the scope of services (clinical, family-based, resource support, etc.), the range of early intervention professionals, sources of funding and the populations served by the services. Results of the study provide a picture of the range and scope of early intervention service in the province and identify variability of services across the province. The study highlights systemic variables that are of interest across Canada in early intervention practices, at a time when significant focus is on the importance of the early years, particularly for children with disabilities. The study aims to identify the scope of early intervention services across the province of Ontario. In the international literature on early intervention, there are frequent references to early intervention systems (for example in the Part C programs in the US, described by Bruder & Dunst, 2008). In Ontario, and other Canadian provinces, it is difficult to define one system of early intervention services. This is because early intervention has no federal guidelines or funding, and at the provincial level, there are is no defining legislation that ensures early intervention services or defines a system of services. Early intervention is a growing area of interest in research on special education and disability in educational settings (Guralnick, 2011). Interest in the early years stems from the understanding that the years preceding elementary school-age are formative and learning in these years can set an educational trajectory for life (Willms, 2002). This is a deterministic view of child development, and ongoing research in early intervention is warranted. However, in some jurisdictions there is not a clear “system” of early intervention services, which makes it challenging to investigate the efficacy of these approaches. This study aims to identify both consistent and variable characteristics of a system of early intervention services in Ontario, Canada, which provide a starting point for analysis of systemic issues in early intervention practice. This mapping of services is designed to identify the scope of organizational characteristics that make up the early intervention system in Ontario.
125

INTERNATIONAL JOURNAL OF SPECIAL EDUCATION Vol 27, No: 2, 2012
What is Early Intervention?Providing good quality early experiences is now widely accepted as important for human development (Camilli, Vargas, Ryan, & Barnett, 2010; McCain, Mustard & Shanker, 2007). In the case of children with disabilities early supports are all the more important because they can potentially prevent additional developmental difficulties and ameliorate existing developmental conditions. There is almost universal acceptance of EI as important for children with disabilities, although the type of EI programs that are best is sometimes contested. The World Health Organizations (WHO) classifies EI programs into primary prevention of disability, secondary prevention of additional impairments, and tertiary prevention to minimize the impact of disability. There has been a significant amount of research on the success of all types of EI programs and it is now widely accepted that EI programs are effective as a preventative measure (Guralnick, 2000; Guralnick, 2004; Feldman, 2004). Claims about the efficacy of EI programs include decreased referrals to special education programs and possible gains in developmental outcomes for all children in inclusive early childhood settings (Fuchs & Deshler, 2007).
Early intervention is multidisciplinary. This is an important difference from school age supports for children with disabilities and/or special educational needs. In schools, while there may be itinerant supports such as child and youth workers, social workers, speech and language pathologists, and psychologists, the primary service providers are teachers. In early intervention, services are provided directly by a range of professionals. Lindqvist, Nilholm, Almqvist, and Wetso (2011) have identified distinct differences in professional views of service delivery for children with disabilities. For example, Lindqvist et al. found that preschool teachers, teaching assistants, special education teachers, and special education coordinators vary in their beliefs about how best to meet the needs of children, where children should be placed in programs, how the programs should be delivered, and who should be delivering programs. In Ontario, there is no information about the prevalence of different professional groups serving children in early intervention services. Having knowledge of who is delivering services to young children can help us to better understand the professional knowledge, and attitudes that shape the early intervention system. It will be useful for advocacy, and for understanding the experiences of children and their families.
In addition to a broad range of professionals providing early intervention services, these programs and supports support children across a broad range of developmental domains. In this study, I refer to both “disability” and “special educational needs”. Disability is defined here using the language of the Convention on the Rights of Persons with Disabilities, “disability is an evolving concept and […] disability results from the interaction between persons with impairments and attitudinal and environmental barriers that hinders their full and effective participation in society on an equal basis with others” (UN, 2007, preamble). Disability refers to an interaction between and individual and other people or their environment. The early intervention system is one of these environments. The term disability, however, in my experience, is sometimes shied away from in early childhood, because young children may not have a diagnosis (of impairment as identified in the definition above), or they may not have experienced discrimination. Further, impairment in development can arise from adverse social conditions such as poverty, or exposure to harmful environments, and early intervention may be in place to prevent disability. The term special educational needs is used here to refer to the broader range of experiences that are addressed in early intervention.
Beyond the definitions of disability and special educational needs, this study seeks to identify particular categories of impairment or special educational needs that are supported within the early intervention system. Patel and Corter (2011) define early intervention services within three broad categories: clinical services, targeted services, and universal services. These categories, as described by Patel and Corter, serve different populations. Clinical services are designed for children with specific diagnoses or disorders; targeted programs are designed for children who are “at risk” or those with special educational needs as described above; and universal programs are those that are designed to support healthy development for all children (Patel & Corter, 2011, p. 2-3). The distinctions made by Patel and Corter highlight the variability in early intervention services. In Ontario, these distinctions are not clearly defined in the literature or in information for families. Each of these approaches has a distinctly different philosophical approach, and it is important for researchers and families to understand these differences in the early intervention system.
126

INTERNATIONAL JOURNAL OF SPECIAL EDUCATION Vol 27, No: 2, 2012
Considering the range of people working in early intervention, and the range of children and families who are served by the early intervention system is important, but this study would not be complete without also investigating how these services are funded. One of the reasons that the early intervention system is so fragmented is that there are multiple mechanisms for funding early intervention services. There is little information to tell us how many programs and supports are funded by private money, and how much control families have over their own services. This study also examines the funding structures in the early intervention system.
Objectives of the project:The objective of this project is to identify the “early intervention system” in Ontario. The research question is: What is the breadth and scope of services that make up the early intervention (EI) system in Ontario? The study identifies funding sources, types of professionals working in EI and the populations being served by early intervention services across the province of Ontario. The resulting description of the early intervention system in the province provides a starting point for future research in early intervention, which has not been as broadly conceptualized in the past.Early Intervention in Ontario: The ContextFederal funding and legislation in the United States has resulted in mandatory EI programs in every US state. While it is acknowledged that implementation of these services is sometimes uneven across the US, it is also clear that a formal system of EI as mandated by federal legislation has increased the number of EI services available to children with disabilities (Hanson, 2003). Canada does not have this type of legislation, in part because our education programs are governed by the provinces. However, it has been argued that we could and should have a federal mandate and funding for early childhood programs due to the significant effect these programs have on children’s development (Cleveland, Corter, Pelletier, Colley, Bertrand, & Jamieson, 2006; Friendly & Lero, 2002). Currently in Ontario we have both formal systems for EI services through regional Infant and Child Development programs as well as an informal system delivered through other agencies and organizations such as children’s hospitals, specialized agencies serving people with particular disabilities, rehabilitation facilities, and childcare settings. Thus EI services in Ontario are based on organizational initiatives rather than legislation. This system is similar to what is found in Australia (Johnston, 2003). Early intervention in Ontario is provided through a fragmented system of services and varied organizations in the province. Many of these services are funded through the provincial government. The Ministry of Children and Youth Services (MCYS) tracks children through data collected by agencies who MCYS funds. Additionally, organizations like the Ontario Association of Infant and Child Development (OAICD) through their own research and membership have a good understanding of where early intervention services are being delivered in the province. The challenge is that not all early intervention services are funded through the MCYS and membership in OAICD is voluntary. The data collected by the provincial government is not publicly available. Early Intervention (EI) is described in this study as those services that support children with disabilities in the early years of life, from ages zero to six years. These services primarily target children in the years before school entry, however, the study includes the transition from pre-school to school age and the changes or consistencies in the services as children transition to school. Children who access these services may have cognitive, linguistic, physical/motor, sensory or mental health disabilities, but they also have widely different social circumstances associated with their families and their communities.
MethodThis study is exploratory in nature, as it aims to define a system that is yet undefined in the general literature. The study can be defined as an environmental scan, which is an approach used in a number of different sectors and is growing as a tool for understanding the organizational context for doing business (Albright, 2004; Muralidharan, 2003). However, there are no guidelines for conducting environmental scans of services for research purposes. It is therefore necessary to outline the steps taken in the scan.
This study draws on the methodologies outlined in systematic reviews of literature, in order to define the approaches taken to scan early intervention services. There are a number of different approaches to scanning literature, depending on the goals of the literature review. Adapting the purposes of “scoping studies”, this exploratory study aims to better understand the scope of services in the early intervention system. Arskey and O’Malley (2003) in their framework for scoping studies, a methodological approach to mapping key concepts in literature, outline the purposes of these studies. They say that scoping studies: examine the range of research activity; determine the value of undertaking a more comprehensive full review; summarize and disseminate findings; and identify gaps. Adapting these four aims of scoping studies, this environmental scan examines the range of services, determines the value of
127
INTERNATIONAL JOURNAL OF SPECIAL EDUCATION Vol 27, No: 2, 2012
a more comprehensive scan, summarizes the findings and identifies gaps in our understanding of early intervention services in Ontario.
The environmental scan was done using a systematic approach. Through access to publicly available information, the researchers gathered information about the following programs: 1) regional early intervention programs, 2) disability specific programs (autism, speech/language, hearing, mental health, physical disability, intellectual disability), and 3) professional organizations. Data sources included but were not limited to websites with lists of service agencies (eg. Ministry of Child and Youth Services, Ontario Association of Infant and Child Development, Children’s mental health agencies, Children’s Aid Societies, and Community Action Program for Children (CAPC) programs); personal experience with agencies; and online searches by population criteria (such as disability categories). Many of the websites included links to additional organizations. A database was developed to record information about the organizations and to identify attributes of the EI system, or the general characteristics based on the aggregate data.
Two research assistants (RAs) were employed in the study. These RAs were selected as a result of their professional experience in the system, working in larger multi-service agencies. Two phases of data collection were employed. The first search for organizations, who listed early intervention as one of their services, resulted in a database of 228 organizations. The second phase of data collection involved cleaning the data. The categories were revised, organizations were searched, and duplicates, which resulted from organizations being listed on multiple sites, or programs that were offered as part of collaboration between organizations, were consolidated and/or deleted. In addition, during the second phase of data collection, many additional organizations were identified. This systematic approach resulted in a database of 361 organizations. Missing data points indicate where public information was not available.
The findings are community level documentation of services, presented using maps of the province. Community level factors in work using the Early Development Index (EDI) have been linked to child outcomes across Canada (Janus, Hughes, & Duku, 2010; Janus & Offord, 2007; Lloyd, Irwin, & Hertzman, 2009). Mapping is a method that is borrowed from geography and has been very useful in understanding community level factors that contribute to outcomes for individuals. Mapping in particular has been useful in showing patterns of difference. For example, David Hulchanski’s work has shown the changing demographics in Toronto since the 1970s with a dramatic polarization of income across the city (Hulchanski, 2010). These studies, as well as the study described in this paper, fit within the tradition of geographers who aim to understand human diversity and difference in relation to place (McDowell, 1995).
Using postal code data, each organization was assigned to a postal code zone and assigned to a region of the province. The frequencies are reported within five regions of the province: Eastern (postal codes beginning with K), Central (postal codes beginning with L), Toronto (postal codes beginning with M), Southwestern (postal codes beginning with N), and Northern (postal codes beginning with P). In future research, more sophisticated mapping technologies may be employed to better understand the options available to children and their families at the community level. It will be possible to compare rural, suburban and urban communities, in addition to regional comparisons.
Limitations of the studyThe study does not include information about the number of children served in each organization. This means that the size of the organization is not accounted for in the analysis. This limits the interpretation of the frequencies, making it important to emphasize the range of choices available to children and their families over the number of services available. The reason this information was not collected is that in most cases it was not available from public information about the services. While information about the number of children and families services should be collected in future research through a questionnaire to each organization, the current study provides the database necessary to do a questionnaire.
At the time of this study (2009/2010), the provincial government and other community organizations had been doing a number of studies that involved questionnaires, which presented a risk of research fatigue in the community. These studies, however, have limits because they were designed to identify information relevant to the organizations who conducted the studies. A broader scan of the early intervention system for the purposes of research in the academic community is needed. The work of other organizations was used as a starting point for this study (see data source above). In addition to the timing of the study, the
128
INTERNATIONAL JOURNAL OF SPECIAL EDUCATION Vol 27, No: 2, 2012
method of searching publicly available information ensures a more comprehensive scan, because it is not reliant on return rates of questionnaires, and the criteria for including organizations is not limited by criteria such as the funding agencies, or membership in a professional body.
FindingsThe early intervention system in Ontario is characterized by widely diverse types of programs delivered by a range of service professionals. The range of services is in turn funded by many different sources, both public and private. The system serves many population groups including diverse geographic populations as well as children with particular diagnoses. The Early Intervention system does not serve children across populations with the same level of service. These findings are divided into the diversity of programs and professional affiliations; funding sources; and populations served.
Table 1. Types of Early Intervention Services by Region of Ontario
Region by postal code
soci
al w
ork
serv
ices
Res
iden
tial p
lace
men
t ser
vice
s
IBI/A
BA
, B
ehav
iour
al se
rvic
esC
omm
unic
atio
n th
erap
ies
Scho
ol/c
hild
care
supp
ort
Segr
egat
ed sc
hool
/
Ref
erra
l
Rec
reat
iona
l/soc
ial
Prof
essi
onal
Con
sulta
tion
and
Educ
atio
nPh
ysic
al a
nd se
nsor
y re
habi
litat
ion
Pare
nt su
ppor
t/tra
inin
g
Cas
e m
anag
emen
t
Dev
elop
men
tal
Med
ical
Tre
atm
ent &
D
iagn
osis
Men
tal h
ealth
serv
ices
mis
sing
Eastern12
12 12
16
16 0 83
12 13 12 95 13 42 12
47 0
Central2 2 3 5 4 2 116 2 4 2 130 4 26 2
68
27
Toronto 36
18 18
28
32 16 63
23 23 18 64 22 33 18
36
18
South-west 010 10
16
18 0 116
14 14 3 113 14 44 0
79 0
North18
26 26
27
37 0 112
26 14 26 135 26 54 25
73
18
Diversity of programs and professional affiliationsThe US based organization, Division for Early Childhood (DEC, of the Council for Exceptional Children) states that “inclusion, as a value, supports the right of all children, regardless of abilities, to participate actively in natural settings within their communities. Natural settings […] include but are not limited to home, preschool, nursery schools, Head Start programs, kindergartens, neighborhood school classrooms, child care, places of worship, recreational and other settings” (Sandall, MacLean, & Smith, 2000, p.1). Does this mean that all services for children should be delivered in natural settings? The DEC statement on inclusion goes on to explain that services must support families and children to access these settings, but presumably the services do not need to be in these settings. In Ontario, services are sometimes delivered in natural settings but more often early intervention is delivered in centre based or clinical settings. These settings tend to have more intensive interventions but the outcomes are not necessarily better. Blackman (2003) says programs that support environmental adaptations by families, caregivers or teachers are as important as programs that target individual development in children.
Early Intervention happens in Ontario in traditional childcare and nursery school programs, kindergartens and primary grade classrooms as well as in special education or specialized intervention programs. Specialized programs are available through community based programs and family support programs as well as through clinical programs in health care settings.
129
INTERNATIONAL JOURNAL OF SPECIAL EDUCATION Vol 27, No: 2, 2012
A range of professional groups are associated with Early Intervention in different settings. These professions include but are not limited to Early Childhood Educators (ECE), Occupational Therapists (OT), Physical Therapists (PT), Speech and Language Pathologists (SLP), Physicians (MD), Psychologists, and Psychiatrists. Each of these professional groups has their own standards of practice and a tradition associated with the history of their profession. However, in many cases children are accessing services from a number of these professionals at the same time. In addition, there are many names used to describe this profession, including Resource Teachers, Developmental Consultants and Early Interventionists to name a few. The status and pay of these professionals also varies by the funding and administrative agencies. The result is that different programs may ascribe to very different philosophies of practice, which can result in children with similar characteristics receiving very different services. Differences in accessibility, quality and consistency of services may in turn affect inclusion of children with disabilities in our society.
Figure 1. Professional Representation in Early Intervention Services by Region
Populations servedEarly Intervention services may target a particular population or they may be delivered through universal programs. As described above, EI often happens in “natural settings”. However, across the province many EI services target children with particular disabilities, cultural affiliations or in particular geographic regions. This may be a result of targeted funding. For example, the Ministry of Child and Youth Services has dramatically increased funding to intervention programs for children with autism compared to other disability categories, and yet many parents see autism supports as being inadequate (Ministry of Child and Youth Services, 2008). Funding will be discussed further in the next section of this paper. In the school years, most intervention services are delivered through the school system where the majority of services are delivered in school settings. This is a dramatic shift from the early years and may affect accessibility of services for families who experience disruptions. The transition from the early years to school age services is often the responsibility of families because of concerns about confidentiality and the lack of coordination amongst organizations (Janus, Lefort, Cameron, & Kopechanski, 2007).
It might be expected that services targeting children with particular diagnostic categories would have prevalence in proportion to the occurrence in the population. The Participation and Activity Limitation
130
INTERNATIONAL JOURNAL OF SPECIAL EDUCATION Vol 27, No: 2, 2012
Survey (PALS, 2001) is the most recent available data on prevalence of disability in the Canadian population. The incidence of disability in for children from birth to four years (as reported in Government of Canada, 2006) was 1.6%. Of these children, 12% had disabilities related to hearing, 8% seeing, 63 % chronic illness including asthma, allergies, complex medical conditions, cerebral palsy, autism, heart conditions, and spina bifida, 68% developmental delays, and 8.9% had disabilities of an unknown origin. One would expect services to exist in proportion to the prevalence of disability in the society. However, from our data to date, it appears that the majority of services are for children with communication disorders including speech and language services and services for children with autism. This should be investigated further.
Figure 2. Prevalence of Services for Children with Diagnosed Disability Category by RegionFunding
EI services are funded through a variety of sources. Across the EI system there are four different Ministries of the provincial government who provide funding depending on the age the children and the type of service. These provincial funds are administered by multiple agencies and organizations with vastly different philosophical orientations. The four government ministries include the Ministry of Child and Youth Services, the Ministry of Community and Social Services, the Ministry of Health and Long-Term Care and the Ministry of Education. The funding for Early Intervention services is administered differently from each source resulting in some sources of funding being accessed directly by families, but the majority of funding being administered through the agencies providing the services. In addition to funding from the province, many of the organizations who provide Early Intervention are supported by private donations and direct fundraising campaigns. This has implications for setting policy across the EI system.
DiscussionFrankel (2004) notes that there is a public policy framework in Canada that supports inclusive practice in early childhood education and care. However, in practice Frankel identifies three factors that can either support or deter inclusion. These are government funding, staff training and attitudes, and resource supports and consultative services (Frankel, 2004). These barriers are evident in the findings of the study
131
INTERNATIONAL JOURNAL OF SPECIAL EDUCATION Vol 27, No: 2, 2012
given that there is variability across the province in all three areas. Similarly, Killoran, Tymon, and Frempong (2007) found that, despite the policy context, the majority of Toronto pre-schools are not inclusive of children with disabilities. Killoran et al findings that the barriers to inclusion are largely related to availability of resources and attitudes of centre directors is consistent with research by Irwin, Lero, and Brophy (2004) that found similar barriers across Canada.
Figure 3. Funding for Early Intervention in Four Regions of Ontario, by Proportion
The findings of the study indicate a degree of variability in services in several areas: where funding comes from, who is delivering the services and how the services are designed and for whom. This variability means that children and families in different parts of the province may be having very different experiences. It is important for families and service providers to understand the variability in the system in order to target advocacy and lobbying efforts to ensure that children have the supports they need. The range of professionals and funders in the province provide a starting point for policy makers, researchers, and families to identify where to target their efforts when trying to bring about change, or to conduct research, in the early intervention system.
Additionally, this type of information provides a framework for understanding the many programs that are supporting children in early intervention. Research in early intervention in Canada has tended to focus on a few high profile programs that have been documented by researchers (Patel & Corter, 2011). These programs have been very important in supporting public policy in the early years and in education. However, the studies that focus on specific programs do not necessarily illustrate the scope of supports and services in the early years in the province. The lack of information about early intervention services may put these programs at risk if the public do not see the value of investing in them.
Future research in this area should expand the scope of understanding by collecting information about outcomes and documentation of successful programs and services. Individual family experiences should also be documented with a focus on equity, and the effects of political trends on the services available in the province. Finally, issues of transition to school should be understood better in relation to the variability in early intervention services identified in this study. More sophisticated mapping techniques
132
INTERNATIONAL JOURNAL OF SPECIAL EDUCATION Vol 27, No: 2, 2012
will allow evaluation of community factors such as population density, affluence of the community, and achievement levels in schools. Funding should also be tracked over time to assess impact of political decisions on targeted funding for particular types of service and outcomes for children and families.
With an expanded scope, a better understanding of the early intervention system will allow strategic decisions to be made for the province. This work builds on the local knowledge that is embedded in many of the programs and services that are in place. Additionally, a better understanding of the early intervention system in Ontario may allow better communication with schools.
References Albright, K.S. (2004). Environmental scanning: radar for success. Information Management Journal, 38(3), 38–45.Arskey, H., & O’Malley, L. (2005). Scoping studies: Towards a methodological framework. International Journal of Social Research Policy, 8, 19-32.Blackman, J. (2003). Early intervention. In S.L. Odom, Hanson, M.J., Blackman, J.A. & Kaul, S. (Eds.) Early intervention practices around the world (pp. 1-23). Baltimore: Brookes.Bruder, M. B., & Dunst, C. (2008). Factors related to the scope of early intervention service coordinator practices. Infants & Young Children, 21, 176-185.Camilli, G., Vargas, S., Ryan, S. & Barnett, W. S. (2010) Meta-analysis of the effects of early interventions on cognitive and social development. Teachers College Record, 112. Retrieved from: http://www.tcrecord.org ID Number: 15440.Cleveland, G., Corter, C., Pelletier, J., Colley, S., Bertrand, J., & Jamieson, J. (2006). A review of the state of the field of early childhood learning and development in child care, kindergarten and family support programs. Toronto, ON: Aktinson Centre for Society and Child Development, OISE/University of Toronto.Feldman, M. A. (Ed) (2004). Early Intervention: the essential reader. Oxford: Blackwell.Frankel, E. (2004). Supporting inclusive care and education for young children with special needs and their families: an international perspective, Childhood Education, 80, 310-316.Friendly, M. & Lero, D. (2002). Social inclusion through early childhood education and care. Toronto, Canada: Laidlaw Foundation.Fuchs, D. & Deschler, D.D. (2007). What we need to know about responsiveness to intervention (and shouldn’t be afraid to ask). Learning Disabilities Research and Practice, 22, 129-136.Government of Canada (2006) The well-being of Canada’s young children: Government of Canada Report 2006. Human Resources and Social Development Canada, the Public Health Agency of Canada and Indian and Northern Affairs. Retrieved from: www.socialunion.caGuralnick, M. (2004). Effectiveness of early intervention for vulnerable children; a developmental perspective. In M.A. Feldman (Ed) Early Intervention: the essential reader (pp.9-50). Oxford: Blackwell.Guralnick, M. (2011). Why early intervention works: A systems perspective. Infants & Young Children, 24, 6-28.Guralnick, M. (Ed) (2000). Early childhood inclusion: focus on change. Baltimore: Brookes.Hanson, M. J. (2003) National legislation for Early Intervention: United States of America. In S.L. Odom, Hanson, M.J., Blackman, J.A. & Kaul, S. (Eds.) Early intervention practices around the world (pp. 253-279). Baltimore: Brookes.Irwin, S.H, Lero, D.S. & Brophy, K. (2004). Inclusion: The next generation in child care in Canada. Wreck Cove, NS: Breton Books. Retrieved from http://www.specialinkcanada.org/books/ING_inclusion.pdf. Janus, M., & Offord, D. (2007). Development and psychometric properties of the Early Development Instrument (EDI): A measure of children’s school readiness. Canadian Journal of Behavioral Science, 39, 1-22.Janus, M., Hughes, D., & Duku, E. (2010). Patterns of school readiness among selected subgroups of Canadian children: Children with special needs and children with diverse language backgrounds. Canadian Council on Learning. Retrieved from: http://www.offordcentre.com/readiness/files/2010_05_06_SR_subgroups_SN_Lang_CCL.pdfJanus, M., Lefort, J., Cameron, R. & Kopechanski, L. (2007). Starting kindergarten: Transition issues for children with special needs. Canadian Journal of Education, 30, 628-648.Johnston, C. F. (2003). Formal and informal networks: Australia. In S.L. Odom, Hanson, M.J., Blackman, J.A. & Kaul, S. (Eds.) Early intervention practices around the world (pp. 281-300). Baltimore: Brookes.
133
INTERNATIONAL JOURNAL OF SPECIAL EDUCATION Vol 27, No: 2, 2012
Killoran, I., Tymon, D. & Frempong, G. (2007). Disabilities and inclusive practices within Toronto preschools. International Journal of Inclusive Education, 11(1), 81-95.Lindqvist, G., Nilholm, C., Almqvist, L., & Wetso, G. -M. (2011). Different agendas? The views of different occupational groups on special needs education. European Journal of Special Needs Education, 26(2), 143-157.Lloyd, J.E.V., Irwin, L. G., & Hertzman, C. (2009). Kindergarten school readiness and fourth-grade literacy and numeracy outcomes of children with special needs: a population-based study. Educational Psychology, 29, 583-602.McCain, M. N., Mustard, F., & Shanker, S. (2007) How are Children Doing? Early Years Study 2: Putting science into action. Toronto, ON: Council for Early Child Development. Retrieved from: http://www.councilecd.ca/cecd/home.nsf/pages/EYS2McDowell, L. (1995). Understanding diversity: The problem of/for “Theory”. In R.J. Johnston, Taylor, P. J., & Watts, M. J. (Eds.), Geographies of global change” remapping the world in the late-twentieth century (pp. 280-94). Oxford: Blackwell.Ministry of Children and Youth Services (2008). Results-based Plan Briefing Book 2008-2009. Toronto, ON: Government of Ontario. Retrieved from: http://www.gov.on.ca/children/graphics/247796.pdf. Patel, S., & Corter, C. (2011). Early intervention research, services, and policies. In A. Slater, Lewis, M., Ansures, G. & Lee, K. (Eds.). Introduction to Infant Development, Canadian Edition. Oxford: Oxford University Press.Hulchanski, D. (2010). The three cities within Toronto: Income polarization among Toronto’s neighbourhoods, 1970- 2005. Toronto, ON: Cities Centre Press.Muralidharan, R. (2003). Environmental scanning and strategic decisions in multinational corporations. Multinational Business Review, 11(1), 67–87.Sandall, S., McLean, M.E. & Smith, B.J. (2000). DEC recommended practices in early intervention/early childhood special education. Longmont, CO: Division for Early Childhood. United Nations. (2007). Convention on the Rights of Persons with Disabilities. Retrieved from http://www.un.org/disabilities/convention/conventionfull.shtmlWillms, J. D. (ed.) (2002). Vulnerable children: Findings from Canada’s National Longitudinal Survey of Children and Youth. Edmonton, AB: University of Alberta Press.
134
INTERNATIONAL JOURNAL OF SPECIAL EDUCATION Vol 27, No: 2, 2012
NATIONAL REGULATIONS AND GUIDELINES AND THE LOCAL FOLLOW-UP IN THE CHAIN OF ACTIONS IN SPECIAL EDUCATION
Sven NilsenCamilla HerlofsenUniversity of Oslo
The topic of this article is the chain of actions in special education in Norwegian compulsory schooling. The main research question is: how do local practise concur with national regulations and guidelines in different phases of the chain of actions in special education? The study is carried out as an evaluation study. The criteria on which the analysis of local practice relates to are clarified based on the analysis of national regulations and guidelines. A qualitative content analysis of written documents has been conducted, both with regard to regulations and practice. Data aimed at throwing light on local practice covers a total of eight pupil cases, each of which contains the relevant documents from the phases in the chain of actions. Based on the results, we can first of all conclude that a rather varying accordance exists between practise and regulations in different phases of the chain of actions. Certain parts of the regulations appear to be followed up effectively, but the follow-up in other areas is far less clear and at times inadequate. Second, the results indicate that the interrelationship between the different phases of the chain of actions varies. This represents a serious challenge, not only for the individual phases, but also for the chain as a whole. Thus, there appears to be a clear need to improve the quality, where the focus should be on aspects of practice as well as the regulations.
The central issue of this article is the chain of actions in special education in Norwegian compulsory schooling. National regulations and guidelines have been laid down for each phase of the chain of actions, which local practice is subject to and shall endeavour to comply with. National regulations in this context are defined as first of all national legislation, as well as associated regulations, including the national curriculum. National guidelines primary relate to the Norwegian Directorate for Education and Training’s guidelines on special education, which illustrate the desired practice based on an interpretation of national regulations. Local practice encompasses local schools and the local Educational and Psychological Counselling Service (PPT). This relates to a coherent chain of actions aimed at identifying and expertly assessing the need for special education, in addition to determining a resolution on, planning, implementing and assessing such education.
The Principle of Adapted Education and the Right to Special EducationIn Norwegian schools, special education is part of a more overarching principle of adapted education. The emphasis on adapted education is partly connected to the development of the Norwegian unitary school system, where the aim has gradually been to cover steadily more groups of pupils, regardless of background, abilities and aptitudes. This has increased the diversity of the pupil population, and consequently also the need for adapting the education in order to cater for the diversity (Nilsen, 2010). The Education Act (Norway) stipulates that education shall be adapted to the abilities and aptitudes of the individual pupil. This forms the formal basis for adapted education as an overarching principle. Initially, this is aimed at what the Act refers to as the ordinary education. However, experience shows that such adaptation is not sufficient for some pupils to achieve a satisfactory benefit from the education.
135
INTERNATIONAL JOURNAL OF SPECIAL EDUCATION Vol 27, No: 2, 2012
These pupils are considered to need a more extensive adaptation, and the Education Act gives them the right to special education. The more extensive adaptation and the support through special education may relate to a greater adaptation of content, expressed through an individual education plan, greater input of resources; mainly time, and a strengthened competence-related input in the form of special education competence.
The Chain of Actions in Special Education The local work aimed at protecting the right to special education shall be carried out through many links in the chain. We talk about a chain of actions. The chain starts when a problem is identified and reported by individual teachers, and continues until special education has been expertly assessed, approved, planned, implemented and evaluated. This chain of actions involves interaction between participants in several local arenas, in particular in schools and the PPT. In addition, the parents and the actual pupil are also key players in certain phases (Nilsen, 2011). National regulations and guidelines set standards for how the work in special education shall be carried out in every phase and on the cohesion between the phases. These standards can form a basis for comparing practice. Based on the regulations, the chain of actions in special education covers the following main phases:The teachers describe their concerns of the possible need for special education in a report to the head teacher.The school sends a referral to the PPT of the need for special education.The PPT conducts an expert assessment of the need for special education.The school owner (or head teacher after delegation) makes an individual resolution for special education.The school devises an individual education plan (IEP).The school implements the special education. The school generates a semi-annual report on the special education and the pupil’s progress.
This study is confined to the four phases from the school’s referral to the PPT up until the school devises an IEP. Further reference to the regulations for these phases is given in the results section, as part of the work on clarifying criteria that are used to compare the quality of practice.
A document will be prepared during each of these phases, which will show the processing of the case. These documents relate to the school’s referral to the PPT, the PPT’s expert assessment, the local authority or the head teacher’s resolution protocol and the school’s IEP. By studying such documents and following them from phase to phase, a picture can be obtained of the case handling in each link and of the cohesion between the links. By comparing the content in the relevant document with regulations and guidelines for the phase, a picture can be formed of the quality of the case handling and the work on special education in each phase. The quality is then analysed based on the relationship between what is prescribed in regulations and guidelines, and what is demonstrated in practice.
The chain of actions in special education aims to fulfil several objectives. This relates in part to a formal, administrative objective, whereby correct case handling helps ensure that the right to special education is well protected. However, the objective also has an important practical, educational aspect, whereby an optimum support system shall be developed for the practical work in special education in schools and the classroom (Nilsen, 2011). If both of these objectives do not work together, and it becomes the formal, administrative object that is salient, the teachers may easily perceive the regulations to be unnecessarily formal and bureaucratic, and look upon the work with the documents, such as the IEP, as a waste of paper (Cooper, 1996).
Local Follow-up of National Regulations and Guidelines An OECD assessment of the Norwegian school system has recommended that more emphasis should be placed on the principle of adapted education. It was highlighted that the schools need to develop better strategies in order to identify and follow up pupils who face problems. It was stressed that in order to improve the school system, active effort is demanded from everyone involved, as well as local school authorities and schools (Mortimore et al., 2004).
Developing a good interplay between the different levels in the education sector has long been considered a challenge for Norwegian schools (Report no. 37 to the Storting (1990-91)). A difficult balance of decisions between national governance and the decentralisation of responsibility has engendered questions about whether the quality of education is governable or not (Weiler, 1990). In a more recent report to the Storting, the need is stipulated for both clearer national governance and better
136
INTERNATIONAL JOURNAL OF SPECIAL EDUCATION Vol 27, No: 2, 2012
local follow-up, and that the quality in schools is dependent on joint effort at all levels (Report no. 31 to the Storting (2007-2008)).
Success in the different phases of the chain of actions is dependent on interaction between national formulation and local realisation. Each phase is subject to national regulations and guidelines, which are aimed at both the PPT and the individual school. Simultaneous to this, the quality in the chain of actions depends on these local bodies following up and executing each phase in accordance with the national standards.
This requires local work on improving the quality of special education to be carried out using legislation, the curriculum and other regulations as the determining framework and direction for the input. The national regulations and guidelines form key criteria for the work on quality improvement, which the local input must be assessed against. The national regulations and guidelines also give room for local priorities and adaptations. Thus, it is not just about a one-sided goal-means-rationality, where finding the right means to meet national goals is all that matters. To a certain extent, it also has a cultural and institutional perspective, where the individual school acts based on local culture and tradition and its experiences of what type of practice works well (Christensen et al., 2007).
Research QuestionThe main research question addressed in this study is: how do local practise concur with national regulations and guidelines in different phases of the chain of actions in special education? This study of the chain of actions is confined to four phases. In order to put the main research question in more concrete terms, four sub-questions are posed. These relate to the interrelationship between local practice and national regulations and guidelines with regard to (1) the school’s referral to the PPT, (2) the expert assessment from the PPT, (3) individual resolutions on special education and (4) the school’s formulation of IEP respectively. These questions are addressed in the results section in the same order as rendered here, first with a clarification of regulations and guidelines, followed by an analysis of local practice. These questions aim to give us an insight into how regulations and guidelines for the different phases of the chain of actions in special education are followed up and practiced by local bodies, and challenges that manifest themselves in this regard.
MethodThe study is carried out as an evaluation study (Weiss, 1998). It relates to a systematic collection, analysis and comparison of data on the different phases in the chain of actions in special education. The analysis is in two parts. For each phase, the national regulations and regulations are studied, followed by local practice. The criteria on which the analysis of local practice relates to are clarified based on the analysis of national regulations and guidelines.
The primary research method, on which the evaluation is based, is document analysis. A qualitative content analysis of written documents has been conducted, both with regard to regulations and practice (Krippendorff, 2004). In relation to the regulations, this entails the study of relevant legislation (the Education Act and Public Administration Act) and regulations, including the national curriculum. The interpretation is also based on the Norwegian Directorate for Education and Training’s guidelines on the education legislation on special education, and other education policy documents such as reports to the Storting, white papers and Storting’s reports on these. A hermeneutic-based analysis is carried out, where various sections in the documents are considered in conjunction with each other with a view to gaining a holistic understanding of each phase in the chain of actions (Gadamer, 2004).
The same principle approach is also applied to the practice side, where the local follow-up of regulations is studied. Data aimed at throwing light on local practice covers a total of eight pupil cases. This data is collected from four schools, which have each provided two pupil cases. The schools are spread over two municipalities, with two schools from each. Each pupil case contains the relevant local documents from the phases in the chain of actions we are examining (the school’s referral form, the PPT’s expert assessment, the school’s resolution protocol and IEPs). The documents are retrieved from the schools’ pupil files, and permission to access the files is obtained from local education authorities and the parents. The sample is made up of cases from pupils who have received an individual resolution for special education, and where the cases will therefore have followed the phases of the chain of actions. This relates to pupils with difficulties in subjects (primarily mathematics, reading and writing) that are commonly the basis for the need for special education.
137
INTERNATIONAL JOURNAL OF SPECIAL EDUCATION Vol 27, No: 2, 2012
The sample of municipalities is made up of one urban and one rural municipality, and these are located in two different regions of Norway. Despite such differences, the analysis shows a number of common features in the characteristics of different pupil cases and phases in the chain of actions. It will therefore mainly be such patterns in practice that we will concentrate on identifying and describing (Patton, 2002) with a view to ascertaining how the work in special education is carried out in each phase. Where clear differences can be seen, these will also be highlighted. We expect the patterns that we find to demonstrate interesting examples of local practice in key parts of the chain of actions. Further generalisations must be of an analytical nature.
ResultsResults for the four relevant phases of the study on the chain of actions in special education are presented below. First, key aspects of national regulations and guidelines on the chain of actions are discussed for each phase, followed by an account and assessment of the schools and the PPT’s follow-up in the area, and a comparison of this with regulations and guidelines.
The School’s Referral to the PPT for Expert AssessmentNational regulations and guidelinesThe first phase in the chain that is analysed is the school’s referral to the PPT. There are no statutory requirements as regards what information needs to be provided when referring to the PPT. However, the guidelines of the Ministry of Education and Research (2004) and the Norwegian Directorate for Education and Training (2009) recommend that referral should be in writing, and that an educational report should be compiled as part of the referral, either as a separate document or as part of the referral form.
Based on the guidelines, we have limited the analysis of the referral to four criteria: what types of assessments and investigations the school has carried out; how the pupil functions in the group/class; what measures have been tried, and an assessment of these; the cooperation with the pupil and the parents. Further details are given below of each of these criteria, first with a reference to regulations and guidelines, followed by a description of the practice in the schools.
The schools’ follow-upIt should be noted that a written referral document is prepared in all cases. However, not all cases have a separate educational report.
With regard to the first criterion in the analysis of the referral to the PPT, the national guidelines recommend that the referral includes a description of what types of investigations and assessments the school has carried out. The guidelines also recommend that this should include both individual and system factors linked to the pupils’ aptitudes and the educational provision. The school’s assessments can be founded on both the results from mapping work and on the impression that the school has of the pupil’s skills and functioning based on the ongoing assessments that are part of the education. It is important to consider the strengths as well as the weaknesses of the pupils’ competence here. The guidelines are more limited and less clear in relation to how the education should be mapped.
With regard to practice, reference is made to mapping tests for all of the pupils in the study except one. The schools in one municipality have given only brief descriptions, while the other have provided much more in-depth descriptions of the pupils, both in relation to mapping test results and the pupil’s ability to function in the different subjects. The assessment of this functioning is not covered to any large degree, either in relation to the goals for competence in the national curriculum or the other pupils’ levels of ability. Additionally, the mapping work and assessments generally have a much clearer focus on the individual than on the system.
As regards the second criterion; how the pupil functions in the group/class, the guidelines give no further details of what this entails. One possible interpretation is that it relates to how the pupil functions socially, i.e. in relation to working with others, verbal interaction and friendships. With regard to the school’s practice, all of the cases provide a description of how the pupil functions in the classroom. Descriptions are given, albeit often brief, in relation to the situation concerning friends, interests, verbal participation, level of conflict and ability to concentrate. Such descriptions can help form a complete picture of the pupil in relation to strengths and problems, which is important for the PPT.
138
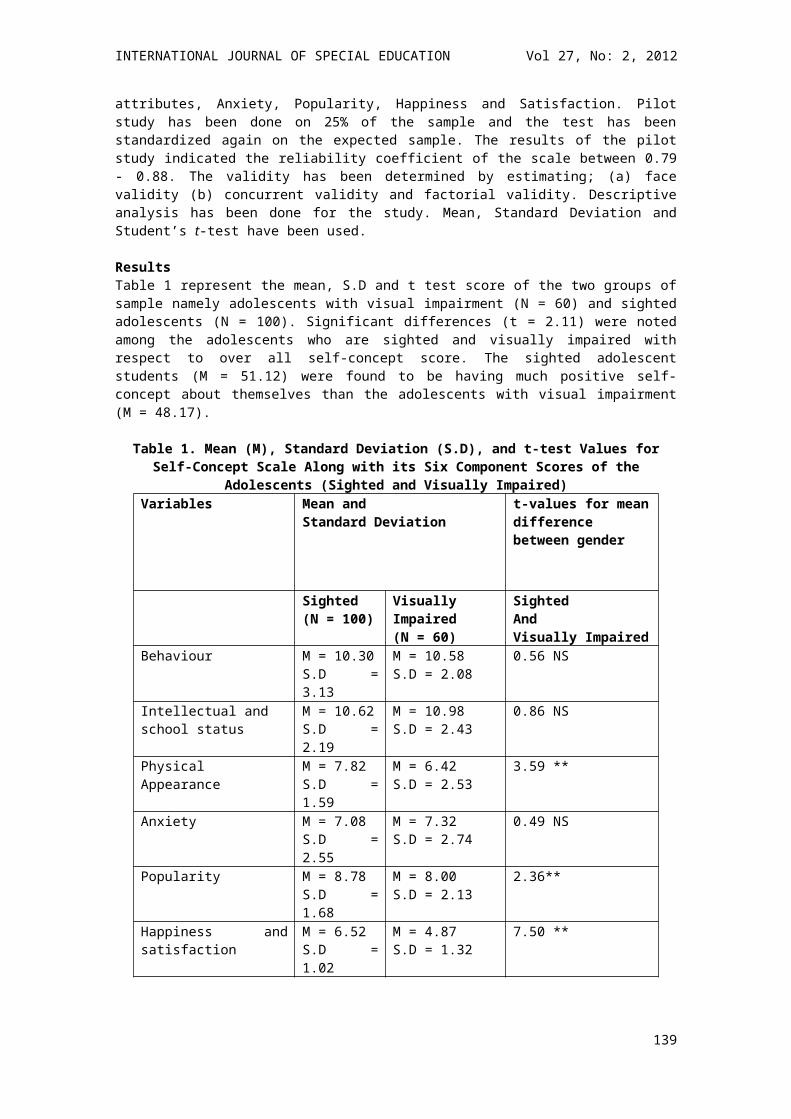
INTERNATIONAL JOURNAL OF SPECIAL EDUCATION Vol 27, No: 2, 2012
When it comes to light that a pupil is not getting adequate benefit from his education, the guidelines say that various ways should first be tried to adapt the ordinary education. If there is still considered to be a need for special education, the guidelines recommend that details are given and assessments made of what measures have been tried. With regard to the schools’ practice, the analysis shows that the referral forms rarely include very much detail of the types of measures that have been implemented for the pupils. The descriptions that are given mainly relate to the organisation of the education, and the few assessments that are given of the measures tried are brief. In one municipality, none of the schools have given an assessment of the measures for any of the pupils. The assessments in the other municipality mainly relate to the fact that the pupils are not showing satisfactory development despite the measures implemented.
With regard to the cooperation with the pupil and the parents, the Education Act requires parental consent for a pupil to be referred to the PPT (until the age of 15). The Act also stipulates that the offer of special education shall, as far as possible, be devised together with the pupil and the parents, and that their views will be a key focus. The guidelines justify the cooperation with the assertion that it is the parents who know the pupil the best, and it is therefore crucial that their knowledge and opinions are taken into account.
In relation to the requirement of the Education Act for parental consent prior to referral to the PPT, a somewhat varying practice can be noted in the schools. In one municipality, half of the cases have no parent signatures. In the other municipality, all of the cases have a signature and consent. The review of the cases also shows a strong varying practice with regard to whether the parents’ information and opinions are described and assessed. A number of cases refer to the dialogue and cooperation between school and home, and comments are given on how the parents help the pupil with their homework. Likewise, the parents’ experiences, assessments and wishes are also described. In other cases, none of these aspects are mentioned.
The Expert Assessment from the PPTNational regulations and guidelinesThe second phase in the chain of actions covered in this article is the PPT’s expert assessment. The Education Act imposes an obligation on all municipalities to have a PPT (in cooperation with other local authorities if appropriate), which aims to ensure that an expert assessment is undertaken before any resolutions on special education are determined. This assessment shall show both whether the pupil has a need for special education and what special education should be provided.
The Act also imposes requirements on the content of the expert assessment. It shall, for example, report on and assess the benefit that the pupil gets from the ordinary instruction, which must particularly be viewed in conjunction with the Act’s provision for a pupil’s right to special education. The next point is the pupil’s learning difficulties and other special conditions that have a bearing on the education. These two points can be regarded as constituting the expert assessment’s review section. The review must then be followed up with an assessment of consequences in the form of advice on the special education that the pupil needs, which can be regarded as constituting the recommendation section of the assessment. This section shall first of all contain advices on realistic educational objectives for the pupil, and second, whether the pupil’s difficulties can be addressed within the ordinary instruction, and third, what type of instructions constitutes a reasonable educational provision.
The Act does not impose any requirements for the form of the expert assessment. However, it must be assumed that the assessment has to be in the form of a written report that satisfies the content requirements. Primarily, the expert assessment must be clear and specific enough to form the basis for determining a resolution on the special education. In addition, it must also be suitable to act as an aid to the schools’ planning of special education based on the resolution.
The PPT’s follow-up.It must first be noted that in all of the cases on special education that are analysed in this article, an expert assessment has been carried out, as required by law. The PPT performed these assessments. All of the assessments explicitly conclude that the pupils have a need for special education. There appears to be reasonably good cohesion with the previous link in the chain of actions, since the expert assessment refers back to the school’s referral. As a general observation, the expert assessments have varying structures, and adhere to the content areas and the order that corresponds to the content requirements of the Act to varying degrees.
139
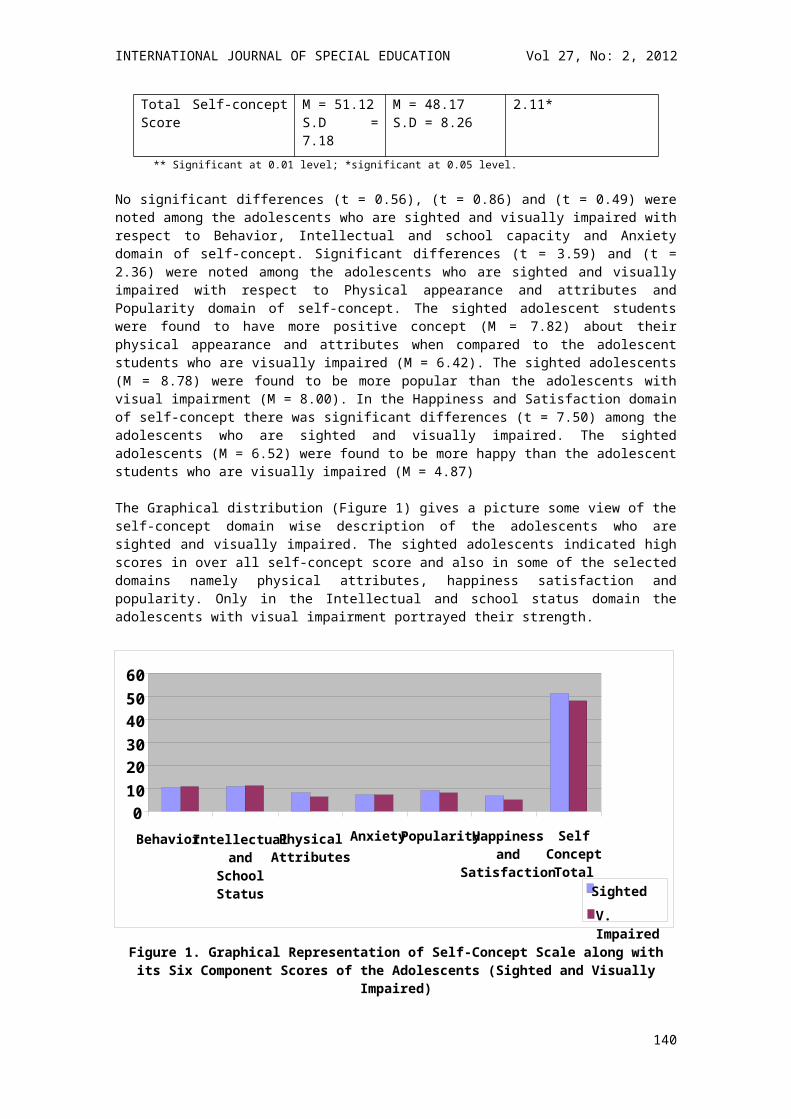
INTERNATIONAL JOURNAL OF SPECIAL EDUCATION Vol 27, No: 2, 2012
The Act’s requirement for a report on the pupil’s benefit from the ordinary instruction is covered in all of the assessments. The assessments primarily seem to place the emphasis on individual characteristics here. These relate to what abilities and aptitudes the pupils have for benefitting satisfactorily from the education, and only to a limited extent to the education’s ability to give the pupils such a benefit through adequately adapted education.In several of the cases, the PPT has referred to various difficulties of a specific nature. The diagnosis in itself does not entitle a pupil to special education, but the PPT refers to the diagnosis when it concludes that the pupil does not benefit satisfactorily from the education and therefore has a need for special education. The pupil’s difficulties and benefits are thus clearly linked together in several of the cases. On the other hand, the pupil’s competence is not so clear in relation to the development that can be expected based on the goals for competence in the national curriculum, and this also applies to comparisons in relation to other pupils of the same age.
The emphasis on difficulties is also connected with the fact that several of the assessments merge this point with the next requirement of the Education Act, i.e. the pupil’s learning difficulties and other special conditions that have a bearing on the education. All of the expert assessments in the study discuss and give in-depth details of the pupil’s difficulties.
With regard to this point, the Norwegian Directorate for Education and Training (2009) recommends that the PPT also comments on the pupil’s strengths, in order to obtain a complete picture of the pupil’s competence. These are aspects that help enable advice to be given on which instruction should be provided, and not least to comply with the legislation where it stipulates that particular emphasis shall be placed on the developmental prospects of the pupil. The analysis shows, however, that the majority of cases are oriented towards difficulties, with the focus on areas where the pupil is struggling. Nevertheless, some of the cases also focus on the pupil’s strengths. Characteristics that relate to social skills and personality feature strongly. Some test results are used to highlight the pupil’s competence; both difficulties and strengths.
With regard to the recommendation section, the Education Act imposes requirements for the expert assessment to indicate realistic educational objectives for the pupil. It is crucial that a realistic assessment is made of both the goals for competence in the national curriculum in different subjects, and what the individual pupil can reasonably manage with the learning support that the school will try to provide. This must also be viewed in conjunction with the fact that the Education Act is open to exceptions from the ordinary content in the curriculum. It is reasonable to assume that the goals set by the PPT are of a general character to a certain degree, since the school will set more specific goals when devising an IEP for the pupil. However, the goals should also be specific enough that they guide the school on what type of goals the pupil should aim for. The goals should also be stipulated in such a way that they provide assistance in formulating a resolution on special education.
The analysis shows major differences in the advice that is given with regard to realistic educational objectives. For a few pupils who had moderate difficulties, it was assumed that the pupil could follow the goals for competence in the curriculum as long as the pupil received help with his difficulties. For other pupils with a greater need for support, the goals were individually adapted to a much greater extent. This may relate to changes in goal achievement in certain subjects or choosing goals in the subject that are applied at a lower year. In certain cases, it relates to the de-selection of goals because they seem too demanding for the pupil. The goals that are specified by the PPT also vary considerably in terms of how specific they are; from very open and general – and sometimes diffused – to the very specific and methodical. Additionally, educational objectives are often formulated in such a way that they constitute a mixture of goals and actions.
The second requirement in the recommendation section relates to whether the pupil’s difficulties can be addressed within the ordinary education offer. It is natural to consider this in conjunction with both the first requirement in this paragraph on evaluating the pupil’s benefit from ordinary education and with the condition for receiving special education: whether the pupil is or can benefit satisfactorily from ordinary education. These are often assessed together in the expert assessment, to a lesser or greater extent, instead of in a separate section. It may appear as if the PPT believes that the requirements of the Education Act overlap here or are repeated. References often relate to highlighting the difficulties that the pupil has, and all of the cases concluded that the need for adjustment is too great to be addressed through ordinary education.
140
INTERNATIONAL JOURNAL OF SPECIAL EDUCATION Vol 27, No: 2, 2012
The final point that the expert assessment should address is, what type of education constitutes a reasonable education offer. This can be understood as a unifying and conclusive point in the expert assessment, where both the review section and the other points in the recommendation section are used as a basis. The understanding of what educational objectives are realistic for the pupil will be covered in the basis of assessment. In addition to this, it may be expedient to give advice on what content the pupil should work with and ways of working and forms of organisation that should be used. The scope of the special education should also be covered.
The analysis of the pupil cases shows that there are large variations in whether and how this point is covered. Comments regarding reasonable education offer are sometimes rather general. Only one local authority’s assessments refer to the scope of the special education in terms of teaching hours. Not all of the assessments give details of the organisation of the special education. Comments in this point often consist of actions, without any reasons being given for why such actions would contribute to a reasonable education offer.
Resolutions concerning Special EducationNational regulations and guidelines The next main phase in the chain of actions in special education is individual resolutions on special education. Pursuant to the Education Act, it is the local authority that determines individual resolutions on special education within compulsory schooling. This authority can also be delegated to head teachers. The school, PPT and school owner are regarded as administrative bodies, and in cases relating to special education the local authority/head teacher must act in accordance with procedure rules in the Public Administration Act. The expert assessment provides the basis for the resolution, and if the resolution deviates from this assessment the reason must be clearly specified.
The legislation does not impose any requirements for the form of the individual resolution, different practice and different templates are therefore possible in the local authorities. However, the Public Administration Act states that an individual resolution shall be in writing. The individual resolution must also be justified, and in cases relating to special education this must be done at the same time the resolution is finalised. The content of this justification is also regulated by the Public Administration Act, where three conditions in particular must be covered by the individual resolution. First, reference shall be made to the rules on which the resolution is based, in this case the rules in the Education Act. To the degree it is necessary, the content of the rules shall also be quoted, or the problem on which the resolution is based.
Second, reference needs to be made to the actual conditions on which the resolution is based. Referring to the expert assessment may suffice, since this is a part of the case preparation and the pupil or parents will have had the opportunity to familiarise themselves with it. The third element to be included is the chief considerations that have been the determining factor in the administrative assessment. Of particular relevance is where the emphasis lies in relation to the legislation’s conditions for special education (Norwegian Directorate for Education and Training, 2009).
Based on the total requirements that are imposed, the individual resolution should consider the content, scope and organisation of the special education (Odelsting Proposition no. 46 (1997-98)). As mentioned, the individual resolution may refer to the expert assessment for further details, provided that this is clear and complete. Out of consideration to legal safeguards for the pupil, the resolution on special education shall be individual. Consequently, the resolution shall not be standardised (however a small part of the resolution may be standardised, e.g. on the rules on which the resolution is based). Beyond that, the Public Administration Act has further provisions on the information that the school owner/head teacher shall provide in the individual resolution. This includes information on the right of appeal, advance notification and right of access.
The schools’ follow-upIt must first be noted that in all of the cases in the study, an individual resolution has been made for special education, all by the head teacher at the relevant schools. In other words, a delegation practice seems to have been adopted in this area. Otherwise, the practice in the schools in the two municipalities varies somewhat.
141
INTERNATIONAL JOURNAL OF SPECIAL EDUCATION Vol 27, No: 2, 2012
One local authority has a standardised resolution that is the same for the four cases under assessment. The only aspect that distinguishes the cases from each other is the scope of the special education, which is considered for the individual pupil. With regard to the organisation of the education, a general sentence is formulated in the resolution on various forms of organisation. No individual assessment is given in relation to the individual pupil’s needs. Likewise, there is no individual justification for the content of the pupil’s special education. However, the resolution does state that the special education shall be provided in accordance with the expert findings. The consequence of this is that the PPT’s recommendation must be followed in the formulation of the education offer, both with regard to content and organisation. It is therefore important that the expert assessment is clear enough to ensure that there is no doubt about what type of education offer the pupil will have.
With regard to the legal conditions on which the resolution is based, reference is made to the requirements of the Education Act, but without quoting the content of this. As already mentioned, the Public Administration Act also sets requirements for the resolution to stipulate the chief considerations that have been vital to the assessment of the right to special education. There is nothing in the resolution that could be regarded as covering this point. Furthermore, the resolution includes some information on right of appeal, but does not refer to the relevant legislation.
The other local authority has a slightly different – and varying – practice. Two of the cases are given a standardised justification, while the other two have an individual justification. None of the resolutions have been specific about the scope of the special education for the pupil. Neither has the scope been considered in the expert assessment. The only reference is to which subjects the pupil needs special education in, and no indication of teaching hours is given. Thus, the scope of the special education has not been specified either in the resolution or the expert assessment. In the cases that have an individual justification, a brief description is given of the pupil’s difficulties and needs.
Furthermore, no clear account has generally been given of the content of the special education that the pupil needs. The justification for special education in the resolution tends to refer to the expert assessment in general, without explicitly stating that the recommendations in this assessment are to be followed with regard to the content of the education.
The resolutions are also unclear as regards the organisation of the special education. In addition to this, there are numerous examples of discrepancies between what is stated in the resolution about the organisation and what the expert assessment recommends, while simultaneously referring to the expert assessment. The wording in the general formulations in some of the resolutions (e.g. most of the special education is carried out in small groups) is inconsistent in places with the formulation of the expert assessment for the pupil (e.g. the pupil can easily be in the class, with some adjustments). Such cases do not seem to have an individual resolution that is as clear and complete as the regulations are assumed to require.
All of the four cases in this local authority include an appendix giving details of the relevant rules of law in the Public Administration Act. This information can be regarded as informative for the parents/pupil, and in line with the requirements of the Act in relation to the content of an individual resolution.
Individual Education PlansNational regulations and guidelinesAfter the individual resolution, the individual education plan (IEP) is the next phase in the chain of actions in special education. The Education Act requires an IEP to be drawn up for all pupils for whom an individual resolution on special education is determined. The school has overall responsibility for devising the IEP, based on the resolution and expert assessment. The aim of the plan is to help the school give the pupil an educational provision in-keeping with the resolution.
With regard to the content of an IEP, the Education Act states that it must specify goals for the education, the content in the education and how the education will be administered. Beyond this, the school has a free hand in drawing up an IEP. Local authorities often create a template that the schools can use when working on an IEP. With regard to goals and content in an IEP, the schools must try to balance the consideration to the national curriculum and the pupil’s aptitudes. This relates to the fact that the guidelines in the national curriculum on the content in the education also apply to special education, but only to the degree appropriate. This can be interpreted in such a way that the special education shall ensure consideration to academic community and individual adjustments, to inclusion and differentiation.
142
INTERNATIONAL JOURNAL OF SPECIAL EDUCATION Vol 27, No: 2, 2012
Main subject areas and associated competence goals in the national curriculum may, to a lesser or greater extent, be excluded, all depending on what is appropriate and is realistic for the pupil. As mentioned previously, the expert assessment should consider what educational objectives are realistic for the pupil, and any de-selection in the IEP shall be done within the framework of the resolution.
With regard to the content, the IEP should also give details of working methods that the pupil shall employ in order to build up the desired competence. The plan shall also show how the education is to be organised, as a follow-up to the resolution. How comprehensive an IEP should be must be considered in relation to the individual pupil’s needs. It is essential that the plan acts as a practical tool for the teachers in the planning and implementation of the education. It should therefore be simple and logical, and show totality and cohesion in the pupil’s educational provision (Norwegian Directorate for Education and Training, 2009).
The schools’ follow-upIn all of the cases in this study, an IEP has been drawn up for the pupil, and is presented as a separate document. Practice in the two local authorities differs somewhat in this link of the chain of actions.
One local authority has an IEP template that is easy to follow and has a simple design. The template places the emphasis on the development prospects of the pupil, which is one of the points in the legislation’s provisions on special education. The plans refer to the pupils’ strong sides and sides that may be strengthened (instead of only discussing difficulties). Pursuant to the legal requirements, the IEPs cover goals for special education, content and working methods. The goals appear to be specific and realistic for the pupil in relation to the expert assessment. Details are also given of which working methods shall be used in order to achieve the goals. In all of the cases in this local authority, the resolution refers to the fact that the education will be carried out in accordance with the expert assessment. The analysis shows that, for the most part, the IEP follows up the recommendations of the expert assessment with further specifics. The IEP also stipulates the scope of the special education and how it is to be organised. This mainly concurs well with the individual resolution. Overall, there is good cohesion between the expert assessment, the resolution and the IEP in this local authority.
All of the cases have a parent/guardian signature. It seems that a practice has been adopted where the parents give consent to the IEP, without this being a legal requirement. However, it is not clear whether the signature is just an approval of the plan or if it reflects cooperation in the preparation of the plan. Nevertheless, we can see from the earlier phases, particularly the expert assessment, that emphasis has been placed on the parents’ and the pupil’s information in the review.
The other local authority has a slightly different practice, and gives a more varying impression of the follow-up of the regulations. The template for the IEP is rather unclear and is not easy to follow. It refers to the IEP being based on the expert assessment, but not explicitly to the individual resolution in any of the cases.
A description is given of the pupil’s functional level both socially and academically, based on mapping carried out by the school and not on the expert assessment. The plan has a separate point on the pupil’s strengths, which mainly relates to personal qualities, interests and social functioning. Two of the cases, however, also give a brief description of the pupil’s academic strengths. Thus, the plans appear to aim to highlight the pupil’s development prospects.
A number of examples of lack of cohesion can be found here by comparing the IEP with the resolution and expert assessment for each pupil. For example, the organisation of the special education indicated in the IEP differs from the expert assessment, which is referred to in the individual resolution. It may appear that this local authority has adopted a practice of special education being carried out in small groups, despite the PPT recommending that the pupil can be part of a class. In one of the cases, the IEP is older than the individual resolution, and was therefore drawn up before the resolution was formally in existence. In this case it may be that the pupil has had extra support in the education and an IEP, without an individual resolution on special education being in place. This implies disorder in the chain of actions.
Several cases give the impression that the IEP is based more on the school’s own assessment of the pupil’s difficulties and needs than on the PPT’s expert assessment. Furthermore, the resolution is not followed up to a sufficient extent. The scope of the contact and cooperation with the parents is unclear.
143
INTERNATIONAL JOURNAL OF SPECIAL EDUCATION Vol 27, No: 2, 2012
In two of the cases, parent signatures have been obtained. The general picture that the analysis forms of this municipality is a varying, and often limited, cohesion between the links in the chain.
DiscussionThe focus of this article is on the chain of actions in special education in compulsory schooling. The research question has focussed on how local practice concur with national regulations and guidelines in different phases of the chain of actions. We have limited this study to examining four of the phases in the chain of actions. With regard to the schools’s referral to the PPT, the results show that the schools follow the regulations and guidelines reasonably well in relation to several criteria in this phase. In relation to the requirement to first test different adaptations of ordinary education before resorting to special education, the schools have only given a brief account of what such tests entail. The referrals seem to be predominantly characterised by a focus on individual characteristics of the pupils, while the guidelines also emphasise a focus on the ordinary education.
As for the expert assessments, these seem to be characterised by a rather variable local formulation. Headings and the sequence appear to deviate from legal requirements for the content of such assessments, and certain points could be merged. The assessments primarily place the emphasis on characteristics of the pupils, and less on how the ordinary education is adapted to the pupils’ abilities and aptitudes.
With regard to resolutions on special education, a delegation practice has developed whereby the head teacher of each school determines all of the resolutions. The main impression is that the resolutions are standardised and not particularly tailored to the individual pupil’s needs. Overall, the resolutions seem to reflect a practice that represents an unclear and invidious follow-up of the regulations, which can sometimes be at the expense of the pupil’s legal protection.
The results indicate major variations in the follow-up of regulations and guidelines in the schools’ formulation of IEP. The pupil cases in the two municipalities are rather different in terms of how IEP builds on the two earlier links in the chain of actions. It transpires that IEP, in a number of cases, deviates somewhat from individual resolutions and expert assessments with regard to both content and organisation.
With regard to the interrelationship between the phases in the chain of actions, it must be viewed as a positive attribute that the expert assessments build further on the school’s referral and on information from parents and the pupil. On the other hand, the interrelationship between the expert assessment and the resolution seems to be more variable. In a number of cases, the expert assessments appear to be rather diffused, and therefore difficult to build on. The resolutions also sometimes include guidelines that point in a different direction to the expert assessment, and are somewhat more standardised than the more individualised expert assessments facilitate. This is likely to create uncertainty and confusion when the schools are to consider resolutions and expert assessments in conjunction with each other. In the same way, the connection between IEP and the two preceding phases in the chain of actions also varies. IEP, resolutions and expert assessments thus become independent phases, which breaks the chain of actions instead of linking it together.
In view of this, one vital question will be whether the extensive work and the large resources that are put into the different links of the chain of actions contribute to the quality of actions being gradually improved, and thereby to adequate and adapted measures being implemented for the pupils. If not, it may be questioned whether the chain works as intended. This applies to the legal side of the case, in relation to how the chain of actions helps protect the right to special education. It also relates to the more practical educational objective, which emphasises that, via the chain, a good support system is developed for the individual pupil with special education. Thus, this seems to relate to a clear need for improving the quality in the chain of actions. When discussing the need for improvement, the focus should be on practice as well as regulations, and on the cohesion between these.
The practising of the regulations depends on what knowledge and insight the users in the school have on rights and principles that are applicable, and on the responsibilities and obligations that ensue from these, including to pupils and parents. Such knowledge is vital in order for rights to be protected. Local education authorities can play a key role in the development of an inclusive and adapted education (Ainscow et al., 2000). Although municipal guidelines on the chain of actions may help to clarify and
144
INTERNATIONAL JOURNAL OF SPECIAL EDUCATION Vol 27, No: 2, 2012
specify national regulations to the schools (Nilsen, 2011), our study indicates that the schools’ follow-up can be somewhat lacking. The municipal input should not, therefore, only be related to the local authority giving details of requirements to the schools on correct procedure. The study also underpins a need for the local authorities to be in a dialogue with the schools and guide and support them, with the aim of systematically seeking to improve the quality of the special education.
Another important element in this context applies to which resources are put at the disposal of the schools and how these are used. This relates to ensuring that the teachers have sufficient time and educational resources to carry out their work, e.g. time for discussion, including joint discussions, planning and evaluation, as well as preparing the documents to be drawn up. As regards educational resources, it may be necessary to recruit special education expertise, develop competence and utilise services such as those offered by the PPT. This should be combined with an improved and developed system for quality assessment, whereby the schools and the local authority can remain up to date with how the regulations are to be practised and ensure that the quality of the chain of actions is maintained.
Improving the chain of actions will require a whole-school approach, where all personnel are involved, and where the management takes clear responsibility for and conveys the importance of this work. It is not sufficient for the chain of actions in special education to only involve teachers within special education. The chain entails interaction between the adaptation of ordinary education and special education, and therefore also requires cooperation between general teachers and special education teachers.
Additionally, this study may give grounds to aim the spotlight at the actual regulations. The area to be regulated is extremely complex, and one of the questions is how the users perceive the relationship between the regulations and the framework condition. Facilitating clear and practical procedures – and ensuring that these are perceived as having a practical utility value for the daily work – must be assumed to be vital by many teachers. The current regulations entail a major balancing act, which on the one hand is necessary to protect the need for flexibility, but on the other are not always easy to carry out. Studies show that teachers find it difficult to balance between individual aptitudes and goals for competence in the national curriculum, and that the requirement to achieve common goals for competence is perceived as contradictory to catering for individual learning aptitudes (Buli-Holmberg and Nilsen, 2011).
It is clearly recognised that the teacher is the source of influence in the school that has the greatest impact on the pupil’s education (Report no. 11 to the Storting 2008-2009). Consequently, it is also recognised that the teacher’s competence is a vital factor. Studies show that the teachers’ competence is absolutely vital to how much the pupils benefit from the special education (Egelund and Tetler, 2009). Whilst the right to special education is important, there are no requirements for competence for the teachers who administer this right in Norwegian schools, beyond standard teaching qualifications. No special education qualifications are required to carry out special education. In addition, it emerges that a large number of assistants are used in special education, and that there are no requirements for the competence of these assistants. Assistants are only meant to assist the teaching staff in the special education. However, the use of assistants has increased gradually in recent years. They are being given more and more responsibility to execute the special education on their own, sometimes as a stand-in when the special education teacher is absent, and sometimes because the special education teacher is used as a supply teacher when other teachers are absent (Union of Education Norway, 2010). One question is what impact such conditions have on the quality of the special education. This also applies to the conditions for the schools to comply with national regulations and guidelines in the chain of actions, and for the pupils to have a reasonable benefit from the education.
Conclusion The overall impression of the study is, first of all, a rather varying concordance between regulations and practice in different phases of the chain of actions in special education. Certain parts of the regulations appear to be followed up well, while the follow-up in other areas is far more unclear and sometimes inadequate. Second, a varying cohesion between the phases in the chain of actions has been identified, both between the expert assessment and the resolution, and between the IEP and the two preceding phases. This creates the risk of fragmentary work instead of an overall chain.
ReferencesAinscow, M., Farrell, P. & Tweddle, D. (2000). Developing policies for inclusive education: a study of the role of local education authorities. International Journal of Inclusive Education, 4 (3), 211-229.
145
INTERNATIONAL JOURNAL OF SPECIAL EDUCATION Vol 27, No: 2, 2012
Buli-Holmberg, J. & Nilsen, S. (Eds.) (2010). Kvalitetsutvikling av tilpasset opplæring. [Improvement of quality in adapted education] Oslo: Universitetsforlaget.Christensen, T., Lægreid, P., Roness, P.G. & Røvik, K.A. (2007). Organization theory and the public sector: instrument, culture and myth. London: Routledge.Cooper, P. (1996). Are Individual Education Plans a waste of paper? British Journal of Special Education, 23 (3), 115-119.Egelund, N. & Tetler, S. (2009). Effekter af specialundervisningen. Pædagogiske vilkår i kompliserede læringssituationer og elevernes faglige, sociale og personlige resultater. [Effects of the special education. Educational conditions in complex learning situations and the pupils’ academic, social and personal results] Copenhagen: Denmark’s Pædagogiske Universitetsforlag.Gadamer, H.-G. (2004). Truth and method. London: Continuum.Krippendorff, K. (2004). Content Analysis. An Introduction to Its Methodology. London: Sage.Mortimore, P., Field, S. & Pont, B. (2004). Equity in Education. Thematic Review. Norway, Country Note. Paris: OECD. Nilsen, S. (2010). Moving towards an educational policy for inclusion? Main reform stages in the development of the Norwegian unitary school system. International Journal of Inclusive Education, 14 (5), 479-497. Nilsen, S. (2011). The chain of actions in special education – the relationship between national guidelines and municipal follow-up: an evaluation based on a case study from on Norwegian municipality. International Journal of Special Education, 26 (1), 33-43. Odelsting Proposition no. 46 (1997-98) Om lov om grunnskolen og den vidaregåande opplæringa (opplæringslova). [Act relating to primary and secondary education (Education Act)]Patton, M.Q. (2002). Qualitative Research & Evaluation methods. London: Sage.Storting report no. 37 (1990-1991). Om organisering og styring i den statlige Utdanningssektoren. [Organisation and administration in national education]Storting report no. 31 (2007-2008). Kvalitet i skolen. [School quality]Storting report no. 11 (2008-2009) Læreren. Rollen og utdanningen. [The teacher. The role and the education]The Ministry of Education and Research (2004). Spesialundervisning i grunnskole og videregående opplæring. Regelverk, prosedyrer og tiltak [Special education in primary and secondary education. Regulations, procedures and actions] Oslo: Læringssenteret. Norwegian Directorate for Education and Training (2010). Spesialundervisning – tallenes tale [Special education – what the figures say]. Temanotat 2/2010.Norwegian Directorate for Education and Training (2009). Spesialundervisning. Veileder til opplæringsloven om spesialpedagogisk hjelp og spesialundervisning. [Special education. Guidelines to the Education Act on special education assistance and special education] Weiler, H.N. (1990). Decentralisation in educational governance: an exercise in contradiction? In M. Granheim, M. Kogan and U. Lundgren (Eds.), Evaluation as policymaking. Introducing Evaluation into a National Decentralised Educational System (pp.42-65). London: Jessica Kingsley Publishers. Weiss, C. (1998). Evaluation. Methods for studying programs and policies. Upper Saddle River, N.J.: Prentice Hall.
146
INTERNATIONAL JOURNAL OF SPECIAL EDUCATION Vol 27, No: 2, 2012
ON THE DIRT ROAD TO INCLUSION
Jaroslaw WiazowskiVrederust Independent School
Inclusive education in the Republic of South Africa has been codified and written down in the form of White Papers. From the legislative point of view, the situation is clear. The reality however shows that the implementation of the law is still at its infancy. Students with visual impairments are practically confined to being educated in specialized schools. This article is presenting a bold attempt to establish conditions for an inclusive setting where students with visual impairments could successfully study hand in hand with non-disabled peers. A small rural school in the Limpopo Province, RSA combines the best of two worlds – an inclusive school in the residential setting. Despite basic facilities in place, the school was struggling with providing quality education for its population. A series of on-site in-services paired up with the expansion of technological facilities proved to be instrumental in forming a model for an inclusive program.
Inclusive education has been commonplace in many countries for decades. It has transformed from what used to be called integration to even further embrace students with different learning needs. Inclusion has as many proponents as opponents (Florian, 2010; Hines, 2001; Taylor, 1996). When we look however at global trends in education, special schools are being phased out and students with disabilities are being placed in mainstream educational settings.
Despite some effort, especially in private schools (Walton, Nel, Hugo & Muller, 2009) , South Africa does not seem to be up to speed when it comes to propagating inclusion in K-12 education in the same shape or form as in other countries with established inclusive education policies and practices (Muthukrishna, 2002; Sukhraj, 2006; Waghid & Engelbrecht, 2002). The government issued the so called White Papers No. 6 in 2001, further revised in 2006, in which general policies, research data, and practical information related to inclusion are described (Maguvhe, 2006). It would seem that the system supports inclusive practices in various types of educational institutions. However despite the guidelines that do not differ much from what is common in the developed countries the actual realization is still incompatible with the recommendations (Pather, 2011). Brenda van Rooyen et al., (2002) notice that this piece of legislation is full of inconsistencies and mutually exclusive statements that contradict the concept of inclusion. Indeed, universities do not appear to discriminate against any disability and students with disabilities attend the same classes hand in hand with students with no disability. There are however critical voices that refute the notion of sufficient provisions for students with disabilities in higher education (Dube, 2009; Matshedisho, 2007). Elementary and secondary education is even further from putting all students under one roof. On average public schools do not have on-site specialists who would support and co-ordinate education of special needs students. The South African Human Rights Commission (SAHRC, 2007) recommended that the Department of Education ensure the provision of infrastructure and qualified teachers, while provincial educational offices were supposed to collaborate with individual schools in their respective regions (Walton, E. et al., 2009). It happens however that
147
INTERNATIONAL JOURNAL OF SPECIAL EDUCATION Vol 27, No: 2, 2012
people assigned the role of support to inclusive environments have not been empowered with sufficient knowledge or experience. As of 2001 regular education teachers had little to no training in handling students with disabilities and they were taught to believe that learners with additional needs may not manage the rigor of regular curricula (Engelbrecht, Forlin, Eloff, & Swart, 2001). The majority of young learners in South Africa attend public schools, known here as government schools. They are controlled by provincial Departments of Education supervised by the central Ministry of Education. In addition private schools offer their programs to different segments of South African population, from affluent groups to underprivileged. However, even those institutions shy from venturing inclusion. Some schools are emerging with their first attempts to include students with various learning concerns (Muthukrishna, 2002; Ngcobo & Muthukrishna, 2011 ). In majority, those schools accommodate learners with mild learning difficulties. SAHRC reported in 2007 that it was impossible to assess the number of students with visual impairments attending mainstream schools as such statistics were not compiled at that time. At the time of writing no official statistics were available yet. SAHRC presented a rather bleak image of the implementation efforts of the inclusive education policies (SAHRC, 2007).
Among those private or independent schools there are a number of schools run by various missions. One of them is St. Bernard’s Mission in the Limpopo province where two educational entities are located. The mission of the Mission is to educate learners with visual impairments and children from surrounding villages. The Siloe School for the Blind belongs to the government and aims at providing education and accommodation for students with visual impairments. The other school, known as Vrederust Independent School, is independent and serves learners from local villages as well as high school students with visual impairments who are pioneering South African inclusion. The research conducted by Walton et al., (2009) indicates that very few independent schools embark on educating students with vision concerns. The same publication reports that none of the responding schools employed or subcontracted teachers of the visually impaired. Vrederust Independent School is an interesting proposition that weds best of the two worlds, namely inclusive academic education with a residential post-curricular training. Students with visual impairments are not segregated in their educational adventure and have an opportunity to compete with non-disabled peers, at the same time having a home-like accommodation where they can learn and practice daily living skills as well as other skills essential for independent life. Discussions about inclusion have rendered a number of forms in which inclusive services are provided. Smelter, Rasch and Yudewitz (1994) have enumerated inclusion formats ranging from part time inclusion to full inclusion for all children with no special education teacher. We can derive from this that inclusion has many faces and it is debatable which is the most effective and just.
Those who manage inclusive education know that the task is neither easy nor cheap. It certainly is not enough to house students with disabilities with non-disabled peers in one classroom to call it inclusion (Sukhraj, 2006; Dyson, 2001; Engelbrecht, 1999). It does not even suffice to have adaptive equipment to boast real inclusion. Unless there are systemic changes that support this form of education, individual attempts are short of mission impossible.
At the time of writing the author has spent a year and a half at St. Bernard’s Mission building and supporting a bold attempt to create and sustain the high school program with inclusive classes. At the time of my arrival the inclusive high school had been operating for a bit over a year. There were three grades with students with visual impairments. Grade 8 had eight of them, Grade 9 had three, while Grade 10 also had as many as eight. The numbers may not seem very impressive but if we consider that there was not a single teacher of the visually impaired on staff, we may understand the severity of the situation. Despite the immediate vicinity of neighboring school for the blind, there were no specialists trained in working with visually impaired students at hand. No member of the teaching staff at the Vrederust School knew Braille whether contracted or uncontracted. Students did not have learning material in an appropriate format. They did not have any devices either low or high tech to assist them in their learning.
Although a few teachers at Siloe School for the blind – a government institution on a private property – are familiar with contracted Braille, they do not have any other qualifications related to visual impairments. It is not the only special needs school that has limited human and financial resources. In fact it seems to be in forefront compared to many other special schools for the blind that do not even provide the most basic devices like Braillers. Despite discrete initiatives, like the donation of state-of-the-art assistive equipment to Filadelfia School for the Blind (HGR, 2010), majority of learners with
148
INTERNATIONAL JOURNAL OF SPECIAL EDUCATION Vol 27, No: 2, 2012
visual impairments cannot hope for obtaining learning material in the appropriate format. A research study (Maguvhe, 2005) reports that even schools whose primary function is to educate students with visual impairments lacked both equipment and resources required to accommodate their charge in science classes. As the report further indicates, even less could be expected of mainstream schools that have students with visual impairments in their classrooms. What the author of the study also notices is that teachers still prefer a theoretical approach to learning based on lecturing and memorization. The same tendency is however present across the board not only in the aspect of teaching sciences to students with vision concerns. Vrederust School had accumulated a variety of learning aids like posters, dictionaries, manipulatives, specialized equipment, and the like. Alas majority of support material was gathering dust stashed away in a storeroom. Students classified as blind had been trained in Braille and worked in this medium. They had been using Perkins Braillers for writing. The school had access to embossers and other devices to produce tactile learning material. The school was also happy to have a computer lab of about thirty computers. Even though it was not a complete setup for a successful inclusive program, some basics were in place. What was missing was qualified personnel that could make use of what was available. The embosser for example had not been used for four years before the author’s arrival. As a consequence blind students were learning mainly through auditory channels. Because the Department of Education provides only selected tests and assessments in appropriate format, questions had to be dictated to the students before they could begin completing the assessments. The same scenario was employed to any tests or assessments done in school. To aggravate the situation, students with visual impairments share their classrooms together with nearly 40 other students. One of the recommendations for inclusive settings is a reduced number of students per class (Hunt & Goetz, 1997; O’Shea, 1999).
Teachers did not have anywhere to turn for help and at least some of them expressed their concerns about providing quality services to the students with visual impairments. The situation required immediate actions and virtually everything needed improvement. The list of tasks included training a staff member to be in charge of creating accessible format for students with visual impairments, devising an accessible format delivery system, instructing high school teachers in contracted English and Sepedi Braille, training high school teachers in how to handle students with visual impairments, providing in class support for the teachers and their VI students, diagnosing VI students’ visual functioning and formulating recommendations, inventorying, organizing, and fixing existing assistive technology solutions, obtaining additional assistive technology for the school and dorm use, and training VI students in assistive software and hardware.
Since the above list contains essential and the most fundamental prerequisites for students with visual impairments to be successful in inclusion, it was nearly impossible to prioritize where to start. It was decided that the teachers will be in the focal point. The reason for this course of action was that students with visual impairments could not continue to be downplayed and left with improper educational means. As mentioned earlier the teachers in high school had no prior training, even the most basic one, in special education. As a matter of fact it turned out that at least half of them had received insufficient teacher training and they were not prepared to adjust their teaching to the new requirements of the Department of Education. Their teaching methods and techniques were based on outdated principles. The classes were very much teacher-centered with little or no active participation of the students. Many teachers were observed to lecture giving the students no opportunities for activities, discussions, questions, or even note taking. With under-trained staff to work with, it was particularly challenging to discuss the tenets of inclusive learning where individualized approach based on learning styles and differentiated instruction are key ingredients.
With that in mind, a series of professional development ongoing in-services needed to be designed. A comprehensive package of after-school classes was offered to bring the teaching staff up to speed in the latest methodologies and approaches to teaching and learning. Although it may appear that it does not have much to do with how to include students with visual impairments, in fact it was geared towards making the teachers aware of differences in individual students and how those differences affect their learning. The teaching methods training was to result in a more versatile approach to covering the learning material so that more students could benefit from their presence in school. As a matter of fact, good teaching involves a variety of hands-on, multi-sensory activities that include all the learners, regardless of their abilities or disabilities. Besides, Soto and Goetz (1998) report that building efficacy in teaching helps teachers build more self-confidence and accept that their teaching skills may not be up-to-date. Throughout this particular training, the teachers were reminded that educators are life-long learners
149
INTERNATIONAL JOURNAL OF SPECIAL EDUCATION Vol 27, No: 2, 2012
and as such they can never assume they know everything. With the evolution of education come new principles and methodologies that correspond with the changes. No one therefore should consider additional training as an implication of someone’s incompetence but rather as a sign of never-ending progress. In order to catch up with the development of new and improved teaching techniques and strategies, teachers need to be offered opportunities. This is the reason those opportunities were created.
Concurrently, a group of teachers began a training session in contracted Braille. They had been teaching a number of students whose primary learning medium was Braille for over a year without knowing this literary system. It was deemed necessary for the teachers to know Braille so that they could read and mark their students’ work. Until then students after writing their assignments in Braille had to read them back to their teachers to be graded. The students even had to read their own tests back to the teachers. As turned out later, at least some of the Braille students had taken advantage of the fact that their teachers could not read Braille and misled their teachers to believe that they had done their homework. Moreover, the teachers were never able to correct their spelling, punctuation or syntax. Students knowing that no one could read their assignments had no extrinsic motivation for following all the grammatical rules. Capitalizing the first person singular pronoun I deemed unnecessary for some of the learners. They admitted that they saw no point in putting the dot six in front of an i as they were the only ones who actually read their assignments. The absence of a Braille reading teacher resulted also in a creative spelling devised by the learners. A combination of a shortage of reading material in Braille and a lack of personnel that would verify the use of contracted Braille made students conjure up their own orthography. Even though they had no difficulty with the most common words, students would come up with a unique spelling of new terms and vocabulary. Having limited access to text in Braille and no one to correct their writing, the learners were left in the dark with no references guiding their spelling.
In the USA for example, it is TVIs or teachers of the visually impaired who take a responsibility for transcribing assignments of students who work in Braille. Classroom teachers do not need to be concerned about how to read Braille. In this case such a solution would not be viable for two main reasons. First of all as of 2011, universities in South Africa did not offer programs in Visual Impairments, which results in lack of trained support staff. Having researched programs available at several major universities, I could not find a single course that would deal with students with visual impairments. One might wonder why universities steer clear from such programs, at the same time offering training for orientation and mobility instructors. It appears that complete and full-fledged support for K-12 students with visual impairments is nearly utterly neglected by major South African universities. Secondly, because of growing numbers of students who read and write in Braille, the school would have to eventually employ a minimum of two full time TVIs. The problem is – there are no TVIs in the country. Learning Braille and applying it can potentially be an additional burden on the teachers whose caseload is already overwhelming. It should be remembered that many of the classes they teach are composed of more than 45 students. Nonetheless, teachers who completed the Braille class were confident enough to check their students’ work in Braille and claimed that the more they read, the faster and easier reading Braille was becoming. Since all the teaching staff was attending the teaching methods class, training in how to accommodate students with visual impairments took a form of on the spot instructions during respective lessons. Teachers were asked to come with any questions and concerns to be helped with adapting the material and learning aids. Some visuals that would be difficult to convert into a tactile format needed to be replaced by models. Certain notions, like colors, had to be presented in an alternative form. The teachers were also learning how to structure the lesson to give all students time for note taking. Prior to the author’s arrival VI students were denied the right to take notes during the class because their Braillers were making too much noise. The fact is that the Braille machines are noisy but it does not mean that VI students, called here Braille learners should not to be allowed to use them in class. It was suggested that teachers plan their classes to give VI students time and opportunities to note relevant information. Teachers were given two basic options: make note taking intermittent with other classroom activities or allot sufficient amount of time towards the end of the class for note-taking.Although the solutions appear rather simple to implement, some teachers struggled with planning their lessons to incorporate note taking time. The author visited several classes during which the time for notes was to be given at the end of the lesson, however due to deficient teaching skills the teachers would not stick to what had been scheduled.
Another aspect of accommodating specific needs of VI students was the presentation of learning material. Per recommendations based on the functional vision assessment, the teachers were directed
150
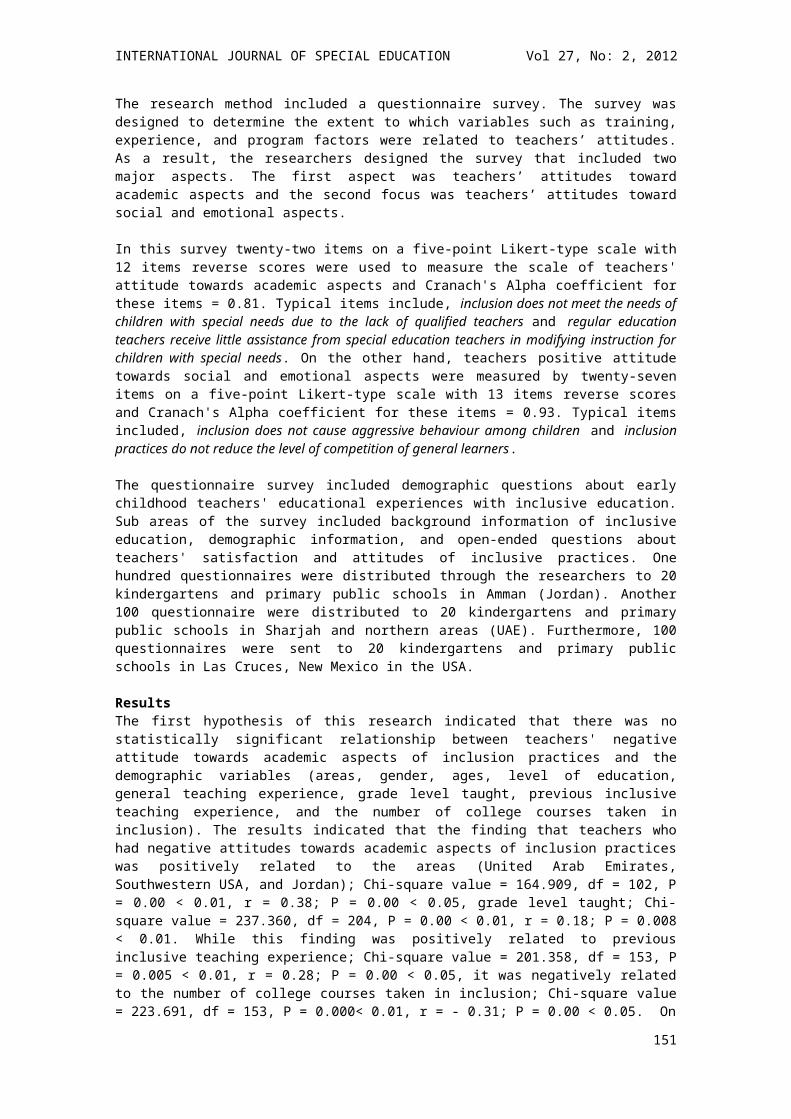
INTERNATIONAL JOURNAL OF SPECIAL EDUCATION Vol 27, No: 2, 2012
how to approach individual learners when presenting and modeling learning aids. The teachers were made aware of various vision conditions and the best ways of helping the students use their residual vision. Educators were informed about how particular students access textual information, whether or not images are accessible to the students, how much additional time they may need to complete homework assignments and assessments, and what type of assistive technology would be helpful.
Additionally students were receiving direct, though due to time restraints limited, classroom support from the author. That support was also to demonstrate to the teachers how to assist VI learners by dictating what is written on the chalkboard, by explaining tactile images and graphs, by organizing material on the table. One of the major difficulties in facilitating VI students is the general number of learners in the class. Teachers are not used to considering their classes as a group of individual learners but rather as a mass. Such an approach is inadequate for students with special needs where each learner may require different forms of accommodations or modifications.
Several months of training and classroom support caused some teachers to improve their teaching skills and understand the basic principles of instructing and accommodating students with visual impairments. Despite overcrowded classes they attempted to work with those students on a more individual basis. They increased their awareness of how non-visual explanations facilitate better conceptualization and how access to information can improve their students’ performance.
Yet another pressing issue was insufficient amount and inappropriate format of the learning material. Many of the VI students who had been selected to adopt Braille as their primary learning medium were not receiving text in this format on a regular basis. Some of the students with sufficient functional vision were forced to use regular textbooks with no magnification. Blind students had to rely on their classmates who read information, exercises and questions for them. Similarly all the tests and assessments had to be dictated to the students with visual impairments because they were not able to read them from the chalkboard.
The situation with the learning material needed to be changed immediately to reverse the deepening gap between the resources available for sighted students and to those with visual impairments. The school was not planning to purchase textbooks in Braille. Besides, very few titles were available in tactile format and the time needed to have a required book converted into Braille was prohibitive. The school had obtained a series of textbooks that came with the electronic version on CDs. The reason for this decision, rightfully so, was to use the embossers to produce Braille versions of those texts. In reality however some of the plans were not realized until nearly a year later. Because the school was in a possession of good quality printing equipment, it was determined that a person be trained to utilize the available resources. The training was two-fold. Firstly, a staff member was to be familiarized with software and hardware. Secondly, and more importantly, he was to receive some fundamental knowledge about the nature of tactile system, how it can and should be formatted so that the readers receive functional text. The embosser operator was simultaneously attending the Braille class.
The software and hardware training covered all the functionalities of the embosser and the main features of the conversion software. Because the facility houses two different embossers powered by different software, separate sessions were organized to cover all the essential details. Both of the systems have their advantages and disadvantages related to their functionalities. One of the embossers is Tiger Pro by ViewPlus whereas the other one is an aging ET by Enabling Technologies. The new staff was not initially familiar with Braille, which required additional supervision during the conversion process. He however was a savvy computer user and the technicalities related to digitizing and converting data did not pose any major problems. As he was learning Braille it was easier for him to understand the uniqueness of the system and he began to understand why print layout needs to be reformatted to be legible for blind readers. The system used in the printing center called CAMP for Center for Accessible Material Production allows embossing not only linear text but also text in charts, graphs, and tables. Although it is a very useful feature, the new staff had to be trained in how to reformat or redo the non-linear information to meet the needs of Braille readers. He soon showed a lot of thoughtfulness in adapting such data and devised his own ways of labeling pictorial representations.
With the changes in the classroom instruction and teachers’ expectations, it was necessary to equip students with visual impairments with assistive devices. A functional vision diagnosis paired up with a learning media assessment provided data indispensable to determine the most effective literacy and learning modulation. Such evaluations aim at determining if and how effectively students can attend to
151
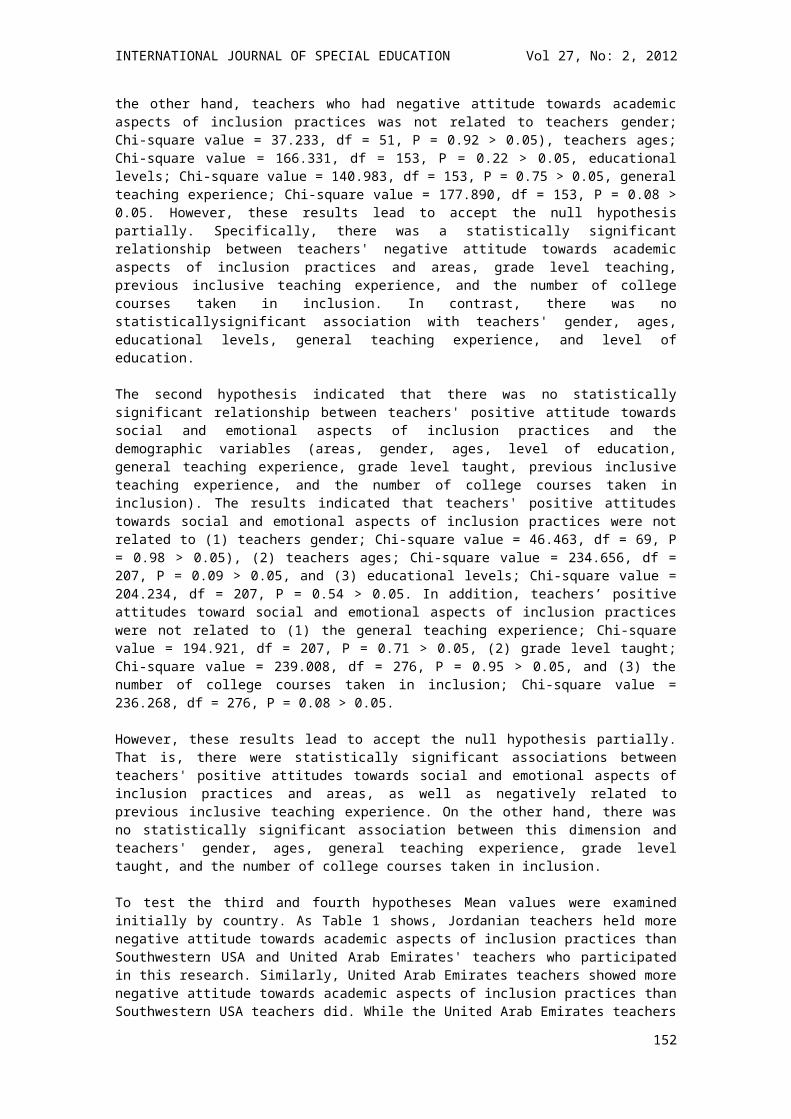
INTERNATIONAL JOURNAL OF SPECIAL EDUCATION Vol 27, No: 2, 2012
different tasks visually, whether they can improve their performance through intervention, and eventually, what compensatory strategies would be the most pertinent (Lueck, 2004). The author chose to adapt the assessment included in Low Vision: A Resource Guide with Adaptations for Students with Visual Impairments by Nancy Levack (2001). The assessment was focused on students’ ability to access school information. Students were to spot and identify objects from various distances, find and count simple shapes in high and low contrast images, pick up and describe verbally different items, and eventually read in Braille and/or print. That last task was to determine the most efficient reading medium.
Historically Braille was prescribed as a mandatory literacy medium without any attempt of learning media assessment or other forms of diagnosis. In some cases, the staff did not even have access to reliable medical report that would confirm students’ eye conditions. In one extreme case, a student who eventually was diagnosed with hyperopia had been forced to read and write in Braille for 8 years. The only alternative to Braille was regular print not entirely accessible for many learners. It might appear that instruction in Braille should be commendable but as later observations and assessment proved, a number of Braille users had significant difficulty in reading this medium with their fingers. Instead they would read tactile writing just like print, with their eyes. Students with low vision were deprived of appropriate visual formats of learning material at the same time struggling immensely with limited offerings in Braille.
Having diagnosed the students’ functional vision, the author advocated for replacing inefficient Braille with more appropriate large print format. Several students were resistant to the change fearing they would not be able to write at the same speed as on the Brailler. The fears turned out to be unsubstantiated and all those that switched to print and handwriting are coping with their school assignments with no major difficulties. As a matter of fact, students were apprehensive because they knew that teachers could read print and their poor spelling would be exposed. No formal test was administered but knowing that students had had scarce access to reading material they lacked exposure to correct written language in contracted Braille. The substandard spelling can result from various factors but researchers are in accord that there is a clear relationship between reading and writing, including spelling (Keegan, 1971; Moats, 2009; Deacon et al., 2012). Deacon et al. (2012) report that young readers’ spelling abilities are acquired through their exposure to reading. Stephen Krashen (2002) opines that reading is crucial in the acquisition and mastery of spelling. It could be concluded then that the more school children read the better opportunities they have to master orthographic skills.Additionally, several students who during the FVA were found to be inefficient Braille readers but whose eye condition prognosis was unstable were recommended to use large print as a means of intervention but practice Braille as a possible primary literary medium in the future. It was necessary to find a compromise that would let these students use efficient medium, simultaneously creating a systematic course of actions leading to the mastery of Braille.
In spite of efforts to provide learning material in the appropriate format, students sometimes needed to resort to using regular print books. Because of this and other reasons it was necessary to furnish their dormitories with magnifying tools in the form of optical magnifiers and CCTV systems. Blind students were also in need of modern assistive devices to be successful in their educational endeavors. In the ideal world, each of the students should be assessed and prescribed adaptive devices that match best their educational needs (Holton Todd, 1986; Presley & D'Andrea, 2009; Wiazowski, 2009). Special education in South Africa at K-12 levels has to however be realistic in its capacity and make do with what can be purchased rather than what every learner might require. Therefore the most flexible options and solutions had to be considered to make them shareable and useful for various groups of students.
Bearing those limitations in mind it was determined to initiate some steps in funding and purchasing equipment that would be functional and useful for different students. The school began with outfitting dormitories where students do their homework. It needs to be mentioned here that learners in both dorms, the girls’ house and the boys’ house, had a computer at their disposal. One of the machines was accessorized with magnifying/reading software called Dolphin Pen. It meant that one group at a minimum could read digitized information. Hard copies still had to be read with unequipped eyes. It turned out however that the school authorities hived away several Mouse Cameras that had never been installed. The kits consisted of a mouse camera, an adapter, a connector, power charger, RCA cable, software and a special graphics card. Although it appears rather complex, the actual setup does not require an engineering degree. Nonetheless, none of the mouse cameras were in use. Sadly enough, the boxes had been opened and several power charges were missing in action. One set was delegated to beef
152
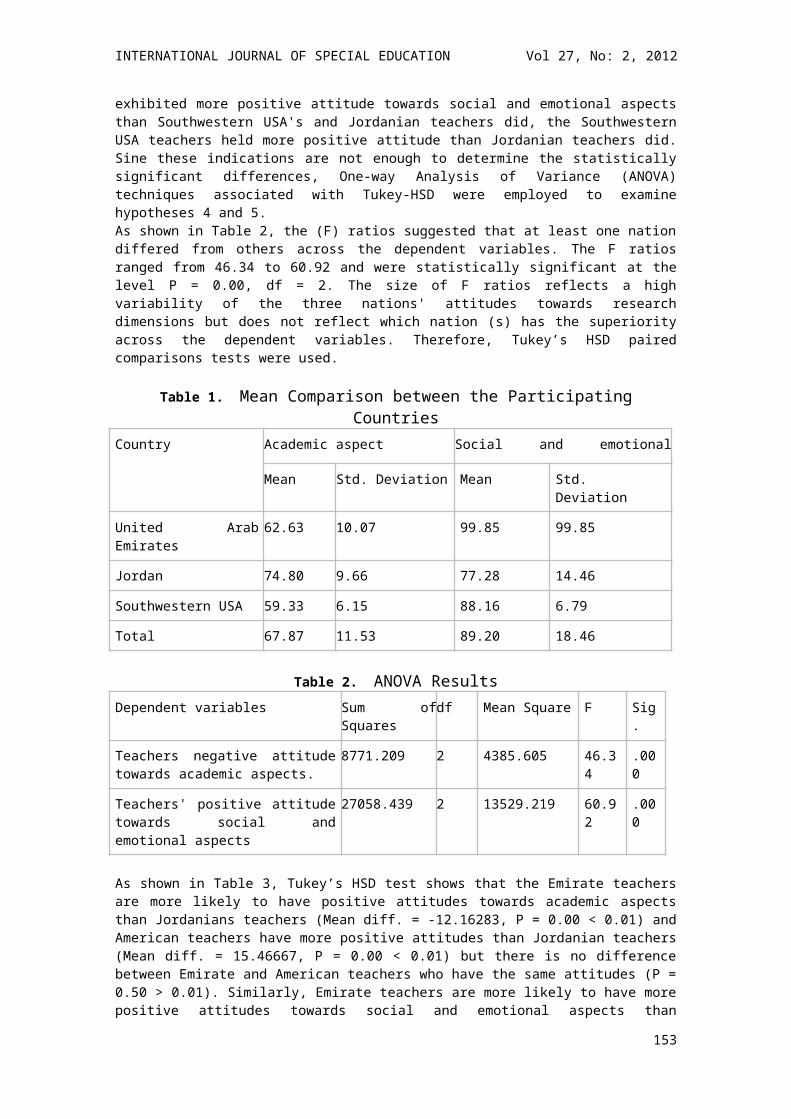
INTERNATIONAL JOURNAL OF SPECIAL EDUCATION Vol 27, No: 2, 2012
up a computer in one of the dorms to help students with low vision read minute print in their textbooks. Two other functioning sets found their home in the library where students would go for an hour a week to read. This camera does not have all the bells and whistles available in the latest magnifying systems but at least it makes the print letters big enough to be readable.
The faces of the students in the other dorm brightened up when the school procured a new CCTV with a few more features than the mouse cameras. Apart from it, a portable electronic magnifier, and two digital text reading devices were added to the shopping list. The last items mentioned above were to assist blind students with note-taking. Students immediately found the tools expedient and valuable. They were anxious to interact with them not only for school purposes but also for entertainment.
The first milestones were set on the way to successful and workable learning environment for the students with visual impairments. Those with residual vision alas continued to struggle with accessing distance tasks in the classroom, especially with copying from the chalkboard. When the school was informed that one of the charity organizations, the Rotary Club was planning to donate a substantial amount of money for assistive technology, it was clear that a device with a flexible camera for both near and distance tasks should be obtained. The amount allowed for two Onyx CCTVs and one FarView Plus, a portable electronic magnifier with an option of taking snapshots that can subsequently be downloaded onto a computer for further use. The reaction to the Onyxes surpassed the author’s wildest expectations. The students who were selected instantly learned the value of the CCTV system and benefits it brought to them. They stated that seeing what is written on the chalkboard made understanding the learning content easier. They also improved the quality of their school notes. Before they could only write down what was dictated or what they remembered when teachers were lecturing and writing on the chalkboard.
ConclusionA 12 month training package resulted in several significant changes in the functioning of the school services and support system for students with visual impairments. New approach to teaching and classroom work were implemented, specialized equipment for students with visual impairments was installed in classrooms, accessible material was being provided on a regular basis. 90% of the teaching staff completed a contracted Braille course and are now able to mark their students’ work. Students with visual impairments are receiving learning material in an appropriate format and understand their vision condition much better.
Although the foundation phase has brought a number of tangible improvements, the teachers, other staff, and their students will need to continue their efforts to make the changes sustainable. The ultimate concern is the lack of trained and qualified special education personnel that would serve as support for both students and staff. Since there are regulations that would enforce districts and schools to employ well qualified teachers who specialize in specific disabilities, the provision of such personnel seems at the discretion of individual entities. But even if a school wished to provide specialized services to their students with visual impairments they need to seek assistance overseas. A need for well-trained specialist can also be illustrated by the following example. A mother of an 8-year-old daughter contacted the Siloe School for the Blind for assistance. Her daughter is a girl with visual impairment diagnosed with macular scars and nystagmus. The girl attended a mainstream private school in the nearby town. Because she was entitled for special education services she spent a portion of her school day with a special education teacher. The teacher claimed that the girl was not able to read or write due to her visual impairment and therefore she was not included in tasks related to literacy. The mother and the daughter were referred to the author who conducted a functional vision assessment and provided the parents and the school with recommendations. Several months later the author received the following personal communication from the mother: Thank you so much for all your effort & help so far I appreciate it very much! [My daughter] has made a lot of progress thanks to the assessment & report you wrote, she is writing her letters & numbers that she never could have done & she is doing very good I can see that there is much better progress than in the past (personal communication, October 2011).
It can be assumed that the teacher lacked sufficient preparation to diagnose and understand educational needs of this particular child. It appears though the teacher took the FVA’s recommendations seriously, found a methodology to implement them into her curriculum, and subsequently was successful in her teaching. The specifics of what techniques and what particular strategies the teacher used are unknown to the author. Presumably the teacher had had relevant material but felt uncomfortable to use it with a
153
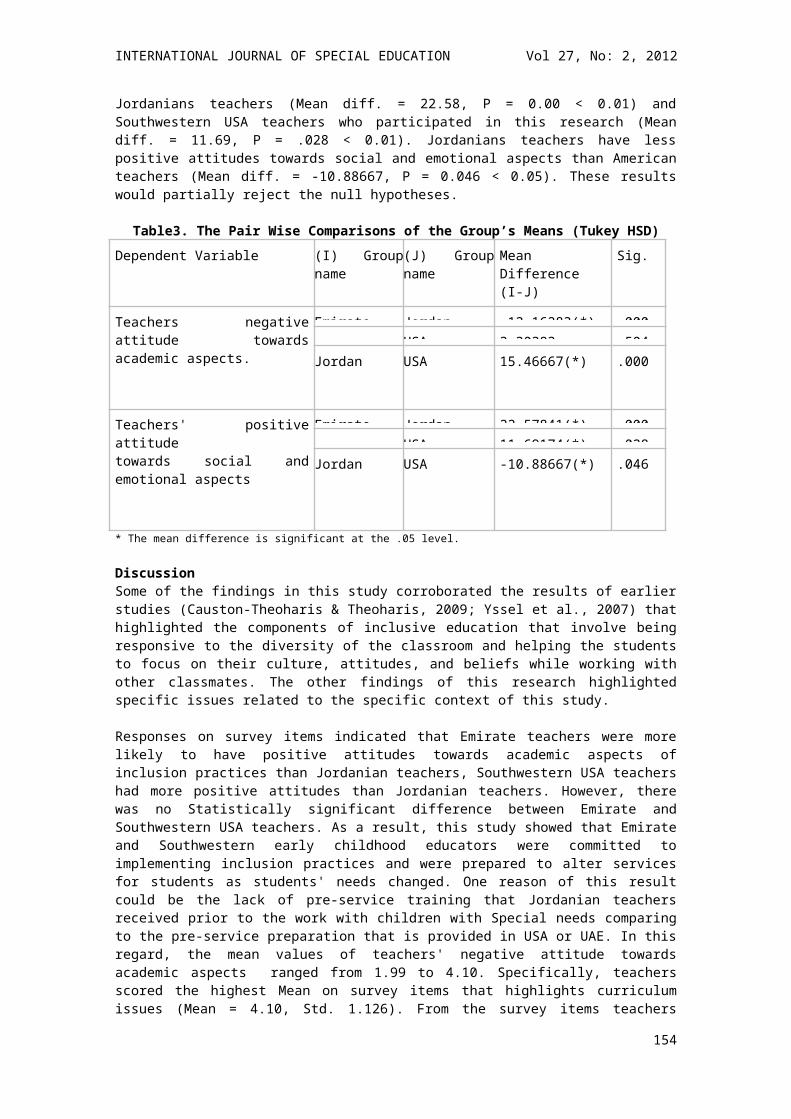
INTERNATIONAL JOURNAL OF SPECIAL EDUCATION Vol 27, No: 2, 2012
visually impaired learner. The suggestions she received must have helped her in selecting, preparing, and incorporating accommodations that facilitated the girl’s achievements.
Such on-site training, however successful, is only a patch that will provide a temporary relief to the ailing special education system. International observers remark that despite correct regulations that follow world-wide standards and quality, the implementation is virtually nonexistent due to lack of resources and resistance from teachers, community and parents, together with the inertia of the existing system (Rieser, 2008, p.31). Engelbrecht et al (2001) also noticed non-existence of specialized training required for effective inclusion of learners with disabilities. To reverse this disadvantageous situation an array of obstacles needs to be overcome. The problems to tackle are lack of trained professionals, insufficient medical documentation, the misunderstanding of what inclusive education is among school administration and other staff, and insufficient support from local and provincial educational authorities Dube, 2009).
This article indicates two important points. First of all it shows how much can be done single-handedly to improve the learning environment for students with visual impairments. Yet, more importantly, it emphasizes the need for well-qualified and professionally prepared teachers of the visually impaired. It is clear that mere regulations do not cause any implementation of necessary reforms. Actions that follow effective and feasible legislature are required. The longer the bodies that govern education in South Africa keep the status quo, the more generations of youngsters with visual impairments are going to graduate with insufficient academic and functional skills.
References:Deacon, S., Benere, J., & Castles, A. (2012). Chicken or egg? Untangling the relationship between orthographic processing skill and reading accuracy. Cognition, 122(1), 110-117.Dube, C. (2009). Illiteracy is Insecurity: Education, Technology and Disability in South Africa. Review Of Disability Studies: An International Journal, 5(3), 64-73.Dyson, A. (2001). Varieties of Inclusion. Paper presented at the conference, VI Jornadas Cientificas de Investigacion sobre Personas con Discapacidad, Salamanca, Spain, 17-19 March 2001.Engelbrecht, P. (1999). A theoretical framework for inclusion. In P. Engelbrecht, L. Green, S. Naicker, &L. Engelbrecht. (Eds.), Inclusive Education in South Africa (3-11). Pretoria: J.L. Van Schaik Publishers.Engelbrecht, P., Forlin, C., Eloff, I., and Swart, E. (2001). Developing a Support Programme for Teachers Involved with Inclusion in South Africa. International Journal of Special Education, 16:1.Florian, L. (2010). Special education in an era of inclusion: The end of special education or a new beginning?. The Psychology of Education Review, 34(2),22-27.Hines, R. A., & ERIC Clearinghouse on Elementary and Early Childhood Education, C. L. (2001). Inclusion in Middle Schools. ERIC Digest.Holton Todd, J. (1986). Resources, Media, and Technology. In G. T. Scholl (Eds.), Foundations of Education for Blind and Visually Handicapped Children and Youth (pp 285-296). New York, USA: American Foundation for the Blind.Home Goods Retailer. (2010). DionWired facilitates learning for blind and partially sighted learners. Retrieved from http://www.hgr.co.za/index.php?option=com_content&view=article&id=47:dionwired-facilitates-learning-for-blind-and-partially-sighted-learners&catid=8.Hunt, P. & Goetz, L. (1997). Research on inclusive educational programs, practices, and outcomes for students with severe disabilities. The Journal of Special Education, 31:3-29.Keegan, J. (2000). The Relationship between Reading, Writing, and Spelling. Retrieved from http://www.eric.ed.gov/PDFS/ED449504.pdf.Krashen, S. (2002). The futility of the spelling grind. Retrieved from http://www.carawayschool.ca/pages/Pedagogy/SpellingGrind.htm.Levack, N. (1991). Low Vision: A resource guide with adaptations for students with visual impairments . Austin, Texas: Texas School for the Blind and Visually Impaired.Lueck, A. (2004). Relating functional vision assessment, intervention, and outcomes for students with low vision. Visual Impairment Research, 6(1), 45-52. doi:10.1080/13882350390486992.Maguvhe, M.O. (2005). A study of inclusive education and its effects on the teaching of biology to visually impaired learners. Unpublished doctorate dissertation. University of Pretoria. Maguvhe, M.O. (2006). Curriculum adaptations: a means to accommodate all learners in an inclusive education system.Matshedisho, K. R. (2007). Access to higher education for disabled students in South Africa: A contradictory conjuncture of benevolence, rights and the social model of disability. Disability & Society, 22(7), 685-699.
154
INTERNATIONAL JOURNAL OF SPECIAL EDUCATION Vol 27, No: 2, 2012
Moats, L. (2009). Knowledge foundations for teaching reading and spelling. Reading and Writing. 22(4), 379-399.Muthukrishna, N. (2002). Inclusive Education In A Rural Context In South Africa: Emerging Policy And Practices. International Journal of Special Education. 17(1), 1-10.Ngcobo, J., & Muthukrishna, N. (2011). The geographies of inclusion of students with disabilities in an ordinary school. South African Journal Of Education, 31(3), 357-368.O’Shea, D. (1999). Making uninvited inclusion work. Preventing School Failure. 43:179-180.
Pather, S. (2011). Evidence on inclusion and support for learners with disabilities in mainstream schools in South Africa: off the policy radar. International Journal Of Inclusive Education, 15(10), 1103-1117. doi:10.1080/13603116.2011.555075Presley, I., & D'Andrea, F. M. (2009). Assistive Technology for Students Who Are Blind or Visually Impaired: A Guide to Assessment. New York, USA: American Foundation for the Blind.Rieser, R. (2008). A Commonwealth Guide to Implementing Article 24 of the UN Convention on the Rights of People with Disabilities. Retrieved from www.worldofinclusion.com/res/internat/Commonwealth_Guide.doc.Smelter, R. W., B. W. Rasch, and G. J. Yudewitz. 1994. Thinking of inclusion for all special needs students? Better think again. Phi Delta Kappan 76(1), 35-38.South African Human Rights Commission. (2007). Right To Basic Education; Inclusive Education (Mainstreaming): Report On Hearings By South African Human Rights Commission. Retrieved from http://www.pmg.org.za/minutes/20070301-right-basic-education-inclusive-education-mainstreaming-report-hearings-sa-human-rights. Soto, G.; Goetz, L. 1998. Self-efficacy beliefs and the education of students with severe disabilities. JASH, 23(2), 134-143.Sukhraj, P. 2006. The Implementation and Challenges to Inclusive Education Policy and Practice in South Africa. Paper Delivered at a Conference of The International Council on Education of Visually Impaired Persons. Kuala Lampur, Malaysia.Taylor, R. E. (1996). Full inclusion of students with mild disabilities: A question of external validity. Clearing House, 70(2), 108.Van Rooyen, B., Lesley Le Grange, L., and Newmark, R. (2002). (De)Constructions of Functionalist Discourses in South Africa’s Education White Paper 6: Specials Needs Education. International Journal of Special Education. 17(2), 1-13.Waghid,Y. & Engelbrecht, P. (2002). Inclusive education, policy and hope: mapping democratic policy changes on inclusion in South Africa. International Journal of Special Education. 17(1), 21-26.Walton, E., Nel, N., Hugo, A. and Muller, H. (2009). The extent and practice of inclusion in independent schools in South Africa. South African Journal of Education, 29:105-126.Wiazowski, J. (2009). Continuum of Assistive Technology for the Blind and Visually Impaired. In J. Gierarch (Ed.), Assessing Students’ Needs for Assistive Technology (ASNAT) Manual 5th Edition. www.WATI.org/Resources.White Papers 6 Special Needs Education. Building an Inclusive Education and Training System (2001). Government Printer. Pretoria, RSA.
155
INTERNATIONAL JOURNAL OF SPECIAL EDUCATION Vol 27, No: 2, 2012
SOCIAL INCLUSION: TEACHERS AS FACILITATORS IN PEER ACCEPTANCE OF STUDENTS WITH DISABILITIES IN REGULAR CLASSROOMS IN TAMIL NADU, INDIA
Ruffina DavidThe University of Melbourne
Ahmed Bawa KuyiniUniversity of New England
This study examined the impact of classroom teachers’ attitudes towards inclusive education, teachers’ self-efficacy and classroom practices on the social status of students with disabilities in inclusive classrooms in Tamil Nadu, India. Questionnaires, interviews and classroom observations were employed to gather data. The data analysis included descriptive statistics and regression analysis. Findings showed that in the context of the Inter-group Contact Theory, teachers’ classroom practices influenced the social status of students with disabilities in regular classrooms. The study’s findings also showed that the social status of students with disabilities was similar to that of their peers without disabilities. The implication of these findings are that teachers can make a difference in the social inclusion experiences of students and that such inclusion may also allow for better school outcomes that are associated with increased peer interaction amongst students with and without disabilities.
The concept of inclusive education gained significant international acclaim when The United Nations promoted the idea of ‘Education for All’ at a conference in Thailand in 1990. A policy statement on inclusive education stemming from the 1994 Salamanca conference challenged all nations, schools and educators to provide access to education for all students, including students with special needs.
In some parts of India, the cultural perception to sometimes view disability as a ‘curse’ or a result of past deeds makes the individual responsible and therefore viewed as a misfortune that cannot be changed (Alur, 2002). However, an attempt to shift these notions was made in line with the demands of the Salamanca statement. A major emphasis of The Indian Equal Opportunities and Rights of Persons with Disabilities ACT 1995, rule 26, was the education of children with disabilities in regular schools. The legislation supported the inclusion of children with disabilities up to the age of 18 years in general classrooms. This marked a new era in the education of such students in India.
One of the main philosophies underpinning the inclusive education agenda is human rights and this implies that peer acceptance ought to be one of the primary outcomes of schooling in order to foster dignity and better quality of life for students with disabilities. In the U.S. and other OECD countries, inclusion has been strongly advocated not only because of academic benefits but also for the presumed social benefits to students with disabilities (Fisher, Roach, & Frey, 2002). Thomas, Walker, and Webb
156
INTERNATIONAL JOURNAL OF SPECIAL EDUCATION Vol 27, No: 2, 2012
(1998) noted that mere geographical inclusion by itself does not foster these benefits and schools have to do more to support the process. The capacity of inclusive classrooms to promote and succeed with generating the social benefits of inclusion depends on the enhanced opportunities that lie in the educational setting to develop a sense of classroom community and friendships within a heterogeneous group of peers (Favvaza & Odom, 1997; Nakken & Pijl, 2002; Parvi & Monda-Amaya, 2001). Thus, classroom teachers play a vital role in facilitating positive interactions between students with and without disabilities (Brown, Odom, & Conroy, 2001; Harrower, 1999; Klingner & Vaughn, 1999; Salend, 2001). However, in order for teachers to effectively facilitate such positive interactions, they need to have a positive disposition or attitudes towards students with disabilities and strong sense of self-efficacy. These variables have been found to be linked to good classroom practices, in terms of facilitating interactions (Cook, 2001) and using adaptive instruction (Kuyini & Desai, 2007). Further, teacher self-efficacy (conceptualised as self-perception of competence rather than actual level of competence) has been reported to be a strong predictor of classroom practices (Henson, Kogan & Vacha-Haase, 2001; Tschannen-Moran & Hoy, 2001). Finally, there is a link between teacher practices and social status of students with disabilities in general education classrooms (Fuchs, Fuchs, Mathes, & Martinez, 2002; Utley, Reddy, Dequadri, Mortweet, & Bowman, 2001).
These factors are bound to have profound effects on how peers accept and interact in the classroom and on the creation of classroom accommodative practices that shape the social status (acceptance or rejection) of students with disabilities among their peers without disabilities in the regular classroom (Briggs, Johnson, Shepherd, & Sedbrook, 2002; Downing, Eichinger & Williams, 1997; Harrower, 1999; Lumpe, Czerniak, & Haney, 1998).
In India, the existence of general negative attitudes towards disabilities among sections of the population (Alur, 2002) and less positive attitudes among teachers in inclusive schools (Sharma, 2001), are more likely to affect the attitudes of students without disabilities towards their peers with disabilities, as well as those of teachers towards such students. And these collectively could influence interactional patterns in inclusive classrooms and thereby generate more or less social accepting classroom conditions. Therefore, these elements (teachers’ attitudes, self-efficacy and classroom practices for social inclusion) have the potential to impact significantly on the interactional patterns as well as the accommodative practices of teachers in inclusive classrooms in India.
Aims of study The aims of this study were to explore whether the classroom practices of the teachers influenced positive peer interaction between students with and without disabilities. Additionally, the study sought to determine whether the variables of teachers’ attitudes towards students with disabilities and teachers’ self-efficacy were significantly related to classroom practices to foster social inclusion.
The theoretical framework that guided this studyThis study was framed upon Allport’s (1954) Theory of Intergroup Contact. The theory predicts that social acceptance or rejection of (in this case) students with disabilities by peers without disabilities in the regular classrooms depends upon the classroom practices.
There is a common belief that merely assembling diverse groups of people together facilitates acceptance of each other. However, Allport (1954) concluded that it is not so simple and that there is a formula for successful acceptance under specified conditions of contact. Allport (1954) held that positive effects of intergroup contact occur only in situations marked by four optimal conditions addressed below:
Equal Status: Allport stressed equal status within the situation where heterogeneous groups are in physical proximity to each other. It is important that both groups – minority and majority groups, expect and perceive equal status coming into the situation (Allport, 1954; Bizman & Amir, 1984; Pettigrew, 1998).
Common Goals: Along with contact or physical proximity, an active, goal-oriented effort should be present for prejudice reduction. In striving to win (athletic teams, for example), interracial teams need each other to achieve their goal (Pettigrew, 1998). Goal accomplishments together further the process towards acceptance of the minority members in the group (Allport, 1954; Bizman & Amir, 1984; Pettigrew, 1998). Intergroup Cooperation: attainment of common goals must be an interdependent effort without intergroup competition (Allport, 1954; Bizman & Amir, 1984; Pettigrew, 1998). Support of Authorities, Law or Customs: Finally, explicit social sanctions foster acceptance within the intergroup
157
INTERNATIONAL JOURNAL OF SPECIAL EDUCATION Vol 27, No: 2, 2012
contact more readily and have more positive effects (Allport, 1954; Bizman & Amir, 1984; Pettigrew, 1998). Authority support establishes norms of acceptance (Pettigrew, 1998).
Allport’s formula continues to receive support across a variety of situations, groups and society (Favvaza & Odom, 1997; Kennedy, 2001; McClenahan, Cairns, et al., 1996; Pettigrew, 1998; Schwartz & Simmons, 2001). The theory has been used by researchers in the field of inclusive education and has been concluded that the type of regular social interaction is an essential determinant in successful inclusion of these students rather than their mere physical presence (Nakken & Pijl, 2002). Allport’s (1954) factor of Support of Authorities is evidenced by the endorsement of laws and legislations on the move towards inclusive education, and teachers as the direct authority figures within the classrooms have more power to facilitate positive social interaction between students with and without disabilities in these classrooms (Hamre-Nietupski, et al., 1994; Korinek, et al., 1999; Pavri, 2004). The other three conditions (Allport, 1954) - equal status, common goals and intergroup cooperation - can be fulfilled by providing interdependent tasks to students in the inclusive classroom. Thus, according to the Theory of Intergroup Contact (Allport, 1954) classroom practices provide the nature and quality of interactions that affect the acceptance or rejection of students with disabilities by their non-disabled peers.
The classroom practices range from traditional teaching practice, where the teacher leaves the students to accommodate themselves socially and there is emphasis on mastery learning (Clarke, 2006; Dyer, 2000; Goodlad, 1984; Grover & Singh, 2002) to non-traditional teaching practice, where peer tutoring, cooperative learning, awareness creating among students without disabilities about their disabled peers and deliberate facilitation of interaction between the two groups by the teacher are seen (Delano, 2000; Hamre-Nietupski et al., 1994; Korinek, et al.,1999; Pavri & Monda-Amaya, 2001; Sapon-Shevin & Schniedewind, 1989; Stainback & Stainback, 1990).
The above findings point to the role of the teachers’ own acceptance of students with disabilities and ability to establish an understanding of equal status among students with and without disabilities (Colley, 2000; Favazza & Odom, 1997; Korinek et al., 1999; Nougaret, Scruggs & Mastropieri, 2005; Salend, 2001; York et al., 1992). Therefore, one can conclude – in line with Allport’s (1954) theory of intergroup contact – that classroom practices, which facilitate contact between the two groups of students given the equal status condition in an interdependent manner (satisfying Allport’s common goals and intergroup cooperation conditions) are most conducive for social inclusion and depend on the teacher as a facilitator and authority figure. As such, teacher factors such as the teachers’ own attitude and self-efficacy become pertinent.
Research from developing and developed countries suggests that a relationship exists between teachers’ attitudes towards inclusive education and classroom practices (Cook, 2001; Cook, Tankersley, Cook & Laundrrum, 2000; Elliot, 2008; Kuyini & Desai, 2007; Van Reusen, Shoho, & Baker, 2001). Likewise, previous research (Carlson, Lee, & Schroll, 2004; Briggs, et al., 2002; Henson, et al., 2001; Muijs & Reynolds, 2002; Soodak, Podell & Lehman, 1998; Stanovich & Jordon, 2002; Subban & Sharma, 2006) links teacher attitudes and classroom behaviours or practices to teachers’ perception of their own teaching efficacy. These elements of self-efficacy, teachers’ attitudes towards inclusive education and their classroom practices have been taken into account in this investigation while considering the success of the inclusive classroom as measured by the social status of students with disabilities.
Study model and research hypothesisThe model adopted for this study hypothesised that teacher factors (attitudes towards students with disabilities, self-efficacy and classroom practices) are related to the social status of students with disabilities in regular classroom. Additionally, the model hypothesised that there is a relationship between the teacher factors such as the attitudes towards students with disabilities, self-efficacy and classroom practices of the teacher. Figure 1 below gives an overview of the model.
158
Teacher Attitude Towards Inclusive Education (ATIES).
Classroom Practices of the Teacher
(COCSI and Interview)
Social Status of Students with disabilities in inclusive classroom
(Sociometry)
Teacher Factors Student Outcome
INTERNATIONAL JOURNAL OF SPECIAL EDUCATION Vol 27, No: 2, 2012
Figure 1. The Model of the StudyThe research questions were: What attitudes do teachers hold towards the inclusion of students with disabilities into regular classrooms?, What self-efficacy beliefs do the teachers hold about teaching students with disabilities in inclusive classrooms?, What teaching practices do teachers use to support the social inclusion of students with disabilities?, Do students with disabilities have the same social status as those without disabilities in the classrooms investigated? and What is the relationship between the teachers’ background variables (such as gender and teaching experience) and their scores on the measures of Attitude Towards Inclusive Education, Teachers’ Self-Efficacy and Classroom Practices? The research hypotheses were: Teachers’ attitude, teacher self-efficacy, and classroom practices, together with teacher background variables (such as gender and teaching experience) will predict the social status of students with disabilities in regular classrooms (Hypothesis1) and Teachers’ attitudes, teacher self-efficacy and classroom practices – will predict the social status of students with disabilities in regular classrooms (Hypothesis 2).
MethodData were collected from a sample of 93 primary school teachers and a total of 923 students from 3rd grade to 6th grade from the district of Ramnad, Tamil Nadu, India. The schools from which the data were collected were all Punchayat Union Schools (public schools). The district of Ramnad is divided into 11 blocks and was subjected to a multi-stage cluster sampling procedure in the selection of schools for the study. Each block/unit was considered as a cluster. Therefore a sample drawn from these clusters is considered a worthy representative of the district (Miller & Salkind, 2002). In selecting the schools from these 11 blocks, a key selection criterion was whether or not teachers had received training in inclusive education. At the time of the data collection, the SSA had covered four blocks in training teachers for inclusion. From these four blocks, two blocks were selected to include in the study. The decision to select these two blocks was influenced by a need to ensure equal representation of schoolteachers who had been trained in inclusion and also to facilitate travel between schools in close proximity using alternative means of transportation to the schools. From each of these two blocks, five schools were randomly selected and teachers were invited to participate in the study. Eight classrooms from each of the five schools (N=40) were selected for observation of classroom teaching and administration of the social status of students. The student participants were derived from the 40 classrooms, which were all taught by teachers trained in inclusive education.
InstrumentationThe study employed a combination of survey questionnaires and participant observation along with interviews to collect data on teacher background variables (gender, age, class level taught, number of students with and without disabilities in their classrooms, their training level and years of teaching experience); attitudes toward inclusive education; self-efficacy to implement inclusive practices; classroom teaching practices and reflection on the practices.
In the model explained in Figure 1, each of the variables was measured by using different instruments. The instruments included: The Attitudes Toward Inclusive Education Scale (ATIES); Teachers’ Sense of Efficacy Scale (TSES) developed by Tschannen-Moran and Hoy (2001); Classroom Observation Checklist for Social Inclusion (COCSI); The Interview Schedule for Inclusive Teachers and A Sociometric Measure: How I Feel Toward Others (Agard, Veldman, Kaufman & Semmel, 1978).
The Attitudes Toward Inclusive Education Scale (ATIES). This scale was developed by Wilczenski (1995) to measure attitudes towards inclusive education on 4 dimensions of academic, psychical, social and behavioural aspects and needs of students with disabilities. This instrument was translated into Tamil and was validated by a panel of 4 experts in the field in India. Examples of items are illustrated as below:
159
Teacher self-efficacy (TSES)
INTERNATIONAL JOURNAL OF SPECIAL EDUCATION Vol 27, No: 2, 2012
Students, whose academic achievement is one year below the other students in the same grade, should be in regular classes; and Students who cannot read standard print and need to use Braille should be in regular classes. These items were rated on a 6-point Likert-type classification from Strongly Disagree (1) to Strongly Agree (6).
The reliability of the original scale was 0.92 and the translated scale used in this study was found have a Cronbach’s Alpha coefficient of 0.83. This is found to be consistent with the reliability coefficient of 0.80 obtained in another Indian study by Sharma (2001) when ATIES was translated into Hindi.
Teachers’ Sense of Efficacy Scale (TSES). This scale was developed by Tschannen-Moran and Hoy (2001). This scale was also translated and validated for its Tamil version. The scale comprises of 24 items. It measures teacher efficacy on 3 dimensions of efficacy: student engagement, instructional strategies, and classroom management. Participants had to rate each item on a 9 point Likert –scale with anchors at 1 - nothing, 3 - Very little, 5 - some influence, 7 - Quite a bit, and 9 - a great deal (Tschannen-Moran & Hoy, 2001). The reliability coefficient of the original TSES is 0.94. The reliability coefficient of the translated TSES long form in this study was found to be 0.95. Examples of items from this scale are illustrated below:
How much can you do to control disruptive behaviour in the classroom? and How much can you do to adjust your lessons to the proper level for individual students? These items were rated on the 9-point classification as explained above.
Classroom Observation Checklist for Social Inclusion (COCSI). This checklist was developed by the researcher and includes a list of teaching behaviours recognised in literature as behaviours that enhance student participation, learning and positive interaction among students in inclusive classrooms (Kuyini, 2004; Mastropieri & Scruggs, 2000; Stainback & Stainback, 1990; Thompson, et al., 1993). It contained 31 items with three subscales - Basic Instruction (8 items), Facilitative Interaction (14 items), and Facilitative Instruction (9 items). Items in the checklist were scored on the basis of three classifications: ‘Fully in Evidence’ (scored 2), ‘Partly in Evidence’ (scored 1) and ‘Not in Evidence’ (scored 0). The checklist included items such as: Positions, handles and moves child in a functional and age appropriate manner (2, 1, 0); Students with disabilities are called upon to answer questions in teacher-led activities (2, 1, 0); Provides both individual and group instruction (2, 1, 0). The checklist was validated by four experts in the field of special education in Tamil Nadu and then subjected to a reliability analysis. The panel of experts included a special education teacher, two university professors and Ministry of education official. The main goal of the panel was to check for content validity and also to advice on the wording of items before the and after piloting. The results of the reliability analysis showed that the checklist had a Cronbach’s Alpha Coefficient of 0.92, indicating that it was a reliable instrument.
The Interview Schedule for Inclusive Teachers. The study used a semi-structured interview schedule. The interview schedule was used to draw out the teachers’ own rationale behind the behaviours that were evidenced or not evidenced during the classroom observation sessions undertaken prior to the interviews. The interview schedule, which comprised six items pertaining to social inclusion of students with disabilities in regular classrooms, was used by the investigator in the local language. The items included questions such as ‘What are the strategies you use for social inclusion of students with disabilities in classroom?’, ‘Why do you think these strategies will help in the successful social inclusion of students with disabilities in your classroom?’ and ‘What do you do to create awareness among children without disabilities about the children with disabilities in your classroom?’.
A Sociometric Measure: How I Feel Toward Others. This Sociometric Measure is a Peer Rating measure for student participants. It was developed by Agard, Veldman, Kaufman and Semmel (1978 as cited by Fuchs, et al., 2002) and used by various researchers such as Coben and Zigmond (1986), Fuchs, et al. (2002) and Roberts and Zuberick (1992). It involved students rating every other student in the class in terms of how much he/she liked each other student. Students were presented with a class roster with four circles next to each name. Each circle contained a smiling face, straight mouth face, frowning face and a question mark. The respondent indicated his/her response by choosing one of the faces in accordance with the following: 1) the smiling face is marked for students, the rater likes (Positive); 2) the straight mouth face if selected for students, the rater is indifferent toward (Neutral); 3) the frowning face is chosen for students, the rater dislikes (Negative); and 4) the question mark is selected for the students, the rater does not know. This provided the status of each student with disability in the classrooms.
160
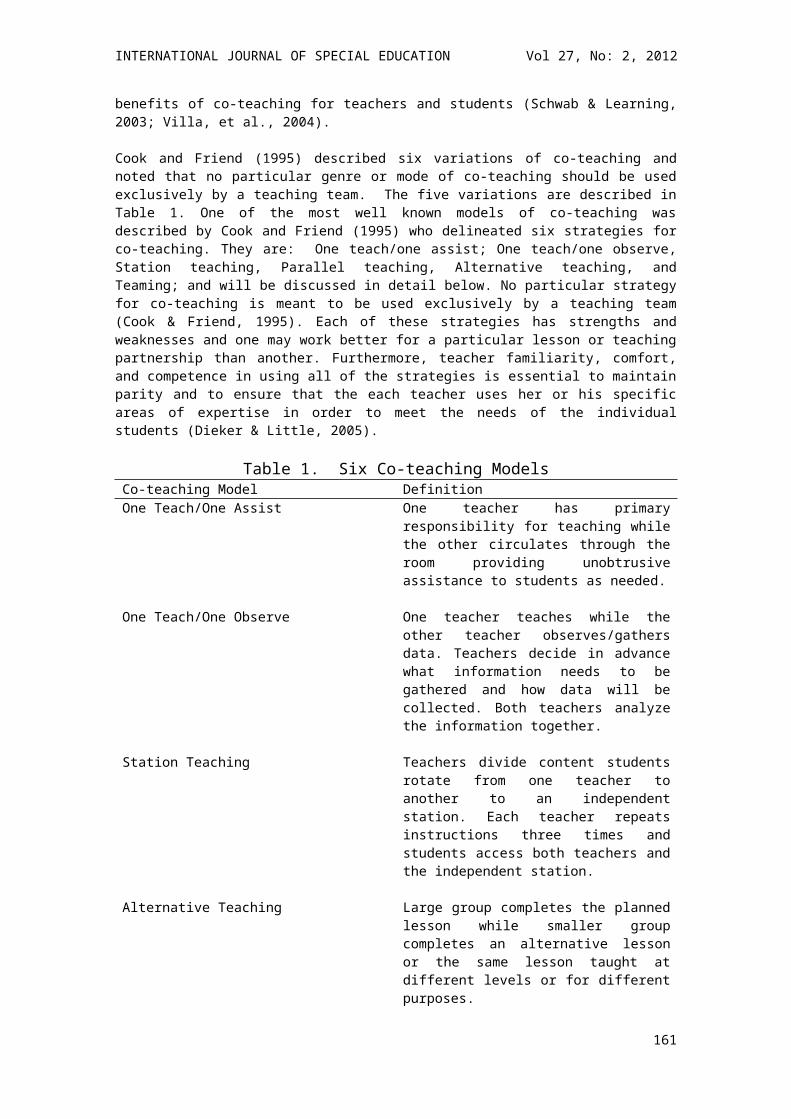
INTERNATIONAL JOURNAL OF SPECIAL EDUCATION Vol 27, No: 2, 2012
Data Collection ProcedureIn keeping with the guidelines set out by The University of Melbourne, and in accordance with its ethical approval process, permission was sought from the Education for All program director for the district of Ramnad. Letters seeking permission from Principals of the selected schools were sent out and consent forms were obtained from all participants.
The process of data collection was done in a systematic fashion. First, the questionnaires for teachers (ATIES, TSES and background questionnaire) were administered. The selected 40 classrooms were then observed for two 30-minute sessions using the COCSI observation checklist, and then interviewed about their teaching. These two activities were followed by Sociometric data collection from students using the Peer Rating Technique ‘How I feel towards others’ by Agard, et al., (1978 as cited by Fuchs, et al., 2002). Data was obtained from 12 classrooms of the 40 classrooms observed on this measure. Many of the teachers did not collect the data before the end of school term and after follow up letters and emails to the teachers to collect the data, only 18 of the 40 classrooms returned data. After going through the data, it was observed that only data from 12 classrooms were comprehensive enough to show any meaningful picture of the social relations in the classroom. Thus the results for this aspect of the study are based on the 12 classrooms.
ResultsThe results of this study are reported in line with the research questions and hypotheses. The results of research questions 1, 2, 3, 4 and 5 are presented first and then followed by the findings for hypothesis 1 and 2.
The results for question one (teachers attitudes toward inclusive education) showed that the attitudes of the teachers (N = 93) were positive with an ATIES Mean of 4.12 (SD = 0.73) on the 6 point Likert-type scale. The mean score suggests that the teacher participants in the study generally held positive attitudes towards inclusive education.
The results for question two (Teacher Self-efficacy) also showed a TSES Mean score of 7.72 (SD = 0.96). This mean score on a 9-point Likert scale indicated high self-efficacy beliefs on the following specific teacher skills that promote inclusive education. Teachers reported high scores on items such as ‘Helping student’s value learning’; ‘Getting students to believe that they can do well in school’; ‘Helping students to follow classroom rules’ (which formed part of the student engagement subscale. The results however, showed moderate scores on the instructional strategies and classroom management subscales.
The results for question three showed that teachers were using more teaching practices associated with Basic Instructional Strategies and a little less of Facilitative interaction and Facilitative instruction (See Table 1 below).
Table 1. Mean Percentage of Full Evident Items in COCSI Sub-scales
Classroom practice (COCSI Sub-Scales) Average percentageBasic instructional strategies 29.1%Facilitative interaction strategies 19.5%Facilitative instructional strategies 18.6%
The results for question four (The social status of students with disabilities in inclusive classrooms) showed that students with and without disabilities were not too different in social status based upon peer rating. To explain the position of students’ social status within individual classrooms, a percentile ranking of the mean social status scores obtained by each student participant was calculated. The following dot-plot shows the percentile ranking of the social status for all students in each of the 12 classrooms.
The below Figure 2 shows the social status of students with and without disabilities in each of the 12 classrooms. The figure suggests that the social status of students with disabilities (represented by the triangles) is similarly spread out as that of students without disabilities (represented by the dots). It is clear that students who are at the lower end of the scale comprise both students with and without disabilities while it is clear that there are students with disabilities who are in the higher end of the social
161
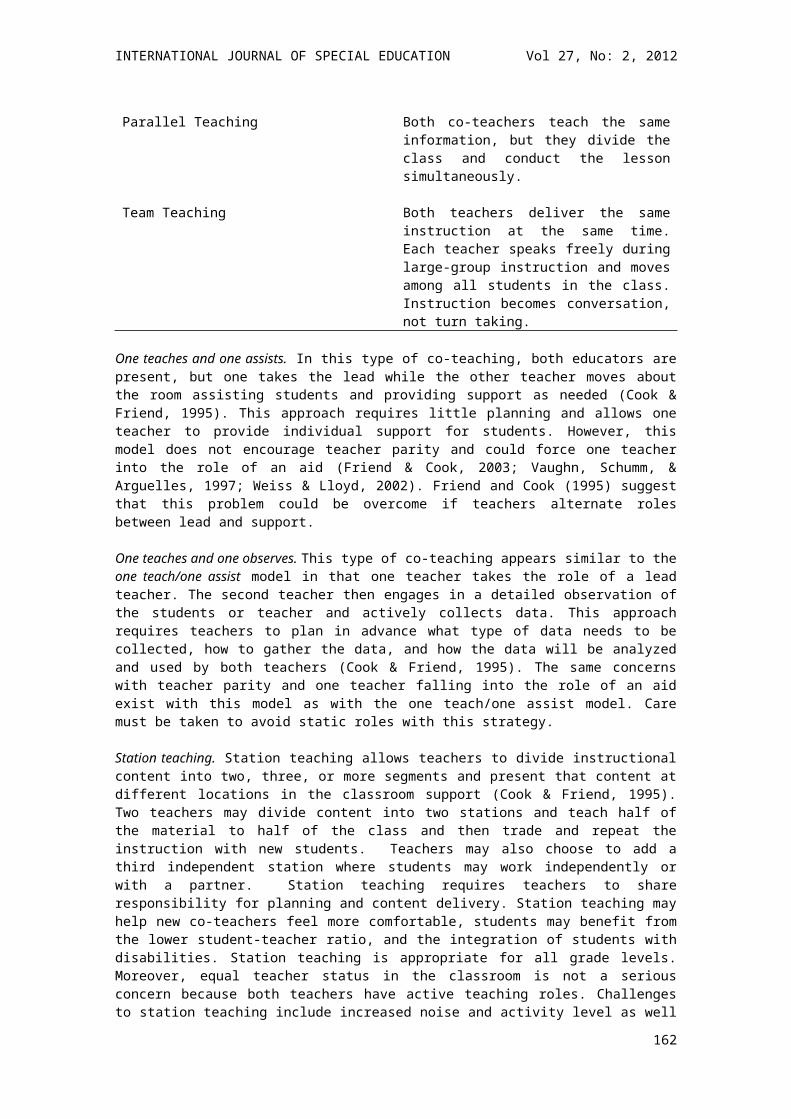
INTERNATIONAL JOURNAL OF SPECIAL EDUCATION Vol 27, No: 2, 2012
status percentile scale. For example, in classroom 3, there was only one student with disability and this student held a high percentile ranking.
In exploring the relationship between the teacher background variables such as gender, number of students with disabilities in classroom, and training in Inclusive education, and their scores on the measures of attitude towards inclusive education, teachers’ self-efficacy and classroom practices (research question five), only one teacher background variable was significantly related to classroom practices. The background variable of ‘number of students with disabilities in the classroom’ had a p- value of 0.04 against COCSI mean scores. Teachers were found to be scoring higher in classroom practices when there was only one student with disabilities in their classrooms (M= 24.3, SD= 10.1). Teachers with more than three students with disabilities in their classrooms displayed the least effective classroom practices (M = 11.9, SD = 11.6). Likewise, the age of the teachers also reflected a direct influence on the classroom practices of the teacher. The mean COCSI score was lowest for teachers who were in the age group of 51-60 years (M= 15.9, SD = 9.9, p= 0.04). There were no significant correlations between teachers’ attitudes, teachers’ self-efficacy and the other variables.
Figure 2. Dot-plot of Percentile Ranking of Social Status of All Students in 12 Classrooms
The hypothesis that teacher attitude, teacher self-efficacy, and classroom practices, together with the teacher background variables (such as gender and teaching experience) will predict the social status of students with disabilities in regular classrooms was tested by employing a multiple regression analysis where all variables were considered in predicting the social status of students with disabilities. In doing this, only two of the subscales of the classroom practices scale (COCSI) significantly predicted the social status of students with disabilities. They were COCSI –Basic instruction and COCSI Facilitative Instruction (see Table 2). The remaining teacher variables were shown not to predict social status of students with disabilities.
Table 2. Regression model summary: Teacher Variables as Predictor of Social Status of Students with Disabilities
Coef SE Coef p
Constant 0.4830 0.1237COCSI Basic Instruction subscale -0.04859 0.01869 0.029
162
INTERNATIONAL JOURNAL OF SPECIAL EDUCATION Vol 27, No: 2, 2012
COCSI Facilitative Instruction subscale 0.08437 0.01869 0.001R Square = 69.8%Adjusted R Square = 63.0%
The two COCSI subscales shown in Table 2 explained 63% of social status of students with disabilities in regular classrooms. Thus, it can be shown that teachers’ classroom practices of basic instruction (for example; arranging instructional environment to accommodate the needs of all students, clarity in presentation, and scanning and circulating frequently), and facilitative instruction (for example; providing both individual and group instruction, accommodation of students’ attention span, and allowing students with disabilities to respond) were the strongest predictors of social status of students with disabilities in regular classrooms when all the teacher variables of attitudes, self-efficacy and background factors were considered.
To test the second hypothesis that teacher attitude, teacher self-efficacy and classroom practices, will predict the social status of students with disabilities in regular classrooms, a multiple regression analysis procedure involving all of the teacher variables (ATIES, TSES and COCSI) – except teachers’ background variables – was used. When the background variables of the teachers were omitted from the regression equation, the effect of classroom practices (COCSI scores) was once again evident. Table 3 gives the correlation of the COCSI with social status of students with disabilities in regular classrooms.
Table 3. Correlation of COCSI with Social Status of Students with Disabilities
Classroom Practice (COCSI)Correlation with
Social Status p-value
Basic Instructional Strategies -0.059 0.9
Facilitative Interactions 0.592 0.04*
Facilitative Instruction 0.686 0.01*
Total COCSI Score 0.548 0.07
*p<0.05
Table 3 above demonstrates that though the total COCSI score was not significant (p = 0.07), two of the subscales of COCSI - Facilitative Interaction and Facilitative Instruction were positively correlated (p= 0.04 and p=0.01 respectively) with social status of students with disabilities. This shows that the teachers’ classroom practices on facilitative interaction strategies and facilitative instruction strategies had a direct influence on the social status of students with disabilities in regular classrooms. This also showed that the teachers’ attitudes toward inclusive education (ATIES) and teachers’ self-efficacy (TSES) did not have any predictive power over the social status of students with disabilities.
DiscussionThe study showed that teachers had positive attitudes towards inclusive education and reported high self efficacy scores on skills and actions that would support inclusive schooling. The results showing positive attitudes toward inclusive education mirrors results from a New Delhi study by Sharma (2001) in the field. The high self-efficacy scores related to the findings of Graham et al., (2003) in the US and Romi and Leyser (2006) in Israel and Palestine.
The most significant finding of the study was that, in the context of The Intergroup Contact Theory, teachers’ classroom practices predicted the social inclusion of students with disabilities in regular classrooms. Teachers’ attitudes towards inclusive education and self-efficacy were not significant influences on the social status of students with disabilities in regular classrooms. The results of this study are in accordance with previous research by Roberts and Zuberick (1992) who found teachers’ attitudes towards inclusion were not significantly related to the social acceptance or rejection of students with disabilities. While the findings of the present study show teachers’ self-efficacy to be unrelated to students’ social status in inclusive classrooms, a review of literature revealed no other studies on this
163
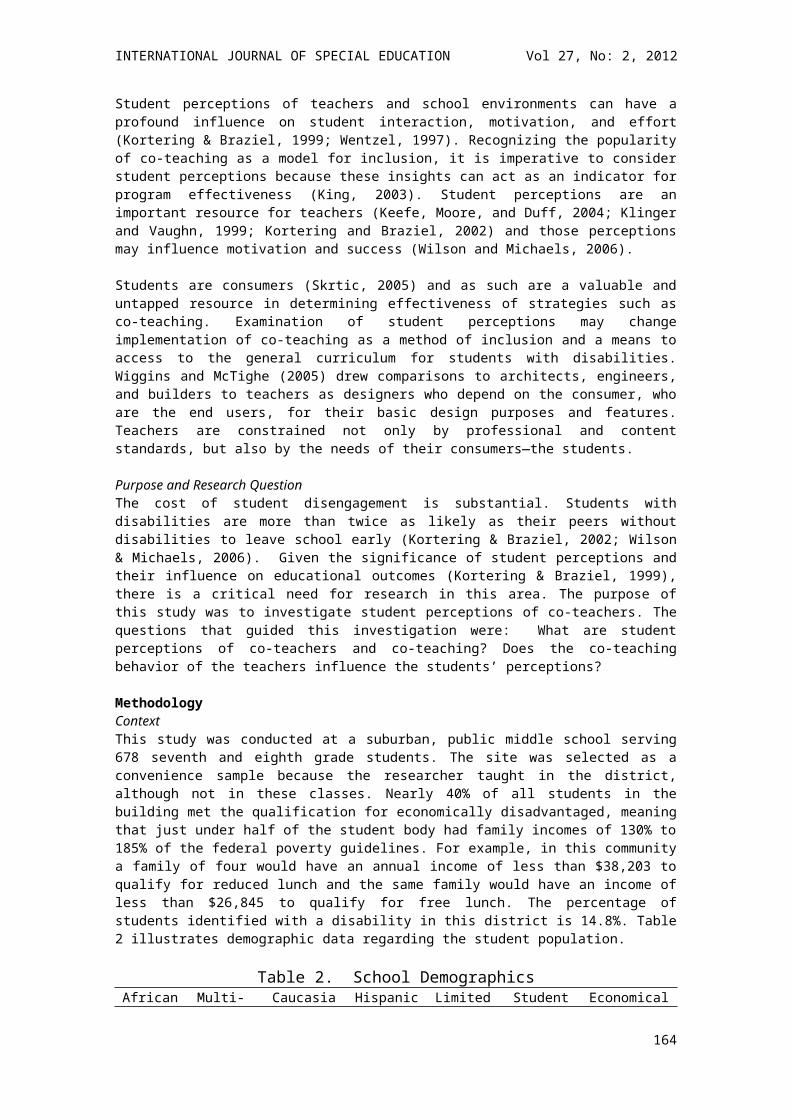
INTERNATIONAL JOURNAL OF SPECIAL EDUCATION Vol 27, No: 2, 2012
question. Replication of this finding could be helpful in future research. The fact that social status was predicted by teachers’ classroom practices including facilitative instruction mirrors the findings of Fuchs, et al. (2002) and Utley et al. (2001), who studied the effects of peer tutoring (a form of facilitative interaction) on social status). The authors found that students with disabilities in peer tutoring programs classes were more socially accepted than their counterparts, and enjoyed the same social standing as most non- disabled classmates. A key implication of this finding is that teacher behaviour is an important component of the effort to facilitate social inclusion. It also implies that teachers can make a difference in the social inclusion experiences of students with disabilities and that such inclusion, through increased peer interaction, may foster more learning opportunities and potentially better school outcomes for students with disabilities. Although this finding relates specifically to the context of Tamil Nadu, it may also apply to other areas in India with similar socio-cultural environments and school practices.
The findings of the study also showed similar ranges of social status for students with and without disabilities in regular classrooms (refer to Figure.3). These findings agree with earlier studies (Bakker & Bosman, 2003; Hall & McGregor, 2000; Kemp & Carter, 2002) and may be an exception to the norm in many contexts around the world where attitudes toward people with disabilities are less positive. However, the finding may not be surprising in this study region (Tamil Nadu, India) when one takes into consideration the cultural context whereby all students came from their own small villages and had been growing up together as playmates in the same location. These shared experiences of students with and without disabilities could have generated a natural social inclusion orientation among the students, with or without effective classroom practices of the teachers. This was particularly reflected in the interviews. One teacher’s comment captured what most of these teachers felt:
….it is the students without disabilities in my class who tell me if I have misunderstood the students with disability (hearing impairment) and give me information on the child. Especially, during the beginning of the year, it took me sometime to adapt to the child with disability in my class. The students without disabilities already knew the child better than me and they helped the child at class-work. There was no need for me to prepare or specially talk to these students about the child with disability. They already know and are very helpful to each other.
This seems to be unique to this particular culture in India where there are no public welfare agencies or institution–based care services taking care of children with disabilities, but there exists, rather, an attitude more or less bound by a moral sense of duty in the structure of family and community (Clarke, 2006; Alur, 2001). One advantage of such a societal attitude is that people are more socially and culturally dependent on the community and this could lead to a natural or casual inclusion of children with disabilities in the community and schools (Alur, 2001).
The teachers in the study also found to be using more basic instructional strategies and that the presence of students with disabilities in the classroom influenced teacher practices. There was a significant difference in the mean scores of teachers’ classroom practices due to the number of students with disabilities in the classroom. Teachers were found to be scoring higher in classroom practices when there was only one student with disabilities in their classrooms. Teachers with more than three students with disabilities in their classrooms displayed the least effective classroom practices. This suggested that the greater the number of students with disabilities in the classroom the less the evidence was of teachers’ effective classroom practices on social inclusion. Similar findings were reflected by Graham et al. (2003) who found a positive correlation with adaptive instruction for struggling writers and percentage of students with disabilities in their classroom. Correspondingly, Kavoori (2002) in relating the success of inclusive classrooms in New Delhi stressed that it is dependent on the number of students with disabilities in the regular classroom. The need for extra time and additional responsibilities imposed on teachers by the increase in number of students with disabilities in classroom is expected to affect teaching processes. This may reflect the reality that each student with a disability has different needs and calls for more work in terms of adapting instruction. And such a conclusion is supported by the teachers’ responses during interviews. Some teachers reported in the interviews that large class-sizes was a burden and limited their classroom practices. As these classroom teachers were solely responsible for the classrooms without any teacher assistants, in their classroom practices were more likely to be constrained. The successful use of teacher aides in classrooms within the state of Victoria, Australia could be a helpful model to follow in Indian classrooms and policy makers in India should consider this approach to supporting teachers.
Conclusion
164
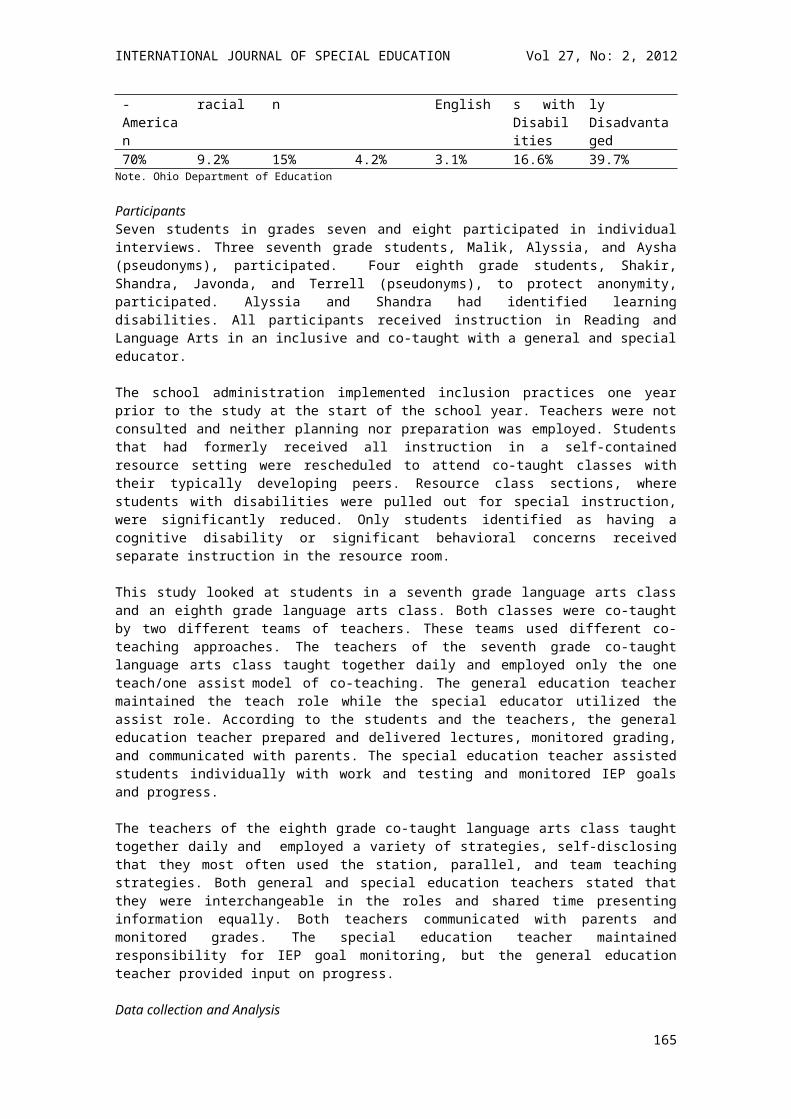
INTERNATIONAL JOURNAL OF SPECIAL EDUCATION Vol 27, No: 2, 2012
This study provided some support for the Intergroup Contact Theory (Allport, 1954) where the acceptance of students with disabilities in regular classrooms is contingent on the teachers’ classroom practices. The results from this study showed the classroom practices of the teacher had greater predictive power than other variables (such as teachers’ attitude towards inclusive education or teachers’ self efficacy) on the social status of students with disabilities in regular classrooms. This implies that although studies (Loreman, Forlin & Sharma, 2007; Tschannen-Moran & Hoy, 2001) point to the positive role of teacher attitudes and teachers self-efficacy in the successful inclusion of students with disabilities, these factors (attitudes and self-efficacy) need to be translated into teaching practices at the classroom level that support such students.
The results of this study also showed that students with disabilities were well accepted by their peers in the inclusive classrooms where teachers were using facilitative teaching practices. The implications of these findings point to the potential for successful social outcomes of inclusive education when teacher classroom practices are inclusive. It further suggests that a natural inclusion process may be created when students live and grow in close proximity as a community.
In terms of teachers as agents of social facilitation, the study suggests that teacher behaviour is an important component of the effort to facilitate social inclusion. Although this study cannot be generalised across India, the implication of the findings are that teachers can make a difference in the social inclusion experiences of students with disabilities and that such inclusion may also allow for better school outcomes that are associated with increased peer interaction. For policy makers and teacher training institutions, the findings imply that they need to think of ways to enhance schools’ and teachers’ capacities to facilitate social inclusion. This can be done through refining teacher inclusive skills and the creation of school and classroom environments that foster equality, common goals and inter-group cooperation among students (Allport, 1954). Since positive teacher attitudes are also linked to good teaching practices (Cook, 2001; Elliot, 2008; Kuyini & Desai, 2007) policy makers would also need to provide the school supports and resources that engender positive teacher attitudes, which also enhance inclusive teaching practices. Finally local school districts have a chance to promote a natural transition from community inclusion to school inclusion for children / students with disabilities.
This study was limited to Tamil Nadu and it not clear whether the findings would be replicated in districts across India with similar conditions. Therefore, further research is needed to investigate teachers’ attitudes, self-efficacy and practices with regard to social inclusion of students with disabilities. It will also be relevant to investigate the similarities and differences in teachers’ attitudes, self-efficacy and practices within and across different, regions, school districts, and contexts such as rural, urban and remote.
ReferencesAllport, G. W. (1954). The Nature of Prejudice. London. Ontario: Addison-Wesley Publishing Company.Alur (2001). Some cultural and moral implications of inclusive education in India – a personal view. Journal of Moral Education, 30 (3), 287-292.Alur, M. (2002). ‘Status of disabled people in India – Policy and inclusion.’ Exceptionality Education Canada, 12 (2), 137-167.Bakker, J. T. A., & Bosman, T. M. (2003). Self-image and peer acceptance of Dutch students in regular and special education. Learning Disability Quarterly, 26(1), 5-14.Bizman, A., & Amir, Y. (1984). Integration and attitudes. In Y. Amir & S. Sharan (Eds.), School Desegregation: Cross cultural perspectives (pp. 155-188). London: Lawrence Erlbaum Associates, Publishers.Briggs, J. D., Johnson, W. E., Shepherd, D. L., & Sedbrook, S. R. (2002). Teacher attitudes and attributes concerning disabilities. Academic Exchange Quarterly, 6(2), 85-89.Brown, W. H., Odom, S. L., & Conroy, M. A. (2001). An intervention hierarchy for promoting young children's peer interactions in natural environments. Topics in Early Childhood Special Education, 21(3), 162-175.Carlson, E., Lee, H., & Schroll, K. (2004). Identifying attributes of high quality special education teachers. Teacher Education and Special Education, 27(4), 340-359.Clarke, P (2006). Culture and classroom reform: the case of the district primary education project, India. Comparative Education, 39 (1), 27-44.Coben, S. S., & Zigmond, N. (1986). The social integration of learning disabled students from self-contained to mainstream elementary school settings. Journal of Learning Disabilities, 19(10), 614-622.
165
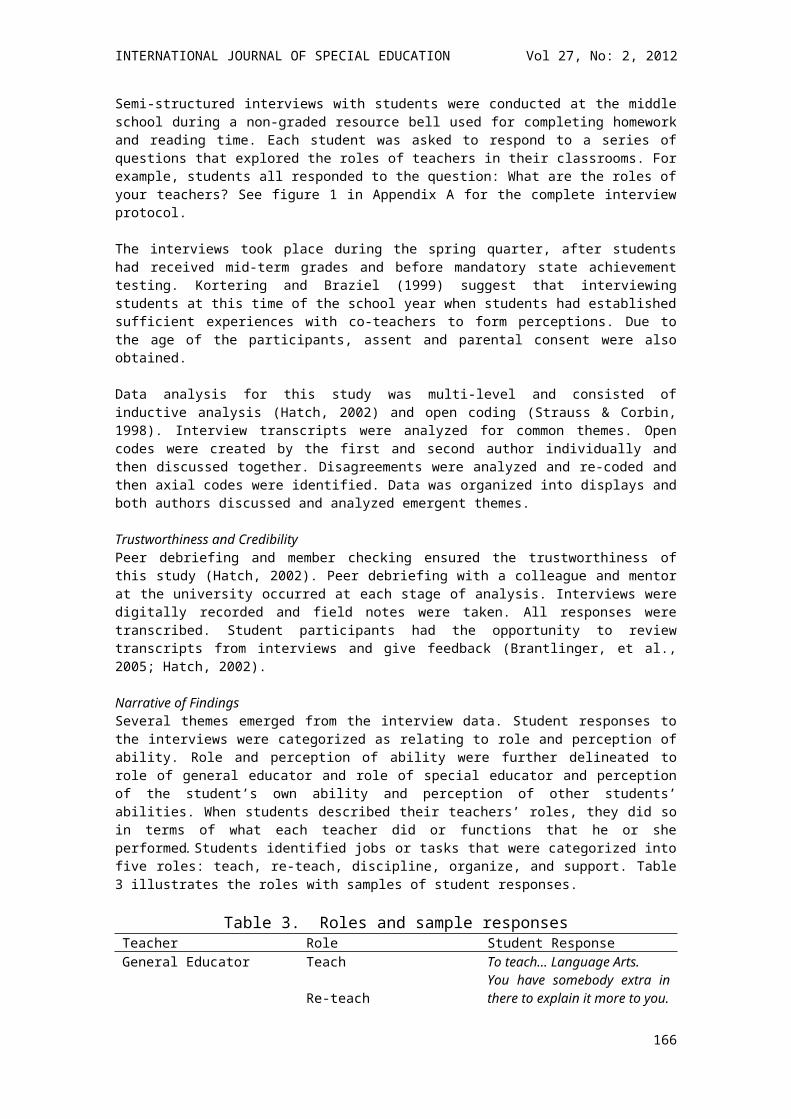
INTERNATIONAL JOURNAL OF SPECIAL EDUCATION Vol 27, No: 2, 2012
Colley, K. M. (2000). Approaches for facilitating positive social relationships. In M. Snell & R. E. Janney (Eds.), Teachers' Guides to Inclusive Practices: Social Relationships and Peer Support (pp. 35-78). Sydney: Paul Brookes Publishing.Cook, B. G., Tankersley, M., Cook, L. & Laundrum, T. J. (2000). Teachers’ attitudes toward their included students with disabilities. Exceptional Children, 67, 115-35.Cook, B.G. (2001). A comparison of teachers’ attitudes toward their included students with mild and severe disabilities. The Journal of Special Education, 34 (4), 203-13.Delano, M. (2000). Models of peer support in instruction. In M. Snell & R. E. Janney (Eds.), Teachers' guide to inclusive practices: Social relationships and peer support. Baltimore: Paul H Brookes Publications.Downing, J. E., Eichinger, J., & Williams, L. J. (1997). Inclusive education for students with severe disabilities. Remedial and Special Education, 18(3), 133-142.Dyer, C. (2000). Operation black board: Policy implementation in Indian elementary education. Wallington, UK: Symposium Books.Elliot, S (2008). The effect of teachers’ attitude toward inclusion on the practice and success levels of children with and without disabilities in physical education. International Journal of Special Education, 23 (3), 48-55.Favazza, P. C., & Odom, S. L. (1997). Promoting positive attitudes of kindergarten-age children toward people with disabilities. Exceptional Children, 63(3), 405-418.Fisher, D., Roach, V., & Frey, N. (2002). Examining the general programmatic benefits of inclusive schools. International Journal of Inclusive Education, 6(1), 63-78.Fuchs, D., Fuchs, L. S., Mathes, P. G., & Martinez, E. A. (2002). Preliminary evidence on the social standing of students with learning disabilities in PALS and no-PALS classrooms. Learning Disabilities Research and Practice, 17(4), 205-215.Goodlad, J. (1984). A place called school: Prospects for The future. New York: McGraw-Hill Books.Graham, S., Harris, K. R., Fink-Chorzempa, B., & MacArthur, C. (2003). Primary grade teachers' instructional adaptations for struggling writers: A national survey. Journal of Educational Psychology, 95(2), 279-292.Grover, S., & Singh, N. H. (2002). The quality of primary education: A case study of Madurai and Villupuram districts In Tamil Nadu, India: Available online: http://www.cid.harvard.edu/india/docs/report.pdf.Hall, L. J., & McGregor, J. A. (2000). A follow-up study of the peer relationships of children with disabilities in an inclusive school. The Journal of Special Education, 34(3), 114-126, 153.Hamre-Nietupski, S., Hendrickson, J., & Nietupski, J. (1994). Regular educators' perceptions of facilitating friendships of students with moderate, severe, or profound disabilities with nondisabled peers. Education and Training in Mental Retardation and Developmental Disabilities, 29 (2), 102-117.Harrower, J. K. (1999). Educational inclusion of children with severe disabilities. Journal of Positive Behaviour Interventions, 1(4), 215-230.Henson, R. K., Kogan, L., & Vacha-Haase, T. (2001). A reliability generalization study of the teacher efficacy scale and related instruments. Educational and Psychological Measurement, 61(3), 404-420.Kavoori, P. (2002). Inclusive education experiences. In S. Hegarty & M. Alur (Eds.), Education and children with special needs: from segregation to inclusion (pp. 120-124). New Delhi: Sage Publications.Kemp, C., & Carter, M. (2002). The social skills and social status of mainstreamed students with intellectual disabilities. Educational Psychology, 22(4), 391-411.Kennedy, C. H. (2001). Social interaction interventions for youth with severe disabilities should emphasize interdependence. Mental Retardation and Developmental Disabilities Research Reviews, 7(2), 122-127.Klingner, J. K., & Vaughn, S. (1999). Students' perceptions of instruction in inclusion classrooms: Implications for students with learning disabilities. Exceptional Children, 66(1), 23-37.Korinek, L., Walther-Thomas, C., McLaughlin, V. L., & Williams, B. T. (1999). Creating classroom communities and networks for student support. Intervention in School and Clinic, 35(1), 3-8.Kuyini (2004). Principals’ and teachers’ attitudes toward and knowledge of inclusive education as predictors of effective inclusive school practices in Ghana. Unpublished Doctoral Thesis, University of Melbourne, Melbourne.Kuyini, A B., & Desai, I (2007). Principals’ and tecahers’ attitudes and knowledge of inclusive education as predictors of effective teaching practices in Ghana. Journal of Research in Special Education Needs, 7(2), 104-113.Loreman, T., Forlin, C., & Sharma, U. (2007). An international comparison of pre-serviceteacher attitudes towards inclusive education. Disability Studies Quarterly, 27(4),Fall Edition. http://www.dsqsdsarchives.
166
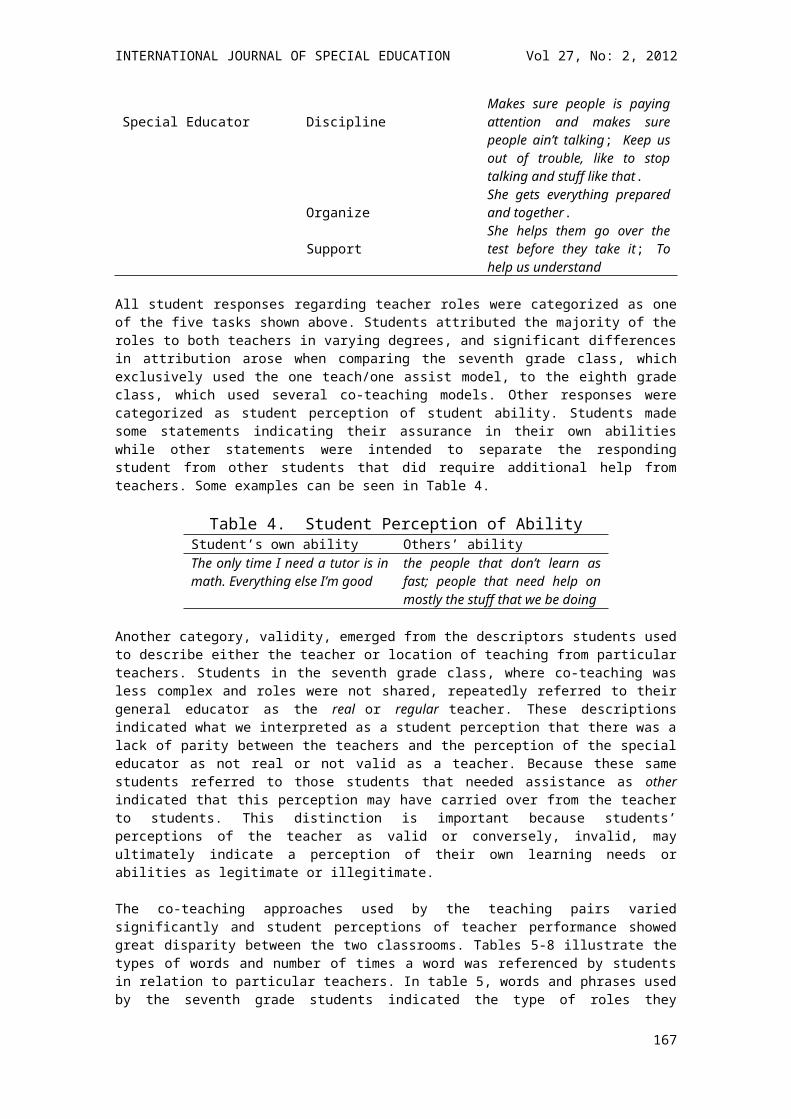
INTERNATIONAL JOURNAL OF SPECIAL EDUCATION Vol 27, No: 2, 2012
org/articles_html/2007/fall/dsq_v27_04_2007_fall_fs_02_loreman.htm Lumpe, A. T., Czerniak, C. M., & Haney, J. J. (1998). Science teacher beliefs and intentions regarding the use of cooperative learning. School Science and Mathematics, 98(3), 123-137.Mastropiere, M. & Scruggs, T. (2000). The inclusive classroom: strategies for effective instruction. Upper Saddle River, NJ: Prentice-Hall.McClenahan, C., Cairns, E., Dunn, S., & Morgan, V. (1996). Intergroup friendships: Integrated and desegregated schools in Northern Ireland. The Journal of Schools in Northern Ireland, 136(5), 549-558.Miller, D. C., & Salkind, N. J. (2002). Handbook of research design and social measurement (6th ed.). Thousand Oaks: Sage Publications.Muijs, D., & Reynolds, D. (2002). Teachers' belief and behaviour: What really matters? Journal of Classroom Interaction, 37(2), 3-15.Nakken, H., & Pijl, S. J. (2002). Getting along with classmates in regular schools: a review of the effects of integration on the development of social relationships. International Journal of Inclusive Education, 6(1), 47-61.Nougaret, A. A., Scruggs, T. E., & Mastropieri, M. A. (2005). Does teacher education produce better special education teachers? Exceptional Children, 71(3), 217-229.Pavri, S. (2004). General and special education teachers' preparation needs in providing social support: A needs assessment. Teacher Education and Special Education, 27(4), 433-443.Pavri, S., & Monda-Amaya, L. (2001). Social support in inclusive schools: Student and teacher perspectives. Exceptional Children, 67(3), 391-411.Pettigrew, T. F. (1998). Intergroup contact theory. Annual Review of Psychology, 49, 65-75.Roberts, C., & Zubrick, S. (1992). Factors Influencing the social status of children with mild academic disabilities in regular classrooms. Exceptional Children, 59(3), 192-202.Romi, S., Leyser, Y. (2006). Exploring inclusion preservice training needs: a study of variables associated with attitudes and self-efficacy beliefs. European Journal of Special Needs Education, 21(1), 85-105. Salend, S. J. (2001). Creating inclusive classrooms: effective and reflective practices (4th ed.). N.J.: Merrill: Upper Saddle River.Sapon-Shevin, M., & Schniedewind, N. (1989). Selling cooperative learning without selling it short. Educational Leadership, 41(4), 63-65. Salend, S. J., & Duhaney, L. M. G. (1999). The impact of inclusion on students with and without disabilities and their educators. Remedial and Special Education, 20(2), 114-126.Schwartz, L. K., & Simmons, J. P. (2001). Contact quality and attitudes toward the elderly. Educational Gerontology, 27(2), 127-137.Sharma, U. (2001). The Attitudes and Concerns of School Principals and Teachers Regarding the Integration of Students with Disabilities into Regular Schools in Delhi, India . Unpublished Doctoral thesis, University of Melbourne.Soodak, L. C., Podell, D. M., & Lehman, L. R. (1998). Teacher, student, and school attributes as predictors of teachers' responses to inclusion. The Journal of Special Education, 31(4), 480-497.Stainback, W., & Stainback, S. (1990). Facilitating peer supports and friendships. In W. Stainback & S. Stainback (Eds.), Support networks for inclusive schooling (pp. 51-63). Balimore, Maryland: Paul H. Brookes Publishing.Stanovich, P. J., & Jordan, A. (2002). Preparing general educators to teach in inclusive classrooms: Some food for thought. The Teacher Educator, 37(3), 173-185.Subban, P. & Sharma, U (2006). Primary school teachers perceptions of inclusive education in Victoria, Australia. International Journal of Special Education, 21(1), 42-52.Thomas, G., Walker, D., & Webb, J. (1998). The making of the inclusive school. London: Routledge.Thompson, B., Wickham, D., Wegner, J., Ault, M., Shanks, P., & Reinertson, B. (1993). Handbook for the inclusion of young children with severe disabilities (pp. 221-224). Lawrence, KS: Learner Managed Designs.Tschannen-Moran, M., & Hoy, A. W. (2001). Teacher efficacy: Capturing an elusive construct. Teaching and Teacher Education, 17(7), 783-805.Van Reusen, A.K, Shoho, A. R. & Barker, K. S. (2001). High school teacher attitudes towards inclusion. The High School Journal, 84 (2), 7-17.Utley, C., Reddy, S., Dequadri, J., Greenwood, C., Mortweet, S., & Bowman, V. (2001). Classwide Peer Tutoring: An effective teaching procedure for facilitating the acquisition of health education and safety facts with students with developmental disabilities. Education and Treatment of Children, 24(1), 1–27.Wilczenski, F. C. (1995). Development of a scale to measure attitudes toward inclusive education. Educational and Psychological Measurement, 55(2), 291-299.
167
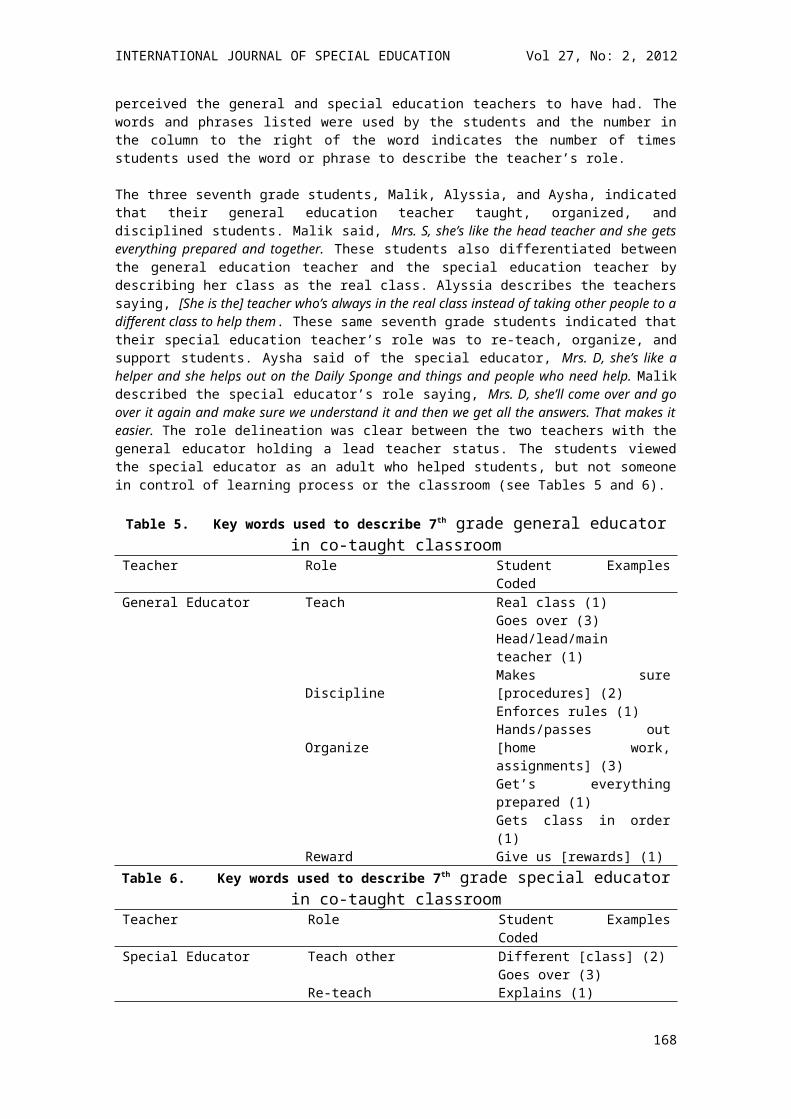
INTERNATIONAL JOURNAL OF SPECIAL EDUCATION Vol 27, No: 2, 2012
York, J., Vandercook, T., Macdonald, C., Heise-Neff, C., & Caughley, E. (1992). Feedback about integrating middle school students with severe disabilities in general education classes. Exceptional Children, 58, 244-258.
THE ROLE OF AUDITORY CUES IN THE SPATIAL KNOWLEDGE OF BLIND INDIVIDUALS
Konstantinos PapadopoulosUniversity of Macedonia
Kimon PapadimitriouUniversity of Thessaloniki
Athanasios KoutsoklenisUniversity of Macedonia
The study presented here sought to explore the role of auditory cues in the spatial knowledge of blind individuals by examining the relation between the perceived auditory cues and the landscape of a given area and by investigating how blind individuals use auditory cues to create cognitive maps. The findings reveal that several auditory cues characterize the study area and are linked to a number of its spatial features. Moreover, the results indicate that, through their sense of hearing, individuals with visual impairments create cognitive maps which include information about spatial relationships of environmental objects/attributes.
IntroductionIt is widely accepted that the ability to make spatial decisions affects our quality of life to a great extent (Golledge, 1993). For individuals with visual impairments in particular, the development of spatial organization is critical for the establishment of orientation and mobility skills (Penrod & Petrosko, 2003; Wheeler, Floyd, & Griffin, 1997). Cognitive mapping of spaces and their defining features is fundamental for spatial organization (Jacobson, 1998; Kitchin, 1994). Most of the information required for cognitive mapping is gathered through the visual channel (Loomis et al., 1993; Matlin & Foley, 1992; Sholl, 1996). People, who are blind, however, do not have access to such information and as a result they use their remaining senses such as hearing, touch and smell (Jacobson, 1993).
Hearing, like vision, is a distance sense and can provide information about objects both in near and far space (Blauert, 1997). The ears collect sounds and through the movement of the head acquire information on the direction of those sounds (Gibson, 1966). The auditory system absorbs information about the nature of sounds, and their direction and duration (Gibson, 1966). Sound converges on a potential listening point from every new direction (Gaver, 1993). Such differentiations in intensity and spectrum in each direction provide a range of information which results in the formation of an auditory array. This auditory array offers important information about the size and the layout of the surrounding environment (Gaver, 1993).
Complex sound environments have been defined as soundscapes (Schafer, 1977). Soundscape is an expression that focuses on the listener’s experience of the space and therefore each listener in the
168
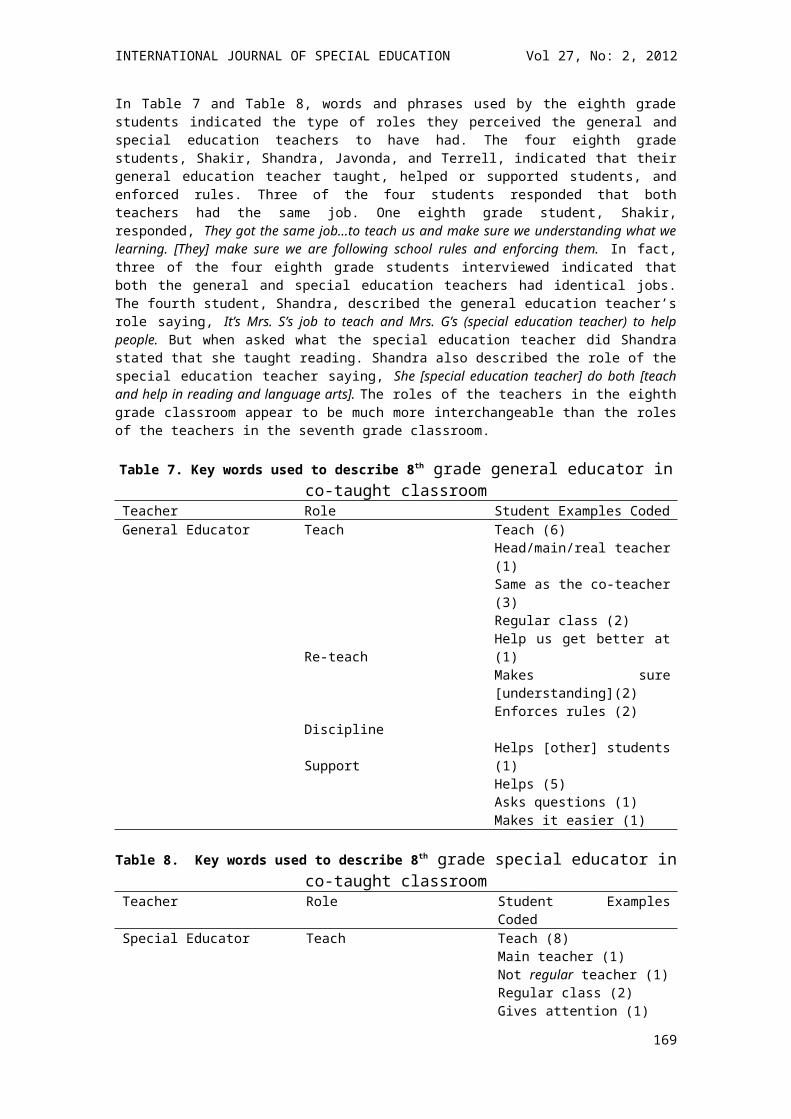
INTERNATIONAL JOURNAL OF SPECIAL EDUCATION Vol 27, No: 2, 2012
surrounding area of an acoustic source experiences different soundscapes (Truax, 1984). Soundscapes are dependent upon the sound making factors that are part of an environment at any given time and may contain a wide range of sounds at the same time (Raimbault & Dubois, 2005). Since the perception of sounds ‘involves listening, not just hearing’ (Gibson, 1966, p. 75), some of these sounds may attract the listener’s attention more than others, not only owing to the physical characteristics of the signal but also to its meaning and relevance to the listener (Hirsh & Watson, 1996). Soundscape is considered to be an auditory equivalent to landscape (Dubois, Guastavino & Raimbault, 2006). The origin and intensity of acoustic signals are a sign of the structure and spatial configuration of the landscape, since human activities, biological processes and natural phenomena produce sounds which play a role as messengers of the landscape (Truax, 1984). Moreover, given that sounds are a secondary product of the landscape, the study of landscapes should not be distinguished from spatial elements (Matsinos et al., 2008).
In view of the fact that a soundscape is shaped by both the conscious and subliminal perceptions of the listener, soundscape analysis is based on perceptual and cognitive attributes such as foreground and background, from which are derived such analytical concepts as keynote, sound signals and soundmarks (Truax, 1999). Schaffer (1977) defines background sounds as ‘keynotes’ and foreground sounds as ‘sound signals’. Additionally, Shaffer defines sounds that are particularly regarded by a community and its visitor’s as ‘sound marks’, in analogy to landmarks. As Wrightson (2000) notes, Schafer’s terminology facilitates the idea that the sound of a particular locality (its keynotes, sound signals and sound marks) can express a community’s identity to the extent that settlements can be recognized and characterized by their soundscapes.
By using auditory cues, individuals with visual impairments can gain information about landmarks and information points and can use this information to determine and maintain their orientation within an environment (Jansson, 2000; Koutsoklenis & Papadopoulos, in press). Individuals with visual impairments also use auditory cues to determine the type of an environment, to identify and localize objects, to maintain orientation, to walk in a straight line, to avoid possible hazards and to cross streets (Ashmead et al., 1998; Blumsack, 2003; Gardiner & Perkins, 2005; Koutsoklenis & Papadopoulos, in press). Several studies, however, indicate that the appraisal and perception of a sound is likely to be affected by visual attributes (Carles, Barrio & de Lucio, 1999; Pheasant, Horoshenkov & Watts, 2008; Viollon, Lavandier & Drake, 2002; Watts, Chin & Godfrey, 1999). Thus, it would be of great interest to investigate the categories of auditory cues that attract the attention of blind individuals.
The StudyThe study presented here sought to explore the role of auditory cues in the spatial knowledge of blind individuals. In particular, the study aimed to investigate the nature of auditory cues that were perceived in a real environment by stationary blind individuals. It also aimed to examine how auditory cues enhance the cognitive maps of blind individuals.
ExperimentTo this end, an experiment consisted of two tests was carried out. In the first test, the relation between the perceived sound cues and the landscape of a given area was examined. The first test aimed to (a) introduce a methodology for the recording and analysis of the auditory cues perceived by blind individuals in the real world, (b) record and analyze the auditory cues perceived by blind individuals, and (c) investigate how the perceived auditory cues can be linked to the spatial changes and represent the landscape. The first test concerned the recording of the perceived sound cues in six outdoor locations (L1–L6) of a university campus, in three different time periods (different days and hours) and with different participants. The second test investigated how blind individuals can use auditory cues to create cognitive maps. In particular, the second test concerned the participants’ cognitive maps for the same six locations of the first test. Participants provided verbal descriptions of the area immediately after the end of the first test.
The experiment took place in three different time periods: on three different days, at different hours of the day and with three different groups of participants. The first time it took place in the afternoon (16:30-18:30) with three participants (see Table 1, participants 1, 2 and 3). The second time it took place in the morning (10:00-12:30) with three other participants (participants 4, 5 and 6). The third time it took place in the afternoon (14:30-17:00) of a bank holiday with five participants (participants 7, 8, 9, 10 and 11). Before the start of the experiment full instructions were given to the participants, and they were given a warm-up period of five minutes to familiarize themselves with the process.
169
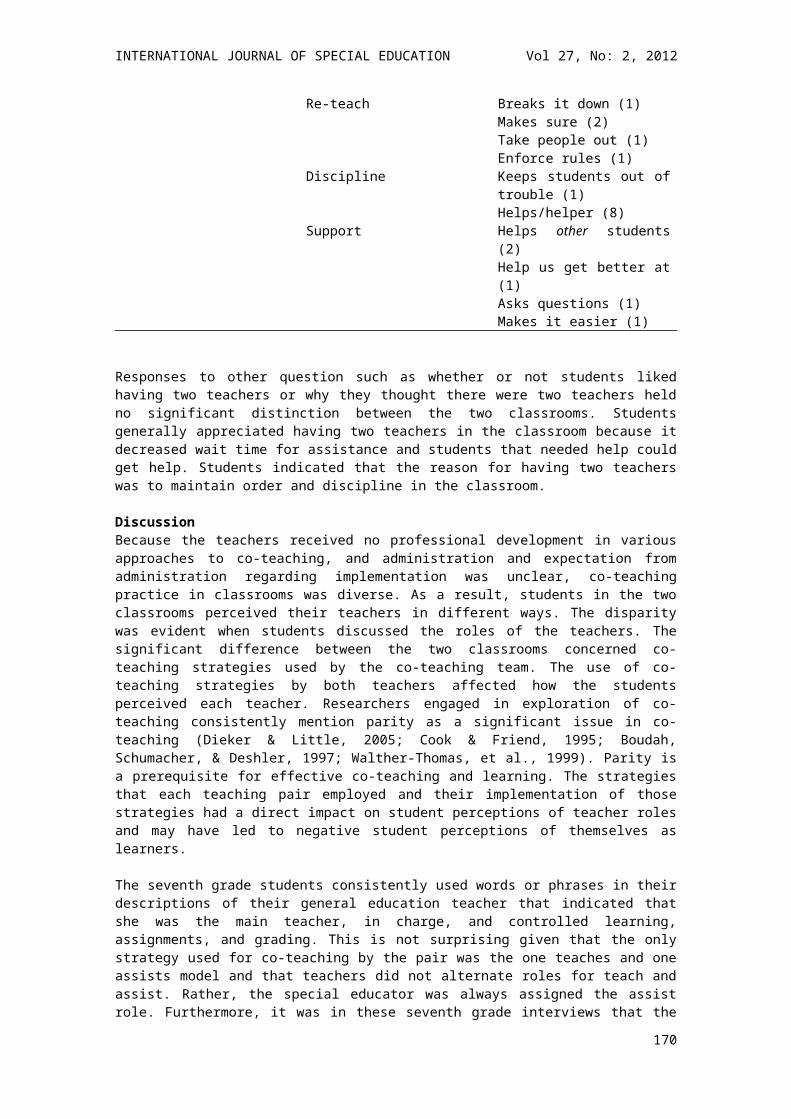
INTERNATIONAL JOURNAL OF SPECIAL EDUCATION Vol 27, No: 2, 2012
The area was selected because it offers a non-threatening urban environment (in contrast with other central parts of the city). University staff, students and visitors are continually to be found there – some on foot, others using cars or motorcycles. At the same time, since the campus forms part of the general city centre area, it is surrounded by streets with relatively heavy vehicular traffic. All the above, in combination with a few green areas (trees and small parks) and a small population of animals (birds, stray dogs), make up an urban area rich in auditory cues.
ParticipantsIn the present study, the ethical principles of the Declaration of Helsinki have been followed. In addition, consent was obtained from the subjects on the appropriate forms and according to the procedure suggested by the World Medical Association (World Medical Association, 2010). The research sample consisted of eleven individuals with blindness (nine totally blind and two legally blind), seven men and four women, aged 21 to 40 (M = 29). Of the eleven participants, seven had lost their sight after the age of six and four by the age of six (see Table 1). Most of the participants (seven) stated that they always moved around alone (independently), whereas four stated that they sometimes went out alone, sometimes with a guide. None of the participants was familiar with the study area.
Table 1. Demographic Data of the ParticipantsParticipant Gender Age Age at onset Vision status Ability to move around
independently1 Male 35 21 Blind Alone 2 Male 21 17 Severe V.I. Alone3 Male 24 15 Blind Alone4 Male 40 10 Blind Sometimes alone, sometimes
with a sighted guide 5 Male 28 1 Blind Alone6 Female 26 6 Blind Alone7 female 30 6 Blind Sometimes alone, sometimes
with a sighted guide8 female 40 12 Blind Alone9 male 25 0 Blind Sometimes alone, sometimes
with a sighted guide10 female 29 11 Blind Sometimes alone, sometimes
with a sighted guide11 male 21 7 Severe V.I. Alone
First testProceduresThe participants remained stationary in predetermined positions in each one of the six locations. By having stationary participants we tried to avoid informational stimuli coming from other senses. For example, if participants were walking they would have access to haptic and kinesthetic information. Each participant was asked to report, for a time period of seven minutes, the auditory cues he or she could hear. In addition, participants were asked to state in respect of each cue whether it fell within the category of foreground (a sound which was linked directly with the recording location) or background (a sound which described the auditory scenery). The participants were also expected to report each recurrence of the same auditory cue throughout the whole period. In other words, the participants were asked to report everything they could hear. Reports of each participant were recorded in a recording device (Philips Voice Tracer 7880). During this procedure, the participants (n = 2) who were legally blind and had some remaining vision were blindfolded.
In order to locate the participants in the field, two factors were taken into consideration: (a) participants had to be placed at close distance in order to avoid differences in the perceived auditory cues, (b) participants had to be at a certain distance to prevent each participant from hearing the responses of other participants. Taking into account these parameters, the participants were placed so that each participant was five meters away from the others. This is a relatively small distance which did not cause unusual differentiations in the soundscape, and at the same time did not allow the participants to listen to each other's responses.
170
INTERNATIONAL JOURNAL OF SPECIAL EDUCATION Vol 27, No: 2, 2012
As previously stated, the aim of the first test was to record the auditory cues that were perceived by the participants in the study area and then to link these cues with the landscape of the area. For that reason, the study was carried out in six different locations and on three different days and at three different times because the soundscape of each area changes according to time and space (Kang & Servigne, 1999). The study was conducted with different blind participants each day in order to minimize the influence of their individual characteristics. If the experiment had been carried out on only one day and with one group of participants it is very likely that some sound cues would not have been recorded or they would have been recorded with a non-representative number of occurrences. Therefore, no broad description of the auditory cues that are representative of the study area would have been obtained. Moreover, it was decided that the participants should remain stationary during the experiment to avoid receiving a wealth of proprioceptive information (Pick, 1980). Data analysisThe authors listened to the data recorded in the field (reports of each participant) and transferred it in suitably formatted inventory form (Figure 1). Sixty six inventory forms were completed; one form per person at each recording location. In this form the auditory cues were recorded together with the time at which they were heard. As shown in Figure 1, the form wais divided into spaces of 15 seconds. Each one of these spaces was used to write down the auditory cues reported by each participant in this time period. This method was followed because it allowed the calculation of the duration of each cue so that it could be included in the calculation of the variable occurrences. For instance, say an observer identifies the sound of a bird, occurring at time-point 1’25” and lasting until time-point 2’35”. In this case, the specific auditory cue appears on the recording form in six different intervals of 15”, and thus the occurrences of the bird sound are equal to six.
Figure 1. Inventory Form. At any particular moment the sound cues are noted, with their intensity and their classification as background or foreground.
The content of each form was transferred to digital form in MS Excel. The entire range of auditory cues recorded – by all observers, at all locations and times – was used to create a list of cues, which were those perceived by the observers forming the soundscape in the study area. To investigate how the perceived auditory cues were linked to the spatial changes and represented the landscape three parameters were calculated: (1) the total sum of occurrences of each sound cue, (2) the number of the participants who perceived each auditory cue, and (3) the total sum of occurrences of specific categories of auditory cues. These parameters were calculated separately for each location.
To calculate the third parameter, three separate categories of auditory cues were created. This categorization was based on the origin of the sound and its relation to basic spatial features (streets, parks, buildings, etc.). Auditory cues were classified into five categories: (a) anthropogenic-mechanical (car, motorbike, bus, etc.), (b) anthropogenic-human (people talking, footsteps, laughing, etc.), (c) anthropogenic-indicators (alarm, siren, bell, banging, etc.), (d) nature-biological (birds, dogs barking, etc.) and nature-geophysical (fountain, air, etc.). This categorization is based on a synthesis of the categorization of Schafer (1994) and those of other researchers such as Gage, Ummadi, Shortridge, Qi and Jella (2004), Matsinos et al. (2008) and Napoletano (2004). Anthropogenic refers to auditory cues produced by human activities and artifacts (e.g. engineering works, traffic noise), biological includes all sound-producing organisms (e.g. insects, birds, dogs) and geophysical refers to sounds emitted by any kind of natural phenomenon (Matsinos et al., 2008).
171
INTERNATIONAL JOURNAL OF SPECIAL EDUCATION Vol 27, No: 2, 2012
Sounds were also classified, in line with the responses of the participants, as background or foreground sounds. The foreground sounds refer to those produced instantly near the sampling site (e.g. dog, car, etc.) whereas the background sounds refer to those produced far from the sampling site and originating from the whole surrounding landscape (e.g. traffic noise). The distinction between background and foreground sounds reflects different priorities of the acoustic environment (Mazaris, Kallimanis, Hatzigiannidis, Papadimitriou, & Pantis, 2009).
ResultsFor each observer and location, the occurrences of each auditory cue were calculated. For example, during the seven minutes of the recording period if one observer identified the sound of a car, occurring at time-point 1’35” and lasting until time-point 2’25’’, he then identified a new car sound occurring at 4’50” and lasting until time-point 5’10’’. In this case, if the observer reports the sound of the car he hears, then on the recording form the specific sound cue appears in six (4+2) different intervals of 15”, and thus the number of occurrences of the car sound is equal to six.Based on the variable occurrences, the variable total occurrences of each auditory cue for each location was calculated for all the participants (for all three days) from the summation of the scores of the variable occurrences of all 11 participants (see Table 2). Therefore, the score of the variable total occurrences does not represent the occurrences of each auditory cue. The variable total occurrences is an index of the frequency of appearance of each auditory cue in each location without being affected by the subjectivity of the observers. This is important since it has been well established that subjectivity affects the perception of auditory cues (Raimbault & Dubois, 2005).
Table 2. Total Occurrences of Each Sound Cue in Each Location (all participants – three days)Sound cues L 1 L 2 L 3 L 4 L 5 L 6Car 45 70 57 47 17 41Motorcycle 32 23 37 54 16 42Bus 7 2 6Car horn 9 7 10 2 5 11Car brakes 4 1 4Bicycle 7People talking 40 77 37 65 83 63Footsteps 67 40 58 29 92 68Coughing 1 3 2Sneezing 1Laughing 3 1 4 1 2Whistling 2Sound of door opening/closing 1 2 16 8Mobile phone ringing 2 3 6Keys 3 1 4 2 1Cart 2Lighter 1Locking/unlocking of car door 1 1Banging 2 6 4 14 2 1Alarm 3 3 1A metallic sound 1 2 1 4 1Something breaking 2Siren 1Music 2 2Engineering works 2Bell 1Car flash 6Birds 20 46 34 16 24 23Dogs (barking) 21 17 18 4 2 18Dogs (walking) 1 1Rustling of the leaves 5
Furthermore, the number of participants who reported each auditory cue was separately calculated for each location. For example, we calculated how many participants reported that they heard the sound car, regardless of how many times they heard this sound. This calculation was done for the entire sample for
172
INTERNATIONAL JOURNAL OF SPECIAL EDUCATION Vol 27, No: 2, 2012
all three days (see Table 3). This index reveals which auditory cues are dominant in each location, which are the ones reported by the majority of the participants.
The analysis revealed that a number of auditory cues (see Table 2) were perceived in all the locations (i.e. car, motorcycle, car horn, people talking, footsteps, banging, birds, dogs). This finding may indicate that these auditory cues were those which characterize the study area. They are the cues one would expect to hear at any location in the study area. Moreover, auditory cues such as car, motorcycle, footsteps, people talking, and birds were reported by many participants in each location (see Table 3). It is obvious that the specific cues are of particular value for this group of observers (blind individuals) and, moreover, are those which define the identity of the location’s soundscape.
Table 3. Number of the Participants Who Perceived Each Sound Cue of the List in Each Location (all participants – three days)
Location 1 Location 2 Location 3Footsteps 11People talking 10Car 9Motorcycle 9Car horn 6Birds 5Dog (barking) 4Alarm 3Bus 3Banging 2A metallic sound 1Keys 1Rustling of the leaves1Something breaking 1Sound of door opening/closing1
Car 11People talking 11Birds 9Footsteps 9Motorcycle 8Car horn 5Engineering works 4Banging 3Dog (barking) 3 Mobile phone ringing 2A metallic sound 1Cart 1Coughing 1Keys 1Sound of door opening/closing1
Car 10Motorcycle 10Footsteps 9People talking 8Birds 7Car horn 3Dog (barking) 3Banging 2Engineering works 2Keys 2Alarm 1Laughing 1Music 1Siren 1Whistling 1
Location 4 Location 5 Location 6
Motorcycle 11People talking 10Car 8Birds 7Footsteps 7Sound of door opening/closing 6Banging 5Car brakes 3Car horn 3Coughing 3Mobile phone ringing 3Dog (barking) 2A metallic sound 1Alarm 1Bus 1Car flash 1Dog (walking) 1Keys 1Laughing 1Lighter 1Locking/unlocking of car door 1
Footsteps 11People talking 11Car 8Birds 7Motorcycle 7Bicycle 5Car horn 4Mobile phone ringing 4Coughing 2Sound of door opening/closing 2A metallic sound 1Banging 1Bell 1Car brakes 1Dog (barking)1Dog (walking) 1Engineering works 1Keys 1Laughing 1Music 1
People talking 11Car 10Motorcycle 10Dog (barking) 9 Footsteps 9Car horn 8Birds 7Car brakes 3Bus 2Laughing 2A metallic sound 1Banging 1Keys 1Sneezing 1
173
INTERNATIONAL JOURNAL OF SPECIAL EDUCATION Vol 27, No: 2, 2012
It is also worth looking a little more deeply at the results, attempting to link the characteristics of the area with the auditory cues which are dominant in each location. Thus, it can be said that this is an area relatively frequently traversed by pedestrians (footsteps, speech). There must be trees, green areas or small parks (birdsong and barking). In the surrounding area there must be a road or roads with heavy traffic (street noise in background). The phrase in the surrounding area was used, because if a busy road passed right through the study area itself it would be difficult to identify, easily and with high frequency, the various other isolated sounds, which would be drowned out by the noise of the road. Also, within the study area there must be some lightly used roads, which is why the participants pointed to car and motorcycle noises among the foreground sounds.
Apart from the sounds that appear in the study area and define its landscape, if sounds in each location are examined separately, additional relations between auditory cues and landscape of each location can be determined. For example, in locations 1, 4, and 6, the auditory cue bus has been reported, which means that there is a street which has bus lanes. This, together with other information and previous knowledge regarding the city’s bus lanes, can help the listener to determine which street it is. In location 4 particularly, but also in location 5, there was an increased occurrence of the auditory cue door opening/closing, which referred to the presence of buildings close to the location. In locations 2 and 3 in the park the occurrences of the auditory cue birds increased. In locations 4 and 5, where there are more buildings but no large open spaces and the occurrence of the auditory cue dogs barking increased.
Based on the categorization described above (see Data Analysis section) we found four categories of foreground auditory cues (anthropogenic-mechanical, anthropogenic-human, anthropogenic-indicators and nature-biological) and four categories of background auditory cues (anthropogenic-mechanical, anthropogenic-human, nature-biological and nature-geophysical). For each location (L1 to L6) and each of the categories the total sum of occurrences of auditory cues for foreground and background separately calculated was derived by adding the occurrences of the individual auditory cues recognized by each observer (see Table 4).
Table 4. The Total Sum of Occurrences of Sound Cues for Foreground and Background for Each Location and Each of the Categories
Foreground categories Background categoriesL1 L2 L3 L4 L5 L6 L1 L2 L3 L4 L5 L6
Nature (geo) 266 0 0 0 0 240Nature (biol) 46 63 52 21 27 41 130 123 200 145 123 81Anthropogenic (h) 111 128 104 124 193 135 0 28 0 50 35 0
Anthropogenic (m) 93 100 104 109 46 104 136 172 211 196 255 238
Anthropogenic (i) 8 8 10 22 9 2
Furthermore, bar-charts which represented the contribution of each category to a total soundscape of each location were created (see Figures 2 and 3). These bar-charts were created to facilitate the examination of the degree to which the perceived soundscape of blind participants is related to the landscape of the area and the spatial changes of the auditory cues in it.
174
INTERNATIONAL JOURNAL OF SPECIAL EDUCATION Vol 27, No: 2, 2012
Figure 2. The Contribution of Each Category to a Total Soundscape of Each Location (foreground).
Figure 3. The Contribution of Each Category to a Total Soundscape of Each Location (background).
It is noteworthy that no nature-geophysical sounds were listed in the foreground categories and no anthropogenic-indicator sounds were listed in the background categories. In the foreground categories, anthropogenic-mechanical and anthropogenic-human auditory cues contribute more to the soundscape of each location. In the background categories, anthropogenic-mechanical sounds together with nature-biological sounds contribute more to the soundscape of the area. Interestingly, nature-geophysical sounds contribute only to the soundscape of two locations (L1 and L6). This could be directly linked to the presence of a fountain close to L1 and L6. These findings are related to the nature of the specific study area (see Experiment section). For instance, if a large park had been chosen as a setting for the experiment, or some location in the countryside, the results would obviously have been entirely different.
The examination of the bar-chart with categories of foreground auditory cues (Figure 2) shows that more nature-biological auditory cues appear in locations 2 and 3 in the park with green areas and trees. More
175
INTERNATIONAL JOURNAL OF SPECIAL EDUCATION Vol 27, No: 2, 2012
anthropogenic-human auditory cues appear in location 5, which is close to buildings and university services (e.g. administration buildings) and it is also a central passage to other areas and buildings. Moreover, in location 5 many fewer anthropogenic-mechanical auditory cues occur, since there are no main streets nearby. In location 4 many more anthropogenic-indicators appear, since the location is close to a car park, and entrances to university buildings (e.g. administration buildings). Anthropogenic-human auditory cues are fewer in number in location 3 since this is in a park which has pathways for pedestrians. Location 2 is also in the park, but it is on the edge of the park and very close to it there are several entrances to buildings. Hence, there are more anthropogenic-human sound cues than in location 3.
The examination of the bar-chart with the categories of background auditory cues (Figure 3) reveals that more nature-biological auditory cues occur in location 3, which is in the park and is surrounded by trees (birds singing). Moreover, fewer nature-biological auditory cues occur in location 6, where nature-geophysical and anthropogenic-mechanical cues are predominant. This can be explained by the fact that there is a fountain close to location 6 and main streets in the broader area around the location. More anthropogenic-human sounds occur in locations 2, 4 and 5 which are near to areas with a number of pedestrian crossings. In location 5 more anthropogenic-mechanical auditory cues appear because there is a main street in the broader area around the location.
Second testProceduresIn the second test the participants were asked to describe the components of the area around each location. They were asked to give descriptions based on the sounds that they could hear in each location. That is, the second test took place in each one of the six locations separately, immediately after the completion of the first test. In effect, it is a process investigating the cognitive maps created by the participants through their sense of hearing. The participants were asked to include in their descriptions basic spatial components such as streets (with light or heavy traffic), parks, squares, buildings, pathways, etc.
Data analysisOne of the authors, who had extensive experience in qualitative research, transcribed the verbal descriptions. Then a list was created containing all the relations between the auditory cues and the elements of the cognitive maps for all participants and all six locations. Examples of such relations include birds with parks, cars with streets, people talking on footpaths, etc. Furthermore, the descriptions enabled sketch maps to be created for the areas around the six locations. These sketch maps represented the cognitive maps of the participants for the areas around the six locations. Figure 4 shows an example of a sketch map. Six sketch maps were created for each participant, making 66 in total.
Figure 4. Example of a Sketch Map for Location 1.
176
INTERNATIONAL JOURNAL OF SPECIAL EDUCATION Vol 27, No: 2, 2012
The way in which the components of each sketch map fitted the actual spatial components of the area was examined. This comparison was done by using a map of the area (Figure 5) in which information provided by the authors was added during field observations.
Results The analysis revealed that the cognitive maps of the participants contained information about principal spatial features, such as streets, buildings, parks, green areas, car parking, etc. In addition, there was more detailed spatial information on such features as footpaths, trees, steps, benches, fountains, etc. The analysis of the participants’ cognitive maps also revealed self-to-object and object-to-object spatial relationships in the study area. For example: Behind me there are steps…on the left of steps there are some trees. Below are several examples of the relationship between auditory cues and components of the landscape. This is a park, I can tell from the continuous bird singing. There are some people who talk and walk but the noise from the street comes from a long distance (location 2).There should be many benches since I can hear people talking but I can’t hear any footstep (location 5).I can hear the noise from a main street but it’s definitely quite far from here (location 5).On the right there is probably a footpath because I heard some people who were passing by a couple of minutes age (location 3).I think that here the area is not so ‘green’ as in the previous locations because I can’t hear birds singing (location 4).I heard a door opening and closing. The sound came from in front of me but on so I can assume that there is a building somewhere there (location 5).I can’t hear clearly the street traffic coming from behind me. There are probably some trees or buildings that block this sound (location 1).
Figure 5. Map of the Study Area.
ConclusionThe study presented here sought to explore the role of auditory cues in the spatial knowledge of stationary blind individuals by examining the relation between the perceived auditory cues and the landscape of a given area and investigating how blind individuals use auditory cues to create cognitive maps. The findings of the study reveal that several auditory cues characterize the study area and are linked to spatial features. Auditory cues such as car, motorcycle, footsteps, people talking, and birds were reported by many participants in each location. These specific auditory cues are of particular value for the group of blind listeners and, moreover, are those which define the identity of the soundscape in
177
INTERNATIONAL JOURNAL OF SPECIAL EDUCATION Vol 27, No: 2, 2012
the study area. In addition, by using auditory cues coming from different sources the participants associated the soundscape with the structural and spatial configuration of the landscape.
It is important to highlight the fact that the participants remained stationary during the testing procedure. By not moving, the participants did not have the opportunity to gather valuable information deriving from their interaction with the environment. Moreover, the results indicate that through their sense of hearing, blind individuals create cognitive maps, which include varied spatial information and spatial relationships within it. The participants linked auditory cues with specific spatial features, such as streets, buildings, parks, green areas, car parkings, and footpaths and reported an understanding of self-to- object and object-to-object relationships.
The findings of the study can be used to inform the development of orientation and mobility aids for individuals with visual impairments. It is well established that tactile maps significantly help individuals with visual impairment to gain spatial knowledge (Espinoza, Ungar, Ochaita, Blades, & Spencer, 1998; Ungar, 2000). The use of new technologies, such as the touch tablet, provides the opportunity for presenting tactile and auditory information simultaneously to individuals with visual impairments (Wells & Landau, 2003). Touch tablets also offer access to the benefits of tactile maps and auditory recordings (Papadopoulos, Koutsoklenis, & Chatzigiannakoglou, 2010). Such an application could help individuals with visual impairments to familiarize themselves with unknown areas, to learn routes on these areas and to be aware of the important spatial features such as landmarks, nodes, districts and edges. Regarding familiar areas, the combined use of tactile maps and soundscape recordings could help individuals with visual impairments to update their cognitive maps and learn new routes before deciding to navigate within these areas. The results could also enhance training in orientation and mobility skills that involves the use of recorded sounds for improving the auditory skills of individuals with visual impairments.
LimitationsOne limitation of the present study is the relatively small number of participants. However, given the nature of the specific experiment, and the structure of the tests used (all participants had to be in a specific position, and relatively close to one another), it would not have been possible to make the sample used much larger. One other drawback is that the probable impact of individual differences within participants cannot be established. For example, it would be very interesting to establish the impact of a person’s age at the time of loss of sight and to identify any gender-related differentiations within the sample. Moreover, since the senses of touch and olfaction were not masked, the possible contribution of haptic cues (e.g. the feeling of wind) and olfactory cues (e.g. smell of flowers) in the cognitive maps of the participants cannot be established in the present study. Finally, given that the authors were familiar with the locales, the procedure of sketch mapping was open to unintentional bias.
ReferencesAshmead, D. H., Wall, R. S., Eaton, S. B., Ebinger, K. A., Snook-Hill, M. M., Guth, D. A., & Yang, X. (1998). Echolocation reconsidered: Using spatial variations in the ambient sound field to guide locomotion. Journal of Visual Impairment and Blindness, 92, 615-632.Blauert, J. (1997). Spatial hearing: The psychophysics of human sound localization (Rev. Ed.). Cambridge: MIT Press.Blumsack, J. T. (2003). Audiological assessment, rehabilitation, and spatial hearing considerations associated with visual impairment in adults: an overview. American Journal of Audiology, 12, 76-83.Carles, J. L., Barrio, I. L., & de Lucio, J. V. (1999). Sound influence on landscape values. Landscape and Urban Planning, 43, 191-200. Dubois, D., Guastavino, C., & Raimbault, M. (2006). A cognitive approach to urban soundscapes: using verbal data to access everyday life auditory categories. Acta Acustica united with Acustica, 92, 865-874.Espinoza, M. A., Ungar, S., Ochaita, E., Blades, M., & Spencer, C. (1998). Comparing methods for introducing blind and visually impaired people to unfamiliar urban environments. Journal of Environmental Psychology, 18, 277-287.Gage, S., Ummadi, P., Shortridge, A., Qi, J., & Jella, P. (2004). Using GIS to develop a network of acoustic environmental sensors. ESRI International Conference. 9-13 August, San Diego, CA. Gardiner, A., & Perkins, C. (2005). ‘It’s a sort of echo. . .’: Sensory perception of the environment as an aid to tactile map design. The British Journal of Visual Impairment, 23, 84-91.Gaver, W. W. (1993). How do we hear in the world?: Explorations in ecological acoustics. Ecological Psychology, 5, 285-313.Gibson, J. J. (1966). The senses considered as perceptual systems. Boston: Houghton Mifflin.
178
INTERNATIONAL JOURNAL OF SPECIAL EDUCATION Vol 27, No: 2, 2012
Golledge, R. (1993). Geography and the disabled: a survey with special reference to vision impaired and blind populations. Transactions of the Institute of British Geographers, 18, 63-85.Hirsh, I. J., & Watson, C. S. (1996). Auditory psychophysics and perception. Annual Review of Psychology, 47, 461-484.Jacobson, R. D. (1998). Cognitive mapping without sight: four preliminary studies of spatial learning. Journal of Environmental Psychology, 18, 289-305.Jacobson, W. H. (1993). The art and science of teaching orientation and mobility to persons with visual impairments. New York, NY: American Foundation for the Blind.Jansson, G. (2000). Spatial orientation and mobility of people with visual impairment. In B. Silverstone, M. A. Lang, B. Rosenthal, & E. E. Faye (Eds.), The Lighthouse handbook on visual impairment and vision rehabilitation (Vol. 1) (pp. 379-397). New York, NY: The Lighthouse and Oxford University Press.Kang, M. A., & Servigne, S. (1999). Animated cartography for urban soundscape information, CM-GIS ’99. Proceedings of the 7th International Symposium on Advances in Geographic Information Systems, November 2-6, Kansas City, USA.Kitchin, R. M. (1994). Cognitive maps: What are they and why study them? Journal of Environmental Psychology, 14, 1-19.Koutsoklenis, A., & Papadopoulos, K. (in press). Auditory cues used for wayfinding in urban environments by individuals with visual impairments. Journal of Visual Impairment & Blindness.Loomis, J. M., Klatzky, R. L., Golledge, R. G., Cicinelli, J. G., Pellegrino, J. W., & Fry, P. A. (1993). Nonvisual navigation by blind and sighted: Assessment of path integration ability. Journal of Experimental Psychology: General, 122, 73-91.Matlin, M. W., & Foley, H. J. (1992). Sensation and perception. London: Allyn and Bacon.Matsinos, Y. G., Mazaris, A. D., Papadimitriou, K. D., Mniestris, A., Hatzigiannidis, G., Maioglou, D., & Pantis, J. D. (2008). Spatio-temporal variability in human and natural sounds in a rural soundscape. Landscape Ecology, 23, 945-959.Mazaris, A. D., Kallimanis, A., Hatzigiannidis, G., Papadimitriou, K., & Pantis, J. (2009). Spatiotemporal analysis of an acoustic environment: interactions between landscape features and sounds. Landscape Ecology, 24, 817-831.Napoletano, B. (2004). Measurement, quantification, and interpretation of acoustic signals within an ecological context [Master's thesis]. Department of Zoology, East Lansing, Michigan State University.Papadopoulos, K., Koutsoklenis, A., & Chatzigiannakoglou, P. (2010). Using soundscape recordings in audio-haptic maps to enhance the spatial knowledge of individuals with visual impairments. 5th ICEVI Balkan Conference, New Competencies for Future Challenges in Europe, October 20-24, 2010, Zagreb, Croatia.Penrod, W. M., & Petrosko, J. (2003). Spatial organization skills of the blind in large outdoor places, RE:view, 34, 155-164.Pheasant, R., Horoshenkov, K., & Watts, G. (2008). The acoustic and visual factors influencing the construction of tranquil space in urban and rural environments tranquil spaces quiet places? Journal of the Acoustic Society of America, 123, 1446–1457.Pick, H. L. (1980). Perception, locomotion and orientation. In R. L. Welsh, & B. B. Blasch (Eds.), Foundations of orientation and mobility (pp. 73-88). New York, NY: American Foundation for the Blind.Raimbault, M., & Dubois, D. (2005). Urban soundscapes: Experiences and knowledge. Cities, 22, 339-350.Schafer, R. M. (1977). The tuning of the world. New York, NY: Knopf.Schafer, R. M. (1994). The soundscape: Our sonic environment and the tuning of the world. Rochester, VT: Destiny Books.Sholl, M. J. (1996). From visual information to cognitive maps. In J. Portugali (Ed.), The construction of cognitive maps (pp. 157-168). Dordrecht: Kluwer.Truax, B. (1984). Acoustic communication. New Jersey: Ablex Publishing.Truax, B. (1999). Handbook for acoustic ecology. Burnaby, B.C.: Cambridge Street Records.Ungar, S. (2000). Cognitive mapping without visual experience. In R. Kitchin, & S. Freundschuh (Eds.), Cognitive mapping: Past, present and future (pp. 222-248). London: Routledge.Viollon, S., Lavandier, C., & Drake, C. (2002). Influence of visual settings on sound ratings in an urban environment, Applied Acoustics, 63, 493-511. Watts, G., Chinn, L. & Godfrey, N. (1999). The effects of vegetation on the perception of traffic noise, Applied Acoustics, 56, 39-56. Wells, L. R., & Landau, S. (2003). Merging of tactile sensory input and audio data by means of the talking tactile tablet. Proceedings of Eurohaptics 2003, Dublin, Ireland.
179
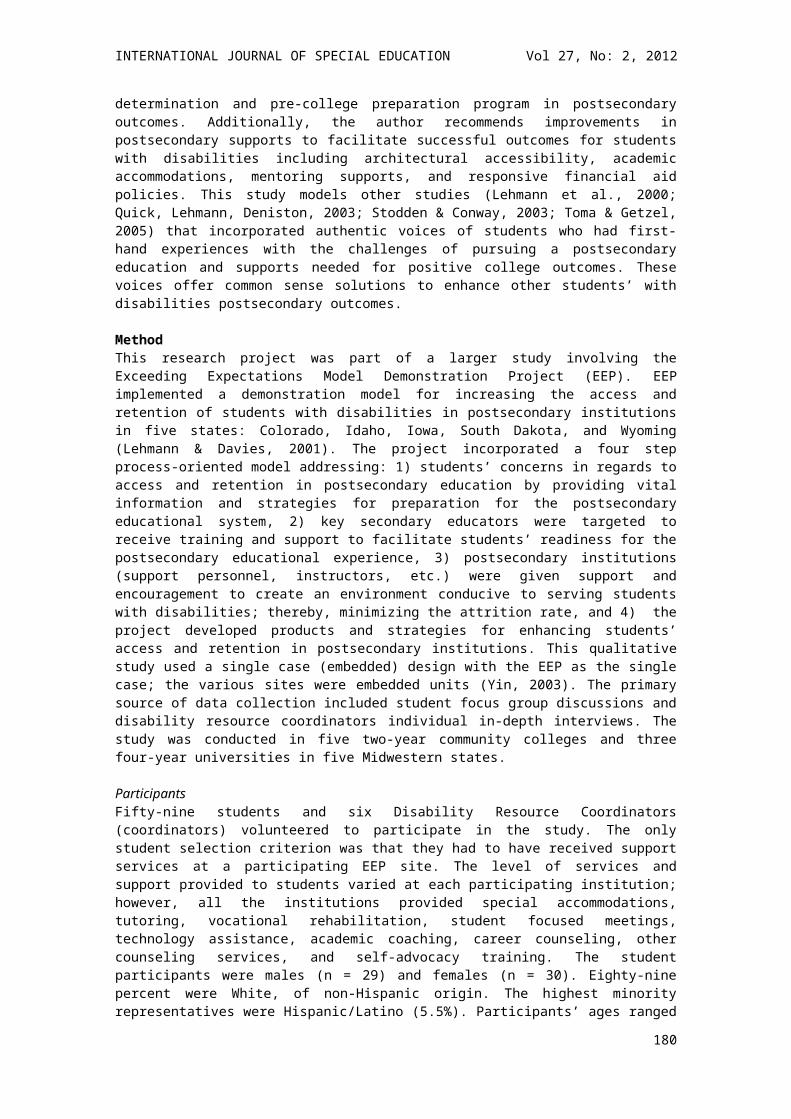
INTERNATIONAL JOURNAL OF SPECIAL EDUCATION Vol 27, No: 2, 2012
Wheeler, L. C., Floyd, K., & Griffin, H. C. (1997). Spatial organization in blind children. RE:view, 28, 177-181. World Medical Association (2010). WMA Declaration of Helsinki - Ethical principles for medical research involving human subjects. Retrieved from http://www.wma.net/en/30publications/10policies/ b3/index.html.Wrightson, K. (2000). An introduction to acoustic ecology. Soundscape: The Journal of Acoustic Ecology, 1, 10-13.
TOWARDS A FRAMEWORK FOR UNDERSTANDING THE PROCESS OF EDUCATING THE ‘SPECIAL’ IN SPECIAL EDUCATION
Rune Sarromaa HausstätterSteven Connolley
Lillehammer University College
This article addresses the debate between traditionalism and inclusion within special education, and presents the argument that being disabled and having special needs are very real conditions, even though disabilities are socially constructed, and that teachers must respond to this reality. This article first presents a theoretical framework that provides an understanding of the processes that create the special student in special education. This article claims that this process is part of the technology of normalization, which plays an important role within special education. Secondly, we show how this understanding can be helpful for identifying the appropriate means of educating and supporting the ‘special’ student. By emphasizing the link to the practical field of special education, we can better see how we construct the ‘special’ in special education and how we can use this knowledge to select the most appropriate solutions for a person with special needs.
The area of special education has divided itself into roughly two camps, the traditionalists (Brantlinger, 1997) and the inclusionists. Each group claims to speak on behalf of the disabled person and to have the right descriptions and solutions for special education (e.g., Kaffmann & Sasso, 2006; Gallagher, 2006).
180
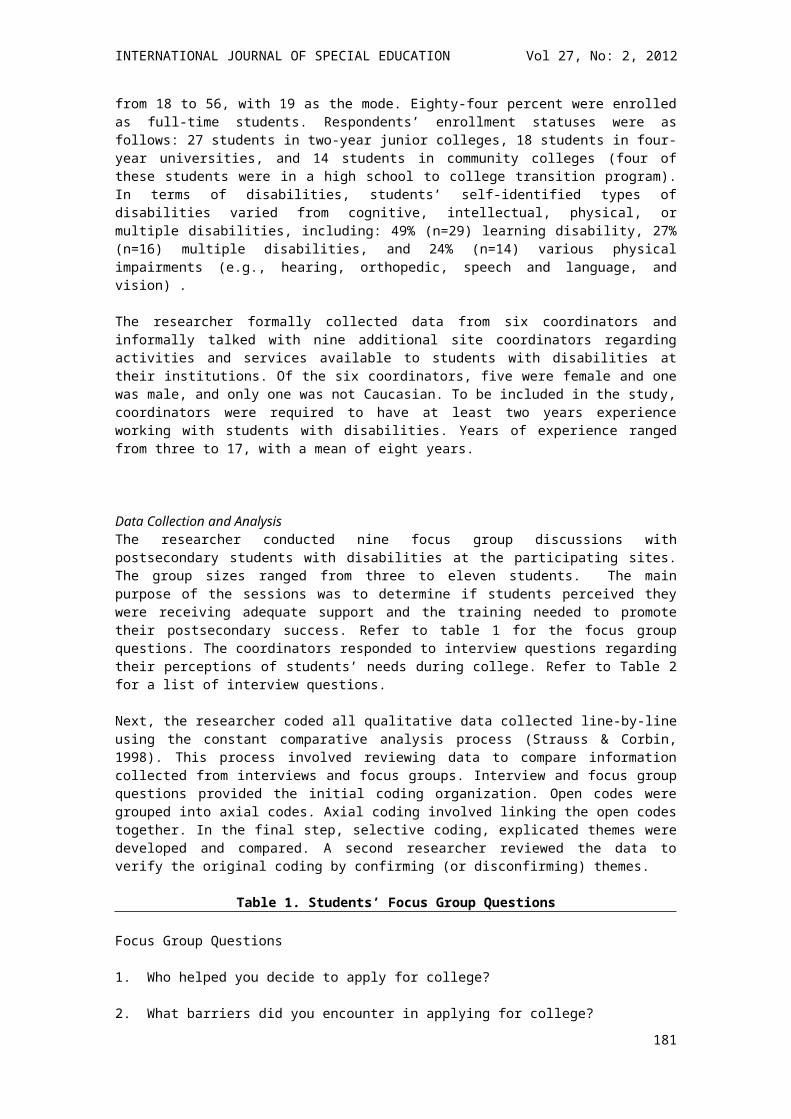
INTERNATIONAL JOURNAL OF SPECIAL EDUCATION Vol 27, No: 2, 2012
According to researchers, traditionalism and inclusionism are incompatible, and their understanding of disabilities very different (Hausstätter, 2007; Brantlinger, 1997; Danforth, 2004; Vehmas, 2008). As part of this debate, several different theoretical descriptions have appeared over the last two decades in order to lay a foundation for the operationalization of the different understandings of special education (e.g., Skrtic, 1991; Skidmore, 1996; Emanuelsson, Persson & Rosenqvist, 2001; Haug, 2003; Hausstätter, 2004).
At the centre of this debate are the questions about the role of special education in today’s school and society and whether disabilities are real and unchangeable or are socially constructed (e.g., Gallagher, 2001; Gallagher, Heshusius, Iano, & Skirtic, 2004; Kavale & Forsnes, 2000; Lipsy & Gardner, 1991; Mostert, Kavale & Kauffman, 2007; Vehmas & Mäkelä, 2008). This debate draws out the ethical challenges of education in general and special education in particular. The problem with this discussion, however, is that it seems to be ridden by traditionalist and inclusionist orthodoxies instead of being guided by pedagogical knowledge and ethics (Iano, 1990; Kavale & Mostert, 2004). This lack of pedagogical reflection results in a lack of a clear focus on the school and its obligation to prepare children for their adult years (Connolley & Hausstätter, 2009).
Much of the debate between traditionalism and inclusionism does not offer concrete solutions on how special education should be implemented. As emphasized by Hausstätter and Connolley (2007), a significant part of this debate should focus on the actual effects of special education in order to support or legitimize a given perspective. Yet it is challenging to identify what policies or measures are effective. Kavale and Mostert (2004) have noted that the field of special education is rife with examples of ideological and cultural positions that define the results of special education. Hausstätter and Connolley’s (2007) solution has been to establish a framework for defining the goal for special education outside of the field of special education itself by presenting the Salamanca Statement as an example. Hegarty (2001) has emphasized another possible goal of special education, namely, the core business of schooling: teaching young people to become responsible, productive members of society.
The core business of schooling forms the framework for the perspectives presented in this article. First, we shall present the theoretical framework that provides an understanding of the process of creating the special student in special education, which is aimed mainly for practitioners but can also be useful for researchers. Secondly; we shall show how this understanding can be helpful for identifying the appropriate means of educating and supporting the ‘special’ student. We claim that both traditionalism and inclusionism can offer important contributions to special education. The former has a well developed range of methodologies aimed at helping people with specific problems, and the latter has the emphasis on the social and ethical context of education.
The disabled as processThe distinction between impairments and disabilities is indispensable for emphasizing the role of education within special education (Vehmas & Mäkelä, 2008). Vehmas and Mäkelä (2008) have defined impairment in terms relating to physical properties: […] impairment is a class name for natural properties that, depending on the context, in part cause or constitute functional limitations – although the limiting implications of the property in question can in part be explained in social terms […]. Thus, impairment is a physical or organic phenomenon whose identification and definition are determined culturally and socially; it is inevitably about attaching some meaning to individual properties (p. 44). Disability, on the other hand, incorporates the social effects of impairment: Disability, however, is a relational phenomenon that consists in the relation between the natural properties or features on the one hand, and the surrounding social and physical world on the other. […] What distinguishes disability from impairment is that it can become dissociated from people’s physical conditions. Disability often involves very general social structures and mechanisms that cannot be reduced to people’s physical or mental characteristics (p. 44).
Vehmas and Mäkelä (2008) have described the connection between impairments and disabilities by drawing on John Searle’s philosophical work on the distinction between ‘brute’ and ‘institutional’ facts. Brute facts are ‘out there’ and ‘indifferent’ (Hacking, 2002), and they are neither dependent on a social structure for their existence nor change if they are an essential part of a social structure. In contrast, institutional facts are dependent on a social structure and its mechanisms in order for them to have any meaning for us. The statement, ‘Hans has one foot’, is a description of a brute fact, but the statement ‘Hans has only one foot’ is an institutional fact; the first does not imply any institutional evaluation of the situation Hans finds himself in, but the adverb ‘only’ of the second statement underlines the
181
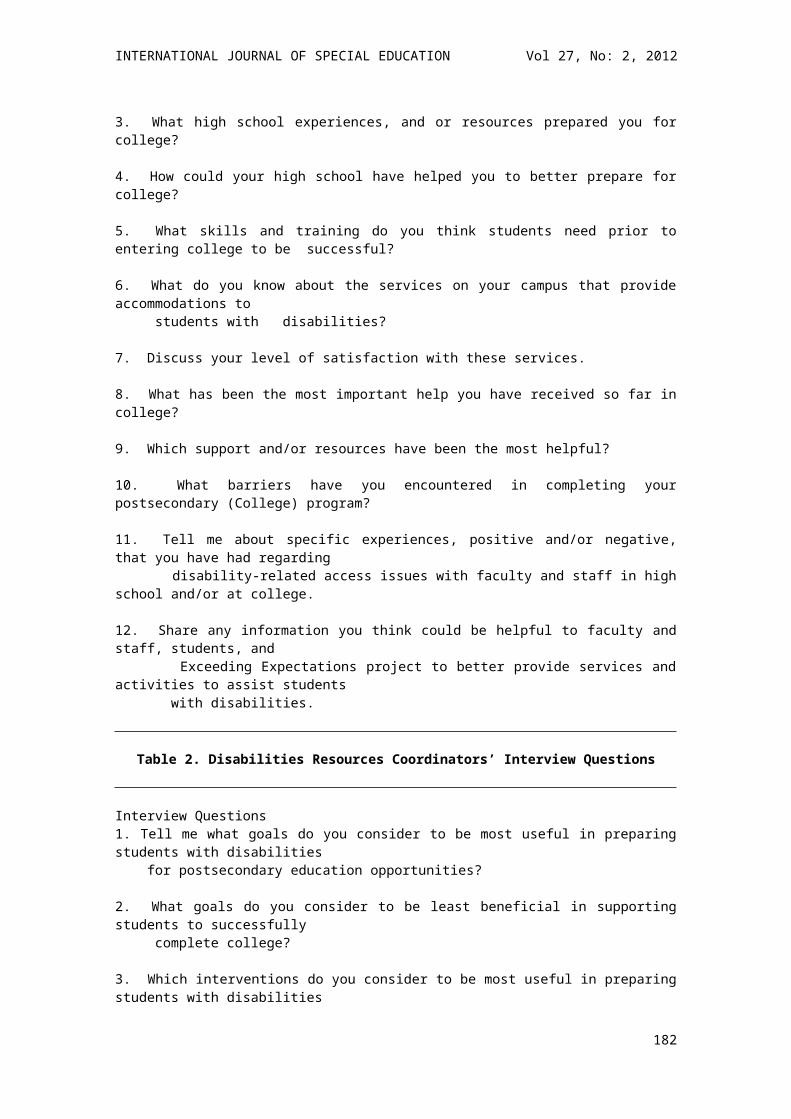
INTERNATIONAL JOURNAL OF SPECIAL EDUCATION Vol 27, No: 2, 2012
discrepancy between what we regard as normal in our society and Hans’s condition. Further, the statement, ‘Hans is disabled’, indicates an even greater institutionalization, for stating that someone is disabled might well lead to a change in this person’s perception of herself or himself. According to Hacking, these kinds of classifications are interactive: The inter may suggest the way in which the classification and the individual classified may interact, the way in which the actors may become self-aware as being classified in a certain way, if only because of being treated in institutionalized in a certain way, and so to experiencing themselves in that way (Hacking, 2002 p. 11).
Schools are social institutions that employ a series of mechanisms in order to teach people to become responsible, productive members of society. In other words, pupils in schools act in a social context, and their ability to succeed is also judged according to this context, hence the special need for education presents itself when we compare people to others acting in the same social context. It is, however, important to bear in mind that even though disabilities are socially constructed, the disability in itself is no less real, as some would claim within the full-inclusion debate (e.g., Gallagher, 2001). Michel Foucault’s works make it clear that we cannot deny the reality of our world, even if we admit that our world is socially constructed. Disabilities are thus real: feeling disabled is a real feeling and being a disabled person is a real way of being a person (Hacking, 2006). Furthermore, educating the disabled person is no less a real task and the goal of this kind of education must be to make this person more able, or less disabled, and more capable (Nussbaum, 2006). However, in the manner that inclusionism is critical to this reality, we can also be critical, not because we want to liberate all who are labelled disabled (Løvlie, 1992), but because we have an ethical responsibility to give everyone the same opportunities of schooling, work, safety, and other vital areas of one’s life (cf. Salamanca Statement).
Disabilities are constructed, but, as pointed out by Hacking (1999), simply to say that something is constructed is close to saying nothing. There are several accounts of the constructed disabled person as a product of our society, which are usually accompanied by arguments about how this is wrong and bad. The view of disabilities as a product is not, however, very helpful if we aim to understand and reduce the negative aspects of this construction and to increase the effectiveness of education. As Hacking (1999) emphasizes, it is also possible, and in this context necessary, to look at disabilities as a process whereby we look at how people become disabled in our society, or for our purposes, how we look at a child who is in need of special education. This approach means that we have to understand the actual process of construction, that is, the social mechanisms underlying statements of institutional facts.
The technology of normalization We argue that a central mechanism in the process of constructing a child in need of special education is located in the technology of normalization. A person is disabled because she or he is not able to do something according to a standard that is defined as normal. Normality and normalization are well established techniques within special education (e.g., Askheim, 2003; Osburn, 1998). Even if what is normal has historically been constructed in different ways, what we look at and accept as normal has always been an important feature of this field of knowledge (Foucault, 2001; Simons & Masschelein, 2005; Danforth, 2009). Although there are various models for understanding normality (e.g., Holst, 1978), we hold that the current technology of normalization arises out from three areas of normality: biological normality, statistical normality, and moral and social normality.
Biological, statistical, and moral and social notions of normality are involved in the construction of the disabled human being. In a Foucauldian framework, these techniques are part of a process where disabilities within special education are translated into socially constructed reality (Foucault, 2003b; Hausstätter, 2007). This process of construction involves the presence of learning problems through standards of normality with the support of other social and institutionalized mechanisms (table 1).
Table 1. Different Groups of NormalityType of normality Standard Important part of Support from Biological normality Biological entities Traditionalism MedicineStatistical normality Normal distribution Traditionalism Psychology Moral and social normality
Social norms and rules Inclusionism Ethics
Each of these groups of normality can process groups of people with learning disabilities. Yet it is important for the practitioners and researchers of special education to understand that these groups
182
INTERNATIONAL JOURNAL OF SPECIAL EDUCATION Vol 27, No: 2, 2012
express different kinds of problems and have different pedagogical solutions according to the construction of the problem. This link between how we use different techniques to define normality and different learning problems is, therefore, important for our understanding about the process of constructing disabilities and how special education can help disabled pupils become more able.
Biologically induced disabilitiesBiologically induced disabilities are closely connected to the concept of impairment and to the medical perspective in special education (Vehmas, 2004). Biological normality interprets the human being and her or his ability according to biological facts, such as the number of chromosomes, the use of two legs, being able to see or hear, and so on. The evaluation of this normality is absolute in the sense that the factors are analysed in relation to specific biological characteristics. One can, of course, have poor eyesight or a reduced ability to hear, but this evaluation is based on the brute fact that one cannot see or hear. Biological normality is thus one standard by which we can judge people and construct a number of disabilities in our society.
Nevertheless, the definition of a problem within the reference of biological normality requires caution because it can be all too easy to overlook the social context in which disabilities are experienced. As we have seen, the distinction between impairment and disability is important for understanding the technology of normalization. Impairment is a brute fact and is not dependent on a social system to exist. Blindness, deafness, and the lack of one leg are examples of impairments that present themselves through their contrast to biological normality. Regardless of these disabilities in light of biological normality, the social context in which they appear makes an enormous difference. A blind or a deaf person would have had problems with learning and living several thousand years ago, just like today, but such persons in most modern societies have greater opportunities to cope with these challenges. A mentally impaired child would perhaps not have survived two hundred years ago, and would likely have had fatal consequences. In modern societies, this is no longer the case. These problems are defined and supported within the medical perspective as pathological, and special education has developed strategies to educate people with such problems.
It is important to note, however, that many problems that we today consider as medical are not necessarily included in pedagogical debates about education. As emphasized by Vehmas and Mäkelä (2008), the medical perspective crosses the line between impairments and disabilities by naming the problems and giving them an institutional reference, such as a diagnosis. Furthermore, many medical diagnoses within special education today are not necessarily part of the process of biologically induced learning problems. Attention-Deficit Hyperactivity Disorder (ADHD), Asperger’s syndrome, and Tourette’s syndrome are medically defined problems, but these diagnoses depend heavily on institutional references and social mechanisms. Accordingly, we claim that such defined problems are not introduced into the process of creating the special-needs person in education by a biological frame of reference, but by another technology of normalization – the area of morality and social acceptance, to which we shall later turn.
Statistically induced disabilitiesThe field of special education has drawn much methodological support from quantitative approaches in psychology. Statistical measurements and the normal distribution are important mechanisms for identifying disabilities within this area. One well known example of the use of statistical normality is the Intelligence Quotient (IQ) score, where an individual score is related to a mean score of 100. The normal distribution curve, or bell curve, according to defined parameters, forms the basis for statistical normality. Unlike biological normality, statistical normality is not based on an absolute understanding of what is considered as normal for humans. Instead, statistical normality is relative to the population measured, to a given task, and to the scale of measurement. We can count the number of chromosomes in humans all over the world on the basis of one theory about the role of chromosomes, but we cannot formulate a universal reading test without taking into account cross-cultural differences and the challenges they present. Statistical normality is today used to identify learning problems in areas such as reading, writing, and mathematics. Most subject areas in schools can be arranged according to a statistical distribution in relation to variables such as age and gender. Even though statistical normality is culturally dependent, it is no less real. If it is normal, for instance, for a child in one country to manage to read at the age of seven, then it is not normal for a child not to be able to read at the age of nine. The normal distribution of reading abilities indicates that a nine-year-old child in this country is in need of special education because her or his ability to read falls below the standards presented by the normal distribution within this specific community. The statistical measurements of a given population thus play
183
INTERNATIONAL JOURNAL OF SPECIAL EDUCATION Vol 27, No: 2, 2012
a critical role the construction of individuals in need of special education. There may be, of course, biological reasons for a particular problem, but it is through the failure to meet certain standards of performance of such tasks as reading and writing that these problems come into existence.
Ethically and socially induced disabilitiesThe ethical component of special education is crucial, especially in relation to the debate between traditionalism and inclusionism. An ethical argument plays an important role in the establishment of inclusionism (Brantlinger, 2001; Danforth, 2004), and appears to be critical in the claims of superior morality: Special education appears to have drawn such a line between us and them over the question of inclusion. As Shanker (1994) pointed out, Some full inclusionists talk as though they are in a battle pitting the forces of morality against the forces of immorality (Kavale & Forness, 2000 p. 280).Traditionalists, of course, also engage in moral and ethical questions, and often accuse inclusioists of being driven more by a political stance than by scientific arguments (e.g., Mostert et al., 2007; Connolley & Hausstätter, 2009; Vehmas, 2008). This article does not seek to argue for either side, but instead aims to recognize the moral and ethical aspects that are integral to special education as a whole.
Moral judgement is essential for a sufficient understanding of special education because it is critical in the construction of the disabled person in society in general. Moral judgements are part of our social traditions and clearly influence how we judge people’s behaviour. Further, moral normality is important for the construction of the disabled person. There is an intimate relation between disabilities and moral and social acceptance (Foucault, 2001; Kirkebæk, 1993; Thuen, 2002). Let us consider the statement by a physician made in the early twentieth century: The social and economic burdens of uncomplicated feeblemindedness are only too well known. The feebleminded are a parasitic, predatory class, never capable of self-support or of managing their own affairs. The great majority ultimately become public charges in some form. They cause unutterable sorrow at home and are a menace and danger to the community. Feebleminded women are almost invariably immoral and… usually become carriers of venereal disease or give birth to children who are as defective as themselves… Every feebleminded person, especially the high-grade imbecile, is a potential criminal, needing only the proper environment and opportunity for the development and expression of his criminal tendencies. (Dr. Walter E. Fernald 1912, in Davies, 1959 p. 47-48)
While most of us do not accept these views today, we still judge whether a person is able or unable to follow certain rules and norms that we find morally acceptable within a social framework. If a person is not able to follow a given set of rules, she or he becomes a problem for the system presenting the rules (Hausstätter, 2006). If someone cannot abide by the rules laid down by schools, she or he can thus be constructed as a disabled person in need of special education. Beyond the school, such people might be defined as ‘mad’ and thence institutionalized, or as criminals and sent to prison (Foucault, 1979; 2003a). Moral and social normalization is, therefore, a fundamental important way that societies deal with the disabled person.
Likewise, conditions such as ADHD and Asperger’s syndrome are brought into reality through moral and social normality. Those who have social and behavioural problems reveal their problems within a social context based on moral judgements. In other words, social and behavioural problems are induced according to social and moral norms of acceptable behaviour. As both Foucault (2001) and Hacking (1995b) have pointed out, social surroundings change according to time and place, and the ways in which these kinds of problems are induced do so as well. Again, it could be that problems that we today define as emotional and behavioural are rooted in biological differences between humans; however, it is in the social context whether a given behavioural pattern is judged as problematic or not.
184
Topic and goal
Student
General learning
environment
Teacher
Evaluation
Activity
Relation
INTERNATIONAL JOURNAL OF SPECIAL EDUCATION Vol 27, No: 2, 2012
Figure 1. Aspects of Didactics (from Engelsen, 1990)
Focusing on Education Both general and special educationalists must take into account the general principles of didactics. The general learning environment, the teacher’s knowledge, the relation between the teacher and the student, and the evaluation of the educative process are aspects that seem to be universal in education (Engelsen, 1990) (figure 1). What is the ‘special’ for special education (in contrast to general education) is the student’s situation, and the themes and goals for this kind of education might differ from those of general education?
We can employ the description of how different learning problems come into existence according to different standards of normality in order to understand better the situation that practitioners find themselves in when planning and implementing special education. To begin with, practitioners can draw from an understanding of the process whereby a person becomes identified as having a disability to describe different learning problems that the student might experience. This knowledge can then be used to organize different strategies within special education in relation to the core business of education. It is important to note, however, that this understanding changes because the context continually changes. There is, then, the need for the ongoing development of new strategies. Table 2 summarizes the framework presented here, which practitioners can use to operationalize existing strategies (table 2).
Table 2 gives examples of biologically induced learning problems that are closely connected to the existence of impairment, and lists various strategies that have been developed within special education to meet these kinds of challenges. The main strategy for this group has been a focus on compensatory teaching and alternative learning goals. For example, a blind person can compensate by learning Braille and by using a guide dog, and a motor-impaired person can learn to drive a custom-built car. Through compensatory teaching, a student can learn how to use tools and alternative strategies in order to meet the general goals of education and thereby to be able to act as active citizens. In some cases the general learning goals require alterations, and the student may be offered an individualized educational plan. Severely mentally impaired students can, for example, have an educational plan that focuses on mastering some lower level of language competency and on learning to manage daily routines in order to lead a life that is as independent as possible.
Table 2: Types of Special Education According to Induced Problems
Normality Examples of induced problems Special education
Biological Auditory problemsVisual problems Speech problems Motor problems Asthma/allergy etc. Mental impairments
Compensatory teaching, i.e., learning to use equipment and alternative strategies in learning, e.g., wheelchair, guide dog, Braille, cochlear implant. Alternative learning goals for life-long learning, e.g., managing daily routines.
Statistical Academic problems, e.g., problems with reading and writing, mathematics
Extra academic training. Individual support and alternative strategies towards learning. Technological support.
Moral and social Social and behavioural problems Social training and environmental changes.
Statistically induced learning problems do not necessarily lead to changes in the goals of education. Such learning problems can be overcome with extra academic training within the ordinary educational system
185
INTERNATIONAL JOURNAL OF SPECIAL EDUCATION Vol 27, No: 2, 2012
or with extra pedagogical material or technological support. The ‘pull-out’ model where a small number of students receive extra support by special education outside of the normal classroom for a limited amount of time is used extensively by special education to teach students with academic problems. Another solution that seems to be developing is co-teaching, where special educational teachers take part in ordinary teaching as a way of supporting students with such problems. With respect to didactics (fig. 1), alternative activities are usually appropriate for statistically induced problems. However, in some cases, the academic challenges might be so severe that the time needed to learn academic skills far exceeds with time available at school, and consequently the goal of education requires some adjustment.
Social and behavioural problems come into existence through their departure from social norms, which are highly dependent on time and place. Time and place are, therefore, also important considerations when focusing on the education for students with such problems. Teaching students how to handle social regulations and rules is an established part of the special educational area. An important aspect of the theoretical framework for inclusion appears to be that the analysis and development of the general educational environment is critical for the identification of these problems (e.g., Overland, 2007). The acceptance that moral and social factors play an essential role for social and emotional problems entails an expansion of the role of special education. The augmented role that both schools and school policy in general play is thus also central to the special educational support for students with social and behavioural problems.
SummaryAt first glance, one might read Table 2 as a normative understanding of the direction of special education. Moreover, real-world experiences are, of course, not so clear-cut as this table. Rather, the point of this classification is that it can help to clarify the relationship between the processes that construct disabilities within special education and the educational support that special education usually offers. Further, the clarification of the different processes underlying the existence of various learning problems can guide the practitioner to plan and implement special education. We may also note that this framework combines certain aspects of traditionalism and inclusionism. An important point made by inclusionists is that the traditionalist approach often attributes the origin of the problem to the individual student, and that special education should concentrate efforts on the problem student (e.g., Gallagher, 2001). The inclusionist view rejects this practice because social and policy factors are essential for the existence of disabilities (e.g., Brantlinger, 1997; 2001; Smith & Gallagher, 2008). Similarly, this framework points to the difference between impairments and disabilities and how disabilities come to existence through different standards of normality. This distinction clearly acknowledges that disabilities are part of the social world, but are no less real for being so. Special education has to account for this fact, but this fact also implies that this field can and must work at different levels, both individually (i.e., the traditional view) and contextually (i.e., the inclusive view), but the focus on these levels might be dependent on what induces the problem and what special education can offer.
ReferencesBrantlinger, E. (1997). Using Ideology: Cases of Non recognition of the Politics of Research and Practice in Special Education. Review of Educational Research. 67(4), 425-59. Brantlinger, E. (2001). Poverty, Class, and Disability: A Historical, Social, and Political Perspective. Focus on Exceptional Children. 33(7), 1-19.Connolley S. & Hausstätter, R. S. (2009). Tocqueville on Democracy and Inclusive Education: A More Ardent and Enduring Love of Equality than of Liberty. European Journal of Special Needs Education 24(3), 231-243.Danforth, S. (2009). The incomplete child. An intellectual History of Learning Disability. NY: Peter Lang. Danforth, S. (2004). Postmodern heresy in Special Education: a Sociological analysis. Mental Retardation. 42(6), 445-458. Davies, S. P. (1959). The Mentally Retarded in Society. New York: Columbia University Press.Emanuelsson, I., Persson, B. & Rosenqvist, J. (2001). Forskning inom det specialpedagogiske området – en kunnskapsöversikt [Research within the special-education area: a review ]. http://hundochkatter.se/Forskninginomdetspec.ped.omr.enkunskovers.pdf (last read 25.09.09)Engelsen, B.U. (1990). Kan læring planlegges? [Can learning be planned?] Oslo: Gyldendal.Foucault, M. (1979). Discipline and punish: the birth of the prison. New York: Vintage.Foucault, M. (2001). Madness and civilization: a history of insanity in the age of reason. London: Routledge.Foucault, M. (2003a). The birth of the clinic: an archaeology of medical perception. London: Routledge.
186
INTERNATIONAL JOURNAL OF SPECIAL EDUCATION Vol 27, No: 2, 2012
Foucault, M. (2003b). Abnormal: Lecutres at the Collège de France 1974-1975. London: Verso.Gallagher, D. J., Heshusius, L., Iano, R. P. & Skirtic, T. M. (2004). Challenging Orthodoxy In Special Education: Dissenting Voices. Denver: Love Publishing Company. Gallagher, D. J. (2001). Neutrality as a Moral Standpoint, Conceptual Confusion and the Full Inclusion Debate. Disability & Society. 16(5), 637-654. Gallagher, D. J. (2006). If Not Absolute Objectivity, Then What? A Reply to Kauffmann and Sasso. Exceptionality 14(2), 91-107.Hacking, I. (1995a). The looping effects of human kinds. In D. Sperber, D. Premack & A. J. Premack (ed). Causal Cognition: A Multidisciplinary Debate. Oxford: Clarendon Press. Hacking, I. (1995b). Rewriting the Soule. Multiple personality and the science of memory. New Jersey: Princeton University Press. Hacking, I. (1996). Normal people. In D.R. Olson & N. Torrance (ed). Modes of thoughts: Explorations in culture and cognition. Cambridge: Cambridge university press. Hacking, I. (2002). Inaugural lecture: Chair of Philosophy and History of Scientific Concepts at the College de France, 16 January 2001. Economy and Society. 31(1), 1-14.Hacking, I. (2006). Kinds of People: Moving Targets. The tenth British Academy Lecture. 11 April 2006 at the British Academy http://www.proc.britac.ac.uk/tfiles/151p285.pdf. (last read 18.12.11) Haug, P. (2003). Regimer i forsking om spesialundervisning i Norge [Regimes in special-education research in Norway]. Psykologisk Pædagogisk Rådgiving 40(2), 181-205. Hausstätter R. S. & Connolley, S. (2007). Towards an Ethics of Research Programmes in Special Education. INTERNATIONAL JOURNAL OF DISABILITY, DEVELOPMENT AND EDUCATION. 54(4), 369-380.Hausstätter, R. S. (2004). An alternative framework for conceptualising and analysing special education research. European Journal of Special Needs Education. 19(3) 367-374.Hausstätter, R. S. (2006). Vilje til likhet – om spesialpedagogikkens legitimitet [The will to equality: on the legitimacy of special education]. Spesialpedagogikk. 7, 4-11.Hausstätter, R. S. (2007). Spesialpedagogiske grunnlagsproblemer: mellom ideologi og virkelighet [The fundamental problems of special education: between ideology and reality]. Bergen: Fagbokforlaget. Hegarty, S. (2001). Inclusive education – a case to answer. Journal of Moral Education. 30(3), 243-249.Holst, J. (1978). Normalitet [Normality]. København: Eijler. Iano, R. P. (1990). Special Education Teachers: Technicians or Educators? Journal of Learning Disabilities. 23(8), 462-465.Kauffman, J. M. & Sasso, G. M. (2006). Toward Ending Cultural and Cognitive Relativism in Special Education. Exceptionality. 14(2) 65-90.Kavale, K. & Mostert, M. P. (2004). The positive side of special education. Minimizing its fads, fancies, and follies. Oxford: Scarecrow Education. Kavale, K. A. & Forness, S. R. (2000). History, Rhetoric and Reality: Analysis of the Inclusion Debate. Remedial and Special Education. 21(5), 279-296.Kirkebæk, B. (1993). Da de åndssvage blev farlige [When the mentally retarded became dangerous]. Holte: Socpol.Lipsky, D. & Gartner, A. (1991). Restructuring for quality. In: W. Lioyd, A. C. Repp & N. N. Singh (eds). The Regular Education Initiative: Alternative perspectives on concepts, issues and modes. Sycamore, IL: Sycamore. Løvlie, L. (1992). Postmodernism and subjectivity. In: S. Kvåle (ed.) Psychology and postmodernism. London: Sage. Mostert, M. P., Kavale, K. A. & Kauffman, J. M. (2007). Challenging the Refusal of Reasoning in Special Education. London: Love Publishing Company. Nussbaum, M. (2006). Frontiers of Justice. Disability, Nationality, Species Membership. Cambridge: Harvard University Press.Osburn, J. (1998). An Overview of Social Role Valorization Theory. The International Social Role Valorization Journal 3(1), 7-12. Overland, T. (2007). Skolen og de utfordrende elevene [The school and the challenging pupil]. Bergen: Fagbokforlaget.Simons, M. & Masschelein, J. (2005). Inclusive Education for Exclusive Pupils. A Critical Analysis of the Government of the Exceptional. In S. Tremain (red). Foucault and the Government of Disability. Michigan: University of Michigan Press. Skidmore, D. (1996). Towards an integrated theoretical framework for research into special education needs. European Journal of Special Needs Education. 11(1), 33-47.Skrtic, T. (1991). Behind Special Education. A Critical Analysis of Professional Culture and School Organization. Denver: Love Publishing Company.
187
INTERNATIONAL JOURNAL OF SPECIAL EDUCATION Vol 27, No: 2, 2012
Thuen, H. (2002). I foreldrenes sted. Barneredningens oppdragelsesdirskurs 1820-1900 [In the parents’ place: the discourse of upbringing and the rescue of children, 1820-1900]. Oslo: Pax.Vehmas, S. (2008). Philosophy and science: the axes of evil in disability studies? Journal of Medical Ethics 34(1), 21-23Vehmas, S. (2004). Ethical Analysis of the Concept of Disability Mental Retardation, 42(3), 209–222.Vehmas, S. & Mäkelä, P. (2008). The ontology of disability and impairment: a discussion on the natural and social features. In K. Kristiansen, S. Vehmas and T. Shakespeare (eds) Arguing about disability, Philosophical perspectives. London: Routledge.
USING INQUIRY-BASED INSTRUCTION FOR TEACHING SCIENCE TO STUDENTS WITH LEARNING DISABILITIES
Mehmet AydenizDavid F. Cihak
Shannon C. GrahamLarryn Retinger
The University of Tennessee
The purpose of this study was to examine the effects of inquiry-based science instruction for five elementary students with learning disabilities (LD). Students participated in a series of inquiry-based activities targeting conceptual and application-based understanding of simple electric circuits, conductors and insulators, parallel circuits, and electricity and magnetism. Students’ conceptual understanding of these concepts was measured through a test designed by the investigators. The students’ attitudes towards science were measured through scientific attitudes inventory (SAI-II). The results indicated that all students acquired the science content covered during the intervention and maintained their performance six weeks later. In addition, students improved their attitudes towards science. Our discussion focuses on the ways in which we can make science learning accessible to students with learning disabilities by making changes in curriculum, instruction and assessment.
Achieving educational opportunities for all students is one of the most promoted goals of national educational laws, polices and reform documents, such as the No Child Left Behind Act (NCLB) of 2001 (U.S. Department of Education, 2002), Science for All (American Association for the Advancement of Science [AAAS], 1990), and the National Science Education Standards (National Research Council [NRC], 1996). For instance, NCLB requires states to disaggregate test results for all student groups
188
INTERNATIONAL JOURNAL OF SPECIAL EDUCATION Vol 27, No: 2, 2012
within the educational system and holds them accountable for their achievement. Similarly, reform documents emphasize providing access to quality education for all students and providing adequate resources to support all students’ learning in science. (NRC, 2005).
In an effort to provide quality education to all students and ensure the achievement if all students, science education reform documents such as NSES (NRC, 1996) emphasized inquiry skills over rote memorization of facts and expect students to learn science in new ways. Students are expected to understand science facts, understand and apply science concepts in real life situations, and perform scientific processes from measuring and estimation to sustained reasoning through scientific inquiry (NRC, 1996; 2000). Teaching these types of knowledge and skills to students with learning disabilities presents unique challenges to the elementary school teachers who reportedly have insufficient content knowledge, and limited understanding and knowledge of reform-based pedagogies (Appleton, 2005; Dorph, Goldstein, Lee, Lepori, Schneider & Venkatesan, 2007; Fulp, 2002; Roth & Garnier, 2006). In an effort to help elementary school teachers to teach science based on reform objectives, science educators have developed a series of kit-based curriculum materials. These kit-based curriculum materials have been effective in increasing the mainstream students’ learning in science (Alonzo, 2008; Aydeniz, 2010; Granger, Bevis, Saka, & Southerland, 2010). Although the use of such kits have reportedly had a positive influence on mainstream students’ learning of science, to our knowledge there is not any recent research on investigating their effects on the learning of students with learning disabilities (LD). Therefore, we designed this study to investigate the effects of the Electric Circuits Kitbook (Edamar, Inc., 2008), an inquiry-based curriculum, on elementary students’ with LD understanding of simple electric circuits, conductors and insulators, parallel circuits, and electricity and magnetism.
Science Instruction and Students with Learning DisabilitiesAn extensive review of the literature by Miller (1999) indicated that there have been few studies of students with learning disabilities. The result of previous studies show that students with LD typically perform lower in science compared to their peers and express doubts about their capacity to perform successfully in science courses (Carlisle & Chang, 1996). The existing literature suggests general reasons why students with LD often struggle in science courses. Among these reasons are that: (1) most standard science activities fail to provide accommodations for students with LD (Ormsbee & Finson, 2000), (2) comprehension of content presented in science textbooks is difficult for students with LD due to deficits in reading ability (Horton, Lovitt, & Bergerud, 1990), and (3) the volume of new vocabulary and terminology in science textbooks is problematic for students with LD (Mastropieri & Scruggs, 1993). Additionally, students with LD may not be given enough time or appropriate scaffolding needed for them to process the scientific information presented in the classroom. Finally, students with LD may not be given the opportunity to engage in guided inquiry activities that may help them to acquire the knowledge and skills promoted by curriculum (AAAS, 1993; NRC, 1996; Ormsbee, & Finson, 2000; Steele, 2005).
Limited attention to the learning of students with LD in science at the elementary level is likely to perpetuate failure in science courses at the middle and high school. If students’ learning needs in science classrooms are not addressed at the elementary school, they will not have sufficient background knowledge to acquire the cognitive complexity of learning tasks presented in more advanced middle and high school science courses (Donovan & Bransford, 2005). Moreover, if students with LD are not provided opportunities to learn scientific concepts in a meaningful manner, they may develop negative attitudes towards learning science that they are expected to learn later in their academic lives. Given the fact that more than 60% of the students with an Individualized Educational Plan (IEP) take the same standardized test as their general education peers with or without accommodations (Thurlow, Moen, & Altman, 2006), the combined effects of attitude and limited prior knowledge may leave these students behind in life and defy the prominent equity goals of the NCLB and Science for All (AAAS, 1990). Kurz, Elliot, Wehby and Smithson (2009) suggested, By virtue of being administered the same assessments, students with disabilities have to be afforded the same opportunity to learn the content they are expected to know on these tests (p. 3). In order for students with LD to be fairly assessed they must receive equitable instruction. Providing equitable instruction will require teachers to develop understanding about the learning needs of students with LD and acquire knowledge and skills to use curriculum materials and instructional strategies that hold promise to be effective for students with LD.
Responsive Science Instruction for Students with Learning DisabilitiesA number of specific interventions have been developed and examined to address barriers to science content learning for LD including: (1) reading comprehension strategies (Bakken, Mastropieri, & Scruggs, 1997; Scruggs & Mastropieri, 1993), (2) textbook adaptations and study guides (Horton et al.,
189
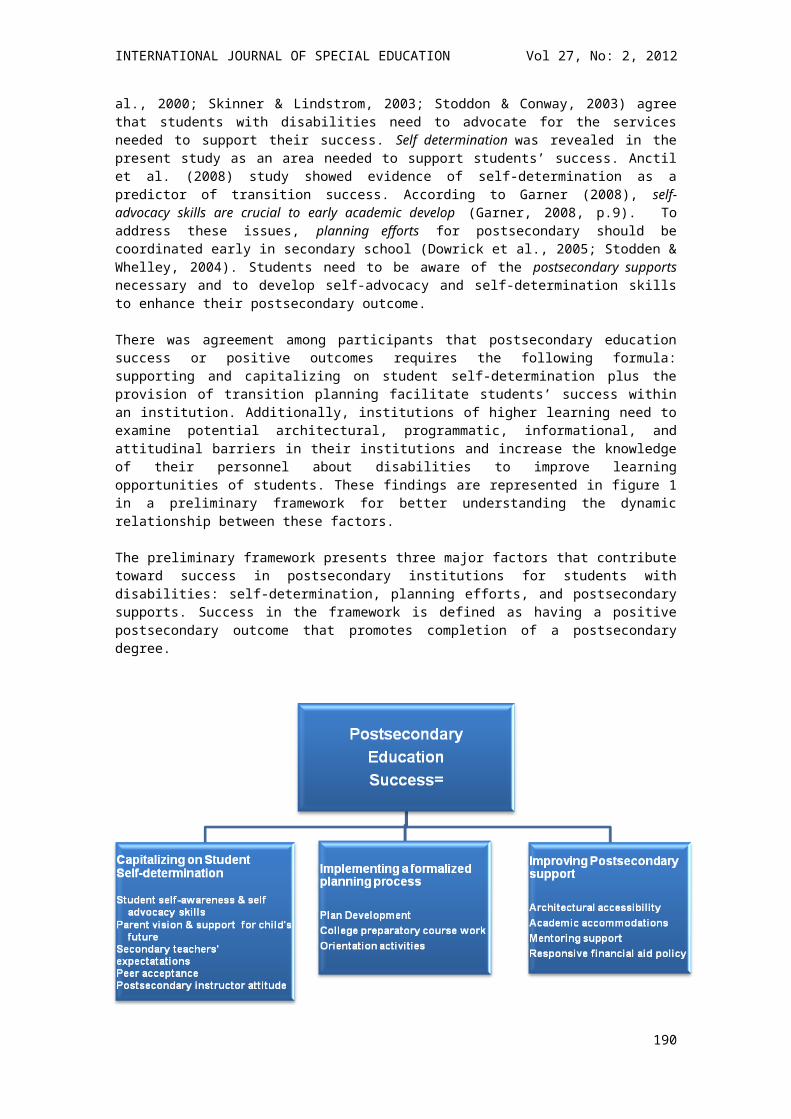
INTERNATIONAL JOURNAL OF SPECIAL EDUCATION Vol 27, No: 2, 2012
1990), (3) mnemonic strategies (Mastropieri, Scruggs, & Levin, 1985), (4) review activities (Maheady, Michielli-Pendl, Mallette, & Harper, 2002), (5) advanced organizers (Lenz, Alley, & Schumaker, 1987) and (6) peer tutoring (Fuchs & Fuchs, 2001). Mastropieri and Scruggs (1992) recommended that study guides and text adaptations demonstrate positive effects on students’ learning, behavior, and motivation. Mnemonic strategies have also been helpful in learning the technical language of science and activities-based science curricula were effective for conceptual understanding.
It has been documented that inquiry-based activities increase LD students’ understanding and retainment of science concepts more than their peers who learn from text-based or lecture-based approaches (Holahan & DeLuca, 1993; Mastropieri & Scruggs, 1993; 1994). Bredderman (1983) found that the self-discovery component of science curriculum led to higher retention rates. In addition, he found that, more activity-process-based approaches to teaching science result in gains over traditional methods in a wide range of student outcome areas… including students with LD. (p. 513). Dalton, Morocco, Tivnan and Mead (1997) stated, students with LD in activities-oriented learning approach scored higher on immediate and delayed recall tests and reported a strong preference for this kind of learning in terms of enjoyment, interest, and competence (p. 671). Additionally, engaging students with LD in science learning through hands-on, inquiry-based activities may help address students’ misconceptions about the scientific concepts, assist them to acquire skills for the processes of science, and help them develop positive attitudes for learning, and for science itself (Dalton et al., 1997; Mastropieri & Scruggs, 1997; Mastropieri, Scruggs, & Magnusen, 1999; Scruggs & Mastropieri, 2007). However, the impact of kit-based curriculum on LD students’ conceptual understanding of simple electric circuits has not been investigated.
The purpose of this study, therefore, was to investigate the effects of the Electric Circuits Kitbook, an inquiry-based curriculum, on elementary students’ with LD understanding of simple electric circuits, magnetism and electricity and their attitudes towards science. Specifically, we were interested in answering the following questions: 1) what are the effects of this inquiry-based curriculum on students’ conceptual and application-based understanding of simple electric circuits? and 2) what are the students’ attitudes towards science and scientific attitudes before and after participating in inquiry-based activities?
MethodsParticipants and SettingThis study took place at an elementary school in the southeastern part of the United States. The school serves a predominantly white student population (94.2%). A significant number of students qualify for free and reduced lunch. More precisely, 75.7% of the students are considered to be economically disadvantaged.
Five students, Adam, Beth, Chris, David and Evia were selected to participate based on the following: (a) elementary school enrollment, (b) qualifications for LD services under state and federal regulations, (c) did not receive previous instruction regarding simple electric circuits, (d) parental permission, and (e) student agreement to participate. Specific student characteristics are presented in Table 1. All students received special educational services for a specific learning disability in reading. Chris and Evia also received services for a specific learning disability in mathematics. In addition, the classroom teacher reported that all students were reading at least two grade-levels below their peers without learning disabilities. Adam, Beth and David received 15 hours of special education services weekly. Chris and Evia received 20 hours of special education services weekly. All students received 50 min of educational services in a special education classroom daily for study skills. All phases of this study occurred in the students’ resource classroom during study skills.
The students’ classroom teacher implemented all phases of this study. The teacher was dually certified to teach both special education and K-6 elementary education. The teacher had five years of teaching experience and a master’s degree in special education. The special education teacher had completed a science methods course during her teacher education program and had participated in a learning activity that focused on enhancing pre-service elementary teacher’s content and pedagogical content knowledge.
Table 1. Student CharacteristicsStudents Age Grade FSIQ Reading
CompositebSpellingb Math
CompositebSLD
Adam 11.2 5 95 65 68 83 Reading
190
INTERNATIONAL JOURNAL OF SPECIAL EDUCATION Vol 27, No: 2, 2012
Beth 12.1 5 105 79 80 91 ReadingChris 10.9 4 95 57 59 51 Reading,
MathDavid 9.2 4 92 62 67 85 ReadingEvia 11.5 5 91 60 58 55 Reading,
MathNote. FSIQ = full scale intelligence quotient; SLD = specific learning disability.a = Wechsler Intelligence for Children (3rd ed.). b = Wide Range Achievement Test-Revised.
MaterialsThe Electric Circuits KitBook, supporting activities, and quizzes were used in this study. The Electric Circuits KitBook is a self-contained, hands-on curriculum that targets nine different learning activities. However, only four scientific concepts were targeted for this study since students had difficulty understanding and applying these concepts and these concepts correlated directly to the state science curriculum standards which included: (a) simple circuits, (b) conductors and insulators, (c) parallel circuits, and (d) electricity and magnetism. Materials needed to conduct all experiments were included in the booklet including jumper wires with alligator tips, lamp, fixed switch, slide switch, buzzer, lamp, motor color wheel, momentary (push) switch, and batteries. Quizzes covered conceptual-based and application-based problems targeting the four concepts. The simple circuit quiz consisted of five conceptual-based and nine application-based problems for a total of 14 items. The conductor and insulator quiz consisted of seven conceptual-based and six application-based problems for a total of 13 items. The series and parallel circuits quiz consisted of six conceptual-based and six application-based problems for a total of 12 items. The electromagnetism quiz consisted of ten conceptual-based and five application-based problems for a total of 15 items. Appendix A lists sample questions from quizzes . In addition, the Scientific Attitudes Inventory SAI-II (Moore & Foy, 1997) was used to assess students’ attitudes towards science.
Data Collection and DesignStudents were presented a daily quiz at the beginning of each class. Permanent product recording procedures were used to collect data for each session. A session was defined as one 50-minute class. At the start of each class or session, students had 20 minutes to complete each quiz. The number of problems completed correctly was divided by the total number of problems presented (i.e., 12, 13, 14, 15) to calculate the student’s percentage of problems solved correctly for each session. For each skill, quizzes incorporated similar but different conceptual and application problems. Problems were semi-randomly assigned to quizzes and no quiz was presented more than once.
A multiple-probe design across behaviors (Barlow & Hersen, 1984) or science skills with a maintenance phase was used to determine the efficacy of the circuit kitbook for the acquisition and maintenance of science skills. The staggered introduction of the intervention within a multiple-probe design allows demonstration of the experimental effects not only within each data series, but also across data series at the staggered times of intervention. As the student reached criterion to move to the maintenance phase, the use of the circuit kitbook began with the next concept and so forth.
Procedures Baseline. At the start of each session, students were given a quiz to solve conceptual-based and application-based problems targeting simple electric circuits. Each quiz targeted one of the specific skills. Students were prompted to try your best and no additional instructions, prompts, or feedback were provided. The teacher administered quizzes until students achieved a stable baseline for a minimum of five sessions. Science teachers did not introduce or teach these science skills during the course of this study.
Electric Circuit Kitbook. During the intervention, each student was provided an Electric Circuits KitBook and worked in either a group of two or three students. The teacher grouped students in a semi-random order to ensure that groups were composed of different students daily and that each group consisted of at least one student who was progressing proficiently, based on quiz scores, to serve as a potential group tutor. The teacher started each lesson with an overview of vocabulary, questioning student’s prior knowledge, and making connections between the content of the lesson and student’s everyday life experiences with electricity. For example, the teacher said, Can you identify devices that have simple circuits in this room? The teacher also read aloud all content information and directions in the kitbook. Afterwards, the teacher instructed the students to perform the corresponding experiments.
191
INTERNATIONAL JOURNAL OF SPECIAL EDUCATION Vol 27, No: 2, 2012
Table 2 lists sample experiments for each skill. All students continued to practice solving the simple circuit experiments and problems until they performed 100% on at least two of three quizzes. After reaching criterion, the teacher introduced conductors and insulator experiments and problems to the students. Similarly, the teacher grouped the students, reviewed vocabulary, questioned student’s prior knowledge, and made connections between the content of the lesson and the student’s experience with electricity. Then, students experimented and practiced solving conceptual and application-based problems targeting conductors and insulator. Likewise, after reaching criterion, the teacher introduced series and parallel circuits, and lastly conceptual and application-based problems and experiments targeting electromagnetism knowledge.
Table 2. Experiment ExamplesSkills Learning Activities/ExperimentsSimple circuits Students constructed two simple circuits to light a bulb and to play a buzzer.
Conductors and insulators
Students were challenged to test five materials and identify electrical conductors and insulators through experimentation.
Parallel circuits Students were challenged to construct and identify parallel circuits with multiple paths. They were also challenged to trace the current path in complex parallel circuits.
Electromagnetism Students were challenged to describe how an electromagnet works, construct a working electromagnet and discuss the useful applications of electromagnets.
Maintenance. Follow-up probes were collected six weeks after students reached acquisition criterion for solving electromagnetism problems. Students were given a similar quiz used during baseline and intervention phases requiring students to solve (a) simple circuits, (b) conductors and insulators, (c) parallel circuits, or (d) electromagnetism problems. The purpose of this approach was to determine if the initial intervention instruction affected the student’s performance over time.
Science Attitude Assessment. Before the baseline phase and following the conclusion of the study, all students completed the Scientific Attitudes Inventory ([SAI-II] (Moore & Foy, 1997) to assess each student’s attitudes towards science. The inventory included 30 items related to student attitudes toward science and their scientific attitudes. Specifically, 13 items inquired about the student’s scientific attitudes (e.g., good scientists are willing to change their ideas; scientists are always interested in better explanation of things; if one scientist says an idea is true, all other scientists will believe it) and 17 items inquired about the student’s attitudes towards science (e.g., I would enjoy studying science; scientific work is useful only to scientist; scientists have to study too much) for a total of 30 items. Students responded to each item using a 5-point Likert Scale ranging from 1 strongly agree to 5 strongly disagree.
ReliabilityInterobserver reliability data and procedural reliability were collected independently and simultaneously by the investigator (second author) and classroom teacher. Interobserver and procedural reliability data were collected during at least 25% of baseline and each concurrent phase. Observers independently and simultaneously recorded the number of problems solved correctly on student quizzes. Interobserver agreement was calculated by dividing the number of agreements of student responses by the number of agreements plus disagreements and multiplying by 100. Interobserver reliability was 100% for all students throughout all phases.
Procedural reliability measured the teacher's performance. The teacher was required to provide students with the circuit kitbook and daily quiz. The teacher also was expected to read aloud all content information and directions, group the students, review vocabulary, question student’s prior knowledge, and make connections between the content of the lesson and the student’s experience with electricity. The procedural agreement level was calculated by dividing the number of observed teacher behaviors by the number of planned teacher behaviors and multiplying by 100. Procedural reliability was 95% for all students throughout all phases.
Results
192
INTERNATIONAL JOURNAL OF SPECIAL EDUCATION Vol 27, No: 2, 2012
Group Results: Conceptual UnderstandingOverall, the mean percentage of problems solved correctly for simple circuits during baseline was 4.7%. Students improved solving problems targeting simple circuits to 76% when the activity-based circuit kitbook was implemented. The mean percentage of problems solved correctly for conductors and insulators during baseline was 5.5%. Students improved solving conductors and insulators problems to mean of 81.5% during intervention. The mean percentage of problems solved correctly for parallel circuits were 6.8% during baseline. Students improved solving parallel circuit problems to 87.5% when the activity-based circuit kitbook was implemented. Similarly, the mean percentage of problems solved correctly for electromagnetism was 12.6% during baseline. Students improved solving series and parallel circuit problems to 92.8% when the activity-based circuit kitbook was implemented. All students also maintained all skills six weeks later. Data are presented in Table 3.
Individual Performance: Conceptual UnderstandingAdam. Figure 1 displays Adam’s percentage of problems solved correctly. During baseline, the mean percentage for solving conceptual-based simple circuit problems correctly was 8.0% and 13.2% for application-based problems. When the activity-based Electric Circuit Kitbook was implemented, the mean percentage for solving conceptual-based simple circuit problems correctly increased to 86.7% and 83.0% for application-based problems. For conductors and insulators, the mean percentage for solving conceptual-based problems was 6.0% and 4.9% for application-based problems during baseline. Adam’s mean percentage for solving conceptual-based problems increased to 79.6% and 88.1% for application-based problems during intervention. For parallel circuits, the mean percentage for solving conceptual-based problems was 5.6% and 5.7% for application-based problems during baseline. His mean percentage for solving conceptual-based problems increased to 86.0% and 91.5% for application-based problems during intervention. For electromagnetism problems, the mean percentage for solving conceptual-based problems was 6.4% and 10.9% for application-based problems during baseline. His mean percentage for solving conceptual-based problems increased to 91.7% and 90.0% for application-based problems during intervention. Adam also maintained 100% of all skills six week later.
Table 3. Mean Percentage of Correct Science Problems Across Skills.
193
INTERNATIONAL JOURNAL OF SPECIAL EDUCATION Vol 27, No: 2, 2012
194
INTERNATIONAL JOURNAL OF SPECIAL EDUCATION Vol 27, No: 2, 2012
Figure 1. Adam’s percentage correct across science skills.
Beth. Figure 2 displays Beth’s percentage of problems solved correctly. During baseline, she did not solve and conceptual-based simple circuit problems correctly and a mean of 4.4% application-based problems correct. When the activity-based circuit kitbook was implemented, her mean percentage for solving conceptual-based simple circuit problems correctly increased to 73.3% and 77.3% for application-based problems. For conductors and insulators, the mean percentage for solving conceptual-based problems was 6.0% and 4.9% for application-based problems during baseline. Beth’s mean percentage for solving conceptual-based problems increased to 79.6% and 80.9% for application-based problems during intervention. For parallel circuits, the mean percentage for solving conceptual-based problems was 3.8% and 9.4% for application-based problems during baseline. Her mean percentage for solving conceptual-based problems increased to 85.8% and 91.5% for application-based problems during intervention. For electromagnetism problems, the mean percentage for solving conceptual-based problems was 10.0% and 9.1% for application-based problems during baseline. Her mean percentage for
195
INTERNATIONAL JOURNAL OF SPECIAL EDUCATION Vol 27, No: 2, 2012
solving conceptual-based problems increased to 88.3% and 83.3% for application-based problems during intervention. Beth also maintained 100% of all skills six week later.
Chris. Figure 3 displays Chris’ percentage of problems solved correctly. During baseline, the mean percentage for solving conceptual-based simple circuit problems correctly was 4.0% and Chris did not solve any application-based problems correctly. When the activity-based circuit kitbook was implemented, the mean percentage for solving conceptual-based simple circuit problems correctly increased to 76.7% and 79.3% for application-based problems. For conductors and insulators, the mean percentage for solving conceptual-based problems was 10.0% and 9.7% for application-based problems during baseline. Chris’ mean percentage for solving conceptual-based problems increased to 81.0% and 81.0% for application-based problems during intervention. For parallel circuits, the mean percentage for solving conceptual-based problems was 9.3% and 5.7% for application-based problems during baseline. His mean percentage for solving conceptual-based problems increased to 86.0% and 80.5% for application-based problems during intervention. For electromagnetism problems, the mean percentage for solving conceptual-based problems was 15.5% and 18.2% for application-based problems during baseline. His mean percentage for solving conceptual-based problems increased to 95.0% and 80.5% for application-based problems during intervention. Chris also maintained 100% of all skills six week later.
Figure 2. Beth’s percentage correct across science skills.
196
INTERNATIONAL JOURNAL OF SPECIAL EDUCATION Vol 27, No: 2, 2012
Figure 3. Chris’ percentage correct across science skills.
David. Figure 4 displays David’s percentage of problems solved correctly. During baseline, the mean percentage for solving conceptual-based simple circuit problems correctly was 7.6% and 5.7% for application-based problems. When the activity-based circuit kitbook was implemented, the mean percentage for solving conceptual-based simple circuit problems correctly increased to 97.2% and 97.2% for application-based problems. For conductors and insulators, the mean percentage for solving conceptual-based problems was 2.0% and 2.4% for application-based problems during baseline. David’s mean percentage for solving conceptual-based problems increased to 91.9% and 88.1% for application-based problems during intervention. For parallel circuits correctly solved no conceptual-based problems and 4.4% for application-based problems during baseline. His mean percentage for solving conceptual-based problems increased to 70.0% and 75.5% for application-based problems during intervention. For electromagnetism problems, the mean percentage for solving conceptual-based problems was 15.5% and 21.8% for application-based problems during baseline. His mean percentage for solving conceptual-
197
INTERNATIONAL JOURNAL OF SPECIAL EDUCATION Vol 27, No: 2, 2012
based problems increased to 98.3% and 96.7% for application-based problems during intervention. David also maintained 100% of all skills six week later.
Figure 4. David’s percentage correct across science skills.
Evia. Figure 5 displays Evia’s percentage of problems solved correctly. During baseline, the mean percentage for solving conceptual-based simple circuit problems correctly was 4.0% and 8.8% for application-based problems. When the activity-based circuit kitbook was implemented, her mean percentage for solving conceptual-based simple circuit problems correctly increased to 66.7% and 71.8% for application-based problems. For conductors and insulators, the mean percentage for solving conceptual-based problems was 4.0% and 4.9% for application-based problems during baseline. Evia’s mean percentage for solving conceptual- based problems increased to 69.1% and 76.1% for application-based problems during intervention. For parallel circuits, the mean percentage for solving conceptual-based problems was 6.2% and 7.6% for application-based problems during baseline. His mean
198
INTERNATIONAL JOURNAL OF SPECIAL EDUCATION Vol 27, No: 2, 2012
percentage for solving conceptual-based problems increased to 83.3% and 78.4% for application-based problems during intervention. For electromagnetism problems, the mean percentage for solving conceptual-based problems was 8.2% and 10.9% for application-based problems during baseline. Her mean percentage for solving conceptual-based problems increased to 95.0% and 96.7% for application-based problems during intervention. Evia also maintained 100% of all skills six week later.
Figure 5. Evia’s percentage correct across science skills. Science Attitude AssessmentA Wilcoxon matched-pairs signed-ranks test was used to examine student attitudes towards science. Table 5 lists student scores, group means, and statistical analyses on the Scientific Attitude Inventory (SAI-II) (Moore & Foy, 1997) prior to and following the conclusion of the intervention. Students reported significant differences regarding their attitudes towards science. Initially, students reported a mean of 44.0 (SD = 7.65) on scientific attitudes, a mean of 52.8 (SD = 4.76) on their attitudes towards science, and a mean of 96.8 (SD = 7.79) overall. Following intervention, students reported significant
199
INTERNATIONAL JOURNAL OF SPECIAL EDUCATION Vol 27, No: 2, 2012
improvements about scientific attitudes (M = 56.2, SD = 2.95, W = 2.02), p < .05), attitudes towards science (M = 73.0, SD = 4.69, W = 2.06, p < .05), and overall (M = 129.2, SD = 5.35, W = 2.03, p < .05).
Table 4. Students’ Attitudes Towards Science
Students Pretest Posttest W pScience Attitudes
Attitudes towards Science
Total Science Attitudes
Attitudes towards Science
Total
Adam 42 51 93 55 70 125Beth 45 55 100 57 75 132Chris 35 50 85 52 72 124David 56 48 104 60 68 128Evia 42 60 102 57 80 137Mean 44.0 - - 56.2 - - 2.02 .043*SD 7.65 - - 2.95 - -Mean - 52.8 - - 73.0 - 2.06 .039*SD - 4.76 - - 4.69 -Mean - - 96.8 - - 129.2 2.03 .042*SD - - 7.79 - - 5.35
Note. W = Wilcoxon matched-pairs signed-ranks test. *p < .05.
DiscussionThe purposes of this study were: 1) to examine the impact of inquiry-based Electric Circuits Kitbook on the acquisition, maintenance and generalization of simple electric knowledge and skills of elementary students with LD and 2) to examine the impact of an inquiry-based curriculum unit, Electric Circuits Kitbook, on student’s with LD attitudes toward science and scientific attitudes. The results of the intervention used in this study indicate that inquiry-based Electric Circuit Kitbook had a significantly positive impact on participants’ conceptual understanding of the targeted science concepts and their attitudes towards science. We discuss the meaning of these results for enhancing the quality of science learning for students with LD by adopting inquiry-based curriculum materials, using responsive instruction and enhancing pedagogical knowledge of special education teachers in relation to science teaching.
The Impact of KitBook on Students’ Conceptual UnderstandingThe test results show that the use of Electric Circuits Kitbook had a significant influence on the learning of elementary students with LD. With the use of Electric Circuit Kitbook, all students improved their conceptual understanding of simple electric circuits. Students were also able to successfully apply their conceptual understanding to construct and interpret simple, series and parallel electrical circuits. Moreover, students maintained this understanding six weeks later. A functional relation was established since experimental control occurred by demonstration of a covariation between change in behavioral patterns and introduction of the intervention within, at least, three different series at three different points in time (Horner, Carr, Halle, McGee, Odom, & Wolery, 2005).
Previous studies (Asami, King, & Monk, 2000; Wandersee, Mintzes, & Novak, 1994) have shown that mainstream elementary school students struggle to develop conceptual understanding of the concept of electricity and electric circuits. These studies have identified many misconceptions related to mainstream students’ conceptual understanding of electricity and simple electric circuits. For instance, Chiu and Lin (2005) found that some students considered that, electricity moves from one end of the battery to the bottom of the light bulb and illuminate the bulb (p. 445). Some students also believed that there only needs to be one wire connecting the battery and the light bulb in order for the light bulb to produce light. More precisely, when the students were asked to draw an apparatus that would create a lit light bulb, they would leave out the wire that connects the bulb back to the battery (Chiu & Lin, 2004). These misconceptions are elaborated in Asami et al (2000) and Chiu and Lin (2005). Moreover, literature reveals that many general education students hold these misconceptions about simple electrical circuits even after instruction (Aydeniz, 2010). Misconceptions about electrical circuits may be more common among students with LD, who often struggle with learning academic content (Carlisle & Chang, 1996). The findings from this study suggest that the use of inquiry-based learning kits can have a significant influence on the learning outcomes of students with LD in science at the elementary school level.
200
INTERNATIONAL JOURNAL OF SPECIAL EDUCATION Vol 27, No: 2, 2012
Although this kit-based curriculum proved to be effective in helping students’ with LD learning of science, curriculum alone is not sufficient for creating equitable and meaningful learning experiences for students with LD. Teachers’ pedagogical content knowledge for teaching inquiry-based science must be taken into consideration in interpreting the effectiveness of learning kits. For instance, we believe that this intervention was successful in part because of teacher’s pedagogical knowledge of inquiry-based science and her commitment to providing meaningful learning experiences to her students with LD. The teacher had taken a science methods course while in her teacher education program and had participated in a professional development activity that focused on enhancing elementary teachers’ science content and pedagogical content knowledge. These experiences and coaching provided by the principal investigators had equipped her with knowledge skills and motivation to successfully implement the proposed activities through an inquiry framework. Many special education teachers may not have such a background in science content and pedagogy that will enable them to use EC Kitbook with effectively. Therefore, teachers willing to use such Kitbooks must also receive professional development on science content and pedagogy of teaching science with inquiry
Literature reveals that students with LD struggle with staying on task, time management and following directions to complete a learning task when proper accommodations are not provided in traditional lecture-based instructional settings (Bulgren, Deshler, & Schumaker, 1997; Shmulsky, 2003). As indicated in this study, students with LD engage in science learning more effectively when curriculum emphasizes inquiry and performance-based assessments and the teacher is conscious of students’ struggles. We attribute this differentiated effect of instruction on students’ learning to the fact that lecture-based instruction does not nurture students’ curiosity. When students with LD are given a chance to pursue an open-ended question or to figure things out, they are more willing to stay on task and complete the learning assignments. Moreover, when the students with LD learn science through inquiry-based curriculum materials such as Electric Circuits, they are more likely to demonstrate their true potential for learning. As a result, giving the teachers a chance to more accurately gauge their students’ knowledge of scientific ideas and processes covered in the class.
Through proper scaffolding, the use of inquiry-based science kits can afford the opportunities for students with LD to construct models simulating the scientific theories (i.e., electric circuits) and discuss their understanding of these theories with their teachers and their peers. The Electric Circuits Kitbook provides such scaffolding through proper sequencing of learning tasks that a teacher can use to teach science. This inquiry-based science kit, which creates a context for and encourages learning activities such as group work and performance-based assessments, has contributed significantly to the learning of students with LD (Schloss, Smith, & Schloss, 2001) and of mainstream students (Granger et al., 2010). Such curriculum materials must be adopted and used by teachers of this group of students to achieve equity in science learning. Adopting such curriculum materials and instructional strategies that accompany them is likely to reduce students’ distraction and engage them in the learning of science in a meaningful and an effective way. However, adopting of such inquiry-based curriculum materials alone is not sufficient. In order for teachers of students with LD to create such positive impacts on students’ learning, they must also have the pedagogical knowledge to teach inquiry-based science. The issue of special education teachers’ science content and pedagogy can partly be addressed through teacher preparation programs, by encouraging the students to take a science methods course. However, this may not be sufficient for addressing the learning needs of students with LD in science. Creating such opportunities in science for all students requires a strong leadership that values both science and students’ with LD right to learn science in a meaningful and effective way. The question that remains to be answered is: How do we create such leadership in our schools? The answer to questions like this one is likely to make the learning of science in a meaningful way accessible to all students with LD.
The Impact of Electric Circuits Kitbook on Students’ Attitudes towards Science and Scientific AttitudesThe results show that the use of Electric Circuits Kitbook had a positive influence on student’s attitudes toward science. Our findings indicate that the participant’s attitudes toward science and their scientific attitudes improved significantly as a result of the intervention. These findings are consistent with a growing body of research that links student’s meaningful participation in science learning activities and their attitudes towards science learning (Granger et al., 2010; Koballa & Glynn, 2007; Osborne & Collins, 2001). For instance, more students described science as enjoyable and that they would like to become a scientist on the post test than they did on the pre-test. Research shows that attitudes play a key role in a students’ effective participation in learning (Koballa & Glynn, 2007; Jenkins & Nelson, 2005). If this is true, we need to use curriculum materials and instructional strategies that are promising in helping the students with LD to develop positive attitudes towards science. The adoption of such
201
INTERNATIONAL JOURNAL OF SPECIAL EDUCATION Vol 27, No: 2, 2012
curriculum materials and instructional strategies will help achieve the goal of making Science for All a reality in our classrooms.
LimitationsThe findings of the current study were limited by a number of factors. First, as with any single subject research design, the small number of students limits the generalizability of the results. Moreover, all students were very cooperative and highly motivated to participate in this study as evident by their attendance. Systematic replication of the use of inquiry-based instruction is needed to build this generality. Second, this study examined the use of inquiry-based instruction outside the student’s regular science instruction and in the resource classroom. The combination of inquiry-based instruction within typical classroom instructional practice requires further investigation. Thirdly, generalization was not assessed. Generalization probes during regular classroom instruction are needed. Finally, other confounding factors such as teacher effect and the effect of group-based learning were not controlled. The findings reported here and the implications proposed should be considered in light of these limitations.
Results of this study provide support for the use of inquiry-based scientific instruction as an effective strategy for students with LD. However, future research needs to be conducted to identify additional ways inquiry-based curriculum and science instruction can be used for students with other disabilities to maximize academic learning opportunities. Additionally, future research should target other science skills and include students of various disabilities to assess the versatility of inquiry-based scientific instruction. Finally, the results of this study cannot be generalizable due to limited number of participants involved in the study. Future studies that include a large number of participants and can control for confounding factors more effectively than we were able to in this study will add to the validity of the conclusions drawn from the findings of this study.
ImplicationsIt is noted in the literature that a significant number of elementary teachers do not feel well prepared to teach science concepts effectively. If teachers do not feel confident in teaching science, they are likely to set a great number of students especially students with LD for failure. In addition, limiting students’ exposures to the scientific ideas in early grades may lead students to develop negative attitudes towards science later in their academic lives. Elementary teachers hold negative attitudes towards teaching science for various reasons (Appleton, 2008; Koballa, & Crawley, 1985). One of the reasons that elementary teachers do not teach science is because they lack content and pedagogical content knowledge (Appleton, 2008; Fulp, 2002). The adoption of reform-based, teacher friendly curriculum such as the one used in this study may impact elementary school teachers’ attitudes towards the teaching of science. The design of the Electric Circuits Kitbook is informed by guided inquiry framework and thus provides scaffolding that students need to engage in learning about simple electrical circuits in an effective manner. Moreover, the adoption of such kits can enhance elementary school teacher’s self-efficacy to teach science. Self-efficacy refers to one’s belief in one’s ability to affect a situation to bring about desirable outcomes (Bandura, 1997). The findings of this study suggest that the use of science kits informed by guided inquiry framework can enhance students’ with LD conceptual understanding and their attitudes towards science. Thus, the use of such kits must not only be adopted by school districts but elementary teachers must be held accountable for using such kits in their classrooms. These kits can also be used in professional development programs designed for the teachers of students with LD.
We understand that these kits may not be available in some countries. However, the key point we try to convey to the readers is not the kit itself but the use of instructional strategies that will challenge the students to engage in inquiry-based learning. This can be done without learning kits such as the one described in this paper. Although the kits add a guided structure to the inquiry-based learning tasks pursued, a teacher with adequate pedagogical content knowledge for inquiry-based instruction can provide such scaffolding in the absence of such kits.
ReferencesAlonzo, A. C. (2008). Using science notebooks as an informal assessment tool. In J. Coffey, R. Douglas, & C. Stearns (Eds.), Assessing science learning: Perspectives from research and practice (pp. 83-99). Arlington, VA: National Science Teachers Association.American Association for the Advancement of Science. (1990). Science for all Americans, Project 2061. New York, NY: Oxford University Press.
202
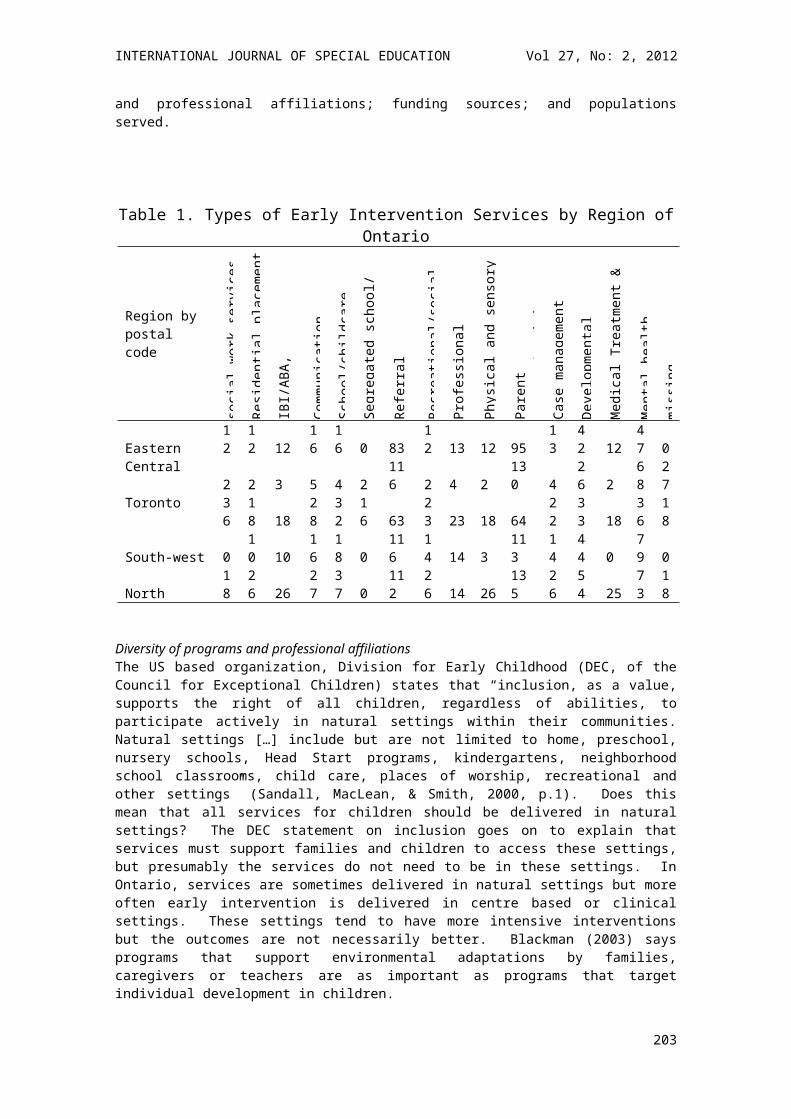
INTERNATIONAL JOURNAL OF SPECIAL EDUCATION Vol 27, No: 2, 2012
American Association for the Advancement of Science. (1993). Benchmarks for science literacy. New York, NY: Oxford University Press.Appleton, K. (2005). Elementary science teacher education. NJ: Lawrence Erlbaum Associates, Inc.Appleton, K. (2008). Developing science pedagogical content knowledge through mentoring elementary teachers. Journal of Science Teacher Education, 19(6), 523–545.Asami, N., King, J., & Monk, M. (2000). Tuition and memory: Mental models and cognitive processing in Japanese children’s work on D.C. electrical circuits. Research in Science and Technological Education, 18(2), 141-54.Aydeniz, M. (2010). Measuring the impact of electric circuits KitBook on elementary school children’s conceptual understanding of simple electric circuits. Electronic Journal of Science Education,14(2), 1-29. Bakken, J. P., Mastropieri, M. A., & Scruggs, T. E. (1997). Reading comprehension of expository science material and students with learning disabilities: A comparison of strategies. Journal of Special Education, 31(3), 300-324.Bandura, A. (1997). Self-efficacy: The exercise of control. New York: Freeman.Barlow, D. H., & Hersen, M. (1984). Single case experimental designs: Strategies for studying behavior change (2nd ed.). Needham Heights, MA: Allyn & Bacon.Bredderman, T. (1983). Effects of activity-based elementary science on student outcomes: A quantitative synthesis. Review of Educational Research, 53(4), 499-518.Bulgren, J. A., Deshler, D. D., & Schumaker, J. B. (1997). Use of a recall enhancement routine and strategies in inclusive secondary classes. Learning Disabilities Research and Practice, 12(4), 198-208.Carlisle, J. F., & Chang, V. (1996). Evaluation of academic capabilities in science by students with and without learning disabilities and their teachers. Journal of Special Education, 30(1), 18-34.Chiu, M., & Lin, J. (2005). Promoting fourth graders’ conceptual change of their understanding of electrical current via multiple analogies. Journal of Research in Science Teaching, 42(4), 429-464.Dalton, B., Morocco, C. C., Tivnan, T., & Mead, P. L. R. (1997). Supported inquiry science: Teaching for conceptual change in urban and suburban science classrooms. Journal of Learning Disabilities, 30(6), 670-684.Donovan, S., & Bransford, J. D. (Eds.). (2005). How students learn: History, mathematics, and science in the classroom. Washington, DC: National Academies Press.Dorph, R., Goldstein, D., Lee, S., Lepori, K., Schneider, S., & Venkatesan, S. (2007). The status of science education in the Bay Area: Research brief. Berkeley, CA: University of California, Lawrence Hall of Science.Edamar Inc. (2008). Electric circuits kitbook. Edamar.Fuchs L. S., & Fuchs, D. (2001). Principles for sustaining research based practice in the schools: A case study. Focus of Exceptional Children, 33(6), 1-14.Fulp, S. L. (2002). Status of elementary school science teaching. 2000 national survey of science and mathematics education. Retrieved from http://www.horizon research.com.Granger, E. M., Bevis, T. H., Saka, Y., & Southerland, S.A. (2010, March). Comparing reform-based and traditional curricula in a large-scale, randomized cluster design study: The interaction between curriculum and teachers' knowledge and beliefs. Paper presented at the meeting of the National Association of Research in Science Teaching, Philadelphia, PA.Holahan, G., & DeLuca, C. (1993). Classroom science interventions via a thematic approach. Unpublished manuscript, Buffalo, NY.Horner, R. H., Carr, E. G., Halle, J., McGee, G., Odom, S., & Wolery, M. (2005). The use of single-subject research to identify evidence-based practice in special education. Exceptional Children, 71(2), 165-180.Horton, S. V., Lovitt, T. C., & Bergerud, D. (1990). The effectiveness of graphic organizers for three classifications of secondary students in content area classes. Journal of Learning Disabilities, 23(1), 12-22.Jenkins, E. W. & Nelson, N. W. (2005). Important but not for me: Students’ attitudes towards secondary school science in England. Research in Science & Technological Education, 23, 41-57.Koballa, T.R., & Crawley, F.E. (1985). The influence of attitude on science teaching and learning. School Science and Mathematics, 85, 222–232.Koballa, T. R. & Glynn, S. M. (2007). Attitudinal and motivational constructs in science learning. In S. K. Abell & N. G. Lederman (Eds.), Handbook of Research on Science Education (pp. 75-102). Mahwah, NJ: Lawrence Erlbaum Associates.Kurz, A., Elliot, S. N., Wehby, J. H., & Smithson, J. L. (2009). Alignment of the intended, planned, and enacted curriculum in general and special education and its relation to student achievement. Journal of Special Education, 43(3), 1-15.
203
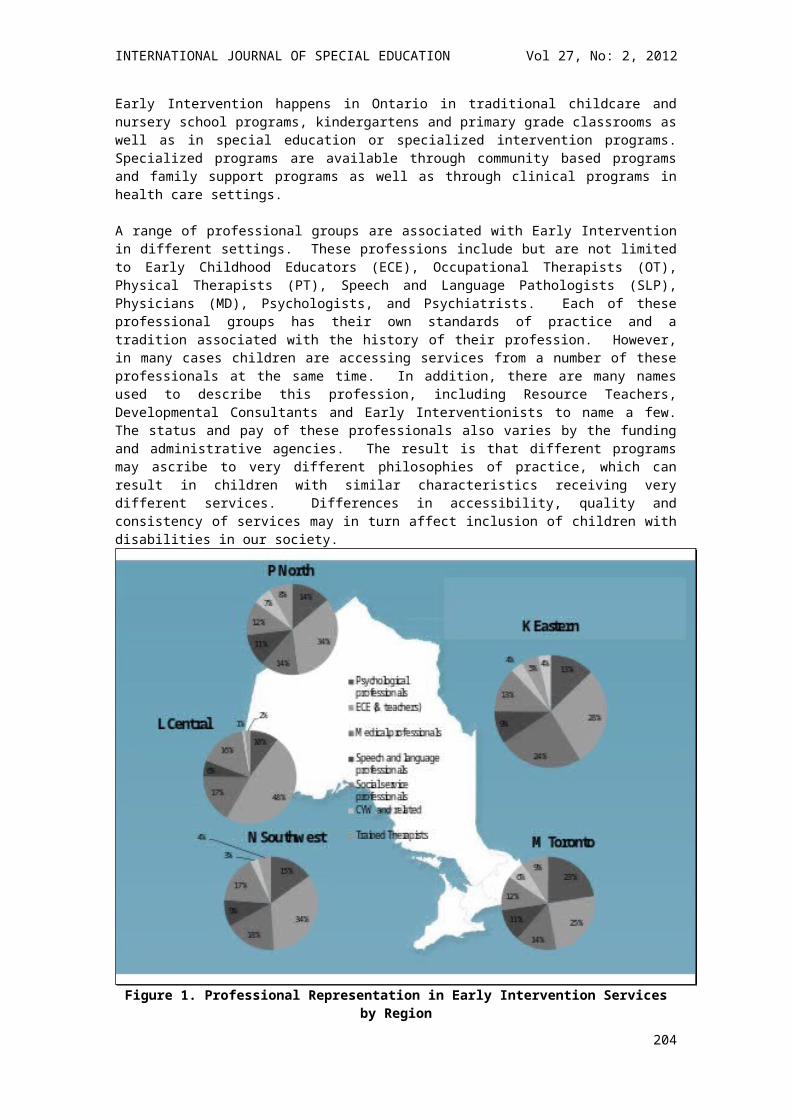
INTERNATIONAL JOURNAL OF SPECIAL EDUCATION Vol 27, No: 2, 2012
Lenz, B. K., Alley, G. R., & Schumaker, J. B. (1987). Activating the inactive learner: Advance organizers in the secondary content classroom. Learning Disability Quarterly, 10, 53-67.Maheady, L., Michielli-Pendl, J., Mallette, B., & Harper, G. F. (2002). A collaborative research project to improve the academic performance of a diverse sixth grade science class. Teacher Education and Special Education, 25(1), 55-70.Mastropieri, M. A., & Scruggs, T. E. (1992). Science for students with disabilities. Review of Educational Research, 62, 377-411.Mastropieri, M. A., & Scruggs, T. E. (1993). A practical guide for teaching science to students with special needs in inclusive settings. Austin, TX: ProEd.Mastropieri, M. A., & Scruggs, T. E. (1994). Text versus hands-on science curriculum: Implications for students with disabilities. Remedial and Special Education, 15, 72-85.Mastropieri, M. A., & Scruggs, T. E. (1997). How effective is inquiry learning for students with mild disabilities? Journal of Special Education, 31, 199-211.Mastropieri, M. A., Scruggs, T. E., & Levin, J. R. (1985). Mnemonic strategy instruction with learning disabled adolescents. Journal of Learning Disabilities, 18(2), 94-100.Mastropieri, M. A., Scruggs, T. E., & Magnusen, M. (1999). Activities-oriented science instruction for students with disabilities. Learning Disability Quarterly, 22, 240-249.Miller, M. (1999). The opportunities and challenges of guided inquiry science for students with special needs (Unpublished doctoral dissertation). University of Michigan, Ann Arbor.Moore, R. W., & Foy, R. L. H. (1997). The scientific attitude inventory: A revision (SAI II). Journal of Research in Science Teaching, 34(4), 327-336.National Research Council. (1996). Introducing the National Science Education Standards. Washington, DC: The National Academy of Sciences. Retrieved from http://www.nap/edu/readingroom/books/intronses/National Research Council. (2000). Inquiry and the national science education standards: A guide for teaching and learning. Washington, DC: National Academies Press.National Research Council.(2005). Systems for state science assessment. Washington, DC: National Academies Press.Ormsbee, C. K., & Finson, K. D. (2000). Modifying science activities and materials to enhance instruction for students with learning and behavioral problems. Intervention in School and Clinic, 36(1), 10-21.Osborne, J., & Collins, S. (2001). Pupils’ views of the role and value of the science curriculum: A focus-group study. International Journal of Science Education, 23(5), 441-467.Roth, K., & Garnier, H. (2006). What science teaching looks like: An international perspective. Educational Leadership. 64(4), 16-23.Schloss, P. J., Smith, M. A., & Schloss, C. A. (2001). Instructional methods for secondary students with learning and behavior problems. Boston, MA: Allyn & Bacon.Scruggs, T. E., & Mastropieri, M. A. (1993). Current approaches to science education: Implications for mainstream instruction of students with disabilities. Remedial and Special Education, 14, 15-24.Scruggs, T. E., & Mastropieri, M. A. (2007). Science learning in special education: The case for constructed versus instructed learning. Exceptionality, 15, 57-74.Shmulsky, S. (2003). Social and emotional issues associated with learning disabilities. In L. C. Shea & S. W. Strothman (Eds.), Understanding learning disabilities at the postsecondary level: A landmark college guide (pp. 63-76). Putney, VT: Landmark College.Steele, M. M. (2005). Teaching students with learning disabilities: Constructivism or behaviorism? Current Issues in Education,8(10). Retrieved from http://cie.ed.asu.edu/volume8/number10/Thurlow, M., Moen, R., & Altman, J. (2006). Annual performance reports: 2003-2004 state assessment data. Minneapolis, MN: University of Minnesota, National Center on Educational Outcomes.U.S. Department of Education (2002). No child left behind: A desktop reference. Washington, DC: U.S. Department of Education.Wandersee, J. H., Mintzes, J. J, & Novak. J. D. (1994). Learning: Research on alternative conceptions. In D. Gabel (Ed.) Handbook of Research in Science Teaching and Learning (pp. 177-210). National Science Teachers Association: MacMillan Publishing Company.
204
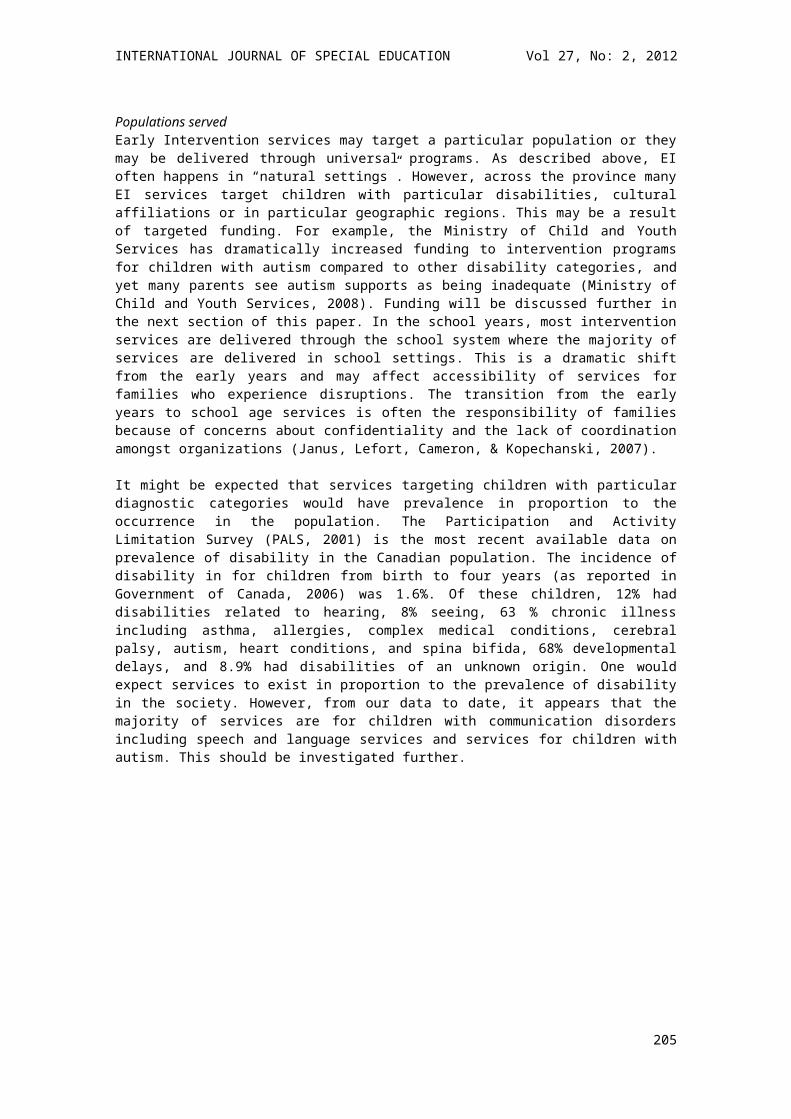
INTERNATIONAL JOURNAL OF SPECIAL EDUCATION Vol 27, No: 2, 2012
Appendix A. Quiz Item Examples
Skills Conceptual Problems Application Problems
Simple circuits Look carefully at the following diagram representing a series circuit. What happens when you open or close the circuit?
The following two circuits use the same battery. The lamp in which circuit will be brighter, A or
B?a. Ab. B
A
B
Conductors and insulators
Measure of the opposition to the flow of free electrons in an electric circuit is known as:
a. Currentb. Resistancec. Conductance
Which one of the following pairs are insulators
a. Copper and ironb. Gold and ceramicc. Plastic and woodd. Steel and mercury
Appendix A (continued)Quiz Item ExamplesParallel circuits What is a parallel circuit?
a. An electric current having more than one path along which electric current can flow.
b. An electric current having more than one path along which electric current can't flow.
In the following circuit, which bulbs will light if only switches A, B, D and F are closed?
a. 3, 4, 5b. 1, 2, 6c. 6 and 2 onlyd. 1,2, 3, 5, 6
205
INTERNATIONAL JOURNAL OF SPECIAL EDUCATION Vol 27, No: 2, 2012
Electromagnetism When current flows through conductor is produced around it.
a. Magnetic fieldb. Power Energy
You have two electromagnets that are the same except one has 10 coils and one has 20 coils. Which one will pick up more paper clips?Explain your answer.
a. 10 coil electromagnetb. 20 coil electromagnet
206
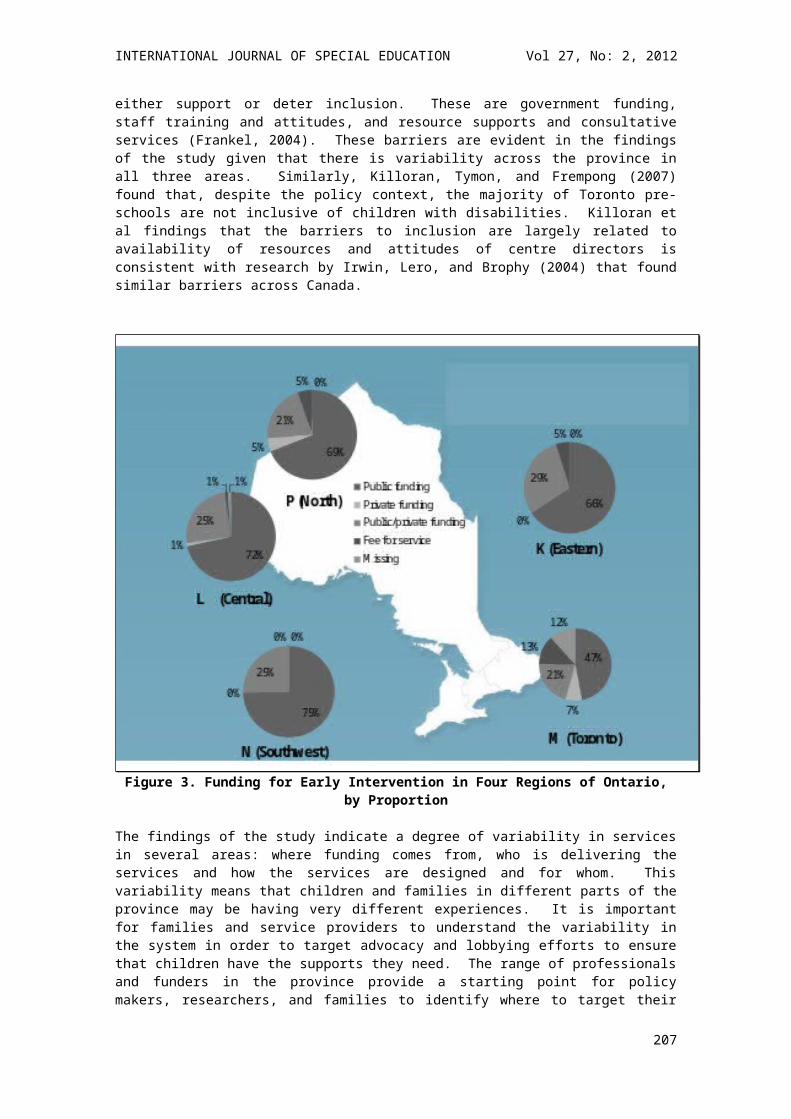
INTERNATIONAL JOURNAL OF SPECIAL EDUCATION Vol 27, No: 2, 2012
VALIDITY AND RELIABILITY OF TURKISH VERSION OF GILLIAM AUTISM RATING SCALE-2: RESULTS OF PRELIMINARY STUDY
Ibrahim H. DikenOzlem Diken
Anadolu University
James E. GilliamAustin, Texas
Avsar ArdicPamukkale University
Dwight SweeneyCalifornia State University at San Bernardino
The purpose of this preliminary study was to explore the validity and reliability of Turkish Version of the Gilliam Autism Rating Scale-2 (TV-GARS-2). Participants included 436 children diagnosed with autism (331 male and 105 female, mean of ages was 8.01 with SD=3.77). Data were also collected from individuals diagnosed with intellectual disability, with hearing impairment, and from typically developing children in order to examine discrimination validity of the TV-GARS-2. After carrying out Turkish translation procedure, reliability and validity of TV-GARS-2 were explored by conducting a series of analyses. Results yielded that TV-GARS-2 is a reliable and valid assessment tool to be used with individuals with autism in Turkey.
Autism is known to occur around the world regardless of race, culture, and economic class (Trembath, Balandin, & Rossi, 2005). Studies conducted by Baird et al., (2006), Ellefssen et al., (2007), and Gilbert, Cederlund, Lamberg, & Zeijlon, (2006), suggest that approximately one percent of the child population presents with some form of Autistic Spectrum Disorders (ASD). However, there are relatively few tests available outside of English speaking countries for identifying and assessing the disorder. spacing The instruments that are available are often translations of tests that were developed and normed in English speaking countries (e.g., Al Jabery, 2008). The purpose of this study was to translate the Gilliam Autism Rating Scale-Second Edition (GARS-2) into Turkish and conduct psychometric evaluations to determine its efficacy when used in a non-English speaking country.
As a lifelong, trainable, and developmental disorder with an age of onset prior to three years (Diagnostic and Statistical Manual of Mental Disorders, 4th Edition, Text Revision; DSM-IV-TR, 2000; Filipek et al., 1999, 2000; International Classification of Diseases-10; ICD-10, 1993; Volkmar et al., 1994), autism is a disorder classified among a group of disorders under Autism Spectrum Disorders (ASD) or Pervasive Developmental Disorder (PDD) (DSM-IV-TR, 2000). According to the data from the Center for Disease Control and Prevention (CDC) study in 2000 and 2002 in the US, the prevalence of ASD is 1 in 150 or 6.6 per 1000 of 8-year old children. An average male-to-female ratio of 4.3:1 was also reported (CDC, 2007). Qualitative impairments in social interaction and communication, restricted, repetitive, and stereotyped patterns of behavior, interest, and activities are three common areas that individuals with autisms associated with ASD.
207
INTERNATIONAL JOURNAL OF SPECIAL EDUCATION Vol 27, No: 2, 2012
In order to be eligible to receive special education or related treatment services, early identification or diagnosis process is crucial for children with special needs including those with autism. Therefore, screening and assessment procedures in terms of the child find process have to happen as early as possible (Filipek et al., 1999; Stone & DiGeronimo, 2006; Volkmar et al., 1999). Assessment and treatment procedures in ASD are two main areas in which several professional groups and professionals have been interested. For example, American Academy of Pediatrics (The Pediatrician’s Role in the Diagnosis and Management of Autistic Spectrum Disorder in Children, 2001; Technical Report: The Pediatrician’s Role in the Diagnosis and Management of Autistic Spectrum Disorder in Children, 2001; Identification and Evaluation of Children with Autism Spectrum Disorders: Guidelines for the Clinician Rendering Pediatric Care: Clinical Report by Johnson, Myers, & the Council on Children with Disabilities, 2007), the Child Neurology Society and American Academy of Neurology (The Screening and Diagnosis of Autistic Spectrum Disorders by Filipek et al., 1999, 2000), and American Academy of Child and Adolescent Psychiatry (The Practice Parameters for the Assessment and Treatment of Children, Adolescents, and Adults with Autism and Other Pervasive Developmental Disorders by Volkmar et al., 1999) have been established and provided valuable information regarding assessment processes for individuals with autism (As cited in Al Jabery, 2008). Among these studies, the practice parameter study (Filipek et al., 1999, 2000) stated two levels for the screening and assessment process: Level one and level two. The focus of the level one is the screening process whereas the purpose of level two is the process of diagnose. Johnson, Myers, & the Council on Children with Disabilities (2007) and Filipek et al. (1999, 2000) recommended specific screening tools regarding autism for professionals to use when they have concerns about the individual. Gilliam Autism Rating Scale (GARS) and Gilliam Autism Rating Scale-2 (GARS-2) as level two instruments have been recommended for at risk children 18 months and older. In addition, Coonrod and Stone (2005), and Lord and Corsello (2005) recommended Gilliam Autism Rating Scale (GARS) as non-age specific measures.
Gilliam Autism Rating Scale-2 (GARS-2, 2006) is revised version of Gilliam Autism Rating Scale (1995). GARS-2 was recommended to be used as type two (level two) assessment instruments by Johnson, Myer, and the Council on Children with Disabilities (2007) guidelines. The GARS and GARS-2 have been used in several studies (e.g., Al Jabery, 2008; Hodge, 2008; Lecavalier, 2005; Mazefsky and Oswald, 2006; Phillips, 2009; Schreck and Mulic, 2000; South et al., 2002; Tafiadis, Loli, Tsanousa, and Tafiadi, 2008). Out of these studies, in two studies GARS-2 was adapted in two different cultures or languages. Al Jabery (2008), for example, in his study, examined reliability and validity of the Jordanian translated Arabic version of the GARS-2 with Jordanian population while Tafiadis, Loli, Tsanousa, and Tafiadi, (2008) studied psychometric characteristics of the GARS-2 with Greek population in Greece. Results of both of these studies showed that adapted GARS-2 had high level of reliability and validity characteristics in both groups of populations. There is currently no standardized or norm-referenced assessment tool in Turkey to screen, diagnose or to be used in the assessment practices of children and adults with autism although reliability and validity of Autism Behavior Checklist-ABC (Krug, Arick, & Almond, 1993) was studied with Turkish sample(Irmak, Sütçü, Aydın, & Sorias, 2007). Therefore, there is an emergent need to have standardized or norm-referenced assessment tool(s) for assessment of individuals with autism in Turkey. This study was designed to provide a valid and reliable either level one or two assessment tool to be utilized by professionals to meet the needs of children and young adults with autism and their families for accurate and appropriate assessment practices in Turkey.
MethodParticipantsParticipants included 436 children and young adults who had been diagnosed with autism. Out of 436, 331 (75.9%) was male and 105 (24.1 %) was female. Participants’ age ranged from 3 to 21 with a mean of 8.01 (SD=3.77).
Data CollectionParticipants were selected in a variety of ways. Parents, teachers, psychologists, and other professionals working in private special education and rehabilitation centers in nine cities of Turkey were contacted by the first author and asked to complete the GARS-2 for students with autism. The following criteria were used to be included in the study: (a) having a diagnosis of autism according to psychological testing done in Counseling and Guidance Centers and individuals’ health reports, (b) being between ages of 3 and 21, (c) residing in the Turkey. Applying these criteria, 533 participants were reached. However, data collected from 97 of these participants was not included because all items had not re not filled out for these participants. So, the final normative sample included 436 children and young adults with autism.
208
INTERNATIONAL JOURNAL OF SPECIAL EDUCATION Vol 27, No: 2, 2012
During the study, additional data were collected on children and young adults who did not have autism. They had diagnoses of intellectual disability and hearing impairment. In addition, data on children and young adults with normal development were collected to establish a control group. These data were also collected from teachers and parents and were used for studies of the discriminating validity of the TV-GARS-2 but were not used in the establishing the norms the instrument. These participants (N=137) were diagnosed with intellectual disability (n= 44) and hearing impairment (n=49). A group with normal development (n= 44) was also selected to serve as a control group.
MeasureGilliam Autism Rating Scale-2 (GARS-2, 2006). GARS-2 is comprised of three subscales (stereotyped behaviors, communication, and social interaction), with 14 items in each, and a total of 42 items. Items were developed based on the definition of autism adopted by the Autism Society of America and on diagnostic criteria for the autism published in DSM-IV-TR (2000). As indicated in its manual (Gilliam, 2005), GARS-2 can be used for following five purposes: (a) identifying persons who have autism, (b) assessing persons refereed for serious behavior problems, (c) documenting progress in the areas of disturbance as a consequence of special intervention programs, (d) targeting goals for change and intervention on a student’s Individualized Education Plan (IEP), and (e) measuring autism in research projects. As a norm-referenced screening instrument, GARS-2 has been used for the assessment of individuals with autism.
GARS-2 was normed on a sample of 1,107 children and young adults aged between 3 and 22 who had been diagnosed as autism. Reliability of validity of the GARS-2 was examined by carrying out a series of psychometric procedures such as content sampling and time sampling for reliability, content-description validity, criterion-related validity, and construct-identification validity for validity. Results of these analyses revealed that GARS-2 a psychometrically sound screening instrument (Gilliam, 2006).
ProcedureNormative Scores. The subscales of TV-GARS-2 are all norm-referenced based on the results from the participants in the normative sample. Raw score means and standard deviations were calculated, and raw scores were then converted to normalized standard scores and percentile ranks. The standard scores are normally distributed and allow an examiner to compare an individual’s performance among the three subscales. An individual’s score may also be compared to those of the TV-GARS-2 normative sample.
Standard Scores. Standard score norms are expressed as standard deviation units that designate a score’s distance from average performance of the normative sample by applying a predetermined mean and standard deviation. For example, the mean and standard deviation for z-score are 0 and 1, respectively; for T-score, they are 50 and 10; and so on. For the TV-GARS-2 subscales, the mean has been set at 10 and the standard deviation at 3 as set in the original GARS-2. Standard scores for the TV-GARS-2 subscale are derived directly from a cumulative frequency table containing the raw scores received by the normative sample. When normative tables are constructed, the raw scores are transformed into the desired derived distribution (i.e., into a distribution with a mean of 10 and a standard deviation of 3). Raw score means and standard deviations were computed for each age and gender. There were minimal differences between participants at different age levels. This is not surprising because the behaviors of autism are not known to differ in terms of age (American Psychiatric Association, 1994). Statistical analyses were undertaken to confirm these observations. Correlations of subscale raw scores with age resulted in correlations of .08 for stereotyped Behaviors (n.s.); .15 for Communication (p<.01); and .06 for Social Interaction (n.s.). One-way analysis of variance of TV-GARS-2 subscales scores by gender did not reveal significant differences between males and females on each subscale. The correlation of subscale raw scores with gender resulted in no significances. Correlations of subscale raw score with gender resulted in correlations of .03 for Stereotyped Behaviors (n.s.); .03 for Communication (n.s.); and .03 for Social Interaction (n.s.).
Autism Index. The Autism Index is another type of normalized standard score. This index has a mean of 100 and a standard deviation of 15 (as set in the original GARS-2) and represents the TV-GARS-2’s overall assessment of the characteristics of autism manifested by an individual. The Autism Index is derived by summing the standard scores for all subscales of the TV-GARS-2 that were recorded.
Percentile Ranks. Percentile ranks are reported for each of the TV-GARS-2 subscales. Percentile ranks, like standard scores, are derived directly from the raw score distribution of a test. They indicate the
209
INTERNATIONAL JOURNAL OF SPECIAL EDUCATION Vol 27, No: 2, 2012
percentage of scores in the normative group that are above or below the score question. Table 1 represents information in converting raw scores to standard scores and percentiles on TV-GARS-2.
Table 1. Converting Raw Scores to Standard Scores and Percentiles TV-GARS-2 Subscales
Standard ScoreStereotyped Behaviors Communication
Social Interaction%
1 _ _ _ <12 _ _ _ <13 _ _ _ <14 1-2 1-2 1-3 <156
3-56-8
3-56-8
4-78-10
48
78
9-1112-14
9-1112-14
11-1314-16
1930
910
15-1718-20
15-1718-20
17-2021-23
4260
1112
21-2324-26
21-2324-26
24-2627-30
7283
1314
27-2930-32
27-2930-32
31-3334-36
8995
1516
33-3536-38
33-3536-38
37-3940-42
98>99
1718
39-4142
39-4142
__
>99>99
1920
__
__
__
>99>99
ResultsReliability of the TV-GARS-2Content Sampling. The internal consistency reliability of the items on the TV-GARS-2 was investigated using Cronbach’s coefficient alpha. Coefficient alphas were computed for all of the subscales of the TV-GARS-2 using all of the participants. The resulting coefficients for each subscale are Stereotyped Behaviors .82; Communication .81; Social Interaction .87; and for the total test (all 42 items) .91.
Time Sampling. To determine whether the results of the TV-GARS-2 are stable over time, a study was completed in which raters completed the TV-GARS-2 twice, 2 weeks apart, on 35 individuals with autism enrolled in a private special education and rehabilitation center in Eskisehir in Turkey. The raters were parents of the children. The mean age of the children was 6 years (SD=2.8). Twenty-seven of children were male and eight were female. Raw scores for the two testing were converted into standard scores and indexes. The values were then correlated and corrected for restriction in range. The results, reported in the Table 2, provide evidence of the stability of the TV-GARS-2 when used with individuals with autism. The coefficients are all beyond the .01 level of significance and of sufficient magnitude to suggest that the TV-GARS-2 has good test-retest reliability for use as an instrument for identifying persons with autism. These findings demonstrate that the TV-GARS-2 yields results that are stable over time.
Validity of the TV-GARS-2Translation procedures and face validity. During the Turkish translation process of the GARS-2, six Turkish professionals working in the field of special education provided input about Turkish version of the GARS-2 items. By gathering Turkish translations of items from six professionals, a final version of items was prepared by the first author. After retranslating items to English, they were then translated from English to Turkish by a professional in special education who had excellent English and Turkish skills and was familiar with the characteristics of individuals with autism. Final version of Turkish items of GARS-2 then was tested with a small sample of parents. Fifteen parents filled out the final form and provided input about its face validity.
210
INTERNATIONAL JOURNAL OF SPECIAL EDUCATION Vol 27, No: 2, 2012
Table 2. Results of Time Sampling of the TV-GARS-2
TV-GARS-2 SubscalesTime 1 Time 2 Correlations rc
M SD M SD r rc
Stereotyped Behaviors 9 3 9 3 .97* .96*
Communication 9 2 9 2 .97* .98*
Social Interaction 9 3 9 3 .96* .96*
Autism Index 95 15 95 14 .94*.94*
*p<.01, rc= coefficent corrected for restricted range
Content-description validity and item analysis. Item-discrimination analysis was conducted to confirm the validity of the test items. Two item discrimination criteria were used test the TV-GARS-2. Using the criteria established by Hammill, Brown, & Bryant (1992), the item-discrimination coefficients had to be statistically significant at or beyond the level .05 level. Second, at least half of the correlation coefficients had to reach or exceed .35 in magnitude. The minimum is large enough to ensure that each item is making a meaningful contribution to the subtest. Conventional item analysis was performed on 301 cases from the sample. These cases were selected because they had complete data; that is, all 42 items of the TV-GARS-2 were completed. In most cases, item analyses are performed for each age interval, but because little relationship exists between age and scores on the TV-GARS-2 subscales, item analyses were not necessary at each age. The results regarding item-discrimination coefficients are reported in Table 3.
Table 3. Item-Discrimination Coefficents for the TV-GARS-2 SubscalesStereotyped Behavior Communication
Social Interaction
Item # r Item # r Item # r1234567891011121314
.43
.25
.35
.32
.33
.37
.40
.45
.39
.38
.38
.37
.49
.42
1516171819202122232425262728
.37
.36
.38
.44
.46
.50
.36
.26
.26
.27
.26
.46
.38
.33
2930313233343536373839404142
.48
.55
.38
.41
.53
.50
.54
.57
.61
.46
.51
.50
.55
.33
Median = .38 Median = .36 Median = .50
The following median coefficients were obtained; Stereotyped Behavior, .38; Communication, .36; Social Interaction, .50. The median coefficient with sum of all items was .39. The median coefficients for the subscales and sum were statistically significant (p<.01). In addition, they were well beyond the minimum criteria for magnitude and provide ample evidence of content-description validity.Construct-identification validity. To demonstrate the construct validity of a test, one must delineate as fully as possible the variable (construct) that the test purports to measure. This is done by setting up hypotheses are subjected to scientific investigation, and they are accepted or rejected on the basis of the
211
INTERNATIONAL JOURNAL OF SPECIAL EDUCATION Vol 27, No: 2, 2012
results. The following hypotheses (as tested in the original study of the GARS-2) were tested for construct-identification validity of the TV-GARS-2:
1. Because the behaviors measured by the TV-GARS-2 reflect the lifelong nature of autism, TV-GARS-2 scores should not correlate highly with chorological age.2. Because the TV-GARS-2 subscales are related to each other (i.e., they all contain items that measure some aspect of autism), the subscales of the TV-GARS-2 should be positively related to each other. 3. Because the items within each TV-GARS-2 subscale measure similar traits, the items of a subscale should relate highly with the total score of that subscale. 4. Because the TV-GARS-2 subscales all measure characteristics of autism, they should be positively related to the Autism Index.5. Because the TV-GARS-2 measures autism, the scores of persons with autism should differ significantly from those of persons who do not have autism.6. Because the TV-GARS-2 measures autism, the TV-GARS-2 scores should discriminate persons who have autism from those who do not.
Hypothesis 1: Relationship of the TV-GARS-2 subscales to age. To study this hypothesis, the TV-GARS-2 raw scores were correlated with age using data of all participants with autism. The resulting coefficients were found .08 (p>.01) for Stereotyped Behaviors, .15 (p<.01) for Communication, , .06 (p>.01) for Social Interaction, and 14 (p<.01) for total (sum of all 42 items.
Hypothesis 2: Interrelationship among GARS-2 subscales. To examine the relationships of the TV-GARS-2 subscales, standard scores of the subscales were correlated for all the participants. Table 4 displays the results of the correlations of the TV-GARS-2 subscales. All of the correlations are moderate to large in magnitude by Hopkins’s criteria. Clearly, the items of each subscale measure the same construct (i.e., behavioral characteristics of autism). Table 4
Table 4. Correlation of TV-GARS-2 Subscale Standard Scores (Decimals Omitted)StereotypedBehaviors Communication
Communication 34*_
Social Interaction 65*53*
*p < .01
Hypothesis 3: Validity of TV- GARS-2 items. The discriminating power of an item, computed by the point-biserial method of item-total correlations, is sometimes referred to as item validity because these coefficients reflect the degree to which the items of a subtest or test are measuring the same constructs. These data can be cited as evidence of a test’s reliability because strong item discrimination can only result from strong construct validity. Evidence of the item validities associated with the TV-GARS-2 appears in Table 3. Tests having poor construct-identification validity are unlikely to be composed of items having coefficients of the size reported in this table.
Hypothesis 4: Relationship of subscale standard scores to the Autism Index. To test this hypothesis, the standard scores for all subscales of the participants in the sample were correlated with the Autism Index. Part-whole correlations were computed, meaning that when a subscale was correlated with the Autism Index, its values were excluded from the index before the correlation was computed. In this way, the true correlation of the subscale value to the Autism Index is verified. As can be seen in Table 5, all correlations are large in magnitude and significant (p < .01).
Table 5. Correlation of GARS-2 subscales with the Autism Index (Decimals omitted)Stereotype Behaviors Communication
Social Interaction
Autism Index 44* 48*60*
*p < .01
212
INTERNATIONAL JOURNAL OF SPECIAL EDUCATION Vol 27, No: 2, 2012
Hypothesis 5: Differences on TV-GARS-2 standard scores between diagnostic groups. In terms of the TV-GARS-2, individuals who will be tested with this instrument will be those with severe behavioral disorders and developmental disabilities. Therefore, to establish the validity of the TV-GARS-2, a sample of individuals without autism was administered the GARS-2 (N=137). These participants were diagnosed with intellectual disability (n= 44) and hearing impairment (n=49). A group with normal development (n= 44) was also selected to serve as a control group. To test hypothesis that persons from different diagnostic groups will score differently than persons with autism on the TV-GARS-2, One-way analysis of variance procedure was run but homogeneity of variance (Levene Test) is not assumed. Therefore, appropriate nonparametric procedures (Kruskal-Wallis H and Mann-Whitney U test) were run. Results showed that differences between groups were statistically significant. Table 6 reports the mean standard scores for all groups. On each TV-GARS-2 subscale and the Autism Index, the group with autism received significantly higher scores (p < .01) than the other diagnostic groups. On the Autism Index, the group with normal development received significantly lower ratings than the other diagnostic groups. Table 6
Table 6. Mean of standard scores of different diagnostic groups on the TV-GARS-2
TV-GARS-2 Subscale Standard Scores
Diagnostic Group NStereotyped Behaviors Communication
Social Interaction
Autism Index
Intellectual Disability 44 4 5 5 69
Hearing Impairment 49 2 2 1 49
Normal Development 44 1 1 1 46
Autistic Disorder 436 10 10 10 100
DiscussionWith the current study, we aimed at providing a valid and reliable assessment tool to be utilized by professionals in Turkey. For this aim, we studied validity and reliability of the Turkish version of GARS-2. Participants in the normative sample covered a wide geographic range coming from 9 cities around Turkey. This diversity adds to the strength of the subscales and provides comparisons for a variety of relevant demographic characteristics. In the study, parents (n=254) completed the subscales more than professionals (n=182). This ratio approximately 3:2 seems appropriate because teachers and other professionals will be the principal raters using the TV-GARS-2. Moreover, the GARS was also found to be useful and recommended as an appropriate instrument for gathering information from parents about their children with autism (Filipek et al., 2000). Since there is no information about prevalence characteristics of individuals with autism in Turkey, we can not decide whether our sample represent the autistic population of Turkey. However, given the male-to-female ratio (3.15:1 in the US) as a reference, the sample used for this study appears representive.
According to Hammill et al., (1992), normative samples should have at least 75 to 100 participants at every age level and at least 750 to 1000 in the total sample. The normative sample for the TV-GARS-2 does not meet this standard for both total sample size and the minimum of 75 participants at all of ages. Results of the current study revealed that there were minimal differences between participants at different age levels. This was not surprising because the behaviors of autism are not known to differ in terms of age (American Psychiatric Association, 1994). Statistical analyses were undertaken to confirm these observations. Correlations of subscale raw scores with age resulted in correlations of .08 for stereotyped Behaviors, .15 for Communication (p<.01), and .06 for Social Interaction. Although the correlation for Communication with age is significant, its magnitude is small according to Hopkins’ Likert-scale approach in determining the magnitude of coefficients (As cited in Gilliam, 2006). He suggested that coefficients between 0.0 and .09 are very small, coefficients between .1 and .29 are small, coefficients between .3 and .49 are moderate, coefficients between .5 and .69 are large, and coefficients between .7 and .89 are very large. Using Hopkins’s guidelines, one must conclude that the relationship between subscale scores and age on the TV-GARS-2 is relatively meaningless. Based on this information, even though age might not be seen as a concern, sample size is a limitation of the current
213
INTERNATIONAL JOURNAL OF SPECIAL EDUCATION Vol 27, No: 2, 2012
study. By taking this study as a preliminary study of standardization process of the TV-GARS-2, norming should be done with 750 to 1000 participants.
Results related to internal reliability of total scale and all subscales of the TV-GARS-2 suggest that the items within the subscales are quite consistent and all of the subscales are sufficiently reliable for contributing to important diagnostic decisions. Test-retest data also suggested that TV-GARS-2 yields results that stable over time. So, this information provides confidence in the subscales to professionals when making decisions or interpreting results from the TV-GARS-2.
Results regarding item analyses of TV-GARS-2 showed that the test items provide ample evidence of content-description validity. Although criterion-validity of the TV-GARS-2 could not be checked since there is no standardized assessment tool in Turkey, construct-identification data also provided sufficient evidence for Turkish version of the GARS-2. For example, age was found that it had no meaningful relationship with TV-GARS-2. Using Hopkins’s criteria, the correlation coefficients among subscales have been found moderate to large in magnitude. In addition, when examining relationship of subscale standard scores to the Autism Index, large in magnitude and significant correlations have been found. This results supports that Autism Index can be used as the best predictor of the likelihood of the diagnosis of autism. Regarding discrimination-validity of the TV-GARS-2, results revealed that TV-GARS-2 can be used in differentiating persons with autism from other special needs groups or persons with normal development and the identification of individuals with autism from individuals from other diagnostic groups.
Overall reliability and validity results of TV-GARS-2 are very similar results of other studies (Al Jabery, 2008; Gilliam, 2006) and similar results at some points (Limited information was provided at the short abstract of poster presentation) with the study carried with Greek population (Tafiadis, Loli, Tsanousa, & Tafiadi, 2008). These results support the knowledge base that autism is a universal disorder regardless of culture. Results of this study also provide evidence that GARS-2 is culturally robust scale.
The results of this study should be interpreted with the following main limitation. As we mentioned earlier, according to Hammill et al., (1992), normative samples should have at least 750 to 1000 in the total sample for standardization process of developing a test. Therefore, with 436 sample size this study should be considered as a preliminary study of standardization.
ReferencesAl Jabery, M. A. (2008). The examination of validity and reliability indicators of the Jordanian translated Arabic version of the Gilliam Autism Rating Scale (GARS-2). Unpublished doctoral dissertation, Wayne State University, Michigan.American Academy of Pediatrics. (2001). Committee on Children with Disabilities: the Pediatrician’s role in the diagnosis and management of autistic spectrum disorder in children. Pediatrics, 107 (5), 1221-1226American Academy of Pediatrics. (2001) Committee on Children with Disabilities: Technical report: the pediatrician’s role in the diagnosis and management of autistic spectrum disorder in children. Pediatrics, 107 (5), 1221-1226.American Psychiatry Association (1994). Diagnostic and statistical manual of mental disorders (4th ed.). Washington, DC: American Psychiatry Association.American Psychiatry Association. (2000). Diagnostic and statistical manual of mental disorders (4th ed. Text Revision). Washington, DC: American Psychiatry Association.Baird, G., Simonoff, E., Pickles, A., Chandler, S., Loucas, T., Meldrum, D., & Chairman, T. (2006) Prevalence of disorders of the autism spectrum in a population cohort children in South Thames: The special needs and autism project (SNAP), Lancet, 368, (9531): 210-215.Center for Disease Control and Prevention (2007). Prevalence of autism spectrum disorders: autism and developmental disabilities monitoring network, 14 Sites, United States, 2002. MMWR Surveill Summ. 56(1):12–28Ellefssen, A., Kampmann, H., Billstedt, E., Gillberg, I.C., & Gillberg, C. (2007). Autism in the Faroe Islands: An epidemiological study, Journal of Autism and Developmental Disorders, 33 (3): 703-707. Filipek, P.A., Accardo, P.J., Ashwal, S., Baranek, G.T.,Cook, E.H. Jr., Dawson, G., et al. (1999).The Screening and diagnosis of autistic spectrum disorders. Journal of Autism and Developmental Disorders, 29, 439–484.
214
INTERNATIONAL JOURNAL OF SPECIAL EDUCATION Vol 27, No: 2, 2012
Filipek, P.A., Accardo, P.J., Ashwal, S., Baranek, G.T.,Cook, E.H. Jr., Dawson, G., et al. (2000). Practice parameter: screening and diagnosis of autism: report of the quality standards subcommittee of the American Academy of Neurology and the Child Neurology Society. Neurology, 55, 468–479.Hammill, D. D., Brown, L., & Bryant, B. R. (1992). A consumer’s guide to tests in print (2nd ed.). Austin, TX: Pro-Ed.Hodge, D. (2008). Children's sleep problems and maternal mental health in mothers of children with and without Autism [Unpublished doctoral dissertation]. Claremont Graduate University, California.Irmak, T. Y., Sütçü, S. T., Aydın, A., & Sorias, O. (2007). Otizm davranış listesinin (ABC) geçerlik ve güvenirliğinin incelenmesi [Investigating reliability and validity of Autism Behavior Checklist (ABC)]. Çocuk ve Ruh Sağlığı Dergisi, 14(1), 13-23. Gilbert, C., Cederlund, M., Lamberg, K., & Zeijlon, C. (2006). Brief report. The autism epidemic: The registered prevalence of autism in a Swedish urban area. Journal of Autism and Developmental Disorders, 36 (6): 429-435.Gilliam, J. E. (1995). Gilliam Autism Rating Scale (GARS). Austin, TX: Pro-Ed.Gilliam, J.E., (2006). Gilliam Autism Rating Scale: Second Edition. Austin, TX.: PRO-ED.Johnson, C.P., Myers, S.M., & Council on Children With Disabilities. (2007). Identification and evaluation of children with autism spectrum disorders. Pediatrics,120 (5), 1183–1215. Retrieved November 16, 2009, from www. aap . org / pressroom / AutismID . pdf Lecavalier, L. (2005). An evaluation of the Gilliam Autism Rating Scale. Journal of Autism and Developmental Disorders, 35 (6), 795— 805.Mazefsky, C., & Oswald, D. (2006). The discriminative ability and diagnostic utility of the ADOS-G, ADI-R, and GARS for children in a clinical setting. Autism, 10(6), 533-549.Phillips, N. (2009). A survey of the work and interactions of school psychologists, school neuropsychologists and clinical psychologists in schools today. Unpublished doctoral dissertation, Claremont Graduate University, California.Schreck, K. A., and Mulick, J. A. (2000). Parental report of sleep problems in children with Autism. Journal of Autism and Developmental Disorders, 30 (2), 127-135.South, M., Williams, B. J., McMahon, W. M., Owley, T., Filipek, P. A., Shernoff, E., Corsello, C., Lainhart, J. E., Landa, R., & Ozonoff, S (2002). Utility of the Gilliam Autism Rating Scale in research and clinical populations. Journal of Autism and Developmental Disorders, 32 (6), 593–599.Stone, W.L., & DiGeronimo, T.F. (2006). Does my child have autism? : a parent’s guide to early detection and intervention in autism spectrum disorders. Jossey-Bass: San Francisco.Tafiadis, D., Loli, G., Tsanousa, E, & Tafiadi, M. (2008). The Gilliam Autism Rating Scale (GARS - 2), a pilot study for the Greek autistic population. Poster presented at International Society on Brain and Behaviour: 3rd International Congress on Brain and Behaviour, Thessaloniki, Greece. 28 November – 2 December 2007. Trembath, D. Balandin, S., & Rossi, C. (2005). Cross-cultural practice and autism. Journal of Intellectual & Developmental Disability, 30, 240-242. Volkmar, F.R., Cook, E.H., Pomeroy, J., Realmuto, G., & Tanguay, P. (1999). Practice parameters for the assessment and treatment of children, adolescents, and adults with autism and other pervasive developmental disorders. American Academy of Child and Adolescent Psychiatry Working Group on Quality Issues. Journal of the American Academy of Child and Adolescent Psychiatry, 38 (12), 32S–545.Volkmar, F.R., Klin, A., Siegal, B., Szatmari, P., Lord, C., Campbell, M., et al. (1994). Field trial for autism in DSM-IV. American Journal of Psychiatry, 151, 1361-1367.World Health Organization (1993). The ICD-10 classification of mental and behavioral disorders: Clinical descriptions and diagnostic guidelines. Geneva, Switzerland: World Health Organization.
215
INTERNATIONAL JOURNAL OF SPECIAL EDUCATION Vol 27, No: 2, 2012
WHO SINNED? PARENTS’ KNOWLEDGE OF THE CAUSES OF DISABILITY IN TANZANI
Frida D. TungarazaUniversity of Dar es Salaam
This study aimed at finding out from parents what they knew to be the causes of their children’s disabilities. One hundred and twenty six parents from four regions, namely Dar es Salaam, Dodoma, Kilimanjaro and Morogoro were involved in this study. Data was collected through interview, narratives and observation. It was obvious from the findings that diseases were the major causes of disabilities. Malaria was mentioned by parents as the leading cause of disability. Many of the parents had only primary education and the majority of them (84.92%) had no reliable income. From the background of the parents, it was evident that disability is a cause as well as consequence of poverty. It was not easy to say for sure ‘ who sinned’, but it was starkly evident that most of the problems stemmed from poverty, though ignorance and beliefs might have played a role in some cases.
IntroductionThe history of persons with disabilities is as old as mankind. People with disabilities have always lived in all of our communities, but causes of disabilities have, often, been misconstrued or not known at all. Many years back and may be even today, disability was associated with curse and/or sin. Some parents, were often, and are still being accused of being the cause/source of their children’s disabilities. We even read in the Bible that when Jesus met the blind man, his disciples asked Him, Teacher, whose sin caused him to be born blind? Was it his own or his parents’ sin…? Jesus answered, His blindness has nothing to do with his sins or his parents’ sins… (John 9:2-3). What causes disability is a question that many people have grappled or wrestled with for along long time, and have still not come to grips with to date . Some people have answers to causes of some disabilities, but others are still searching for answers to their children’s disabilities. Writing about causes of mental retardation, Hallahan and Kauffman (2003) said, not all causes of mental retardation are genetically related, so there still remains a large percentage (probably over 50 percent) in which we are not able to pinpoint the cause of a child’s mental retardation (p. 115).
Many psychologists believe today that both heredity and environment shape who we are. Heredity and environment operate together or cooperate to produce a person’s intelligence, temperament, height, ability to pitch a baseball, ability to read, and so on (Santrock, 2005). However, we cannot say for sure that parents are not the cause of their children’s disabilities because some disabilities in children may be traced to the parents (Turnbull & Turnbull, 1997). Parents’ life style and the environment around them may lead to disabilities. It is important to look at different stages of child development to find out what may be the causes of disability.
Prenatal causes of disability Despite the fact that the fetus is in a well-protected environment, negative influences from outside may still affect it (Cox & Canada, 1994).There is a lot of evidence today that a child’s disability may occur before birth (prenatal) at the time of birth (perinatal) or after birth (postnatal). Congenital malformations may have genetic or environmental causes. For example, one of the most common and easily recognized genetic disorders is Down syndrome that leads to mild or moderate mental retardation and a variety of hearing, skeletal, and heart problems (Kirk, Gallagher & Anastasiow, 2003).
There are also a variety of environmental factors that can affect an expecting mother and thereby affect the development of fetus she is carrying (Hallahan & Kauffman 2003) Maternal nutrition is very important for a pregnant mother. If the mother to be does not maintain a healthy diet, fetal brain
216
INTERNATIONAL JOURNAL OF SPECIAL EDUCATION Vol 27, No: 2, 2012
development may be compromised (Hallahan and Kauffman (2003, p.120). Other psychologists say that an inadequate diet leaves the mother more prone to illness and complications during pregnancy (Cox & Canada, 1994). In addition, Cox & Canada (1994) add:
Malnutrition can cause physical weakness, stunted growth, rickets (softening of the bones), scurvy, (weakness, anemia, bleeding gums) and even mental retardation in the fetus. Poor diet can also cause spontaneous abortions and stillbirths where an infant is born dead (p. 303).
Therefore, quantity and quality maternal nutrition is not only necessary, but is also a must for the health and well-being of both the mother and the unborn child. Viruses and infections often cause mental retardation and a host of other problems. While pregnant, a woman and her developing child are very susceptible to a wide variety of potentially damaging infections (Gargiulo, 2003). Maternal infections can affect the developing fetus and cause disabilities. Rubella (German measles), for example, is a mild, but highly contagious illness that may cause prenatal malformations including blindness, deafness, mental retardation and heart problems (Santrock, 2005; Gargiulo, 2003). No symptoms may occur when you are infected with Rubella. Rubella is also linked to low birth weight and is one of the leading causes of multiple impairments in children (Gargiulo, 2003). Other dangerous maternal infections that may lead to disabilities include gonorrhea and syphilis, HIV/AIDS and genital herpes. Such sexually transmitted diseases are capable of crossing the placenta and attacking the central nervous system of the developing fetus (Gargiulo, 2003). Unlike Rubella which poses greater risks during the first trimester, the risk of syphilis is greater to the unborn child at the later stages of fetal development.
Many unsafe maternal behaviors, among them smoking, illicit drug use and the consumption of alcohol before and during pregnancy have been linked to impaired fetal development (Gargiulo, 2003). Drinking and smoking are some of the things that people do or consume for pleasure. Alcohol use, cigarette smoking and use of drugs during pregnancy are also dangerous to the fetus. Fetal alcohol syndrome (FAS) affects a lot of babies born by chronically alcoholic mothers. Hallahan and Kauffman (2003) reported that world wide, FAS is now seen in about 1 in 1,000 live births, and the prevalence of other disorders related to alcohol use by women during pregnancy is a serious problem (p. 429). Fetal alcohol syndrome children have facial abnormalities, droopy eyelids, heart defects, small size, low birth weight, motor dysfunctions and usually some degree of mental retardation (Kirk, Gallagher & Anastasiow, 2003; Gargiulo, 2003). In addition, studies have also found out that:
Cigarette smoking by pregnant women can adversely influence prenatal development, birth and postnatal development. Fetal and neonatal deaths are higher among smoking mothers. Also prevalent are a higher incidence of pre-term births and lower birth weights, (Santrock, 1999 p. 98).
In addition, many drugs that cause pleasant changes in a pregnant woman’s mood or state, cause damage to her embryo or fetus (Brendt, 1994). Both legal and prescription drugs have been found to be harmful to the unborn child. Illegal drugs include cocaine, marijuana and heroin. Canada & Cox (1994) reported that:
Since the introduction of crack cocaine onto streets, the number of babies born addicted to crack has greatly increased…. ‘Crack babies’ can suffer from brain damage, strokes, prematurity, seizures and mental retardation (p. 300).
While prescription drugs are supposed to heal our diseases, some of them may be dangerous to the unborn child if used by the pregnant mother. However, the physician has to weigh between using the drug and the life of both the mother and the unborn child. On prescription drugs, Canada & Cox (1994) wrote that:
Many common prescription drugs also affect the fetus. Some antihistamines, medicines taken to clear nasal congestion, may produce malformations in the fetus. General anesthetics at high concentrations may also produce malformations (p. 300).
Perinatal causesA fetus may survive all dangers, but the problems may occur during birth. Complications surrounding the birth processes may cause mental retardation and other developmental delays (Gargiulo, 2003). Head
217

INTERNATIONAL JOURNAL OF SPECIAL EDUCATION Vol 27, No: 2, 2012
trauma at birth, maternal anemia, premature delivery and umbilical cord accidents are some of the perinatal causes of disability (Heward, 2003).
Postnatal causesThe environment where the child is born and raised may lead to a number of developmental problems to the child. Poverty is the source of many problems facing children. The causes of impairments in children in developing countries are mainly the same preventable conditions that cause the higher mortality and morbidity rates associated to poverty (Zinkin, 1995). Children born of poor families and who are raised in poor environments may develop mental retardation or other disabilities. A poor child may be malnourished and be prone to diseases. Other postnatal causes include head injuries, infections such as measles, meningitis, malaria, epilepsy and environmental deprivation (Heward, 2003); adverse living conditions, inadequate health care and nutritional problems. Mannan, (2004) revealed the peril of malaria when he wrote:
Malaria threatens more than 40% of the world’s population and out of the more than 300 million acute cases each year, between 1.1 and 2.7 million people die annually. Malaria accounts for nearly 25% of all childhood mortality in Africa. A small number of untreated cases among the most vulnerable and the marginalized (i.e., persons with disabilities) presents a massive challenge in achieving the aims of WHO initiative Roll Back Malaria.
Other studies done in AfricaIt has been established that disability is a cause and consequence of poverty. Mannan (2004) expressed this well when he wrote:
Linkages between disability and poverty are well established, as is the fact that poverty perpetuates ill health. Poverty causes disability through malnutrition, lack of access to health care and unhealthy living conditions. Also disability in turn can cause poverty by preventing the full participation of people with disabilities in the economic and social life of their communities, especially if reasonable accommodations are not available in accessing education, health and employment. The linkages lead to lack of access and opportunities, inequities and disparities in access to health knowledge, health promotion and the prevention of diseases, primary health care services, essential drugs, emergency medical care, and rehabilitation services.
Africa is a large continent debilitated by strife and most of its countries are characterized by low incomes, high prevalence of communicable diseases and malnutrition, low life expectancy and poorly staffed services (Okasha (2002). All these health problems may lead to disability. The United Nations Population Information Network estimates that there are almost 800 million people living with disability in Africa (Onasanya undated). These scary statistics require urgent steps to redress this problem. Malnutrition in its various forms is an additional major cause of disability in Africa where two-fifths of children are malnourished (Mitra, 2004). Werner (1990) visited Angola, a country that had been engulfed in conflicts and civil strife for many years, and says that most of the disabilities there were due to amputation or polio. The long drawn civil war left a lot of people disabled. He maintained that the incidence of polio was due to breakdown of health services in a land where access to rural areas has been cut off by random but persistent terrorist attacks along the road and pathways (Werner, 1990). Warner (1990) also found out that the prevalence of epilepsy was high and alcohol, tobacco and drug related problems were becoming an increasing concern for Africa.
War, combined with poverty and recurrent drought, are said to have increased the incidence of impairment, leading to disability in children in Mozambique (EENET, 1998). EENET further reports:
Causes of disability related to underdevelopment and poverty range from malnutrition, vitamin deficiency and the spread of infectious diseases to problems in pregnancy and childbirth and a general lack of resources, particularly in the health and education sectors (p.2).
In Burundi, reports show that despite a 10-year civil war, diseases remained the major causes of disability and mortality, the major reasons including high costs of medical care, long distances to health services and ignorance (UN ,2003).
218
INTERNATIONAL JOURNAL OF SPECIAL EDUCATION Vol 27, No: 2, 2012
Injuries have also been recognized as a major public health problem in both developed and less developed countries and it has been acknowledged that this problem is growing rapidly in sub-Saharan Africa (Moshiro, Heuch, Nordrehaug Astrom, Setel, Hemed & Kvale, 2005). Studies in Tanzania show that injuries are an major cause of death among adults and accounts for 12 percent of all admissions at the national hospital in the country's largest city (Moshiro et al., 2005). It has besides been reported: disability at birth or various causes such as injury, disease or aging is now becoming a public health problem in Tanzania due to changes in lifestyles and economic conditions (United Republic of Tanzania, 2001 p.17). In Africa, there also is evidence that many people become disabled because they cannot afford health care Mitra (2004).
Purpose of the studyThe purpose of this study was to find out from the parents what they knew or believed to be the causes of their children’s disabilities. Specifically the study wanted to find out, first of all, the environmental conditions where these parents lived with their children. This was deemed important because research results have proved that there is a connection between disability and poverty. Secondly, the study aimed at finding out the parents’ knowledge about the causes of the disabilities. Knowing the causes is important for the parents because they will be able to accept their children and cope with the situation or their condition.
Research MethodologyStudy area and population of the study: This study was conducted in four regions namely Dar es Salaam, Dodoma, Kilimanjaro and Morogoro. The participants in the study were parents of children with visual impairment, hearing impairment and intellectual disabilities. The children were those who attended schools and/or those who were known to have one form of disability or another in the communities visited. The parents were, therefore, identified through schools and through village leaders. The researcher visited schools where children with disabilities attended and got the names and addresses of the parents. In the schools visited, only children with the three types of disabilities, that is, visual, hearing and intellectual impairments were admitted. Other parents whose children were not in schools were identified through the village leadership. The identified parents were visited in their homes.
Data collection methods: Three methods were used to collect data and these were structured interviews, observation and narratives. The interview guidelines included open-ended questions. Open-ended questions were used because they allowed respondents an opportunity to express their views on various issues as opposed to close-ended questions that tended to be restrictive (Ary, Jaco & Razavieh, 1996). Open-ended interview questions also allowed the researcher to observe and record feelings and emotions. In addition, extra questions were used as needed to clarify or add information.
Narratives: Data was also collected through personal narratives of parents of the children with disabilities. This method was considered useful because it provided an opportunity for the researcher to have detailed in-depth discussions with such parents about their experiences and what they thought were the causes of their children’s disabilities.
Observation: The observation method was used to learn about the surroundings where the children lived and were raised. This was essential because it provided a picture of the facilities available in the homes such as water and toilets. Such facilities are essential for the health and well being of individuals.
Research Findings and DiscussionsThe background information of the participants, the home environment where children with disabilities were raised and the causes of disabilities as mentioned by the parents are reported here. The participants, who were the parents, and their living environments, had some connection to the causes of disabilities. Parents mentioned what they thought were the causes of their children’s disabilities while some of them did not know.
Background information of parentsAge and gender: The background information of the parents was divided into four main sections, namely age differences and gender, level of education, employment and maririal status. The age of the respondents was considered a vital aspect of this study, particularly so, because one of the causes of disabilities is the age of the mother. In addition, taking care of a child with disability especially those with severe or profound mental retardation requires maturity and energy. Table one shows the age and gender differences of the parents involved in the study.
219
INTERNATIONAL JOURNAL OF SPECIAL EDUCATION Vol 27, No: 2, 2012
One hundred and twenty six parents were involved in this study. Ninety-one respondents were females and 35 were males. The parents’ ages ranged between 20 and 45 years. Nearly 40 percent of these parents were between 31 and 40 years of age and 46 (36.51%) were 41 years and above. Two (1.59%) grandparents, who were raising orphan children with disabilities, reported that they were 70 years old. Thirty (23.81%) respondents were between 20 and 30 years of age.
Table 1. Age Differences and GenderAge group Female Male f %20-30 25 5 30 23.81%31-40 32 18 50 39.6841 and above 34 12 46 36.51Total 91 35 126 100
Level of education: The aspect of education when dealing with individuals with disabilities is significant because through education people may learn to cope, care and understand issues facing people with disabilities. In addition the level of education is also important because it affects the kind of employment a person can have. As indicated in Table 2, twelve (9.52%) parents had no formal education, 98 (77.78%) had primary education, 13 (10.32%) had secondary education and three had tertiary education.
Table 2. Parents’ Level of EducationLevel Female Male f %Tertiary education 1 2 3 2.38Secondary education
4 9 13 10.32
Primary education 76 22 98 77.78No formal education
10 2 12 9.52
Total 91 35 126 199
Employment: Many of the parents had no reliable employment. Eighteen (14.29%) parents were government employees, one worked with an NGO and the remaining 107 (84.92%) parents were either poor subsistence farmers or carried out small businesses. This information shows that the majority of the parents involved in this study had no reliable income and having a child with disability might have had a major impact on them both socially and economically.
Marital status: the information about marital status was considered important in this study because, bringing up a child with a disability is a difficult task and both parents need to work together and support each other. In addition, a lot of research has revealed that many parents divorce after the birth of a child with a disability. In this study, it was discovered that 102 (80.95%) parents were married, two (1.59%) were widowed, 13 (10.32%) were divorced and nine (7.14%) were single parents.
The general picture we get from the background information of these parents is that of uneducated, poor parents. Hogan, Rogers & Msall, (2000) support this general statement when they say that what is perhaps less recognized is that the households of children with disability more often are headed by unmarried mothers who live in poverty.
The home environmentMany times, parents’ lives are complicated when necessary services such as water and sources of energy are not readily available. The researcher wanted to know from the parents if they had access to basic services such as drinking water, type of sanitation, source of energy and type of the house they lived in with their children. This information was important because disability has been linked to poverty. In addition, people may get sick arising from unhealthy environments, which are dirty and dangerous to people’s lives.
Source of drinking water: Fifty two (41.3%) of the respondents reported that piped water was their main source of drinking water, while thirty (23.8%) respondents got water from wells or rivers. Some piped water was in the houses as reported by 20 (15.9%) respondents, but the remaining parents had to walk some distance to get piped water from public stand pipes in their villages. Some of those who depended
220
INTERNATIONAL JOURNAL OF SPECIAL EDUCATION Vol 27, No: 2, 2012
on water from rivers or wells had to walk for a mile or more to get water and this consumed a lot of time to parents who had a lot to attend to. One well, which was a source of water for some people, was observed and it was found that the water there was not clean enough for human consumption, but this was the only source of water for the people. Unclean water may lead to diseases, such as typhoid and cholera, and cause heath hazards to all people including individuals with disabilities.
Source of energy for lighting and cooking: It has been found out that the high rates of deforestation in Tanzania are caused by many people who still use charcoal and firewood as a source of energy (The United Republic of Tanzania, 2001). Ninety (71.4%) of the respondents used firewood most of the time or charcoal, on a few occasions/in some instances, as a major source of energy for cooking, while 20 (15.9%) of the respondents said they used firewood and kerosene as a source of energy for cooking. Six (4.8%) of the respondents used electricity and charcoal as a source of energy for cooking. The majority of these parents, therefore, had to struggle to get fire-wood, which took their energy and time, in addition to taking care of a child with disability.
Access to type of toilet: All respondents reported that they had toilets but 86 (68.3%) of the respondents used traditional pit latrines, which were built, outside the house. Thirty-one (24.6%) of the respondents had modern toilets and the remaining respondents either did not have permanent facilities, and used only makeshift facilities. Research has linked absence of, or bad sanitation to diseases and causes of disabilities, which may lead to devastating results.
Causes of disability according to parents
The World Health Organization estimates that there are around 600 million persons with disabilities, 80% of whom live in low income countries. Moreover, an estimated 20% of the poorest people in the world are persons with disabilities and it is widely acknowledged that there is a lack of information on the impact of care-giving to women and young girls (Mannan, 2004).
A child may be born with a disability or acquire a disability during birth or as he or she grows up. In this study 50 (39.7%) parents reported that their children were born with disability. Fifty six (44.4%) said that the children acquired disability and two parents did not know whether their children were born with disability or not. Of those who said the child acquired the disability, 34 percent of them reported that their children acquired the disability between zero and two years. One woman had this to say:
My son was born normal, but when he was about one year and a half, he became sick. He had high fever continuously. We thought it would go down, but it did not. We took him to the hospital on the third day and he was admitted, but the doctor told us that the child will not become normal due to brain damage. He did not explain to us what happened, but it was true, because our son was not the same. He became mentally retarded as you can see him today.
There is a possibility, though, that some of these children who were reported to have acquired a disability between zero and two years, might have been born with a disability, which was not obvious at birth since in Tanzania there are generally no tests or screening procedures done to children during or immediately after birth. Table three shows the causes as reported by the respondents.
Table 3. Causes of DisabilitiesNo. Causes Frequency Percentage1. Malaria 23 44.232. Convulsions 17 32.693. Delivery complications 7 13.464. Premature births 4 7.695. Meningitis 4 7.696. Measles 2 3.857. Delayed labor 2 3.858. Cataract 1 1.92
221

INTERNATIONAL JOURNAL OF SPECIAL EDUCATION Vol 27, No: 2, 2012
The parents were asked if they knew the causes of their children’s disabilities. Fifty-two parents (41.27%) knew the causes of their children’s disabilities, while 74 parents (58.73) did not know. Twenty-three (44.23%) parents out of 52 parents who said they knew the causes mentioned malaria as the cause of their children’s disability. Malaria seemed to be the leading cause of disabilities in this study especially for children with mental retardation. Now, malaria is both a preventable and treatable disease, but it is still a threat to many lives in Tanzania. USAID (undated) writing about malaria in Tanzania said:
Due to poor living conditions, the majority of Tanzanians suffer from malaria, a preventable disease that can have a serious negative impact on pregnant women and young children. Malaria is the number one killer among children in Tanzania. Mothers who contract malaria during pregnancy run the risk of having low birth weight babies, maternal anemia, impaired fetal growth, spontaneous abortions, stillbirths, and premature babies.
In a research done by Savigny, Mayombana, Mwageni, Masanja, Minhay, Mkilindi, Mbuya, Kasale and Reid (2004) it was reported that:
The most commonly reported complaint resulting in a health service consultation is fever or malaria – reported in 69.3 percent of all ill children (less than 15 years of age) and 60 percent of ill adults (15+ years).
Malaria is definitely a burden to Tanzania and all people in Tanzania are at risk of attracting malaria. Tanzania has been reported to have the third largest population at risk of stable malaria in Africa after Nigeria and the Democratic Republic of Congo Savigny et al., 2004). The National Bureau of Statistics in Tanzania reported that anemia is a major problem among children and the major cause is malaria (United Republic of Tanzania, 2004). Reyburn (2004) found that in the year 2000, 42 percent of hospital diagnoses and 32 percent of hospital deaths in Tanzania were reported to be malaria-related. Tanzania is one of the poorest countries in the world with 58 percent of the population living on less than $1 a day (http:// earthtrends.wri.org/povlinks/country/Tanzania.php). Poverty is perhaps the major reason why malaria continues to kill many people in Tanzania, despite the fact that malaria deaths can be prevented.
Seventeen (32.69%) parents reported that their children began with high fever that led to convulsions. It is also possible that the fever that led to convulsions was related to malaria. One mother reported:
My son had fever and I thought it would go down because I gave him ‘miti shamba’ (herbs). But it did not help. One morning he developed ‘degedege’(convulsions) and I decided to take him to the hospital. I had to walk for about four miles. When I got there the doctors checked him and we were admitted and he continued getting treatment. ‘Degedege’ stopped but when we came back home my son was not the same. They said he was mentally retarded.
High fever might have different causes and delay to see the doctor, which might have attributed to lack of money or lack of a health center close to the home, exacerbated the situation. The child developed mental retardation due to a disease that could have been treated, had it been promptly attended to.
Seven (13.46%) parents reported that they had problems during delivery that affected the health of the child. Four of these parents said they delivered their children at home and problems that faced such children were detected too late. For some parents, the hospitals were far, and five of these women admitted that it was hard to even attend clinics regularly during pregnancy. Four (7.69%) parents had premature babies. Prematurity is generally defined as a birth that occurs prior to 37 weeks of gestation (Gargiulo, 2003). Those who had premature babies narrated different stories, but all of them agreed that during pregnancy they were sick most of the time. The real cause why they had premature babies was not known. One woman explained, for example:
When I was pregnant I did not feel normal. I got sick often and I became weak. I do not know exactly what was wrong with me. I lost appetite most of the time, but I do not know for sure if this may have been the reason why my son was delivered prematurely.
222
INTERNATIONAL JOURNAL OF SPECIAL EDUCATION Vol 27, No: 2, 2012
Meningitis was mentioned by four (7.69%) parents as a cause of their children’s disability. Meningitis is a bacterial or viral infection of the linings of the brain or spinal cord (Hallahan & Kaufman, 1994). Because meningitis is capable of causing brain damage, mental retardation is a distinct possibility (Gargiulo, 2003).
Two children were reported to have been affected by measles when they were young. Measles is an acute, contagious viral disease, characterized by small red spots on the skin. Such an infection may lead to blindness and/or deafness. These infections could have been treated if children were sent to the hospital on time. The two mothers whose children had measles narrated that they sent their children to the hospital when it was too late. These children developed hearing problems. One complained not only that a health center was very far away from home, but also that financially she could not meet the hospital bills. ‘‘I just prayed that my child will get well, but at the end he became disabled’’, said one of the parents; and this was a major complaint of most respondents. It is unfortunate, though, because taking care of a child with disability is more expensive than treating measles. However, it was obvious that parents were not financially capable and they had no choice.
The last two causes of disability mentioned were delayed labor and cataract, mentioned by 3.85 percent and 1.9 percent of the parents, respectively was. One of the parents said that she had long labor and she did not get immediate help. The doctor had to pull out the child and the mother thought that was the reason why the child developed mental retardation because her baby did not cry after birth. Cataract is a vision defect that is easy to spot. Cataracts, which can be corrected by surgery, are caused by a clouding of the lens of the eye, which results in blurred vision (Hallahan & Kauffman, 2003)
Summary and conclusionSummary: This study aimed at finding out the causes of children’s disabilities as known to the parents. The participants were parents who had children in schools and others whose children were not in schools. Information was collected from 91 female parents and 35 male parents. Their ages were between 20 and 41 and above years of age. Twelve parents had no formal education while the majority (77.78%) of them had primary education. The information was collected through interviews, narratives and observation methods. It was discovered in this study that the children became disabled due to causes that could have been prevented. All the diseases discussed such as malaria, meningitis, and measles were preventable and/or treatable. In addition, causes such as premature births and delivery complications could be prevented through provision of good health services. Poverty is one of the underlying problems of our society (Smith, Polloway, Patton & Dowdy, 1995).It is obvious when considering Tanzanian case that fighting disability must start with fighting poverty. Tanzania has to plan and be ready to combat poverty so as to save the lives of her citizens and reduce disability cases.
Conclusions: While it may be difficult to pinpoint what exactly caused disabilities in Tanzania, it is nonetheless obvious that poverty plays part in this problem. The findings of this study have revealed that poverty is the main factor behind disabilities because some of the problems could have been avoided in a more advanced or wealthier country. It has also been established that poverty and disability are inextricably linked. In addition, it has been clearly indicated that conditions that could have been prevented, such as poor nutrition, diseases, limited access to health care, poor hygiene, all cause disability in Africa. Diseases and poor health services were seen as the main causes of disability in this study. Most of the causes mentioned above have resulted from diseases. All these diseases are preventable, however, and/or treatable, but poverty, which leads to poor health services has rendered this not possible. There are vaccinations such as those of polio and measles, which could have been used for prevention; and early detection and early treatment, might have changed the lives of these children. However, the background information of the parents shows clearly that the majority of them had neither education nor jobs that could have enabled them meet their economic needs. Perhaps even ignorance has contributed a lot, for instance in the case where the child was given herbs instead of being taken to hospital on time. In addition, some parents complained of lack of health services close to their homes. Diseases can only be treated by trained medical personnel. However, lack of medical services close to people, is definitely a cause of health problems.
Poverty is a social condition that is affecting all nations all over the world. It has been related to crime, physical abuse, learning problems, behavior problems and emotional problems (Smith, Polloway, Patton & Dowdy, 1995). Poverty is also associated with poor prenatal care, poor parenting, hunger, limited heath care, single-parent households and poor housing conditions (Smith, Polloway, Patton & Dowdy. 1995). It is unfortunate, but Tanzania being one of the poorest countries in the world, cannot be expected
223

INTERNATIONAL JOURNAL OF SPECIAL EDUCATION Vol 27, No: 2, 2012
to do miracles. That notwithstanding, however, there is need for making concerted effort as a nation so as to prevent some of the preventable conditions. It is truly expensive to be poor, and without determined effort to fight poverty, neither poverty nor disabilities will be decreased. It is futile to try to find who the sinner is; and that should not take too much of our time either, because that may hold us from doing what is central to our problems, which is fighting poverty. Tanzania needs well defined policies which can lead to economic growth and create jobs and help every citizen, including small holder subsistence farmers and self employed individuals, to become economically self reliant. In addition, the country should invest more in health services and education so as to reduce diseases and increase employment. Diseases and poor health are barriers that hinder many poor people from participating fully in economic growth. An educated healthy person is more likely to work hard to reduce poverty and consequently reduce the number of people with disabilities.
ReferencesAry, D., Jacob & Razavieh, A. (1996). Introduction to research in education (5th ed.) New York: Harcourt Brace College Publishers.Berndt T. J. (1994). Children development, (2nd ed.). Madison, WI Brown & Benchmark Publishers.Cox, F. D. & Canada, C. (1994). Family Living: Relationships and decisions. Lincolnwood Illinois: National Textbook Company.Enabling Education Network (1998). Community based support for disabled children in post-war MozambiqueGargiulo, R. (2003).Special education in contemporary society: An introduction to exceptionality. Australia: Wadsworth/Thomson Learning.Good News Bible: Today English version (p.130). New York: United Bible societies.Hallahan, D. P. & Kauffman, J. M. (1994). Exceptional children: Introduction to special education (6th ed.). Boston: Allyn and Bacon.
Hallahan, D. P. & Kauffman, J. M. (2003). Exceptional learners: Introduction to special education (9th ed.). Boston: Allyn and Bacon.Heward, W. L. (1996). Exceptional children: An introduction to special education (5th ed.). Columbus: Merrill.Heward, W.L. (2003). Exceptional children (7th ed.). An introduction to special education Columbus: MerrillHogan, Rogers & Msall (2000). Functional limitations and key indicators of well being in children with disability. Archives of Pediatrics and Adolescent Medicine, 154, 1042 – 1048.Kirk, S. A., Gallagher, J. J. & Anastasiow, N. J. (2003). Educating exceptional children (10th ed.) Boston: Houghton Mifflin Company.
Mannan, H. (2004). ‘Persons with Disabilities and the Millennium Development Goals’ Global Forum for Health Research Forum 8, Mexico, November 2004.Mitra, S. (2004). ‘Viewpoint: Disability- the hidden side of African poverty’. www.disabilityworld.org/01-03_04/news/africa.shtml
Moshiro, Heuch, Nordrehaug Astrom, Setel, Hemed & Kvale (2005). ‘Injury morbidity in an urban and a rural area in Tanzania: an epidemiological survey’.Okasha, A. (2002). ‘Mental Health in Africa: The role of WPA’. Official Journal of the World Psychiatric Association. Onasanya, A. (n.d.). ‘Disabilities in Africa’. www.pearlsofafrica.org/htmlDIA.htmlReyburn, H. (2005). ‘Over diagnosis of malaria in patients admitted to hospital in Tanzania’. www.id21.org.Santrock, J.W. (2005). A tropical approach to life-span development (2nd ed.). Boston, McGraw Hill.Santrock, J. W. (1999). Life-span development (7th ed.). Boston, McGraw-Hill College.Savigny, D. , Mayombana, C., Mwageni, E., Masanja, H., Minhai,, A., Mkilindi, Y., Mbuya, C., Kasale, H., & Reid, G. (2004). Care seeking patterns for fatal malaria in Tanzania’. Malaria Journal 3 (29)Smith, T.E.C., Polloway, E.A., Patton, J.R. & Dowdy, C.A. (1995). Teaching students with special needs in an inclusive setting. Boston: Allyn and Bacon.The United Republic of Tanzania (2001). Pilot Census for the 2002 population and housing census, Dar es. Salaam: TanzaniaTurnbull, A. P. & Turnbull H. R. (1990). Families, professionals, and exceptionality: A special partnership, 2nd ed., Columbus Ohio, Merril.USAID (undated). Combating malaria in Tanzania. www.usaid.gov/stories/tanzania.WHO (2002). ‘Urgent call for action on meningitis in Africa’.
224
INTERNATIONAL JOURNAL OF SPECIAL EDUCATION Vol 27, No: 2, 2012
www.who.int/mediacentre/news/releases/pr71/en/Werner, D. (1990). Visit to Angola: Where civilians are disabled as a strategy of LIC. Disabled People International: Canada CIDA. Yao, R. (n.d.). ‘Chronic poverty and disability’: Somerset,Vallis House: Chronic Poverty Research CenterZinkin, P. (1995). Framework priorities. In Zinkin, P. & McConsachier (Eds.) Disabled children & developing countries, (pp. 10-14). London: MacKeith Press:
225