Embed Size (px)
Citation preview
© Grant Thornton. All rights reserved.
Measurement strategy in Strategic Learning:Communicating alignment with firm strategy
© Grant Thornton LLP. All rights reserved. 2
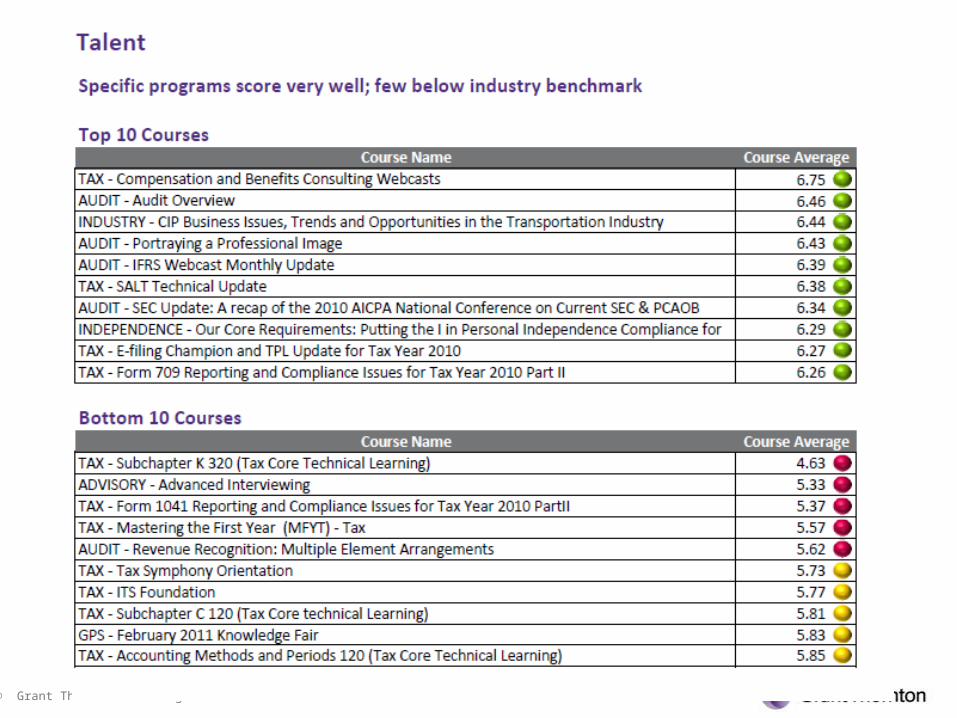
talent
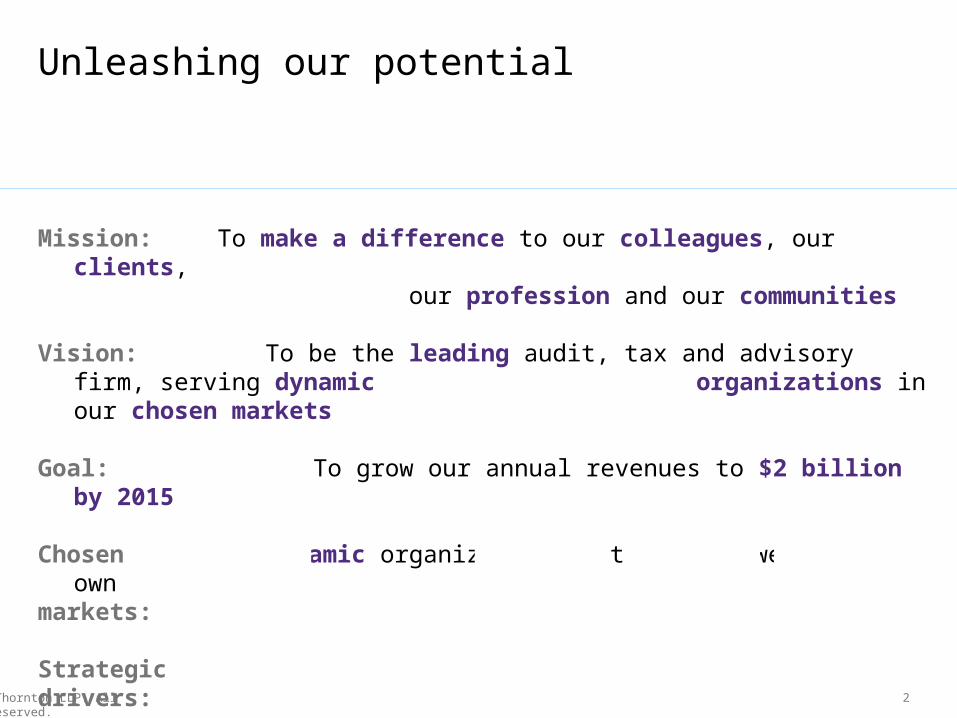
Unleashing our potential
Mission: To make a difference to our colleagues, our clients, our profession
and our communities
Vision: To be the leading audit, tax and advisory firm, serving dynamic organizations in our chosen markets
Goal: To grow our annual revenues to $2 billion by 2015
Chosen Dynamic organizations – the space we want to ownmarkets:
Strategic drivers:
Global Collaboration Leadership Excellence Agility Respect Responsibility
values:
revenue growth
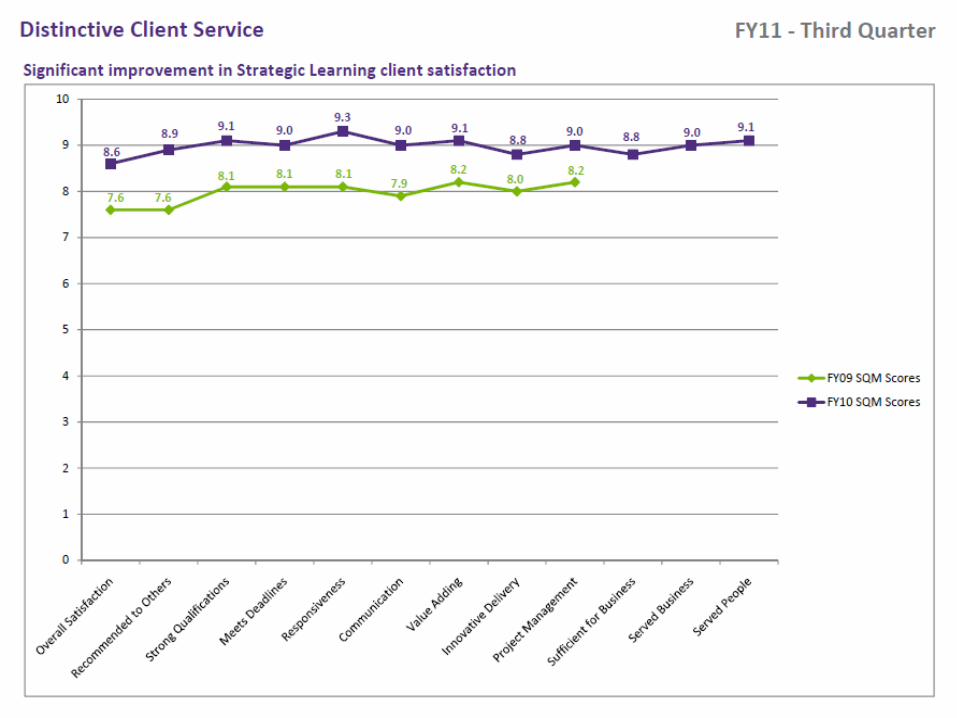
distinctive client service
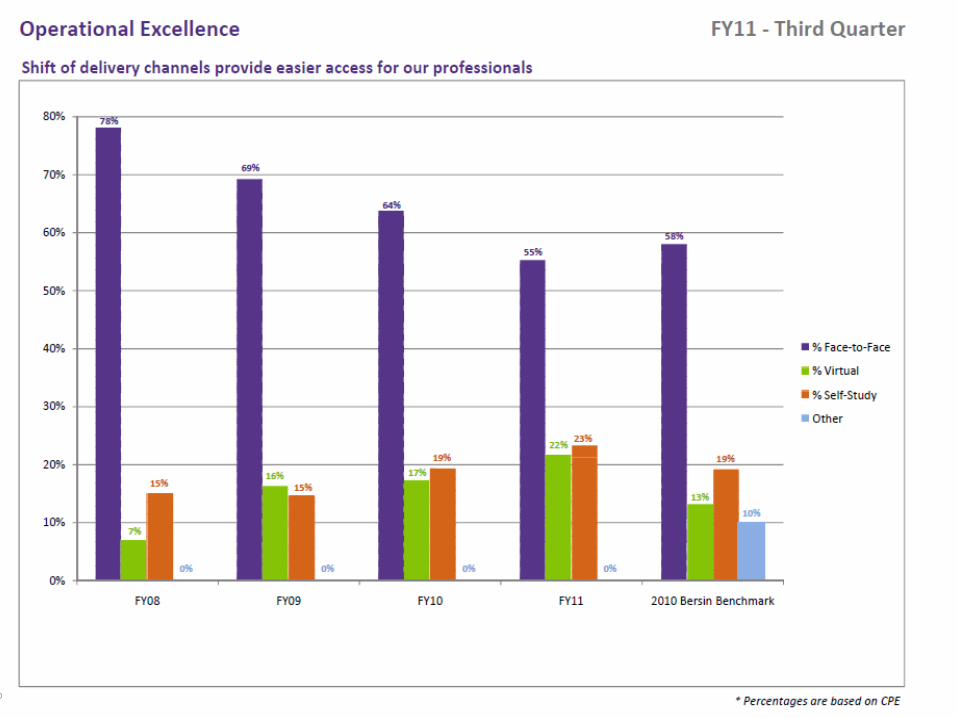
operational excellence
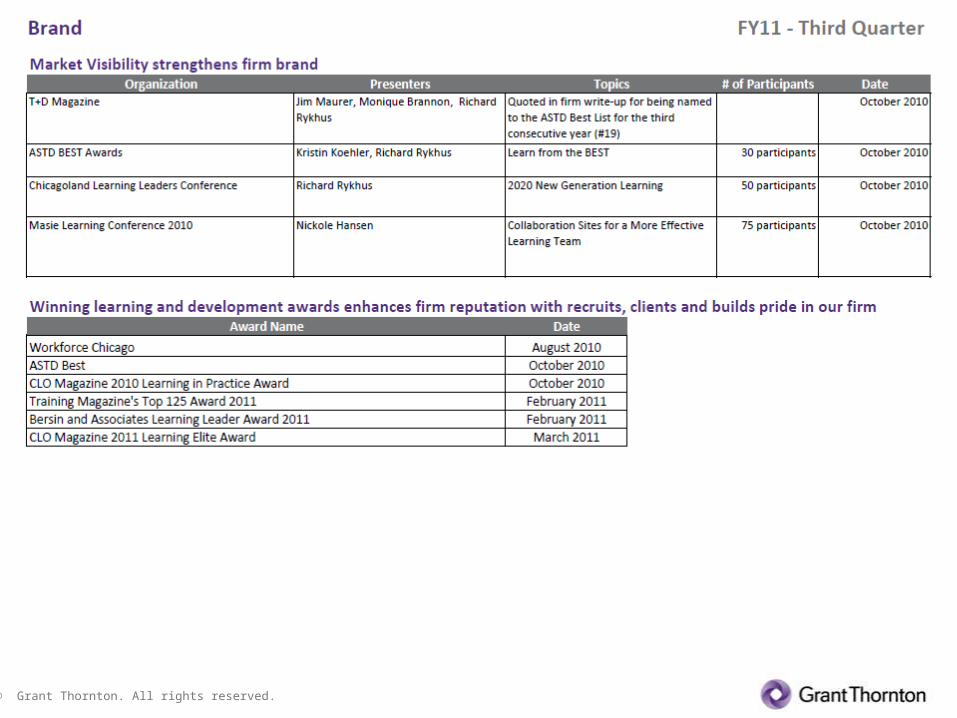
brand
© Grant Thornton. All rights reserved.
What is the vision for Strategic Learning?
To empower our people to be the leading providers of audit, tax and advisory services for dynamic clients in our chosen markets
© Grant Thornton. All rights reserved.
What are our measurement initiative goals?
• Alignment• Stories• Accomplishments and needs
© Grant Thornton. All rights reserved.
What results do we expect by 2014?
• High Service Quality Measurement (SQM) scores
• Increased investment
• Seat at firm leadership table
© Grant Thornton. All rights reserved.
What is our current state?
Effective elements• Consistent measurement of satisfaction, knowledge
retention and application
• Business impact measurement for select initiatives
• Some stories demonstrating impact of initiatives
• Timely operational reporting• Custom client reports available
(on-demand)
• Clear financial reporting
© Grant Thornton. All rights reserved.
What is our current state?
Less effective elements
• Reporting alignment with strategic drivers
• Timeliness of financial reporting• Limited discussion with clients regarding initiative
measures beyond Level 1 and 2 evaluations• Too few business impact measures
and compelling stories• Infrequent communication with senior leaders
© Grant Thornton. All rights reserved.
What is our desired state?
• Clarity on measures within each strategic driver
• Business results-driven measures and reports• Consistent standard and custom reporting
for clients and leaders• Periodic, consistent communication
of key measures and storieswith senior leaders
© Grant Thornton. All rights reserved.
What do we need to do in FY12?
• Complete matrix aligning strategic drivers and reporting• Identify 10 or more business impact measurement
opportunities for FY12• Establish / enhance standard and custom reports
– Drive usage of measurement dashboards• Plan with Account Leads how/when to discuss
reporting with clients
• Communicate consistently with senior leaders
© Grant Thornton. All rights reserved.
Quarterly Impact ReportStrategic Learning at Grant Thornton
Q3 FY 11 | May 2011
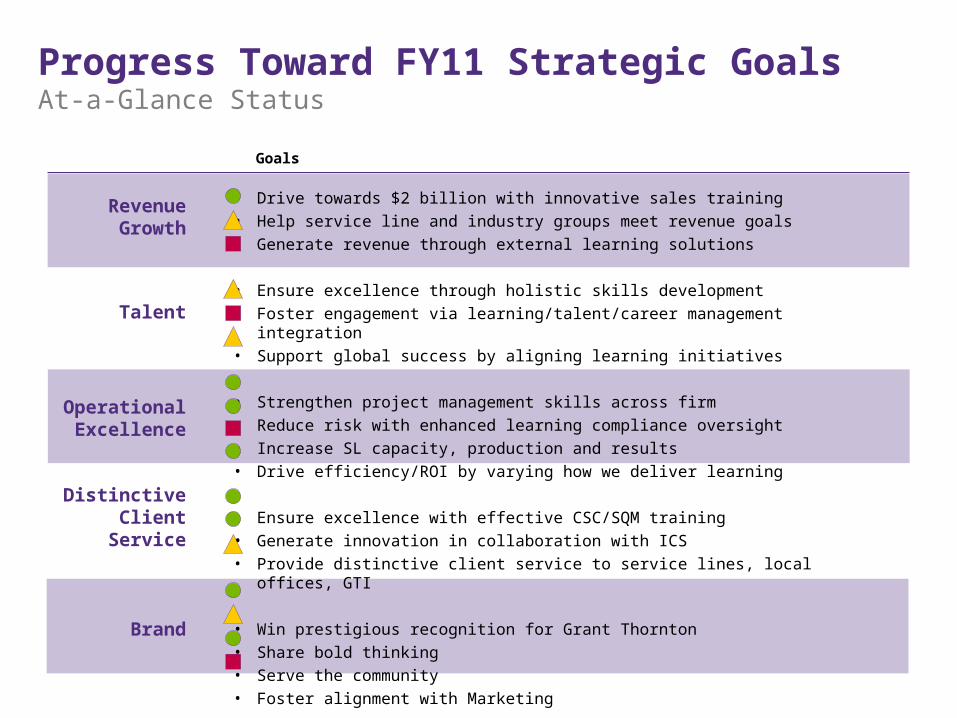
RevenueGrowth
• Drive towards $2 billion with innovative sales training• Help service line and industry groups meet revenue goals• Generate revenue through external learning solutions
• Ensure excellence through holistic skills development• Foster engagement via learning/talent/career management integration• Support global success by aligning learning initiatives
• Strengthen project management skills across firm• Reduce risk with enhanced learning compliance oversight• Increase SL capacity, production and results• Drive efficiency/ROI by varying how we deliver learning
• Ensure excellence with effective CSC/SQM training• Generate innovation in collaboration with ICS• Provide distinctive client service to service lines, local offices, GTI
• Win prestigious recognition for Grant Thornton• Share bold thinking• Serve the community • Foster alignment with Marketing
Goals
Talent
OperationalExcellence
Distinctive Client Service
Brand
Progress Toward FY11 Strategic Goals At-a-Glance Status
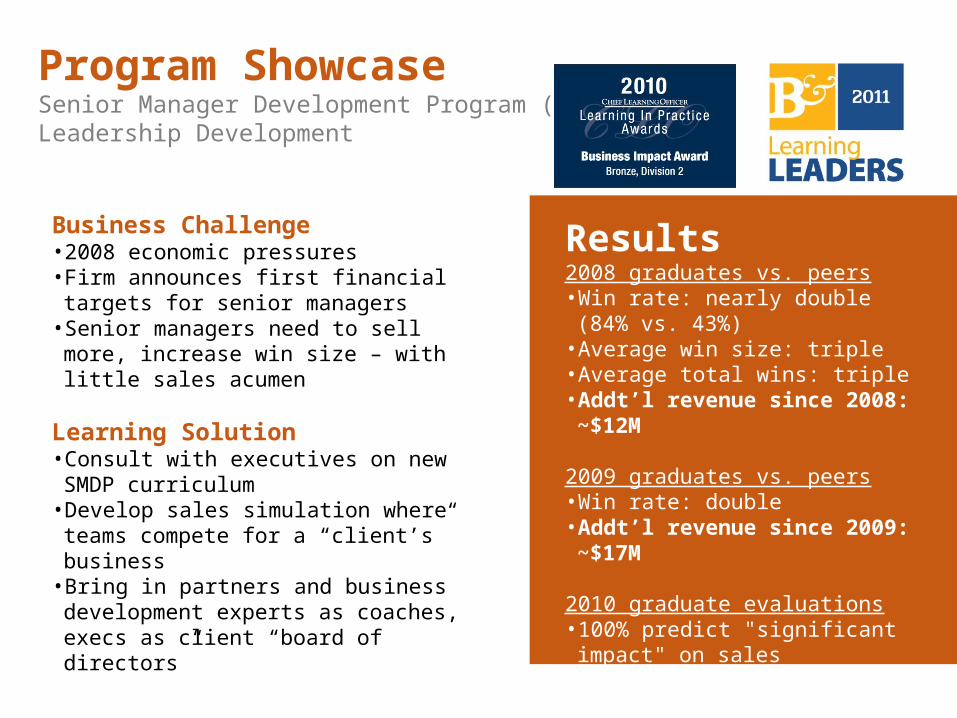
Program ShowcaseSenior Manager Development Program (SMDP)Leadership Development
Business Challenge• 2008 economic pressures • Firm announces first financial targets for
senior managers• Senior managers need to sell more,
increase win size – with little sales acumen
Learning Solution• Consult with executives on new SMDP
curriculum• Develop sales simulation where teams
compete for a “client’s” business• Bring in partners and business
development experts as coaches, execs as client “board of directors”
Results2008 graduates vs. peers• Win rate: nearly double (84% vs. 43%)
• Average win size: triple• Average total wins: triple• Addt’l revenue since 2008: ~$12M
2009 graduates vs. peers• Win rate: double • Addt’l revenue since 2009: ~$17M
2010 graduate evaluations• 100% predict "significant impact" on sales
Industry recognition: Two prestigious learning awards
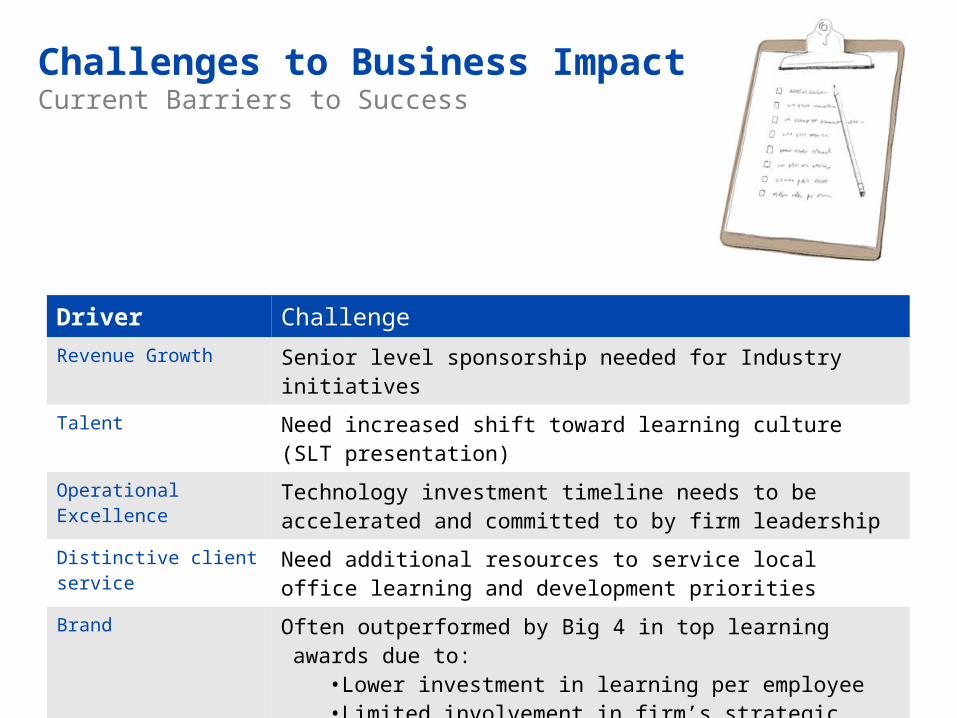
Challenges to Business ImpactCurrent Barriers to Success
Driver Challenge
Revenue Growth Senior level sponsorship needed for Industry initiatives
Talent Need increased shift toward learning culture (SLT presentation)
Operational Excellence Technology investment timeline needs to be accelerated and committed to by firm leadership
Distinctive client service Need additional resources to service local office learning and development priorities
Brand Often outperformed by Big 4 in top learning awards due to:• Lower investment in learning per employee• Limited involvement in firm’s strategic decisions
(vs. CLO at VP level)• Technological limitations
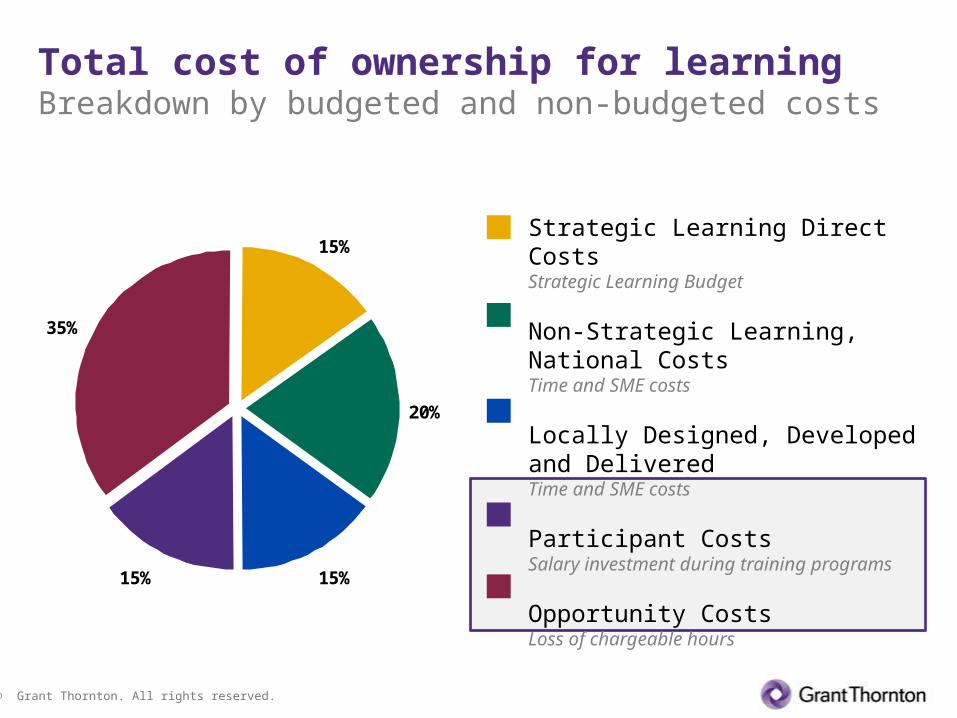
15%
20%
15%15%
35%
Strategic Learning Direct CostsStrategic Learning Budget
Non-Strategic Learning, National CostsTime and SME costs
Locally Designed, Developedand DeliveredTime and SME costs
Participant CostsSalary investment during training programs
Opportunity CostsLoss of chargeable hours
Total cost of ownership for learningBreakdown by budgeted and non-budgeted costs
© Grant Thornton. All rights reserved.
© Grant Thornton. All rights reserved.
© Grant Thornton. All rights reserved.
© Grant Thornton. All rights reserved.
© Grant Thornton. All rights reserved.
© Grant Thornton. All rights reserved.
© Grant Thornton. All rights reserved.
© Grant Thornton. All rights reserved.