Embed Size (px)
Citation preview

N A T I O N A L S A V I N G S B A N K
Annual Report 2014
GOOD


National Savings Bank
Annual Report 2014
Page 1B e i n g f o r t h e B e n e f i t o f A l l
G R E A T E R G O O D
N A T I O N A L S A V I N G S B A N K
A n n u a l R e p o r t 2 0 1 4

Greater GoodNational Savings BankAnnual Report 2014Produced by: Smart Media - The Annual Report Company
ISBN 978-955-1619-06-0
This National Savings Bank annual report has been produced by Smart Media The Annual Report Company,
the greenhouse gas emissions resulting from activities outsourced by Smart Media in the production of this annual report, including the usage of paper and
This National Savings Bank annual report has been prepared using the Smart Integrated Reporting Methodology™ of Smart Media
This Annual Report is Carbon Neutral
This is an Integrated Annual Report

A n n u a l R e p o r t 2 0 1 4
G R E A T E R G O O D
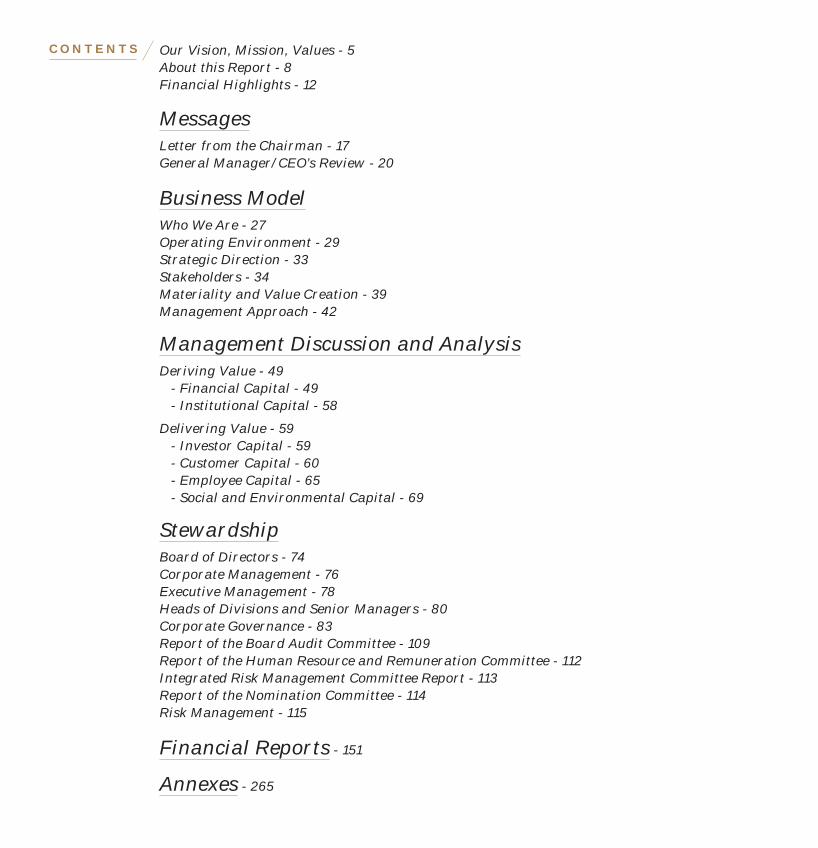
Our Vision, Mission, Values - 5About this Report - 8Financial Highlights - 12
MessagesLetter from the Chairman - 17General Manager/CEO’s Review - 20
Business ModelWho We Are - 27Operating Environment - 29Strategic Direction - 33Stakeholders - 34Materiality and Value Creation - 39Management Approach - 42
Management Discussion and AnalysisDeriving Value - 49
- Financial Capital - 49- Institutional Capital - 58
Delivering Value - 59- Investor Capital - 59- Customer Capital - 60- Employee Capital - 65- Social and Environmental Capital - 69
StewardshipBoard of Directors - 74Corporate Management - 76Executive Management - 78Heads of Divisions and Senior Managers - 80Corporate Governance - 83Report of the Board Audit Committee - 109Report of the Human Resource and Remuneration Committee - 112Integrated Risk Management Committee Report - 113Report of the Nomination Committee - 114Risk Management - 115
Financial Reports - 151
Annexes - 265
C O N T E N T S

National Savings Bank
Annual Report 2014
Page 5 O U R V I S I O N , M I S S I O N , V A L U E S
Our Vision
The most reliable and sought-after choice for savings and
Our Mission
Providing our customers with total financial solutions to optimise their savings and investment needs, while meeting the expectations of
Our Values
In conducting our day-to-day business we will respond promptly and act

National Savings Bank
Annual Report 2014
Page 6

National Savings Bank
Annual Report 2014
Page 7
The National Savings Bank was incorporated for the greater good of
We first espoused the efficacy of the ‘coin in the till’ model of ethical financial saving as a blueprint for a valid savings habit that brings with it financial
To achieve this objective we work with purpose, taking advantage of our expertise, knowledge and understanding with the aspects of life that

National Savings Bank
Annual Report 2014
Page 8
About this Report
A B O U T T H I S R E P O R T

National Savings Bank
Annual Report 2014
Page 9
Report Structure
In your hands is the Bank’s maiden integrated Annual Report. It constitutes a significant change from the reporting format of the past. Our move to this format was prompted by a desire to adopt a more holistic approach, trending internationally, that enables us to communicate more effectively and concisely, the interactions and interdependence of many aspects of our business – such as strategy, governance, performance and prospects – in the context of creating value over time. The triple bottom line evaluatory process that examines economic, social and environmental impacts on our business and by our business remains integral to the reporting process, but with better and more meaningful integration.
Sustainability
Sustainability is an overarching goal of the Bank that cuts across all aspects of our business in the value creation and capital formation process. In practice, since sustainability pervades every area of strategy and action, it made sense for the Bank to seamlessly integrate sustainability with financial reporting. Thus, whilst a separate, stand alone review on sustainability will not appear in this Report, we have retained all material disclosures and discussions associated with ‘sustainability reporting’, within the new format, whilst complying with core criteria of GRI G4.
Format
This Annual Report is produced in print and PDF versions. The latter is available on our website – www.nsb.lk
Value Creation
Two Sides of the Same Coin
Explaining how the Bank creates value over time, lies at the core of our integrated reporting. Underpinning this approach, is the realisation that the ability of the Bank to create value for itself is inextricably linked to the value it creates for its stakeholders. This also explains the duality of our purpose, namely, deriving and delivering value, leading to internal and external capital formation respectively.
Capital Formation
The ‘capital’ we create and nurture at the Bank takes many forms and is not limited to financial capital. The Bank’s internal capital formation is a result of value created by the Bank for itself (deriving value) and comprises financial capital and institutional capital. Our external capital formation is a result of financial and non-financial value created by the Bank for its stakeholders (delivering value), the key components being investor capital, customer capital, employee capital and social and environmental capital. These forms of capital are stores of value with flows taking place between them which may be increased, decreased or transformed by the Bank, including its relationships and engagement with stakeholders.
Our reporting, particularly the Management Discussion and Analysis, is thus structured along these lines; that of deriving and delivering value which lead to internal and external capital formation.
A B O U T T H I S R E P O R T

National Savings Bank
Annual Report 2014
Page 10
Report Boundary and Materiality
The overall boundary of this Annual Report comprises the National Savings Bank and its wholly-owned subsidiary, NSB Fund Management Company Ltd., duly identified as the ‘Bank’ individually and ‘Group’ collectively. Consistent with the framework adopted in the 2013 report, key financial aspects are discussed in the context of the Bank as well as the Group, while non-financial aspects are discussed in the context of the Bank unless stated otherwise.
This report focuses on aspects that are material or important. It is an assessment based on the extent to which these factors may substantively affect the Bank’s ability to create value over the short, medium and long term. The materiality determination process is discussed under Materiality and Value Creation that begins on page 39, and also reflects ‘our two sides of the same coin’ view of value creation, as already described.
Compliance
The Bank’s Annual Report 2014 covers the 12-month period 1st January to 31st December 2014, and is consistent with our usual annual reporting cycle for financial and sustainability reporting. The latter is in accordance with the core criteria of GRI G4 guidelines. Being an integral part of the Bank’s overall business, it is subject to the Bank’s existing internal and external control and assurance systems.
There are no significant changes from previous reporting periods in the scope and aspect boundaries. The most recent previous Annual Report, dated 25th April 2014, covered the 12-month period ended 31st December 2013. Comparative financial information, if reclassified or restated, has been disclosed and explained in the relevant sections.
The primary statutes that govern the activities of the Bank are the National Savings Bank Act No. 30 of 1971 and its amendments, Banking Act No. 30 of 1988 and its amendments, directives and guidelines of the Central Bank of Sri Lanka (CBSL) and regulations and directions of the Department of Inland Revenue.
The financial information contained in this report, as in the past, is in compliance with all applicable laws, regulations and standards and is declared in the several reports and statements that appear under the section on Financial Reports commencing on page 151.
In preparing this Integrated Report, we have also drawn on concepts, principles and guidance given in the following, where applicable:
- Global Reporting Initiative (GRI) Sustainability Reporting Guidelines G4 (2013)
[www.globalreporting.org];
- The International Integrated Reporting Framework (2013)
[www.theiirc.org]; and the
- Smart Integrated Reporting MethodologyTM
[www.smart.lk].
Queries
We welcome your comments or inquiries on this report, which could be addressed to the Finance and Planning Division at National Savings Bank, 255, Galle Road, Colombo 3 (email: [email protected])
A B O U T T H I S R E P O R T

National Savings Bank
Annual Report 2014
Page 11
National Savings Bank
Annual Report 2014
Page 11
Sustainability and Value Creation is an overarching goal of the Bank that cuts across
all aspects of our business

National Savings Bank
Annual Report 2014
Page 12
National Savings Bank
Annual Report 2014
Page 12F I N A N C I A L H I G H L I G H T S
Asset Growth
19%
NPL Ratio
7%
Total Capital Adequacy Ratio
19%
Cost: Income Ratio
45%
Liquid Assets Ratio
92%
ROE
30%
Growth in Net Profit
480%

Bank Group
2014Rs. Million
2013Rs. Million
Growth %
2014Rs. Million
2013Rs. Million
Growth %
Results For the Year
Gross Income 77,890 65,573 19 78,573 66,671 18 Net Interest Income 21,380 10,107 112 21,661 10,255 111 Net Profit Before Income Tax 10,472 2,279 360 10,764 2,669 303 Income Tax on Profit 3,606 1,095 229 3,710 1,141 225 Net Profit After Taxation 6,867 1,184 480 7,054 1,528 362 Contribution to the Government 11,043 4,731 133 11,197 4,826 132
At the Year End
Total Assets 779,466 654,368 19 786,845 662,346 19 Loans & Investments 757,182 632,187 20 764,526 640,138 19 Deposits from Customers 554,060 501,890 10 554,060 501,890 10 Shareholders’ Funds (Capital and Reserves) 23,260 22,217 5 25,025 23,797 5
Ratios
Return on Average Shareholders’ Funds (%) 30.2 5.1 28.9 6.3 Return on Assets (%) 1.5 0.4 1.5 0.5 Net Interest Margin (%) 3.0 1.7 3.0 1.7 Liquidity Ratio (%) 91.5 92.7 91.5 92.7 Tier I (%) (Statutory Minimum Ratio Required is 5%) 20.5 18.5 21.6 19.8 Tier I & II (%) (Statutory Minimum Ratio Required is 10%) 19.0 16.7 20.2 18.2 Cost: Income (%) (With VAT) 44.5 67.7 44.0 65.6
Non-Financial Indicators
Branches (No.) 236 229 – –Agents (Post Offices & Sub-Post Offices) (No.) 4,063 4,063 – –School Bank Units (No.) 2,287 1,723 – –ATMs (No.) 260 247 – –Accounts Holders (Million) 18.35 17.90 – –Staff (No.) 3,407 2,943 – –
F I N A N C I A L H I G H L I G H T S
National Savings Bank
Annual Report 2014
Page 13

National Savings Bank
Annual Report 2014
Page 14

National Savings Bank
Annual Report 2014
Page 15
Messages
Letter from the Chairman – 17General Manager/CEO’s Review – 20

National Savings Bank
Annual Report 2014
Page 16

National Savings Bank
Annual Report 2014
Page 17
National Savings Bank
Annual Report 2014
Page 17
Banking for the Greater Good
For the National Savings Bank, founded in 1972, there is a greater good above and beyond the straightforward business of
indeed the year under review saw the Bank record its highest
when one reflects that, in the same year, NSB also returned a
M E S S A G E SL E T T E R F R O M T H E C H A I R M A N

National Savings Bank
Annual Report 2014
Page 18L E T T E R F R O M T H E C H A I R M A N M E S S A G E S
Still, our real goal lies beyond mere profit. Our true object is financial inclusion – participation in the legitimate economy and access to an appropriate range of finance and banking options for all Sri Lanka citizens. As a result, our business model is somewhat different from that of other banks; customer numbers and savings-deposit figures are also important yardsticks of success.
In 2014, the Bank mobilised Rs. 59.4 Billion from depositors, causing its deposit base to grow by 10.4%. Savings deposits accounted for 44% of this total – a significant improvement in the deposit mix. This represents a total of 18.3 Million individual savings and fixed deposit accounts. In gross figures, the total deposit base stood at Rs. 554 Billion on 31st December 2014.
It would be idle to deny that NSB has faced some problems in the recent past – by no means all of its own making. Despite this, I am pleased to find that I have been appointed Chairman of a vibrant and financially robust institution. The Bank’s total assets now stand at Rs. 780 Billion. The Bank’s solid financial performance is discussed in detail elsewhere in this Annual Report.
The People Who Really Matter
As I have already implied, NSB is equally concerned with the welfare of its customers. It is through them alone that we can attain our ultimate goal of financial inclusion for all Sri Lankans. We do not delude ourselves that we are operating in a vacuum; the country now boasts a mature and active banking sector that features both private and public sector involvement. While there are still socioeconomic groupings and strata that NSB is best suited to serve, or which fall through the cracks of other banks’ marketing plans, we cannot forget that we are surrounded by hungry competitors, and that we must keep reinventing ourselves and our offerings in order to stay relevant, profitable and on-mission.
Resources with which to Build
Profitability and financial health are capital to be invested in the Bank’s national and social mission. They are resources, so to speak, with which to build the future. In 2015, a large portion of these resources will be dedicated to the expansion of our financial services portfolio into new areas. For instance, we are planning an aggressive move into new areas of banking, the first results of which will be seen in the months ahead. More fundamentally, we shall continue to invest in our physical distribution network, in part to make transactions more convenient for remittance customers. We are also exploring the possibility of taking our products and services overseas.
Taking NSB to the Next Level
We plan to open at least ten new branches in 2015, in several under-penetrated areas for greater financial accessibility. Meanwhile, existing branches will be upgraded and overhauled, with new technology investments to enhance customer relevance and convenience. This is now an ongoing process at NSB.
The current year will also see us invest considerable resources in getting to know our customers better. We need better intelligence at local, grassroots level: the kind of detailed information that jump-starts insight and inspires us to come up with innovative, highly marketable products. We shall introduce new ways and means to assess customer satisfaction, the relevance and functionality of our products, ease of opening an NSB account and the quality of service at city offices and rural branches.
This knowledge will help us develop new products, new systems, new ways to observe and take stock of ourselves and our customers. It will enable us to reassess our product mix and better align it with emerging trends in the market. It will help us reinforce our 44-year-old brand and develop top-notch product and service-related daughter brands.
National Savings Bank
Annual Report 2014
Page 19
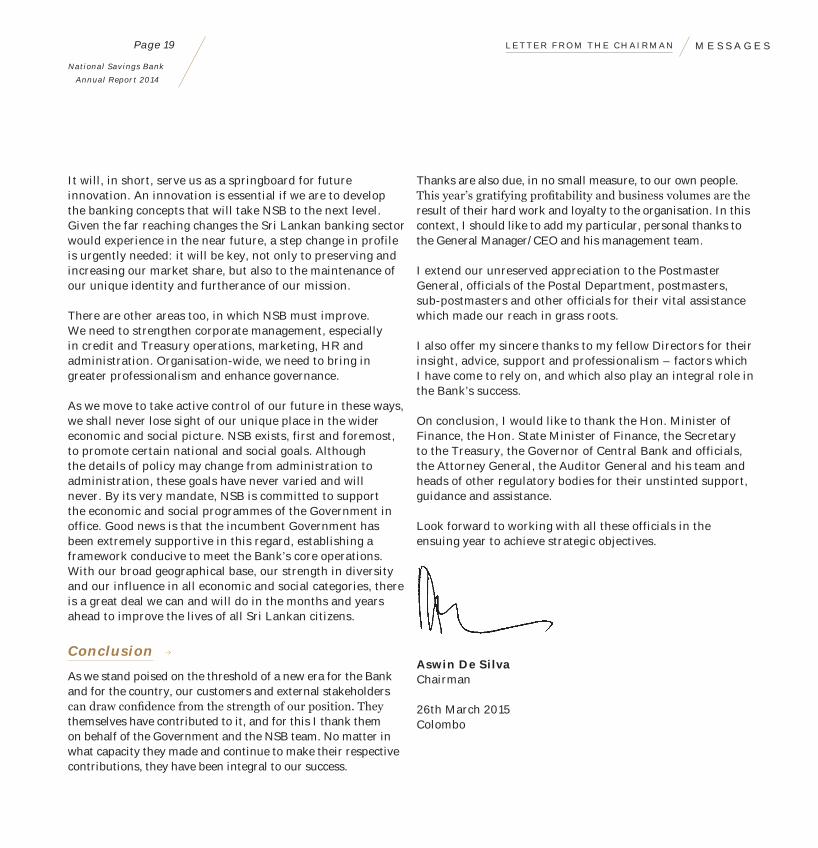
It will, in short, serve us as a springboard for future innovation. An innovation is essential if we are to develop the banking concepts that will take NSB to the next level. Given the far reaching changes the Sri Lankan banking sector would experience in the near future, a step change in profile is urgently needed: it will be key, not only to preserving and increasing our market share, but also to the maintenance of our unique identity and furtherance of our mission.
There are other areas too, in which NSB must improve. We need to strengthen corporate management, especially in credit and Treasury operations, marketing, HR and administration. Organisation-wide, we need to bring in greater professionalism and enhance governance.
As we move to take active control of our future in these ways, we shall never lose sight of our unique place in the wider economic and social picture. NSB exists, first and foremost, to promote certain national and social goals. Although the details of policy may change from administration to administration, these goals have never varied and will never. By its very mandate, NSB is committed to support the economic and social programmes of the Government in office. Good news is that the incumbent Government has been extremely supportive in this regard, establishing a framework conducive to meet the Bank’s core operations. With our broad geographical base, our strength in diversity and our influence in all economic and social categories, there is a great deal we can and will do in the months and years ahead to improve the lives of all Sri Lankan citizens.
Conclusion
As we stand poised on the threshold of a new era for the Bank and for the country, our customers and external stakeholders
themselves have contributed to it, and for this I thank them on behalf of the Government and the NSB team. No matter in what capacity they made and continue to make their respective contributions, they have been integral to our success.
Thanks are also due, in no small measure, to our own people.
result of their hard work and loyalty to the organisation. In this context, I should like to add my particular, personal thanks to the General Manager/CEO and his management team.
I extend our unreserved appreciation to the Postmaster General, officials of the Postal Department, postmasters, sub-postmasters and other officials for their vital assistance which made our reach in grass roots.
I also offer my sincere thanks to my fellow Directors for their insight, advice, support and professionalism – factors which I have come to rely on, and which also play an integral role in the Bank’s success.
On conclusion, I would like to thank the Hon. Minister of Finance, the Hon. State Minister of Finance, the Secretary to the Treasury, the Governor of Central Bank and officials, the Attorney General, the Auditor General and his team and heads of other regulatory bodies for their unstinted support, guidance and assistance.
Look forward to working with all these officials in the ensuing year to achieve strategic objectives.
Aswin De SilvaChairman
26th March 2015Colombo
M E S S A G E SL E T T E R F R O M T H E C H A I R M A N

National Savings Bank
Annual Report 2014
Page 20
National Savings Bank
Annual Report 2014
Page 20
Consciously playing our part
For over 180 years, the last 42 as the National Savings Bank,
Believing that success should be measured by the greater good of development, our mission at NSB has always been about more than earning a higher return, being a beneficent workplace or even helping our customers succeed – although all three goals
Sri Lankans with the financial wherewithal they need to build a
the Sri Lankan financial services sector faced a number of challenges, particularly with respect to the global macroeconomic environment and also getting accustomed to low interest rate
G E N E R A L M A N A G E R / C E O ’ S R E V I E WM E S S A G E S

National Savings Bank
Annual Report 2014
Page 21

National Savings Bank
Annual Report 2014
Page 22G E N E R A L M A N A G E R / C E O ’ S R E V I E WM E S S A G E S
In 2014, the Bank became:
Stronger The Bank led the market in terms of lending growth. We achieved an asset base of Rs. 780 Billion, up by 19% from Rs. 654 Billion a year before, funded by our successful tapping of the International Bond market and growth in our deposit base. Several major loans to State-Owned Enterprises (SOEs) amounting to Rs. 79 Billion as of 31st December 2014 and the growth in the loans portfolio contributed to this growth in asset base. This growth is particularly impressive given the contraction of our pawning business. Total value of the pawning portfolio declined to Rs. 33 Billion by end of 2014 from Rs. 50 Billion recorded by mid 2013. More attractive In 2014, one key to our success was through the introduction of a number of specialised products that helped us reach some important groups of previously underserved Sri Lankans. Those products included:
NSB Divi Surakum, a special pension plan for resident/non-resident Sri Lankans who are not entitled to receive a permanent pension to enjoy a comfortable retired life.
Buddhi, a scheme that offers loans for higher studies at attractive interest rates and a repayment schedule that only begins on completion of studies. In 2014, we disbursed Rs. 0.1 Billion to students.
NSB Diriya, a personal loan product developed for small and medium scale entrepreneurs to meet their start up or working capital needs. The Bank also introduced a special loan category for women and disabled people who want to start businesses.
More approachable Year after year, it keeps getting easier than before to be a customer of NSB. In addition to banking through our network of 230+ branches and 4,000+ post offices and sub-post offices, we offer SMS and telephone banking and online banking. Expanding the network further, we opened seven more branches in strategic locations during the year. We have also established remittance relationships with many exchange houses and banks in countries where
there is a sizable Sri Lankan expatriate population. Today, we can confidently maintain that NSB is in reach of all Sri Lankans, wherever they may be.
Smarter In our current strategic plan, one of our key objectives is to increase the efficiency of the Bank through the automation of more processes. In 2014, we began a long-range process of upgrading our systems in a way that will improve the Bank’s efficiency, lower its costs and enhance its customer service.
More skilled and flexible Conventional wisdom has it that as financial services grow more automated, the human element becomes less important. In fact, the opposite is true: companies the world over are finding that as computers take over more of the routine work, the jobs that remain tend to demand people who have more highly developed skills and a greater capacity to learn.
During the year, the Bank recruited a total of 560 new employees giving priority for women. After this recruitment drive, the Bank equipped itself with more qualified employees to become managers, giving us a deep reservoir of potential leaders to draw on as we continue to grow. In addition to this hiring more leaders for tomorrow, we filled some important positions that further professionalised the enterprise.
We are proud of our relatively lower staff turnover ratio which speaks volumes about our attractiveness as an employer, particularly given that as the economy grows, the number of attractive opportunities does too.
Contributions to Government
As a fully Government-owned institution, our contribution to the Government is manifold. We pay dividends, help collect taxes and fund national infrastructure development projects.
During the year, we paid Rs. 4 Billion as dividends and Rs. 1.3 Billion as a special fee to the Government Treasury. We paid Rs. 5.7 Billion as direct taxes on our own profits.

National Savings Bank
Annual Report 2014
Page 23 M E S S A G E SG E N E R A L M A N A G E R / C E O ’ S R E V I E W
Contributions to Society
In 2014, the Bank devoted its social responsibility resources to helping all of Sri Lankan society. In addition to ‘giving at the office,’ through our special products for children, young people, women and senior citizens, we contributed to a variety of educational, cultural and religious undertakings. Our work even extended beyond the island as we reached out to Sri Lankans working in Saudi Arabia, Kwait, Dubai and as far as Italy, offering them not just financial advice on how to send remittances home safely but a friendly face from home, through the organisation of a number of community activities throughout the year.
A Plan Takes Hold
One reason for the last year’s successes to be especially encouraging to us is that they indicate our 2014-2016 strategic plan is working.
Even before this initiative began, NSB was already Sri Lanka’s third-largest bank in terms of deposits and the institution with one of the widest account bases. Its unique Government-backed guarantee on all deposits and national reach had given the Bank one of the island’s largest fund bases, as well as access at advantageous terms to the international institutional investment market.
Now, by following this strategy, we are raising NSB’s value to all its stakeholders as we try to capitalise on our competitive advantages through the development of additional capabilities. In each of our priority areas – Information Communication Technology development, customer satisfaction, recruitment and treasury management – we made substantial progress to gear the Bank for the times ahead.
In two more years, I have no doubt that our current programme will enable us to reach our goal: surpassing total assets of Rs. 1 Trillion, a deposit market share of 12%. We also expect to win 8% market share of foreign remittances and continue to grow our credit at a steady 19% a year for the next two years.
A Team for the Greater Good
In my many years with the National Savings Bank, I have come to realise that the Bank is far more than an important financial conduit: NSB is a replica of Sri Lanka – a community in which diverse groups of people all have a vital role to play in advancing our society.
I would like to thank first the outgoing Chairperson, the Board of Directors and the former General Manager/CEO for their valuable counsel, support and years of dedicated service. I would also like to thank our management and each and every member of our staff for their devotion to the Bank. I also take this opportunity to warmly welcome the Chairman and other members of the new Board who will provide leadership and encouragement for the implementation of the strategic plan and further advance the cause of savings among Sri Lankans. We owe thanks to our other stakeholders as well: to the Hon. Minister of Finance, Secretary and other officials of the Ministry of Finance, the Secretary to the Treasury, the Governor and officials of the Central Bank of Sri Lanka, the Auditor General, the Attorney General and the Postmaster General and his staff for their support and guidance; investors for their confidence; and the trade unions for their support and co-operation.
Most of all, I would like to thank our customers for choosing us as their financial service partner. Whether you chose us to safeguard a fistful of Rupees for your little girl, fund your nephew’s medical education or extend a multi-billion Rupee loan to build a new bridge, we are proud to have earned your trust.
S.D.N. PereraGeneral Manager/CEO
26th March 2015Colombo

National Savings Bank
Annual Report 2014
Page 24

National Savings Bank
Annual Report 2014
Page 25
Business Model
Who We Are – 27Operating Environment – 29
Strategic Direction – 33Stakeholders – 34
Materiality and Value Creation – 39Management Approach – 42

National Savings Bank
Annual Report 2014
Page 26

National Savings Bank
Annual Report 2014
Page 27 W H O W E A R E B U S I N E S S M O D E L
The Bank
The National Savings Bank is Sri Lanka’s oldest financial institution. It has a proud heritage that dates back over 180 years. Incorporated in 1971, through the amalgamation of the Ceylon Savings Bank (Est. 1832), the Ceylon Post Office Savings Bank (Est. 1885),the Savings Certificates Section of the Postmaster General’s Department (Est. 1938) and the National Savings Movement (Est. 1942), the Bank today stands tall as the country’s premier savings bank (see page 291 for profile). Thus, in 1972, The National Savings Bank (NSB) was established as a fully state-owned institution, by Act of Parliament. The Bank’s business is complemented by its wholly-owned subsidiary, NSB Fund Management Company Ltd., and together they comprise the NSB Group.
For the 12th consecutive year, NSB earned a AAA long-term credit rating from Fitch Ratings Lanka Ltd., in recognition of its financial stability and management practices. This was further strengthened by re-affirmation of BB- Stable international credit rating by Fitch Ratings and B+ by Standard and Poor’s Rating services. NSB as first among equals of its peers, offers a splendid array of modern banking experiences, blended with modern technology, to cater to the evolving needs of every member in the family.
Markets Served
Focused on promoting thrift and mobilising savings, the Bank’s operations span the entire length and breadth of Sri Lanka and our ‘footprint’ consists of over 5,000 touch points incorporating 236 branches (see page 278 for geographic distribution), 2,287 school bank units, 653 post offices, 3,410 sub-post offices, 260 ATMs as well as via Internet/phone banking.
The Bank offers a wide range of deposit and credit products (see page 272) to a broad clientele. Sri Lankans from all walks of life bank with NSB, from rural farmers with modest means to successful urban entrepreneurs; from school children learning to save to senior citizens seeking a superior return for their retirement; from expatriate nationals, sending money home to Government workers trusting us with their pensions; from home builders seeking construction loans to build affordable housing to corporates seeking long-term project finance.
Operational Structure
The Bank’s internal structure broadly comprises ‘operations divisions’ and ‘support services’. The former encompasses the activities of Branch Management, Retail Lending, Corporate Finance, International Operations, Postal Banking and Treasury Operations whilst the latter includes the activities pertaining to areas such as Legal, Information Technology, Supplies, Premises, Finance and Planning, Human Resource Development, Training, Marketing, Risk Management, Compliance and Internal Audit.
Mr. H.M. Hennayake Bandara retired from the post of General Manager/CEO with effect from 19th June 2014, after serving the Bank for 14 years in Corporate Management level. Mr. S.D.N. Perera took over as the Acting General Manager/CEO with effect from 20th June 2014. Mr. Perera was assumed duties as the General Manager/CEO on 12th March 2015.

National Savings Bank
Annual Report 2014
Page 28W H O W E A R EB U S I N E S S M O D E L
Structurally, the Bank also made some significant changes in its back-office functions. Our Compliance division was detached from the Risk Management Division and set up as an independent department. The Card Centre and E-Banking Unit too was transferred from the purview of the IT Division to the Branch Management Division and Asset Management Division respectively. The Bank also restructured the back-office operations of the Asset Management Division (AMD), Credit Division, Corporate Credit Division and the International Business Unit (IBU) under the Finance & Planning Division. At the same time, the Treasury function of both Asset Management and IBU was entrusted to the restructured Asset Management Division and their middle office functions were brought under the purview of the Risk Management Division. Finally, the credit risk management function that had been carried out by the Credit division and Corporate Credit Divisions were also transferred to the Risk Management Division.
Scale of Operations
At the end of 2014, the Sri Lankan banking industry included 25 licensed commercial banks and 9 licensed specialised banks, with 34 players in total (2013: 33 banks). In terms of market share, the Bank accounted for 5.5% of Loans and Receivables, a 11.5% share of customer deposits and a 11.1% share of total assets.
The gross income of the Bank increased by 19% during the FY 2014 to Rs. 77,890 Million, with profit before tax increased by 360% to Rs. 10,472 Million, mainly as a result of increase in net interest margin. Total assets of the Bank grew by 19% to Rs. 779,466 Million during the year.
The number of deposit accounts has increased steadily at around 2.5% p.a. over the past three years and reached 18.35 Million by end 2014.
The Bank’s staff strength averaged 3,159 persons over the past three years, with year 2014 ending with a total of 3,358 employees, of which 89% were in the permanent cadre.

National Savings Bank
Annual Report 2014
Page 29 O P E R A T I N G E N V I R O N M E N T B U S I N E S S M O D E L
International Economic Environment
The global economy grew by just 3.3% in 2014, according to the IMF’s World Economic Outlook Update for January 2015. A modest increase in global growth to reach 3.8% in 2015 is expected, while a stronger growth performance is anticipated in some advanced economies and emerging economies. Nevertheless, geopolitical uncertainties, threat of deflation, increased volatility in financial markets, high debt levels and high unemployment in certain regions and countries continue to threaten a full recovery in global economic activity.
Emerging market and developing economies grew at 4.4% in 2014. Many emerging markets and developing economies are in the process of adjusting to tighter global financial conditions. Domestic demand in China moderated more than expected, topping 7.4%. In India, the post-election investor optimism helped the country end the year with a 5.6% growth. Meanwhile, geopolitical uncertainties clouded the economic outlook of the Middle East, Russia and the Commonwealth of Independent States. Global inflation is expected to remain low in 2014-15 with excess capacity in advanced economies, weaker domestic demand in several emerging markets and subdued commodity prices. The US Federal Reserve continued the gradual tapering of its Quantitative Easing (QE) programme as signs of economic recovery became stronger, but the European Central Bank (ECB) moved in a different direction due to deflationary fears. These ‘asynchronous’ monetary policy adjustments in advanced economies have resulted in increased volatility in global financial markets, including steep swings in exchange rates between mature economies as well as with and among the developing economies. Capital flows to most of the emerging economies declined sharply in the first half of 2014, mainly due to concerns about the recovery of Euro zone economies, intensified geopolitical tensions in emerging economies and the gradual unwinding of monetary stimulus in the US.
The drop in oil prices that started in mid 2014 would have normally spurred economic growth, but many international organisations expect the impact of the prevailing low oil prices to be modest due to a variety of offsetting factors in both oil producing as well as importing countries, such as unfavourable economic environments, high unemployment levels, political uncertainties, tightened monetary and fiscal policies, poor consumer spending and a lingering hangover from the global economic crisis in 2008.
Local Economic Environment
The Sri Lankan economy has grown by 7.4% in the year 2014, reflecting increased domestic economic activity and rising external demand. The positive macroeconomic policy environment contributed to the strengthening of the growth momentum while global economic conditions continued to improve, particularly in export destinations, which supported domestic economic activity. While all three sectors contributed to the growth, the contribution of the Agricultural sector was moderate due to adverse weather conditions. The Industrial sector made the highest contribution followed by the Services sector.
Well-managed demand pressures, favourable inflation expectations and supply side improvements kept consumer price inflation below 5 percent on a year-on-year basis during the year. In the context of low inflation and a benign inflation outlook, the Central Bank maintained a relatively easier monetary policy stance to provide further stimulus to economic activity and reduced the Standing Lending Facility Rate (SLFR) by 50 basis points in January 2014. Nevertheless, the reliance of the private sector on bank credit to finance economic activity moderated as the availability of other domestic and foreign sources of financing grew. In this context, the Central Bank rationalised access to the Standing Deposit Facility with effect from 23rd September 2014, to urge commercial banks to pursue credit disbursements more actively at reasonable interest rates.

National Savings Bank
Annual Report 2014
Page 30O P E R A T I N G E N V I R O N M E N TB U S I N E S S M O D E L
Public investment reached 6.8% of GDP with continued Government investment in Infrastructure projects. The unemployment rate declined to 4.3% during the year 2014 from 4.4% in 2013. Domestic savings increased to 21.1% of GDP in 2014 from 20% in 2013, while gross investment reached 29.7% of GDP in 2014, up from 29.5% recorded in the previous year. National savings also increased to 27% of GDP from 25.8% in 2013 with increased workers’ remittances.
Earnings from exports during 2014 rose 7% to USD 11,130 Million, driven largely by a rise in textile and garments, tea and coconut exports. Exports recorded healthy growth while imports decelerated, resulting in a lower trade deficit. Continued inflows to the private and public sectors further strengthened the financial account of the Balance
recorded a surplus of USD 1,369 Million by end 2014 and gross official reserves reached a historically high level of USD 8.2 Billion at end of 2014.
The external current account deficit also contracted to USD 523 Million during the year 2014 compared to deficit of USD 2,541 Million in 2013. A substantial increase in earnings from export of goods and also the export of services such as tourism, port and airport related services and computer and information services, together with an increase in workers’ remittances, helped reduce the external current account deficit. Workers’ remittances, which account for a greater share of the secondary income account, grew by 9.5% to USD 7,018 Million for the year 2014. The increase in skilled and professional labour migrants as well as increased awareness on remitting money through formal channels has contributed to the significant growth in workers’ remittances.
Meanwhile, net inflows to the Colombo Stock Exchange (CSE) included USD 43.7 Million to the secondary market and USD 4.4 Million to the primary market, while the proceeds
of the International Sovereign Bond issues amounting to USD 1.5 Billion and foreign investments in Treasury Bills and Treasury Bonds at USD 196 Million also contributed to the improvement of the financial account during the period. Improved trade balance, other inflows to the current account and enhanced inflows to the financial account contributed to this significant improvement in the BOP.
The Sri Lankan Rupee remained stable against the USD during the first nine months of the year, appreciating marginally by 0.3%. Continued inflow of foreign exchange by way of current, capital and financial flows helped maintain the stability of the Rupee during this period. Reflecting the cross currency exchange rate movements, the Sri Lankan Rupee appreciated against the Japanese Yen by 13.5%, the Pound Sterling by 5.6% the Euro by 13.2% and the Indian Rupee by 2.1%, while depreciating against the USD by 0.23% by end 2014.
Financial Services Sector
In 2014, several adjustments were introduced by the Central Bank to streamline the policy interest rate corridor. Accordingly, the Central Bank established a Standing Rate Corridor (SRC) in place of the policy rate corridor while introducing Standing Deposit Facility Rate (SDFR) and Standing Lending Facility Rate (SLFR) that replaced, respectively, the Repurchase rate and the Reverse Repurchase rate.
Further, in consideration of the Central Bank’s zero credit risk in Rupee transactions, the Standing Deposit Facility (SDF) was uncollateralised from February 2014, while all other Open Market Operation (OMO) transactions continued to remain collateral based.

National Savings Bank
Annual Report 2014
Page 31
Reflecting on the Central Bank’s desire to curtail the volatility of interest rates in the short-term money market further, on 2nd January 2014, the Standing Rate Corridor was compressed to 150 basis points from 200 basis points by reducing the SLFR by 50 basis points. Since then, the SDFR and the SLFR have remained at 6.50% and 8.00%, respectively. In addition to these measures, considering the improvements in the external sector, the Central Bank decided to remove the minimum cash margin requirement of 100% against Letters of Credit opened with commercial banks for the import of certain categories of motor vehicles, imposed on 30th August 2013, with effect from 2nd January 2014.
To encourage Banks to lend more actively to the private sector, access to the SDF was rationalised as a temporary measure with effect from 23rd September 2014. Accordingly, OMO participants including commercial banks would earn a lower rate of 5 percent if they access the SDF of the Central Bank more than 3 times per calendar month.
Net Credit Growth (NCG) of commercial banks amounted to Rs. 231 Billion, which was mainly a result of banks investing surplus funds in Government Securities. Eased access to foreign financial markets and improved domestic corporate debt and equity markets as well as the impact of lower gold prices, which affected the pawning portfolio of the banking sector, were reflected in the moderation of the growth of credit extended to the private sector by commercial banks in 2014. Accordingly, the year-on-year growth of credit extended to the private sector decelerated to 2.6% up to November 2014 from 7.5% at end 2013.
Reflecting monetary policy easing, market interest rates fell further in the first nine months of 2014. The Average Weighted Call Money Rate (AWCMR), which moved towards the lower bound of the SRC during the year due to high levels of Rupee liquidity in the market, declined further with the announcement of rationalising access to the SDF of the Central Bank. Yield rates on Government Securities
too declined significantly during the year 2014 to reach historically low levels. The Average Weighted Deposit Rate (AWDR) declined to 6.20% by end December 2014 from 9.37% at end 2013. The Average Weighted Fixed Deposit Rate (AWFDR) also declined to 7.13% by end December 2014 compared to 11.78% at end 2013. Commercial banks’ lending rates also continued to adjust downwards along with other market interest rates during the period under review with some rigidity in rates applicable on longer term advances being observed in the early part of the year. The weekly Average Weighted Prime Lending Rate (AWPR) declined significantly by 387 basis points to a historically low level of 6.26% by end December 2014 from 10.13% at end December 2013.
Although this is good macroeconomic news, some of these numbers represent a mixed blessing for the banking sector. The Interest margin of the banking sector held steady at 6.00% during the first 10-months period of the year but started to decline from the beginning of November. The spread between the Average Weighted Prime Lending Rate and Average Weighted Fixed Deposit Rate also fell.
However, low levels of inflation led the Real Interest Rate (as measured by the difference between the 12-month Gross T-bill rate and Inflation) to grow.
The overall soundness of the sector improved, as most institutions enhanced their reserves and compliance functions in order to meet the Central Bank’s new requirements for adequate capital and liquidity levels and an enhanced regulatory and risk management framework. The deceleration of credit growth however, impacted on the profitability of financial institutions. Domestic money market as well as the domestic foreign exchange market remained substantially liquid.
O P E R A T I N G E N V I R O N M E N T B U S I N E S S M O D E L

National Savings Bank
Annual Report 2014
Page 32
The stability of the financial system was maintained while the sector expanded. The process of financial sector consolidation, aimed at strengthening financial institutions further, completed six transactions by end of the year and 22 mergers/acquisitions are being finalised. Domestic financial markets remained liquid and the stock market and the corporate debt market gathered further momentum. The price indices of the CSE improved during the year and the market capitalisation reached a record Rs. 3 Trillion by end December 2014. The corporate debt securities market too continued to improve, mainly in response to new Government tax incentives.
The Treasury Bill Weighted Average (net) rates for 3, 6 and 12-months were 7.42%, 7.53% and 7.95% respectively at the beginning of the year. The Treasury Bill rates were 5.74%, 5.84% and 6.01% for 3, 6 and 12-months respectively at the end of the year. Accordingly, the 3, 6 and 12-month Treasury Bill rates declined by 168 basis points, 169 basis points and 194 basis points respectively, during the year. Primary and secondary market yields for Treasury Bonds declined during the year across all maturities. It is interesting to note that the long-term yield of the Treasury Bonds have come down significantly compared to the short-term yield, an indication that investors are becoming more concerned about long-term economic prospects.
O P E R A T I N G E N V I R O N M E N TB U S I N E S S M O D E L
Prospects for 2015
The Sri Lankan economy is projected to grow at a rate of around 8% in 2015, with all sectors contributing to this growth. Private and public sector investments to strengthen the traditional sectors as well as new emerging sectors are expected to raise the growth potential of the economy. Improving physical and social infrastructure is likely to enhance productivity of the economy further, resulting in sustainable and inclusive growth. Inflation is expected to remain below 5% in the medium-term. The recent decline in domestic energy prices should dampen inflation in the period ahead. Forward-looking monetary policy measures are expected to be implemented to maintain inflation at a level below 5%.

National Savings Bank
Annual Report 2014
Page 33 S T R A T E G I C D I R E C T I O N B U S I N E S S M O D E L
Our Purpose
The core mission of NSB is to provide customers with total financial solutions that optimally meet their savings and investment needs, whilst meeting the expectations of all other key stakeholders as well. It’s about actively participating with accountability, in the positive growth of economic, social and environmental capitals of the individuals and communities we work with, leading to the greater good of the nation and her people.
This calls for balancing the diverse expectations of the Bank’s stakeholders. We achieve this through stakeholder identification, engagement and mapping, which in turn lead to prioritisation, goal setting and strategising. It is a business model that recognises the two sides of value creation we discussed earlier (page 9).
Our Strategic Priorities
Our primary goal is to maintain our position as steward of the country’s savings. Over the next several years, we will diligently work on the following four interconnected priorities that will help us achieve this overarching goal:
Customer Satisfaction The success of the Bank is heavily dependent upon constant interaction with the customer in order to identify specific needs, to measure the delivery of these requirements and to monitor the responses received from customers. Therefore, we intend to develop and implement a Customer Service Index (CSI) to help track customer satisfaction levels and discern areas of significant improvement needed or shortcomings.
Information and Communication Technology (ICT) Development Future banking and financial services will be heavily dependent on ICT and customers would be rapidly moving towards a virtual banking regime as opposed to the traditional model of banking and finance. In line with
current trends and to meet the needs of the customer of the future, NSB plans to institutionalise a complete banking software solution during the next three to four years.
Treasury Management The NSB treasury will be strengthened with enhanced systems processes, skills and competencies with optimal balance sheet management.
Human Resource Development It is essential that NSB recruit, train, develop and retain young, professional, experienced personnel to achieve our goals. Therefore, in order to have sustainable growth, we will focus on (a) improving skills, capacities and the competencies of employees; (b) filling all vacant positions and ensuring that all branches have adequate staff; and (c) implementing effective performance evaluation, whilst linking performance to rewards. These will be addressed through an effective Human Resource Development (HRD) Plan.
Our Goals
Based on the strategic direction, with due regard to the current and projected operating environment and backed by a set of solid strategies, we have developed several important goals that we plan to achieve over the next several years. These goals relate to business volumes and their growth rates, related market shares, balance sheet structure, profitability, stability and the underlying resource requirements. Being quantifiable goals, they will provide clarity and help us move in the right direction.

National Savings Bank
Annual Report 2014
Page 34S T A K E H O L D E R SB U S I N E S S M O D E L
We have identified our key stakeholders on the basis of those who may be significantly affected by the Bank’s decisions and activities and those whose actions affect the Bank’s ability to create value in the short, medium and long term. Accordingly, the key stakeholders with whom we engage quite frequently are –
Shareholder Customers Employees Suppliers Regulators and Government Society and Environment Institutions
Stakeholder Engagement
Engagement with stakeholders is both programmed as well as ad hoc. Often it is a combination of both and based on statutory as well as business interests.
Stakeholder Mode of engagement Frequency of engagement Topics discussed Method of response
Shareholder
(Governmentof Sri Lanka, represented by the Ministry of Finance)
Submission of the Annual Report to the Ministry and Parliament
Annual Budget
Annual Action Plan
Strategic Business Plan
Management Letter
Media Statements
Publications
Interim Financial Statements
Periodic updates
Corporate website
Appointment of members to the Board
Participating in the Procurement Committee meetings
Procurement Plan
Annually
Annually
Annually
Once in three years
Annually
As & when required
As & when required
Quarterly
As and when required
Periodically
When there is a change in the Board
Twice a month
Quarterly
Annual results and financial position
Contribution towards the Consolidated Fund
Ensuring compliance in regulatory reporting
Ensuring maintenance of Statutory Ratios (Capital Adequacy, Liquid Assets etc.)
Assuring feasibility on network expansion
Plans to launch new products and re-launch existing products.
Strategies to maintain low NPLs
Ensuring compliance with laws and regulations
Market position
Target achievements
Purchase of goods and services
Submission of reports by due days
Contribution to the Consolidated Fund
Establishment of controls and procedures
Maintaining transparency and accountability
Approval for procurement decisions

National Savings Bank
Annual Report 2014
Page 35 S T A K E H O L D E R S B U S I N E S S M O D E L
Stakeholder Mode of engagement Frequency of engagement Topics discussed Method of response
Customers Customer access points
Ithurum Ayojana Kawa School banking units
Call centre
Surveys on customer satisfaction
Corporate events
Corporate website
Customer awareness programmes
CSR activities
Promotional campaigns
As and when required
As and when required
As and when required
As and when required by the customer
Periodically
Occasionally
As and when required
As and when required
As and when required
Interest rates and features of products and services
New products and services introduced
Accessibility to relevant and reliable banking information
Awareness on promotional activities
Satisfaction on rendered service
Future expectations of customers
Loan disbursement/loan recovery
The Bank and products/services offered
Change in customer characteristics and market trends
Introducing more features to products
Connecting advance technological features to products
Marketing campaigns
Direct promotional campaigns
Enhancing customers access points
Customer surveys
Opening and re-location of branches.
Enhancing customer satisfaction
National Savings Bank
Annual Report 2014
Page 36S T A K E H O L D E R SB U S I N E S S M O D E L
Stakeholder Mode of engagement Frequency of engagement Topics discussed Method of response
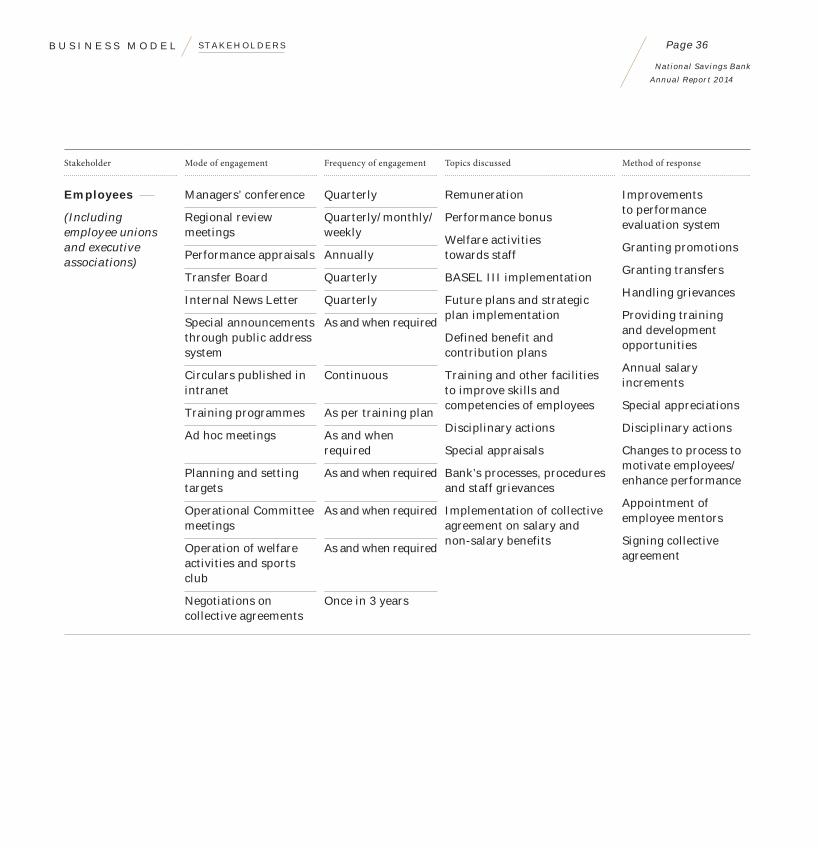
Employees
(Including employee unions and executive associations)
Managers’ conference
Regional review meetings
Performance appraisals
Transfer Board
Internal News Letter
Special announcements through public address system
Circulars published in intranet
Training programmes
Ad hoc meetings
Planning and setting targets
Operational Committee meetings
Operation of welfare activities and sports club
Negotiations on collective agreements
Quarterly
Quarterly/monthly/weekly
Annually
Quarterly
Quarterly
As and when required
Continuous
As per training plan
As and when required
As and when required
As and when required
As and when required
Once in 3 years
Remuneration
Performance bonus
Welfare activities towards staff
BASEL III implementation
Future plans and strategic plan implementation
Defined benefit and contribution plans
Training and other facilities to improve skills and competencies of employees
Disciplinary actions
Special appraisals
Bank’s processes, procedures and staff grievances
Implementation of collective agreement on salary and non-salary benefits
Improvements to performance evaluation system
Granting promotions
Granting transfers
Handling grievances
Providing training and development opportunities
Annual salary increments
Special appreciations
Disciplinary actions
Changes to process to motivate employees/enhance performance
Appointment of employee mentors
Signing collective agreement

National Savings Bank
Annual Report 2014
Page 37 S T A K E H O L D E R S B U S I N E S S M O D E L
Stakeholder Mode of engagement Frequency of engagement Topics discussed Method of response
Suppliers Procurement Plan
Procurement activities
Meetings with suppliers
Site inspections
Product demonstrations
Tender notices
Publication of information/notices
Annual
As & when required
As & when required
As & when required
As & when required
As & when required
As & when required
Bank’s requirement
Registration of suppliers
Procurement opportunities
Delivery of contractual obligations
After sales maintenance service arrangements
Warranty arrangements
Product quality defects
Price negotiations
Calling quotations
Signing agreements to supply goods and services
Payments on contractual obligations
Short listing suppliers
Awarding contracts
Renewal of license
Regulators and Government Institutions Central Bank of Sri Lanka
Department of Inland Revenue
Auditor General’s Department
Other Government Organisations
Professional organisations and business community
Directions and circulars
Interim Financial Statements
Statutory Examination
Periodic returns to regulatory bodies
Interviews and meetings
Specialists’ opinion
Participation in competitions
Annual Report
As and when issued
Quarterly
Annually
Periodically
As & when required
As & when required
As & when required
Annually
Performance of the Bank
Regulations and directives for Specialised Licensed Banks issued by the CBSL
Matters relevant to audit
Compliance with tax regulations issued by IRD
Sri Lanka Accounting Standards and Sri Lanka Financial Reporting Standards issued by the ICASL
Banking license fee
Labour regulations
Marketing and promotional Campaigns
Awards and accolades
Approval to open new branches
Relevant laws and regulations
Periodic returns
Responses and actions on supervisory concerns
Replies to audit queries
Payment of taxes and other statutory payments
Responses and suggestions on industrial and professional concerns

National Savings Bank
Annual Report 2014
Page 38S T A K E H O L D E R SB U S I N E S S M O D E L
Stakeholder Mode of engagement Frequency of engagement Topics discussed Method of response
Society and Environment
Media Campaigns
CSR Projects
Sponsorships
Press releases
Public relation activities
Special events
Delivery channels
Recruitments
Corporate website
Call Centre
Funding Government infrastructure projects
As & when required
Launch and re-launch of Products and services
Scholarships granted by the Bank
Social Responsibility activities carried out by the Bank
Employment opportunities
CSR activities
Responses to inquiries
Recruitments
Opening branches and installing ATMs
Introduction of products with special features
School banking units and Ithurum Ayojana Kawa
In addition, the Bank holds memberships in the following organisations through which it engages with industry participants and the wider public.
Association of Compliance Officers of Banks, Sri Lanka Association of Banking Sector Risk Professionals, Sri Lanka
Employers’ Federation of Sri Lanka Institute of Bankers of Sri Lanka (IBSL) Association of Professional Bankers of Sri Lanka
The National Chamber of Commerce of Sri Lanka Society for Worldwide Interbank Financial Telecommunication (SWIFT)
Eurogiro Global Payments community LankaClear (Pvt) Ltd. The Sri Lanka SWIFT User Group The World Savings Banks Institute

National Savings Bank
Annual Report 2014
Page 39 M A T E R I A L I T Y A N D V A L U E C R E A T I O N B U S I N E S S M O D E L
Through an extensive mapping process involving Bank executives, employees and key stakeholders, we developed a list of what we consider to be the 50 most important aspects of materiality and value creation of our business.
Aspects Significance in terms of Bank’s sustainability context
Internal Customers Communities Suppliers Regulators To the Bank To thestakeholders
Report
Economic
1 Economic performance H H H Yes2 Market presence H H H Yes3 Indirect economic impact H H H Yes
Environmental
4 Energy M H M Yes5 Emissions L L M No6 Effluents and waste M M M No7 Products and services M M M No
Social: Labour Practice and Decent Work
8 Employment H H H Yes9 Labour/management relations H H H Yes
10 Occupational health and safety M H M Yes11 Training and education H H H Yes12 Diversity and equal opportunity H H H Yes13 Equal remuneration
for women and men H H H Yes
14 Supplier assessment for labour practices M M M Yes
15 Labour practices grievance mechanisms H H H Yes

National Savings Bank
Annual Report 2014
Page 40M A T E R I A L I T Y A N D V A L U E C R E A T I O NB U S I N E S S M O D E L
Aspects Significance in terms of Bank’s sustainability context
Internal Customers Communities Suppliers Regulators To the Bank To thestakeholders
Report
Social: Human Rights
16 Non-discrimination H H H Yes17 Freedom of association
and collective bargaining H H H Yes
18 Child labour H H H Yes19 Forced or compulsory labour H H H Yes20 Security practices M M M No21 Assessment M M M No22 Supplier human rights
assessment M M M No
23 Human right grievance mechanism H H H Yes
Social: Society
24 Local communities H H H Yes25 Anti-corruption H H H Yes26 Compliance H H H Yes27 Supplier assessment for
impact on society M H M Yes

National Savings Bank
Annual Report 2014
Page 41 M A T E R I A L I T Y A N D V A L U E C R E A T I O N B U S I N E S S M O D E L
Aspects Significance in terms of Bank’s sustainability context
Internal Customers Communities Suppliers Regulators To the Bank To thestakeholders
Report
Social: Product Responsibility
28 Product and service labelling H H H Yes29 Marketing communication H H H Yes30 Customer privacy H H H Yes31 Compliance H H H Yes
Other Topics
32 Bank’s CSR activities H H H Yes
Importance to
Stakeholders
High
Medium
Low
Low Medium High
Importance to the Bank
1
15
26
2
16
28
3
17
29
8
18
30
9
19
31 32
11
23
12 13
24 25
6 7 14 20 21 22 4 10 275

National Savings Bank
Annual Report 2014
Page 42M A N A G E M E N T A P P R O A C HB U S I N E S S M O D E L
The economic, social and environmental implications of business are increasingly becoming more important than ever. In a world where the population is growing, natural resources are depleting faster than their regenerative capacity and stakeholder expectations are fast changing.
Our management approach outlines how NSB’s economic, social and environmental impacts are managed. Accordingly, we will first identify aspects that are material to NSB and its stakeholders.
The discussion that follows on economic, social and environmental aspects are based on why we consider the aspect to be material, what we do to manage them and how we evaluate our approach and results. They are elaborated further in the next section on Management Discussion in the context of deriving and delivering value.
On the basis of an aspect meeting any one of the following criteria, it was identified to be material to the Bank.
1. Top 32 most important internal and external stakeholder expectations and concerns (ascertained from various means of engagement, primarily correspondence)
2. Whether an aspect is a risk to the Bank or whether it creates value
3. Aspects contained in the GRI G4 Guidelines
Accordingly, the following aspects have been identified to be material in the spheres of economic, social and environmental.
Material Economic Aspects
Since economic prosperity is a sine qua non for the Bank to be able to contribute to the social and environmental prosperity and well-being of the Nation, the Bank attaches due prominence to its economic performance. Goals - both financial and non-financial - have been set in the Corporate Business Plan and related budgets.
The Bank continued to grow organically by consistently expanding its market position in terms of reach and enhancing its value proposition in terms of products and services, benchmarked service standards and streamlined internal processes. Being a national bank, island-wide presence contributes immensely to our success. Wherever possible and practical, we prefer local hires since it improves the diversity within the NSB team and provides fresh insights on local needs that may also be replicable elsewhere.
NSB pays due attention to the needs of the under-served populations in rural areas and in the North and the Eastern Provinces, for accessible and affordable services, while effectively managing its reach and products and services portfolio. Our branch network stood at 236 as at the end of the year, most of which have been opened in the rural areas where fewer facilities for savings and investment were available for people. This has helped rescue people in these areas from being ensnared by informal financial services. All branches now have Automated Teller Machines (ATM) providing 24-hours accessibility to banking services. In addition, there are 22 off-site ATMs, making a total of 260 ATMs in the island-wide network. POS mobilisation too continued to grow as the devices in the field grew in parallel with the expansion of the branch network. POS banking has proved to be an immense success in providing banking solutions to encourage the savings habit at schools, weekly and weekend fairs and factories.
The Bank is very close to peoples’ hearts and in fact, it is an undeniable truth that the vast majority of Sri Lankans have learnt the basics of savings from NSB. Going beyond the promotion of domestic savings and taking into account the immense contribution Sri Lankan migrant workers make towards the Gross Domestic Production, the Bank is determined to enhance its capabilities and focus on inward remittances and NRFC and RFC deposit mobilisation, thus supporting Sri Lankan expatriates. As a trusted and responsible state-owned Bank, NSB is proud to play the role of guardian of their remittances. The Bank has relationships with

National Savings Bank
Annual Report 2014
Page 43 M A N A G E M E N T A P P R O A C H B U S I N E S S M O D E L
prominent, established exchange houses around the world. In total, we are involved with 37 organisations, including MoneyGram International and the Eurogiro fraternity.
We continued to contribute towards the strengthening of the national framework by ensuring the availability of funds for development initiatives, primarily infrastructure projects. In addition, loans through the Paddy Marketing Board to farmers amounted to Rs. 1,000 Million for agricultural purposes as at 31st December 2014. More than 90% of the Bank’s Investment portfolio represents investments in Government Securities.
Beyond the value created for ourselves and the significant contribution to the Government coffers by way of Income Tax, indirect taxes, Special fees to Treasury and contributions to the Consolidated Fund in the form of dividends, our market presence impacts the local communities in many a way - including job creation, support extended to those in the supply chain, development of skills and knowledge and assistance in attracting other investors.
The Bank has taken measures to keep abreast with technological advancement that has bearing and influence on the financial services industry. Our Internet Banking and SMS Banking facilities added contemporary convenience for people able or wishing to manage their banking transactions on the move or at home. We have also introduced bill payment facilities, building one-stop-shop convenience through our network. We are connected to major utility suppliers, telecom providers and major insurance companies. The internet banking facilitated fund transfers to most of the Banks in the country.
We continue to conduct research on products and services offered by the Bank to re-design them in order to maximise customer convenience and satisfaction.
Material Environmental Aspects
As Elon Musk, the CEO of Tesla Motors said recently, ‘we are all in the same ship and the ship is sinking’. He was of course referring to a world where natural resources were fast depleting and as stakeholders of the world, we would all perish with the world unless we acted together, fast.
As a service-oriented organisation and with minimal use of physical input materials, the Bank’s operations do not have a material direct impact on the environment in terms of intensive resource utilisation, emissions or generation of hazardous waste. However, being a responsible public entity, the Bank strives to inculcate a culture of responsibility amongst its employees to encourage them to take personal responsibility for the effective and efficient use of materials and energy.
We only use promotional materials most of them are in biodegradable form. Non-biodegradable materials like polythene are not used as promotional materials. The Bank is quite conscious of the use of printing of paper and resulting wastage and their environmental impacts. Waste papers are collected and handed over to the Paper Corporation for recycling. The Bank uses teleconferencing and telecommunicating and conducts online training whenever possible and is developing more energy efficient office spaces. Plans have been drawn to switch to alternative fuel sources, reducing waste and recycling & reusing materials.
The Bank maintains attractive surroundings in branch premises by planting trees and maintaining natural landscaping. Special attention is given to avoid distractions to natural environmental cycles, such as felling of trees, when constructing branches. The Bank obtains legal clearance from local authorities for constructions of housing before granting loans.

National Savings Bank
Annual Report 2014
Page 44M A N A G E M E N T A P P R O A C HB U S I N E S S M O D E L
Material Social Aspects
Labour Practices and Decent Work
In its adherence to labour laws applicable to its operations, NSB looks well beyond meeting minimum standards in its HR protocols. This true for all relevant activity - recruitment, training and retaining the best talent as well as giving them a work environment that is consistent with our corporate values and business goals.
The Bank’s HR Policy provides the Bank employees with guidelines pertaining to our culture, work ethics, acceptable/ unacceptable behaviour, norms and standard procedures of the Bank, ensuring operational efficiency and addressing our HR mission. Thus the Bank invites them to be stakeholders in achieving the institution’s strategic objectives.
Our HR Vision is to build a work force focused on individual and business needs to achieve organisational excellence and a sustainable competitive advantage. The HR mission proactively supports NSB’s business strategy through a relentless focus on organisational excellence, providing and retaining the right people at the right place to meet the needs of the organisation.
The general objectives of the Bank’s HR approach are as follows:
a. To comply with rules and regulations and guidelines of the regulatory bodies;
b. To develop the Bank to achieve a competitive edge in the banking industry;
c. To ensure effective utilisation and maximum development of human resources while aligning the individual goals of the employees with the Bank’s strategic objectives;
d. To achieve and maintain a high morale amongst employees and to improve their working conditions and job satisfaction;
e. To be ethically and socially responsive to the needs of the society.
NSB hires staff with the right attitude and professional skills to enable them to develop a long-term relationship with the Bank. Every new recruit is considered a member of the NSB team and a partner in achieving its overall goals.
In order to promote the Bank’s business needs and long-term goals and to develop the capacity of all our employees, we also invest in the training and development of our people. We are a major Sri Lankan employer and we have displayed by example our commitment to equal opportunity in the workplace, self-improvement and provision of meaningful careers.
NSB as a Government entity is responsible for complying with the ILO conventions that are ratified by Sri Lanka. The Bank complies with the International Labour Standards in relation to avoidance of forced labour, providing for freedom of association and the right to organise, collective bargaining, equal remuneration, non-discrimination in employment, adherence to minimum age limits for employment and hours of work, maternity protection, workmen compensation among others and has enshrined such rights and privileges within its policies and procedures.
In balancing such factors as work priorities and exigencies and an evolving social order where the new generation, with their ‘connected’ lifestyles demanding more flexibility, the Bank encourages all staff to embrace a healthy work-life balance. This is an area that the Bank needs to actively work on with a view to readying itself to meet the needs of the ‘future worker’.
Human Rights
NSB is an equal opportunity employer. Recruitment, hiring, compensation, benefits, transfers, training and development, educational assistance, recreational programmes and promotion of individuals in all job positions are offered without bias in areas such as race, colour, religion, national origin, age, gender, physical disability, except where a bona fide occupational qualification exists.
An individual’s disability will not in any way preclude him from being hired, promoted, compensated or trained, if the individual concerned is qualified for the job. The Bank also accommodates employees’ religious beliefs and needs in its hiring and employment practices.

National Savings Bank
Annual Report 2014
Page 45 M A N A G E M E N T A P P R O A C H B U S I N E S S M O D E L
The Bank is committed to provide a work and learning environment free of any form of harassment. NSB considers harassment in all forms to be a serious offence and has taken measures to prevent any such incident within its premises involving staff as well as visitors in whatever capacity.
The Bank is committed to provide a safe and healthy work place for all employees. Management and all employees working in the Bank share the responsibility for the success of the safety and health procedures at their respective Branches/Divisions.
NSB upholds the freedom of association of its staff.
Society
As a Bank that touches the lives of almost all Sri Lankans in some way or the other, we recognise community engagement as a business imperative and the cornerstone of sustainability of our operations. We attempt to make a difference in the lives of the communities we touch.
We operate a countrywide network of delivery channels comprising branches, ATMs, Post Offices, Sub-post offices and School Banking units that reach both urban and rural parts of Sri Lanka. NSB has a wide range of corporate social responsibility initiatives that aims to continuously engage with the local community and strengthen the role of the Bank as a socially responsible corporate entity. We firmly believe that the highest level of community buy-in and acceptance is vital for our sustainability.
The Bank’s specific focus areas of social responsibility include education. A necessary and effective internal control mechanism has been established to prevent bribery and corruption in the Bank’s operations. Our Risk Management function too has been strengthened covering all major categories of risks in order to minimise the risk of bribery, corruption and frauds. Liaison officers have been appointed in all branches and divisions who report directly to the Head of Risk and Compliance Officer for their respective activities only in respect of Risk and Compliance.
We offer a wide range of products and services that cater to the needs of customers ranging from infants to senior citizens. In this regard, Ithurum Ayojana Kawa savings scheme warrants special mention since it is a product that is targeted at the low income segment, where there is potential for savings but reluctant to transact with formal banking sector.
Product Responsibility
With the advancement of Information and Communication Technology and the consequent ease of availability of information, consumers have become highly ‘literate’ and prefer to make informed decisions when it comes to purchase of products and services. The growing popularity and influence of social media and public interest groups have opened up many avenues for dissatisfied customers to air their grievances or seek legal action if product information had been misleading.
A vast majority of customers are not sufficiently financially literate and as such often perceive financial products and services to be complicated. Hence, the Bank takes great care in providing accurate and relevant information in a manner that can be easily understood by even a layman. Our marketing communications guidelines ensure that all applicable laws, directions, codes of conduct and ethical norms are strictly followed in all forms of public communications, including advertising, promotion and sponsorship of products and services.
In the absence of issues relating to safety standards and environmental concerns, product responsibility for us entails offer of products and services that provide the maximum possible benefits to the customer whilst the manner and delivery of the offer will not be misleading in anyway. We are also aware of the consequences – financial as well as otherwise – of a breach in customer privacy which can lead to fines, penalties and even to the loss of reputation. Hence, we have given highest priority to customer privacy and maintain secure systems and procedures which include an oath of confidentiality taken by employees.

National Savings Bank
Annual Report 2014
Page 46

National Savings Bank
Annual Report 2014
Page 47
Management Discussion and
Analysis
Deriving Value – 49- Financial Capital – 49- Institutional Capital – 58
Delivering Value – 59- Investor Capital – 59- Customer Capital – 60- Employee Capital – 65- Social and Environmental Capital – 69

National Savings Bank
Annual Report 2014
Page 48

National Savings Bank
Annual Report 2014
Page 49 D E R I V I N G V A L U E M A N A G E M E N T D I S C U S S I O N A N D A N A L Y S I S
Internal Capital Formation
Financial Capital
The Bank recorded its best-ever performance for the year ended 31st December 2014, regaining its strong market position in the industry. The current year’s performance reflected the successful implementation of the business strategies identified in the Bank’s 2014-2016 business plan.
A summary of the financial performance for the year 2014 is given below:
2014Rs. Million
2013Rs. Million
GrowthRs. Million
Growth%
Gross Income 77,890 65,573 12,317 18.78Total operating income 25,178 11,399 13,779 120.88Impairment provision 3,476 1,380 2,096 151.88Expenses 9,194 7,116 2,078 29.20VAT and NBT 2,036 624 1,412 226.28
Profit before tax 10,472 2,278 8,193 359.50Tax 3,605 1,095 2,510 229.22
Profit after tax 6,867 1,184 5,683 479.98
Income
The Bank’s gross income for the year increased by 19%, from Rs. 65,573 Million for the year 2013 to Rs. 77,890 Million in 2014, details of which are given below:
2014 2013
Rs. Million Mix (%) Rs. Million Mix (%)
Interest Income 74,023 95.03 64,248 97.98Fee and commission income 356 0.46 228 0.35Net Gain/loss on trading 1,905 2.45 857 1.31Net Gain/Loss on financial investments 1,349 1.73 – –Other operating income 258 0.33 240 0.37
Total gross income 77,890 100.00 65,573 100.00
Gross Income and Composition
[ Rs. Million ]
20,000
0
40,000
60,000
80,000
2012 2013 2014
Fee andCommissionIncome
Net Gain/(Loss) fromTrading
Net Gain/(Loss) fromFinancialInvestments
InterestIncome
OtherOperatingIncome (Net)
Interest income represented 95% of the Bank’s gross income. Overall, interest income increased by Rs. 9,775 Million or 15% over 2013, as a result of increase of interest income from investments in Government Securities due to investment of
Bond issues in Sri Lanka a Development Bonds and in Treasury Bonds until funds are disbursed to intended projects/SOEs and increase of interest income from loans granted to SOEs.
Fee and commission income also increased by 56% from Rs. 228 Million in 2013 to Rs. 356 Million in 2014, mainly due to introduction of an ATM service fee for customers and also due to increase in service fees on services rendered in foreign currencies. Transaction volumes also rose. However, these gains were partially offset by the increase in fees paid to MasterCard and Visa for debit card transactions.
Trading income doubled in 2014 as several sources of income grew - dividend income; profit on sale of a trading bond of which the prices increased during the year through the decline of interest rates and sale of equity shares. Overall, the fair value of the equity portfolio grew in 2014.

National Savings Bank
Annual Report 2014
Page 50
The income for the year included Rs. 1,349 Million of gain on Financial Investments, which represented the realised gain on disposal of Air Lanka investments that was fully impaired as of 31st December 2013. Gains on sale of equity shares held under AFS also contributed to the increase in gains from financial investments.
The total operating income of the Bank for the year increased by Rs. 13,779 Million from Rs. 11,399 Million in 2013 to Rs. 25,178 Million mainly due to the 112% increase of net interest income compared to that in the last year. This was the result of the 15% growth of the Bank’s interest income from last year and a 3% decline in interest expenses compared to 2013.
Net Interest Income
The Bank’s main sources of interest income were loans and receivables to other customers and financial investments held-to-maturity. The growth of corporate lending occurred more towards the last quarter of year 2014 while growth in the retail portfolio was dampened by negative growth in pawning advances. Therefore the interest income from loans and receivables to other customers increased marginally by 2.4% from Rs. 21,750 Million in year 2013 to Rs. 22,277 Million in the year 2014. The interest income from financial investments held-to-maturity increased by 25% from Rs. 40,010 Million in the year 2013 to Rs. 49,898 Million in 2014, as explained in the foregoing paragraphs.
In contrast, the interest expenses on Bank borrowings increased by Rs. 6,417 Million compared to the previous year due to the International Bonds issued in September 2013 and September 2014. The interest expenses due to other customers decreased by Rs. 7,916 Million during the year compared to the previous year as a result of reduction in interest rates on customer deposits offsetting the increase in borrowing costs. As a result, the Bank’s interest expenses reduced by 3% to Rs. 52,642 Million for the year from Rs. 54,141 Million of year 2013.
15,000
0
30,000
45,000
60,000
75,000
Interest Income and Interest Expenditure
[ Rs. Million ]
2012 2013 2014
Interest ExpenseInterest Income
Impairment Charge
During the year, one of the challenges the Bank faced was the decrease in the market value of gold as all of the collateral value of the Bank’s pawning portfolio is in gold jewellery. The falling gold price increased impairment provision by Rs. 2,096 Million. The Bank had to provide Rs. 3,476 Million on impairment of total loans and receivables during the year compared to Rs. 1,380 Million provided last year. Further, the Bank, has waived-off interest on those loans amounting to Rs. 1,444 Million.
800
0
1,600
2,400
3,200
4,000
Impairment Charge
[ Rs. Million ]
2012 2013 2014
M A N A G E M E N T D I S C U S S I O N A N D A N A L Y S I S D E R I V I N G V A L U E

National Savings Bank
Annual Report 2014
Page 51
Operating Expenses
Total operating expenses of the Bank increased by 29% to Rs. 9,194 Million in 2014 from Rs. 7,116 Million in 2013. The personnel cost increased with recruitments and the increase in contribution to employee defined benefit plans through actuarial valuation as at 31st December 2014. The main cause of increase in other expenses was the sum of Rs. 1,333 Million of special fee charged to the profit or loss, being the annual charge of a Rs. 8,000 Million special fee paid to General Treasury as a prepayment for six years from 2014 to 2019.
Taxes
Value added taxes and income taxes as percentages of operating profit have decreased from 21.5% to 16% and from 38% to 29% respectively, despite the increase in profit liable to VAT and income tax. This is primarily because the Bank had an unusually high tax bill in 2013, due to a one-off charge of tax arrears in 2011 and 2012.
Net Profit
As a result of decrease in interest rates, the Bank earned substantial profits on disposal of financial investments and disposals of trading investments and this helped the Bank record its highest-ever net profit of Rs. 10,472 Million before tax and Rs. 6,867 Million in net profit after tax for the year ended 31st December 2014. The basic earnings per share of the Bank increased to Rs. 21.46 per share for the year compared to Rs. 3.70 per share recorded for the previous year.
Other Comprehensive Income
Further, the Bank had Rs. 1,745 Million of other comprehensive loss (net of taxes) for the year compared to Rs. 284 Million of comprehensive profit (net of taxes) recorded for the previous year. This was the net result of the actuarial valuation of the employee benefits pension plan, net gain/losses on cash flow hedges and the fair value gain on financial assets available-for-sale.
2,500
0
5,000
7,500
10,000
12,500
Profit
[ Rs. Million ]
2012 2013 2014
Profit After TaxProfit Before Tax
Contribution to the Government
Greater profits meant the Bank returned a higher contribution to the General Treasury for the year, amounting to Rs. 1,745 Million of Value Added Tax, Rs. 291 Million of NBT, Rs. 3,606 Million of Income Tax, Special Fee of Rs. 1,333 Million, contribution to National Insurance Trust Fund Rs. 69 Million and Rs. 4,000 Million of dividend for the year ended 31st December 2014.
IncomeTax
SpecialFees
Contribution to the Government
NBTVAT
[ Rs. Million ]
2,500
0
5,000
7,500
10,000
12,500
2012 2013 2014
Dividends NITF
D E R I V I N G V A L U E M A N A G E M E N T D I S C U S S I O N A N D A N A L Y S I S

National Savings Bank
Annual Report 2014
Page 52
Significant Financial Assistance Received from Government
The Bank did not receive financial assistance from the Government.
However, there is a loan scheme for Government employees to purchase property and construct houses at concessionary rates. In the case of these loans, the difference between the existing market interest rate and the concessionary rate is reimbursed to the Bank by the Government on behalf of the beneficiary. This is a facility provided by the Government to Government employees in order to implement their strategies.
In additions the Bank has contributed to the payment of commuted pension fund for retiring Government employees through personal loans. This loan interest is paid by the Government.
Financial Position
As at 31st December 2014, the Bank was much stronger than it had been a year earlier. NSB returned one of its best annual performances ever in terms of deposit mobilisation, cash generation through financial activities and income generation.
2014Rs. Million
2013Rs. Million
Growth%
Total assets 779,466 654,368 19.11
Due to other customers 554,150 502,016 10.39Borrowings 191,103 120,434 58.68Other liabilities 10,953 9,700 12.92Equity and reserves 23,260 22,218 4.69
Total equity and liabilities 779,466 654,368 19.11
Assets
In 2014, the Bank grew to Rs. 779,466 Million, up from Rs. 654,368 Million in 2013. Overall, NSB outperformed the banking industry as a whole, growing by 19.11% compared to a growth rate of 17.35% for the industry.
2014Rs. Million
Mix%
2013Rs. Million
Mix%
Financial investments held-to-maturity 510,341 65.5 432,465 66.1Loans and receivables to other customers 216,162 27.7 158,870 24.3Financial assets held- for-trading 7,431 1.0 13,808 2.1Financial assets available-for-sale 4,037 0.5 2,926 0.5Property, plant & equipment and other assets 41,494 5.3 46,299 7.0
Total assets 779,466 100.0 654,368 100.0
200
0
400
600
800
1,000
Total Assets
[ Rs. Billion ]
2012 2013 2014
M A N A G E M E N T D I S C U S S I O N A N D A N A L Y S I S D E R I V I N G V A L U E

National Savings Bank
Annual Report 2014
Page 53
The financial investments held-to-maturity represented 65% of the Bank’s total assets as at 31st December 2014, almost the same as the year before (66%). Financial investments held-to-maturity increased by 18% from Rs. 432,465 Million as at 31st December 2013 to Rs. 510,341 Million as at 31st December 2014. The increase was primarily due to US$ 250 Million raised through International Bonds floated in 2014 and the proceeds were converted into LKR and invested in Treasury Bonds.
As at the end of financial year 2014 derivative financial instrument amounting to Rs. 2,880 Million against Rs. 5,119 Million in the correspondent period in 2013 was there due to the mitigation of exchange rate risk on foreign currency bond issue by entering a swap with Central Bank of Sri Lanka.
125,000
0
250,000
375,000
500,000
625,000
[ Rs. Million ]
Financial InvestmentsHeld-to-Maturity
2012 2013 2014
Loans and receivables to other customers increased by 36% from Rs. 158,870 Million to Rs. 216,162 Million. The disbursement of planned loans under International Bond issues and project loan disbursement for infrastructure projects in 2014 mainly contributed to the increase in the corporate loan portfolio. The increase in the retail loan portfolio attributable to increased demand for housing loans, personal loans and auto loans were offset by the negative growth of the pawning portfolio. Loans and receivables from banks as at year end 2014 also decreased by 13% compared with year end 2013 due to reduction of lending rates as a result of high market liquidity.
Notwithstanding the measures taken by the Bank to refine its credit selection process and appraisal capabilities to enhance asset quality, the overall net NPA ratio was above the industry average due to impact from default in pawning advances as a result of decline in gold prices. As a result, the Bank’s NPA ratio stood at 7.38% as of 31st December 2014 against 6.6% as at 31st December 2013.
Liabilities
The Bank’s deposit base grew by 10.4% from Rs. 501,890 Million as of 31st December 2013 to Rs. 554,060 Million of 31st December 2014, matching the industry’s growth. The Bank’s deposit mix of time deposits to saving deposits changed towards low cost saving deposits at the end of the year 2014 contributing to the better net interest margins. This was mainly due to the narrowing interest spread between savings and time deposits during 2014.
31st December 2013 Mobilisation 31st December 2014
Rs. Million Mix %
Rs. Million Growth %
Rs. Million Mix %
Saving deposits 115,252 24 26,333 23 141,585 26Time deposits 364,568 76 33,068 9 397,636 74Interest payable 22,070 14,840
Total Deposit 501,890 59,401 554,060
D E R I V I N G V A L U E M A N A G E M E N T D I S C U S S I O N A N D A N A L Y S I S

National Savings Bank
Annual Report 2014
Page 54M A N A G E M E N T D I S C U S S I O N A N D A N A L Y S I S D E R I V I N G V A L U E
The Bank’s other borrowings consisted of Rs. 134,273 Million of US$ Bonds (31st December 2013 - Rs. 100,148 Million) and Rs. 56,829 Million of securities sold under repurchase agreements (31st December 2013 - Rs. 20,285 Million). US$ 250 Million worth of 5-year International Bond was issued at 5.15% during the year further to US$ 750 Million worth of 5-year bond at 8.875% issued in 2013, lowering the weighted average cost of borrowings of the Bank. Repo borrowings at the end of the year increased by 180% compared to year before, mainly due to Rs. 18,576 Million of project loans disbursed in December.
The other liabilities as at 31st December 2014 mainly included Rs. 5,923 Million of Liability on Employee Retirement Benefits (unfunded pension liability, pension fund II, gratuity and retired employee medical liability) determined through actuarial valuation as at 31st December 2014 and taxes payable.
125,000
0
250,000
375,000
500,000
625,000
[ Rs. Million ]
Funding Structure
2012 2013 2014
Borrowings Other Liabilities EquityDeposits
Equity and Reserves
After contributing Rs. 4,000 Million to the General Treasury, the sole shareholder of the Bank and other statutory distributions, the equity grew by 4.7% from Rs. 22,217 Million as of 31st December 2013 to Rs. 23,260 Million as at 31st December 2014.
The Bank was able to achieve all its key targets set for 2014 and also was able to record a 3% of net interest margin (2013 - 1.7%), Rs. 21.46 of Earnings per Share (2013 - Rs. 3.70), cost to income ratio of 44.5% (2013 - 67.7%) and liquidity ratio of 91.5% (2013 - 92.7%).
15
0
30
45
60
75
Cost to Income Ratio
[ % ]
2012 2013 2014
The regulatory capital of the Bank was 20.5% at the core capital and 19.0% at the total capital levels and these ratios were well above the minimum statutory requirements. The capital adequacy ratios improved compared to those of 2013 with the increase in the Bank’s net profit during the year 2014.

National Savings Bank
Annual Report 2014
Page 55
Sources and Distribution of Income
2014Rs. Million
2013Rs. Million
Source of IncomeInterest 74,023 64,248Fee and commission 356 228Other income 3,512 1,097
Total 77,890 65,573
Utilisation of IncomeEmployees - Salaries and other payments to staff 4,797 4,209Depositors Interest 52,642 54,141Impairment for loans and other losses 3,476 1,380Other expenses 4,467 2,518
65,383 62,248Net Income before Government Taxes and Levies 12,508 3,326
GovernmentVAT, NBT and income taxes 5,642 1,719Consolidated Fund 4,000 3,000
Special fee paid to the Government 1,333 –Contribution to National Insurance Trust Fund 69 12
11,043 4,731To Reserves 1,465 (1,406)
Total 77,890 65,573
Direct Economic Value Generated and Distribution
Value Addition and Distribution
2014Rs. Million
2013Rs. Million
Value AdditionIncome from banking services 74,023 64,248Cost of services (52,642) (54,141)Value added by banking services 21,380 10,107Non-Banking income 3,798 1,292(Provisions)/reversal (3,476) (1,380)
21,702 10,019
Distribution to EmployeesPersonnel costs 4,797 4,209
To Government:Income tax 3,606 1,095Value added tax 1,745 624NBT on financial services 291 –Contribution to the consolidated fund 4,000 3,000Special fee paid to the Government 1,333 –Contribution to National Insurance Trust Fund 69 12
11,043 4,731
Retained for Expansion and Growth:Earnings 5,558 745Depreciation 304 334
5,862 1,07921,702 10,019
D E R I V I N G V A L U E M A N A G E M E N T D I S C U S S I O N A N D A N A L Y S I S

National Savings Bank
Annual Report 2014
Page 56
51%
42%
27%
47%
22%11%
Distribution of Value Addition
[ % ]
Retained for Expansion and GrowthTo GovernmentDistribution to Employees
2014 2013
M A N A G E M E N T D I S C U S S I O N A N D A N A L Y S I S D E R I V I N G V A L U E

National Savings Bank
Annual Report 2014
Page 57
Economic Value Added (EVA)
Economic value addition indicates the excess value created over the required return of the total investment by the share holders.
For the year ended 2014Rs. Million
2013Rs. Million
Invested EquityShareholders’ funds 23,260 22,217Add: Cumulative provision for impairment charges 3,925 2,006
27,185 24,223
EarningsProfit after taxation 6,867 1,184Add: Impairment and provisions 3,476 1,380
10,342 2,564
Cost of equity based on 12 months weighted average Treasury Bill rate plus 2% for the risk premium (%) 8.60 12.69Cost of Average Equity 2,337 3,074
Economic value addition 8,005 (510)
NSB Group
NSB Fund Management Company
The Bank’s sole and fully-owned subsidiary, NSB Fund Management Company Ltd., is one of 15 dedicated primary dealers in Government Securities appointed by the Central Bank of Sri Lanka. During the year, the Company obtained license from the Securities and Exchange Commission of Sri Lanka to function as a Stock Dealer/Stock Broker for Debt Securities and the Trading Membership for Debt Securities of the Colombo Stock Exchange, under the diversification programme of the Central Bank for Primary Dealers.
In addition, the Company provides such services to its Parent, NSB as bidding at primary auctions and settlement of funds and securities, handling fund transfers through RTGS, acceptance and delivery of Government Securities from counterparties for NSB and repositioning them in the Central Depository System (CDS) and providing custodian services to the Trustee-Fund Management activities of the Bank.
The value of the Government Securities portfolio held by the Company as at 31st December 2014 was Rs. 7,494 Million. The Company reported a net profit of Rs. 202 Million for the year compared to Rs. 344 Million recorded in 2013. Net assets of the Company as at 31st December 2014 was Rs. 1,915 Million including retained earning and special risk reserve amounting to Rs. 1,765 Million.
Group Performance
The Group also recorded highest ever net profit of Rs. 10,764 Million before tax during this year (2013 - Rs. 2,669 Million). This is an increase of 303% against previous year. The Group ascertained a profit of Rs. 7,054 (2013 - Rs. 1,528) after paying taxes showing a growth of 362%.
D E R I V I N G V A L U E M A N A G E M E N T D I S C U S S I O N A N D A N A L Y S I S
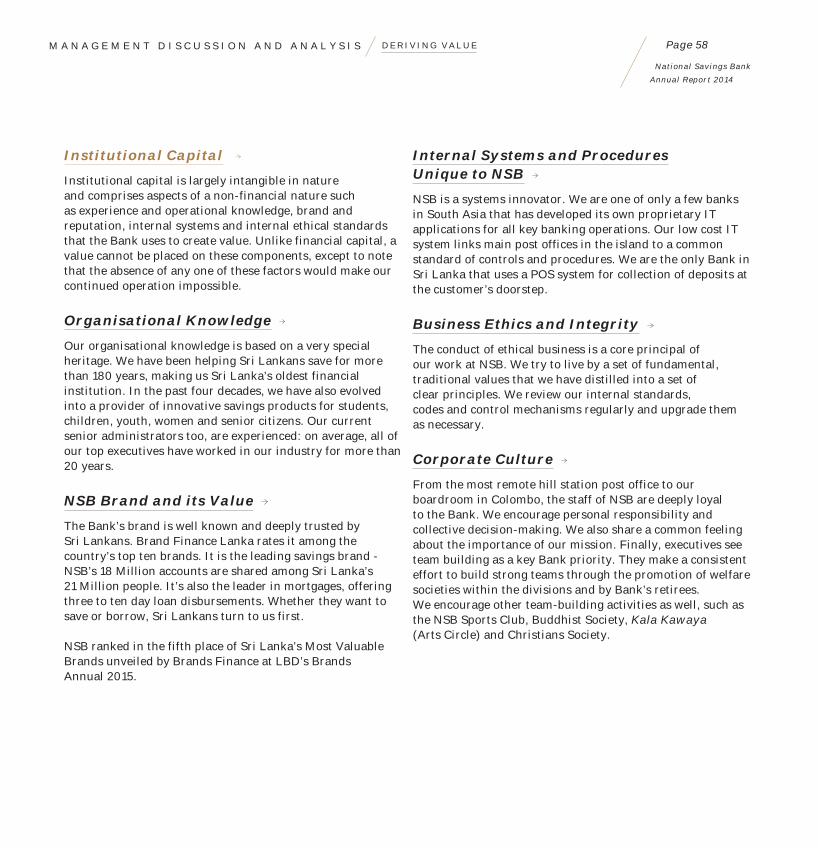
National Savings Bank
Annual Report 2014
Page 58
Institutional Capital
Institutional capital is largely intangible in nature and comprises aspects of a non-financial nature such as experience and operational knowledge, brand and reputation, internal systems and internal ethical standards that the Bank uses to create value. Unlike financial capital, a value cannot be placed on these components, except to note that the absence of any one of these factors would make our continued operation impossible.
Organisational Knowledge
Our organisational knowledge is based on a very special heritage. We have been helping Sri Lankans save for more than 180 years, making us Sri Lanka’s oldest financial institution. In the past four decades, we have also evolved into a provider of innovative savings products for students, children, youth, women and senior citizens. Our current senior administrators too, are experienced: on average, all of our top executives have worked in our industry for more than 20 years.
NSB Brand and its Value
The Bank’s brand is well known and deeply trusted by Sri Lankans. Brand Finance Lanka rates it among the country’s top ten brands. It is the leading savings brand - NSB’s 18 Million accounts are shared among Sri Lanka’s 21 Million people. It’s also the leader in mortgages, offering three to ten day loan disbursements. Whether they want to save or borrow, Sri Lankans turn to us first.
NSB ranked in the fifth place of Sri Lanka’s Most Valuable Brands unveiled by Brands Finance at LBD’s Brands Annual 2015.
Internal Systems and Procedures Unique to NSB
NSB is a systems innovator. We are one of only a few banks in South Asia that has developed its own proprietary IT applications for all key banking operations. Our low cost IT system links main post offices in the island to a common standard of controls and procedures. We are the only Bank in Sri Lanka that uses a POS system for collection of deposits at the customer’s doorstep.
Business Ethics and Integrity
The conduct of ethical business is a core principal of our work at NSB. We try to live by a set of fundamental, traditional values that we have distilled into a set of clear principles. We review our internal standards, codes and control mechanisms regularly and upgrade them as necessary.
Corporate Culture
From the most remote hill station post office to our boardroom in Colombo, the staff of NSB are deeply loyal to the Bank. We encourage personal responsibility and collective decision-making. We also share a common feeling about the importance of our mission. Finally, executives see team building as a key Bank priority. They make a consistent effort to build strong teams through the promotion of welfare societies within the divisions and by Bank’s retirees. We encourage other team-building activities as well, such as the NSB Sports Club, Buddhist Society, Kala Kawaya (Arts Circle) and Christians Society.
M A N A G E M E N T D I S C U S S I O N A N D A N A L Y S I S D E R I V I N G V A L U E

National Savings Bank
Annual Report 2014
Page 59
External Capital Formation
In the end, the success of a business is measured by the value it delivers to its stakeholders. The bar is set doubly high in the case of the National Savings Bank, an institution chartered and funded by the Government to promote the common good.
The value created by NSB for stakeholders through activities, relationships and linkages lead to the formation of capital external to NSB. They reside within our stakeholders, but NSB has access to and makes use of these and its own internal capital in driving its business. Our discussion will now focus on NSB’s external capital formation, the material ones being, investor capital, customer capital, employee capital and social and environmental capital.
Investor Capital
Although the Bank is a Government-owned and Government-funded institution, beyond its support and the support of our depositors, we continue to seek debt funding from institutional investors, mainly overseas, from time to time for expanding our business activities. As a result, 17% of our total funding as at 31st December 2014 had come from these debt holders, compared to 3% comprising of shareholders’ equity.
Holders of NSB Bonds include some of the most respected institutional investors in the world. Our USD 750 Million Bond issue in September 2013 was subscribed by a number of important global investors, including Pimco, JP Morgan Investment Management Inc. – New York, UBS Global Asset Management (Americas) Inc. – Chicago, Aberdeen Asset Management PLC - London, Danske Bank A/S – Copenhagen, and Lord, Abbett & Co. LLC of Jersey City.
In September 2014, we returned to the market with a five-year USD 250 Million Bond offering that matures in September 2019. This offering, took advantage of the favourable rate environment to lock in a 5.15% rate. As with our 2013 issue, it was heavily oversubscribed. Final order book reached USD 2.1 Billion, 8.5 times the value of the Bond issue which enabled us to achieve 35 basis point yield compression, and brought the overall yield down to 5.15%.
Another source of pride for us was the diversity of investor interest. Asian investors took 37% of the issue, Europeans took 29% and the US took 34%. The bulk of sales, 80%, were to fund managers, with the remainder split between private banks (11%), public banks (8%) and insurance companies.
The transaction is an indication of the growing respect global investors have for Sri Lanka in general and the NSB in particular: the 5.15% yield was the lowest ever achieved by a non-governmental Sri Lankan issuer, and was priced at just a sliver less than the last sovereign issue – 2.5 bps off the sovereign yield of 5.125%.
Finally, the growing breadth and internationalisation of our business is likely to make our investors’ assets even more secure by diversifying our investments and our revenue streams.
D E L I V E R I N G V A L U E M A N A G E M E N T D I S C U S S I O N A N D A N A L Y S I S

National Savings Bank
Annual Report 2014
Page 60
Customer Capital
There is much justification for the word ‘National’ to feature in the name of the National Savings Bank – for the scope and scale of its enterprise truly embraces the entire nation and its people.
We present the many measures by which the Bank has been able to deliver value to its customers and build customer capital.
The number of active accounts of the Bank grew in 2014 by 2.36%, to 18,347,819 from 17,924,301 – a remarkable figure when we consider that the total population of Sri Lanka is approximately 21 Million.
In view of NSB’s strong credit rating and Government deposit guarantee, it is perhaps no surprise that the value of deposits increased 11.91%, to Rs. 539,220 Million in 2014 from Rs. 479,820 Million at the end of 2013 (excluding interest payable). Particularly impressive was the growth in savings account value, 22.85%, a substantial climb to Rs. 141,585 Million from Rs. 115,252 Million. The value of time deposit accounts also grew, to Rs. 397,636 Million from Rs. 364,568 Million – a more substantial number in absolute value, though less in terms of percentage (9.07%).
Loans and receivables too increased by 36% from Rs. 158,870 Million to Rs. 216,162 Million. Average value per loan also grew in 2014 in four of the five largest loan categories. Personal loans grew by 37.23%, to Rs. 248,523 from Rs. 181,100. Project loans grew as well, by 132%, to Rs. 1,891 Million from Rs. 814 Million. Housing and property purchase loans recorded gains too, rising 1.73%, to Rs. 765,380 from Rs. 752,353. Vehicle loans, however, declined substantially, to Rs. 83,055.40 from Rs. 978,628/-, a 91.51% decline, consequent to the Bank extending vehicle loans to three-wheelers and motor cycles.
Debit card issuance continued in 2014. The Bank issued a total of 168,440 debit cards during the year, compared to 191,211 in 2013, a reflection not so much of declining customer enthusiasm but the growing maturity of the Sri Lankan card market. Master debit cards remained the favourite product – 135,926 cards compared to 32,514 Visa cards. Total debit cards and proprietors cards issued stood at 1,108,481 and 282,178 respectively as at 31st December 2014.
Strengthening Domestic Industry
During the year, the Bank was able to fulfil a long felt need of its customers. Expanding its reach and facilitation beyond the limits of its ‘housing loan’ segment, the Bank launched the ‘Diriya’ loan scheme to serve the upcoming small scale entrepreneurs of its customer base. During the year, the concentration was more on capacity building by way of skills, material and creating awareness across the branch network while gradually building up the portfolio. The entire branch network is now geared to implement this scheme vigorously keeping in line with the awakened economic expectations of the country. The scheme deviates from the conventional credit evaluation methodology of relying on a regular income base to a non-regular income base comprising the future cash flows of an enterprise.
To further develop the economy of rural Sri Lanka, the NSB continued to make microfinancing available to people engaged in village enterprises most likely to promote economic growth, including cottage industry manufacturers, entrepreneurs and the self-employed. Funds are lent at affordable interest rates and include convenient repayment schedules and reasonable grace periods.
M A N A G E M E N T D I S C U S S I O N A N D A N A L Y S I S D E L I V E R I N G V A L U E

National Savings Bank
Annual Report 2014
Page 61
Women
‘Sthree’, a savings account designed specifically for women, also grew in popularity this year. This account is facilitated with number of additional features as reduced interest on pawning. In a first for Sri Lanka, the Bank also created a business loan specifically for women. It is noteworthy that this is the first time in the history of this country that a loan scheme of this nature has been implemented to create a dedicated set of women entrepreneurs in the country.
The Bank offered special promotions throughout the year to encourage women to take advantage of these opportunities.
Throughout the year, women who have Sthree accounts were offered gifts when they passed a special milestone, such as a cash prizes on their wedding and Prarthana savings certificates in the event of the birth of a child.
Why all the effort? NSB believes that women are natural leaders when it comes to saving and looking after themselves, their families and society.
Students
In 2014, NSB launched a new product for students – the NSB ‘Buddhi’ higher education loan. This instrument allows individuals pursuing higher education at either local or foreign universities or other relevant institutions to obtain loans of up to Rs. 10 Million. During the year under review, the Bank disbursed Rs. 136.8 Million on 295 loans taken under this product.
Children
As the Bank is committed to the future well-being of Sri Lanka and its people, it naturally follows that we have a special interest in the upliftment and development of the children of our land.
Every year, the Bank conducts a series of seminars for grade 5 scholarship students Island-wide, facilitated by well-known personalities of the country with the aim of helping school children develop their academic skills, personalities and attitudes. This programme has been implemented continuously since 2008.
As part of its social responsibility, the Bank also recognises the academic successes of the students who sit for the Grade 5 scholarship examination. The top fifteen scorers in each district and those who secured the highest national ranks at the scholarship examination were bestowed with scholarships, by the Bank. Other students who gained merit results were recognised and awarded for their achievements at the respective NSB branches in their localities.
Under its ‘Nena Guna Thilina’ Book project, the Bank supported the reading habit amongst schoolchildren in remote areas of the country. Since most of the schools lack libraries and as the existing ones are ill equipped, the Bank provided assistance to start new libraries or supplement the existing resource base.
To encourage the growth of the school bank network, the Bank now offers cash rewards to schools that collect deposits from students. The school banks are an innovative educational project designed to encourage financial literacy and good savings habits: their management and operation are carried out by the students themselves.
D E L I V E R I N G V A L U E M A N A G E M E N T D I S C U S S I O N A N D A N A L Y S I S

National Savings Bank
Annual Report 2014
Page 62
Senior Citizens
Our ‘Divi Surekum’ annuity scheme was introduced on 4th August 2014, in response to a call by the Central Bank of Sri Lanka to strengthen the financial security of Sri Lanka’s senior citizens.
Open to savers between 35 and 64 years of age, ‘Divi Surekum’ is a flexible pension plan that enables NSB customers to provide for a regular income once they pass 60 years of age. Both resident and non-resident Sri Lankan citizens can avail themselves of this scheme either through monthly contributions or a lump sum payment. Benefits extend beyond the life of the account holders. For example, the plan includes a life insurance scheme for dependent children. The insurance cover provides – benefit in the event of an accidental death, – cover for permanent disability, – for natural death, hospital coverage - and critical illness coverage – to 10 critical illnesses.
Non-Resident Sri Lankans
One economically important group of Sri Lankans that has been traditionally underserved by the Banks, is non-resident Sri Lankans who repatriate substantial finances to the country. With a view to changing this scenario and in order to enable ease of remittance, the Bank took several initiatives.
Through the sponsorship of special events and community gatherings of migrant Sri Lankan workers the Bank endeavoured to build awareness of its presence, products and services amongst this population. We increased the available channels by signing up with more exchange houses in existing as well as new markets, thus enhancing accessibility to the Bank’s services. We also deployed our own staff in some of the exchange houses. Other measures extended included – introduction of branded NRFC/RFC minor accounts offering value added services, strengthening relationships with exchange houses, embassies and cargo agents, creating awareness among family members of migrant workers and
prospective migrant workers through meetings organised by AGA offices, participating in training programmes conducted by the SLBFE, building relationships with foreign employment recruitment agencies and advertising in local and overseas printed, electronic and digital media. Concurrently, the Bank is in the process of upgrading its internal systems and procedures – web services, management information system, system for counter operations etc. – to enhance the level of customer service.
Corporate Credit
The corporate loan portfolio grew significantly on the strength of funding infrastructure projects of the country. The year was significant in that the Bank was able to make commitments for lending in foreign currency for private sector projects as well as for State sector projects while increasing the USD denominated portfolio by over USD 50 Million or over four fold to reach USD 70 Million approximately. In an environment of very limited credit growth coupled with excess liquidity throughout the year, the corporate lending portfolio witnessed a concentration around State-owned enterprises. The terms of these facilities made a positive contribution to the bottom line of the Bank with minimum or near zero credit risk as the most of the facilities were granted to State Owned Enterprises with Government guarantee. The market conditions made it possible for many of the clients to pre-settle loans by means of refinancing at lower costs through loans, raising funds in the debt market etc. Nevertheless the portfolio grew to a level of Rs. 79 Billion from Rs. 18 Billion in 2013.
Of course, microenterprises are not the only source of economic growth in Sri Lanka. To help the entire country grow, the Bank is now offering project finance support as well – loans and other credit facilities that help promote, establish, expand, and/or modernise industrial, agricultural and other kinds of commercial ventures.
M A N A G E M E N T D I S C U S S I O N A N D A N A L Y S I S D E L I V E R I N G V A L U E

National Savings Bank
Annual Report 2014
Page 63
NSB as a Trusted Member of the International Financial Community
Sri Lanka’s economic activities are becoming increasingly international and as they change, so do the concerns of the NSB. One measure of our increasingly global outlook is our work in setting up remittance relationships with Delma Exchange and Lulu Exchange in UAE, Industrial Bank and Kookmin Bank in Korea and the Al Zaman Exchange and Islamic Exchange Co. in Qatar.
Another mark of our growing sophistication is the decision of the Central Bank of Sri Lanka to grant us greater latitude in the kinds of accounts we are allowed to maintain. The Central Bank now allows the Bank to open and maintain a variety of accounts for its customers, including Foreign Exchange Earners’ Accounts (FEEA), Securities Investments Accounts (SIA), Resident Non-National Foreign Currency Accounts (RNNFCA), Resident Guest Foreign Currency Accounts (RGFCA), Non-Resident Rupee Accounts (NRRA), Foreign Currency Accounts for International Service Providers and their Employees (FCAISPE), Non-Resident Non-National Foreign Currency Accounts (NRNNFCA), Non-Resident Block Accounts (NRBA) and Migrant Block Accounts (MBA).
In addition, the Central Bank agreed to allow NSB to serve outward remittances in foreign currency for educational, health and other purposes when requested – by third-party customers who do not have accounts in foreign currencies. The Bank is also now permitted to enter into foreign currency derivative agreements and operate a foreign currency dealing facility.
To help prospective customers overseas, the Bank has introduced web-based account opening facilities. At the same time, NSB introduced web service with Valutrans, a service that automatically credits remittance transactions
to beneficiaries’ accounts. A fast and secure channel for remittances, Valutrans is likely to grow increasingly popular in 2015, particularly after the Bank extends this service to Xpress Money, Al Fardan Exchange – Qatar and the UAE Exchange.
A new Inward Remittance Handling system to speed up the remittance process and to automate the counter operations was also developed in 2014. Both systems are expected to be implemented during the year 2015.
NSB as a Trusted Financial Advisor
As the world learned a new space during the Western financial crisis, a financial institution’s most precious asset is trust. In that respect, NSB has a stronger Balance Sheet than many of larger institutions:
The Bank’s research unit co-ordinated an island-wide customer survey to measure public attitudes towards savings and towards NSB. Scholars from the University of Kelaniya experienced in customer research, canvassed customers at 236 NSB branches.
Very few customers have complaints about their service with NSB. In 2014, our Call Centre logged 1,466 complaints out of 499,595 calls, or less than 0.3%.
No incidents of non-compliance with regulations or voluntary codes concerning product and service information and labelling were recorded, nor were any complaints made regarding breaches of customer privacy or losses of customer data. Nor did we pay any significant fines for non-compliance with laws and regulations concerning the provisions and use of products and services.
D E L I V E R I N G V A L U E M A N A G E M E N T D I S C U S S I O N A N D A N A L Y S I S

National Savings Bank
Annual Report 2014
Page 64
The Bank has a range of savings and lending products. Going beyond the disclosure requirements of the Central Bank, it is the Bank’s policy that all the data relevant to these products that would help customers in their decisions i.e., interest rates (nominal as well as effective), maturity periods, collateral requirements etc. are clearly displayed in all forms of communications as well as in each branch. The Call Centre too works on a 24 x 7 basis and is geared to provide information on all products and services.
As a financial intermediary, the Bank does not have any banned or disrupted products on offer in its products and services portfolio.
2015 and Beyond
Over the years, we have accomplished a lot, but much more remains on our to-do list. As part of our current strategic plan, a large number of initiatives have been identified for implementation in the near future. At the same time, the Bank will devote time and commit resources for research and development to understand the changing customer needs and aspirations, particularly in the context of changing customer demographics and developments in information and communication technology. Broadly, the initiatives will relate to augmenting our products and services offering, enhancing our reach, benchmarking our service standards and streamlining internal systems and procedures, all with the final aim of providing unparalleled convenience to the customer.
In terms of product and service offerings, these initiatives, inter alia, will include new product development, product rationalisation, product enrichment and product branding. Cognisant of the growing influence of information and communication technology on day-to-day lives of customers and their changing buying patterns, the Bank will develop technology based new products and services to be made available primarily on alternative channels. Plans are afoot to create awareness and build relationships with Sri Lankans
working abroad and their families back at home that will help us build long lasting relationships. Through these new products and services and relationships, the Bank envisages enhancing its appeal as a one-stop shop for customers, thereby helping to penetrate more deeply into new market segments.
Apart from the expansion of our local delivery network further by adding branches, student savings centres and ATMs among others and offering extended banking hours, plans have been drawn up to expand globally into new markets for remittance services through the appointment of our own representatives or through agency arrangements and the like that will further enhance our reach.
Initiatives for improving our service standards include development of physical infrastructure further by better utilising the Bank’s own properties, undertaking research and development in relation to market developments and changing customer needs, upgrading skill levels of staff at branches and their service standards, implementing the proposed IT strategy to fully institutionalise the core-banking system and promote optimum utilisation of available system capabilities.
Internal systems and procedures will be further streamlined by developing branch level staff skills, deploying dedicated and competent treasury management staff, rapid roll out of the portfolio management system, offer of performance based rewards and market-based remuneration, development of the governance framework, formulation and implementation of asset management policy and improving supplies management system among other like measures.
M A N A G E M E N T D I S C U S S I O N A N D A N A L Y S I S D E L I V E R I N G V A L U E

National Savings Bank
Annual Report 2014
Page 65
Employee Capital
When our customers talk about the National Savings Bank, we hear time and again how much they like and appreciate that special ‘family feeling’ they get when they walk through the doors of one of our branches or work with one of our loan officers.
That is not the result of a marketing strategy. Instead, it is a fringe benefit of our long-time commitment to our employees and a testament to how well our employees buy into the NSB ethos. In fact, next to serving our customers, we believe that one of the most important ways we create value at the National Savings Bank is by giving thousands of Sri Lankans the opportunity to work in a safe, non-discriminatory environment that provides them with career advancement opportunities, health care and a livelihood for their families. Today, we are trying to build on this foundation of commitment to our employees by evolving it to remain contemporary and valid well into a new century. Besides serving our customers and investors better, this enhanced approach gives all our employees more incentives and opportunities to excel. In this way, we hope to continue to offer better and more relationship based service to our customers, our investors, and all those we consider to be the extended NSB family.
Employee Profile
To keep up with our growing business, we expanded our staff cadre significantly in 2014. A total of 560 new recruits joined the NSB family during the year, of whom 410 were women. Only 114 retired and 6 left to pursue other opportunities.
Over 3,400 people now work full-time for NSB, including 3,026 permanent employees and 381 contract employees. An additional 971 workers serve the Bank through an outsourced service provider.
Nearly 90% of employees are covered by a collective bargaining agreement. Trade unions operating within the Bank include the Ceylon Bank Employees’ Union, Sri Lanka Independent Bank Employees’ Union, Jathika Sevaka Sangamaya, Executive Officers’ Association and All Ceylon Bank Employees’ Union.
Depending on work exigencies, the Bank makes operational changes from time to time. Although, minimum notice period regarding such operational changes has not been specified in the collective agreement, employee representatives i.e., trade union officials have the opportunity of having discussions with management on changes.
Employees have also formed their own religious and welfare societies. In addition, there is a Sports Club and a ‘Kala Kawaya’ (Arts Circle).
Most new hires in 2014 were either at Banking Assistant - or Officer Trainee – levels. Despite all this growth, the Bank is still hierarchically a relatively flat organisation. Over half of all employees are banking assistants (51%) and most of the others serve as supervisors (25.71%), junior managers (13.74%) or as middle and upper management (4.47%).
From an investors’ point of view, one of the key initiatives of the Bank this year in relation to staff was its continued effort to further professionalise our operations. Our key hires – represented different disciplines as Risk, Finance IT and Legal.
At the same time, we continue to send senior managers abroad for additional managerial and functional training in areas such as risk, investment and operations.
NSB also appointed 11 Regional Managers to supervise the operations in each of 11 regions. They started in a new region as Regional Managers to share their expertise with staff and customers in a region other than where they have been located earlier.
D E L I V E R I N G V A L U E M A N A G E M E N T D I S C U S S I O N A N D A N A L Y S I S

National Savings Bank
Annual Report 2014
Page 66
We consciously follow a process of service rotation that ensures senior managers do not stagnate in any given posting for longer than 5 years. Given the nature of our business within the sensitive financial industry, such a measure goes a long way to mitigate unwarranted risk of fraud and malpractice.
Compensation and Benefits
In a fast-growing, low-unemployment economy such as
some of the world’s most dynamic economies, the fact that only six of 3,400 employees left the Bank during the year for reasons other than retirement suggests that NSB offers a compelling value proposition to its entire staff. Why? We believe that the
environment are the three main factors that have enabled us to attract and retain talented employees.
Compensation
Wages at the National Savings Bank are on par with the wages of other Government-owned banks. Most wages are set by collective agreements signed between the Bank and the representatives of the trade unions who represent the employees. Employees are also entitled to an annual bonus that is equal to two times gross monthly salary, plus a special bonus awarded if the Bank achieves a pre-stated target.
Benefits
Permanent employees enjoy a number of benefits from the Bank, including healthy meals for Head Office staff at a subsidised canteen and the use of holiday bungalows at a discount rate. More importantly, the benefits to employees include a comprehensive health plan, disability coverage, a pension plan and training.
Health
Employees have access to an in-house medical centre at the NSB Head Office that runs by a leading private hospital and managed by the Bank’s Welfare Division. Twice a month, the Bank arranges for specialists to visit the in-house medical centre for employee consultations. Employees at the Head Office also have access to an in-house gym to help them keep fit and a library to strengthen their minds and broaden their knowledge-base.
Welfare officers also sponsor seminars and lectures for employees on health-related topics. Conducted by professional human resource experts, past lectures have included such subjects as stress management, eye care and the prevention of cardiovascular disease.
Employees and their spouses and dependants are also entitled to reimbursement of medical expenses, including the costs of treatment rendered by a medical practitioner, hospitalisation, dental treatment (including dentures), spectacles and medicine (including ongoing prescriptions). We also offer financial support for maternity (births) and critical illnesses.
In addition to ordinary medical coverage, all permanent employees are also covered by the Bank’s Compensation Benefit Scheme, under which the Bank will compensate dependants of an employee up to a maximum of Rs. 1 Million in case of death, permanent disability or partial disability of that employee.
Women are also entitled to up to 84 days of paid maternity leave each for up to three confinements and 42 days for each subsequent baby.
M A N A G E M E N T D I S C U S S I O N A N D A N A L Y S I S D E L I V E R I N G V A L U E

National Savings Bank
Annual Report 2014
Page 67
Pensions
Employees hired before 1st October 1995 are eligible for a non-contributory pension scheme established in 1980. A total of 975 existing employees are enrolled in this scheme. Employees joining on or after 2nd October 1995, also entitle for new pension scheme which is non-contributory. However the employees have to contribute to W & OP Fund under this scheme – Benefits vest after 10 years of service. Pensions amount to 10% of salary after 10 years of service, rising to 74% of salary after 40 years of service. Employees who leave before reaching the 10-year milestone are entitled to a one-time gratuity. So far 1,998 employees have joined this pension scheme.
During the year under review, we also computerised the Pensioners Medical Assistance Scheme with a view to making it easier for pensioners to use it and monitor their medical assistance benefits.
Training
NSB invested over Rs. 20 Million in foreign and domestic training for employees during the year 2014.
The Bank’s employees have taken advantage of a variety of opportunities extended to them, including foreign training programmes, short-term programmes, seminars, and workshops, as well as long-term courses, diplomas and degrees. In 2014, virtually all employees outside the executive suite participated in training programmes.
Participants logged a total of over 25,000 hours training in-house and regionally. Eighteen employees logged in nearly 500 hours of foreign training, while nearly 300 employees at all levels of the organisation participated in short-term training programmes, seminars and workshops. More than 200 people, from banking assistants to executive-level managers, took advantage of the Bank’s offer to support their pursuit of long-term courses and degrees. Middle management was especially active in preparing themselves for new challenges.
To further encourage self-improvement, the Bank also offered honoraria to employees who excelled in banking examinations such as the Certificate in Banking and Finance and Diploma in Banking and Finance Examinations of the Institute of Bankers of Sri Lanka.
Non-Discrimination
NSB is committed to operating an inclusive, non-discriminatory workplace. No complaints about discrimination of any kind were filed in 2014, nor were any corrective actions needed. The Bank does not consider gender when it grants promotions, assigns responsibilities or sets salaries and other financial and non-financial benefits.
Few Grievances
Finally, we are proud of the fact that although more than 4,000 people now work for NSB, there were no cases of grievances reported during the year on such grounds as discrimination or any other form of human rights violations. As of 31st December 2014, there were eight Labour Tribunal actions filed by ex-employees and pending against the Bank. All these were seeking reinstatement following dismissal on fraud charges.
As a policy, the Bank does not recruit anyone below the age of 18 for employment in the Bank and as such, there is no possibility for incidence of child labour in the Bank.
Given the work ethic and operational framework at the Bank, there is no occasion for forced or compulsory labour to occur.
The Bank allows maternity leave for its employees and is proud to note that our ‘return to work ratio’ after maternity leave is 100%.
D E L I V E R I N G V A L U E M A N A G E M E N T D I S C U S S I O N A N D A N A L Y S I S

National Savings Bank
Annual Report 2014
Page 68
Celebrating the Family
NSB endeavours at all times to support the success of its employees’ families. An annual Achievers Day is held that includes a presentation of awards for children of employees with the best results in the Grade 5 Scholarship Examination, Ordinary Level and Advanced Level Examinations and outstanding performance in sports and other extracurricular activities. Outstanding children receive prizes in cash or kind. We sponsor special events too for our families, including an Avurudu Pola conducted twice a year, New Year celebratory ceremonies, Vesak Bhakthi Gee and a Christmas programme of Carol singing.
Long-time employees were also recognised in 2014, as they are every year. Annual ceremonies are held for employees who have reached 25- and 35-year service milestones. They are recongnised with Gold coins and a salary raise as a reward for their loyal service.
A transportation allowance is paid to employees at the time of their marriage and gratuities to their dependants in the event of their death.
Future Plans
As with so many aspects of the Bank operations, our HR policies and systems are another area in which we are working to raise our systems to an international standard. These initiatives are expected to further strengthen recruitment, effective deployment, development and retention of best talent. In this regard, the Bank will appoint a Committee to review all existing HR policies and procedures, leading to implementation of a computerised HRD system/HIMS to improve efficiency and effectiveness of the overall human resource function.
These efforts to modernise our talent base are ongoing, of course, particularly as we hope to achieve it without sweeping away the special homey warmth that is such an important part of NSB’s personality. We firmly believe that the traditional warm ways of Sri Lankan hospitality that we have always offered our customers can co-exist in absolute harmony with 21st Century customer service protocols – and that is the optimal balance we seek in our efforts to modernise.
Plans have been drawn up to develop a qualifications based annual recruitment system and a purpose driven transfer scheme and succession plan to empower and enhance performance at all workplaces. The present HR outsourcing policy will also be reviewed with a focus on the future of outsourced employees presently working at the Bank.
We hope to introduce formal performance-based appraisals and promotions for Grade I Officers and above, along with an enhanced incentive scheme. We would like to improve our training programmes too, with a special focus on skill development and on the building of a more consistent corporate culture.
Several initiatives have also been planned for further shaping and enhancing our desired corporate identity and culture. This initiative will look at behavioural traits including – dress code, etiquettes, use of mobile phones, customer care, ethics and NSB’s enshrined qualities in action.
M A N A G E M E N T D I S C U S S I O N A N D A N A L Y S I S D E L I V E R I N G V A L U E
National Savings Bank
Annual Report 2014
Page 69
Social and Environmental Capital
Over the past decade or so, the international business community has turned away from the idea that the success of a business should be measured solely by changes in shareholder value. Many companies are trying to look more holistically at the impact they have on all their stakeholders.
In this regard, NSB may be considered far ahead of the pack, given that as an institution we have been focused entirely on serving the public good for over a century and a half. However, in order to better clarify the value we bring to Sri Lankan society, we have changed how we report on our non-financial impacts.
Environmental Capital
Given that we are not a manufacturing business, our environmental impact is limited. To reduce our carbon footprint further, however, we now use CFL energy saving lamps in all our branches. New VRV-type air-conditioning systems have also been introduced in all the new branch buildings to reduce power consumption and increase the comfort of customers and staff.
In our lending, we have also made an effort to fund environmentally friendly projects such as Weras Ganga Developing Project: In order to minimise the associated risk in agricultural loans the Bank adopted the following strategies:
1. The Bank evaluates the credit worthiness of the customers.
2. The Bank obtains collateral for granted loans.
3. The Bank diversified its credit portfolio to manage the concentration on agricultural loans.
As an institution, we are concerned about climate change, but our activities are not directly exposed to its risks in terms of its direct impact on our business. Our biggest direct exposure is through our loans and pawning advances given for agricultural purposes.
In addition, the Bank uses electricity and fuel on a day-to-day basis in its operations. Electricity is primarily used for lighting, powering and air conditioning of the Bank’s Head Office, branches, call centre, holiday bungalows and Disaster Recovery Centre. The Bank also used 24 petrol and 27 diesel vehicles during the year. These vehicles had done 329,579 km and 625,251 km respectively during the year costing Rs. 13,902,908/- for fuel.
Social Capital
Banking, in the final analysis, is an intensely social business, a way in which resources are transferred in time and space to where they can find most profitable use. As an agent for Sri Lanka’s greater good, we take pride in the impact of our core business. At the same time, however, we acknowledge that this necessary condition is not sufficient.
To act as a catalyst of Sri Lankan development, we also undertook a variety of other initiatives in 2014 that resulted in large and small gains to our country’s social capital.
Children’s Education and Social Services
One of the projects we were proud to be associated with in 2014 was the Nena Guna Thilina Presidential Book Project, to which we donated Rs. 1,000,000/- and managed a voluntary project dedicated to promoting reading for school children in remote areas of the country. Since most of these schools have no libraries, staffers donated to each school 250-300 books of educational value suitable for children up to 14 years of age. These donations enabled schools to either start a new library or supplement their existing resources.
For the sixth year, NSB conducted its island-wide Hapan Scholarship Seminars to help grade five students with Hapan savings accounts excel in their Grade 5 Government Examinations. The seminars were facilitated by Sri Lankan celebrities who helped schoolchildren develop their academic skills, personality and attitudes. During the year, we sponsored 50 such ‘Mathulowa Dinumata Nena Guna Wadamu’ Seminars.
D E L I V E R I N G V A L U E M A N A G E M E N T D I S C U S S I O N A N D A N A L Y S I S

National Savings Bank
Annual Report 2014
Page 70
We also recognised the academic achievements of students who had the greatest success in their Grade 5 Examination.
The annual island-wide seminar programme organised by Navayugaya magazine for the benefit of schoolchildren with the participation of recognised resource personnel was sponsored by the Bank.
Community Outreach
Our branch network has worked hard to preserve local community values. We have done this through our support of a variety of activities, including community circles, such as senior citizen clubs and Ayojana Kawa, which promotes saving with the NSB and obtaining credit facilities at a concessionary rate.
The Bank also engaged different communities with specially tailored products, such as the Ithuru Mithuru savings account and Diriya loans. Our operations too were tailored to local needs. For example, the working capital needs of the wood trader community in Moratuwa were met through pawning. We also tried to take full advantage of the unique ability of local postmasters and their families to promote and mobilise our corporate social responsibility programmes.
We also tried to help groups of people with special physical needs too, donating Rs. 200,000/- to sponsor the Sri Lanka National Volleyball Federation for Disabled Championship Tournament, for example.
Nor were our war veterans forgotten. In 2014, Bank donated Rs. 5,000,000/- towards Brave Hearts - Abhimansala, an effort by the Army Benevolent Fund to provide housing in luxury complexes for our disabled war heroes.
Institutional Outreach
As Sri Lanka recovers from its long years of strife, rebuilding social capital is a key aspect of NSB’s mission – not just between individuals or individuals and our institution, but by reaching out to individuals through other national institutions. We did this through several special promotions that targeted a number of important organisations and events. We sponsored different events in related organisations which organised for the welfare function of employees.
Migrant Worker Outreach
We consider Sri Lankans as our core customer wherever they happen to work. To assist those who are contemplating leaving the island for foreign employment, the Bank conducted numerous training programmes to educate them on remitting money. In 2014, Bank officers conducted 438 programmes and taught over 17,000 prospective expatriates how to remit their hard-earned wages to the Motherland safely, securely and at low cost.
We also taught the families of absent workers how to maintain good financial discipline in their homes and save money for their future needs. Bank officers conducted these programmes with the assistance of local AGA offices, focusing especially on communities where a large number of workers have gone overseas in the Kurunegala, Kandy, Kegalle and Ratnapura Districts.
Infrastructure
The Bank in the course of its business does not merely concentrate on making profits, but focus on the long-term development of the entire country. As a result, the Bank was able to shoulder several high value long-term projects where many of its peers were not in a position to support. In this regard, the much needed and important road network
M A N A G E M E N T D I S C U S S I O N A N D A N A L Y S I S D E L I V E R I N G V A L U E

National Savings Bank
Annual Report 2014
Page 71
from faraway places such as Point Pedro in Jaffna, Bibila, Mahiyanganaya in Uva, Kirinda at deep down South, Seeduwa, Udugampola from Western Province were funded by the Bank yielding benefits to the entire Nation.
Furthermore, the Bank’s sphere of activities extends beyond material benefits. NSB has extended its co-operation to preserve our mother earth by funding projects that will minimise soil erosion and inundation within Colombo District. The implementation of the Weras Ganga project was funded by NSB to protect the environment and propagate natural bird habitats and fauna of the capital of Sri Lanka to improve the living condition of its city dwellers.
Total amount committed is Rs. 14.2 Billion and released Rs. 1.6 Billion.
Medical Outreach
The Bank supported HelpAge Sri Lanka, a charity organisation that conducts mobile medical camps for medically vulnerable senior Sri Lankans. The project focuses mainly on underprivileged elders in rural areas whom HelpAge serves through such activities as giving them spectacles or arranging for cataract operations.
D E L I V E R I N G V A L U E M A N A G E M E N T D I S C U S S I O N A N D A N A L Y S I S
Religious Donations
Believing that the Bank can make a difference by helping build people with strong religious convictions, the Bank makes donations to deserving organisations for use in religious activities. These include national level initiatives on religious festivals, events at local organisations such as temples and foundations in memory of respected Sri Lankans.

National Savings Bank
Annual Report 2014
Page 72

National Savings Bank
Annual Report 2014
Page 73
Stewardship
Board of Directors – 74Corporate Management – 76Executive Management – 78
Heads of Divisions and Senior Managers – 80Corporate Governance – 83
Report of the Board Audit Committee – 109Report of the Human Resource and Remuneration Committee – 112
Integrated Risk Management Committee Report – 113Report of the Nomination Committee – 114
Risk Management – 115
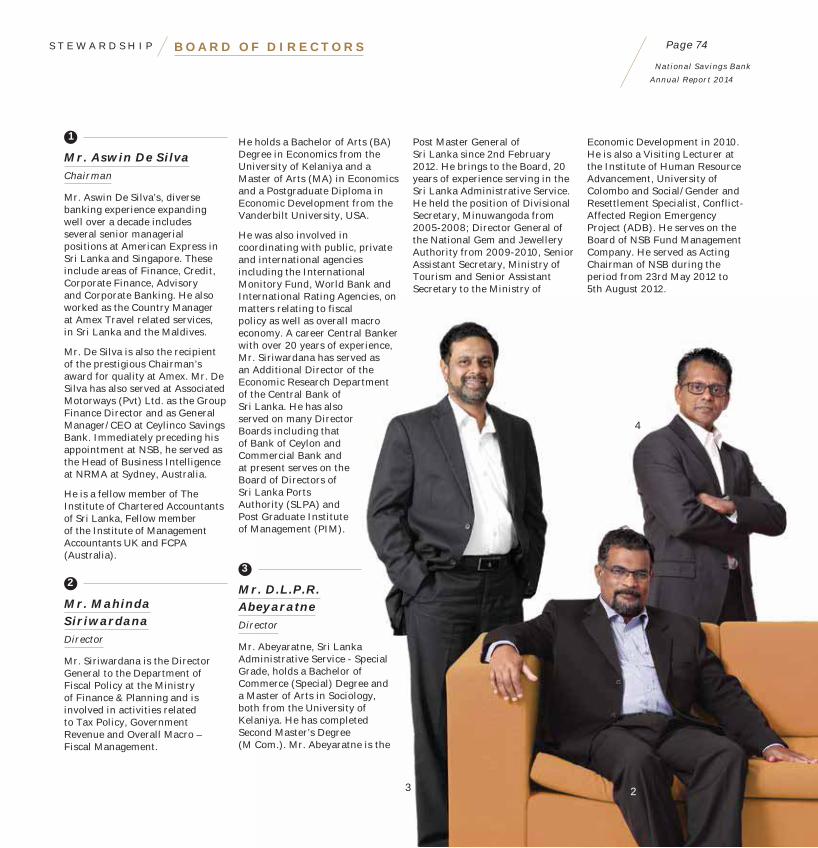
National Savings Bank
Annual Report 2014
Page 74B O A R D O F D I R E C T O R SS T E W A R D S H I P
1
Mr. Aswin De SilvaChairman
Mr. Aswin De Silva’s, diverse banking experience expanding well over a decade includes several senior managerial positions at American Express in Sri Lanka and Singapore. These include areas of Finance, Credit, Corporate Finance, Advisory and Corporate Banking. He also worked as the Country Manager at Amex Travel related services, in Sri Lanka and the Maldives.
Mr. De Silva is also the recipient of the prestigious Chairman’s award for quality at Amex. Mr. De Silva has also served at Associated Motorways (Pvt) Ltd. as the Group Finance Director and as General Manager/CEO at Ceylinco Savings Bank. Immediately preceding his appointment at NSB, he served as the Head of Business Intelligence at NRMA at Sydney, Australia.
He is a fellow member of The Institute of Chartered Accountants of Sri Lanka, Fellow member of the Institute of Management Accountants UK and FCPA (Australia).
2
Mr. Mahinda SiriwardanaDirector
Mr. Siriwardana is the Director General to the Department of Fiscal Policy at the Ministry of Finance & Planning and is involved in activities related to Tax Policy, Government Revenue and Overall Macro – Fiscal Management.
Post Master General of Sri Lanka since 2nd February 2012. He brings to the Board, 20 years of experience serving in the Sri Lanka Administrative Service. He held the position of Divisional Secretary, Minuwangoda from 2005-2008; Director General of the National Gem and Jewellery Authority from 2009-2010, Senior Assistant Secretary, Ministry of Tourism and Senior Assistant Secretary to the Ministry of
He holds a Bachelor of Arts (BA) Degree in Economics from the University of Kelaniya and a Master of Arts (MA) in Economics and a Postgraduate Diploma in Economic Development from the Vanderbilt University, USA.
He was also involved in coordinating with public, private and international agencies including the International Monitory Fund, World Bank and International Rating Agencies, on matters relating to fiscal policy as well as overall macro economy. A career Central Banker with over 20 years of experience, Mr. Siriwardana has served as an Additional Director of the Economic Research Department of the Central Bank of Sri Lanka. He has also served on many Director Boards including that of Bank of Ceylon and Commercial Bank and at present serves on the Board of Directors of Sri Lanka Ports Authority (SLPA) and Post Graduate Institute of Management (PIM).
3
Mr. D.L.P.R. AbeyaratneDirector
Mr. Abeyaratne, Sri Lanka Administrative Service - Special Grade, holds a Bachelor of Commerce (Special) Degree and a Master of Arts in Sociology, both from the University of Kelaniya. He has completed Second Master’s Degree (M Com.). Mr. Abeyaratne is the
Economic Development in 2010. He is also a Visiting Lecturer at the Institute of Human Resource Advancement, University of Colombo and Social/Gender and Resettlement Specialist, Conflict-Affected Region Emergency Project (ADB). He serves on the Board of NSB Fund Management Company. He served as Acting Chairman of NSB during the period from 23rd May 2012 to 5th August 2012.
23
4

National Savings Bank
Annual Report 2014
Page 75 S T E W A R D S H I PB O A R D O F D I R E C T O R S
4
Mr. Bradley EmersonDirector
Mr. Emerson is the Regional Director Middle East, South Asia and North Africa of CIMA.
Mr. Emerson worked with Commercial Bank as Senior Manager Operations, Nations Trust Bank as Head of Retail Banking and Pan Asia Bank as Deputy CEO.
Mr. S.D.N. Perera General Manager/CEO
Mr. S.D.N. Perera is appointed as the 16th General Manager/CEO of National Savings Bank w.e.f. 12th March 2015. Prior to his appointment, he has been serving as the Acting. General Manager/CEO and he has been serving the Bank covering all functional areas in his career for nearly three decades.
Mr. Perera is a holder of a B.Com Special Degree and a Diploma in Bank Management. He is also a Certified Information Systems Auditor (CISA) of USA. He was also the President of the Information Systems Audit and Control Association of the USA Chapter and was the founder member of the Institute of Internal Auditors of USA-Sri Lanka Chapter. He has been presenting papers at various forums on a wide range of disciplines.
Mr. Perera was also a Director of ‘Rajarata Sanwardana Bank’ and ‘Regional Development Bank’ for over 10 years.
Ms. Y.F. DeenSecretary to the Board
Yasmin Fathima Deen is an Attorney-at-Law, Registered Company Secretary and Notary Public with 30 years’ experience in the Bank as a Legal Officer and worked as the Company Secretary for NSB Fund Management Company from the time of its incorporation in 1999. Appointed as the Secretary to the Board of Directors with effect from 1st February 2013.
1
5
6
Mr. Emerson received the Achievers Award in 2004 from PIM in recognition of outstanding achievements.
He was judged as one of the seven Bank’s Notable Contributors for Commercial Bank in 1997.
He is a fellow member of the Institute of Bankers of Sri Lanka and holds an MBA from the University of Sri Jayewardenepura and an Advanced Diploma in Management Accounting from the Institute of Management Accountants -UK.
5
Mr. Suranga NaulageDirector
Mr. Naulage was appointed to the Board on 9th February 2015. He joined the Bank in 1979. He is a former Assistant Secretary on Industrial Relations to the Ministry of Finance and a former Member of National Labour Advisory Council. Mr. Naulage has served in the capacity of a Director at the National Institute of Labour Studies, Jobs Net Ltd. and on the Programme on Project Finance & Fund Management under the Ministry of Productivity.
He holds a B.Com Special Degree from the University of Kelaniya and Certificate in Banking & Finance from Institute of Bankers of Sri Lanka.
6
Mr. Ajith PathiranaDirector
Mr. Pathirana is the Secretary of the Bar Association of Sri Lanka (BASL). He had been a senior Committee Member of BASL and held Chairmanship on many committees of the BASL. Presently, he holds membership in Commonwealth Bar Association. Mr. Pathirana is an alternate counsellor of Law Asia and also member of the Council for Legal Education.
Mr. Pathirana is an Attorney-at-Law who possesses experiene of more than 25 years. He is also an Unofficial Magistrate, a Justice of the Peace and a practitioner in Criminal Law and has appeared in many prominent cases in courts throughout the County.

National Savings Bank
Annual Report 2014
Page 76C O R P O R A T E M A N A G E M E N TS T E W A R D S H I P
3
4
5
6
12

National Savings Bank
Annual Report 2014
Page 77 C O R P O R A T E M A N A G E M E N T S T E W A R D S H I P
1
S.D.N. Perera
General Manager/CEO
Bank Management
12th March 2015)
6
Ms. C.S. Jesudian
Deputy General Manager (Credit)
(IBSL)
4
K. Raveendran
Deputy General Manager (Audit)
5
R.M. Gunathilaka
Head of Risk Management
(PIM), FCIMA (UK)
3
J.K. Gamanayake
Deputy General Manager (Branch Operations and Marketing)
MBA (Colombo), FSLIM, MCIM (UK), AMIB (SL), Chartered Marketer’
2
K.B. Wijeyaratne
Deputy General Manager
FCA, SAAT, FCMA
H.M. Hennayake Bandara
General Manager/CEO
T.M.K. BandaraAdditional General Manager

National Savings Bank
Annual Report 2014
Page 78E X E C U T I V E M A N A G E M E N TS T E W A R D S H I P
1
2
3
45
11 1210
1
K.K.V.L.W. Karunatillake
(Recoveries)
HRM
2
Ms. B.P.J. Gunasekera
Administration, (ICASL)
Postgraduate
Management (IBSL), MFE (Colombo)
3
P.S. Wasanthatillake
Supporting)
(Computer Science),
Programming Techniques
4
Ms. K.P.D.M. de Silva
(Postal Banking)
5
W. Piyaratne
(Audit)
6
J.M. Seneviratne Banda
(Operations 2)
BA (Spl)
7
P.A. Abeysooriya
Computer Science
Programming Techniques (IDM)
8
Ms. S.W. Gunasekera
(Support Services)

National Savings Bank
Annual Report 2014
Page 79 E X E C U T I V E M A N A G E M E N T S T E W A R D S H I P
6 7
8
9
151413
9
J.A.A.S.L. Somaratne
Development)
in Computer Science,
Programming Techniques
10
M.P.A.W. Peiris
Management
Postgraduate Executive
(IBSL)
(SLITAD)
11
Ms. G.V.A.D.D. Silva
(Finance)
Administration)
MBA in Finance, FCA
12
E.M.M.G. Ekanayake
(Operations 1)
Administration),
in Management
13
Ms. Y.F. DeenSecretary to the Board of Directors
Attorney-at-LawRegistered Company Secretary
14
Ms. M.Y. Gunasekera
(HRD)
of Computing,
Data Processing
15
A.C. Gamage
(Credit)
Management

National Savings Bank
Annual Report 2014
Page 80H E A D S O F D I V I S I O N S A N D S E N I O R M A N A G E R SS T E W A R D S H I P
Heads of Divisions
1
S.T.S. De SilvaHead of IT
2
Ms. M.B.D. De SilvaHead of Legal
Senior Managers
Regional Managers
1
Ms. B.K.G.B.M. KarunaratneRegional Manager (Central)
2
A.L.A. HaleemRegional Manager (Eastern)
3
V.V. CraisonRegional Manager (North)
4
Ms. H.M.S.L. FernandoRegional Manager (North – Western)
5
T.M.D.G.D. de AlwisRegional Manager (Southern)
6
M.T.A.J.F. GomisRegional Manager (Uva)
7
Ms. M.S.S. FernandoRegional Manager (Western 1)
8
Ms. E.D. SeethaRegional Manager (Western 2)
9
Ms. H.R. SilvaRegional Manager (Western 3)
Branch Operations
1
S.H.M. MubarakSenior Manager – City
2
Ms. D.D. WickramasingheSenior Manager – Galle
3
R.A.N.N. WijesingheSenior Manager – Homagama
4
S.F. CaesariusSenior Manager – Jaffna
5
P.T.A. PereraSenior Manager – Kalutara
6
K.M. PiyaratneSenior Manager – Kandy
7
Ms. N.P.D.S.S. NanayakkaraSenior Manager - Kegalle
8
W.G.R. FonsekaSenior Manager – Kirulapone
9
J.A.U. GamageSenior Manager – Kurunegala
10
K.D. NimalSenior Manager – Maharagama
11
P.H. AndrahennadiSenior Manager – Matara
12
Ms. T.C. RanjanieSenior Manager – Moratuwa
13
K. KamalanathanSenior Manager – Negombo
14
Ms. H.R. KarunamuniSenior Manager – Panadura
15
Ms. W.P.U.A. de SilvaSenior Manager – Wellawatta
Asset Management
1
J.K. WijesingheSenior Manager
Audit
1
D.N.J.K. GamageSenior Manager – Audit and Vigilance

National Savings Bank
Annual Report 2014
Page 81 H E A D S O F D I V I S I O N S A N D S E N I O R M A N A G E R S S T E W A R D S H I P
Branch Management
1
V. ArulananthamSenior Manager – Branch Inspection
2
M.L. DayaratneSenior Manager – Development
Credit
1
T.L.A. WijeratneSenior Manager – Recoveries
2
M.M. JayasiriSenior Manager – Credit Risk Management
3
Ms. K.G. DamayanthiSenior Manager – Credit
4
W. WijetungaSenior Manager – Credit
5
A.B.C.R. WijayapalaSenior Manager – Pawning
6
Mrs. R.C. SamarasingheSenior Manager – Credit
Finance and
Planning
1
Ms. S.A.B.M. BandaranayakeSenior Manager – Superannuation
2
Ms. M.A. GomesSenior Manager – Planning
Human Resource
Development
1
K.S. WeerasenaSenior Manager – Training
2
Ms. M.N.A. FernandoSenior Manager – Personnel
International
Banking
1
P.K.G.B. PereraSenior Manager – International Banking
IT and Support
Services
1
K.M.W.M. KarunaratneSenior Manager – Premises
2
G.M.S.P. FernandoSenior Manager – IT
3
C.W. PathiranaSenior Manager – Supplies
Legal, Risk and
Compliance
1
Ms. A.C. Edirisinghe(Retired on 1st February 2015)Senior Legal Officer
2
Ms. I.K.L. Sasi MahendrenCompliance Officer
3
Ms. R.P.A.M.P. RajanayakeSenior Manager – Risk Management
Marketing
1
H.M.G.P.J. HerathSenior Manager – Marketing
NSB Fund
Management Company
1
W.M.R.B. WeerakoonSenior Manager

National Savings Bank
Annual Report 2014
Page 82
National Savings Bank
Annual Report 2014
Page 82
A good governance system focuses on highest standard of
business ethics, well-constructed policies and procedures and
productive monitoring systems within the organisation

National Savings Bank
Annual Report 2014
Page 83
Corporate governance is a fundamental tool in the current corporate environment. It is a framework that directs, regulates and controls an entity whilst ensuring maximum value to its stakeholders. A good governance system focuses on highest standard of business ethics, well-constructed policies and procedures and productive monitoring systems within the organisation. However, the essence of corporate governance is accountability to all its stakeholders.
The corporate governance framework initiates at the apex and circulates to bottom levels of the entity to ensure that every operation is conducted conforming to best practices. Board of Directors is central to corporate governance. Therefore, foremost emphasis is placed on the role and responsibilities of the Board of Directors towards safeguarding accountability, fairness and transparency in the organisation.
Corporate governance directly impacts the performance and profitability of an organisation. Good governance promotes transparency and helps to evade mistakes, corruptions, mismanagement and misuse of resources. It helps to identify issues at the beginning and avoids potential massive disasters to the entity. Good governance increases investor confidence resulting in increase in share prices and the ability to raise capital effectively and efficiently. It also minimises the reputational risk and helps to develop a stronger brand for the entity in the market.
Governance at NSB
NSB considers corporate governance as an integral part of the Bank. The concept of good governance is integrated to business processes and is promoted across the management hierarchy. NSB family believes in core values such as integrity and fairness in discharging its duties towards all stakeholders. The staff members at NSB are committed in providing their services with highest professional standards and business ethics.
NSB performs within an integrated corporate governance framework formulated on legal and regulatory requirements, core values of the Bank, and the best practices of good governance in the banking sector. The Corporate Governance Framework at NSB is based on following principles:
Assuming responsibility and accountability in managing affairs of NSB at all levels.
Ensuring the oversight of specific responsibilities assigned to the Board through Board appointed sub-committees.
Determining the best structures of management for the Bank to achieve its business objectives.
Striking a balance between business and the true spirit of ‘National Savings’ and delegating Key Management Personnel appropriately.
Evaluating business activities and prudent risk management policies of the Bank to create a safe and sound environment.
Infusing and accommodating new ideas and maintaining cordial relationships at Board and Senior Management levels.
Having an active role in discussions with the relevant regulatory bodies on the implementation and compliance of governance regulations.
Overseeing internal control systems including internal audit, compliance and risk management functions independent of its business lines.
Adhering to all requirements of the NSB Act, Laws and Directions of Regulators.
Keeping social responsibility in mind when carrying out its core activities.
NSB being a state-owned entity is highly regulated and governed by the provisions of Acts such as Banking Act, Finance Act, Financial Transaction Act, NSB Act and other Regulations issued by the Central Bank of Sri Lanka (CBSL). The Compliance Division of the Bank is committed on ensuring that the Bank adheres to all provisions and
S T E W A R D S H I PC O R P O R A T E G O V E R N A N C E

National Savings Bank
Annual Report 2014
Page 84
guidelines thereof applicable to the Bank. The Division is duly updated of the changing compliance environment and follows up with relevant divisions/branches in the Bank to ensure that the new directions are properly communicated among relevant staff members. The Bank’s Financial Statements are duly audited by the Auditor General and tabled at the Parliament as well as published in the media within the stipulated time frame to ensure transparency and reliability. Apart from Annual Government Audit and External Compliance Audit, the Internal Audit Division also assesses the Compliance Division by conducting special reviews.
The Board of Directors is central to corporate governance at NSB. The Board sets the direction for Corporate Governance at NSB and promotes the Governance framework in the Bank. It is appointed by the Ministry of Finance and Planning and Board consists of highly qualified, experienced and eligible individuals to discharge services for the Bank. The Board is vested with general supervision, control and administration of the Bank’s operations and it also serves as
the ultimate decision-making body of the Bank. The Board consists of seven members, of which six members are Non-Executive Directors to ensure autonomy in decision-making.
The Board has also delegated some of its functions to Board Sub-Committees keeping in line with the Directions on Corporate Governance. These sub-committees namely the Board Audit Committee (BAC), Integrated Risk Management Committee (IRMC), Human Resources and Remuneration Committee (HRRC) and Nomination Committee (NC) are given the authority to make recommendations to the Board on matters under their purview. The Board Audit Committee (BAC) and Integrated Risk Management Committee assist the Board to review and make decisions on the adequacy and integrity of internal controls, review of financial information and their integrity, principal risk elements of the industry and precise risk factors and corporate governance of the Bank. The Board has also retained the critical areas of operations under its purview without delegating to the operational level as per corporate governance practices. The authority and responsibilities of the Chairperson/Chairman and the Chief Executive Officer are separate as per the CBSL Directions.
C O R P O R A T E G O V E R N A N C ES T E W A R D S H I P
The Corporate Governance Organisational Chart
Board Sub-Committees
Corporate Management
CEO
The Board
BM HRDiv
AMDiv
ITDiv
IBDiv Div
LegalDiv
PostalDiv
BAC IRMC NC HRRC
Audit Investigations Compliance Risk
BM – Branch ManagementHR – Human Resources
Crd. – CreditF&P – Finance & Planning
AM – Asset ManagementIT – Information Technology
IB – International BankingMkt. – Marketing
PO – Postal Banking

National Savings Bank
Annual Report 2014
Page 85
The Management Committees
The Management Committee structure of the Bank is given below:
Board of Directors
GM/CEO
IRMC BAC HRRC NC
ECTNIC PDC ORMC
MC ITS PCECCMKTCOPRCCCICALCO ERMC
S T E W A R D S H I PC O R P O R A T E G O V E R N A N C E
IRMC – Integrated Risk Management CommitteeBAC – Board Audit CommitteeHRRC – Human Resource and Remuneration CommitteeNC – Nomination CommitteeMC – Management Committee ALCO – Asset and Liability Management Committee
IC – Investment Committee CC – Credit Committee OPRC – Operational Performance Review CommitteeITS – IT Steering CommitteeMKTC – Marketing CommitteeERMC – Executive Risk Management Committee
ECC – Executive Compliance CommitteeTNIC – Tender and New Investment CommitteeEC – Equity CommitteePDC – Product Development CommitteeORMC – Operational Risk Management CommitteePC – Procurement Committee
The Board of Directors of NSB who oversees and assumes overall responsibilities and accountability of the Bank by setting high level strategic directions, overseeing the risk management function etc. has delegated the implementation of strategies to the CEO who exercises executive authority through the corporate management team which he heads and to which he provides leadership and direction.
The compliance framework of the Bank is guided by the Compliance Charter which was reviewed and approved by the Board in January 2013. The salient features included at the review comprised of introduction of an Executive Compliance Committee (ECC), role and responsibilities of Head of Risk, Role of Compliance Officer, redefined responsibilities of Senior Management etc.

National Savings Bank
Annual Report 2014
Page 86
The committees shown above provide effective management practices while complying with corporate governance practices. The Board Sub-Committees are headed by Board approved Chairmen (enlisted) while Board Secretary act as Secretary to all Board Sub-Committees.
Attendance of the Board Members for Board Meetings during the Year 2014
Name of Director Date of Appointment Eligible to Attend
Attended
Ms. Weragoda Arachchige Nalani Appointed on 30th May 2013 30 30
Mr. Sumanadasa Tilak Abeygunawardana - Working Director
Appointed on 30th August 2007Resigned on 7th May 2010Reappointed on 17th June 2010 Resigned on 18th May 2012 Reappointed on 6th August 2012
30 27
Mr. Disanayake Lekamwasamge Priyantha Rohana Abeyaratne
Appointed on 9th February 2012Acting Chairman from 23rd May 2012 to 5th August 2012Continuing as a Director
30 28
Mr. Naida Panikkilage Lionel Pathmabandu Fernando
Appointed on 6th August 2012 30 29
Mr. Wijesinghe Wellappili Don Sumith Wijesinghe Appointed on 6th August 2012 30 27
Mr. Hema Madiwela - Director Appointed on 29th November 2007Resigned on 7th May 2010Reappointed on 25th August 2010Resigned on 18th May 2012Reappointed on 26th April 2013
30 28
Mr. S.R. Atygalle - Director (Ex officio) Appointed on 31st January 2006 (Acting Chairman from 31st January 2009 to 7th May 2010)Reappointed on 23rd April 2013 as a Director
30 25
C O R P O R A T E G O V E R N A N C ES T E W A R D S H I P
The General Manager/CEO heads all operational committees which are operated as per charters approved by the Board of Directors. The Board Sub-Committees meet as per statutory requirements while operational committees meet as per the respective charters.
National Savings Bank
Annual Report 2014
Page 87
2015 at a Glance Presently NSB is under a new Board of Directors. Following table depicts the Board composition at present.
Name Position
Mr. Aswin De Silva ChairmanMr. Mahinda Siriwardana DirectorMr. D.L.P.R. Abeyaratne DirectorMr. Bradley Emerson DirectorMr. Suranga Naullage DirectorMr. Ajith Pathirana Director
Scope, functions and attendance during the year 2014 are given below for the Board appointed sub-committees in accordance with the Banking Act Direction No. 12 of 2007:
1. Board Audit Committee (BAC)
Scope of the Board Audit Committee (BAC)
The scope of the Board Audit Committee is principally to assist the Board of Directors in fulfilling its oversight responsibilities which are to: maintain the integrity of the Bank’s Financial Statements; review financial information of the Bank in its Annual Report, accounts and quarterly reports prepared for disclosure, and to review significant financial reporting judgments contained in them.
In reviewing the Bank’s Annual Report and accounts and quarterly reports before submission to the Board, the committee focuses their attention particularly on major judgemental areas, any changes in accounting policies and practices, significant adjustments arising from the audit, the going concern assumption and the compliance with relevant accounting standards and other legal requirements.
The Committee also assists the Board in assessing the risk management system of the Bank thus ensuring that the Bank has a comprehensive policy on risk management; and monitoring the effectiveness of the Bank’s risk management system.
It would also assess the Bank’s compliance with legal and regulatory requirements by reviewing the effectiveness of the system of monitoring compliance with laws and regulations and the results of management’s investigation and follow-up of any instances of non-compliance.
The Board Audit Committee Report is given on page 109.
2. Human Resources and Remuneration Committee (HRRC)
Scope of the HRRC
Human Resources and Remuneration Committee (HRRC) formed under the Banking Act Direction No. 12 of 2007 is responsible for determining the remuneration policy including salaries, allowances and other financial payments relating to Chief Executive Officer and Key Management Personnel of the Bank, other than the remuneration determined by the collective agreements.
Developing and reviewing HR development strategies on behalf of the Bank and maintaining a consultative role with the other Board Sub-Committees and operational committees on all human resource issues, including matters relating to all staff, are among the primary responsibilities vested in the HRRC.
The Human Resources and Remuneration Committee Report is given on page 112.
S T E W A R D S H I PC O R P O R A T E G O V E R N A N C E

National Savings Bank
Annual Report 2014
Page 88
3. Nomination Committee (NC)
Scope of the Nomination Committee
The Nomination Committee reports to the Board in respect of its activities and decisions and the Committee should comprise at least three Independent Directors as members.
The Committee sets the criteria such as qualifications, experience and key attributes required for eligibility to be considered for appointment or promotion to the post of CEO and the key management positions.
Nomination Committee is also responsible for providing general oversight of policies and processes that ensure the Bank’s compliance with appointments and nominations required by regulators in addition to monitoring, evaluating and making decisions on behalf of the Board with respect to policies and strategic matters related to nominating staff members.
The Nomination Committee Report is given on page 114.
4 . Integrated Risk Management Committee (IRMC)
Scope of the Integrated Risk Management Committee
IRMC assesses all risks, i.e., credit, market, liquidity, operational and strategic risks to the Bank through appropriate risk indicators and management information.
The Committee is responsible for ensuring that the Integrated Risk Management Framework for the Bank is implemented according to plan and assesses all aspects of risk management including the updating of business continuity plans.
The IRMC reviews the adequacy and effectiveness of all management level committees such as the Credit Committee and the Asset-Liability Committee to address specific risks and to manage those risks within quantitative and qualitative risk limits as specified by the Committee.
The Committee is to take prompt corrective action to mitigate the effects of specific risks in the case such risks are at levels beyond the prudent levels decided by the Committee on the basis of the Bank’s policies and regulatory and supervisory requirements.
IRMC ensures submission of a risk assessment report to the Board seeking the Board’s views, concurrence and/or specific directions on a regular basis.
The Committee has established a compliance function to assess the Bank’s compliance with laws, regulations, regulatory guidelines, internal controls and approved policies on all areas of business operations. A dedicated compliance officer is selected from Key Management Personnel to carry out the compliance function and report to the Committee periodically.
The Integrated Risk Management Committee Report is given on page 113.
C O R P O R A T E G O V E R N A N C ES T E W A R D S H I P

National Savings Bank
Annual Report 2014
Page 89
Board Appointed Committee Attendance
The number of meetings to be held as per statutory requirements, meetings conducted and individual attendance of committee members for the year 2014 are shown below:
Name Directorship Status Board Audit Committee
Nomination Committee
Integrated Risk Management
Committee
Human Resource Remuneration
Committee
Total minimum number of meetings to be held during the year as per statutory requirements
4 2 4 4
Total number of meetings held during the year
9 1 8 5
Ms. Weragoda Arachchige Nalani - Chairperson (from 30th May 2013)
Chairperson HRRC & NCNon-Independent Non-Executive
N/A 1 From
13th February 2014
N/A 5
Mr. S.T. Abeygunawardana (Reappointed on 6th August 2012)
Working DirectorNon-IndependentNon-Executive
N/A 1 N/A N/A
Mr. Hema Madiwela(Reappointed on 26th April 2013)
Independent Non-Executive Director
9 N/A N/A 5
Mr. S.R. Attygalle (Reappointed on 23rd April 2013)
Independent Non-Executive Director
9 1 Chairman up to
12th February 2014 From
13th February 2014
N/A 3
Mr. D.L.P.R. Abeyaratne (From 9th February 2012)
Non-Independent Non-Executive Director (Chairman IRMC)
N/A N/A 8 N/A
Mr. Lionel P. Fernando (From 6th August 2012)
Non-Independent Non-Executive Director (Chairman BAC)
9 N/A 8 N/A
Mr. Sumith Wijesinghe (From 6th August 2012)
Independent Non-Executive Director
6 From
13th February 2014
N/A Up to
12th February 2014
4 N/A
NA = Not Applicable 0 = Required to be present but not attended
The Nomination Committee was not held as per the Direction in its charter during the year 2014.
S T E W A R D S H I PC O R P O R A T E G O V E R N A N C E

National Savings Bank
Annual Report 2014
Page 90
Compliance at NSB
NSB has an effective process to ensure compliance with applicable laws and regulations pertaining to the banking industry, including Banking Act Direction No. 12 of 2007 on Corporate Governance for Licensed Specialised Banks. The Board of Directors approved the compliance policy of the Bank in 2010 when the salient features were aligned with the BASEL Principles on compliance function and also identified the need of having an Independent Internal Compliance Function. In 2012, the Bank reviewed the compliance policy and introduced new areas and updated existing areas according to the CBSL Guidelines and Directions which was implemented on 10th January 2013.
The compliance function is reported to the Integrated Risk Management Committee and to the Board. Reports are also submitted to the Audit Committee confirming compliance with the Bank’s compliance requirements. These reports are also circulated to the Board of Directors for their information.
The Bank has obtained External Auditors’ Report on Internal Control over Financial Reporting and a Report on the Bank’s compliance with the Corporate Governance Directions issued by the CBSL for the year 2013. This further improved the Bank’s corporate governance approach.
Bank’s Compliance with Direction No. 12 of 2007, Issued by the CBSL on the Subject ‘Corporate Governance for Licensed Specialised Banks in Sri Lanka’
No. 12 of 2007 Corporate Governance Report to be published in terms of Banking Act Direction and subsequent.
The Bank’s adherence to the above Direction is set out as follows:
3 (1) The Responsibilities of the Board
3 (1) (i) The Board shall strengthen the safety and soundness of the Bank, by ensuring the following:
3 (1) (i) (a) Approve and oversee the Bank’s strategic objectives and corporate values and ensure that these are communicated throughout the Bank.
Complied with.
3 (1) (i) (b) Approve the overall business strategy of the Bank, the overall risk policy and risk management procedures and mechanisms with measurable goals, for at least the next three years.
The Board approved three-year strategic plan (2014–2016) is implemented. This covers business strategy, directions and measurable goals.
Complied with.
C O R P O R A T E G O V E R N A N C ES T E W A R D S H I P

National Savings Bank
Annual Report 2014
Page 91
3 (1) (i) (c) Identify the principal risks and ensure implementation of appropriate systems to manage the risks prudently.
In addition to the prevailing policies such as IRM Policy, the policies for operations (Treasury, Investments, Outsourcing, HR, Compliance, Audit Charter, etc.). The Operational Risk Policy, Credit Policy, Related Party Transaction Policy and Internal Information Disclosure Policy, Credit Risk Policy & Market Risk & Liquidity Risk Management Policy were introduced during the year 2013 and 2014 and other risk identification measures (Stress Tests, KPI&KRI and Risk Reports etc.) were introduced to ensure identification of principal risks and risks at operational levels. Further the ICAAP document was submitted to CBSL.
Complied with.
3 (1) (i) (d) Approve implementation of a policy of communication with all stakeholders, including depositors, borrowers, creditors, shareholders.
Complied with.
3 (1) (i) (e) Review the adequacy and the integrity of the Bank’s internal control systems and management information systems.
Complied with.
3 (1) (i) (f) Identify and designate Key Management Personnel, as defined in the International Accounting Standards.
Complied with.
3 (1) (i) (g) Define the areas of authority and key responsibilities for Directors themselves and for Key Management Personnel (KMP).
Complied with.
3 (1) (i) (h) Ensure that there is appropriate oversight of the affairs of the Bank by Key Management Personnel (KMP) that is consistent with Board policy.
Complied with.
3 (1) (i) (i) Periodically assess the effectiveness of the Board of Directors’ own governance practices, including: the selection, nomination and election of Directors and Key Management Personnel; the management of conflicts of interests; and the determination of weaknesses and implementation of changes, where necessary.
The Bank is wholly-owned by the Government of Sri Lanka and the Directors are appointed by the Minister in charge of Finance and Planning. Quarterly declarations in respect of related parties and their interests are obtained from Directors to monitor conflict, if any. This process has now been extended to KMPs through Related Party Transaction Policy. The implementation is in progress.
Complied with.
S T E W A R D S H I PC O R P O R A T E G O V E R N A N C E

National Savings Bank
Annual Report 2014
Page 92
3 (1) (i) (j) Ensure that the Bank has an appropriate succession plan for Key Management Personnel.
Succession Plan for Key Management Personnel was submitted to the Nomination Committee and the Committee decided to submit the Plan for Board approval.
3 (1) (i) (k) Meet regularly, on a need basis, with the Key Management Personnel to review policies, establish communication lines and monitor progress towards corporate objectives.
Complied with.
3 (1) (i) (l) Understand the regulatory environment and ensure that the Bank maintains an effective relationship with regulators.
Complied with.
3 (1) (i) (m) Exercise due diligence in the hiring and oversight of External Auditors.
The Auditor General is the External Auditor to the Bank.
Complied with.
3 (1) (ii) The Board shall appoint the Chairman and the Chief Executive Officer and define and approve the functions and responsibilities of the Chairman and the Chief Executive Officer in line with Direction 3 (5) of these Directions.
Under the provisions of Section 11 (1) of the NSB Act No. 30 of 1971 as amended by Act No. 28 of 1995, the Chairman is appointed by the Minister of Finance.
Chairman’s and CEO’s functions and responsibilities have been defined and approved by the Board.
Complied with.
3 (1) (iii) The Board shall meet regularly and Board meetings shall be held at least twelve times a year at approximately monthly intervals. Such regular Board meetings shall normally involve active participation in person of a majority of Directors entitled to be present. Obtaining the Board’s consent through the circulation of written resolutions/papers shall be avoided as far as possible.
The Board has held 30 meetings during the year on the following basis.
Complied with.
3 (1) (iv) The Board shall ensure that arrangements are in place to enable all Directors to include matters and proposals in the agenda for regular Board meetings where such matters and proposals relate to the promotion of business and the management of risks of the Bank.
Complied with.
C O R P O R A T E G O V E R N A N C ES T E W A R D S H I P

National Savings Bank
Annual Report 2014
Page 93
3 (1) (v) The Board procedures shall ensure that Notice of at least 7 days is given of a regular Board meeting to provide all Directors an opportunity to attend. For all other Board meetings, reasonable Notice may be given.
Complied with.
3 (1) (vi) The Board procedures shall ensure that a Director, who has not attended at least two-thirds of the meetings in the period of 12 months immediately preceding or has not attended the immediately preceding three consecutive meetings held, shall cease to be a Director.
No such instance within the specific period.
Complied with.
3 (1) (vii) The Board shall appoint a Company Secretary who satisfies the provisions of Section 43 of the Banking Act No. 30 of 1988.
Complied with.
3 (1) (viii) All Directors shall have access to advice and services of the Company Secretary with a view to ensuring that Board procedures and all applicable rules and regulations are followed.
Complied with.
3 (1) (ix) The Company Secretary shall maintain the minutes of Board meetings and such minutes shall be open for inspection at any reasonable time, on reasonable notice by any Director.
Directors could inspect minutes on reasonable notice.
Complied with.
3 (1) (x) Minutes of Board meetings shall be recorded in
the minutes, as to whether the Board acted with due care and prudence in performing its duties.
The minutes shall also serve as a reference for regulatory and supervisory authorities to assess the depth of deliberations at the Board meetings.
Complied with.
3 (1) (xi) There shall be a procedure agreed by the Board to enable Directors, upon reasonable request, to seek independent professional advice in appropriate circumstances, at the Bank’s expense.
The Board shall resolve to provide separate independent professional advice to Directors to assist the relevant Director or Directors to discharge his/her/their duties to the Bank.
On the request of the Directors such services are being provided. However, during the year 2014 such requirement did not arise.
Complied with.
S T E W A R D S H I PC O R P O R A T E G O V E R N A N C E

National Savings Bank
Annual Report 2014
Page 94
3 (1) (xii) Directors shall avoid conflicts of interests, or the appearance of conflicts of interest, in their activities with, and commitments to, other organisations or related parties.
Complied with.
3 (1) (xiii) The Board shall have a formal schedule of matters specifically reserved to it for decision to ensure that the direction and control of the Bank is firmly under its authority.
Complied with.
3 (1) (xiv) The Board shall, if it considers that the Bank is, or is likely to be, unable to meet its obligations or is about to become insolvent or is about to suspend payments due to depositors and other creditors, forthwith inform the Director of Bank Supervision of CBSL of the situation of the Bank prior to taking any decision or action.
No such situation has arisen during the year.
Complied with.
3 (1) (xv) The Board shall ensure that the Bank is capitalised at levels as required by the Monetary Board in terms of the capital adequacy ratio and other prudential grounds.
Complied with.
3 (1) (xvi) The Board shall publish in the Bank’s Annual Report, an annual corporate governance report setting out the compliance with Direction 3 of these Directions.
Corporate Governance Report is given on pages 83 to 108 in the Annual Report.
Complied with.
3 (1) (xvii) The Board shall adopt a scheme of self-assessment to be undertaken by each Director annually, and maintain records of such assessments.
Complied with.
3 (2) Board’s Composition
3 (2) (i) The number of Directors on the Board shall not be less than 7 and not more than 13.
Complied with.
3 (2) (ii) (a) The total period of service of a Director other than a Director who holds the position of Chief Executive Officer shall not exceed nine years.
Complied with.
3 (2) (ii) (b) A Director who has completed nine years as at 1st January 2008, or who completes such term at any time prior to 31st December 2008, may continue for a further maximum period of 3 years commencing 1st January 2009.
Not applicable.
C O R P O R A T E G O V E R N A N C ES T E W A R D S H I P

National Savings Bank
Annual Report 2014
Page 95
3 (2) (iii) An employee of a bank may be appointed, elected or nominated as a Director of the Bank (hereinafter referred to as an ‘Executive Director’) provided that the number of Executive Directors shall not exceed one-third of the number of Directors of the Board. In such an event, one of the Executive Directors shall be the Chief Executive Officer of the Bank.
As per the NSB Act, the Minister selects five out of seven Directors. The other two Directors according to the NSB Act are Treasury Secretary or his Nominee and Postmaster General or his Nominee. Therefore, no such situation arises.
Complied with.
3 (2) (iv) The Board shall have at least three Independent Non-Executive Directors or one-third of the total number of Directors, whichever is higher.
Directors are appointed by the Minister in terms of the NSB Act. Out of seven Directors, three are Independent and six are Non-Executive. Please refer to Directors details on pages 74 and 75 of Annual Report of Board of Directors.
Complied with.
3 (2) (v) In the event an alternate Director is appointed to represent an Independent Director, the person so appointed shall also meet the criteria that apply to the Independent Director.
The NSB Act does not refer provisions to appoint alternate Directors.
Complied with.
3 (2) (vi) Non-Executive Directors shall be persons with credible track records and/or have necessary skills and experience to bring an independent judgment to bear on issues of strategy, performance and resources.
All Directors appointed by the Minister are from various disciplines such as Accountancy, Law, Marketing and Business Administration and professionals with necessary experiences.
Complied with.
3 (2) (vii) A meeting of the Board shall not be duly constituted, although the number of Directors required to constitute the quorum at such meeting is present, unless more than one-half of the number of Directors present at such meeting are Non-Executive Directors.
As per the NSB Act the quorum of the Board is 4 which is more than one-half of the Directors who are Non-Executive Directors.
Complied with.
3 (2) (viii) The Independent Non-Executive Directors shall be expressly identified as such in all corporate communications that disclose the names of Directors of the Bank.
Please refer page 157.
3 (2) (ix) There shall be a formal, considered and transparent procedure for the appointment of new Directors to the Board. There shall also be procedures in place for the orderly succession of appointments to the Board.
Appointments of Directors are done by the Minister of Finance as per the NSB Act. No provision in the NSB Act to appoint and fill casual vacancies in the Board.
Complied with.
S T E W A R D S H I PC O R P O R A T E G O V E R N A N C E

National Savings Bank
Annual Report 2014
Page 96
3 (2) (x) All Directors appointed to fill a casual vacancy shall be subject to election by shareholders at the First General Meeting after their appointment.
Not Applicable.
Appointments of Directors are done by the Minister of Finance as per the NSB Act.
3 (2) (xi) If a Director resigns or is removed from office, the Board shall: announce the Director’s resignation or removal and the reasons for such removal or resignation; and issue a statement confirming whether or not there are any matters that need to be brought to the attention of shareholders.
Not Applicable.
Appointment and removal of Directors are done by the Minister of Finance as per the NSB Act.
3 (2) (xii) A Director or an employee of a bank shall not be appointed, elected or nominated as a Director of another bank except where such bank is a subsidiary company or an associate company of the first mentioned bank.
Senior Deputy General Manager, an employee of the Bank was a Director of RDB (Regional Development Bank) representing the shareholding of the NSB.
Complied with.
3 (3) Criteria to Assess the Fitness and Propriety of Directors
3 (3) (i) a & b
The age of a person who serves as a Director shall not exceed 70 years.
Complied with.
3 (3) (ii) A person shall not hold office as a Director of more than 20 companies/entities/institutions inclusive of subsidiaries or associate companies of the Bank.
Complied with.
3 (4) Management Functions Delegated by the Board
3 (4) (i) The Directors shall carefully study and clearly understand the delegation arrangements in place.
Complied with.
3 (4) (ii) The Board shall not delegate any matters to a Board Committee, Chief Executive Officer, Executive Directors or Key Management Personnel, to an extent that such delegation would significantly hinder or reduce the ability of the Board as a whole to discharge its functions.
The Board has not delegated such authority which hinders or reduces the ability of the Board as a whole to discharge its functions.
Complied with.
3 (4) (iii) The Board shall review the delegation processes in place on a periodic basis to ensure that they remain relevant to the needs of the Bank.
Delegation arrangements currently in place and reviewed by the Board on a need basis/on requests made by the management.
C O R P O R A T E G O V E R N A N C ES T E W A R D S H I P

National Savings Bank
Annual Report 2014
Page 97
3 (5) The Chairman and Chief Executive Officer
3 (5) (i) The roles of Chairman and Chief Executive Officer shall be separated and shall not be performed by the same individual.
The roles of Chairperson/Chairman and the CEO are performed by two separate individuals.
Complied with.
3 (5) (ii) The Chairman shall be a Non-Executive Director and preferably an Independent Director as well.
Chairperson/Chairman is a Non-Executive Director. Chairperson/Chairman is not independent since Chairperson is in the Board of the NSB Fund Management Ltd., a fully-owned subsidiary of NSB.
Complied with.
3 (5) (iii) The Board shall disclose in its Corporate Governance Report, the identity of the Chairman and the Chief Executive Officer and the nature of any relationship.
Profile of the Board and General Manager/CEO are available on pages 74 and 75.
Complied with.
3 (5) (iv) The Chairman shall provide leadership to the Board; ensure that the Board works effectively and discharges its responsibilities; and ensure that all key and appropriate issues are discussed by the Board in a timely manner.
Complied with.
3 (5) (v) The Chairman shall be primarily responsible for drawing up and approving the agenda for each Board meeting.
The Secretary to the Board, under the guidance of Chairperson/Chairman draws-up the agenda and the papers are submitted by the management through the General Manager/CEO.
Complied with.
3 (5) (vi) The Chairman shall ensure that all Directors are properly briefed on issues arising at Board meetings and also ensure that Directors receive adequate information in a timely manner.
Complied with.
3 (5) (vii) The Chairman shall encourage all Directors to make a full and active contribution to the Board’s affairs and take the lead to ensure that the Board acts in the best interests of the Bank.
Evaluation of the role of the Chairperson and the overall assessment of the Board’s performance are incorporated in the Director’s Self-Evaluation Process.
Complied with.
3 (5) (viii) The Chairman shall facilitate the effective contribution of Non-Executive Directors in particular and ensure constructive relations between Executive and Non-Executive Directors.
Not relevant since there is no Executive Director.
Complied with.
S T E W A R D S H I PC O R P O R A T E G O V E R N A N C E

National Savings Bank
Annual Report 2014
Page 98
3 (5) (ix) The Chairman shall not engage in activities involving direct supervision of Key Management Personnel or any other executive duties whatsoever.
Complied with.
3 (5) (x) The Chairman shall ensure that appropriate steps are taken to maintain effective communication with shareholders and that the views of shareholders are communicated to the Board.
The shareholder (Treasury) is represented in the Board by the Treasury Representative.
Complied with.
3 (5) (xi) The Chief Executive Officer shall function as the apex executive-in-charge of the day-to-day management of the Bank’s operations and business.
Complied with.
3 (6) Board Appointed Committees
3 (6) (i) Each bank shall have at least four Board Committees as set out in Directions 3 (6) (ii), 3 (6) (iii), 3 (6) (iv) and 3 (6) (v) of these Directions. Each committee shall report directly to the Board. All committees shall appoint a Secretary.
All four committees are in place. Board Secretary acts as Secretary to all four committees. Board Audit Committee, Integrated Risk Management Committee, Human Resources and Remuneration Committee and Nomination Committee directly submit reports to the Board.
Complied with.
3 (6) (ii) The following rules shall apply in relation to the Audit Committee:
(a) The Chairman of the Committee shall be an Independent Non-Executive Director who possesses qualifications and experience in accountancy and/or audit.
Board Audit Committee Chairman is Non-Executive but Non-Independent due to his appointment as a Director of the NSB Fund Management Company Ltd. (this appointment is authorised by CBSL) a fully-owned subsidiary of the Bank. The Chairman for the BAC for 2014, is a Fellow Member of The Institute of Chartered Accountants of Sri Lanka, who has experience in the banking sector.
Complied with.
(b) All members of the Committee shall be Non-Executive Directors.
Complied with.
C O R P O R A T E G O V E R N A N C ES T E W A R D S H I P

National Savings Bank
Annual Report 2014
Page 99
(c) The Committee shall make recommendations on matters in connection with:
(i) the appointment of the External Auditor for audit services to be provided in compliance with the relevant statutes;
By statutes the Auditor General is the External Auditor of the Bank.
(ii) the implementation of the Central Bank Guidelines issued to Auditors from time to time;
(iii) the application of the relevant accounting standards; and
(iv) the service period, audit fee and any resignation or dismissal of the Auditor; provided that the engagement of the audit partner shall not
partner is not re-engaged for the audit before the expiry of three years from the date of the completion of the previous term.
Not Applicable.
(d) The Committee shall review and monitor the External Auditor’s independence and objectivity and the effectiveness of the audit processes in accordance with applicable standards and best practices.
Since the Auditor General is the External Auditor, the independence and objectivity are maintained. Effectiveness of the audit process is discussed with the Superintendent of the Government Audit at Board Audit Committee meetings.
Complied with.
(e) The Committee shall develop and implement a policy on the engagement of an External Auditor to provide non-audit services.
Not relevant as the Auditor General is appointed as per the Constitution. No such service has been obtained during the year.
Complied with.
(f) The Committee shall, before the audit commences, discuss and finalise with the External Auditors the nature and scope of the audit.
The Auditor General has a permanent office at the Bank and the Superintendent of the Government Audit attends Board Audit Committee meetings regularly and participates in deciding the scope of the Audit.
Complied with.
(g) The Committee shall review the financial information of the Bank, in order to monitor the integrity of the Financial Statements of the Bank, its Annual Report, accounts and quarterly reports prepared for disclosure and the significant financial reporting judgments contained therein.
Complied with.
S T E W A R D S H I PC O R P O R A T E G O V E R N A N C E

National Savings Bank
Annual Report 2014
Page 100
(h) The Committee shall discuss issues, problems and reservations arising from the interim and final audits, and any matters the Auditor may wish to discuss including those matters.
The Auditor General has a permanent office at the Bank and the Superintendent of the Government Audit attends all Board Audit Committee meetings by invitation.
Complied with.
(i) The Committee shall review the External Auditor’s Management Letter and the managements response thereto.
Reviewed the Auditor General’s Report issued under the Section 13 (7) (a) during the year and the management response thereon.
Complied with.
(j) The Committee shall take the following steps with regard to the internal audit function of the Bank:
i. Review the adequacy of the scope, functions and resources of the Internal Audit Department and satisfy itself that the department has the necessary authority to carry out its work;
The Committee has reviewed the scope and functions under Audit Plan. Please refer Committee Report.
Complied with.
ii. Review the internal audit programme and results of the internal audit process and, where necessary, ensure that appropriate actions are taken on the recommendations of the Internal Audit Department;
The Committee has reviewed audit programme and results and actions on recommendations. Please refer Committee Report on page 109.
Complied with.
iii. Review any appraisal or assessment of the performance of the Head and Senior Staff members of the Internal Audit Department;
The performance appraisal of Head of Audit (DGM Audit) for the year 2014 had been carried out in 1st quarter of 2015. Performance of the Senior Staff members of Audit Division is assessed by the Head of Internal Audit and reported to the BAC for review.
Complied with.
iv. Recommend any appointment or termination of the Head, Senior Staff members and outsourced service providers to the internal audit function;
A comprehensive System Audit is being carried out by a firm of Chartered Accountants during the year under review.
Complied with.
v. Ensure that the committee is appraised of resignations of senior staff members of the Internal Audit Department;
No such situation has arisen during the year.
Complied with.
C O R P O R A T E G O V E R N A N C ES T E W A R D S H I P

National Savings Bank
Annual Report 2014
Page 101
vi. Ensure that the Internal Audit function is independent of the activities it audits and that it is performed with impartiality, proficiency and due professional care.
During the year, the internal audit function independently perform impartial proficient and due professional care.
Head of Internal Audit is a Fellow Member of ICASL and the staff is well-experienced and conversant with banking operations. Head of Internal Audit reports to the BAC directly.
Complied with.
(k) The Committee shall consider the major findings of internal investigations and management’s responses thereto.
Committee has reviewed major findings and management responses thereto. Please refer Committee Report on pages 109 to 111.
Complied with.
(l) The Chief Finance Officer, the Chief Internal Auditor and a representative of the External Auditors may normally attend meetings.
Complied with.
(m) The Committee shall have:
i. Explicit authority to investigate into any matter within its terms of reference;
As per the BAC Charter the Committee has been empowered to investigate any matter, access to information, authority to obtain professional advice, resources to carry out its functions etc.
Refer Committee Report on page 109.
ii. The resources which it need to do so;
iii. Full access to information; and
iv. Authority to obtain external professional advice and to invite outsiders with relevant experience to attend, if necessary.
Complied with.
(n) The Committee shall meet regularly, with due notice of issues to be discussed and shall record its conclusions in discharging its duties and responsibilities.
Committee has met 9 times during the year and decisions are recorded.
Complied with.
(o) The Board shall disclose in an informative way:
i. details of the activities of the Audit Committee;
Scope of Board Audit Committee is given on page 87.
ii. the number of Audit Committee meetings held in the year; and
Number of meetings held during the year was 9.
iii. details of attendance of each individual Director at such meetings.
Details of attendance of Directors are given on page 86.
Complied with.
S T E W A R D S H I PC O R P O R A T E G O V E R N A N C E

National Savings Bank
Annual Report 2014
Page 102
(p) The Secretary of the Committee shall record and keep detailed minutes of the committee meetings
The Board Secretary acts as Secretary and detailed minutes are maintained.
Complied with.
(q) The Committee shall review arrangements by which employees of the Bank may, in confidence, raise concerns about possible improprieties in financial reporting, internal control or other matters. Accordingly, the Committee shall ensure that proper arrangements are in place for the fair and independent investigation of such matters and for appropriate follow-up action and to act as the key representative body for overseeing the Bank’s relations with the External Auditor.
The existing Whistle-Blower Policy is being reviewed by DGM Audit and is expected to submit the same to BAC.
A process is in place for investigation/deals with improprieties in financial reporting/frauds by Internal Audit which reports to Human Resources Division (HRD) for disciplinary actions and finally reports to BAC.
Complied with.
3 (6) (iii) The following rules shall apply in relation to the Human Resources and Remuneration Committee:
(a) The Committee shall determine the remuneration policy (salaries, allowances and other financial payments) relating to Directors, Chief Executive Officer (CEO) and Key Management Personnel of the Bank.
Remuneration of the Directors is decided by the Ministry.
Remuneration of the CEO and KMPs are decided by the collective agreement.
(b) The Committee shall set goals and targets for the Directors, CEO and the Key Management Personnel.
The goals for Directors are not documented as they are appointed by the Minister.
Goals and targets for KMPs are documented through the Action plan for achieving targets for their respective Divisions.
Complied with.
(c) The Committee shall evaluate the performance of the CEO and Key Management Personnel against the set targets and goals periodically and determine the basis for revising remuneration, benefits and other payments of performance-based incentives.
Evaluation of performance of CEO is handled by Chairperson/Chairman while General Manager/CEO evaluates performance of KMPs.
Complied with.
(d) The CEO shall be present at all meetings of the Committee, except when matters relating to the CEO are being discussed.
Complied with.
C O R P O R A T E G O V E R N A N C ES T E W A R D S H I P

National Savings Bank
Annual Report 2014
Page 103
3 (6) (iv) The following rules shall apply in relation to the Nomination Committee:
(a) The Committee shall implement a procedure to select/appoint new Directors, CEO and Key Management Personnel.
The Directors are appointed by the Subject Minister as per the NSB Act.
Section 11 - The Minster shall nominate one of the Directors of the Board to be its Chairman.
Section 26 - The Board shall appoint a fit and proper person to be the General Manager of the Bank who shall be the Chief Executive Officer of the Bank.
Appointment of KMPs is made by the Board of Directors.
Complied with.
(b) The Committee shall consider and recommend (or not recommend) the re-election of current Directors.
Not Applicable.
(c) The Committee shall set the criteria for eligibility to be considered for appointment or promotion to the post of CEO and the key management positions.
The criteria eligibility to be considered for CEO and KMPs are as per the approval of the Board of Directors.
Complied with.
(d) The Committee shall ensure that Directors, CEO
given in Direction 3 (3) and as set out in the statutes.
Declaration from Directors, CEO and KMPs has been submitted to Director Bank Supervision.
The declarations will be obtained through the committee in the future.
Complied with.
(e) The Committee shall consider and recommend from time to time, the requirements of additional/new expertise and the succession arrangements for retiring Directors and Key Management Personnel.
Directors are appointed by Subject Minister as mentioned previously. The general practice is that a fit and proper person among senior DGMM is considered as the successor for the post of CEO.
The Committee would get involved in the process in the future.
Complied with.
(f) The Committee shall be Chaired by an Independent Director. The CEO may be present at meetings by invitation.
Present Chairman of Nomination Committee is Non-Independent only due to the reason that he is the Chairman of NSBFMC which is a fully-owned subsidiary of the NSB.
Complied with.
S T E W A R D S H I PC O R P O R A T E G O V E R N A N C E

National Savings Bank
Annual Report 2014
Page 104
3 (6) (v) The following rules shall apply in relation to the Integrated Risk Management Committee:
(a) The Committee shall consist of at least three Non-Executive Directors, Chief Executive Officer and Key Management Personnel supervising broad risk categories.
Complied with.
(b) The Committee shall assess all risks, i.e., credit, market, liquidity, operational and strategic risks to the Bank on a monthly basis.
Risk Management Division (RMD) assesses the credit, market, operational risks and submits reports to the Committee on a quarterly basis. RMD review risk through product and Sectors, Stress Testing, Liquidity Ratios, KPI, KRI, Loss Event Data etc. and report to IRMC/Board periodically.
Complied with.
(c) The Committee shall review the adequacy and effectiveness of all management level committees.
Complied with.
(d) The Committee shall take prompt corrective action to mitigate the effects of specific risks.
The risk indicators have shown as alarming level.
Complied with.
(e) The Committee shall meet at least quarterly to assess all aspects of risk management including updated Business Continuity Plans (BCP).
The Committee had met 8 times during the year.
Complied with.
(f) The Committee shall take appropriate actions against the officers responsible for failure to identify specific risks and take prompt corrective actions as recommended by the Committee, and/or as directed by the Director of Bank Supervision.
Presently all disciplinary actions are handled by the Human Resources and Development Division. No necessities have arisen during the year.
Complied with.
(g) The Committee shall submit a Risk Assessment Report within a week of each meeting to the Board seeking the Board’s views, concurrence and/or specific directions.
The RMD submits Risk Review Reports of IRMC directly to the Board meeting held subsequently.
Complied with.
(h) The Committee shall establish a compliance function to assess the Bank’s compliance with laws, regulations, regulatory guidelines, internal controls and approved policies on all areas of business operations. A dedicated compliance officer selected from Key Management Personnel shall carry out the compliance function and report to the committee periodically.
Complied with.
C O R P O R A T E G O V E R N A N C ES T E W A R D S H I P

National Savings Bank
Annual Report 2014
Page 105
3 (7) Related Party Transactions
(7) (i) & (ii) The Board shall take necessary steps to avoid any conflicts of interest that may arise from any transaction of the Bank with any person.
Complied with.
3 (7) (iii) The Board shall ensure that the Bank does not engage in transactions with related parties as defined in Direction 3 (7) (i) above, in a manner that would grant such parties ‘more favourable treatment’ than that accorded to other constituents of the Bank carrying on the same business.
Related Party Transactions (if any) carried out with related parties in the normal course of business are disclosed in Note 39 to the Financial Statements ‘Related Party Disclosures’ on page 239.
Complied with.
3 (7) (iv) A bank shall not grant any accommodation to any of its Directors or to a close relation of such Director unless such accommodation is sanctioned at a meeting of its Board of Directors, with not less than two-thirds of the number of Directors other than the Director concerned, voting in favour of such accommodation.
Accommodations granted to the Directors are governed by the NSB Act and Section 20 of the Banking Act.
The Bank has not granted any accommodations to Directors as per the disclosures made at Board meeting.
Complied with.
3 (7) (v) (a) Where any accommodation has been granted by a bank to a person or a close relation of a person or to any concern in which the person has a substantial interest, and such person is subsequently appointed as a Director of the Bank, steps shall be taken by the Bank to obtain the necessary security as may be approved for that purpose by the Monetary Board, within one year from the date of appointment of the person as a Director.
No such instance.
Complied with.
3 (7) (vi) A bank shall not grant any accommodation or ‘more favourable treatment’ other than on the basis of a scheme applicable to the employees of such bank.
No such instance.
Complied with.
3 (7) (vii) No accommodation granted by a bank under Direction 3 (7) (v) and 3 (7) (vi) above, nor any part of such accommodation, nor any interest due thereon shall be remitted without the prior approval of the Monetary Board and any remission without such approval shall be void and of no effect.
No such instance.
Complied with.
S T E W A R D S H I PC O R P O R A T E G O V E R N A N C E

National Savings Bank
Annual Report 2014
Page 106
3 (8) Disclosures
3 (8) (i) The Board shall ensure that:
(a) Annual Audited Financial Statements and Quarterly Financial Statements are prepared and published in accordance with the formats prescribed by the supervisory and regulatory authorities and applicable accounting standards, and that;
Complied with.
(b) such statements are published in the newspapers in an abridged form, in Sinhala, Tamil and English.
Complied with.
3 (8) (ii) The Board shall ensure that the following minimum disclosures are made in the Annual Report:
(a) A statement to the effect that the Annual Audited Financial Statements have been prepared in line with applicable accounting standards and regulatory
Refer page 153 on Annual Report of the Board of Directors.
Complied with.
(b) A report by the Board on the Bank’s internal control mechanism that confirms that the financial reporting system has been designed to provide reasonable assurance regarding the reliability of financial reporting, and that the preparation of Financial Statements for external purposes has been done in accordance with relevant accounting principles and regulatory requirements.
Refer page 153 on Annual Report of the Board of Directors and Directors’ Statement on Internal Control Over Financial Reporting on page 162.
Complied with.
(c) The External Auditor’s Certification on the effectiveness of the internal control mechanism referred to in Direction 3 (8) (ii) (b) above, in respect of any statements prepared or published after 31st December 2008.
Refer Independent Assurance Report on Internal Controls on page 164.
Complied with.
(d) Details of Directors:
(i) including names, fitness and propriety, Profiles of the Directors are given on pages 74 and 75.
(ii) transactions with the Bank, and Refer Note 39 (d) to the Financial Statements on page 241.
(iii) the total of fees/remuneration paid by the Bank.
Refer Note 39 (d) to the Financial Statements on page 241.
Complied with
C O R P O R A T E G O V E R N A N C ES T E W A R D S H I P

National Savings Bank
Annual Report 2014
Page 107
(e) Total net accommodation as defined in 3 (7) (iii) granted to each category of related parties. The net accommodation granted to each category of related parties shall also be disclosed as a percentage of the Bank’s regulatory capital.
The net accommodations granted as a percentage of Bank’s regulatory capital are given in Note 39 (e) to the Financial Statements on page 241.
Complied with.
(f) The aggregate values of remuneration paid by the Bank to its Key Management Personnel and the aggregate values of the transactions of the Bank with its Key Management Personnel, set out by broad categories such as remuneration.
Details are given in Note 39 (d) to the Financial Statements on page 241.
Complied with.
(g) The External Auditor’s Certification of the compliance with these Directions in the annual corporate governance reports published after 2008
External Auditor’s Certification was obtained and set out on page 164 on Independent Assurance Report.
Complied with.
(h) A report setting out details of the compliance with -
Please refer Statement on Directors’ Responsibility for financial reporting on page 160.
(i) prudential requirements, regulations, laws;
(ii) internal controls; and
(iii) measures taken to rectify any material non-compliance.
Complied with.
(i) A statement of the regulatory and supervisory concerns on lapses in the Bank’s risk management, or non-compliance with these Directions that have been pointed out by the Director of Bank Supervision of CBSL if so directed by the Monetary Board to be disclosed to the public, together with the measures taken by the Bank to address such concerns.
Monetary Board has not directed any disclosures to be made public during the year.
3 (9) Transitional and Other General Provisions The Bank has complied with the transitional provisions.
Complied with.
S T E W A R D S H I PC O R P O R A T E G O V E R N A N C E

National Savings Bank
Annual Report 2014
Page 108
Compliance Requirement of the Corporate Governance Direction No. 12 of 2007
The Auditor General has performed procedures in accordance with the principles set out in Sri Lanka Standards on Related Services 4400 applicable to agreed upon procedures engagements issued by The Institute of Chartered Accountants of Sri Lanka, to meet the compliance requirement of the Direction No. 12 of 2007 on Corporate
C O R P O R A T E G O V E R N A N C ES T E W A R D S H I P
Governance issued by the Central Bank of Sri Lanka. His findings given in his Report dated 30th April 2015, were not materially different to the matters disclosed above and did not identify any significant inconsistencies to those reported above by the Board.
Y.F. Deen Secretary to the Board
Aswin de SilvaChairman
30th April 2015Colombo

National Savings Bank
Annual Report 2014
Page 109
The Board Audit Committee (BAC) of the Bank was constituted in accordance with the provisions of the Public Enterprises Guidelines for Good Governance. Central Bank of Sri Lanka (CBSL) under the Banking Act Direction No. 12 of 2007 on ‘Corporate Governance for Licensed Specialised Banks’ has also directed each Bank to form four Board appointed Committees including the Board Audit Committee and has stipulated the rules applicable to Board Audit Committee under Section 3 (6) (ii) of the said Direction.
R E P O R T O F T H E B O A R D A U D I T C O M M I T T E E
Meetings and Attendance
During the financial year ended 31st December 2014, nine (09) Committee meetings were held. The details of the dates of the meetings held and the attendance of the Committee members are given below:
Members of the Committee
Mr. Lionel P. Fernando Mr. S.R. Attygalle Mr. Hema Madiwela Mr. Sumith Wijesinghe
13th February 2014 –
25th February 201424th April 2014 Excused22nd May 201418th July 2014 Excused22nd September 20147th November 201413th November 2014
9th December 2014 Excused
The Committee comprises of three Non-Executive Directors of the Bank, who are all independent. The following Directors served on the Committee during the year 2014:
Mr. Lionel P. Fernando - Chairman of the Committee (13th January 2015)
Mr. S.R. Attygalle - Member (Up to 24th February 2015)Mr. Hema Madiwela - Member (Up to 27th January 2015)Mr. Sumith Wijesinghe - Member (Up to 2nd February 2015)
Following Directors were appointed to the Board Audit Committee since 12th March 2015:
Mr. Bradley Emerson - ChairmanMr. Mahinda Siriwardana - Member
S T E W A R D S H I P

National Savings Bank
Annual Report 2014
Page 110
The Secretary to the Board of Directors functioned as the Secretary to the Committee. The members of the senior management who were invited also attended the Committee meetings during the year. The Superintendent of the Government Audit attended the meetings regularly, as an observer.
Internal Audit Manual
The Internal Audit Manual of the Bank summarises the operations of the internal audit function and delineates the policies, standards and procedures which will generally govern the internal audit function.
Board Audit Committee Charter
The Committee functioned within the terms of reference stipulated in the Board Audit Committee Charter. In terms of the Charter, the scope of the Committee was to assist the Board of Directors in fulfilling its oversight responsibilities for:
(a) The integrity of the Bank’s Financial Statements;
(b) The effectiveness of the Bank’s risk management function;
(c) The performance of the Bank’s external audit function;
(d) The performance of the Bank’s internal audit function.
The Charter also stipulates the functions and responsibilities, and the authority of the Committee. The Charter Checklist was used to assist the Committee to assess its compliance to the Charter in performing Committee’s functions and discharging its responsibilities. The completed Charter Checklist was submitted to the Board of Directors for review.
Internal Audit Charter
The Internal Audit Charter is used in order to assist the internal audit to discharge its duties effectively and independently. The Charter includes the scope, functions, responsibilities, authorities, reporting procedure and independence and objectivity of the internal audit.
Activities during the Year
The Committee attended to the following activities during the year 2014:
1. Reviewed the Charter Checklist to assess the compliance to the Charter in performing Committee’s functions and discharging its responsibilities for the year 2013.
2. Discussed and completed the Self-Assessment Guide of the Board Audit Committee for 2013.
3. Reviewed the Financial Statements of the Bank for the year ended 31st December 2013, and the quarters ended, 31st March, 30th June, and 30th September 2014 before publication and recommended to submit the same to the Board of Directors.
4. Periodically reviewed the performance of the Audit and Vigilance Division as against the Audit Plan approved for the implementation in 2014.
5. Approved the Report on the Board Audit Committee activities to be included in the Annual Report for the year 2013.
6. Reviewed the performance appraisal of senior audit staff members of the Audit and Vigilance Division.
7. Reviewed the internal audit findings of the branch audits, Head Office divisional audits and the information system audits. The Committee considered the internal audit reports, the deficiencies observed therein, responses by the Heads of Divisions and branches and corrective actions taken to rectify the deficiencies observed.
8. Reviewed the Report of the Auditor General issued in terms of the Section 13 (7) (a) of the Finance Act No. 38 of 1971 on the accounts of National Savings Bank for the year ended 31st December 2012 and the management response thereon.
Division in the Central Bank of Sri Lanka Statutory Examination Report and the action taken thereon.
R E P O R T O F T H E B O A R D A U D I T C O M M I T T E ES T E W A R D S H I P

National Savings Bank
Annual Report 2014
Page 111
10. Reviewed the summary of internal investigations on the fraudulent and irregular activities and management action thereon.
11. Reviewed and discussed the findings of the information system audit carried out by the outsourced consultant.
12. Reviewed the resource requirement of the internal audit division including the manpower requirement and the staff matters of the Audit and Vigilance Division.
External Audit
By statute, the Auditor General is the External Auditor of the Bank. The Superintendent of Government Audit is invited to attend to the Committee meetings as an observer. The External Auditor was invited to discuss the findings of the External Auditor during the Committee meetings. The Committee ensured the provision of all information and documents required by the External Auditor for the purpose of audit.
R E P O R T O F T H E B O A R D A U D I T C O M M I T T E E
Reporting
The Committee directly reported to the Board of Directors about its activities along with the minutes of the meetings.
The Committee is of the view that the terms of reference of the Committee were complied within all material aspects.
Bradley EmersonChairman - Board Audit Committee/Director
26th March 2015Colombo
S T E W A R D S H I P

National Savings Bank
Annual Report 2014
Page 112
Human Resource and Remuneration Committee (HRRC) constituted in terms of the provisions of Section 3 (6) (i) and (iii) of Banking Act Direction No. 12 of 2007 issued by the Monetary Board of the CBSL under Section 76 J (1) of the Banking Act No. 30 of 1988, as amended. The Committee reports directly to the Board of Directors (Board). During the year, the Committee comprised of three Non-Executive Directors of whom one Director was Independent as set out below: Ms. W.A. Nalani NIND/NED Chairperson Until 19.01.2015Mr. S.R. Attygalle NIND/NED Member Until 24.02.2015Mr. H. Madiwela IND/NED Member Until 27.01.2015
The HRRC has been reconstituted with two Non-Executive Directors as follows with effect from 12th March 2015.
Mr. Aswin De Silva NIND/NED ChairmanMr. D.L.P.R. Abeyaratne NIND/NED Member
NIND - Non-Independent, NED - Non-Executive Director, IND - Independant
The Secretary to the Board functions as the Secretary to the Committee. General Manager/CEO presents at all meetings by invitation of the Committee except when matters relating to General Manager/CEO are discussed.
The Committee is responsible for determining the remuneration policy relating to the Key Management Personnel of the Bank other than the remunerations determined by the Collective Agreements.
The Committee reviews all significant Human Resource Policies, initiatives, salary structures and terms and conditions relating to staff at senior executive level. In this process, necessary information and recommendations are obtained from the General Manager/CEO and the Senior Management of the Bank.
R E P O R T O F T H E H U M A N R E S O U R C E A N D
R E M U N E R A T I O N C O M M I T T E E
During the financial year ended 31st December 2014, five HRRC meetings were held and the following activities were carried out:
1. Reviewed the proposal for Recruitment of Assistant Legal Officers of Grade IV and recommended the same to the Board with proposed amendments to the cadre and the designations therein.
2. Reviewed the Performance Bonus Payment criteria used in the Bank.
3. Evaluated the recruitment for the Post of Deputy General Manager of Human Resources Development and recommended to the Board of Directors with amendments.
4. Reviewed the Charter of HRRC and recommended it to the Board of Directors subject to amendments.
5. The Committee reviewed the Absorption of Sales Officers worked on contract basis to the Bank cadre.
6. Reviewed and recommended the Bank’s Cadre for 2014 and the Organisational Structure to the Board of Directors.
7. Reviewed the Promotion Schemes for Project Officer of Grades III-II, Assistant Engineer (Electrical) of Grades III-II and recommended them to the Board of Directors.
8. Reviewed the Outsourced Personnel in the Bank.
The attendance of the meetings is given on page 89 of this Annual Report. The proceedings of the Committee meetings have been regularly reported to the Board of Directors.
Aswin De SilvaChairman – Human Resources and Remuneration Committee
26th March 2015Colombo
S T E W A R D S H I P

National Savings Bank
Annual Report 2014
Page 113 I N T E G R A T E D R I S K M A N A G E M E N T
C O M M I T T E E R E P O R T
Composition of Integrated Risk Management Committee (IRMC) of the Bank
The IRMC was established by the Board of Directors (Board), in compliance with the Section 3 (6) (i) and (v) of the Direction No. 12 of 2007, issued by the Central Bank of Sri Lanka under powers vested in the Monetary Board in terms of the Banking Act No. 30 of 1988. IRMC of NSB consisted of three Non-Executive Directors, members of the Corporate Management and the Compliance Officer. The Secretary to the Board functions as the Secretary to the Committee. The details of the members are given on pages 158 of this Annual Report.
The terms of reference set out by the Board of Directors, include the following:
Advise the Board of Directors in fulfilling its responsibilities relating to risk management.
Implement the Integrated Risk Management Policy approved by the Board of Directors and periodically update the Bank wide Risk Management Framework.
Ensure that all risks; credit risk, market risk, operational risk and strategic risk faced by the Bank are identified, monitored, and adequately managed;
Work with Key Management Personnel very closely and make recommendations to the Board of Directors within the framework of the authority and responsibility assigned to the Committee.
Charter and the Responsibilities of the Risk Management Division
The Risk Management Division prepares and collates the materials necessary for the IRMC to deliberate and recommend the decisions on matters falling within its mandate for approval of Board of Directors. These papers
are circulated to members in advance. The process and the methodology through which risks were managed is explained in detail in the Risk Management Report on pages 115 to 149 of this Annual Report.
IRMC Meetings of the Year
IRMC held eight meetings on a quarterly basis during the year 2014. The attendance of members in the Committee is listed on page 89 of this Annual Report. The minutes of the meetings and risk reports were submitted to the Board of Directors regularly.
The Committee reviewed Internal Capital Adequacy Assessment Process (ICAAP) document, Introduction of Internal Information Disclosure, Related Party Transaction and Operational Risk Policies and also reviewed the Outsourcing Policy, Related Party Policies of the Bank. The risk review covers Stress Testing, Risk Appetite and Tolerance, Loss Event Data Examination, Risk Measurement Techniques etc. The Committee also extensively was involved in monitoring and controlling the findings of the statutory examination process. Further IRMC has assessed the Corporate Governance and Regulatory Framework, KYC compliance status, etc. at its meetings and was satisfied that the actions taken in respect of managing risks of Bank.
D.L.P.R. AbeyaratneChairman – Integrated Risk Management Committee
26th March 2015Colombo
S T E W A R D S H I P
National Savings Bank
Annual Report 2014
Page 114
Nomination Committee (NC) was established by the Board in compliance with the provisions of Section 3 (6) (i) of the Direction No. 12 of 2007 issued by the Monetary Board of the Central Bank under Section 76 j (i) of the Banking Act No. 30 of 1988 as amended. The Nomination Committee reports directly to the Board and it is governed by the rules given in Section 3 (6) (iv) of the above stated Directions. The Nomination Committee comprised of three Non-Executive Directors during 2014 and currently two Non-Executive Directors serve in the Committee.
Mr. Aswin De Silva NIND/NED Chairman from 12.03.2015Mr. D.L.P.R. Abeyaratne NIND/NED Member from 12.03.2015Ms. W.A. Nalani NIND/NED Chairperson Up to 19.01.2015Mr. S.R. Attygalle NIND/NED Member Up to 24.02.2015Mr. S.T. Abeygunawardena NIND/WD Member Up to 27.01.2015
NIND – Non-Independent NED – Non-Executive Director WD – Working Director
Secretary to the Board of Directors functions as the Secretary to the Committee.
The Nomination Committee is responsible for implementing a procedure to select/appoint General Manager/CEO and Key Management Personnel, setting criteria such as qualifications, experience and key attributes required for eligibility to be considered for appointment or promotions to the Post of General Manager/CEO and Key Management Positions. Further, the Committee shall ensure that the
Directors, General Manager/CEO and Key Management Personnel are fit and proper persons to hold office specified in the criteria given in Section 3 (3) of Direction under Section 76 j (i) as stated above. The Committee shall also consider and recommend from time to time the requirements of additional/new expertise and succession arrangements for retiring Key Management Personnel.
During the financial year ended 31st December 2014, one Nomination Committee meeting was held on 24th December 2014 and the Succession Plan of the Bank for the years 2015/2016 and 2017 was reviewed by the Committee who advised to amend the Succession Plan.
Aswin De SilvaChairman – Nomination Committee
26th March 2015Colombo
R E P O R T O F T H E N O M I N A T I O N C O M M I T T E ES T E W A R D S H I P

National Savings Bank
Annual Report 2014
Page 115 R I S K M A N A G E M E N T
The NSB Group consists of National Savings Bank (The Parent Company) and NSB Fund Management Company. The information presented in this Report mainly focus on ‘the Bank’ (The Parent Company) since it accounts over 99% of the total assets, liabilities, income and expenditure of the Group.
Risk management report discusses the risk management framework of the Bank and the risk factors which may cause actual future results differ from expected results. The factors discussed in this report address critical risk aspects but cannot consider as a complete set of potential risks and uncertainties.
Business Condition and Impact
NSB is the premier savings bank in the country, owned by the Government of Sri Lanka. The profitability of the Bank’s business could be adversely affected by the Government policy changes, general economic condition of the country and changes in the local/global markets.
Considering the potential sources of business risk and the competitive landscape in the financial service market, the Bank devotes substantial management and planning effort to the strategic planning process. In an event of strategic plans do not deliver the anticipated results, the Bank’s earnings and the growth will get affected.
Further, factors such as interest rates, inflation, creditworthiness, investor sentiment, volatility of equity prices, liquidity of the financial markets and events disrupting the business operation are some of the factors which affect the Bank’s earnings and business position.
Understanding the challenging financial and economic environment, the Bank has recognised the significance of risk management to maintain consistency in profitability and solvency.
Risk Management Framework and Governance Structure
Bank’s strive to inculcate a risk management culture by developing an integrated approach in risk management capable of developing a sustainable and resilient business responsive to the ever-changing business environment.
The Bank is in the process of introducing advancement essential to strengthen the risk management framework to evaluate, monitor and manage the principle risks assumed in conducting its activities. The risk management policies, procedures and systems of the Bank are established in line with the guidelines issued by the CBSL and the international best practices introduced by BASEL.
The responsibility of risk management resides at all levels within the Bank. The Bank assigns the responsibility so that risk and return decisions are taken at the most appropriate level, subject to robust and effective reviews in line with the policies and procedures of the Bank.
The risk management framework and the governance structure are based on the three lines of defence model. The Business Heads are responsible for identify and manage risk in the respective business functions, hence the internal control structure and the management controls at operational level acts as the 1st line of defence.
Integrated Risk Management function spearheaded by Head of Risk Management in Risk Management Division (RMD) and the independent compliance function undertaken by the Compliance Division headed by an Independent Compliance Officer act as the 2nd line of defence.
S T E W A R D S H I P

National Savings Bank
Annual Report 2014
Page 116
Internal Audit Division headed by the Deputy General Manager - Internal Audit acts as the 3rd line of defence, providing an independent assurance on the accuracy and integrity of the Financial Statements, IT systems, risk management mechanisms and the effectiveness and adequacy of the internal control structure of the Bank.
The risk management governance structure and key responsibilities are discussed below:
Risk Culture
Risk Management Framework
1st Line of Defence
Management Control
Operational Committee Structure
Operational Policies, Manuals and Office Instruction Circulars
Internal Control Measures
Internal Control Structure
Risk Assessment at Operational Level
Staff Training
Risk Aware Culture
2nd Line of Defence
Risk Management
Risk Management Committees
Risk Management Policies
Risk Assessment Techniques, Models, Processes and Reporting
Risk Review at Strategic Level and Operational Level
Use of Risk Mitigants and Continuous Improvement
Compliance
Compliance Committees
Compliance Policies
Continuous Compliance Reviews
Action on Compliance Findings
Action on Compliance Findings and Reporting
3rd Line of Defence
Internal Audit
Board Audit Committees
Audit Charter
Audit Manuals
Continuous Internal Audits and Reporting
Actions on Internal Audit Findings
Improvement of Internal Control Environment
R I S K M A N A G E M E N TS T E W A R D S H I P

National Savings Bank
Annual Report 2014
Page 117
Board of Directors (BOD)
Risk management governance structure of the Bank begins with the oversight of the BOD. The overall responsibility to ensure the adequacy of the risk management function within the Bank is vested with the BOD.
The BOD sets the strategic direction through risk management policy framework and procedures and monitors risk using predefined risk appetite limits.
Integrated Risk Management Committee (IRMC)
with respect to risk management and compliance. IRMC
assist the BOD in discharging its duties in risk management.
The Committee recommends corrective actions to mitigate the effects of specific risks in the case such risks are beyond the risk appetite of the Bank and regulatory and supervisory requirements. IRMC ensures submission of risk assessment reports to the BOD seeking views, concurrence and/or directions on a specific risk issues.
Composition of the Committee consists of members from the BOD and the Corporate Management members appointed by the BOD.
Board Audit Committee (BAC)
The BAC assists the BOD in fulfilling its oversight responsibility to maintain the effectiveness and adequacy of the risk management techniques, internal control structure and the integrity of the Financial Statements of the Bank. The Committee also assists the BOD in assessing the effectiveness of the risk management and compliance functions.
The Committee consists of members from the BOD. The Corporate Management members are invited for deliberations as and when need arises.
Management Committees
Following are the main management committees focus on oversight on key risks
i. Corporate Management Committee (CMC) is responsible for managing the overall affairs of the Bank with due consideration to the risk emanate from internal and external sources.
ii. Asset Liability Management Committee (ALCO) is responsible for management of the Balance Sheet and takes asset allocation and pricing decisions in risk and return perspective focusing the market risk.
iii. Investment Committee (IC) is responsible for review and implementing the Investment Policy Statement and manage the key risk in investment, corporate lending and project finance.
iv. Credit Committee (CC) is responsible for review and implementing the Retail Credit Policy and manages the retail credit risk through reviewing retail credit procedures, portfolios.
v. Executive Risk Management Committee (ERMC) is responsible for managing risk through review and implementing the risk management policies, procedures and systems on Bank-wide basis.
vi. Executive Compliance Committee (ECC) is responsible for managing the compliance risk through implementing the compliance policy and monitoring adherence to the relevant laws, regulatory requirements.
vii. IT Steering Committee (ITSC) manages operational risks driven through systems by review and implementing the IT Policy and monitoring support activities relating to developments, procurement, automations and system/network security.
S T E W A R D S H I PR I S K M A N A G E M E N T

National Savings Bank
Annual Report 2014
Page 118
viii. Performance Review Committee reviews quarterly performance of the Bank, mainly considering the financial performance, business operations (credit, branches, international and support services) to take decisions to enhance process efficiency and performance.
ix. Marketing Committee is responsible for promoting corporate image and enhancing the brand value of the Bank’s products and services.
Risk A
djust
ed P
erfo
rmance
Board
Ove
rsig
ht
BOD
IRMC BAC
General Manager/CEO Corporate Management
Business Divisions
CMC ALCO IC CC ERMC ECC ITSC PRC MKTC/PC
Internal Audit
Division
Risk Management Division
IRMC - Integrated Risk Management CommitteeBAC - Board Audit CommitteeCMC - Corporate Management Committee
ALCO - Asset Liability Management CommitteeIC - Investment CommitteeCC - Credit Committee
ERMC - Executive Risk Management CommitteeECC - Executive Compliance CommitteeITSC - IT Steering Committee
PRC - Performance Review CommitteeMKTC - Marketing CommitteePC - Procurement Committee
Figure: Risk Management Governance Structure
R I S K M A N A G E M E N TS T E W A R D S H I P
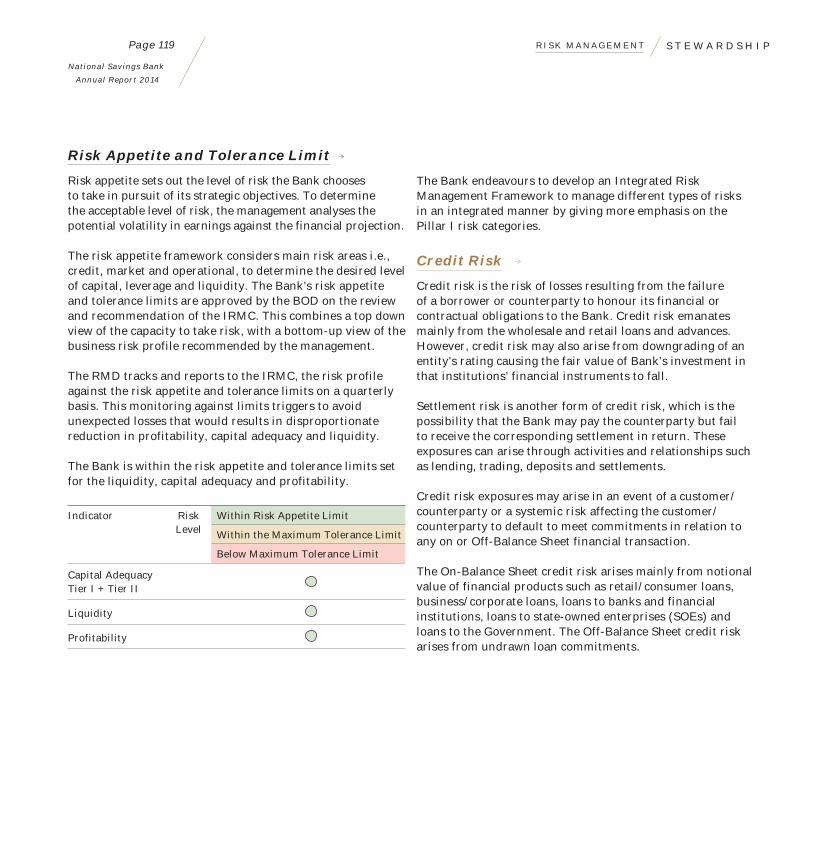
National Savings Bank
Annual Report 2014
Page 119
Risk Appetite and Tolerance Limit
Risk appetite sets out the level of risk the Bank chooses to take in pursuit of its strategic objectives. To determine the acceptable level of risk, the management analyses the potential volatility in earnings against the financial projection.
The risk appetite framework considers main risk areas i.e., credit, market and operational, to determine the desired level of capital, leverage and liquidity. The Bank’s risk appetite and tolerance limits are approved by the BOD on the review and recommendation of the IRMC. This combines a top down view of the capacity to take risk, with a bottom-up view of the business risk profile recommended by the management.
The RMD tracks and reports to the IRMC, the risk profile against the risk appetite and tolerance limits on a quarterly basis. This monitoring against limits triggers to avoid unexpected losses that would results in disproportionate reduction in profitability, capital adequacy and liquidity.
The Bank is within the risk appetite and tolerance limits set for the liquidity, capital adequacy and profitability.
Indicator Risk Level
Within Risk Appetite Limit
Within the Maximum Tolerance Limit
Below Maximum Tolerance Limit
Capital Adequacy Tier I + Tier II
Liquidity
Profitability
The Bank endeavours to develop an Integrated Risk Management Framework to manage different types of risks in an integrated manner by giving more emphasis on the Pillar I risk categories.
Credit Risk
Credit risk is the risk of losses resulting from the failure of a borrower or counterparty to honour its financial or contractual obligations to the Bank. Credit risk emanates mainly from the wholesale and retail loans and advances. However, credit risk may also arise from downgrading of an entity’s rating causing the fair value of Bank’s investment in that institutions’ financial instruments to fall.
Settlement risk is another form of credit risk, which is the possibility that the Bank may pay the counterparty but fail to receive the corresponding settlement in return. These exposures can arise through activities and relationships such as lending, trading, deposits and settlements.
Credit risk exposures may arise in an event of a customer/counterparty or a systemic risk affecting the customer/counterparty to default to meet commitments in relation to any on or Off-Balance Sheet financial transaction.
The On-Balance Sheet credit risk arises mainly from notional value of financial products such as retail/consumer loans, business/corporate loans, loans to banks and financial institutions, loans to state-owned enterprises (SOEs) and loans to the Government. The Off-Balance Sheet credit risk arises from undrawn loan commitments.
S T E W A R D S H I PR I S K M A N A G E M E N T

National Savings Bank
Annual Report 2014
Page 120
Loans and Advances
[ % ]
79%
21%
2014
On-Balance Sheet Off-Balance Sheet
71%
29%
2013
On-Balance Sheet Credit Exposure
[ % ]
2014
2%
26%
10%
3%23%
6%
9%
16%
5%
2013
4%
10%1%5%
28%
3%
12%
31%
6%
Pawning Others
Loans to GOSL Loans to SOEs Project Loans
Personnal Loans
Loans Against Deposits
Loans to Banks House and Property Loans
Magnitude of Loans and Advances of the Bank
R I S K M A N A G E M E N TS T E W A R D S H I P
National Savings Bank
Annual Report 2014
Page 121
The main composition of On-Balance Sheet credit exposure has shifted to SOEs and project loans priced at floating rates from the retail loans, particularly from pawning and house and property loans during the year 2014. This is mainly due to the Bank’s role in facilitating the Government development goals by lending to infrastructure projects and strategic approach for reducing pawning.
Credit Risk Management and Reporting Framework
Within the year under consideration, the Bank’s total loans and receivables increased by 33.8% against the previous year. This is mainly due to the strategic initiatives taken to expand lending to infrastructure projects and through diversifying the retail product portfolio under the concept of ‘Naya Pokura’. The Bank operates within well-defined criteria for new credit as well as for the expansion of existing credit within the target markets. The BOD approved Credit Risk Management Policy goes in line with the lending strategy and introduce framework of controls on credit risk taking to ensure a risk and return trade-off. The BOD approved Retail Credit Policy (RCP) governs the retail credit function and the Investment Policy Statement (IPS) governs corporate and project lending.
Limit Setting
Limit setting is an important element of credit risk management. The Bank abides by the single borrower limits stipulated by CBSL and the risk limits stated in the risk appetite document of the Bank.
Delegated authority limits structure governs the credit approval process, where the BOD delegates the appropriate levels of authority to the CC with respect to retail lending, to the IC with respect to corporate and project lending and to different levels of management.
The limits are reviewed on a periodic basis to reflect the market changes and the business environment.
Credit Administration and Recoveries
Credit Administration and Recoveries are carried out by separate units attached to the Credit Division. Credit administration is a critical element in maintaining a sound credit risk management function within the Bank. It is an essential part in managing the credit risk as well as the operational risk in credit. Credit administration is a back office function which ensures completeness of the documentation, proper approvals, after disbursement monitoring and maintenance of loan and security documents.
Recovery Unit manages all arrears loans including non-performing loans and advances (NPL). The unit monitors arrears credit and takes necessary action to reduce NPL. The Recovery Unit is also responsible for foreclosure actions and management of vested property with the assistance of the legal division.
Loan Review Mechanism (LRM)
The Bank’s BOD approved LRM established procedures for streamlining the appraisal process and to early identification of the lapses in the credit administration process and possible changes in credit quality, to facilitate pre-emptive action to safeguard the credit quality. The implementation of LRM is one of the responsibilities of the Credit Risk Management Unit of RMD.
The Policy on Valuation and Revaluation of Immovable Property (VRIP) is aligned with CBSL Directions to ensure the maximum revenue protection to the Bank in case of a borrower defaults.
The Credit Risk Management Unit at RMD monitors credit risk at portfolio level and transaction level for individually significant loans to ensure highest asset quality and adequate returns. The Bank is in the verge of procuring rating and scoring models to further strengthen the process and to comply with international best practices.
S T E W A R D S H I PR I S K M A N A G E M E N T

National Savings Bank
Annual Report 2014
Page 122
Stress Testing is used as a tool to identify the unexpected risks in credit and to assess the adequacy of capital. The unit uses risk appetite dash boards and key risk indicators to monitor credit risk against predefined risk appetite limits on a continuous basis. The findings of special risk reviews on specific risk areas are reported to CC, IC, ERMC, IRMC and the BOD on regular intervals.
Credit Risk Identification, Assessment and Mitigation
Parameters Risk Management/Mitigation
Credit Quality
IndustryThe Bank
0
[ % ]
2010 2011 2012 2013 2014
Gross NPL
2
4
6
8
10
The Bank’s NPL level was higher than the industry during the past two years. In the year 2014, the Bank’s Gross NPL ratio stood at 7.8% level.
The increase of NPL is mainly due to increase in non-performing pawning advances as a result of declining trend in the market prices of gold.
During the year under consideration, the Bank has an impairment allowance of Rs. 3.9 Billion, which is 24% from the gross non-performing loans.
R I S K M A N A G E M E N TS T E W A R D S H I P

National Savings Bank
Annual Report 2014
Page 123
Parameters Risk Management/Mitigation
PersonalHouse &Property
Project Auto Pawning
10
0
20
30
40
50
[ % ]
2010 2011 2012 2013 2014
Product-wise NPL of the Bank
Gross NPL excluding Pawning 1.62%Net NPL excluding Pawning 1.18%
The Bank has taken following actions to reduce/minimise pawning losses:
Taking aggressive recovery actions such as providing interest concessions and conducting auctions.
Follow CBSL credit guarantee scheme on pawning advances.
NPL excluding pawning is below the industry level and within the risk appetite level of the Bank.
S T E W A R D S H I PR I S K M A N A G E M E N T
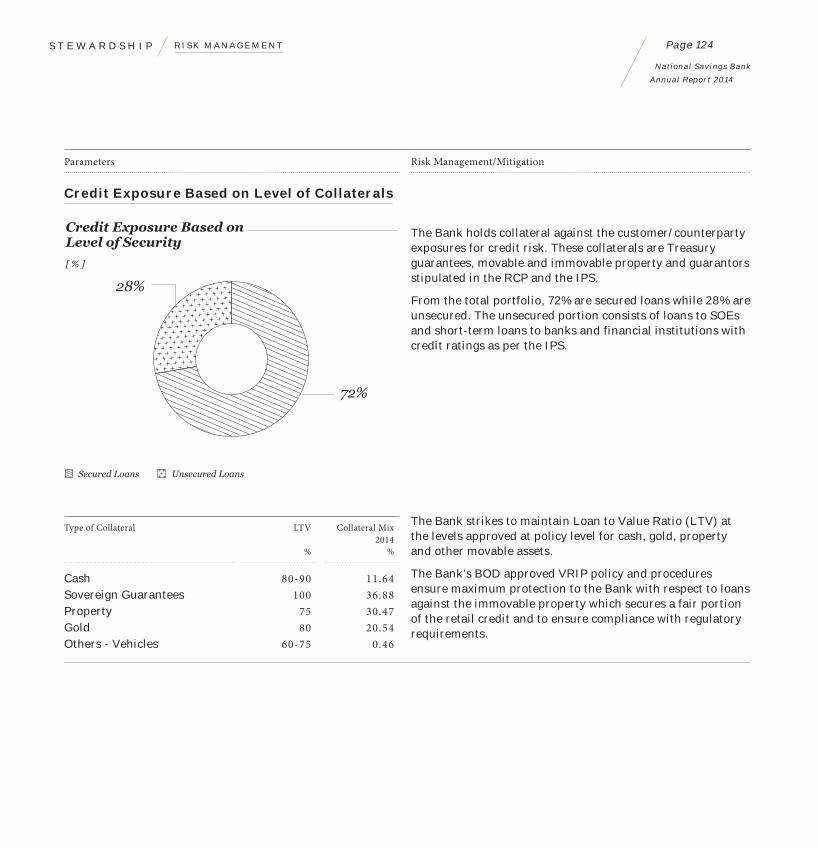
National Savings Bank
Annual Report 2014
Page 124
Parameters Risk Management/Mitigation
Credit Exposure Based on Level of Collaterals
Credit Exposure Based onLevel of Security
[ % ]
72%
28%
Secured Loans Unsecured Loans
The Bank holds collateral against the customer/counterparty exposures for credit risk. These collaterals are Treasury guarantees, movable and immovable property and guarantors stipulated in the RCP and the IPS.
From the total portfolio, 72% are secured loans while 28% are unsecured. The unsecured portion consists of loans to SOEs and short-term loans to banks and financial institutions with credit ratings as per the IPS.
Type of Collateral LTV
%
Collateral Mix 2014
%
Cash 80-90 11.64Sovereign Guarantees 100 36.88Property 75 30.47Gold 80 20.54Others - Vehicles 60-75 0.46
The Bank strikes to maintain Loan to Value Ratio (LTV) at the levels approved at policy level for cash, gold, property and other movable assets.
The Bank’s BOD approved VRIP policy and procedures ensure maximum protection to the Bank with respect to loans against the immovable property which secures a fair portion of the retail credit and to ensure compliance with regulatory requirements.
R I S K M A N A G E M E N TS T E W A R D S H I P

National Savings Bank
Annual Report 2014
Page 125
Concentration Risk
Concentration risk is a part of credit risk. It refers to the risk arise from uneven distribution of counterparties in credit or any other business relationship or from concentration in the portfolio of exposure to a business sector or a geographic region.
When number of counterparties engaged in similar activities and have similar economic characteristics can get similarly affected by the changes in economic and other conditions (systemic risk) that could adversely affect their ability to meet contractual obligations.
Concentration risk in credit portfolio may occur directly through obligors or through protection providers’ i.e., collateral. In time of stress both obligor concentration and collateral concentration may drive a Bank towards financial distress.
The Credit Risk Management Unit of RMD uses Herfindahl- Hirischman Index (HHI), Concentration Limits and Stress Testing to assess and monitor concentration risk in the credit portfolio of the Bank.
Concentration Risk Identification and Assessment and Mitigation
Parameters Risk Management/Mitigation
Name Concentration
59%28%
13%
[ % ]
Private InstitutionsGovernment InstitutionsIndividual Borrowers
Concentration of Loans byTypes of Borrowers
Name concentration arises from uneven distribution of counterparties in credit. The Bank seeks to manage its name concentration risk through the diversification to ensure that the concentration of risks with individuals or groups of customers or institutions is at an acceptable level.
59% of the loans and advances are for individual borrowers.
S T E W A R D S H I PR I S K M A N A G E M E N T

National Savings Bank
Annual Report 2014
Page 126
Parameters Risk Management/Mitigation
Concentration of Customers - Retail Portfolio
2014 2013
Value of Top 50 Customers as a % of Retail Loans and Advances 0.56 0.23Value of Top 100 Customers as a % of Retail Loans and Advances 0.88 0.37
The name concentration in retail loan portfolio is low, where the Top 100 Borrowers are below 1% of the total retail exposure demonstrating the existence of a large portfolio in which each individual loan constitutes an insignificantly small share of the total portfolio exposure.
Concentration of Customers - Total Loan Portfolio
2014 2013
Value of Top 5 Customers as a % of Total Loans and Advances 12.13 6.62Value of Top 10 Customers as a % of Total Loans and Advances 18.24 9.34
The name concentration of overall credit portfolio is at low level but has increased during the year under review as a result of high volume loans granted to SOEs and Corporates.
The Bank ensures that all lendings are within the single borrower limits stipulated by CBSL.
R I S K M A N A G E M E N TS T E W A R D S H I P

National Savings Bank
Annual Report 2014
Page 127
Parameters Risk Management/Mitigation
Sector Concentration
Industry Concentration 2014 2013
HHI 0.2171 0.2089
Sector concentration arises from uneven distribution of exposures to particular sector, industry or a region.
8%
6%
20%
29%
32%
2%2%1%
Concentration of Loansby Industry
[ % ]
Financial and Business ServicesTradersManufacturing
Other Services Other Sectors
Construction Infrastructure
Agriculture and Fishing
The Bank monitors concentration risk using Herfindahl-Hirschman Index (HHI).
Considering the present economic scenario, the Bank has an appetite to a medium concentration risk, provided the Bank can achieve reasonable margins and assert the development goals of the Government.
The Bank has a high concentration towards infrastructure sector.
S T E W A R D S H I PR I S K M A N A G E M E N T
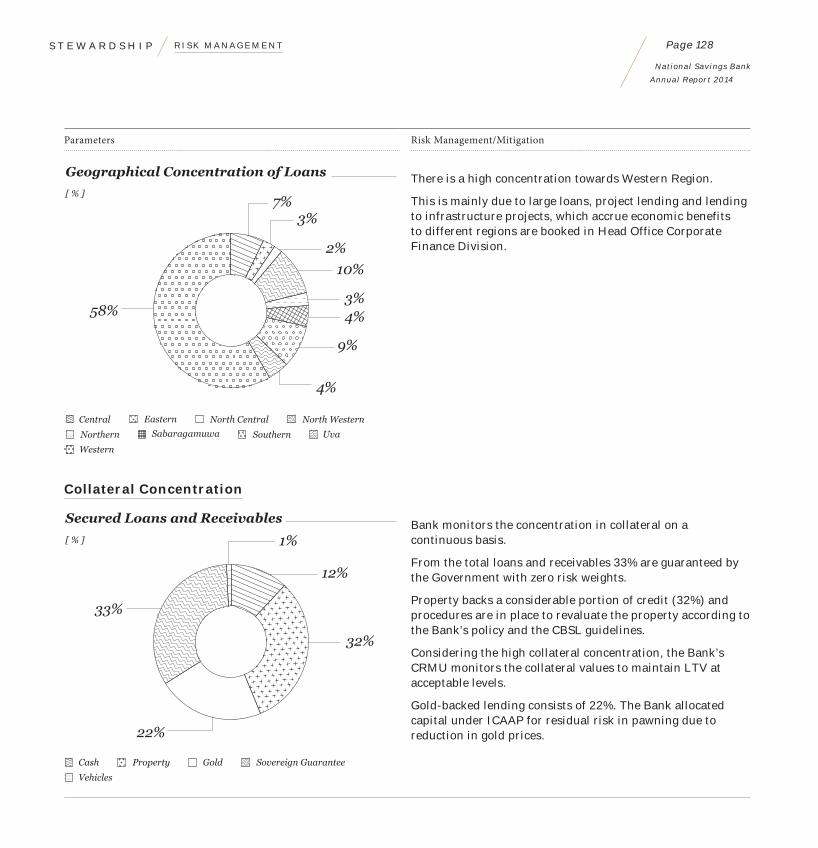
National Savings Bank
Annual Report 2014
Page 128
Parameters Risk Management/Mitigation
Geographical Concentration of Loans
[ % ]7%
3%
58%
Central Eastern North Central North Western
Northern Sabaragamuwa Southern Uva
Western
2%
10%
3%
4%
9%
4%
There is a high concentration towards Western Region.
This is mainly due to large loans, project lending and lending to infrastructure projects, which accrue economic benefits to different regions are booked in Head Office Corporate Finance Division.
Collateral Concentration
32%
12%
33%
22%
1%
Secured Loans and Receivables
[ % ]
Vehicles
Property GoldCash Sovereign Guarantee
Bank monitors the concentration in collateral on a continuous basis.
From the total loans and receivables 33% are guaranteed by the Government with zero risk weights.
Property backs a considerable portion of credit (32%) and procedures are in place to revaluate the property according to the Bank’s policy and the CBSL guidelines.
Considering the high collateral concentration, the Bank’s CRMU monitors the collateral values to maintain LTV at acceptable levels.
Gold-backed lending consists of 22%. The Bank allocated capital under ICAAP for residual risk in pawning due to reduction in gold prices.
R I S K M A N A G E M E N TS T E W A R D S H I P
National Savings Bank
Annual Report 2014
Page 129
Market Risk
Market risk refers to the risk of losses in on and Off-Balance Sheet positions arising from movements in market prices as per the Basel Committee definition. The fluctuations in interest rates, foreign currency, equity prices may cause adverse impact to the profitability and business assets.
The market variations can also cause other forms of financial risk such as credit and liquidity risks. The Bank with the objective of minimising market risk while optimising the returns from its operations have taken appropriate actions to manage market risk as per the CBSL Directions, Board approved policies and procedures and industry best practices under BASEL.
Market Risk Management and Reporting Framework
Market Risk and Liquidity Risk Management (MRLRM) Policy governs the market risk and liquidity risk initiatives in accordance with other operational policies such as Assets and Liability Management and Liquidity Management Policy, IPS, Pricing Policy etc. The MRLRM policy includes the organisational structure, the assessment and measurement methodologies and reporting of the market risk and liquidity risk of the Bank.
The Market Risk Management Unit (MRMU) of the RMD is responsible for overall market risk management and middle office functions. MRMU independently reports the market risk and liquidity risk profile to ALCO, IC, ERMC, IRMC recommending appropriate actions to mitigate/minimise adverse impact on earnings and assets.
Middle Office Function
Middle Office (MO) within the MRMU functions independently from the Treasury operations. In the absence of an online deal monitoring system, MO monitors the trading and investment in equity, debt instruments and foreign currency using the limits predefined in the IPS. The findings are directly reported to the ALCO, IC and the
Treasury Front Office through Head of Risk Management. MO submits market risk related reports daily, weekly, monthly and annually stating an independent opinion regarding the Bank’s Treasury operations. These reports are generated as per the CBSL Guidelines and the international best practices. Further, ad hoc reports are submitted to relevant authorities when required or in special circumstances.
Limit Setting and Monitoring
Risk Appetite Document of the Bank spells out the amount and type of risk the Bank is willing to accept with respect to market risk. The Bank has taken followings into consideration when deciding the risk appetite level for market risk:
The overall financial position and risk appetite level of the Bank.
The prevailing economic and market conditions and its impact towards the Bank.
The IPS stipulates the operational level limits for monitoring purposes. This includes portfolio limits, individual stock level limits, transaction limits, dealer limits and loss limits on equity, debt instruments and foreign currency operations according to the risk appetite level of the Bank. MO of the RMD monitors limits to ensure the limits approved by the Board are adhered to and exceptions are reported to Front Office of the AMD and IC.
Market Risk Identification, Assessment and Mitigation Interest Rate Risk
The BASEL Committee defines interest rate risk as the exposure of a bank’s financial condition to adverse movements in interest rates. Changes in interest rates affect Bank’s earnings by changing its net interest income and the level of other interest sensitive income and operating expenses. The changes in interest rates may also affect the underlying value of the Bank’s assets, liabilities and Off-Balance Sheet instruments.
S T E W A R D S H I PR I S K M A N A G E M E N T

National Savings Bank
Annual Report 2014
Page 130
Interest rate risk is one of the most significant aspects in the market risk since excessive interest rate risk can pose a significant threat to the earnings and the economic value of equity of the Bank, hence measured in both perspectives.
Parameters Risk Management/Mitigation
Funding and Investments
31%
24%
25%
20%
Maturity Analysis of Loans andAdvances & Investments
[ % ]
3 to 5 Years1 to 3 YearsLess than 1 Year Over 5 Years
75%
3%
3%
19%
Maturity Analysis of Funding
[ % ]
3 to 5 Years1 to 3 YearsLess than 1 Year Over 5 Years
The assets are mainly funded through deposits which is 71% of the total liabilities. This has resulted in increased funding of less than l year. However, the Bank has taken actions to manage interest rate risk by funding through long-term sources such as international bonds.
In a low interest rate scenario, RMD closely monitors funding & investment mix and the maturity analysis to identify the impact to the Bank’s NIM and to recommend risk mitigation actions.
R I S K M A N A G E M E N TS T E W A R D S H I P

National Savings Bank
Annual Report 2014
Page 131
Parameters Risk Management/Mitigation
AWDR AWFDR364 Days T Bills (Gross)
3
0
6
9
12
15
[ % ]
2010 2011 2012 2013 2014
Market Interest Rate Movements Interest rates sharply declined during the year 2014.
This improvement is mainly due to fixed-rated Loans and Treasury Bonds.
However, in an interest rate increasing scenario, re-pricing of deposits will adversely impact the Bank.
RMD monitors interest rate trends and conducts stress tests to identify the impact and to take proactive measures.
Rate Sensitive Gap Analysis
Description Up to 3 Months
3-12 Months
1-3 Years
3-5 Years
Over 5 Years
Total Rate Sensitive Assets (Rs. Million) 84,579 165,550 174,528 178,130 143,654Total Rate Sensitive Liabilities (Rs. Million) 392,746 198,221 18,834 135,452 0Rate Sensitive Gap (Rs. Million) (308,167) (32,671) 155,694 42,678 143,654Gap as a % of Rate Sensitive Liabilities (%) -78 -16 827 32
Interest Rate Risk in the Banking Book (IRRBB) is assessed through re-pricing under the earnings perspective.
The Bank has negative gaps in less than 1 year buckets. This is mainly due to the increasing of investment in Government Securities with a maturity of more than 1 year and granting of long to medium-term loans, where as major portion of deposits mature in less than 12 months.
RMD conducts stress testing on the gaps using adverse rate shocks and assess the adequacy of capital. This was recognised in the ICAAP to allocate additional capital under the IRRBB.
S T E W A R D S H I PR I S K M A N A G E M E N T

National Savings Bank
Annual Report 2014
Page 132
Parameters Risk Management/Mitigation
Modified Duration Gap
Interest rate risk is also calculated under the economic perspective through Modified Duration Gap. The results are used to measure the IRRBB and take corrective actions accordingly.
2014Years
2013Years
Weighted-Average Duration of RSAs 2.74 1.59Weighted-Average Duration of RSLs 1.05 1.09Modified Duration Gap 1.93 0.72
To be less affected by interest rate swings, the Bank can use two alternative methods:
i. Converting fixed rate loans into adjustable rate loans
ii. Reducing duration gap of the Bank
During the year 2014, the Bank moved to offer floating interest rate rather than fixed rate for loans and advances. This would contribute favourably to the Bank’s profitability in the medium to long-term and reduces the re-pricing risk.
The duration gap of the Bank stood at 1.93 years and has increased compared to the previous year mainly on account of investing in longer tenor Treasury Bonds and offering of loans in longer tenor.
The Bank can benefit from duration gaps in an interest rates falling scenario. However, RMD monitors and conducts stress tests to identify the impact to the Bank in an interest rate increasing scenario.
Portfolio Performance - Government Securities
2014Rs. Million
2013Rs. Million
Capital Gain on Treasury Bills/ Trading Bonds 848.9 138.7Mark to Market Gain/(Loss) - Trading Portfolio 138 206
Total investments in Treasury Bills and Bonds represent 84% of the deposits of which 0.7% represents the trading portfolio.
The Government Securities trading portfolio is mark-to-market on a daily basis to assess the portfolio value.
During the year 2014, the Bank generated a trading profit of Rs. 710 Million over the previous year.
AMD and IC monitor the mark-to-market analysis on a regular basis to safeguard the portfolio quality. Further, the MO monitors the trading portfolio on a daily basis and report to FO of AMD and ALCO.
R I S K M A N A G E M E N TS T E W A R D S H I P

National Savings Bank
Annual Report 2014
Page 133
Equity Risk
Equity risk is the risk that the equity investments will depreciate due to stock market dynamics causing decline in profitability. The Bank is conscious of systematic and un-systematic risks of the equity portfolio.
Accordingly, the systematic risk is mitigated by diversification and the unsystematic risk inherent to particular stock is monitored and controlled through comprehensive analysis of company fundamentals and technical charts and effective asset allocation. MRMU carefully analyses both quantitative and qualitative variables which may unfavourably affect to the performance of the equity portfolio and reports to relevant authorities frequently.
At the end 2014, the total investment of the equity portfolio amounted to Rs. 7.3 Billion, which is a reduction of 8% compared to the 2013 year end investment value. Total investment in Equity securities represents 1.0% of the total assets of the Bank.
The Bank has a comprehensive limit structure to monitor and minimise the equity risk in the trading portfolio. Marking to market, Value at Risk (VaR) and Stress testing techniques are used by the Bank to measure the equity risk.
Parameters Risk Management/Mitigation
Analysis of Stock Market Movements
In 2014, ASPI advanced by 23.4%. The growth of the main index prevailed during the first three quarters of the year and lowered during the last quarter due to uncertainties.
The MRMU/MO monitors the equity market and reports on a continuous basis.
Independent reports are submitted to the Head of Treasury/FO, ALCO and IC on the performance of stocks using predefined alert levels and heat maps.
The Bank recognised a trading profit of Rs. 101 Million in the Year 2014.
S&P SL 20 NSB PortfolioASPI
-8
-12
-4
4
0
8
12
[ % ]
January February AprilMarch JuneMay July August OctoberSeptember DecemberNovember
Performance of the Equity Portfolio and Stock Market - 2014
S T E W A R D S H I PR I S K M A N A G E M E N T

National Savings Bank
Annual Report 2014
Page 134
Parameters Risk Management/Mitigation
Equity VaR
Highest in 2014
Lowest in 2014
Average in 2014
Equity VaR* (Rs. Million) 458 0.75 115
*60 day average of VaR
MRMU of RMD calculates Equity VaR on a daily basis to monitor and report the losses in the equity trading book.
The MRMU monitors the number of days the daily VaR is above the predefined alert levels.
During the year under consideration only few instance were reported above alert levels.
Alert Level10 Day VaR
100
0
200
300
400
500
[ Rs. Million ]
27 Jan. 17 Feb. 31 Mar.10 Mar. 12 May21 Apr. 2 Jun. 23 Jun. 4 Aug.14 Jul. 29 Dec.8 Dec.17 Nov.27 Oct.6 Oct.15 Sep.25 Aug
Equity VaR Against Alert Level - 2014
The calculations are carried out as per the guidelines issued by the Basel Committee on Banking Supervision taking 365 days, a 10-day holding period and a 99% confidence level using Exponentially Weighted Moving Average (EWMA). However, this model is not validated or approved by the regulator.
Foreign Exchange Risk
Foreign Exchange (FX) risk is a risk that exists when a financial transaction is denominated in a currency other than that of the reporting currency of the Bank. In general, an adverse movement in exchange rates may decline the value of an asset or liability held in terms of foreign currency.
R I S K M A N A G E M E N TS T E W A R D S H I P
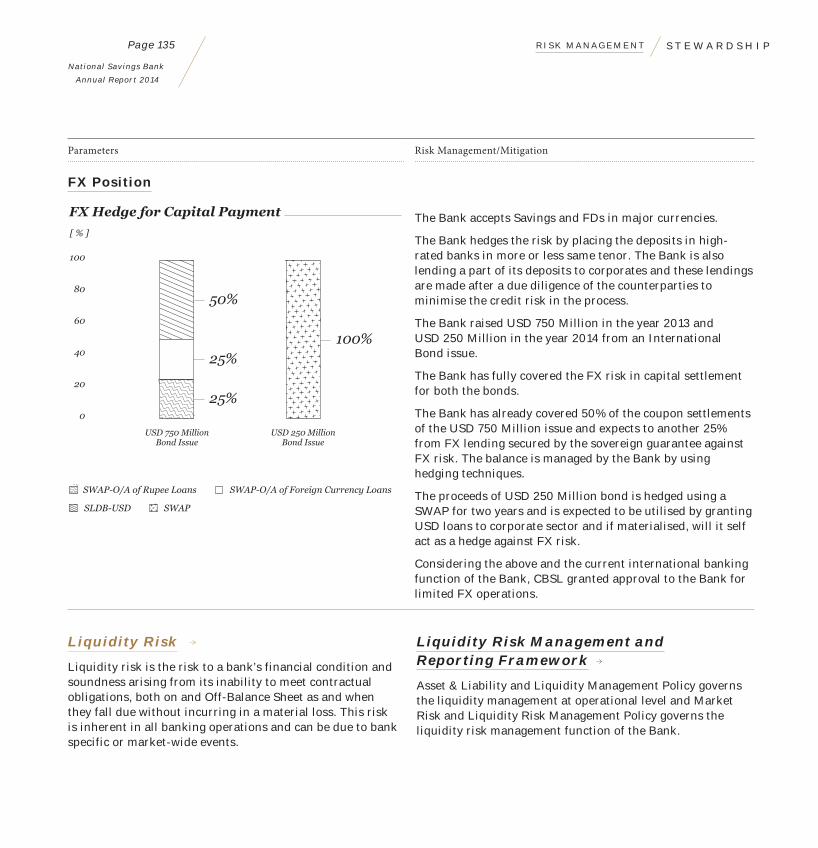
National Savings Bank
Annual Report 2014
Page 135
Parameters Risk Management/Mitigation
FX Position
FX Hedge for Capital Payment
SWAP-O/A of Foreign Currency Loans
SLDB-USD SWAP
SWAP-O/A of Rupee Loans
[ % ]
20
0
40
60
80
100
USD 750 MillionBond Issue
USD 250 MillionBond Issue
25%
25%
50%
100%
The Bank accepts Savings and FDs in major currencies.
The Bank hedges the risk by placing the deposits in high-rated banks in more or less same tenor. The Bank is also lending a part of its deposits to corporates and these lendings are made after a due diligence of the counterparties to minimise the credit risk in the process.
The Bank raised USD 750 Million in the year 2013 and USD 250 Million in the year 2014 from an International Bond issue.
The Bank has fully covered the FX risk in capital settlement for both the bonds.
The Bank has already covered 50% of the coupon settlements of the USD 750 Million issue and expects to another 25% from FX lending secured by the sovereign guarantee against FX risk. The balance is managed by the Bank by using hedging techniques.
The proceeds of USD 250 Million bond is hedged using a SWAP for two years and is expected to be utilised by granting USD loans to corporate sector and if materialised, will it self act as a hedge against FX risk.
Considering the above and the current international banking function of the Bank, CBSL granted approval to the Bank for limited FX operations.
Liquidity Risk
Liquidity risk is the risk to a bank’s financial condition and soundness arising from its inability to meet contractual obligations, both on and Off-Balance Sheet as and when they fall due without incurring in a material loss. This risk is inherent in all banking operations and can be due to bank specific or market-wide events.
Liquidity Risk Management and Reporting Framework
Asset & Liability and Liquidity Management Policy governs the liquidity management at operational level and Market Risk and Liquidity Risk Management Policy governs the liquidity risk management function of the Bank.
S T E W A R D S H I PR I S K M A N A G E M E N T

National Savings Bank
Annual Report 2014
Page 136
Liquidity management is the responsibility of ALCO and operationalised through AMD. MRMU monitors the liquidity risk of the Bank and reports findings to the ALCO, ERMC, IRMC and the Board.
Liquidity Risk Identification, Assessment and Mitigation
Parameters Risk Management/Mitigation
Analysis of Liquidity using Statutory Ratios
i. Statutory Liquid Assets Ratio (SLAR)
The Bank is in a comfortable position with respect to liquidity, as a result the mandatory requirement to invest 60% of deposits in Government Securities.
The Bank’s SLAR is well above the statutory requirement of 20% and the industry average.
SLAR accounted for 91.5% by the end of 2014 against 92.2% recorded in 2013.
Statutory RequirementLiquid Asset Ratio of the Bank
0
20
60
40
80
100
[ % ]
January February AprilMarch JuneMay July August OctoberSeptember DecemberNovember
Stability of Liquidity
ii. Liquidity Coverage Ratio (LCR) The Bank based on CBSL Guidelines has calculated LCR where the regulatory minimum is to maintain the ratio at 100%. According to the calculations, the Bank’s LCR is well above the minimum requirement.
R I S K M A N A G E M E N TS T E W A R D S H I P

National Savings Bank
Annual Report 2014
Page 137
Parameters Risk Management/Mitigation
Analysis of Liquidity using Stock and Flow Approach
i. Stock Approach
Loans toCustomerDeposits
20
0
40
60
80
100
[ % ]
2011 2012 2013 2014
Liquidity Ratios Under Stock Approach
LiquidAssets toShort-termLiabilities
PurchasedFunds toTotal Assets
Commitmentsto TotalLoans
Net Loansto TotalAssets
Loans to deposit ratio is low compared to industry average even though it is in an increasing trend. The Bank is in a comfortable position according to the stock approach.
ii. Flow Approach
Retail and Wholesale Deposits
[ % ]
2013
81%
19%
2014
Institutional DepositsIndividual Deposits
82%
18%
The negative maturity gap in less than one year bucket depicts a high liquidity risk under flow approach.
Individual deposits consist of a higher composition from total deposits narrating a low concentration and over Rs. 5 Million single deposits are only 2%. Therefore, probable demand for withdrawals at any point of time is low.
S T E W A R D S H I PR I S K M A N A G E M E N T

National Savings Bank
Annual Report 2014
Page 138
Parameters Risk Management/Mitigation
Size-wise Analysis of FDs
[ % ]
2013
23% 25%
29% 27%21%22%
1% 1%2% 3%
23% 21%
2014
Over 5 Million
100,001 to 500,00050,001 to 100,000 to 50,000
500,001 to 1 Million 1 Million to 5 Million
The Bank’s high liquid assets (Treasury Bills/Bonds) represent 66% of total assets.
Therefore, liquid risk is within a manageable level.
Further, the Government Guarantees on the deposits acts as a covenant in a severe stress scenario.
Operational Risk
Operational risk is defined by the Basel Committee as ‘the risk of loss resulting from inadequate or failed internal processes and systems, human factors or from external events including legal risk but excluding strategic and reputational risk. The operational risk includes all hidden dangers that do not fall under the umbrella of market and credit risks.
Operational risks are inherent in all products and business activities. It is associated with human errors, system failures and inadequate procedure and controls. In other words, it is the risk of loss resulting from the potential that inadequate information system, technological failure, breach in internal controls, fraud, unforeseen catastrophes or other operational problems may result in unexpected losses. When managing the operational risk, identification of the impact of external environmental factors are paramount to foresee the risk management strategies.
Regulatory Development
Pro
cess
es/
Pro
du
cts
Tec
hn
olo
gic
al
Inn
ova
tio
n
Co
un
terpa
rties
Industry Development
Operational Risk
Sources of the Operational Risk
R I S K M A N A G E M E N TS T E W A R D S H I P

National Savings Bank
Annual Report 2014
Page 139
Operational Risk Management and Reporting Framework
Operational risk management is all about awareness and accountability. Greater the awareness on business environment, people, products, processes and technology that support business activities, greater will be the accountability in assessing and managing risk. Therefore, the Bank strives to inculcate a culture where everyone is responsible for operational risk management regardless of their level, role and duties to strengthen internal control environment of the Bank.
At operational level, operational committees, policies and manuals, office instruction circulars and internal control structure direct the operational risk management function. The Bank has a Board approved Operational Risk Management Policy governing the full operational risk management process of the Bank.
The Operational Risk Management Unit of the RMD is responsible for introducing the operational risk identification, assessment and manages practices in line with CBSL Guidelines and internal best practices.
The Bank applies consistent approach to identify and assess key risks and controls across the Bank to ensure the risks are managed within the risk appetite levels and otherwise to take remedial action. Internal loss experiences, risk and control assessment results, expert judgments, internal audit findings and external loss experience obtained from published sources are used to develop Operational Key Risk Indicators (OKRIs) to identify significant operational risk levels to ensure a fair reflection of operational risk.
The findings of the operational risk management process are reported to the relevant committees including IT Steering Committee, ERMC, IRMC and the Board.
Further, the Bank undertakes following processes and procedures to manage the operational risk of the Bank.
Fraud Risk Management
The Bank has zero risk appetite for internal frauds hence take necessary steps to reduce fraud risk to a minimum level. The Fraud Investigation Unit operating under the Audit and Vigilance Division establish and operates a fraud risk framework to identify the overall fraud risk exposure and to establish controls.
On identification of a fraud event, action is taken to minimise the loss using insurance as a risk transfer strategy and preventive actions are taken to improve the controls and to increase staff awareness from the lessons learnt.
Business Continuity Management
As a financial service provider, the Bank ought to serve the customers regardless of natural disasters, technical failures or any other event which disrupt business. Priority is given for the identification and strengthening the disaster recovery capabilities of the Bank and the business continuity of the IT systems during the year under consideration.
The Business Continuity Plan (BCP) endeavours to ensure that critical services, systems and procedures continue to be available without any disruption.
Outsourcing Management
The risk arising from outsourcing of business operations are managed based on the Board-approved Outsourcing Policy prepared as per CBSL Guidelines and the Bank’s procurement guidelines. A separate Outsourcing Unit is established within the Support Services Division to streamline the functions and reporting.
Comprehensive due diligence exercises to ensure the service providers’ capability to perform the activity outsourced. The due diligence covers the expertise and experience of the service provider, technical capability, financial strength, business continuity capabilities and the reputation among the competitors. The outsourcing service providers are bound to comply by the information security standards of the Bank.
S T E W A R D S H I PR I S K M A N A G E M E N T

National Savings Bank
Annual Report 2014
Page 140
Information Security Management
The laws and regulations relating to Information and Communications Technology (ICT) are evolved to provide a safe banking service to customers in terms of accuracy, control, integrity and confidentiality of the information from the emerging vulnerabilities caused by the usage of Information Technology (IT) which comprises mainly internally developed systems.
Bank has taken steps to comply with the Baseline Security Standards (BSS) through Information Security Committee which reports to IT Steering Committee. The implementation of Information Security Management System under the Board approved Information Security Policy conducts vulnerability assessments, business impact analysis and technological/security enhancements to mitigate and minimise the identified risks.
RMD monitors the Information Security Management Function using progress reviews on a continuous basis.
Operational Risk Identification, Assessment and Mitigation
Parameters Risk Management/Mitigation
i. Loss Data Analysis
0.6
0
1.2
1.8
2.4
3.0
Risk Tolerance Limit ofActual Loss Events
[ % ]
2012 2013 2014
Trigger Level Alert LevelActual
Loss events of branches are collected and reported to RMD by Branch Operational Unit and other divisions.
High proportion of operational loss events accounts for low impact. The total frequency of loss events which are less than hundred thousand Rupees is 87% during the year 2014.
A low proportion of operational loss events accounts for high impact. The total frequency of loss events which are above regulatory threshold i.e. above five hundred thousand Rupees is only 3% for the year 2014.
Risk Appetite Document outlines the alert levels to monitor operational loss of the Bank. The actual operational losses are far below the risk levels defined by the Bank.
R I S K M A N A G E M E N TS T E W A R D S H I P

National Savings Bank
Annual Report 2014
Page 141
Parameters Risk Management/Mitigation
ii. Operational Losses According to
BASEL II Categories
Frequency
[ % ]
40%
1%
12%
29%
14% 4%
2013
21%
35%
18%
22% 4%
2014
Severity
[ % ]
63%
8%
20%
1%
8%
201345%
16%
25%
12%
2%
2014
Execution, Delivery and Process Management
Employment Practices & Workplace Safety
External FraudsInternal Frauds
Client, Product and Business Practices
Damage to Physical Assets
Business Disruptions and System Failures
The Bank maintains a loss event database, in line with Basel II loss event categorisation.
Higher frequency of events (35%) occurs under damages to physical assets of which impact is mitigated through insurance.
The internal fraud (45%) has the highest severity, though the frequency of occurrences is very low.
The RMD analyses the loss events, conducts root cause analysis and recommends improvements to strengthen the control environment further.
The findings of the loss event data are reported to the Business Units, Operational Committees, ERMC, IRMC and the BOD on regular intervals.
S T E W A R D S H I PR I S K M A N A G E M E N T

National Savings Bank
Annual Report 2014
Page 142
Parameters Risk Management/Mitigation
iii. Operational Key Risk Indicators (OKRIs) The Bank monitors operational risk using a seven operational risk indices. Each index comprises OKRIs to assess the risk based on predefined threshold limits.
The RMD submits a dash board to ERMC, IRMC and the BOD on a quarterly basis highlighting the changes in operational risk profile under different indices.
iv. Analysis of Customer Complaints
71%
17%12%
Customer Complaints Analysis
[ % ]
Products IssuesDefective Customer ServiceBusiness Distruptions
Bank’s customer complaints are received and recorded by the Customer Call Centre.
RMD obtains the date relating to customer complaints on monthly basis to monitor trends through OKRIs and reports the BOD quarterly.
From the composition of complaints, the highest number of complaints are for customer service (71%) which is customary for a service provider.
Senior Management examines complaints and takes necessary corrective and preventive actions.
R I S K M A N A G E M E N TS T E W A R D S H I P
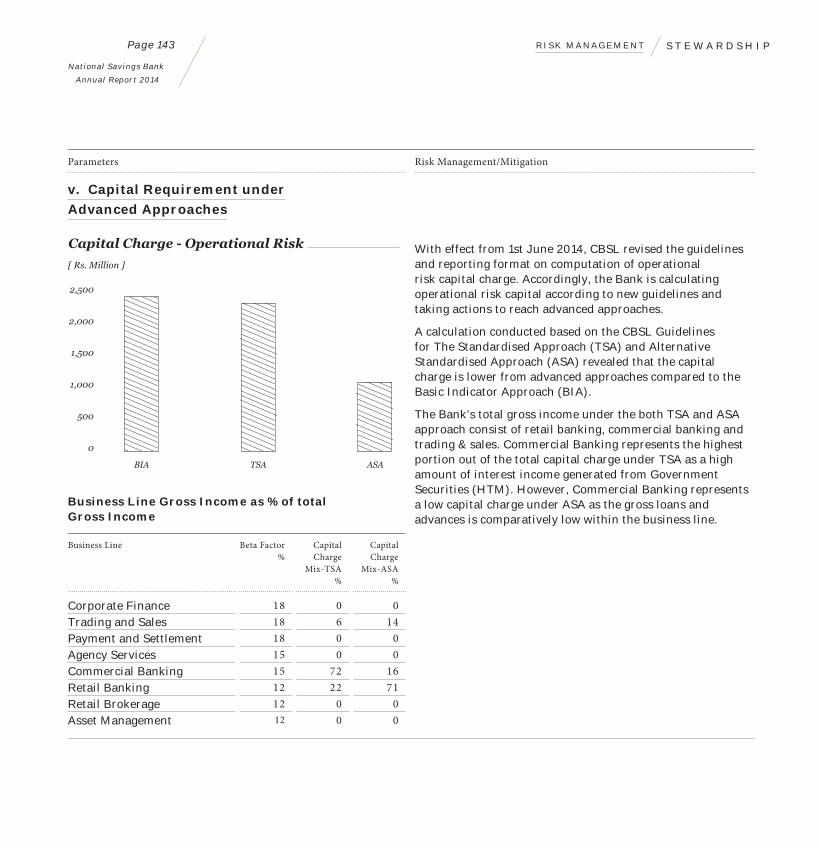
National Savings Bank
Annual Report 2014
Page 143
Parameters Risk Management/Mitigation
v. Capital Requirement under Advanced Approaches
500
0
1,000
1,500
2,000
2,500
Capital Charge - Operational Risk
[ Rs. Million ]
BIA TSA ASA
Business Line Gross Income as % of total Gross Income
Business Line Beta Factor%
Capital Charge
Mix-TSA%
Capital Charge
Mix-ASA%
Corporate Finance 18 0 0Trading and Sales 18 6 14Payment and Settlement 18 0 0Agency Services 15 0 0Commercial Banking 15 72 16Retail Banking 12 22 71Retail Brokerage 12 0 0Asset Management 12 0 0
With effect from 1st June 2014, CBSL revised the guidelines and reporting format on computation of operational risk capital charge. Accordingly, the Bank is calculating operational risk capital according to new guidelines and taking actions to reach advanced approaches.
A calculation conducted based on the CBSL Guidelines for The Standardised Approach (TSA) and Alternative Standardised Approach (ASA) revealed that the capital charge is lower from advanced approaches compared to the Basic Indicator Approach (BIA).
The Bank’s total gross income under the both TSA and ASA approach consist of retail banking, commercial banking and trading & sales. Commercial Banking represents the highest portion out of the total capital charge under TSA as a high amount of interest income generated from Government Securities (HTM). However, Commercial Banking represents a low capital charge under ASA as the gross loans and advances is comparatively low within the business line.
S T E W A R D S H I PR I S K M A N A G E M E N T

National Savings Bank
Annual Report 2014
Page 144
Legal Risk
BASEL II defines legal risk as a part of operational risk. It arises due to the legal implications of failed internal systems, people, process or external events.
The responsibility of managing legal risk is vested with the Legal Division. The Risk Management Division monitors the legal risk on a regular basis and the Compliance Division ensures compliance with relevant laws and regulations.
Although the division handles several litigations, there were no major matters that affect operations and reputation of the Bank during the year 2014.
Strategic Risk
At macro level, the universe of strategic risk for a banking industry arises as a result of business strategies made by the entities towards risk-filled business environment factors such as hastened business trends, technological advancement, global economies and political factors.
Bank specific strategic risk may arise internally due to unsuccessful business plan, inability to implement business plan, substandard execution of decisions, inadequate resource allocation and inability of adapting to changes in business environment causing adverse impact on earnings and capital of the Bank.
The overall responsibility of the management of strategic risk rests with the Senior Management and Board of Directors. The Bank has a well-structured Strategic Business Planning and Budgeting process to set the strategic direction and a robust monitoring mechanism is in place to minimise strategic risk.
The strategic risk of the Bank is assessed using a qualitative scorecard approach as a part of ICAAP. The model considers the level of strategic risk from industry, market competition, strategic plan, capital market and overall management.
Reputational Risk
Reputational risk is referred to as potential negative impact on corporate image or earning and capital arising from an adverse perception toward the Bank due to illegal, unethical or non-compliance business practices. Reputation of a financial service provider is a key to attain a competitive edge in challenging business environment.
Being the AAA rated state savings bank with 100% Government Guarantee for its deposits; the Bank takes utmost care to safeguard its reputation. The Bank’s management structure and the risk management framework including all the policies, procedures on codes of conduct and related party disclosures provide guidance to corporate management and the staff to execute their duties and responsibilities in an ethical and standard manner to safeguard the reputation of the Bank. The customer complaints and media publications are monitored on regular basis through KORIs to understand the external perception toward the Bank and to take proactive and corrective actions on recognised vulnerabilities.
The overall reputational risk of the Bank is assessed through qualitative scorecard approach as a part of ICAAP by the RMD. The model considers the level of reputational impact relating to operational loss events, business loss events, market perception and corporate management.
R I S K M A N A G E M E N TS T E W A R D S H I P

National Savings Bank
Annual Report 2014
Page 145
Compliance Risk
Compliance risk arises from failure or inability to comply fully with the rules, orders, laws and regulations applicable to the financial services business locally and internationally. The laws mainly include Prevention of Money Laundering Act (PMLA) No. 5 of 2006, Financial Transaction Reporting Act (FTRA) No. 6 of 2006, Suppression of Terrorist Financing Act No. 25 of 2005 and the directions issued for the Licensed Specialised Banks by CBSL. Non-compliance of their requirements could lead to fines, public reprimands and reputation damages or in extreme cases enforcement of suspension of operation or withdrawal of license to operate.
Understanding the magnitude of the risk involved, the Bank has established the compliance function headed by an Independent Compliance Officer directly reporting to the Board through IRMC.
The compliance function is governed by the Bank’s Compliance Policy. This policy is implemented by the Compliance Officer using well-defined systems and procedures on a bank-wide basis through the ECC of the Bank.
The division ensures compliance with the regulations, laws and directions through ensuring the adequacy of Bank’s policy framework, compliance testing in business lines and conducting customer due diligence tests.
The Compliance Risk of the Bank is assessed as a part of ICAAP process through scorecard approach giving weights to the critical compliance requirements.
Capital Adequacy
The capital adequacy requirement is a part of regulatory framework governing how financial institutions are managed. It is a measure of solvency and the ability to absorb the unexpected losses with confidence so that the financial institution functions without the threat of liquidation for a foreseeable future. Capital Adequacy Ratio (CAR), expresses capital as a percentage of risk-weighted assets. Core capital (Tier I) is defined by permanent shareholders equity. Since the Bank has not raised capital through approved subordinated debt instruments, the Tier II capital base is arrived as net of other supplementary capital source and deductions.
Under BASEL II Pillar I capital calculations, the Bank uses Standardised Approach for Credit Risk, Standardised Measurement Approach for Market Risk and the Basic Indicator Approach for Operational Risk.
S T E W A R D S H I PR I S K M A N A G E M E N T
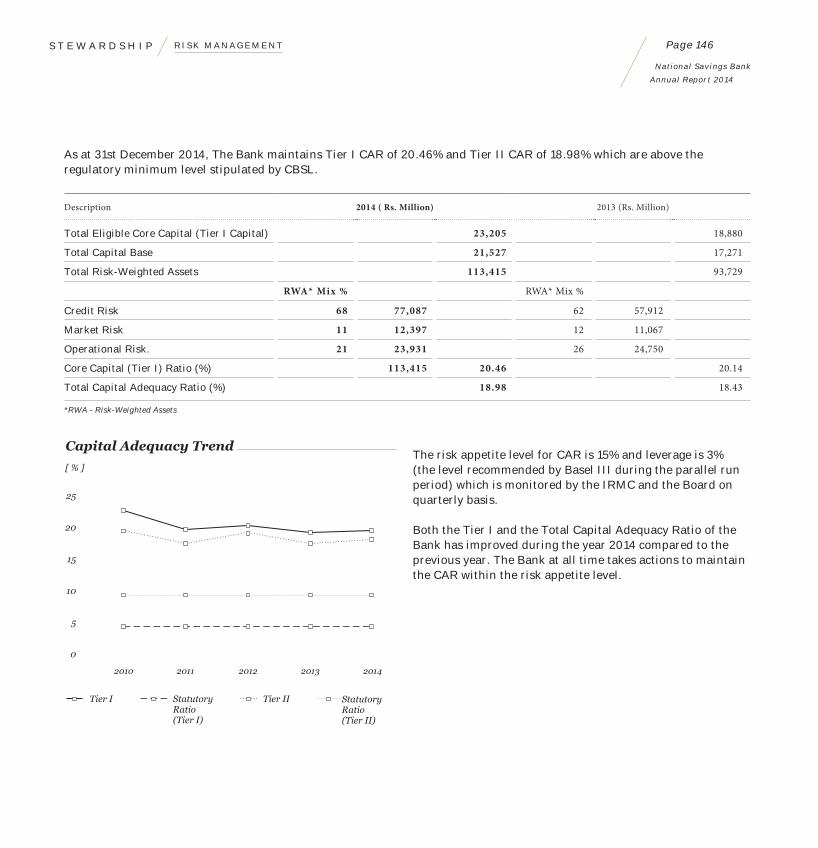
National Savings Bank
Annual Report 2014
Page 146
As at 31st December 2014, The Bank maintains Tier I CAR of 20.46% and Tier II CAR of 18.98% which are above the regulatory minimum level stipulated by CBSL.
Description 2014 ( Rs. Million) 2013 (Rs. Million)
Total Eligible Core Capital (Tier I Capital) 23,205 18,880
Total Capital Base 21,527 17,271
Total Risk-Weighted Assets 113,415 93,729
RWA* Mix % RWA* Mix %
Credit Risk 68 77,087 62 57,912
Market Risk 11 12,397 12 11,067
Operational Risk. 21 23,931 26 24,750
Core Capital (Tier I) Ratio (%) 113,415 20.46 20.14
Total Capital Adequacy Ratio (%) 18.98 18.43
*RWA - Risk-Weighted Assets
The risk appetite level for CAR is 15% and leverage is 3% (the level recommended by Basel III during the parallel run period) which is monitored by the IRMC and the Board on quarterly basis.
Both the Tier I and the Total Capital Adequacy Ratio of the Bank has improved during the year 2014 compared to the previous year. The Bank at all time takes actions to maintain the CAR within the risk appetite level.
R I S K M A N A G E M E N TS T E W A R D S H I P
5
0
10
15
20
25
Capital Adequacy Trend
[ % ]
2010 2011 2012 2013 2014
Tier I StatutoryRatio(Tier I)
Tier II StatutoryRatio(Tier II)

National Savings Bank
Annual Report 2014
Page 147
Internal Capital Adequacy Assessment Process (ICAAP)
ICAAP is a process by which the management ensures additional capital is provided for banking risks, other than those covered in Pillar I. This ensures the Bank has adequate capital to commensurate the risk it carries.
The capital adequacy assessment is carried out on a proportionate basis, taking into account the size, nature and complexity of the Bank’s activities, based on directions given by CBSL. The document was approved by the Board and the Board also reviews it for its ongoing appropriateness both on an annual basis and additionally when considered necessary in the light of significant changes.
The ICAPP process is governed by two principle requirements; the Bank to have an internal capital adequacy process and strategy linked to their capital levels. The Bank expected to hold capital in excess of the regulatory minimum.
ICAAP is integrated with the entire operation of the Bank and its risk profile, where a sound risk management structure is in place to ensure prudential assessment of inherent and residual risks which are not covered under Basel II Pillar I.
Assessment conducted for the year 2014, forecasted approximately 5% impact on capital adequacy level due to Pillar II risks. The residual risk to the pawning portfolio due to adverse variation in gold prices and the interest rate risk in banking book are the main contributors for the incremental capital charge. The Bank’s CAR after considering Pillar II risks is above the regulatory minimum.
Capital Management
The Bank targets to maintain the CAR ahead of regulatory minimum requirement of the CBSL. The capital positions along with the profitability enable the Bank to perform a superior role for its customers and the stakeholders.
The Bank’s capital management objectives are to -
- Maintain sufficient capital resources to meet minimum regulatory capital requirement set by CBSL.
- Maintain sufficient capital resources to support the Bank’s risk appetite and economic capital requirement.
- Support the credit rating of the Bank.
- Ensure the subsidiary company meets the minimum capital requirement.
- Allocate capital to the business to support achieving strategic objectives to optimise return on economic and regulatory capital.
The Bank strives to maintain the optimum capital since higher capital, restrict the leverage of the Bank which inturns affect the profitability. The ALCO headed by the GM/CEO reviews actual and the forecasted capital to achieve the capital management objectives.
In addition, the RMD analyses the impact of stress scenarios in order to understand and manage projected capital adequacy targets.
Stress Testing
Stress testing is an integral part of the Bank’s risk management process. The Bank’s stress testing framework is governed by the Board approved Stress Testing Policy and the Guidelines issued by CBSL.
Stress tests focus on the effect of various potential vulnerabilities on earnings, capital requirements and liquidity of the Bank. It is an integrated test that shows to varying degrees, whether the Bank can withstand unforeseen scenarios
S T E W A R D S H I PR I S K M A N A G E M E N T
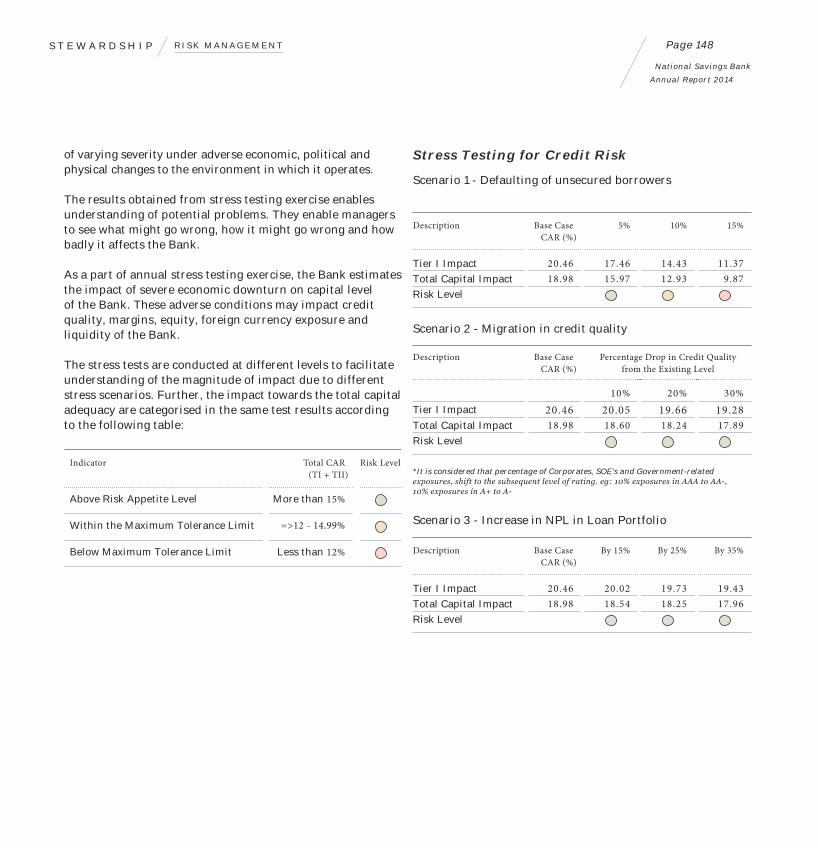
National Savings Bank
Annual Report 2014
Page 148
of varying severity under adverse economic, political and physical changes to the environment in which it operates.
The results obtained from stress testing exercise enables understanding of potential problems. They enable managers to see what might go wrong, how it might go wrong and how badly it affects the Bank.
As a part of annual stress testing exercise, the Bank estimates the impact of severe economic downturn on capital level of the Bank. These adverse conditions may impact credit quality, margins, equity, foreign currency exposure and liquidity of the Bank.
The stress tests are conducted at different levels to facilitate understanding of the magnitude of impact due to different stress scenarios. Further, the impact towards the total capital adequacy are categorised in the same test results according to the following table:
Indicator Total CAR (TI + TII)
Risk Level
Above Risk Appetite Level More than 15%
Within the Maximum Tolerance Limit =>12 - 14.99%
Below Maximum Tolerance Limit Less than 12%
Stress Testing for Credit Risk
Scenario 1 - Defaulting of unsecured borrowers
Description Base Case CAR (%)
5% 10% 15%
Tier I Impact 20.46 17.46 14.43 11.37Total Capital Impact 18.98 15.97 12.93 9.87Risk Level
Scenario 2 - Migration in credit quality
Description Base Case CAR (%)
Percentage Drop in Credit Quality from the Existing Level
10% 20% 30%Tier I Impact 20.46 20.05 19.66 19.28Total Capital Impact 18.98 18.60 18.24 17.89Risk Level
*It is considered that percentage of Corporates, SOE’s and Government-related
Scenario 3 - Increase in NPL in Loan Portfolio
Description Base Case CAR (%)
By 15% By 25% By 35%
Tier I Impact 20.46 20.02 19.73 19.43Total Capital Impact 18.98 18.54 18.25 17.96Risk Level
R I S K M A N A G E M E N TS T E W A R D S H I P

National Savings Bank
Annual Report 2014
Page 149
Stress Test for Market Risk
Scenario 1 - Parallel adverse rate shift (IRRBB)
Description Base Case CAR (%)
50 bp 100 bp 200 bp
Tier I Impact 20.46 19.07 17.66 14.77Total Capital Impact 18.98 17.58 16.16 13.25Risk Level
Scenario 2 - Decline in MV of Government Securities - Trading Portfolio
Description Base Case CAR (%)
50 bp 100 bp 200 bp
Tier I Impact 20.46 20.44 20.43 20.39Total Capital Impact 18.98 18.96 18.95 18.91Risk Level
Scenario 3 - Adverse changes in stock market prices
Description Base Case CAR (%)
15% 20% 25%
Tier I Impact 20.46 20.26 20.18 20.09Total Capital Impact 18.98 18.76 18.67 18.58Risk Level
Scenario 4 - Adverse movements in FX rates (Rupee Appreciation)
Description Base Case CAR (%)
5% 10% 15%
Tier I Impact 20.46 20.35 20.25 20.14Total Capital Impact 18.98 18.87 18.76 18.65Risk Level
Scenario 5 - Liquidity: Less than 1 month deposit withdrawal %
Description Base Case CAR (%)
25% 50% 100%
Tier I Impact 20.46 22.09 20.85 18.31Total Capital Impact 18.98 20.43 19.18 16.62Risk Level
S T E W A R D S H I PR I S K M A N A G E M E N T

National Savings Bank
Annual Report 2014
Page 150

F I N A N C I A L R E P O R T S
National Savings Bank
Annual Report 2014
Page 151 N O T E S T O T H E F I N A N C I A L S T A T E M E N T S
Financial Reports
Annual Report of Board of Directors – 153Statement of Directors Responsibility on Financial Reporting – 160
Directors’ Statement on Internal Control Over Financial Reporting – 162Independent Assurance Report on Internal Controls 164
General Manager/CEO’s and Deputy General Manager’s (Finance & Planning) Statement of Responsibility – 165
Auditor General’s Report – 167Statement of Comprehensive Income – 168
Statement of Financial Position – 170Statement of Changes in Equity – 172
Statement of Cash Flows – 176Notes to the Financial Statements – 177

Financial Calendar
Financial Calendar 2014
Publication of Interim Financial Statements for the quarter ended 31st March 2014 30th May 2014Publication of Interim Financial Statements for the quarter ended 30th June 2014 15th August 2014Publication of Interim Financial Statements for the quarter ended 30th September 2014 7th November 2014Listing of USD 250 Million Bond in Singapore Stock Exchange 10th September 2014 Publication of Financial Statements (Audited) for the year ended 31st December 2014 31st March 2015
Proposed Financial Calendar 2015
Publication of Interim Financial Statements for the quarter ending 31st March 2015 29th May 2015Publication of Interim Financial Statements for the quarter ending 30th June 2015 28th August 2015Publication of Interim Financial Statements for the quarter ending 30th September 2015 27th November 2015Publication of Financial Statements for the year ending 31st December 2015 30th March 2016
F I N A N C I A L R E P O R T S
National Savings Bank
Annual Report 2014
Page 153
General
The Directors of the National Savings Bank have pleasure in presenting their Annual Report on the affairs of the Bank together with the audited Financial Statements of the Bank and Consolidated Financial Statements for the year ended 31st December 2014. The draft Financial Statements together with the Annual Report were submitted to the Auditor General on 16th February 2015. The audited Financial Statements were authorised to issue on 26th March 2015 by a resolution of the Board of Directors. The Report also includes certain disclosures required to be made under the Banking Act No. 30 of 1988 and amendments thereto and the Direction on Corporate Governance. The Annual Report and Financial Statements, together with the Auditor General’s Report will be submitted to the Minister of Finance, on or before 31st May 2015 as per Circular No. PE D/27 of 27th January 2005, issued by the Director General of the Department of Public Enterprises to be placed before the Parliament of Sri Lanka.
National Savings Bank is incorporated in Sri Lanka by National Savings Bank Act No. 30 of 1971 and was granted the status of Licensed Specialised Bank in terms of Banking Act No. 30 of 1988.
The Bank has been assigned AAA (lka) long-term credit rating by the Fitch Rating Lanka (Pvt) Ltd. for 12th consecutive year. It has also been awarded international credit ratings of BB- Stable by Fitch Inc. and B+ Stable by Standard and Poor’s Rating services.
First Integrated Annual Report
The Board of Directors takes pleasure in presenting its first integrated Annual Report for the year ended 31st December 2014. We are certain that it gives the strategic picture of the Bank’s business that explains how the Bank creates and sustains value over the years and in the future.
Vision, Mission and Values
The Bank’s Vision, Mission and Values are given on page 5 of this Annual Report. The Bank maintains high ethical standards in its activities whilst pursuing the objectives stated under ‘Vision’ and ‘Mission’. All permanent employees are being aware about the Code of Conduct of the Bank with the view of reaching the Vision and Mission of the Bank.
Principal Business Activities
Bank
The principal business activity of the National Savings Bank is promotion of savings among the people of Sri Lanka and profitable investments of savings so mobilised.
Subsidiary
The principal activity of NSB Fund Management Company Ltd. is dealing in Government Securities as a primary dealer authorised by the Central Bank of Sri Lanka. Details are given in Note 39 (b) to the Financial Statements.
There were no significant changes in the nature of the principal activities of the Bank and the Group.
Review of Business Performance
The Bank’s performance for the financial year 2014 and its financial position were reviewed in the Letter from the Chairman (page 17), the General Manager/CEO’s Review (page 20) Audited Financial Statements. Managements Discussion and Analysis (pages 49 to 71). These reports form an integral part of this Annual Report.
Future Developments
An overview of the future developments of the Bank is given in the Letter from the Chairman (page 17), the General Manager/CEO’s Review (page 20) and Management Discussion and Analysis (pages 49 to 71). These reports form an integral part of the Annual Report.
A N N U A L R E P O R T O F B O A R D
O F D I R E C T O R S

F I N A N C I A L R E P O R T S
National Savings Bank
Annual Report 2014
Page 154
The Bank has adopted a Strategic Business Plan from 2014 to 2016 and it will strive to achieve the business goals set out in the new Business Plan, which will accelerate the future momentum of NSB.
Going Concern
The Board of Directors have reviewed and satisfied that the Bank has adequate resources to continue its operations in the foreseeable future. Therefore, the Bank continues to adopt the going concern basis in preparing the Financial Statements in compliance with SLFRS/LKAS and in conformity with the GAAP applied consistently.
Financial Statements
These Financial Statements are prepared in accordance with the Sri Lanka Accounting Standards (SLFRS/LKAS).
The Financial Statements of the Bank and the Group for the year ended 31st December 2014 are duly certified by the Deputy General Manager – Finance & Planning, and approved and signed by the General Manager/Chief Executive Officer, two Directors including the Chairman of the Bank are given from pages 168 to 263.
Directors’ Responsibility for Financial Reporting
The Directors are responsible for the preparation of the Financial Statements of the Bank and the Group, to reflect a true and fair view of the state of affairs of the Bank as at 31st December 2014 and its profit for the year then ended. The Directors are of the view that these Financial Statements have been prepared in conformity with the requirements of the Sri Lanka Accounting Standards and the Banking Act No. 30 of 1988 and its amendments. The Statement of Directors Responsibility on Financial Reporting Statement appearing on page 160 of this Annual Report forms an integral part of the Annual Report of the Board of Directors and describes in detail in the Directors’ Responsibilities in relation to Financial Statements.
Auditors’ Report
The Auditor General carried out an audit of the Financial Statements of the Bank and the Consolidated Financial Statements of the Group for the year ended 31st December 2014 and their Report on those Financial Statements is given on page 167.
Significant Accounting Policies
The Significant Accounting Policies adopted in preparation of the Financial Statements are given on pages 177 to 191 The significant changes to accounting policies if any in the preparation of the Financial Statements are also stated therein.
Income
The total income of the Bank for 2014 was Rs. 77,890 Million (2013 - Rs. 65,573 Million) while the Group’s income was Rs. 78,573 Million (2013 - Rs. 66,671 Million). Details of the income are given in Note 3 to the Financial Statements.
Financial Performance
The Bank has recorded Rs. 10,472 Million of net profit before tax (PBT) and Rs. 6,867 Million of net profit after tax (PAT) for the year ended 31st December 2014 which was an increase by 360% of PBT and 480% of PAT compared to the same periods of last year. The Group PAT also increased by 362% to Rs. 7,054 Million for the year ended 31st December 2014.
A N N U A L R E P O R T O F B O A R D O F D I R E C T O R S

F I N A N C I A L R E P O R T S
National Savings Bank
Annual Report 2014
Page 155
Details of appropriation of profit of the Bank are given below:
2014Rs. Million
2013 Rs. Million
Profit for the year after payment of all expenses, VAT and NBT 10,472 2,279Less: Provision for Taxation 3,606 1,095Net Profit After Taxation 6,867 1,184
Profit available for appropriation 6,867 1,184
Less: AppropriationsTransfer to the Statutory Reserve Fund 137 24Contribution to Consolidated Fund/Dividend 4,000 3,000Contribution to National Insurance Trust Fund 69 12Transfer to the Retirement Benefit Plans 3,000 –Transfer to the Investment Fund Account – 608Transfer to General Reserve (340) (2,460)
6,867 1,184
awarded with B+ stable and BB- stable international Credit Ratings from Standard & Poor and Fitch Ratings respectively as a prerequisite with international bond.
Stated Capital
The authorised share capital of the Bank is Rs. 10 Billion which is made of one billion ordinary shares of Rs. 10 each. The issued share capital of the Bank as at 31st December 2014 stood at Rs. 3.2 Billion. The Secretary to the Treasury in his official capacity holds the entirety of the issued share capital.
Shareholding
The Government of Sri Lanka is the sole shareholder of the National Savings Bank.
Provision for Taxation
The Income Tax Rate applicable for the Bank on its operation is 28% (2013 - 28%), the Bank’s profit is also liable for Value Added Tax on financial services at the rate of 12% (2013 - 12%), National Building Tax at the rate of 2% (2013 - Nil). Further, the Bank is liable to pay Crop Insurance Levy of 1% on its PAT.
The Bank provided deferred tax on all known temporary differences under the liability method in accordance with Sri Lanka Accounting Standard (LKAS 12) - ‘Income Taxes’. Information on Income Tax expenditure and Deferred Taxation are given in Notes 13 and 29 respectively 0n pages 196 and 224.
International Bond Issue
The Bank issued its second international bond for the value of US $ 250 Million in September 2014 in order to bring down the weighted average cost of funds. The Bank has been
A N N U A L R E P O R T O F B O A R D O F D I R E C T O R S
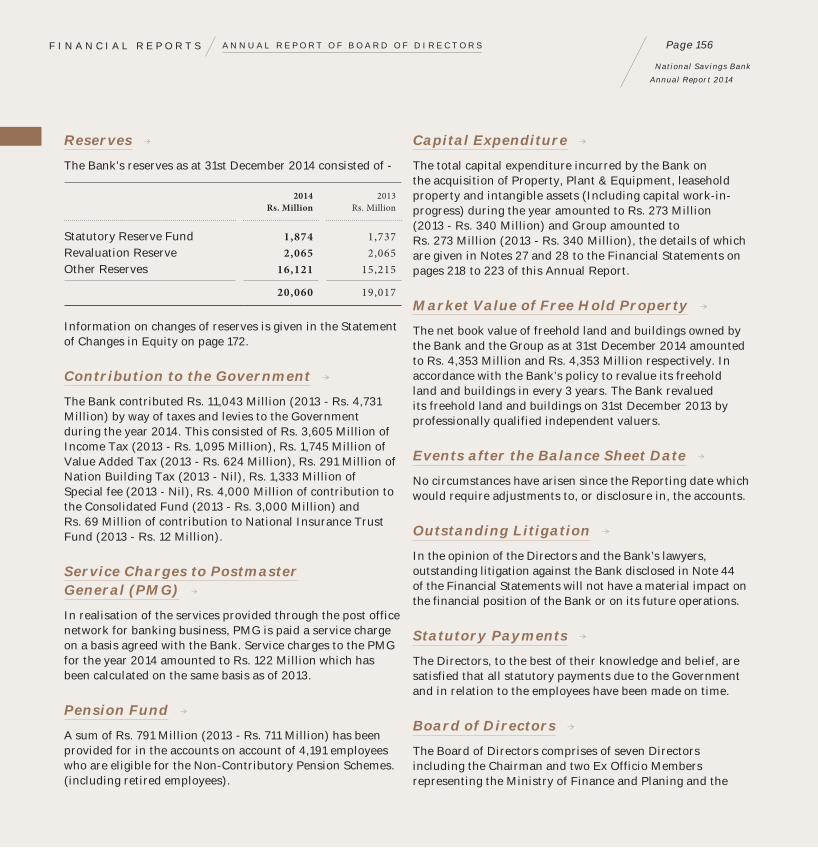
F I N A N C I A L R E P O R T S
National Savings Bank
Annual Report 2014
Page 156
Reserves
The Bank’s reserves as at 31st December 2014 consisted of -
2014Rs. Million
2013 Rs. Million
Statutory Reserve Fund 1,874 1,737Revaluation Reserve 2,065 2,065Other Reserves 16,121 15,215
20,060 19,017
Information on changes of reserves is given in the Statement of Changes in Equity on page 172.
Contribution to the Government
The Bank contributed Rs. 11,043 Million (2013 - Rs. 4,731 Million) by way of taxes and levies to the Government during the year 2014. This consisted of Rs. 3,605 Million of Income Tax (2013 - Rs. 1,095 Million), Rs. 1,745 Million of Value Added Tax (2013 - Rs. 624 Million), Rs. 291 Million of Nation Building Tax (2013 - Nil), Rs. 1,333 Million of Special fee (2013 - Nil), Rs. 4,000 Million of contribution to the Consolidated Fund (2013 - Rs. 3,000 Million) and Rs. 69 Million of contribution to National Insurance Trust Fund (2013 - Rs. 12 Million).
Service Charges to Postmaster General (PMG)
In realisation of the services provided through the post office network for banking business, PMG is paid a service charge on a basis agreed with the Bank. Service charges to the PMG for the year 2014 amounted to Rs. 122 Million which has been calculated on the same basis as of 2013.
Pension Fund
A sum of Rs. 791 Million (2013 - Rs. 711 Million) has been provided for in the accounts on account of 4,191 employees who are eligible for the Non-Contributory Pension Schemes. (including retired employees).
Capital Expenditure
The total capital expenditure incurred by the Bank on the acquisition of Property, Plant & Equipment, leasehold property and intangible assets (Including capital work-in-progress) during the year amounted to Rs. 273 Million (2013 - Rs. 340 Million) and Group amounted to Rs. 273 Million (2013 - Rs. 340 Million), the details of which are given in Notes 27 and 28 to the Financial Statements on pages 218 to 223 of this Annual Report.
Market Value of Free Hold Property
The net book value of freehold land and buildings owned by the Bank and the Group as at 31st December 2014 amounted to Rs. 4,353 Million and Rs. 4,353 Million respectively. In accordance with the Bank’s policy to revalue its freehold land and buildings in every 3 years. The Bank revalued its freehold land and buildings on 31st December 2013 by professionally qualified independent valuers.
Events after the Balance Sheet Date
No circumstances have arisen since the Reporting date which would require adjustments to, or disclosure in, the accounts.
Outstanding Litigation
In the opinion of the Directors and the Bank’s lawyers, outstanding litigation against the Bank disclosed in Note 44 of the Financial Statements will not have a material impact on the financial position of the Bank or on its future operations.
Statutory Payments
The Directors, to the best of their knowledge and belief, are satisfied that all statutory payments due to the Government and in relation to the employees have been made on time.
Board of Directors
The Board of Directors comprises of seven Directors including the Chairman and two Ex Officio Members representing the Ministry of Finance and Planing and the
A N N U A L R E P O R T O F B O A R D O F D I R E C T O R S

F I N A N C I A L R E P O R T S
National Savings Bank
Annual Report 2014
Page 157
Postmaster General. The Minister of Finance appoints the Chairman and other four Directors. The Bank’s Board of Directors, their appointments and resignations during the year are as follows. The brief profiles of each Director appear on pages 74 and 75 of this Annual Report.
Name of the Director Period Status
Aswin De Silva, Chairman From 09.02.15 NIND/NEDMahinda Siriwardana (Ex Officio) From 25.02.15 IND/NEDD.L.P.R. Abeyaratne, PMG (Ex Officio) From 10.03.15 NIND/NEDBradley Emerson From 11.02.15 IND/NEDSuranga Naullage From 09.02.15 NIND/NEDAjith Pathirana From 20.03.15 IND/NEDMs. W.A. Nalani, Chairperson Up to 19.01.15 NIND/NEDS.R. Attygalle (Ex Officio) Up to 24.02.15 NIND/NEDH. Madiwela Up to 27.01.15 IND/NEDS.T. Abeygunawardena Up to 12.01.15 NIND/WDN.P.L.P. Fernando Up to 13.01.15 NIND/NEDSumith Wijesinghe Up to 02.02.15 IND/NED
NIND - Non-Independent, IND - Independent, NED - Non-Executive Director, WD - Working Director
Directors’ Remuneration and
Details of Directors’ emoluments and other benefits in respect of the Bank and Group for the financial year 2014 are given in Note 39 to the Financial Statements.
Board Sub-Committees
The Board while assuming the overall responsibility and accountability has also appointed the four Board Sub-Committees to ensure conformity with Corporate Governance Standards of the Central Bank and other statutory compliances. The four mandatory Sub-Committees and their composition as at 31st December 2014 are as follows.
Board Audit Committee
Bradley Emerson - Chairman (From 12th March 2015)Lionel P. Fernando - Chairman (Up to 13th January 2015)Mahinda Siriwardana - Member (From 12th March 2015)S.R. Attygalle - Member (Up to 09th February 2015)H. Madiwela - Member (Up to 27th January 2015)
The Report of the Board Audit Committee is given on page 109.
Board Human Resources and Remuneration Committees
Aswin De Silva - Chairman (From 12th March 2015)Ms. W.A. Nalani - Chairperson (Up to 19th January 2015)D.L.P.R. Abeyratne - Member (From 12th March 2015)S.R. Attygalle - Member (Up to 24th February 2015)H. Madiwela - Member (Up to 27th January 2015)
The Report of the Board Human Resources and Remuneration Committee is given on page 112.
Board Nomination Committee
Aswin De Silva - Chairman (From 12th March 2015)S.R. Attygalle - Chairman
(Up to 24th February 2015)Mahinda Siriwardana - Member ( From 12th March 2015)Sumith Wijesinghe - Member (Up to 2nd February 2015)S.T. Abeygunawardena - Member (Up to 12th January 2015)
The Report of the Board Nomination Committee is given on page 114.
A N N U A L R E P O R T O F B O A R D O F D I R E C T O R S

F I N A N C I A L R E P O R T S
National Savings Bank
Annual Report 2014
Page 158
Board Integrated Risk Management Committee
D.L.P.R. Abeyaratne - ChairmanBradley Emerson - Member (From 12th March 2015)Mahinda Siriwardana - Member (From 12th March 2015)Lionel P. Fernando - Member (Up to 13th January 2015)Sumith Wijesinghe - Member (Up to 2nd February 2015)
The Report of the Board Integrated Risk Management Committee is given on pages 113.
Directors’ Meetings
The number of Directors’ meetings which comprises of Board meetings, Audit Committee meetings, Nomination Committee meetings, Integrated Risk Management Committee meetings and Human Resources and Remuneration Committee and the attendance of Directors at these meetings are given on Corporate Governance Report (pages 86 and 89) of this Annual Report.
Directors’ Interests in Contracts
Directors’ interests in contracts or proposed contracts with the Bank, both direct and indirect are disclosed in Note 39 to the Financial Statements. These interests have been declared at the Board meetings. The Directors do not have any direct or indirect interest in other contracts or proposed contracts with the Bank.
Related Party Transactions
The Directors have also disclosed the transactions if any, that could be classified as related party transactions in terms of Sri Lanka Accounting Standard (LKAS) 24 - ‘Related Party Disclosures’ which is adopted in the preparation of the Financial Statements. Those transactions disclosed by the Directors are given in Note 39 to the Financial Statements.
Branch Expansion and Developments
The Bank extended its services through the addition of 7 new branches and relocation of two new branches during the period under review. At the end of the year the Bank has 236 branches in its network. The ATM network was further expanded enhancing customer convenience. The Bank installed 13 ATMs during the year across the island bringing out the total ATMs to 260 excluding peer banks’ ATMs through which customers of NSB can transact. Also Postal network which comprises 4,063 main and sub-post office are also a major part of NSB network.
Human Resources
The Bank continued to develop and maintain dedicated and highly motivated employees who are committed to create sustainable value through high quality service. Significant investments have been made in the development of quality of Human Capital of the Bank. The policies and procedures adopted by the Bank to upgrade human capital are described in Management Discussion and Analysis on pages 65.
Environmental Protection
The Bank has taken initiatives to safeguard and enhance the environment which are vital for sustainable development and growth of the Bank. The Bank and the Group have not engaged in any activity that is harmful or hazardous to environment.
Risk Management, Internal Controls and Management Information Systems
The Board of Directors assumes overall responsibility for managing risk. For this purpose, the Board of Directors has instituted and implemented an effective and comprehensive system of internal controls and management information systems in the Bank. The Board of Directors continuously monitors and reviews this process through the Board Integrated Risk Management Committee. The Bank’s Risk Management Report is given on page 115.
A N N U A L R E P O R T O F B O A R D O F D I R E C T O R S
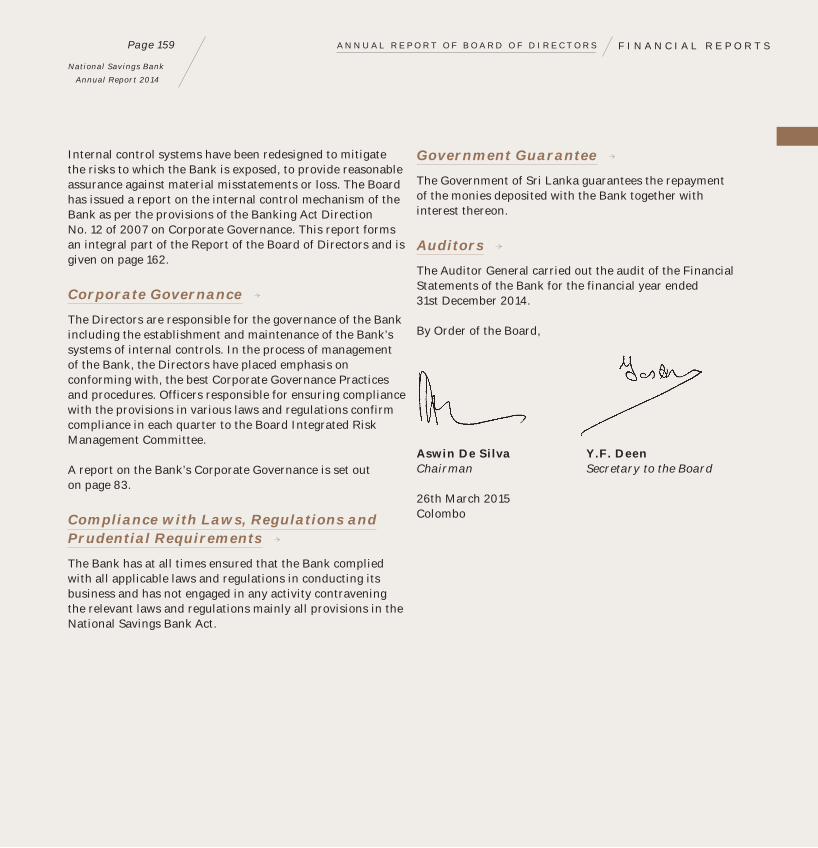
F I N A N C I A L R E P O R T S
National Savings Bank
Annual Report 2014
Page 159
Internal control systems have been redesigned to mitigate the risks to which the Bank is exposed, to provide reasonable assurance against material misstatements or loss. The Board has issued a report on the internal control mechanism of the Bank as per the provisions of the Banking Act Direction No. 12 of 2007 on Corporate Governance. This report forms an integral part of the Report of the Board of Directors and is given on page 162.
Corporate Governance
The Directors are responsible for the governance of the Bank including the establishment and maintenance of the Bank’s systems of internal controls. In the process of management of the Bank, the Directors have placed emphasis on conforming with, the best Corporate Governance Practices and procedures. Officers responsible for ensuring compliance with the provisions in various laws and regulations confirm compliance in each quarter to the Board Integrated Risk Management Committee.
A report on the Bank’s Corporate Governance is set out on page 83.
Compliance with Laws, Regulations and Prudential Requirements
The Bank has at all times ensured that the Bank complied with all applicable laws and regulations in conducting its business and has not engaged in any activity contravening the relevant laws and regulations mainly all provisions in the National Savings Bank Act.
Government Guarantee
The Government of Sri Lanka guarantees the repayment of the monies deposited with the Bank together with interest thereon.
Auditors
The Auditor General carried out the audit of the Financial Statements of the Bank for the financial year ended 31st December 2014.
By Order of the Board,
Aswin De Silva Y.F. DeenChairman Secretary to the Board
26th March 2015Colombo
A N N U A L R E P O R T O F B O A R D O F D I R E C T O R S

F I N A N C I A L R E P O R T S
National Savings Bank
Annual Report 2014
Page 160
The responsibility of the Directors in relation to the Financial Statements of the National Savings Bank (Bank) and Consolidated Financial Statements of the Bank and its subsidiary (Group) is set out in this statement. The Directors of the Bank are responsible for ensuring that the Bank and the Group keep proper books of accounts of all the transactions and prepare Financial Statements in accordance with Generally Accepted Accounting Principles, Sri Lanka Accounting Standards and Sri Lanka Financial Reporting Standards that give a true and fair view of the state of affairs of the Bank and the Group at the end of each financial year in compliance with statutory requirements. The Financial Statements comprise of Statement of Comprehensive Income, Statement of Financial Position, Statement of Changes in Equity, Statement of Cash Flows, Significant Accounting Policies and Notes thereto.
The Directors have ensured the following in preparation of the Financial Statements:
1. The accounting policies adopted to prepare the Financial Statements were appropriate, consistently applied and adequately disclosed.
2. Reasonable and prudent judgments have been made where necessary when preparing the Financial Statements.
3. All applicable accounting standards as relevant have been followed.
As per the provisions of the Finance Act No. 38 of 1971, the Banking Act No. 30 of 1988 and Section 7 (i) of NSB Act No. 30 of 1971, the Board of Directors is required to control and administer the affairs and the business of the Bank. The Board of Directors are also responsible for ensuring
S T A T E M E N T O F D I R E C T O R S
R E S P O N S I B I L I T Y O N
F I N A N C I A L R E P O R T I N G
that proper accounting records which correctly record and explain the Bank’s financial position, with reasonable accuracy at any point of time is determined by the Bank, enabling preparation of the Financial Statements.
The Board of Directors accepts the responsibility for the integrity and objectivity of the Financial Statements presented in this Annual Report. (The Directors confirm that in preparing the Financial Statements exhibited on page 168 to 263) The Financial Statements for the year 2014 prepared and presented in this Annual Report are consistent with the underlying books of accounts and are conformity with the requirements of Sri Lanka Accounting Standards, Sri Lanka Financial Reporting Standards, Sri Lanka Accounting and Auditing Standards Act, Baking Act and the Directions of the Central Bank of Sri Lanka.
The Board of Directors has been responsible for taking reasonable measures and care to safeguard the assets of the Bank and the Group, detect frauds and other irregularities and has also instituted an effective and comprehensive system of internal controls and an effective system of monitoring its effectiveness which includes internal audit. The Directors ensure that the Financial Statements are reviewed by them directly at their regular meetings and also through the Board Audit Committee. The Directors’ Statement on Internal Control is given on page 162 of this Annual Report. External Auditors’ Assurance Report on the Bank’s Internal Control is given on page 164.
The Auditor General has been made available with all records of the Bank including the Financial Statements by the Board of Directors and provided every opportunity to undertake the inspections they considered appropriate all of which

F I N A N C I A L R E P O R T S
National Savings Bank
Annual Report 2014
Page 161
the Auditor General Department has examined and have expressed the Auditor General’s opinion which appears as reported by him on page 167 of this Annual Report.
The Directors confirm that to the best of their knowledge and belief that all taxes payable by the Bank on behalf of and in respect of employees of the Bank and the Group, and all other known statutory dues to the Government and the other relevant regulatory and statutory Authorities which were due and payable by the Bank and the Group as at the Statement of Financial Position date have been paid or where relevant provided for. Further, the Directors have confirmed that after considering the financial position, operating conditions and regulatory and other factors required to be addressed in the ‘Corporate Governance Code’ issued jointly by the ICASL and the SEC, the Bank and the Group have adequate resources to continue in operation for the foreseeable future and to justify the application of the going concern basis in preparing these Financial Statements and the Board has taken all necessary measures to comply with the directives issued by the Central Bank of Sri Lanka.
By Order of the Board,
Y.F. DeenSecretary to the Board
26th March 2015Colombo
S T A T E M E N T O F D I R E C T O R S R E S P O N S I B I L I T Y O N
F I N A N C I A L R E P O R T I N G

F I N A N C I A L R E P O R T S
National Savings Bank
Annual Report 2014
Page 162
The Board of Directors present this Report on Internal Control over Financial Reporting in line with the Banking Act Direction No. 12 of 2007, Section 3 (8) (ii) (b) and it has been prepared based on the guidelines issued by The Institute of Chartered Accountants of Sri Lanka (CA Sri Lanka).
The Board of Directors (Board) is responsible for ensuring that an adequate and effective system of internal control is established and maintained at the National Savings Bank (Bank). However, such a system is designed to manage the Bank’s significant risk areas within the acceptable risk parameters, rather than eliminating the risk of failure to achieve business objectives of the Bank. Accordingly, the system of internal controls can only provide reasonable but not absolute assurance against material misstatement of management and financial information and records or against financial losses or frauds.
The Board of Directors has established an ongoing process for identifying, evaluating and managing the significant risks faced by the Bank and this process includes enhancing the system of internal controls over financial reporting as and when there are changes to business environment or regulatory requirements and other guidelines. The processes are regularly reviewed by the Board and confirmed according to the compliance with the Guidance for Directors of the Banks on the Directors’ Statement on Internal Control issued by CA Sri Lanka. The Board has assessed the internal control system taking into principle the assessment of an internal control system as given in that guidance.
The Board is of the view that the system of internal controls in place is sound and adequate to provide reasonable assurance regarding the reliability of financial reporting and that the preparation of Financial Statements for external purposes is in accordance with relevant accounting principles and regulatory requirements.
The management assists the Board in the implementation of the policies and procedures approved by the Board on risk and control by identifying and assessing the risks faced by the Bank and in the design, operation and monitoring of suitable internal controls to mitigate and control these risks.
The Board has put in place the system of reviewing the adequacy and integrity of system of internal control over financial reporting. The key processes include the following:
The Board Sub-Committees have been established with defined scopes and functions to assist the Board in ensuring the effectiveness of the Bank’s operations and that the Bank’s operations are in accordance with the corporate objectives, strategies & policies and business directions that have been approved.
The Internal Audit Division of the Bank carries out audit of Branches, Divisions and other Units as per the Annual Audit Plan. The frequency of audit is determined by the level of risk assessed. The Audit Plan is reviewed and approved by the Board Audit Committee (BAC) for implementation. The Internal Audit Division carries out audit checks to ensure compliance with policies & procedures and the effectiveness of the internal control systems and reports its findings in respect of any non-compliance. Audits are carried out to provide an independent and objective report on operational and management activities. The findings of the audits are submitted to the BAC for review at their periodic meetings.
The BAC reviews periodically the internal control issues identified by the Internal Audit Division of the Bank, the External Auditors, Regulatory Authorities and the management and also evaluates the adequacy and effectiveness of the risk management and internal control systems. The BAC reviews the internal audit function with particular emphasis on the scope of audits and quality of the same. The Superintendent of the Government Audit
D I R E C T O R S ’ S T A T E M E N T
O N I N T E R N A L C O N T R O L O V E R
F I N A N C I A L R E P O R T I N G

F I N A N C I A L R E P O R T S
National Savings Bank
Annual Report 2014
Page 163
is generally invited to BAC meetings. The minutes of BAC meetings are forwarded to the Board on a periodic basis. The activities attended to by the BAC during the year 2014 are set out in the Board Audit Committee Report appearing on page 109 of this Annual Report.
of the Bank continued to review and update all procedures
and disclosures of the Financial Statements of the Bank. The Internal Audit Division of the Bank continues to verify the suitability of design and effectiveness of these procedures and controls on an ongoing basis. The assessment covered only the process applied by the Bank and did not include the processes carried out by its Subsidiary.
Confirmation
Based on the above processes, the Board confirms that the financial reporting system of the Bank has been designed to provide reasonable assurance regarding the reliability of financial reporting and the preparation of Financial Statements for external purposes has been done in accordance with Sri Lanka Accounting Standards and Sri Lanka Financial Reporting Standards and regulatory requirements of the Central Bank of Sri Lanka.
Review of the Statement by the External Auditors
The External Auditors have reviewed the above Directors’ Statement on Internal Controls for the year ended 31st December 2014 and reported to the Board that nothing has come to their attention that causes them to believe that the statement is inconsistent with their understanding of the process adopted by the Board in the review of the design and effectiveness of the internal control system of the Bank.
By Order of the Board,
Aswin De SilvaChairman
D.L.P.R. AbeyaratneDirector
Bradley EmersonChairman - Board Audit Committee/Director
30th April 2015Colombo
D I R E C T O R S ’ S T A T E M E N T O N I N T E R N A L C O N T R O L
O V E R F I N A N C I A L R E P O R T I N G

F I N A N C I A L R E P O R T S
National Savings Bank
Annual Report 2014
Page 164
The Chairman,
National Savings Bank,
Assurance Report of the Auditor General to the Board of Directors on the Directors’ Statement on Internal Control of National Savings Bank
Introduction
This report is to provide assurance on the Directors’ Statement on Internal Control (“Statement”) of National Savings Bank included in the annual report for the year ended 31 December 2014.
Management’s Responsibility
Management is responsible for the preparation and presentation of the statement in accordance with the “Guidance for Directors of Banks on the Directors’ Statement on Internal Control” issued in compliance with the Section 3 (8) (ii) (b) of the Banking Act Direction No. 11 of 2007, by the Institute of Chartered Accountants of Sri Lanka.
My Responsibility and Compliance with SLSAE 3050
My responsibility is to issue a report to the Board of Directors on the statement based on the work performed. I conducted my engagement in accordance with Sri Lanka Standard on Assurance Engagements SLSAE 3050 - Assurance Report for Banks on Directors’ Statement on Internal Control issued by the Institute of Chartered Accountants of Sri Lanka.
Summary of Work Performed
My engagement has been conducted to assess whether the statement is both supported by the documentation prepared by or for Directors and appropriately reflects the process the Directors have adopted in reviewing the system of internal control for the Bank.
The procedures performed are limited primarily to inquiries of bank personnel and the existence of documentation on a sample basis that supports the process adopted by the Board of Directors.
SLSAE 3050 does not require me to consider whether the Statement covers all risks and controls, or to form an opinion on the effectiveness of the Bank’s risk and control procedures. SLSAE 3050 also does not require me to consider whether the processes described to deal with material internal control aspects of any significant problems disclosed in the annual report will, in fact, remedy the problems.
My Conclusion
Based on the procedures performed, nothing has come to my attention that causes me to believe that the Statement included in the annual report is inconsistent with my understanding of the process the Board of Directors has adopted in the review of the design and effectiveness of internal control over financial reporting of the Bank.
W.P.C. WickramaratneAuditor General (Acting)
I N D E P E N D E N T A S S U R A N C E R E P O R T O N
I N T E R N A L C O N T R O L S

F I N A N C I A L R E P O R T S
National Savings Bank
Annual Report 2014
Page 165
The Financial Statements of the National Savings Bank and the Consolidated Financial Statements of the Bank and its Subsidiary (Group) as at 31st December 2014, are prepared and presented in conformity with the requirements of the following:
National Savings Bank Act No. 30 of 1971 and amendments thereto.
Finance Act No. 38 of 1971. Sri Lanka Accounting Standards and Sri Lanka Financial Reporting Standards issued by The Institute of Chartered Accountants of Sri Lanka.
Sri Lanka Accounting and Auditing Standards Act No. 15 of 1995.
Banking Act No. 30 of 1988 and amendments thereto and Directions and Guidelines issued by Central Bank of Sri Lanka.
Code of Best Practice on Corporate Governance issued by The Institute of Chartered Accountants of Sri Lanka.
The formats used in the preparation of the Financial Statements and disclosures made, comply with the specified formats prescribed by the Central Bank of Sri Lanka which are also in compliance with the disclosure requirements of the Sri Lanka Accounting Standard 1 (LKAS 1) - ‘Presentation of Financial Statements’. The Group presents the financial results to its users on a quarterly basis.
The Significant Accounting Policies have been consistently applied by the Group. Application of Significant Accounting Policies and estimates that involved a high degree of judgment and complexity were discussed with the Bank’s External Auditors and the Board Audit Committee. Comparative information has been reclassified wherever necessary to comply with the current presentation and material departures, if any, have been disclosed and explained. We confirm that to the best of our knowledge, the Financial Statements, Significant Accounting Policies and other financial information included in this Annual
Report, fairly present in all material aspects of the financial condition, results of the operations and the cash flows of the Group during the period under review. We also confirm that the Group has adequate resources to continue in operation and has applied the going concern basis in preparing these Financial Statements.
We are responsible for establishing, implementing and maintaining Internal Controls and Procedures of the Bank and its Subsidiary. We ensure that effective Internal Controls and Procedures are in place ensuring material information relating to the Group is made known to us for safeguarding assets, preventing and detecting fraud and/or error as well as other irregularities, which are reviewed, evaluated and updated on an ongoing basis. We are satisfied that there were no significant deficiencies and weaknesses in the design or operation of the Internal Controls and Procedures, to the best of our knowledge. We confirm, based on our evaluations, that there were no significant deficiencies and material weaknesses in the design or operation of internal controls and fraud that involved management or other employees. The Bank’s Internal Audit Division also conducts periodic reviews to ensure that the Internal Controls and Procedures are consistently followed.
The Financial Statements of the Bank and its Subsidiary were audited by the Auditor General and Messrs Ernst & Young, Chartered Accountants respectively. The Auditor General’s Report on the Bank’s Consolidated Financial Statements is given on page 167 of this Annual Report.
The Bank’s Board Audit Committee, inter alia, reviewed all Internal Audit and Inspection Programmes, the efficiency of Internal Control Systems and Procedures and also reviewed the Significant Accounting Policies and their adherence to statutory and regulatory requirements, the details of which are given in the Board Audit Committee Report on pages 109 to 111 of this Annual Report. To ensure complete
G E N E R A L M A N A G E R / C E O ’ S A N D
D E P U T Y G E N E R A L M A N A G E R ’ S
( F I N A N C E & P L A N N I N G ) S T A T E M E N T
O F R E S P O N S I B I L I T Y

F I N A N C I A L R E P O R T S
National Savings Bank
Annual Report 2014
Page 166
independence, the Auditor General and the Internal Auditors have full and free access to the members of the Board Audit Committee to discuss any matter of substance. However, there are inherent limitations that should be recognised in weighing the assurances provided by any system of internal control and accounting.
We confirm that to the best of our knowledge –
The Bank and Group have complied with all applicable laws and regulations and guidelines and there are no material litigations against the Group other than those disclosed in Note 44 on page 234 of the Financial Statements.
All taxes, duties, levies and all statutory payments payable by the Bank and the Group and all contributions, levies and taxes payable on behalf of and in respect of the employees of the Bank and the Group as at 31st December 2014 have been paid, or where relevant, provided for.
S.D.N. Perera K.B. WijeyaratneGeneral Manager/CEO Deputy General Manager (Finance & Planning)
26th March 2015Colombo
G E N E R A L M A N A G E R / C E O ’ S A N D
D E P U T Y G E N E R A L M A N A G E R ’ S ( F I N A N C E & P L A N N I N G )
S T A T E M E N T O F R E S P O N S I B I L I T Y

F I N A N C I A L R E P O R T S
National Savings Bank
Annual Report 2014
Page 167
The Chairman,
National Savings Bank,
Report of the Auditor General on the Financial Statements of the National Savings Bank and its subsidiary for the year ended 31 December 2014 The audit of the financial statements of the National Savings Bank (“Bank”) and the consolidated financial statements of the Bank and its subsidiary (“Group”) for the year ended 31 December 2014 comprising the Statements of Financial Position as at 31 December 2014, the Statement of Comprehensive Income, Statements of Changes in Equity and Cash Flow Statements for the year then ended, and a summary of significant accounting policies and other explanatory information, was carried out under my direction in pursuance of provisions in Article 154(1) of the Constitution of the Democratic Socialist Republic of Sri Lanka. The financial statements of the subsidiary were audited by a firm of Chartered Accountants in public practice appointed by the members of the respective subsidiary.
The Board of Directors (“Board”) is responsible for the preparation and fair presentation of these financial statements in accordance with Sri Lanka Accounting Standards and for such internal control as Board determines is necessary to enable the preparation of financial statements that are free from material misstatements, whether due to fraud or error.
Auditor’s Responsibility My responsibility is to express an opinion on these financial statements based on my audit. I conducted my audit in accordance with Sri Lanka Auditing Standards consistent with International Standards of Supreme Audit Institutions (ISSAI 1000-1810). Those Standards require that I comply with ethical requirements and plan and perform the audit to obtain reasonable assurance about whether the financial statements are free from material misstatements. An audit involves performing procedures to obtain audit evidence about the amounts and disclosures in the financial statements. The procedures selected depend on the auditor’s judgment, including the assessment of the risk of the material misstatement of the financial statements, whether due to fraud or error. In making those risk assessments, the auditor considers internal control relevant to the Bank’s preparation and fair presentation of the financial statements in order to design audit procedures that are appropriate in the circumstances, but not for the purpose
of expressing an opinion on the effectiveness of the Bank’s internal control. An audit also includes evaluating the appropriateness of Accounting Policies used and the reasonableness of accounting estimates made by Board, as well as evaluating the overall presentation of the financial statements.
I believe that the audit evidence I have obtained is sufficient and appropriate to provide a basis for my audit opinion.
Opinion – Bank In my opinion, the financial statements give a true and fair view of the financial position of the Bank as at 31 December 2014 and its financial performance and its cash flows for the year then ended in accordance with Sri Lanka Accounting Standards.
Opinion – Group
then ended in accordance with Sri Lanka Accounting Standards.
Report on Other Legal and Regulatory Requirement These financial statements had been presented the information required by the Banking Act, No. 30 of 1988 and subsequent amendments thereto.
Report to Parliament My report to Parliament in pursuance of provisions in Article 154 (6) of the Constitution will be tabled in due course.
W.P.C. WickramaratneAuditor General (Acting)
A U D I T O R G E N E R A L ’ S R E P O R T

F I N A N C I A L R E P O R T S
National Savings Bank
Annual Report 2014
Page 168
Bank Group
For the year ended 31st December Notes 2014Rs. ’000
2013Rs. ’000
Change %
2014Rs. ’000
2013Rs. ’000
Change %
Gross income 3 77,890,413 65,573,042 19 78,573,202 66,670,921 18
Interest income 74,022,734 64,247,818 15 74,656,751 65,066,567 15Less: Interest expenses 52,642,488 54,141,176 (3) 52,995,992 54,811,288 (3)
Net interest income 4 21,380,246 10,106,642 112 21,660,759 10,255,279 111Fee and commission income 356,092 228,056 56 356,173 228,142 56Less: Fee and commission expenses 70,056 33,016 112 72,035 34,124 111
Net fee and commission income 5 286,036 195,040 47 284,138 194,018 46Net gain/(loss) from trading 6 1,904,725 857,079 122 1,970,243 1,137,997 73Net gain/(loss) from financial instruments designated at fair value through profit or loss 7 – – – – – –Net gain/(loss) from financial investments 8 1,349,348 – 100 1,349,348 – 100Other operating income (net) 9 257,513 240,089 7 240,686 238,215 1
Total operating income 25,177,867 11,398,850 121 25,505,174 11,825,509 116Less: Impairment charge for loans and other losses 10 3,475,695 1,380,003 152 3,475,695 1,380,003 152
Net operating income 21,702,172 10,018,847 117 22,029,479 10,445,506 111Less: Expenses Personnel expenses 11 4,797,371 4,208,706 14 4,813,983 4,224,196 14Other expenses 12 4,396,971 2,906,932 51 4,369,365 2,879,603 52
Operating profit before value added tax (VAT) and nation building tax (NBT) 12,507,830 2,903,209 331 12,846,131 3,341,707 284Less: Value added tax on financial services 1,744,872 624,445 179 1,784,099 672,464 165 Nation building tax on financial services 290,812 – 100 298,134 – 100
Operating profit after value added tax (VAT) and nation building tax (NBT) 10,472,146 2,278,764 360 10,763,898 2,669,243 303
Profit before income tax 10,472,146 2,278,764 360 10,763,898 2,669,243 303Less: Income tax expenses 13 3,605,541 1,094,954 229 3,710,276 1,141,437 225
Profit for the year 6,866,605 1,183,810 480 7,053,622 1,527,806 362
Profit attributable to:Equity holders of the Bank 6,866,605 1,183,810 480 7,053,622 1,527,806 362
Profit for the year 6,866,605 1,183,810 480 7,053,622 1,527,806 362Earnings per share on profit Basic earnings per ordinary share (Rs.) 14 21.46 3.70 480 21.06 4.56 362Diluted earnings per ordinary share (Rs.) 21.46 3.70 480 21.06 4.56 362
S T A T E M E N T O F
C O M P R E H E N S I V E I N C O M E
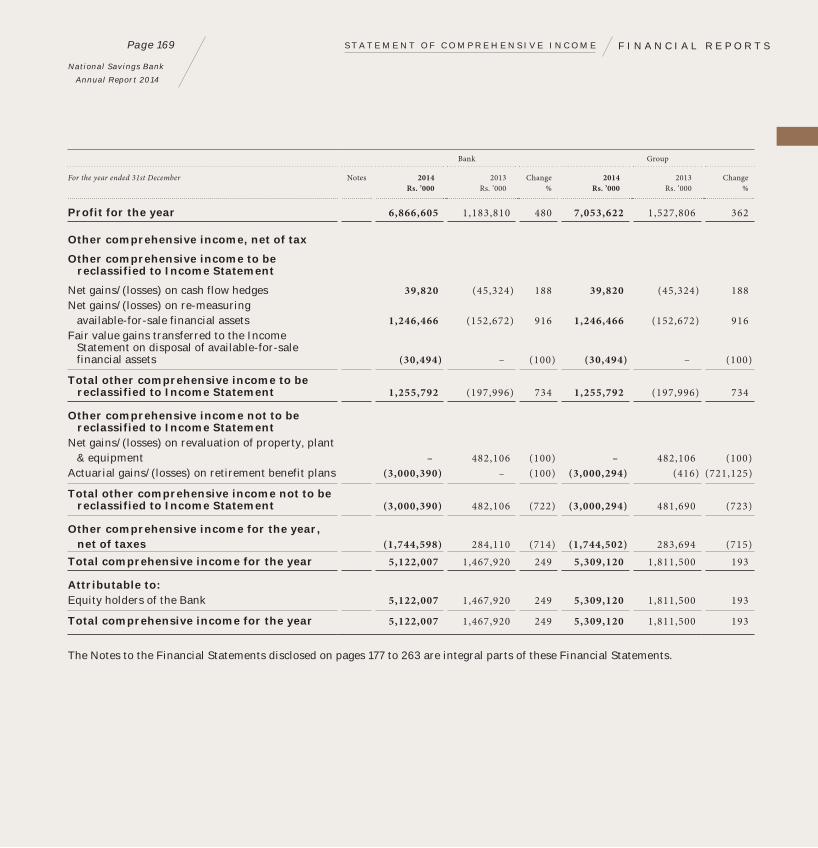
F I N A N C I A L R E P O R T S
National Savings Bank
Annual Report 2014
Page 169 S T A T E M E N T O F C O M P R E H E N S I V E I N C O M E
Bank Group
For the year ended 31st December Notes 2014Rs. ’000
2013Rs. ’000
Change %
2014Rs. ’000
2013Rs. ’000
Change %
Profit for the year 6,866,605 1,183,810 480 7,053,622 1,527,806 362
Other comprehensive income, net of tax
Other comprehensive income to be reclassified to Income Statement
Net gains/(losses) on cash flow hedges 39,820 (45,324) 188 39,820 (45,324) 188Net gains/(losses) on re-measuring available-for-sale financial assets 1,246,466 (152,672) 916 1,246,466 (152,672) 916Fair value gains transferred to the Income Statement on disposal of available-for-sale financial assets (30,494) – (100) (30,494) – (100)
Total other comprehensive income to be reclassified to Income Statement 1,255,792 (197,996) 734 1,255,792 (197,996) 734
Other comprehensive income not to be reclassified to Income StatementNet gains/(losses) on revaluation of property, plant & equipment – 482,106 (100) – 482,106 (100)Actuarial gains/(losses) on retirement benefit plans (3,000,390) – (100) (3,000,294) (416) (721,125)
Total other comprehensive income not to be reclassified to Income Statement (3,000,390) 482,106 (722) (3,000,294) 481,690 (723)
Other comprehensive income for the year, net of taxes (1,744,598) 284,110 (714) (1,744,502) 283,694 (715)Total comprehensive income for the year 5,122,007 1,467,920 249 5,309,120 1,811,500 193
Attributable to:Equity holders of the Bank 5,122,007 1,467,920 249 5,309,120 1,811,500 193
Total comprehensive income for the year 5,122,007 1,467,920 249 5,309,120 1,811,500 193
The Notes to the Financial Statements disclosed on pages 177 to 263 are integral parts of these Financial Statements.

F I N A N C I A L R E P O R T S
National Savings Bank
Annual Report 2014
Page 170
Bank Group
As at 31st December Note 2014Rs. ’000
2013Rs. ’000
Change %
2014Rs. ’000
2013Rs. ’000
Change %
AssetsCash and cash equivalents 16 1,926,594 1,546,221 25 1,930,527 1,557,267 24Balances with central banks 17 – – – 167 203 (18)Placements with banks 18 9,645,621 11,298,360 (15) 9,645,621 11,298,360 (15)Derivative financial instruments 19 2,879,931 5,118,615 (44) 2,879,931 5,118,615 (44)Other financial assets held-for-trading 20 7,431,458 13,808,239 (46) 11,555,186 18,111,911 (36)Financial assets designated at fair value through profit or loss 21 – – – – – –Loans and receivables to banks 22 6,534,102 7,550,509 (13) 6,534,102 7,849,969 (17)Loans and receivables to other customers 23 216,162,152 158,869,826 36 216,164,238 158,871,926 36Financial investments – Available-for-sale 24 4,036,955 2,926,082 38 4,037,955 2,927,082 38Financial investments – Held-to-maturity 25 510,341,337 432,465,113 18 513,709,164 435,959,845 18Investments in subsidiaries 26 150,000 150,000 – – – –Property, plant & equipment 27 5,529,743 5,610,413 (1) 5,530,622 5,611,100 (1)Intangible assets 28 64,652 81,803 (21) 64,659 81,888 (21)Deferred tax assets 29 – – – 668 568 18Other assets 30 14,763,764 14,942,811 (1) 14,791,687 14,957,063 (1)
Total assets 779,466,309 654,367,993 19 786,844,527 662,345,797 19
LiabilitiesDue to banks 31 90,150 126,989 (29) 694,869 4,118,522 (83)Due to other customers 32 554,060,312 501,889,688 10 554,060,312 501,889,688 10Other borrowings 33 191,102,124 120,433,536 59 196,008,232 122,790,093 60Current tax liabilities – – – 86,575 33,205 161Deferred tax liabilities 29 269,754 143,450 88 269,754 143,450 88Other liabilities 34 10,683,745 9,556,844 12 10,699,769 9,574,014 12
Total liabilities 756,206,086 632,150,506 20 761,819,512 638,548,971 19
EquityStated capital/Assigned capital 35 3,200,000 3,200,000 – 3,200,000 3,200,000 –Statutory reserve fund 36 1,874,135 1,736,803 8 1,874,135 1,736,803 8Other reserves 37 18,186,088 17,280,684 5 19,950,880 18,860,023 6
Total equity of the owners of the parent 23,260,223 22,217,487 5 25,025,015 23,796,826 5
Total equity 23,260,223 22,217,487 5 25,025,015 23,796,826 5
Total equity and liabilities 779,466,309 654,367,993 19 786,844,527 662,345,797 19
Contingent liabilities and commitments 38 59,444,638 69,590,143 (15) 59,444,638 69,590,143 (15)
S T A T E M E N T O F F I N A N C I A L P O S I T I O N
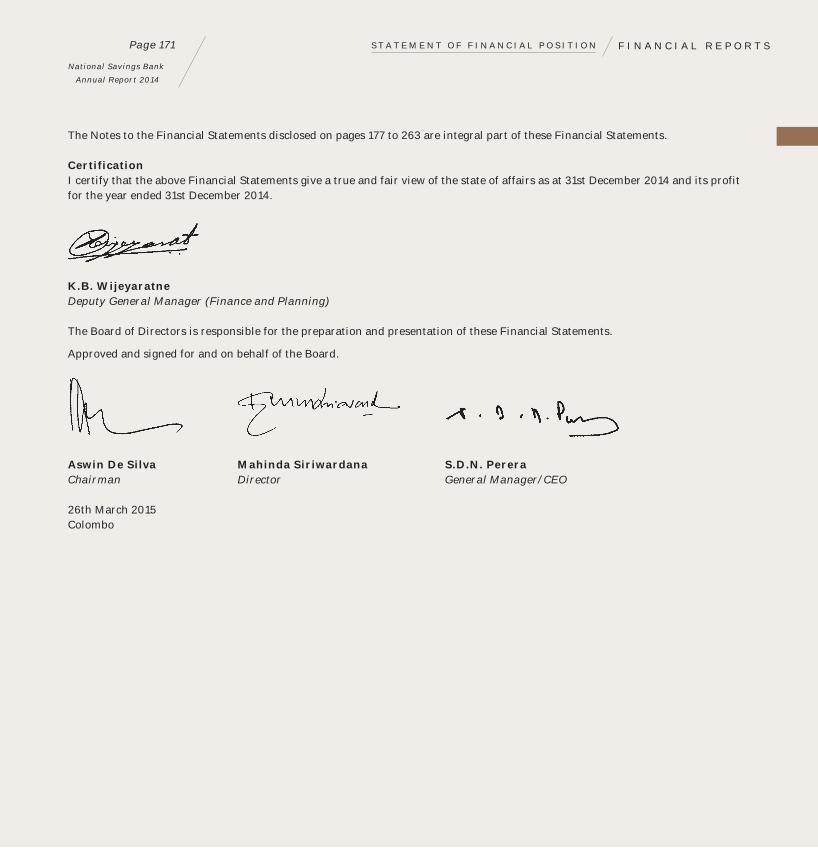
F I N A N C I A L R E P O R T S
National Savings Bank
Annual Report 2014
Page 171
The Notes to the Financial Statements disclosed on pages 177 to 263 are integral part of these Financial Statements.
CertificationI certify that the above Financial Statements give a true and fair view of the state of affairs as at 31st December 2014 and its profit for the year ended 31st December 2014.
K.B. WijeyaratneDeputy General Manager (Finance and Planning)
The Board of Directors is responsible for the preparation and presentation of these Financial Statements.
Approved and signed for and on behalf of the Board.
Aswin De Silva Mahinda Siriwardana S.D.N. PereraChairman Director General Manager/CEO
26th March 2015Colombo
S T A T E M E N T O F F I N A N C I A L P O S I T I O N

F I N A N C I A L R E P O R T S
National Savings Bank
Annual Report 2014
Page 172
Bank
Stated capital/ Assigned capital
Rs. ’000
Statutory reserve fund
Rs. ’000
Revaluation reserve
Rs. ’000
Balance as at 1st January 2013 3,200,000 1,713,127 1,583,340 Profit for the year 2013 – – – Other comprehensive income (net of tax) – – 482,106
Total comprehensive income for the year – – 482,106
Transaction with equity holders, recognised directly in equityTransfers to reserves during the period – 23,676 – Contribution to consolidated fund/dividend – – – Contribution to national insurance trust fund – – – Unclaimed deposit reserve – – –
Total transactions with equity holders – 23,676 –
Balance as at 31st December 2013 3,200,000 1,736,803 2,065,446
Profit for the year 2014 – – – Other comprehensive income (net of tax) – – –
Total comprehensive income for the year – – –
Transaction with equity holders, recognised directly in equityTransfers to reserves during the period – 137,332 – Contribution to consolidated fund/dividend – – – Contribution to national insurance trust fund – – – Unclaimed deposit reserve – – –
Total transactions with equity holders – 137,332 –
Balance as at 31st December 2014 3,200,000 1,874,135 2,065,446
S T A T E M E N T O F C H A N G E S I N E Q U I T Y

F I N A N C I A L R E P O R T S
National Savings Bank
Annual Report 2014
Page 173
Available-for-sale reserve
Rs. ’000
Cash flow hedging reserve
Rs. ’000
Other reserves
Rs. ’000
Retained earnings
Rs. ’000
Total equity
Rs. ’000
136,119 – 17,134,512 – 23,767,098 – – – 1,183,810 1,183,810
(152,672) (45,324) – – 284,110
(152,672) (45,324) – 1,183,810 1,467,920
– – (1,851,707) 1,828,028 – – – – (3,000,000) (3,000,000) – – – (11,838) (11,838) – – (5,693) – (5,693)
– – (1,857,400) (1,183,810) (3,017,531)
(16,553) (45,324) 15,277,112 – 22,217,487
– – – 6,866,605 6,866,605 1,215,972 39,820 – (3,000,390) (1,744,598)
1,215,972 39,820 – 3,866,215 5,122,007
– – (339,783) 202,451 – – – – (4,000,000) (4,000,000) – – – (68,666) (68,666) – – (10,606) – (10,606)
– – (350,389) (3,866,215) (4,079,272)
1,199,419 (5,504) 14,926,723 – 23,260,223
S T A T E M E N T O F C H A N G E S I N E Q U I T Y

F I N A N C I A L R E P O R T S
National Savings Bank
Annual Report 2014
Page 174
Group
Stated capital/ Assigned capital
Rs. ’000
Statutory reserve fund
Rs. ’000
Revaluation reserve
Rs. ’000
Balance as at 1st January 2013 3,200,000 1,713,127 1,583,340 Profit for the year 2013 – – – Other comprehensive income (net of tax) – – 482,106
Total comprehensive income for the year – – 482,106
Transaction with equity holders, recognised directly in equityTransfers to reserves during the period – 23,676 – Contribution to consolidated fund/dividend – – – Contribution to national insurance trust fund – – – Unclaimed deposit reserve – – –
Total transactions with equity holders – 23,676 –
Balance as at 31st December 2013 3,200,000 1,736,803 2,065,446 – – –
Profit for the year 2014 – – – Other comprehensive income (net of tax) – – –
Total comprehensive income for the year – – –
Transaction with equity holders, recognised directly in equityTransfers to reserves during the period – 137,332 – Contribution to consolidated fund/dividend – – – Contribution to national insurance trust fund – – – Unclaimed deposit reserve – – –
Total transactions with equity holders – 137,332 –
Balance as at 31st December 2014 3,200,000 1,874,135 2,065,446
The Notes to the Financial Statements disclosed on pages 177 to 263 are integral parts of these Financial Statements.
S T A T E M E N T O F C H A N G E S I N E Q U I T Y

F I N A N C I A L R E P O R T S
National Savings Bank
Annual Report 2014
Page 175
Available-for-sale reserve
Rs. ’000
Cash flow hedging reserve
Rs. ’000
Other reserves
Rs. ’000
Retained earnings
Rs. ’000
Total equity
Rs. ’000
136,119 – 18,370,271 – 25,002,857 – – – 1,527,806 1,527,806
(152,672) (45,324) – (416) 283,694
(152,672) (45,324) – 1,527,390 1,811,500
– – (1,508,124) 1,484,448 – – – – (3,000,000) (3,000,000) – – – (11,838) (11,838) – – (5,693) – (5,693)
– – (1,513,817) (1,527,390) (3,017,531)
(16,553) (45,324) 16,856,453 – 23,796,826
– – – 7,053,622 7,053,622 1,215,972 39,820 – (3,000,294) (1,744,502)
1,215,972 39,820 – 4,053,328 5,309,120
– – (154,331) 16,999 – – – – (4,001,661) (4,001,661) – – – (68,666) (68,666) – – (10,606) – (10,606)
– – (164,937) (4,053,328) (4,080,933)
1,199,419 (5,504) 16,691,515 – 25,025,015
S T A T E M E N T O F C H A N G E S I N E Q U I T Y

F I N A N C I A L R E P O R T S
National Savings Bank
Annual Report 2014
Page 176
Bank Group
For the year ended 31st December Note 2014Rs. ’000
2013Rs. ’000
2014Rs. ’000
2013Rs. ’000
Cash Flow from Operating ActivitiesProfit before tax 10,472,146 2,278,764 10,763,898 2,669,243 Adjustment for:
Non-cash items included in profit before tax 41 1,602,603 1,861,004 1,602,959 1,860,883 Change in operating assets 42 (128,410,932) (141,595,582) (127,818,280) (139,777,863)Change in operating liabilities 43 53,843,200 50,162,185 50,455,238 47,748,316 Placements with banks 1,652,739 (5,324,775) 1,652,739 (5,324,775)Contribution paid to defined benefit plans (575,033) (679,971) (575,033) (679,971)Tax paid (3,479,237) (1,074,842) (3,530,702) (1,141,199)Contribution to national insurance trust fund (39,303) (11,838) (39,303) (11,838)Dividends received from investment in subsidiaries (14,953) –
Net cash used in operating activities (64,948,770) (94,385,055) (67,488,484) (94,657,204)
Cash Flows from Investing ActivitiesPurchase of property, plant & equipment (181,360) (268,407) (181,732) (268,407)Proceeds from the sale of property, plant & equipment 11,408 2,340 11,408 2,340 Net increase in investment in available-for-sale (1,110,873) 147,176 (1,110,873) 147,176 Net purchase of intangible assets (26,128) (12,248) (26,128) (12,248)Decrease in unclaimed reserve fund (10,606) (5,693) (10,606) (5,693)Dividends received from investment in subsidiaries 14,953 –
Net cash used in investing activities (1,302,606) (136,832) (1,317,931) (136,831)
Cash Flow from Financing ActivitiesOther borrowings 70,668,588 97,812,591 73,218,139 98,094,246 Contribution to consolidated fund/dividend (4,000,000) (3,000,000) (4,001,661) (3,000,000)
Net cash from financing activities 66,668,588 94,812,591 69,216,478 95,094,246 Net (decrease)/increase in cash and cash equivalents 417,212 290,704 410,063 300,211 Cash and cash equivalents at the beginning of the year 1,419,232 1,128,528 1,430,481 1,130,270
Cash and cash equivalents at the end of the year 1,836,444 1,419,232 1,840,544 1,430,481
The Notes to the Financial Statements disclosed on pages 177 to 263 are integral parts of these Financial Statements.
S T A T E M E N T O F C A S H F L O W S

F I N A N C I A L R E P O R T S
National Savings Bank
Annual Report 2014
Page 177
1. Corporate Information
Reporting Entity
National Savings Bank (NSB) is a specialised bank incorporated in Sri Lanka. The registered office of the Bank is located at No. 255, ‘Saving House’, Galle Road, Colombo 03, Sri Lanka. The Group Financial Statements for the year ended 31st December 2014 comprise of the Bank (Parent) and its fully-owned Subsidiary, NSB Fund Management Company Ltd.
The staff strength of the Bank as at 31st December 2014 was 3,358. (2013 - 2,943)
The Bank possesses 236 branches, 2,287 school bank units and 260 ATMs of its service outlets and 647 Post Offices and 3,416 Sub-Post Offices as its agency network.
The Bank prepares Financial Statements of the ‘Bank’ and the ‘Group’ for the twelve months period ended 31st December each year to be table in the Parliament.
The Financial Statements for the year ended 31st December 2014 were authorised for issue on 26th March 2015, by a resolution of the Board of Directors.
2. Accounting Policies
2.1 Basis of Preparation
The Consolidated Financial Statements have been prepared on a historical cost basis, except for the following material items:
(i) available-for-sale investments
(ii) derivative financial instruments
(iii) other financial assets and liabilities held-for-trading
(iv) financial assets and liabilities designated at fair value through profit or loss
(v) land and buildings
(vi) liability for employee defined benefits
The Consolidated Financial Statements are presented in Sri Lankan Rupees (Rs.) and all values are rounded to the nearest thousand Rupees, except when otherwise indicated.
2.1.1 Statement of Compliance
The Financial Statements of the Bank and the Group are prepared in accordance with Sri Lanka Accounting Standards (LKASs and SLFRSs) as issued by The Institute of Chartered Accountants of Sri Lanka and presented the information amendments required by the Banking Act No. 30 of 1988 and subsequent amendments thereto.
The formats used in the preparation of the Financial Statements
formats prescribed by the Central Bank of Sri Lanka for the preparation, presentation and publication of Annual Audited Financial Statements of Licensed Specialised Banks.
2.1.2 Presentation of Financial Statements
The Bank and the Group present their Statement of Financial Position broadly in order of liquidity.
2.1.3 Offsetting Financial Instruments
Financial assets and financial liabilities are offset and the net amount reported in the Statement of Financial Position if and only if there is a legally enforceable right to offset the recognised amounts and there is an intention to settle on a net basis, or to realise the assets and settle the liability simultaneously. Income and expenses are not offset in the Income Statement unless required or permitted by any accounting standard or interpretation, and as specifically disclosed in the accounting policies of the Bank.
2.1.4 Basis of Consolidation
The Financial Statements of the Bank and the Group comprise the Financial Statements of the Bank and its Subsidiary for the year ended 31st December 2014.
N O T E S T O T H E F I N A N C I A L
S T A T E M E N T S
F I N A N C I A L R E P O R T S
National Savings Bank
Annual Report 2014
Page 178N O T E S T O T H E F I N A N C I A L S T A T E M E N T S
The Financial Statements of the Bank’s Subsidiary for the purpose of consolidation are prepared for the same reporting period as that of National Savings Bank, using consistent accounting policies.
All intra-group balances, transactions, income and expenses are eliminated in preparing the Consolidated Financial Statements.
The Financial Statements of the Subsidiary is consolidated from the date on which control is transferred to the Bank. The control exists where the Bank has the power to govern the financial and operating policies of an entity so as to obtain benefits from its activities.
2.2 Significant Accounting Judgments, Estimates and Assumptions
In the process of applying the Group’s accounting policies, management has exercised judgement and estimates in determining the amounts recognised in the Financial Statements. The most significant uses of judgements and estimates are as follows:
2.2.1 Going Concern
The management has made an assessment of its ability to continue as a going concern and is satisfied that it has the resources to continue in business for the foreseeable future. Furthermore, management is not aware of any material uncertainties that may cast significant doubt upon the Group’s ability to continue as a going concern. Therefore, the Financial Statements continue to be prepared on the going concern basis.
2.2.2 Fair Value of Financial Instruments
Where the fair value of financial assets and financial liabilities recorded in the Statement of Financial Position cannot be derived from active markets, they are determined using valuation techniques that include the use of mathematical models. The inputs to these models are
derived from observable market data where possible, but where observable market data are not available, judgment is required to establish fair values.
2.2.3 Impairment Losses on Loans and Receivables
The Group reviews its individually significant loans and receivables at each Reporting date to assess whether an impairment loss should be recorded in the Income Statement. In particular, management judgment is required in the estimation of the amount and timing of future cash flows when determining the impairment loss. These estimates are based on assumptions about various factors and actual results may differ, resulting in future changes to the allowance.
Loans and receivables that have been assessed individually and found not to be impaired and all individually insignificant loans and receivables are then assessed collectively, in groups of assets with similar risk characteristics, to determine whether provision should be made due to incurred loss events for which there is objective evidence but whose effects are not yet evident. The collective assessment takes account of data from the loan portfolio (such as levels of arrears, credit utilisation, loan to collateral ratios, etc.) and judgments to the effect of concentrations of risks and economic data (including levels of unemployment, real estate prices indices, country risk and the performance of different individual groups).
2.3 Financial Instruments
2.3.1 Financial Instruments - Initial Recognition, Classification and Subsequent Measurement
(i) Date of recognition
All financial assets and liabilities are initially recognised on the trade date, i.e., the date that the Group becomes a party to the contractual provisions of the instrument.

F I N A N C I A L R E P O R T S
National Savings Bank
Annual Report 2014
Page 179 N O T E S T O T H E F I N A N C I A L S T A T E M E N T S
Note: In maintaining the General Ledger, Government Securities are recognized on the settlement date which falls due after three days from the date of trade. The position is rectified in preparation of the Financial Statements.
(ii) Initial Measurement of Financial Instruments
The classification of financial instruments at initial recognition depends on the purpose and the management’s intention for which the financial instruments were acquired and their characteristics. All financial instruments are measured initially at their fair value plus transaction costs that are directly attributable to the acquisition or issue of the financial instrument, except in the case of financial assets and financial liabilities recorded at fair value through profit or loss.
Transaction costs in relation to financial assets and financial liabilities at fair value through profit or loss are dealt with through profit or loss.
(iii) ‘Day 1’ Profit or Loss
When the transaction price differs from the fair value of other observable current market transactions in the same instrument, or based on a valuation technique whose variables include only data from observable markets, the Group immediately recognises the difference between the transaction price and fair value (a ‘Day 1’ profit or loss) in ‘Interest Income and Personnel Expenses’. In cases where fair value is determined using data which is not observable, the difference between the transaction price and model value is only recognised in the Statement of Comprehensive Income when the inputs become observable, or when the instrument is derecognised. The ‘Day 1 loss’ arising in the case of loans granted to employees at concessionary rates under uniformly applicable schemes is using Effective Interest Rates (EIR) over the remaining service period of the employees or tenure of the loan whichever is shorter.
(iv) Derivatives Recorded at Fair Value Through Profit or Loss
The Group uses derivatives such as interest rate swaps and forward foreign exchange contracts. Derivatives are recorded at fair value and carried as assets when their fair value is positive and as liabilities when their fair value is negative. Changes in the fair value of derivatives are included in ‘Net trading income’.
Cash Flow Hedge
If a hedge of the exposure to variability in cash flow, the effective portion of changes in the fair value of derivatives that are designated and qualify as cash flow hedges is recognised in Other Comprehensive Income within ‘cash flow hedge’ – fair value gains/(losses)’. Any gain or loss in fair value relating to an ineffective portion is recognised immediately in the Income Statement.
The accumulated gains and losses recognised in Other Comprehensive Income are reclassified to the Income Statement in the periods in which the hedged item will affect profit or loss. However, when the forecast transaction that is hedged result in the recognised of a non-financial assets or a non-financial liability, the gains and losses previously recognised in Other Comprehensive Income are removed from equity and included in the initial measurement of the cost of the asset or liability.
When a hedging instrument expires or is sold, or when a hedge no longer meet the criteria for hedge accounting, any cumulative gain or loss recognised in Other Comprehensive Income at that time remains in equity until the forecast transaction is eventually recognised in the Income Statement. When a forecast transaction is no longer expected to occur, the cumulative gain or loss that was recognised in Other Comprehensive Income is immediately reclassified to the Income Statement.

F I N A N C I A L R E P O R T S
National Savings Bank
Annual Report 2014
Page 180N O T E S T O T H E F I N A N C I A L S T A T E M E N T S
2.3.2 Classification and Subsequent Measurement of Financial Instruments
(i) Financial Assets or Financial Liabilities Held-for-Trading
Financial assets or financial liabilities held-for-trading are recorded in the Statement of Financial Position at fair value. Changes in fair value are recognised in ‘Net trading income’. Interest and dividend income or expense are recorded in ‘Net trading income’ according to the terms of the contract, or when the right to the payment has been established.
Included in this classification are Government Securities Held-for-Trading and dealing equity securities.
(ii) Financial Assets and Financial Liabilities Designated at Fair Value Through Profit or Loss (FVTPL)
Financial assets and financial liabilities classified in this category are those that have been designated by management on initial recognition, and designation is determined as per the provisions in LKAS 39 on, ‘Financial Instruments: Recognition and Measurement’ on an instrument by instrument basis.
Financial assets and financial liabilities at fair value through profit or loss are recorded in the Statement of Financial Position at fair value. Changes in fair value are recorded in ‘Net gain or loss on financial assets and liabilities designated at fair value through profit or loss’. Interest is earned or incurred is accrued in ‘Interest income’ or ‘Interest expense’, respectively using the effective interest rate (EIR), while dividend income is recorded in ‘Other operating income’ when the right to the payment has been established.
(iii) Available-for-Sale Financial Investments (AFS)
Available-for-sale investments include equity and debt securities. Equity investments classified as available-for-sale
are those which are neither classified as held-for-trading nor designated at fair value through profit or loss. Debt securities in this category are those which are intended to be held for an indefinite period of time and which may be sold in response to needs for liquidity or in response to changes in the market conditions.
Note: The Group has not designated any loans or receivables as available-for-sale.
After initial measurement, available-for-sale financial investments are subsequently measured at fair value. Equity investments under AFS that do not have quoted market price and whose fair value cannot be reliably measured shall be measured at cost.
Unrealised gains and losses are recognised directly in equity (Other Comprehensive Income) in the ‘Available-for-sale reserve’. When the investment is disposed of, the cumulative gain or loss previously recognised in equity is recognised in the Income Statement in ‘Net gain/(loss) from financial investment’. Where the Group holds more than one investment in the same security they are deemed to be disposed of on a first-in first-out basis. Interest earned whilst holding available-for-sale financial investments is required as interest income using the EIR. Dividends earned whilst holding available-for-sale financial investments are recognised in the Income Statement as ‘Other Operating Income’ when the right of the payment has been established. The losses arising from impairment of such investments are recognised in the Income Statement in ‘Impairment losses on financial investments’ and removed from the ‘Available-for-sale reserve’.
(iv) Held-to-Maturity Financial Investments
Held-to-maturity financial investments are non-derivative financial assets with fixed or determinable payments and fixed maturities, which the Group has the intention and ability to hold to maturity. After initial measurement, held-to-maturity financial investments are subsequently measured at amortised cost using the EIR, less impairment. Amortised

F I N A N C I A L R E P O R T S
National Savings Bank
Annual Report 2014
Page 181 N O T E S T O T H E F I N A N C I A L S T A T E M E N T S
cost is calculated by taking into account any discount or premium on acquisition and fees that are an integral part of the EIR. The amortisation is included in ‘Interest and similar income’ in the Income Statement. The losses arising from impairment of such investments are recognised in the Income Statement line ‘Credit loss expense’.
If the Group were to sell or reclassify more than an insignificant amount of held-to-maturity investments before maturity (other than in certain specific circumstances), the entire category would be tainted and would have to be reclassified as available-for-sale. Furthermore, the Group would be prohibited from classifying any financial asset as held-to-maturity during the following two years.
(v) Due from Banks and Loans and Receivable to Customers
‘Due from banks’ and ‘Loans and receivables to customers’, include non-derivative financial assets with fixed or determinable payments that are not quoted in an active market.
After initial measurement, amounts ‘Due from banks’ and ‘Loans and receivables to customers’ are subsequently measured at amortised cost using the EIR, less allowance for impairment. Amortised cost is calculated by taking into account any discount or premium on acquisition and fees and costs that are an integral part of the EIR. The amortisation is included in ‘Interest and similar income’ in the Income Statement. The losses arising from impairment are recognised in the Income Statement in ‘Credit loss expense’.
(vi) Repurchase and Reverse Repurchase Agreements
Securities sold under agreements to repurchase at a specified future date are not derecognised from the Statement of Financial Position as the Group retains substantially all the risks and rewards of ownership. The corresponding cash received is recognised in the Consolidated Statement of Financial Position as financial liability reflecting as a
loan received by the Group, including accrued interest as a liability within ‘Cash collateral on securities lent and repurchase agreements’, reflecting the transaction’s economic substance. The difference between the sale and repurchase prices is treated as interest expenses and is accrued over the life of agreement using the EIR.
Conversely, securities purchased under agreements to resell at a specified future date are not recognised in the Statement of Financial Position. The consideration paid, including accrued interest, is recorded in the Statement of Financial Position, within ‘Cash collateral on securities borrowed and reverse repurchase agreements’, reflecting the transaction’s economic substance as a loan granted by the Group. The difference between the purchase and resale prices is recorded in ‘Net interest income’ and is accrued over the life of the agreement using the EIR.
(vii) Cash and Cash Equivalents
Cash and cash equivalents as referred to in the Cash Flow Statement comprises cash on hand, non-restricted current accounts with Central Banks and amounts due from banks on demand or with an original maturity of three months or less.
(viii) Due to Banks
These represents overdrafts, call money borrowings and repos by the Subsidiary. Subsequent to initial recognition deposits are measured at their amortised cost using EIR method.
(ix) Due to Other Customers
These include savings deposits and term deposits. Subsequent to initial recognition deposits are measured at their amortised cost using EIR method.
(x) Other Borrowings - Debt Securities Issued
These represent the funds borrowed by the Bank for long-term funding requirement through international bonds (USD denominated). Subsequent to initial recognition debt

F I N A N C I A L R E P O R T S
National Savings Bank
Annual Report 2014
Page 182N O T E S T O T H E F I N A N C I A L S T A T E M E N T S
securities issued are measured at their amortised cost using EIR method. Interest paid/payable is recognised in profit or loss.
Foreign currency denominated debt securities as at the reporting date are translated to the functional currency at the middle exchange rate of the functional currency at that date. Foreign currency differences arising on retranslation at the reporting date are recognised in profit or loss.
The Group reclassifies non-derivative financial assets out of the ‘held-for-trading’ category and into the ‘available-for-sale’, ‘loans and receivables’, or ’held-to-maturity’ categories as permitted by the Sri Lanka Accounting Standard - LKAS 39 ‘Financial Instruments: Recognition and Measurement’. In certain circumstances the Group is also permitted to reclassify financial assets out of the ‘available-for-sale’ category and into the ‘loans and receivables’, ‘held-for-trading’ or ‘held-to-maturity’ category.
Reclassifications are recorded at fair value at the date of reclassification, which becomes the new amortised cost.
For a financial asset with a fixed maturity reclassified out of the ‘available-for-sale’ category, any previous gain or loss on that asset that has been recognised in equity is amortised to profit or loss over the remaining life of the investment using the effective interest rate (EIR). Any difference between the new amortised cost and the expected cash flows is also amortised over the remaining life of the asset using the EIR.
In the case of a financial asset does not have a fixed maturity, the gain or loss is recognised in the profit or loss when such financial asset is sold or disposed of. If the asset is subsequently determined to be impaired, then the amount recorded in equity is recycled to the Income Statement.
The Group may reclassify a non-derivative trading asset out of the ‘held-for-trading’ category and into the ‘loans and receivables’ category if it meets the definition of loans and receivables and the Group has the intention and ability to hold the financial asset for the foreseeable future or until maturity. If a financial asset is reclassified, and if the Group subsequently increases its estimates of future cash receipts as a result of increased recoverability of those cash receipts, the effect of that increase is recognised as an adjustment to the EIR from the date of the change in estimate.
Reclassification is at the election of management, and is determined on an instrument by instrument basis.
The Group does not reclassify any financial instrument into the ‘fair value through profit or loss’ category after initial recognition. Also the Group does not reclassify any financial instrument out of the ‘fair value through profit or loss’ category if upon initial recognition it was designated as at fair value through profit or loss.
2.3.4 Derecognition of Financial Instruments(a) Financial Assets
Financial assets are derecognised when the contractual right to receive cash flows from the assets has expired; or when Group has transferred its contractual right to receive the cash flows of the financial assets and, either:
- substantially all risks and rewards of ownership have been transferred; or
- the Group has transferred its right to receive cash flows from the asset or has assured an obligation to pay the received cash flows in full without material delay to a third party.
(b) Financial Liabilities
Financial liabilities are derecognised when they are extinguished, that is when the obligation is discharged, cancelled or expired.

F I N A N C I A L R E P O R T S
National Savings Bank
Annual Report 2014
Page 183 N O T E S T O T H E F I N A N C I A L S T A T E M E N T S
2.3.5 Impairment of Financial Instruments(i) Impairment of Financial Assets
The Group assesses at each reporting date whether there is any objective evidence that a financial asset or a group of financial assets is impaired. A financial asset or a group of financial assets is deemed to be impaired if, and only if, there is objective evidence of impairment as a result of one or more events that has occurred after the initial recognition of the asset (an incurred ‘loss event’) and that loss event (or events) has a impact on the estimated future cash flows of the financial asset or the group of financial assets that can be reliably estimated.
Objective evidence of impairment includes indications that the borrower or a group of borrowers is experiencing significant financial difficulty, the probability that they will enter bankruptcy or other financial restructuring, default or delinquency in interest or principal payments and also other observable data indicating that there is a measurable decrease in the estimated future cash flows, or economic conditions that correlate with defaults.
In general, the Group considers a decline of 20% to be ‘significant’ and a period of six months to be ‘prolonged’. However, in specific circumstances a smaller decline or a shorter period may be appropriate.
(ii) Impairment of Financial Assets Carried at Amortised Cost
For financial assets carried at amortised cost (such as amounts due from banks, loans and receivable to customers as well as held-to-maturity investments), the Group first assesses individually whether objective evidence of impairment exists for financial assets that are individually significant, or collectively for financial assets that are not individually significant. If the Group determines that no objective evidence of impairment exists for an individually assessed financial asset, it includes the asset in a group of financial assets with similar credit risk characteristics
and collectively assesses them for impairment. Assets that are individually assessed for impairment and for which an impairment loss is, or continues to be, recognised are not included in a collective assessment of impairment.
If there is objective evidence that an impairment loss has been incurred, the amount of the loss is measured as the difference between the assets’ carrying amount and the present value of estimated future cash flows (excluding future expected credit losses that have not yet been incurred). The carrying amount of the asset is reduced through the use of a provision account and the amount of the loss is recognised in the Income Statement. Interest income continues to be accrued on the reduced carrying amount at the rate of interest used to discount the future cash flows for the purpose of measuring the impairment loss. The interest income is recorded as part of ‘Interest and similar income’. Loans together with the associated allowance are written off when there is no realistic prospect of future recovery and all collateral has been realised or has been transferred to the Group. If, in a subsequent year, the amount of the estimated impairment loss increased or decreased because of an event occurring after the impairment was recognised, the previously recognised impairment loss is increased or reduced by adjusting the allowance account. If a future write-off is later recovered, the recovery is credited to the ‘Credit loss expense’.
The present value of the estimated future cash flows is discounted at the financial asset’s original EIR. If a loan has a variable interest rate, the discount rate for measuring any impairment loss is the current EIR. If the Group has reclassified trading assets to loans and advances, the discount rate for measuring any impairment loss is the new EIR determined at the reclassification date. The calculation of the present value of the estimated future cash flows of a collateralised financial asset reflects the cash flows that may result from foreclosure less costs for obtaining and selling the collateral, whether or not foreclosure is probable.

F I N A N C I A L R E P O R T S
National Savings Bank
Annual Report 2014
Page 184N O T E S T O T H E F I N A N C I A L S T A T E M E N T S
For the purpose of a collective evaluation of impairment, financial assets are grouped on the basis of the Group’s internal credit grading system that considers credit risk characteristics such as asset type, industry, geographical location, collateral type, past due status and other relevant factors.
Future cash flows on a group of financial assets that are collectively evaluated for impairment are estimated on the basis of historical loss experience for assets with credit risk characteristics similar to those in the group. Historical loss experience is adjusted on the basis of current observable data to reflect the effect of current conditions on which the historical loss experience is based and to remove the effect of conditions in the historical period that do not exist currently. Estimates of changes in future cash flows reflect, and are directionally consistent with, changes in related observable data from year to year (such as changes in unemployment rates, property prices, commodity prices, payment status, or other factors that are indicative of incurred losses in the group and their magnitude). The methodology and assumptions used for estimating future cash flows are reviewed regularly to reduce any differences between loss estimates and actual loss experience.
Collateral Valuation
The Group uses collateral where possible to mitigate the risk on financial assets. The collateral comes in various forms such as cash, gold, Government Securities. To the extent possible, the Bank uses active market data for valuing financial assets held as collaterals.
(iii) Available-for-Sale Financial Investments
For available-for-sale financial investments including debt securities, the Group assesses at each reporting date whether there is objective evidence that an investment is impaired.
In the case of debt instruments classified as available-for-sale, the Group assesses individually whether there is objective evidence of impairment based on the same criteria as financial asset carried at amortised cost. However, the amount recorded for impairment is the cumulative loss measured as the difference between the amortised cost and the current fair value, less any impairment loss on that investment previously recognised in the Income Statement. Future interest income is based on the reduced carrying amount and is accrued using the rate of interest used to discount the future cash flows for the purpose of measuring the impairment loss. The interest income is recorded as part of ‘Interest and similar income’. If, in a subsequent period, the fair value of a debt instrument increased and the increase can be objectively related to a credit event occurring after the impairment loss was recognised in the Income Statement, the impairment loss is reversed through the Income Statement.
In the case of equity investments classified as available-for-sale, objective evidence would also include a ‘significant’ or ‘prolonged’ decline in the fair value of the investment below its cost. The Group treats ‘significant’ generally as 20% and ‘prolonged’ generally as greater than six months. Where there is evidence of impairment, the cumulative loss measured as the difference between the acquisition cost and the current fair value, less any impairment loss on that investment previously recognised in the Other Comprehensive Income is removed from equity and recognised in the Income Statement. Impairment losses on equity investments are not reversed through the Income Statement; increases in the fair value after impairment are recognised in Other Comprehensive Income.
(iv) Renegotiated Loans
Where possible, the Bank seeks to restructure loans rather than to take possession of collateral. This may involve extending the payment arrangements and the agreement of new loan conditions. Once the terms have been renegotiated any impairment is measured using the original EIR as calculated before the modification of terms and the loan is no

F I N A N C I A L R E P O R T S
National Savings Bank
Annual Report 2014
Page 185 N O T E S T O T H E F I N A N C I A L S T A T E M E N T S
longer considered past due. Management continually reviews renegotiated loans to ensure that all criteria are met and that future payments are likely to occur. The loans continue to be subject to an individual or collective impairment assessment, calculated using the loan’s original EIR.
2.3.6 Recognition of Income and Expenses for Financial Instruments
Revenue is recognised to the extent that it is probable that the economic benefits will flow to the Bank and the revenue can be reliably measured. The following specific recognition criteria must also be met before revenue is recognised:
(i) Interest and Similar Income and Expense
For all financial instruments measured at amortised cost, interest-bearing financial assets classified as available-for-sale and financial instruments designated at fair value through profit or loss, interest income or expense is recorded using the EIR, which is the rate that exactly discounts estimated future cash payments or receipts through the expected life of the financial instrument or a shorter period, where appropriate, to the net carrying amount of the financial asset or financial liability. The calculation takes into account all contractual terms of the financial instrument (for example, prepayment options) and includes any fees or incremental costs that are directly attributable to the instrument and are an integral part of the EIR, but not future credit losses.
The carrying amount of the financial asset or financial liability is adjusted if the Group revises its estimates of payments or receipts. The adjusted carrying amount is calculated based on the original EIR and the change in carrying amount is recorded as ‘Other operating income’. However, for a reclassified financial asset for which the Bank subsequently increases its estimates of future cash receipts as a result of increased recoverability of those cash receipts, the effect of that increase are recognised as an adjustment to the EIR from the date of the change in estimate.
Once the recorded value of a financial asset or a group of similar financial assets has been reduced due to an impairment loss, interest income continues to be recognised using the rate of interest used to discount the future cash flows for the purpose of measuring the impairment loss.
(ii) Fee and Commission Income
Fees earned for the provision of services and credit-related fees are recognised in the year in which the income is received.
(iii) Net Trading Income
Net trading income includes all gains and losses from changes in fair value and related dividend for financial assets and financial liabilities ‘held-for-trading’ other than interest income.
(iv) Dividend Income
Dividend income is recognised when the Group’s right to receive the payment is established.
2.4 Property, Plant & Equipment (PPE)
Property, Plant & Equipment are recognised if it is probable that future benefits associated with the asset will flow to the Group and cost of the asset can be reliably measured. Property, Plant & Equipment are initially measured at cost including costs directly attributable to the acquisition of the asset.
The Group applies cost model to Property, Plant & Equipment except for freehold land and buildings and records at cost of purchase or construction together with any incidental expenses thereon less accumulated depreciation and any accumulated impairment losses.
The Group applies the revaluation model to the entire class of freehold land and buildings. Such properties are carried at a revalued amount, being their fair value at the date of

F I N A N C I A L R E P O R T S
National Savings Bank
Annual Report 2014
Page 186N O T E S T O T H E F I N A N C I A L S T A T E M E N T S
revaluation less any subsequent accumulated depreciation and subsequent accumulated impairment losses. Freehold land and buildings of the Group are revalued every three years on a roll over basis to ensure that the carrying amounts do not differ materially from the fair values at the reporting date. On revaluation of an asset, any increase in the carrying amount is recognised in Other Comprehensive Income and accumulated in equity, under capital reserve or used to reverse a previous revaluation decrease relating to the same asset, which was charged to Income Statement.
In this circumstance, the increase is recognised as income to the extent of the previous write-down. Any decrease in the carrying amount is recognised as an expense in the Income Statement or debited in the Other Comprehensive Income to the extent of any credit balance existing in the capital reserve in respect of that asset. The decrease recognised in Other Comprehensive Income reduces the amount accumulated in equity under capital reserves. Any balance remaining in the Revaluation Reserve in respect of an asset is transferred directly to Retained Earnings on retirement or disposal of the asset.
Depreciation is recognisted in profit or loss on the straight-line method to write-down the cost of property and equipment to their residual values over their estimated useful lives. Land is not depreciated. Depreciation rates for the identified classes of assets are as follows:
Category of Asset Depreciation Rate Per Annum
Leasehold Property Over the period of leaseFreehold Buildings 2.5% p.a.Office and Sundry Equipment 10% p.a.Motor Vehicles 20% p.a.Computer Hardware and Software 25% p.a.Furniture and Fittings 10% p.a.
The Group provide depreciation of an asset commence from the date when they are available for use to the date of disposal of the asset.
Property, Plant & Equipment are derecognised on disposal or when no future economic benefits are expected from its use. Any gain or loss arising on derecognition of the asset (calculated as the difference between the net disposal proceeds and the carrying amount of the asset) is recognised in ‘Other operating income’ in the Income Statement in the year the asset is derecognised.
2.5 Intangible Assets
The Group’s intangible assets consist of the value of computer software. An intangible asset is recognised only when its cost can be measured reliably and it is probable that the expected future economic benefits that are attributable to it will flow to the Group.
Intangible assets acquired separately are measured on initial recognition at cost. The cost of intangible assets acquired in a business combination is their fair value as at the date of acquisition. Following initial recognition, intangible assets are carried at cost less any accumulated amortisation and any accumulated impairment losses.
The useful lives of intangible assets are assessed to be either finite or indefinite. Intangible assets with finite lives are amortised over the useful economic life. The amortisation period and the amortisation method for an intangible asset with a finite useful life are reviewed at least at each financial year-end. Changes in the expected useful life or the expected pattern of consumption of future economic benefits embodied in the asset are accounted for by changing the amortisation period or method, as appropriate, and they are treated as changes in accounting estimates. The amortisation expense on intangible assets with finite lives is recognised in the Income Statement in the expense category consistent with the function of the intangible asset.
The Group does not posse intangible assets with indefinite useful economic life. The estimated economic life of the Group’s computer software is 4 years (25% per annum).

F I N A N C I A L R E P O R T S
National Savings Bank
Annual Report 2014
Page 187 N O T E S T O T H E F I N A N C I A L S T A T E M E N T S
2.6 Impairment of Non-Financial Assets
The Group assess at each reporting date whether there is an indication that an asset other than deferred tax asset, may be impaired. If any indication exists, or when annual impairment testing for an asset is required, the Group estimates the asset’s recoverable amount. Where the carrying amount of an asset exceeds its recoverable amount, the asset is considered impaired and is written down to its recoverable amount.
2.7 Employee Benefits
2.7.1 Defined Benefit Pension Plans
2.7.1.1 Staff Pension Fund - I
The Bank operates a defined benefit pension plan, for the permanent staff members who have joined the Bank prior to 1st October 1995, which requires contributions to be made to a separately administered fund. The cost of providing benefits under the defined benefit pension plan is determined separately for each plan using the Projected Unit Credit actuarial valuation method. Actuarial gains and losses are recognised in the Other Comprehensive Income in the period in which they arise.
The defined benefit asset or liability is calculated as the present value of the defined benefit obligation less past service costs not yet recognised and less the fair value of planned assets out of which the obligations are to be settled directly, less actuarial losses not yet recognised. The value of the defined benefit liability is borne by the Bank and recognised in the profit or loss. The value of any asset is restricted to the sum of any actuarial losses and past service cost not yet recognised and the present value of any economic benefits available in the form of refunds from the plan or reductions in the future contributions to the plan.
The latest actuarial valuation was carried out as of 31st December 2014, by Piyal S. Gunatilleke F.S.A. (USA), Member of the American Academy of Actuaries and Consulting Actuaries.
The principal financial assumptions used in the valuation as at 31st December 2014 are as follows:
Interest/Discount Rate 9.75% p.a.Increase in Cost of Living Allowances 4.50% p.a.Increase in Average Basic Salary 5.50% p.a.
The assets of the fund are held separately from these of the Bank and are independently administrated by the Trustees as per the provisions of the Trust Fund and are subject to annual audit by Independent External Auditors. The Financial Statements as well as the Auditor’s Report are tabled and reviewed by the Board of Trustees. They are also submitted for review of the disclosure of the Bank, as the Bank has an obligation of ensuring that funding is made at optimum levels. Pension is payable monthly as long as the participant is alive.
2.7.1.2 Un-funded Pension Liability
The past service cost not funded is recognised in Other Comprehensive Income immediately upon actuarial valuation. The actuarial valuation as at 31st December 2014 indicated a past service cost deficit of Rs. 4,258 Million which has been provided in full. The details of Unfunded Pension Liability are given in Note No. 34 (a).1.
2.7.1.3 Staff Pension Fund - II
Effective from 2013, a pension scheme has been established for the staff members who have joined the Bank on or after 1st October 1995. The option has been granted to staff members to continue with gratuity entitlement or to join with the new scheme. The Bank monthly contributes 12% of members’ gross salary to the scheme. Rs. 149 Million has been allocated from the profit of 2014 by using an actuary estimate of valuation.

F I N A N C I A L R E P O R T S
National Savings Bank
Annual Report 2014
Page 188N O T E S T O T H E F I N A N C I A L S T A T E M E N T S
2.7.1.4 Widows’/Widowers’ and Orphans’ Pension Fund
Effective from 2013 December, the Bank has established a ‘Widows’/Widowers’ and Orphans’ Pension Scheme for the members of Pension Fund - II. The Bank does not contribute to the Fund while Bank’s employees monthly contribute 5% of their basic salary.
2.7.2 Gratuity
The employees who joined the Bank on or after 1st October 1995 will be eligible for gratuity under the Payment of Gratuity Act No. 12 of 1983, or if opted can join the proposed new pension scheme - II and if so such employees will forfeit their right to gratuity payment.
Other employees whose services are terminated other than by retirement are eligible to receive the terminal gratuity under the Payment of Gratuity Act No. 12 of 1983 at the rate of one-half of the gross salary applicable to the last month of the financial year in which the employment is terminated, for each year of continuous service, for those who have served in excess of 5 years.
The Group makes a monthly provision towards such Gratuity Payment Liabilities and this value is reflected in the Financial Position of the Group. The provision is based on the actuarial valuation. The last actuarial valuation was carried out as of 31st December 2014. The gratuity liabilities are not externally funded.
2.7.3 Post-Employment Medical Benefits
The Bank has a contributory medical assistance scheme for the retired employees. The assets of the plan are held independently of the Bank’s assets and administered by Boards of Trustees/Managers, representing the management and the employees, as provided in the trust deed of the fund.
The Bank contributes to the contributory medical scheme an amount determined by the Management of the Bank
based on actuarial recommendation made from time to time. Accordingly, a sum of Rs. 54 Million has been provided from the profit of 2014.
2.7.4 Defined Contribution Plans
The Group also operates a defined contribution plan. The contribution payable to a defined contribution plan is in proportion to the services rendered to the Bank by the employees and is recorded as an expense under ‘Personnel expenses’. Unpaid contributions are recorded as a liability. The Bank contributes to the following defined contribution plans:
(i) Employees’ Provident Fund
The Bank and employees contribute 12% and 8% respectively of the employee’s monthly gross salary (excluding overtime) to the Provident Fund. The Bank’s Provident Fund is an approved fund under the Employees’ Provident Fund Act. The Bank guarantees 8% p.a. return to the members of the Employees’ Provident Fund.
(ii) Employees’ Trust Fund
The Group contributes 3% of the employee’s monthly gross salary (excluding overtime) to the Employees’ Trust Fund maintained by the Employees’ Trust Fund Board.
2.8 Taxation 2.8.1 Current Taxation
Current tax assets and liabilities consist of amounts expected to be recovered from or paid to the Commissioner General of Inland Revenue in respect of the current as well as prior years. The tax rates and tax laws used to compute the amount are those that are enacted or subsequently enacted at the reporting date. Accordingly, provision for taxation is made on the basis of the profit for the year as adjusted for taxation purpose in accordance with the provision of the Inland Revenue Act No. 10 of 2006 and the amendment thereto, at the rates specified in Note 13 to the Financial Statements.

F I N A N C I A L R E P O R T S
National Savings Bank
Annual Report 2014
Page 189 N O T E S T O T H E F I N A N C I A L S T A T E M E N T S
2.8.2 Deferred Taxation
Deferred tax is provided using the liability method on temporary differences at the reporting date between the tax bases of assets and liabilities and their carrying amounts for financial reporting purpose.
Deferred tax assets are recognised for all deductible differences. Carry forward of unused tax credits and unused tax losses, to the extent that it is probable that taxable profits will be available against which the deductible temporary differences and the carry forward of unused tax credits and unused tax losses can be utilised.
The carrying amount of a deferred tax asset is reviewed at each reporting date and reduced to the extent it is no longer probable that sufficient taxable profit will be available to allow all or part of the deferred tax asset to be utilised. Unrecognised deferred tax assets are reassessed at each reporting date and are recognise to the extent that is probable that future taxable profit will allow the deferred tax asset to be recovered.
Deferred tax assets and liabilities are measured at the tax rate that are expected to apply in the year when the assets are realised or the liabilities are settled, based on tax rates and tax laws that have been enacted or subsequently enacted at the reporting date.
2.8.3 Value Added Tax on Financial Services (VAT)
VAT on financial services is calculated in accordance with Section 25A of Value Added Tax Act No. 14 of 2002 and subsequent amendments thereto.
VAT on financial services is payable at 12% on operating profit before value added tax and nation building tax on financial services adjusted for emoluments of employees and economic depreciation.
2.8.4 Nation Building Tax on Financial Services (NBT)
NBT on financial services is calculated in accordance with Nation Building Tax (Amendment) Act No. 10 of 2014. NBT on financial services is payable at 2% on same base subjected to value added tax on financial services.
2.9 Provisions
Provisions are recognised when the Group has a present obligation (legal or constructive) as a result of a past event, and it is probable that an outflow of resources embodying economic benefits will be required to settle the obligation and a reliable estimate can be made of the amount of the obligation. The expenses relating to any provision is presented in the Income Statement net of any reimbursement.
2.9.1 Provision for Fraudulent Withdrawals
The total value of fraudulent withdrawals identified as at 31st December 2014 was Rs. 26.53 Million. A provision of Rs. 7.02 Million already exists in the account.
2.10 Contingent Liabilities
Where, as a result of past events, there may be an outflow of resources embodying future economic benefits in settlement of a present obligation or a possible obligation whose existence is confirmed only by occurrence or non-occurrence of one or more uncertain future events, a provision is made if there is a present obligation that probably requires an outflow of resources.
2.11 Events After the Reporting Period
The Group updates disclosures relating to any event occurred between the end of the reporting period and the date when the Financial Statements are authorised for issue and provide evidence of the conditions that existed at the end of the reporting period.

F I N A N C I A L R E P O R T S
National Savings Bank
Annual Report 2014
Page 190N O T E S T O T H E F I N A N C I A L S T A T E M E N T S
2.12 Foreign Currency Transactions
Foreign currency transactions are translated into the functional currency, which is Sri Lankan Rupees, using the exchange rates prevailing at the dates of the transactions.
Monetary assets and liabilities denominated in foreign currencies at the reporting date are retranslated to Sri Lankan Rupees at the functional currency rate at the reporting date. All exchange differences arising on the settlement of monetary items or on translating monetary items at rates different to those at which they are initially recorded are recognised in the Income Statement in the period in which they arise.
Non-monetary items that are measured in terms of historical cost in a foreign currency are translated using the exchange rates at the dates of the initial transactions. Non-monetary items measured at fair value in a foreign currency are translated using the exchange rates at the date when the fair value was determined.
The Statement of Financial Position of Foreign Currency Banking Unit is translated to Sri Lankan Rupees at the middle rate of exchange ruling at the reporting date.
2.13 Statement of Cash Flows
The Statement of Cash Flows has been prepared by using the ‘Indirect Method’ of preparing cash flows in accordance with the LKAS 7. Cash and cash equivalents comprise short term, highly liquid investment that is readily convertible to known amounts of cash and are subject to an insignificant risk of changes in value. The cash and cash equivalents include cash in hand, balances with banks and money at call and short notice.
2.14 Directors’ Responsibility Statement
The Board of Directors takes the responsibility for the preparation and presentation of these Financial Statements. Please refer page 160 for the Statement of the Directors’ Responsibility for Financial Reporting.
2.15 Deposit Insurance Scheme
The Bank calculates the insurance premium on eligible deposit base at the rate of 0.10% which is the applicable statutory rate based on capital adequacy ratio of the Bank. The Bank has remitted the applicable premium within a period of 15 days from the end of each quarter as stipulated by the Direction.
2.16 Investment Fund Account (IFA)
As required by the Government Budget 2011, with effect from 1st January 2011 the Bank is required to transfer an amount equivalent to 8% of the profits calculated for the payment of VAT on financial services and 5% of the profit before tax calculated for the payment of income tax to an Investment Fund Account.
The operations of this fund were ceased with effect from 1st October 2014 by Central Bank Direction Ref. No. 08/17/800/0014/02. Accordingly, the amount equivalent to 8% of the profits calculated for the payment of VAT on financial services expires with effect from 1st January 2014. The amount equivalent to 5% of the profit before tax calculated for the payment of income tax expires with effect from 1st April 2014. The balance as at that date was transferred to retained earnings.

F I N A N C I A L R E P O R T S
National Savings Bank
Annual Report 2014
Page 191 N O T E S T O T H E F I N A N C I A L S T A T E M E N T S
2.17 Crop Insurance Levy (CIL)
As per the provisions of the Section 14 of the Finance Act No. 12 of 2013, the CIL was introduced with effect from 1st April 2013 and is payable to the National Insurance Trust Fund. Currently, the CIL is payable at 1% of the profit after tax.
2.18 Accounting Standards Issued But Not Yet Effective as at Reporting Date
The following SLFRSs have been issued by the Institute of Chartered Accountants of Sri Lanka that have an effective date in the future and have not been applied in preparing these Financial Statements. Those SLFRS will have an effect on the accounting policies currently adopted by the Bank and the Group and may have an impact on the future Financial Statements.
Sri Lanka Accounting Standard (SLFRS 9) - ‘Financial Instruments: Classification and Measurement’
SLFRS 9 reflects all phases of the financial instruments project and replaces LKAS 39 - ‘Financial Instruments: Recognition and Measurement’. The standard introduces new requirements for classification and measurement, impairment and hedge accounting. SLFRS 9 is effective for annual periods beginning on or after 1st January 2018, with early application permitted. Retrospective application is required, but comparative information is not compulsory.
The adoption of SLFRS 9 will have an effect on the classification and measurement of the Group’s financial instruments.
Sri Lanka Accounting Standard (SLFRS 14) - ‘Regulatory Deferral Accounts’
The scope of this standard is limited to first-time adopters of SLFRS that already recognise regulatory deferral account balances in their Financial Statements. Consequently, the Financial Statements of rate regulated entities that already apply SLFRS, or that do not otherwise recognise such balances, will not be affected by this standard. This standard is effective for the annual periods beginning on or after 1st January 2016.
Sri Lanka Accounting Standard (SLFRS 15) – ‘Revenue from Contracts with Customers’
SLFRS 15 establishes a comprehensive framework for determining whether, how much and when revenue is recognised. It replaces existing revenue recognition guidance, including Sri Lanka Accounting Standard (LKAS 18) - ‘Revenue’, Sri Lanka Accounting Standard (LKAS 11) - ‘Construction Contracts’ and IFRIC 13 - ‘Customer Loyalty Programmes’. This Standard is effective for the annual periods beginning on or after 1st January 2017.
The Bank and the Group will adopt these Standards when they become effective. Pending the completion of detailed review, the financial impact is not reasonably estimable as at the date of publication of these Financial Statements.
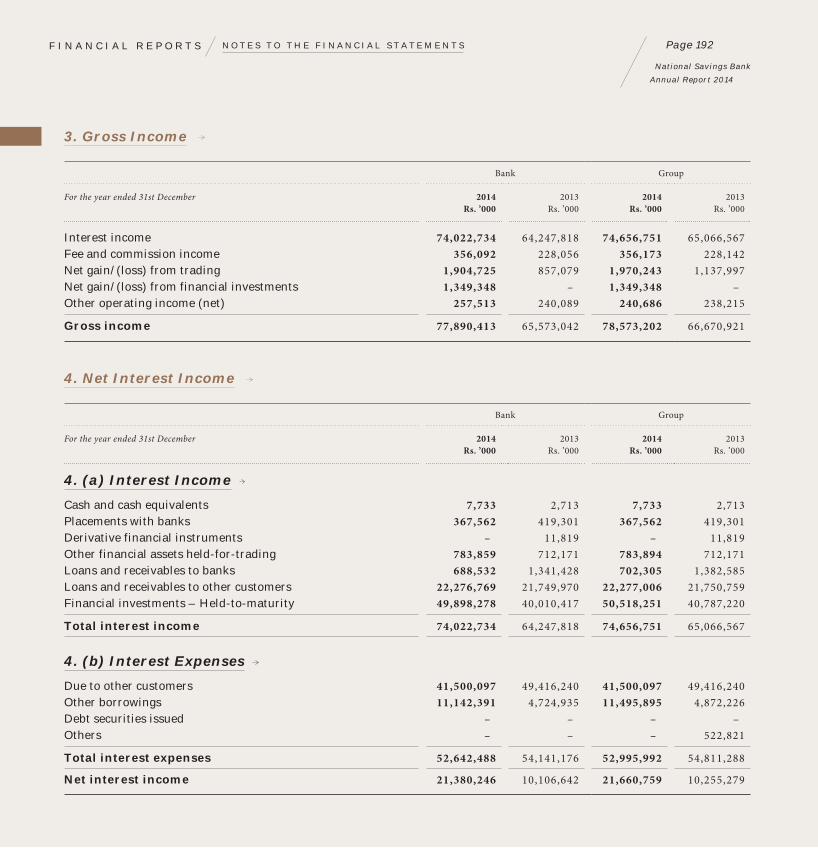
F I N A N C I A L R E P O R T S
National Savings Bank
Annual Report 2014
Page 192N O T E S T O T H E F I N A N C I A L S T A T E M E N T S
3. Gross Income
Bank Group
For the year ended 31st December 2014Rs. ’000
2013Rs. ’000
2014Rs. ’000
2013Rs. ’000
Interest income 74,022,734 64,247,818 74,656,751 65,066,567 Fee and commission income 356,092 228,056 356,173 228,142 Net gain/(loss) from trading 1,904,725 857,079 1,970,243 1,137,997 Net gain/(loss) from financial investments 1,349,348 – 1,349,348 – Other operating income (net) 257,513 240,089 240,686 238,215
Gross income 77,890,413 65,573,042 78,573,202 66,670,921
4. Net Interest Income
Bank Group
For the year ended 31st December 2014Rs. ’000
2013Rs. ’000
2014Rs. ’000
2013Rs. ’000
4. (a) Interest Income
Cash and cash equivalents 7,733 2,713 7,733 2,713 Placements with banks 367,562 419,301 367,562 419,301 Derivative financial instruments – 11,819 – 11,819 Other financial assets held-for-trading 783,859 712,171 783,894 712,171 Loans and receivables to banks 688,532 1,341,428 702,305 1,382,585 Loans and receivables to other customers 22,276,769 21,749,970 22,277,006 21,750,759 Financial investments – Held-to-maturity 49,898,278 40,010,417 50,518,251 40,787,220
Total interest income 74,022,734 64,247,818 74,656,751 65,066,567
4. (b) Interest Expenses
Due to other customers 41,500,097 49,416,240 41,500,097 49,416,240 Other borrowings 11,142,391 4,724,935 11,495,895 4,872,226 Debt securities issued – – – – Others – – – 522,821
Total interest expenses 52,642,488 54,141,176 52,995,992 54,811,288
Net interest income 21,380,246 10,106,642 21,660,759 10,255,279

F I N A N C I A L R E P O R T S
National Savings Bank
Annual Report 2014
Page 193 N O T E S T O T H E F I N A N C I A L S T A T E M E N T S
4. Net Interest Income (Cont.)
Bank Group
For the year ended 31st December 2014Rs. ’000
2013Rs. ’000
2014Rs. ’000
2013Rs. ’000
4. (c) Net Interest Income from Sri Lanka Government Securities
Interest income 50,682,137 40,722,587 51,302,145 41,541,336 (Less): Interest expenses – – 383,512 670,112
Net interest income 50,682,137 40,722,587 50,918,633 40,871,224
4. (d) Notional Tax Credit for Withholding Tax on Government Securities on Secondary Market Transactions
In accordance with the Section 137 of the Inland Revenue Act No. 10 of 2006 and amendment thereto, the Group is entitled to a notional tax credit equivalent to 1/9th of the interest income derived from the market transaction in Government Securities.
Accordingly, the net income earned by the Group from the secondary market transactions in Government Securities, has been grossed up in the Financial Statements and the resulting notional tax credit amounted to Rs. 4,200 Million (2013 - Rs. 3,454 Million) for the Bank and Rs. 4,228 Million (2013 - Rs. 3,469 Million) for the Group.
4. (e) Notional Tax Receivable
The notional tax receivable is given in Note 30 to the Financial Statements after deducting the recoverable amounts.

F I N A N C I A L R E P O R T S
National Savings Bank
Annual Report 2014
Page 194N O T E S T O T H E F I N A N C I A L S T A T E M E N T S
5. Net Fee and Commission Income
Bank Group
For the year ended 31st December 2014Rs. ’000
2013Rs. ’000
2014Rs. ’000
2013Rs. ’000
Fee and commission income 356,092 228,056 356,173 228,142 Fee and commission expenses (70,056) (33,016) (72,035) (34,124)
Net fee and commission income 286,036 195,040 284,138 194,018
Earned fromLoans 283,376 174,554 283,376 174,554 Cards (30,088) (3,346) (30,088) (3,346)Others 32,749 23,832 30,851 22,810
Net fee and commission income 286,036 195,040 284,138 194,018
6. Net Gain/(Loss) from Trading
Bank Group
For the year ended 31st December 2014Rs. ’000
2013Rs. ’000
2014Rs. ’000
2013Rs. ’000
Foreign exchangeFrom banks – – – – From other customers 73,881 79,006 73,881 79,006
Interest rates – mark-to-market gain/(loss) and others 849,034 504,999 914,552 785,917 Equities – mark-to-market gain/(loss) and others 981,810 282,475 981,810 282,475 Others – interest rate swap – (9,401) – (9,401)
Total 1,904,725 857,079 1,970,243 1,137,997

F I N A N C I A L R E P O R T S
National Savings Bank
Annual Report 2014
Page 195 N O T E S T O T H E F I N A N C I A L S T A T E M E N T S
7. Net Gain/(Loss) from Financial Instruments Designated at Fair Value Through Profit or Loss
Bank Group
For the year ended 31st December 2014Rs. ’000
2013Rs. ’000
2014Rs. ’000
2013Rs. ’000
Gains/(Losses) on financial assets designated at fair value through profit or loss – – – –
Total – – – –
8. Net Gain/(Loss) from Financial Investments
Bank Group
For the year ended 31st December 2014Rs. ’000
2013Rs. ’000
2014Rs. ’000
2013Rs. ’000
Assets available-for-saleDebt securities – – – –Equities [Note (a)] 1,349,348 – 1,349,348 –
Others – – – –
Total 1,349,348 – 1,349,348 –
Note (a)The fully-impaired financial investment (Rs. 1,136,500,000/-) in Sri Lankan Airlines Ltd. in 2011 has been recovered in full during 2014.

F I N A N C I A L R E P O R T S
National Savings Bank
Annual Report 2014
Page 196N O T E S T O T H E F I N A N C I A L S T A T E M E N T S
9. Other Operating Income (Net)
Bank Group
For the year ended 31st December 2014Rs. ’000
2013Rs. ’000
2014Rs. ’000
2013Rs. ’000
Gain on sale of property, plant & equipment 9,631 2,119 9,631 2,119 Gain/(Loss) on revaluation of foreign exchange (21,965) 32,059 (21,965) 32,059 Equities - Divided income 173,979 156,313 159,026 156,313 Others 95,869 49,597 93,995 47,723
Other operating income (Net ) 257,513 240,089 240,686 238,215
10. Impairment for Loans and Other Losses
Bank Group
For the year ended 31st December 2014Rs. ’000
2013Rs. ’000
2014Rs. ’000
2013Rs. ’000
Loans and receivablesTo other customers [Refer Note 23 (d)] 3,475,695 1,380,003 3,475,695 1,380,003
Total 3,475,695 1,380,003 3,475,695 1,380,003
11. Personnel Expenses
Bank Group
For the year ended 31st December 2014Rs. ’000
2013Rs. ’000
2014Rs. ’000
2013Rs. ’000
Salary and bonus 3,464,219 3,077,458 3,478,526 3,109,215 Contribution - staff provident fund 258,515 237,093 259,152 237,346 Contribution - Employees’ Trust Fund 64,593 59,328 64,752 59,391 Contribution - staff pension fund 1 [Note 11 (a) and 34 (a).1] 641,919 592,759 642,500 593,325 Contribution - staff pension fund 11 [Note 11.(b)] 149,025 118,274 149,038 118,274 Gratuity on termination of service [Note 34.(a).3] 44,916 19,207 45,346 20,000 Retired Staff Medical Assistance Scheme [Note 34.(a).2] 53,850 – 53,850 – Others 120,334 104,587 120,819 86,645
Total 4,797,371 4,208,706 4,813,983 4,224,196

F I N A N C I A L R E P O R T S
National Savings Bank
Annual Report 2014
Page 197 N O T E S T O T H E F I N A N C I A L S T A T E M E N T S
11. Personnel Expenses (Cont.)
11. (a) Provision for Staff Pension Fund - 1
Bank Group
For the year ended 31st December 2014Rs. ’000
2013Rs. ’000
2014Rs. ’000
2013Rs. ’000
Amount recognised as expense 641,919 592,759 642,500 593,325
Actuarial valuation was carried out by Mr. Piyal S. Goonetilleke, Fellow of Society of Actuaries (USA) of Piyal S. Goonetilleke & Associates, on 31st December 2014. [Refer Note 34. (a)]
11. (b) Provision for Staff Pension Fund - 11
Effective from 2013, a pension scheme has been established for the employees who were recruited on or after 1st October 1995.
12. Other Expenses
Bank Group
For the year ended 31st December 2014Rs. ’000
2013Rs. ’000
2014Rs. ’000
2013Rs. ’000
Directors’ emoluments 1,879 1,301 2,029 1,436 Auditors’ remunerations 3,090 3,942 3,379 4,121 Professional and legal expenses 23,755 13,715 23,755 13,715 Depreciation of property, plant & equipment 253,024 284,163 253,205 284,380 Amortisation of leasehold property 7,228 7,228 7,228 7,228 Amortisation of intangible assets 43,279 42,546 43,357 42,625 Special fees paid to Treasury [Note 30. (a)] 1,333,333 – 1,333,333 – Office administration and establishment expenses 2,286,006 2,128,062 2,257,701 2,100,124 Others 445,376 425,975 445,376 425,975
Total 4,396,971 2,906,932 4,369,365 2,879,603

F I N A N C I A L R E P O R T S
National Savings Bank
Annual Report 2014
Page 198N O T E S T O T H E F I N A N C I A L S T A T E M E N T S
13. Income Tax Expenses
Bank Group
For the year ended 31st December 2014Rs. ’000
2013Rs. ’000
2014Rs. ’000
2013Rs. ’000
Current tax expensesCurrent year tax expenses 3,479,237 1,074,842 3,584,072 1,114,069 Prior years’ (over)/under provision – – – 7,510
Deferred tax expensesTemporary differences [Refer Note 13. (b)] 126,304 20,112 126,204 19,858
Total 3,605,541 1,094,954 3,710,276 1,141,437
Effective tax rate (%) 34.43 48.05 34.47 42.76Effective tax rate (excluding deferred tax) (%) 33.22 47.17 33.30 42.02
13. (a) Reconciliation of Tax Expenses
Profit before tax 10,472,146 2,278,764 10,763,898 2,669,243
Income tax for the period (Accounting profit @ 28%) 2,932,201 638,054 3,013,891 747,388 Add: Tax effect of expenses that are not deductible for tax purposes 2,633,136 1,195,472 2,656,567 1,125,656
(Less): Tax effect of expenses that are deductible for tax purposes 2,086,100 758,684 2,086,386 758,975
Tax expense for the period 3,479,237 1,074,842 3,584,072 1,114,069

F I N A N C I A L R E P O R T S
National Savings Bank
Annual Report 2014
Page 199 N O T E S T O T H E F I N A N C I A L S T A T E M E N T S
13. Income Tax Expenses (Cont.)
13. (b) The Deferred Tax Charge in the Income Statement Comprise of the following
Bank Group
For the year ended 31st December 2014Rs. ’000
2013Rs. ’000
2014Rs. ’000
2013Rs. ’000
Deferred tax assets 37,511 3,870 37,611 4,124 Deferred tax liabilities 163,815 23,982 163,815 23,982
Deferred tax (credit)/charge to Income Statement 126,304 20,112 126,204 19,858
14. Earning Per Share (EPS)
Bank Group
For the year ended 31st December 2014Rs. ’000
2013Rs. ’000
2014Rs. ’000
2013Rs. ’000
Net profit attributable to ordinary equity holders 6,866,605 1,183,810 7,053,622 1,527,806 Adjustment for the effect of dilution – – – – Net profit attributable to ordinary equity holders adjusted for the effect of dilution 6,866,605 1,183,810 7,053,622 1,527,806 Weighted average number of ordinary shares for basic earnings per share 320,000 320,000 335,000 335,000 Weighted average number of ordinary shares adjusted for the effect of dilution 320,000 320,000 335,000 335,000
Basic earnings per ordinary share (Rs.) 21.46 3.70 21.06 4.56
Diluted earnings per ordinary share (Rs.) 21.46 3.70 21.06 4.56
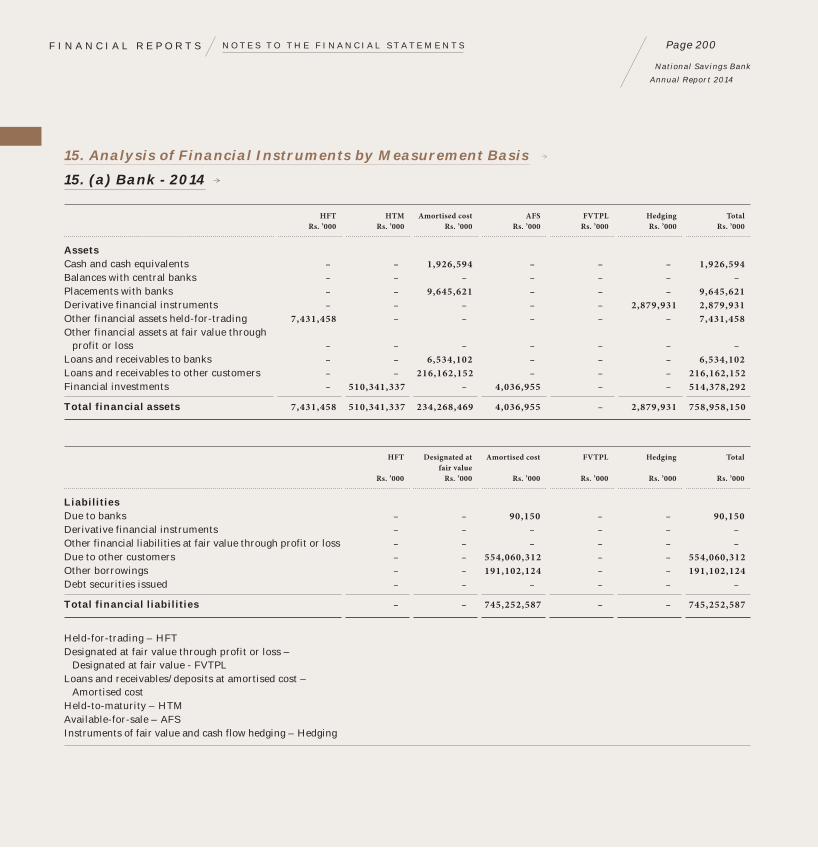
F I N A N C I A L R E P O R T S
National Savings Bank
Annual Report 2014
Page 200N O T E S T O T H E F I N A N C I A L S T A T E M E N T S
15. Analysis of Financial Instruments by Measurement Basis
15. (a) Bank - 2014
HFTRs. ’000
HTMRs. ’000
Amortised costRs. ’000
AFSRs. ’000
FVTPLRs. ’000
HedgingRs. ’000
TotalRs. ’000
AssetsCash and cash equivalents – – 1,926,594 – – – 1,926,594 Balances with central banks – – – – – – – Placements with banks – – 9,645,621 – – – 9,645,621 Derivative financial instruments – – – – – 2,879,931 2,879,931 Other financial assets held-for-trading 7,431,458 – – – – – 7,431,458 Other financial assets at fair value through profit or loss – – – – – – – Loans and receivables to banks – – 6,534,102 – – – 6,534,102 Loans and receivables to other customers – – 216,162,152 – – – 216,162,152 Financial investments – 510,341,337 – 4,036,955 – – 514,378,292
Total financial assets 7,431,458 510,341,337 234,268,469 4,036,955 – 2,879,931 758,958,150
HFT
Rs. ’000
Designated at fair value
Rs. ’000
Amortised cost
Rs. ’000
FVTPL
Rs. ’000
Hedging
Rs. ’000
Total
Rs. ’000
LiabilitiesDue to banks – – 90,150 – – 90,150 Derivative financial instruments – – – – – – Other financial liabilities at fair value through profit or loss – – – – – – Due to other customers – – 554,060,312 – – 554,060,312 Other borrowings – – 191,102,124 – – 191,102,124 Debt securities issued – – – – – –
Total financial liabilities – – 745,252,587 – – 745,252,587
Held-for-trading – HFTDesignated at fair value through profit or loss – Designated at fair value - FVTPLLoans and receivables/deposits at amortised cost – Amortised costHeld-to-maturity – HTMAvailable-for-sale – AFSInstruments of fair value and cash flow hedging – Hedging

F I N A N C I A L R E P O R T S
National Savings Bank
Annual Report 2014
Page 201 N O T E S T O T H E F I N A N C I A L S T A T E M E N T S
15. Analysis of Financial Instruments by Measurement Basis (Cont.)
15. (b) Bank - 2013
HFTRs. ’000
HTMRs. ’000
Amortised costRs. ’000
AFSRs. ’000
FVTPLRs. ’000
HedgingRs. ’000
TotalRs. ’000
AssetsCash and cash equivalents – – 1,546,221 – – – 1,546,221 Balances with central banks – – – – – – – Placements with banks – – 11,298,360 – – – 11,298,360 Derivative financial instruments – – – – – 5,118,615 5,118,615 Other financial assets held-for-trading 13,808,239 – – – – – 13,808,239 Other financial assets at fair value through profit or loss – – – – – – – Loans and receivables to banks – – 7,550,509 – – – 7,550,509 Loans and receivables to other customers – – 158,869,826 – – – 158,869,826 Financial investments – 432,465,113 – 2,926,082 – – 435,391,195
Total financial assets 13,808,239 432,465,113 179,264,916 2,926,082 – 5,118,615 633,582,965
HFT
Rs. ’000
Designated at fair value
Rs. ’000
Amortised cost
Rs. ’000
FVTPL
Rs. ’000
Hedging
Rs. ’000
Total
Rs. ’000
LiabilitiesDue to banks – – 126,989 – – 126,989 Derivative financial instruments – – – – – – Other financial liabilities at fair value through profit or loss – – – – – – Due to other customers – – 501,889,688 – – 501,889,688 Other borrowings – – 120,433,536 – – 120,433,536 Debt securities issued – – – – – –
Total financial liabilities – – 622,450,213 – – 622,450,213

F I N A N C I A L R E P O R T S
National Savings Bank
Annual Report 2014
Page 202N O T E S T O T H E F I N A N C I A L S T A T E M E N T S
15. Analysis of Financial Instruments by Measurement Basis (Cont.)
15. (c) Group - 2014
HFTRs. ’000
HTMRs. ’000
Amortised costRs. ’000
AFSRs. ’000
FVTPLRs. ’000
HedgingRs. ’000
TotalRs. ’000
AssetsCash and cash equivalents – – 1,930,527 – – – 1,930,527 Balances with central banks – – 167 – – – 167 Placements with banks – – 9,645,621 – – – 9,645,621 Derivative financial instruments – – – – – 2,879,931 2,879,931 Other financial assets held-for-trading 11,555,186 – – – – – 11,555,186 Other financial assets at fair value through profit or loss – – – – – – – Loans and receivables to banks – – 6,534,102 – – – 6,534,102 Loans and receivables to other customers – – 216,164,238 – – – 216,164,238 Financial investments – 513,709,164 – 4,037,955 – – 517,747,119
Total financial assets 11,555,186 513,709,164 234,274,656 4,037,955 – 2,879,931 766,456,891
HFT
Rs. ’000
Designated at fair value
Rs. ’000
Amortised cost
Rs. ’000
FVTPL
Rs. ’000
Hedging
Rs. ’000
Total
Rs. ’000
LiabilitiesDue to banks – – 694,869 – – 694,869 Derivative financial instruments – – – – – – Other financial liabilities at fair value through profit or loss – – – – – – Due to other customers – – 554,060,312 – – 554,060,312 Other borrowings – – 196,008,232 – – 196,008,232 Debt securities issued – – – – – –
Total financial liabilities – – 750,763,413 – – 750,763,413
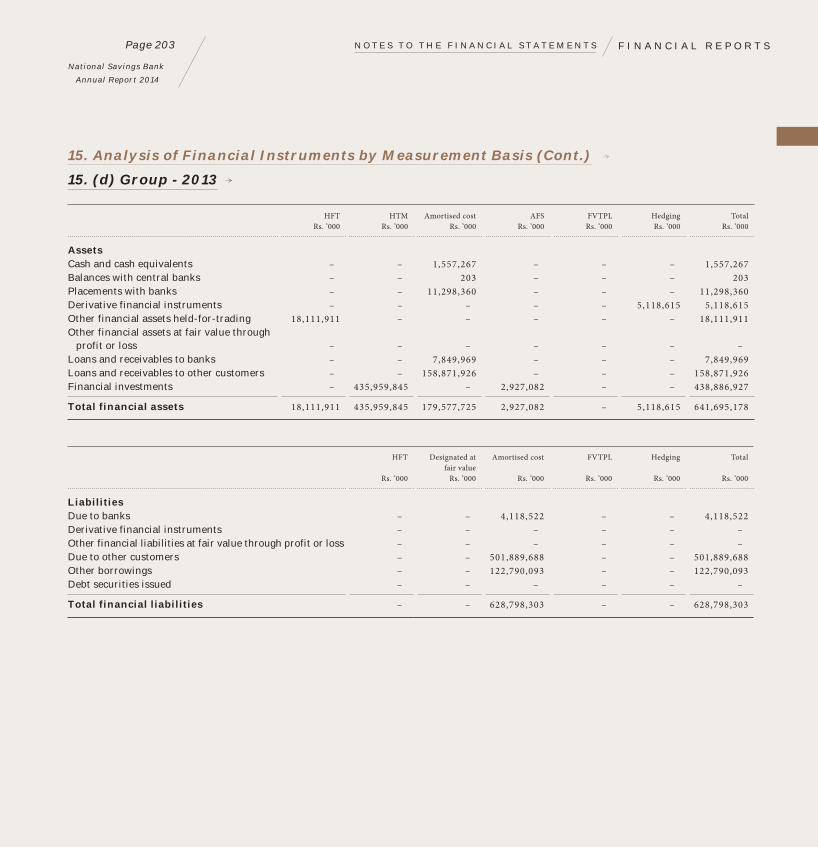
F I N A N C I A L R E P O R T S
National Savings Bank
Annual Report 2014
Page 203 N O T E S T O T H E F I N A N C I A L S T A T E M E N T S
15. Analysis of Financial Instruments by Measurement Basis (Cont.)
15. (d) Group - 2013
HFTRs. ’000
HTMRs. ’000
Amortised costRs. ’000
AFSRs. ’000
FVTPLRs. ’000
HedgingRs. ’000
TotalRs. ’000
AssetsCash and cash equivalents – – 1,557,267 – – – 1,557,267 Balances with central banks – – 203 – – – 203 Placements with banks – – 11,298,360 – – – 11,298,360 Derivative financial instruments – – – – – 5,118,615 5,118,615 Other financial assets held-for-trading 18,111,911 – – – – – 18,111,911 Other financial assets at fair value through profit or loss – – – – – – – Loans and receivables to banks – – 7,849,969 – – – 7,849,969 Loans and receivables to other customers – – 158,871,926 – – – 158,871,926 Financial investments – 435,959,845 – 2,927,082 – – 438,886,927
Total financial assets 18,111,911 435,959,845 179,577,725 2,927,082 – 5,118,615 641,695,178
HFT
Rs. ’000
Designated at fair value
Rs. ’000
Amortised cost
Rs. ’000
FVTPL
Rs. ’000
Hedging
Rs. ’000
Total
Rs. ’000
LiabilitiesDue to banks – – 4,118,522 – – 4,118,522 Derivative financial instruments – – – – – – Other financial liabilities at fair value through profit or loss – – – – – – Due to other customers – – 501,889,688 – – 501,889,688 Other borrowings – – 122,790,093 – – 122,790,093 Debt securities issued – – – – – –
Total financial liabilities – – 628,798,303 – – 628,798,303

F I N A N C I A L R E P O R T S
National Savings Bank
Annual Report 2014
Page 204N O T E S T O T H E F I N A N C I A L S T A T E M E N T S
16. Cash and Cash Equivalents
Bank Group
As at 31st December 2014Rs. ’000
2013Rs. ’000
2014Rs. ’000
2013Rs. ’000
Cash in hand 570,277 512,938 570,277 512,942 Balances with banks 1,260,687 989,803 1,264,620 1,000,845 Money at call and short notice 95,630 43,480 95,630 43,480
Total 1,926,594 1,546,221 1,930,527 1,557,267
17. Balances with Central Banks
Bank Group
As at 31st December 2014Rs. ’000
2013Rs. ’000
2014Rs. ’000
2013Rs. ’000
Statutory balances with Central Bank of Sri Lanka – – 167 203
Total – – 167 203
18. Placements with Banks
Bank Group
As at 31st December 2014Rs. ’000
2013Rs. ’000
2014Rs. ’000
2013Rs. ’000
Placements with banks - Sri Lanka 9,645,621 11,298,360 9,645,621 11,298,360
Total 9,645,621 11,298,360 9,645,621 11,298,360

F I N A N C I A L R E P O R T S
National Savings Bank
Annual Report 2014
Page 205 N O T E S T O T H E F I N A N C I A L S T A T E M E N T S
19. Derivative Financial Instruments - Bank & Group
As at 31st December Assets 2014 Notional Amount - 2014
Assets 2013 Notional Amount - 2013
Interest rate derivatives Interest rate swaps – – – –
Cash flow hedges Foreign currency swaps 2,879,931 71,196,422 5,118,615 71,196,422
Total 2,879,931 71,196,422 5,118,615 71,196,422
20. Other Financial Assets Held-For-Trading
Bank Group
As at 31st December 2014Rs. ’000
2013Rs. ’000
2014Rs. ’000
2013Rs. ’000
Held-for-trading Sri Lanka Government Securities Treasury Bills 182,311 1,778,133 1,778,098 2,992,381 Treasury Bonds 3,479,689 8,201,689 5,990,595 11,291,113 Equity securities - [Refer Note 20. (a,b)] 3,769,459 3,828,417 3,769,459 3,828,417 Debt securities - Debenture – – 17,035 –
Total 7,431,458 13,808,239 11,555,186 18,111,911

F I N A N C I A L R E P O R T S
National Savings Bank
Annual Report 2014
Page 206N O T E S T O T H E F I N A N C I A L S T A T E M E N T S
20. Other Financial Assets Held-For-Trading (Cont.)
20. (a) Equity Securities (Quoted) - Bank & Group
As at 31st December 2014 2013
No. of SharesCost
Rs. ’000Market Value
Rs. ’000 No. of SharesCost
Rs. ’000Market Value
Rs. ’000
1. Banks, Finance and InsuranceCommercial Bank of Ceylon PLC – – – 1,517,149 137,590 181,669DFCC Bank – – – 1,342,024 194,396 171,846HNB Assurance PLC – – – 105,332 6,556 5,468 Hatton National Bank PLC (NV) – – – 1,103,175 138,244 129,808Janashakthi Insurance Company PLC – – – 1,699,500 26,322 21,342National Development Bank PLC – – – 679,868 74,247 107,897 Nations Trust Bank PLC – – – 355,200 27,962 21,951 Pan Asia Banking Corporation PLC 5,000 116 129 570,200 16,269 8,739 Seylan Bank PLC (NV) – – – 1,535,151 59,466 46,753Lanka Orix Leasing Company PLC 606,900 68,594 52,809 606,900 68,594 43,507 Lanka Orix Finance PLC 4,550,000 50,340 18,446 4,550,000 50,340 12,597
119,049 71,384 799,986 751,577
2. Beverage, Food and TobaccoCargills (Ceylon) PLC 783,568 143,957 118,543 543,800 106,584 79,043 Lanka Milk Foods (CWE) PLC 75,421 9,567 8,986 311,300 39,457 33,244
153,523 127,530 146,041 112,287
3. Chemical and PharmaceuticalsCIC Holdings PLC (NV) 233,700 20,184 15,344 183,700 17,302 6,267 Haycarb PLC 447,491 83,838 76,549 391,366 73,006 73,449
104,023 91,893 90,308 79,716
4. Construction and EngineeringAccess Engineering PLC 3,470,023 132,692 111,170 – – – Colombo Dockyard PLC 1,234,706 275,603 235,629 642,075 162,381 120,628
408,294 346,799 162,381 120,628

F I N A N C I A L R E P O R T S
National Savings Bank
Annual Report 2014
Page 207 N O T E S T O T H E F I N A N C I A L S T A T E M E N T S
As at 31st December 2014 2013
No. of SharesCost
Rs. ’000Market Value
Rs. ’000 No. of SharesCost
Rs. ’000Market Value
Rs. ’000
5. Diversified HoldingsAitken Spence PLC 2,593,516 306,499 265,423 450,700 77,045 46,080 C T Holdings PLC 700,265 124,420 99,016 440,400 83,598 61,009 Hemas Holdings PLC – – – 1,112,300 53,158 37,395 John Keells Holdings PLC 1,103,023 267,845 272,667 1,649,585 321,298 367,000 Sunshine Holdings PLC – – – 318,200 15,038 8,841 Browns Investments PLC 93,606,200 468,031 185,116 93,606,200 468,031 222,139 Expolanka Holdings PLC – – – 9,943,700 100,038 73,742 Free Lanka Capital Holdings PLC 2,900,000 13,279 6,022 2,900,000 13,279 6,309 Richard Pieris & Company PLC 12,001,659 113,095 100,872 5,323,900 63,909 33,165 Vallibel One PLC 3,300,000 77,299 79,025 – – –
1,370,468 1,008,140 1,195,393 855,680
6. Footwear and TextileHeyleys MGT Knitting Mills PLC 362,623 5,294 6,239 1,202,700 21,321 13,200
5,294 6,239 21,321 13,200
7. Health CareNawaloka Hospitals PLC 17,789,400 79,421 58,048 17,789,400 79,421 52,770
79,421 58,048 79,421 52,770
20. Other Financial Assets Held-For-Trading (Cont.)
20. (a) Equity Securities (Quoted) - Bank & Group (Cont.)

F I N A N C I A L R E P O R T S
National Savings Bank
Annual Report 2014
Page 208N O T E S T O T H E F I N A N C I A L S T A T E M E N T S
As at 31st December 2014 2013
No. of SharesCost
Rs. ’000Market Value
Rs. ’000 No. of SharesCost
Rs. ’000Market Value
Rs. ’000
8. Hotels and TravelsEden Hotels Lanka PLC 576,566 28,590 14,652 477,900 25,837 13,704 Ceylon Hotels Corporation PLC 3,793,842 128,776 86,656 3,304,900 116,264 52,286 The Kingsbury PLC 4,569,876 104,096 81,336 2,707,100 74,428 35,334 John Keells Hotels PLC 5,541,205 103,475 94,241 3,473,800 72,296 42,936 Lighthouse Hotels PLC 1,900,000 115,539 103,330 1,900,000 115,539 82,664 Mahaweli Reach Hotels PLC 133,300 4,884 3,071 133,300 4,884 2,109 Marawila Resorts PLC 1,899,556 16,063 11,458 702,750 9,413 3,683 Asian Hotels & Properties PLC 1,366,132 106,609 92,532 441,000 42,526 28,344 Aitken Spence Hotel Holdings PLC 2,102,133 188,903 164,209 1,613,400 153,681 119,331
796,935 651,484 614,869 380,391
9. Investment TrustsRenuka Holdings PLC 5,356,146 235,077 166,299 2,678,073 178,838 81,031 Renuka Holdings PLC (NV) 496,812 12,043 11,643 148,406 5,789 3,038
247,120 177,942 184,626 84,069
10. Land and PropertyOverseas Reality (Ceylon) PLC 50,000 1,213 1,300 5,279,241 99,789 96,572
1,213 1,300 99,789 96,572
20. Other Financial Assets Held-For-Trading (Cont.)
20. (a) Equity Securities (Quoted) - Bank & Group (Cont.)

F I N A N C I A L R E P O R T S
National Savings Bank
Annual Report 2014
Page 209 N O T E S T O T H E F I N A N C I A L S T A T E M E N T S
As at 31st December 2014 2013
No. of SharesCost
Rs. ’000Market Value
Rs. ’000 No. of SharesCost
Rs. ’000Market Value
Rs. ’000
11. ManufacturingACL Cables PLC 2,059,267 172,418 155,362 1,275,200 116,643 81,960 Dipped Products PLC 190,812 23,782 26,981 953,900 118,890 84,889 Chevron Lubricants PLC – – – – – – Tokyo Cement Company (Lanka) PLC – – – 1,334,520 68,723 37,608 Lanka Ceramic PLC 446,000 60,350 52,965 446,000 60,350 46,526 Lanka Walltile PLC 1,838,387 154,859 177,962 619,700 68,290 32,844 Royal Ceramics Lanka PLC 1,844,159 234,003 213,350 747,700 119,581 63,582 Tokyo Cement Company (Lanka) PLC (NV) – – – 2,568,500 99,706 59,684 Textured Jersey PLC 4,335,000 87,201 88,301 – – –
732,612 714,921 652,183 407,093
12. PlantationNamunukula Plantations PLC 150,000 12,432 13,260 – – – Watawala Plantations PLC 588,301 13,979 10,936 419,500 11,250 4,148
26,411 24,196 11,250 4,148
13. Power and EnergyLanka IOC PLC – – – 15,365,100 567,966 501,369 Laugfs Gas PLC – – – 154,900 5,801 4,350 Resus Energy PLC 1,627,415 37,238 29,287 424,800 15,605 7,687
37,238 29,287 589,371 513,406
14. TelecommunicationDialog Axiata PLC 6,790,960 168,982 89,308 6,790,960 168,982 60,434
168,982 89,308 168,982 60,434
20. Other Financial Assets Held-For-Trading (Cont.)
20. (a) Equity Securities (Quoted) - Bank & Group (Cont.)
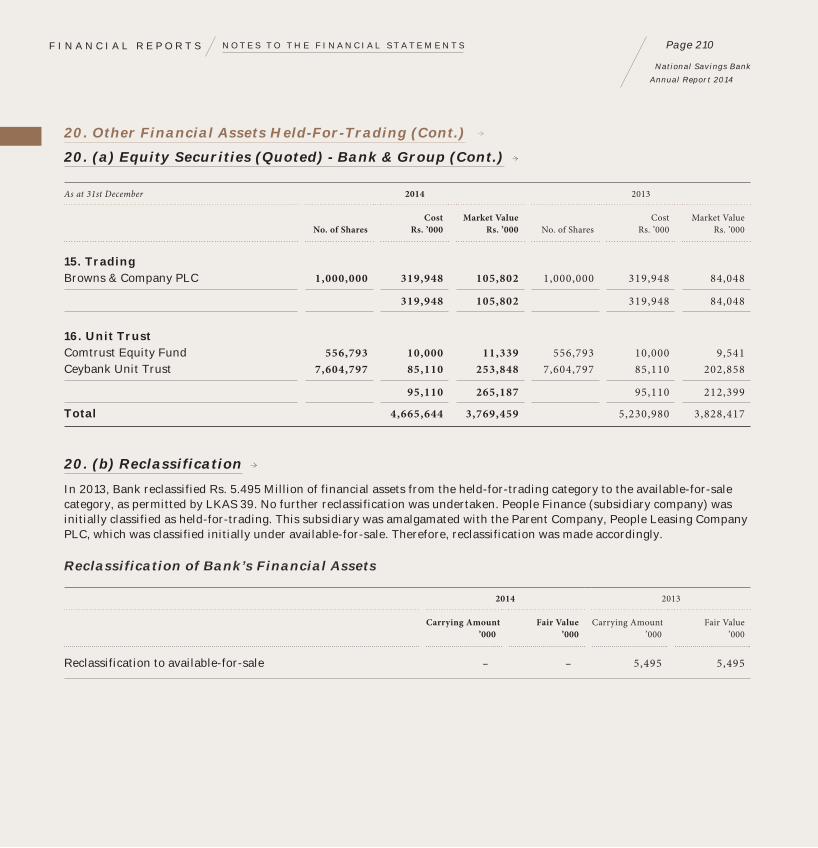
F I N A N C I A L R E P O R T S
National Savings Bank
Annual Report 2014
Page 210N O T E S T O T H E F I N A N C I A L S T A T E M E N T S
As at 31st December 2014 2013
No. of SharesCost
Rs. ’000Market Value
Rs. ’000 No. of SharesCost
Rs. ’000Market Value
Rs. ’000
15. TradingBrowns & Company PLC 1,000,000 319,948 105,802 1,000,000 319,948 84,048
319,948 105,802 319,948 84,048
16. Unit TrustComtrust Equity Fund 556,793 10,000 11,339 556,793 10,000 9,541 Ceybank Unit Trust 7,604,797 85,110 253,848 7,604,797 85,110 202,858
95,110 265,187 95,110 212,399
Total 4,665,644 3,769,459 5,230,980 3,828,417
20. (b) Reclassification
In 2013, Bank reclassified Rs. 5.495 Million of financial assets from the held-for-trading category to the available-for-sale category, as permitted by LKAS 39. No further reclassification was undertaken. People Finance (subsidiary company) was initially classified as held-for-trading. This subsidiary was amalgamated with the Parent Company, People Leasing Company PLC, which was classified initially under available-for-sale. Therefore, reclassification was made accordingly.
Reclassification of Bank’s Financial Assets
2014 2013
Carrying Amount ’000
Fair Value ’000
Carrying Amount ’000
Fair Value ’000
Reclassification to available-for-sale – – 5,495 5,495
20. Other Financial Assets Held-For-Trading (Cont.)
20. (a) Equity Securities (Quoted) - Bank & Group (Cont.)

F I N A N C I A L R E P O R T S
National Savings Bank
Annual Report 2014
Page 211 N O T E S T O T H E F I N A N C I A L S T A T E M E N T S
20. Other Financial Assets Held-For-Trading (Cont.)
20. (b) Reclassification (Cont.)
Effect of Reclassifying and not Classifying Financial Assets
Bank Group
As at 31st December 2014Rs. ’000
2013Rs. ’000
2014Rs. ’000
2013Rs. ’000
Reclassification to available-for-saleRecorded in the Income Statement – – – – Assuming no reclassification – (2,897) – (2,897)
Net Income Statement effect – (2,897) – (2,897)
21. Financial Assets Designated at Fair Value Through Profit or Loss
Bank Group
As at 31st December 2014Rs. ’000
2013Rs. ’000
2014Rs. ’000
2013Rs. ’000
Sri Lanka Government Securities Treasury Bills – – – – Treasury Bonds – – – – Less: Increase/(decrease) in falling value of securities – – – –
Total – – – –
22. Loans and Receivables to Banks
Bank Group
As at 31st December 2014Rs. ’000
2013Rs. ’000
2014Rs. ’000
2013Rs. ’000
Gross loans and receivables 6,534,102 7,550,509 6,534,102 7,849,969 (Less): Individual impairment – – – –
Net loans and receivables 6,534,102 7,550,509 6,534,102 7,849,969

F I N A N C I A L R E P O R T S
National Savings Bank
Annual Report 2014
Page 212N O T E S T O T H E F I N A N C I A L S T A T E M E N T S
22.(a) Analysis by Product
Bank Group
As at 31st December 2014Rs. ’000
2013Rs. ’000
2014Rs. ’000
2013Rs. ’000
Loans and receivables Short-term loans – – – – Long-term loans 4,152,195 4,228,538 4,152,195 4,228,538 Securities purchased under resale agreements 498,705 1,548,565 498,705 1,848,025 Debentures 1,883,202 1,671,509 1,883,202 1,671,509 Commercial papers – 101,897 – 101,897
Gross total 6,534,102 7,550,509 6,534,102 7,849,969
22. (b) All loans and receivables to banks are in Sri Lankan Rupees
23. Loans and Receivables to Other Customers
Bank Group
As at 31st December 2014Rs. ’000
2013Rs. ’000
2014Rs. ’000
2013Rs. ’000
Gross loans and receivables 220,087,324 160,875,404 220,089,410 160,877,504 (Less): Individual impairment – – – – Collective impairment [Refer - 23. (d)] 3,925,172 2,005,578 3,925,172 2,005,578
Net loans and receivables 216,162,152 158,869,826 216,164,238 158,871,926

F I N A N C I A L R E P O R T S
National Savings Bank
Annual Report 2014
Page 213 N O T E S T O T H E F I N A N C I A L S T A T E M E N T S
23. Loans and Receivables to Other Customers (Cont.)
23. (a) Analysis by Product
Bank Group
As at 31st December 2014Rs. ’000
2013Rs. ’000
2014Rs. ’000
2013Rs. ’000
Loans and receivables Pawning 38,184,641 52,000,487 38,184,641 52,000,487 Staff loans 2,791,077 2,659,967 2,791,077 2,659,967 Term loans Short-term 1,000,000 1,192,959 1,000,000 1,192,959 Long-term 169,647,494 91,905,182 169,647,494 91,905,182 Securities purchased under resale agreements – – 2,086 2,100 Others Securitisation/Commercial papers 3,797,575 5,427,665 3,797,575 5,427,665 Sri Lanka Government Securities 4,122,500 4,122,500 4,122,500 4,122,500 Administrative borrowings – 3,389,220 – 3,389,220 Others 544,037 177,425 544,037 177,425
Gross total 220,087,324 160,875,404 220,089,410 160,877,504

F I N A N C I A L R E P O R T S
National Savings Bank
Annual Report 2014
Page 214N O T E S T O T H E F I N A N C I A L S T A T E M E N T S
23. Loans and Receivables to Other Customers (Cont.)
23. (b) Analysis by Industry
Bank Group
As at 31st December 2014Rs. ’000
2013Rs. ’000
2014Rs. ’000
2013Rs. ’000
Agriculture and fishing 1,001,737 1,195,539 1,001,737 1,195,539 Tourism 145,375 163,577 145,375 163,577 Transport 913,895 456,551 913,895 456,551 Construction/Housing 56,776,500 53,483,331 56,776,500 53,483,331 Others Infrastructure 52,692,775 6,595,707 52,692,775 6,595,707 Leasing and Finance 4,521,533 5,728,880 4,521,533 5,728,880 Government 4,122,500 7,511,719 4,122,500 7,511,719 Education 12,924,747 3,398,654 12,924,747 3,398,654 Telecommunication – 91,063 – 91,063 Power and Energy 13,126,850 3,185,665 13,126,850 3,185,665 Health Care – 74,482 – 74,482 Pawning 38,184,641 52,000,487 38,184,641 52,000,487 Loan against deposit 19,802,230 20,470,214 19,802,230 20,470,214 Others 15,874,541 6,519,535 15,876,627 6,521,635
Gross total 220,087,324 160,875,404 220,089,410 160,877,504
23. (c) Analysis by Currency
Bank Group
As at 31st December 2014Rs. ’000
2013Rs. ’000
2014Rs. ’000
2013Rs. ’000
Sri Lankan Rupees 210,618,937 158,741,108 210,621,023 158,743,208 United States Dollar 9,468,387 2,134,296 9,468,387 2,134,296
220,087,324 160,875,404 220,089,410 160,877,504

F I N A N C I A L R E P O R T S
National Savings Bank
Annual Report 2014
Page 215 N O T E S T O T H E F I N A N C I A L S T A T E M E N T S
23. Loans and Receivables to Other Customers (Cont.)
23. (d) Movements in Collective Impairment Charges during the Year
Bank Group
As at 31st December 2014Rs. ’000
2013Rs. ’000
2014Rs. ’000
2013Rs. ’000
Collective impairment Opening balance 2,005,578 625,773 2,005,578 625,773 Charge to Income Statement (Note 10) 3,475,695 1,380,003 3,475,695 1,380,003 Net write-off during the year (1,556,101) (198) (1,556,101) (198)
Closing balance 3,925,172 2,005,578 3,925,172 2,005,578
24. Financial Investments – Available-for-Sale
Bank Group
As at 31st December 2014Rs. ’000
2013Rs. ’000
2014Rs. ’000
2013Rs. ’000
Quoted Investments Equity Securities [Note - 24. (a)] 3,634,808 2,628,554 3,634,808 2,628,554 Unquoted Investments Equity Securities [Note - 24. (b)] 402,147 297,528 403,147 298,528
Net Available-for-sale investments 4,036,955 2,926,082 4,037,955 2,927,082
24. (a) Quoted Investments – Bank and Group
2014 2013
Quoted Investments No. of Shares Cost Fair Value No. of Shares Cost Fair Value
Hatton National Bank PLC 9,371,940 1,301,845 1,807,060 9,371,940 1,301,845 1,362,245 Sri Lanka Telecom PLC 13,158,700 445,643 657,072 13,158,700 445,643 481,419 People's Leasing Company PLC 48,323,927 868,036 1,170,676 59,237,340 1,064,072 784,890
2,615,524 3,634,808 2,811,560 2,628,554

F I N A N C I A L R E P O R T S
National Savings Bank
Annual Report 2014
Page 216N O T E S T O T H E F I N A N C I A L S T A T E M E N T S
24. Financial Investments – Available-for-Sale (Cont.)
24. (b) Unquoted Investments
2014 - Bank 2013 - Bank
Unquoted Investments No. of Shares Cost Cost/Fair Value No. of Shares Cost Cost/Fair Value
Investment - Credit Information Bureau 30,450 57,364 57,364 30,450 57,364 57,364 Investment - Associated News Papers Ceylon Ltd. 20,000 127 127 20,000 127 127 Investment - Regional Development Bank (RDB) 16,452,126 164,521 344,656 7,358,448 73,584 240,037 Investment - Sri Lankan Airlines Ltd. – – – 4,236,135 1,136,500 1,136,500 (Less): Impairment – – – (1,136,500)
222,012 402,147 1,267,575 297,528
2014 - Group 2013 - Group
Unquoted Investments No. of Shares Cost Cost/Fair Value No. of Shares Cost Cost/Fair Value
Investment - Credit Information Bureau 30,450 57,364 57,364 30,450 57,364 57,364 Investment - Associated News Papers Ceylon Ltd. 20,000 127 127 20,000 127 127 Investment - Regional Development Bank (RDB) 16,452,126 164,521 344,656 7,358,448 73,584 240,037 Investment- Sri Lanka Financial Services Bureau 100,000 1,000 1,000 100,000 1,000 1,000 Investment - Sri Lankan Airlines Ltd. – – – 4,236,135 1,136,500 1,136,500 (Less): Impairment – – – (1,136,500)
223,012 403,147 1,268,575 298,528
All unquoted available-for-sale equities (except RDB) are recorded at cost since its fair value can’t be reliably estimated. There is no market for these investments and Bank intends to hold it for the long-term. The investment in RDB shares have been fair valued using a valuation model based on observable data. The fully-impaired financial investment in Sri Lankan Airline in 2011, has been recovered in full during 2014.
There were no financial investments - available-for-sale pledged as collateral.

F I N A N C I A L R E P O R T S
National Savings Bank
Annual Report 2014
Page 217 N O T E S T O T H E F I N A N C I A L S T A T E M E N T S
25. Financial Investments – Held-to-Maturity
Bank Group
As at 31st December 2014Rs. ’000
2013Rs. ’000
2014Rs. ’000
2013Rs. ’000
Sri Lanka Government Securities Treasury Bills 46,587,182 63,582,708 46,587,182 63,582,708 Treasury Bonds 412,929,214 318,403,753 416,297,040 321,898,485 Debt securities – – – – Sri Lanka Development Bond - USD 50,824,942 50,478,652 50,824,942 50,478,652 (Less): Impairment – – – –
Net Held-to-maturity investments 510,341,337 432,465,113 513,709,164 435,959,845
The Bank has pledged Treasury Bills and Treasury Bonds held-to-maturity of Rs. 63,842 Million as collateral as at 31st December 2014 (2013 - Rs. 27,778 Million)
26. Investments in Subsidiaries – Bank
As at 31st December 2014 2013 2014 2013
Holding 100%
Holding 100%
Cost Directors’ Valuation
Cost Directors’ Valuation
Unquoted Equity Share NSB Fund Management Co. Ltd. 100 100 150,000 150,000 150,000 150,000 (15,000,000 Ordinary Shares of Rs. 10/- each)(Less): Impairment – – – –
Net total 150,000 150,000 150,000 150,000

F I N A N C I A L R E P O R T S
National Savings Bank
Annual Report 2014
Page 218N O T E S T O T H E F I N A N C I A L S T A T E M E N T S
27. Property, Plant & Equipment
27. (a) Property, Plant & Equipment – Bank - 2014
Land and buildings
Rs. ’000
Leasehold properties
Rs. ’000
Computer hardware
Rs. ’000
Office equipment,
furniture and fittings
Rs. ’000
Others
Rs. ’000
Total
Rs. ’000
Cost/ValuationOpening balance as at 1st January 2014 4,373,526 475,549 1,639,899 1,311,733 239,037 8,039,744 Adjustments – – – (37) – (37)Additions 86,918 – 64,809 53,457 41,443 246,627 Revaluation – – – – – – Disposals – – (4,544) (3,260) (17,098) (24,902)Transfers [Refer 27. (d)] (65,230) – – – – (65,230)
Closing balance as at 31st December 2014 4,395,214 475,549 1,700,164 1,361,893 263,382 8,196,202
(Less): Accumulated depreciationOpening balance as at 1st January 2014 – 44,704 1,495,557 727,980 161,090 2,429,331 Adjustments – – – (1) – (1)Charge for the year 42,433 7,228 83,124 99,419 28,049 260,253 Additions – – – – – – Disposals – – (4,544) (3,242) (15,339) (23,125)
Closing balance as at 31st December 2014 42,433 51,932 1,574,137 824,156 173,800 2,666,458
(Less): Impairment – – – – – –
Net book value as at 31st December 2014 4,352,781 423,617 126,027 537,737 89,582 5,529,743

F I N A N C I A L R E P O R T S
National Savings Bank
Annual Report 2014
Page 219 N O T E S T O T H E F I N A N C I A L S T A T E M E N T S
27. Property, Plant & Equipment (Cont.)
27. (a) Property, Plant & Equipment – Bank - 2013
Land and buildings
Rs. ’000
Leasehold properties
Rs. ’000
Computer hardware
Rs. ’000
Office equipment,
furniture and fittings
Rs. ’000
Others
Rs. ’000
Total
Rs. ’000
Cost/ValuationOpening balance as at 1st January 2013 3,905,258 475,549 1,578,243 1,257,284 199,579 7,415,913 Adjustments – – – (684) – (684)Additions 158,490 – 64,294 62,426 42,111 327,321 Revaluation 482,106 – – – – 482,106 Depreciation adjustment for revalued assets (114,098) – – – – (114,098)Disposals – – (2,638) (7,293) (2,653) (12,584)Transfers [Refer 27. (d)] (58,230) – – – – (58,230)
Closing balance as at 31st December 2013 4,373,526 475,549 1,639,899 1,311,733 239,037 8,039,744
(Less): Accumulated DepreciationOpening balance as at 1st January 2013 71,536 37,476 1,376,654 634,947 143,788 2,264,401 Adjustments – – – (23) – (23)Charge for the year 42,562 7,228 121,541 100,128 19,955 291,414 Additions – – – – – – Depreciation adjustment for revalued assets (114,098) – – – – (114,098)Disposals – – (2,638) (7,072) (2,653) (12,363)
Closing balance as at 31st December 2013 – 44,704 1,495,557 727,980 161,090 2,429,331
(Less): Impairment – – – – – –
Net book value as at 31st December 2013 4,373,526 430,845 144,342 583,753 77,947 5,610,413

F I N A N C I A L R E P O R T S
National Savings Bank
Annual Report 2014
Page 220N O T E S T O T H E F I N A N C I A L S T A T E M E N T S
27. Property, Plant & Equipment (Cont.)
27. (b) Property, Plant & Equipment – Group - 2014
Land and buildings
Rs. ’000
Leasehold properties
Rs. ’000
Computer hardware
Rs. ’000
Office equipment,
furniture and fittings
Rs. ’000
Others
Rs. ’000
Total
Rs. ’000
Cost/ValuationOpening balance as at 1st January 2014 4,373,526 475,549 1,643,415 1,313,127 239,037 8,044,654 Adjustments – – – (37) – (37)Additions 86,918 – 65,173 53,466 41,443 246,999 Revaluation – – – – – – Disposals – – (4,769) (3,273) (17,098) (25,140)Transfers [Refer 27. (d)] (65,230) – – – – (65,230)
Closing balance as at 31st December 2014 4,395,214 475,549 1,703,819 1,363,283 263,382 8,201,246
(Less): Accumulated DepreciationOpening balance as at 1st January 2014 – 44,704 1,499,017 728,744 161,090 2,433,555 Adjustments – – – (1) – (1)Charge for the year 42,433 7,228 83,199 99,524 28,049 260,433 Additions – – – – – – Disposals – – (4,769) (3,255) (15,339) (23,363)
Closing balance as at 31st December 2014 42,433 51,932 1,577,447 825,012 173,800 2,670,624
(Less): Impairment – – – – – –
Net book value as at 31st December 2014 4,352,781 423,617 126,372 538,271 89,582 5,530,622

F I N A N C I A L R E P O R T S
National Savings Bank
Annual Report 2014
Page 221 N O T E S T O T H E F I N A N C I A L S T A T E M E N T S
27. Property, Plant & Equipment (Cont.)
27. (b) Property, Plant & Equipment – Group - 2013
Land and buildings
Rs. ’000
Leasehold properties
Rs. ’000
Computer hardware
Rs. ’000
Office equipment,
furniture and fittings
Rs. ’000
Others
Rs. ’000
Total
Rs. ’000
Cost/ValuationOpening balance as at 1st January 2013 3,905,258 475,549 1,581,759 1,258,678 199,579 7,420,823 Adjustments – – – (684) – (684)Additions 158,490 – 64,294 62,426 42,111 327,321 Revaluation 482,106 – – – – 482,106 Depreciation adjustment for revalued assets (114,098) – – – – (114,098)Disposals – – (2,638) (7,293) (2,653) (12,584)Transfers [Refer 27. (d)] (58,230) – – – – (58,230)
Closing balance as at 31st December 2013 4,373,526 475,549 1,643,415 1,313,127 239,037 8,044,654
(Less): Accumulated DepreciationOpening balance as at 1st January 2013 71,536 37,476 1,380,005 635,603 143,788 2,268,408 Adjustments – – – (23) – (23)Charge for the year 42,562 7,228 121,650 100,236 19,955 291,632 Additions – – – – – –Depreciation adjustment for revalued assets (114,098) – – – – (114,098)Disposals – – (2,638) (7,072) (2,653) (12,363)
Closing balance as at 31st December 2013 – 44,704 1,499,017 728,744 161,090 2,433,555
(Less): Impairment – – – – – –
Net book value as at 31st December 2013 4,373,526 430,845 144,396 584,383 77,947 5,611,100

F I N A N C I A L R E P O R T S
National Savings Bank
Annual Report 2014
Page 222N O T E S T O T H E F I N A N C I A L S T A T E M E N T S
27. Property, Plant & Equipment (Cont.)
27. (c) Revaluation
The Bank had revalued its land and buildings, by professionally qualified independent valuers. The revaluation was carried out by taking into account the observable prices in active market or recent market transactions on arm’s length basis. Accordingly, a revaluation surplus, amounting to Rs. 482 Million had been credited to the Revaluation Reserve Account in 2013.
27. (d) Building Work-in-Progress
Land and Building includes Building Work-in-Progress as follows:
Bank Group
2014Rs. ’000
2013Rs. ’000
2014Rs. ’000
2013Rs. ’000
Opening Balance 88,534 46,504 88,534 46,504 Add:Additions during the year 21,687 100,260 21,687 100,260 Less:Amount transferred to buildings 65,230 58,230 65,230 58,230
Closing balance 44,991 88,534 44,991 88,534
27. (e) Land & Buildings of the Bank
Land and building balance include freehold land value of Rs. 2,258,345,000/-.
27. (f) Property, Plant & Equipment Pledged as Security for Liabilities
There were no items of property, plant & equipment pledged as securities for liabilities.

F I N A N C I A L R E P O R T S
National Savings Bank
Annual Report 2014
Page 223 N O T E S T O T H E F I N A N C I A L S T A T E M E N T S
27. Property, Plant & Equipment (Cont.)
27. (g) Fully Depreciated Property, Plant & Equipment
The initial cost of fully-depreciated property, plant & equipment, which are still in use as at reporting date is as follows:
Bank & Group
As at 31st December 2014Rs. ’000
2013Rs. ’000
Computer hardware 585,131 456,497 Office equipment, furniture and fittings 83,340 61,274 Intangible assets 89,235 28,792 Others 111,651 117,063
28. Intangible Assets
Bank Group
As at 31st December 2014Rs. ’000
2013Rs. ’000
2014Rs. ’000
2013Rs. ’000
CostOpening balance 448,223 435,975 450,193 437,945 Additions 26,128 12,248 26,128 12,248 Disposals – – – –
Closing balance 474,351 448,223 476,321 450,193 (Less): Accumulated AmortisationOpening balance 366,420 323,874 368,305 325,680 Charge for the year 43,279 42,546 43,357 42,625 Disposals – – – –
Closing balance 409,699 366,420 411,662 368,305
Net book value 64,652 81,803 64,659 81,888

F I N A N C I A L R E P O R T S
National Savings Bank
Annual Report 2014
Page 224N O T E S T O T H E F I N A N C I A L S T A T E M E N T S
29. Deferred Tax Assets/Liabilities
Bank Group
As at 31st December 2014Rs. ’000
2013Rs. ’000
2014Rs. ’000
2013Rs. ’000
29. (a) Deferred Tax Assets
Deferred tax assets – – 568 313 Income Statement – – 100 255
Deferred tax assets – – 668 568
29. (b) Deferred Tax Liabilities
Deferred tax liabilities 143,450 123,338 143,450 123,338 Income Statement 126,304 20,112 126,304 20,112
Net Deferred tax liabilities 269,754 143,450 269,754 143,450
30. Other Assets
Bank Group
As at 31st December 2014Rs. ’000
2013Rs. ’000
2014Rs. ’000
2013Rs. ’000
WHT receivable [Refer Note 4. (e)] 4,419,382 3,259,465 4,447,394 3,274,243 Receivables 1,793,930 1,823,324 1,793,941 1,822,798 Deposits and prepayments 59,689 91,722 59,689 91,722 Advance payment to Treasury [Note (a)] 6,666,667 8,000,000 6,666,667 8,000,000 Sundry debtors 1,485 1,238 1,485 1,238 Other receivables 1,822,611 1,767,062 1,822,511 1,767,062
Total 14,763,764 14,942,811 14,791,687 14,957,063
Note (a)At the request of Treasury, the Bank paid an advance of Rs. 6,000 Million in 2012 and Rs. 2,000 Million in 2013, as confirmed by the Treasury to be set off against the profit within a period of 6 years starting from 2014.

F I N A N C I A L R E P O R T S
National Savings Bank
Annual Report 2014
Page 225 N O T E S T O T H E F I N A N C I A L S T A T E M E N T S
31. Due to Banks
Bank Group
As at 31st December 2014Rs. ’000
2013Rs. ’000
2014Rs. ’000
2013Rs. ’000
Securities sold under repurchase (Repo) agreements – – 604,719 3,991,533 Other facilities 90,150 126,989 90,150 126,989
Total 90,150 126,989 694,869 4,118,522
32. Due to Other Customers
Bank Group
As at 31st December 2014Rs. ’000
2013Rs. ’000
2014Rs. ’000
2013Rs. ’000
Amount due to other customers 554,060,312 501,889,688 554,060,312 501,889,688
Total 554,060,312 501,889,688 554,060,312 501,889,688
32. (a) Analysis by Product
Bank Group
As at 31st December 2014Rs. ’000
2013Rs. ’000
2014Rs. ’000
2013Rs. ’000
Savings deposits 141,598,577 115,267,167 141,598,577 115,267,167 Fixed deposits 412,461,735 386,622,521 412,461,735 386,622,521
Total 554,060,312 501,889,688 554,060,312 501,889,688

F I N A N C I A L R E P O R T S
National Savings Bank
Annual Report 2014
Page 226N O T E S T O T H E F I N A N C I A L S T A T E M E N T S
32. Due to Other Customers (Cont.)
32. (b) Analysis by Currency
Bank Group
As at 31st December 2014Rs. ’000
2013Rs. ’000
2014Rs. ’000
2013Rs. ’000
Sri Lankan Rupee 547,692,326 493,134,240 547,692,326 493,134,240 United States Dollar 3,607,111 5,856,969 3,607,111 5,856,969 Great Britain Pound 967,373 988,819 967,373 988,819 Others 1,793,502 1,909,660 1,793,502 1,909,660
Total 554,060,312 501,889,688 554,060,312 501,889,688
33. Other Borrowings
Bank Group
As at 31st December 2014Rs. ’000
2013Rs. ’000
2014Rs. ’000
2013Rs. ’000
Securities sold under repurchase (Repo) agreements 56,828,947 20,285,108 61,735,055 22,641,665 Senior note issued [Note 33. (a)] 134,273,177 100,148,428 134,273,177 100,148,428
Total 191,102,124 120,433,536 196,008,232 122,790,093
33. (a) Senior Note Issued
Interest Payable Frequency
Issued Date Maturity Date Coupon Rate%
2014Rs. ’000
2013Rs. ’000
750 Million US Dollar senior note Semi Annually 18.09.2013 18.09.2018 8.875 100,935,186 100,148,428250 Million US Dollar senior note Semi Annually 10.09.2014 10.09.2019 5.150 33,337,991 –
134,273,177 100,148,428

F I N A N C I A L R E P O R T S
National Savings Bank
Annual Report 2014
Page 227 N O T E S T O T H E F I N A N C I A L S T A T E M E N T S
34. Other Liabilities
Bank Group
As at 31st December 2014Rs. ’000
2013Rs. ’000
2014Rs. ’000
2013Rs. ’000
Sundry creditors 63,250 54,165 63,250 54,165 Interest payable 98,574 98,032 98,574 98,032 Provision for pension scheme [Note 34. (a) 1] 4,258,336 1,898,618 4,258,336 1,898,618 Provision for medical assistance scheme [Note 34. (a) 2] 549,827 – 549,827 – Provision for gratuity [Note 34. (a) 3] 292,667 158,698 295,019 160,901 Other payables 5,421,091 7,347,331 5,434,762 7,362,298
Total 10,683,745 9,556,844 10,699,769 9,574,014
34. (a) Defined Benefit Plans
Actuarial valuation was carried out by Mr. Piyal S. Goonetilleke, fellow of Society of Actuaries (USA) of Piyal S. Goonetilleke & Associates, on 31st December 2014.
Projected Unit Credit Method was used to allocate the actuarial present value of the projected benefits earned by employees to date of 31st December 2014.
34. (a) 1. National Savings Bank Employees’ Pension Scheme
The assets of this scheme are held independently of the Bank’s assets and administered by Boards of Trustees/Managers, representing the management and the employees, as provided in the trust deed/rules of the fund.
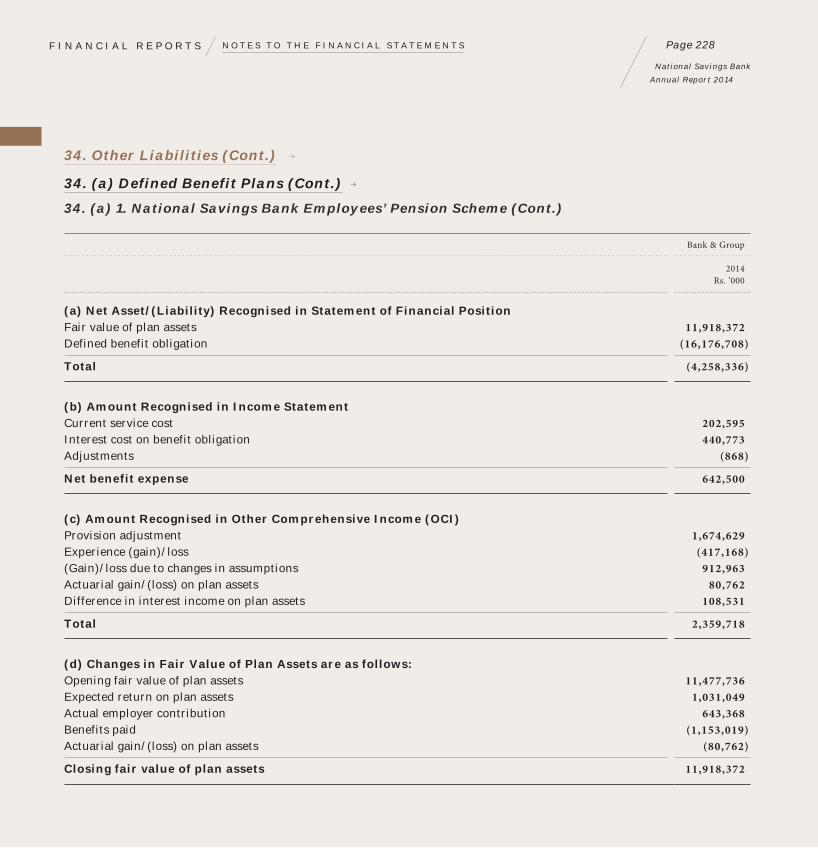
F I N A N C I A L R E P O R T S
National Savings Bank
Annual Report 2014
Page 228N O T E S T O T H E F I N A N C I A L S T A T E M E N T S
34. Other Liabilities (Cont.)
34. (a) Defined Benefit Plans (Cont.)
34. (a) 1. National Savings Bank Employees’ Pension Scheme (Cont.)
Bank & Group
2014Rs. ’000
(a) Net Asset/(Liability) Recognised in Statement of Financial PositionFair value of plan assets 11,918,372 Defined benefit obligation (16,176,708)
Total (4,258,336)
(b) Amount Recognised in Income StatementCurrent service cost 202,595 Interest cost on benefit obligation 440,773 Adjustments (868)
Net benefit expense 642,500
(c) Amount Recognised in Other Comprehensive Income (OCI)Provision adjustment 1,674,629 Experience (gain)/loss (417,168)(Gain)/loss due to changes in assumptions 912,963 Actuarial gain/(loss) on plan assets 80,762 Difference in interest income on plan assets 108,531
Total 2,359,718
(d) Changes in Fair Value of Plan Assets are as follows:Opening fair value of plan assets 11,477,736 Expected return on plan assets 1,031,049 Actual employer contribution 643,368 Benefits paid (1,153,019)Actuarial gain/(loss) on plan assets (80,762)
Closing fair value of plan assets 11,918,372

F I N A N C I A L R E P O R T S
National Savings Bank
Annual Report 2014
Page 229 N O T E S T O T H E F I N A N C I A L S T A T E M E N T S
Bank & Group
2014Rs. ’000
(e) Changes in Present Value of Defined Benefit Obligation are as follows:Opening defined benefit obligation 15,050,984 Interest cost 1,580,353 Current service cost 202,595 Benefits paid (1,153,019)(Gains)/losses due to changes in assumptions 912,963 Actuarial (gains)/losses on obligation (417,168)
Closing defined benefit obligation 16,176,708
(f) Plan Assets Consists of followings:Treasury Bonds 6,339,689 Treasury Bills 100,893 Fixed Deposits 4,158,314 Securities purchased under resale agreements 802,016 Cash at Bank of Ceylon 8,971 Other assets 508,491
Total 11,918,372
34. Other Liabilities (Cont.)
34. (a) Defined Benefit Plans (Cont.)
34. (a) 1. National Savings Bank Employees’ Pension Scheme (Cont.)

F I N A N C I A L R E P O R T S
National Savings Bank
Annual Report 2014
Page 230N O T E S T O T H E F I N A N C I A L S T A T E M E N T S
34. Other Liabilities (Cont.)
34. (a) Defined Benefit Plans (Cont.)
34. (a) 1. National Savings Bank Employees’ Pension Scheme (Cont.)
(g) Actuarial AssumptionFuture salary increment rate (%) 5.50Discount rate (%) 9.75Increase in future Cost of Living Allowance (COLA) (%) 4.50Mortality GA 1983 Mortality tableRetirement age 57 yearsNormal form of payment Monthly
Turnover rate
Age %
20 2 25 1.5 30 1 35 1 40 1 45 1 50 1 55 –
(h) Increase/Decrease in the following assumptions will have an impact on the Present Value of Defined Benefit Obligation as illustrated below:
1% increase 1% decrease
Future salary increment rate 16,215,521 16,139,777 Discount rate 14,980,418 17,561,380

F I N A N C I A L R E P O R T S
National Savings Bank
Annual Report 2014
Page 231 N O T E S T O T H E F I N A N C I A L S T A T E M E N T S
34. Other Liabilities (Cont.)
34. (a) Defined Benefit Plans (Cont.)
34. (a) 2. Medical Assistance Scheme for the Retired Employees of NSB
The assets of this scheme are held independently of the Bank’s assets and administered by Boards of Trustees/Managers, representing the management and the employees, as provided in the trust deed/rules of the fund.
Bank & Group
2014Rs. ’000
(a) Net Asset/(Liability) Recognised in Statement of Financial PositionFair value of plan assets 315,935 Defined benefit obligation (860,443)Less:Contribution from employees 5,320
(549,827)
(b) Amount Recognised in Income StatementCurrent service cost 5,303 Interest cost on benefit obligation 48,547
Net benefit expense 53,850
(c) Amount Recognised in Other Comprehensive Income (OCI)Provision adjustment 420,658 Experience (gain)/loss 79,972 (Gain)/loss due to changes in assumptions 50,109 Actuarial gain/(loss) on plan assets (3,547)Difference in interest income on plan assets 2,635
549,827

F I N A N C I A L R E P O R T S
National Savings Bank
Annual Report 2014
Page 232N O T E S T O T H E F I N A N C I A L S T A T E M E N T S
Bank & Group
2014Rs. ’000
(d) Changes in Fair Value of Plan Assets are as followsOpening fair value of plan assets 305,154 Expected return on plan assets 25,029 Actual employer contribution 53,850 Actual participants' contribution 5,320 Benefits paid (76,964)Actuarial gain/(loss) on plan assets 3,547
Closing fair value of plan assets 315,935
(e) Changes in Present Value of Defined Benefit Obligation are as follows:Opening defined benefit obligation 725,812 Interest cost 76,210 Current service cost 5,303 Benefits paid (76,964)(Gains)/losses due to changes in assumptions 50,109 Actuarial (gains)/losses on obligation 79,972
Closing defined benefit obligation 860,443
(f) Plan Assets Consists of followingsTreasury Bonds 79,028 Fixed Deposits 183,036 Cash at Bank of Ceylon 21 NSB contribution receivable 53,850
Total 315,935
34. Other Liabilities (Cont.)
34. (a) Defined Benefit Plans (Cont.)
34. (a) 2. Medical Assistance Scheme for the Retired Employees of NSB (Cont.)

F I N A N C I A L R E P O R T S
National Savings Bank
Annual Report 2014
Page 233 N O T E S T O T H E F I N A N C I A L S T A T E M E N T S
%
(g) Actuarial AssumptionFuture salary increment rate 5.50Medical cost inflation rate 5.00Discount rate 9.75
34. (a) 3. National Savings Bank Gratuity Plan
Bank Group
2014Rs. ’000
2013Rs. ’000
(a) Net Benefit Expense (recognised under personal expenses)Current service cost 23,445 23,664 Interest cost on benefit obligation 21,471 21,682
Net benefit expense 44,916 45,346
(b) Provision for GratuityDefined benefit obligation as at 1st January 158,698 160,901 Interest cost 21,471 21,682 Current service cost 23,445 23,664 Benefits paid (1,791) (1,976)Actuarial losses/(gains) on obligation (recognised in OCI) 90,845 90,749
Defined benefit obligation at 31st December 292,667 295,019
34. Other Liabilities (Cont.)
34. (a) Defined Benefit Plans (Cont.)
34. (a) 2. Medical Assistance Scheme for the Retired Employees of NSB (Cont.)

F I N A N C I A L R E P O R T S
National Savings Bank
Annual Report 2014
Page 234N O T E S T O T H E F I N A N C I A L S T A T E M E N T S
34. Other Liabilities (Cont.)
34. (a) Defined Benefit Plans (Cont.)
34. (a) 3. National Savings Bank Gratuity Plan
2014
(c) Actuarial Assumption Future salary increment rate (%) 5.50Discount rate (%) 9.75Mortality GA 1983 Mortality table
(d) Increase/Decrease in the following assumptions will have an impact on the Present Value of Defined Benefit Obligation as illustrated below:
1% increase 1% decrease
Salary increment rate 334,401 257,770 Discount rate 258,101 334,539
35. Stated Capital/Assigned Capital
Bank Group
As at 31st December 2014Rs. ’000
2013Rs. ’000
2014Rs. ’000
2013Rs. ’000
AuthorisedOne Billion Ordinary Share of Rs. 10/- each 10,000,000 10,000,000 10,000,000 10,000,000 Issued and Fully Paid320 Million Ordinary Shares of Rs. 10/- each 3,200,000 3,200,000 3,200,000 3,200,000
Total 3,200,000 3,200,000 3,200,000 3,200,000
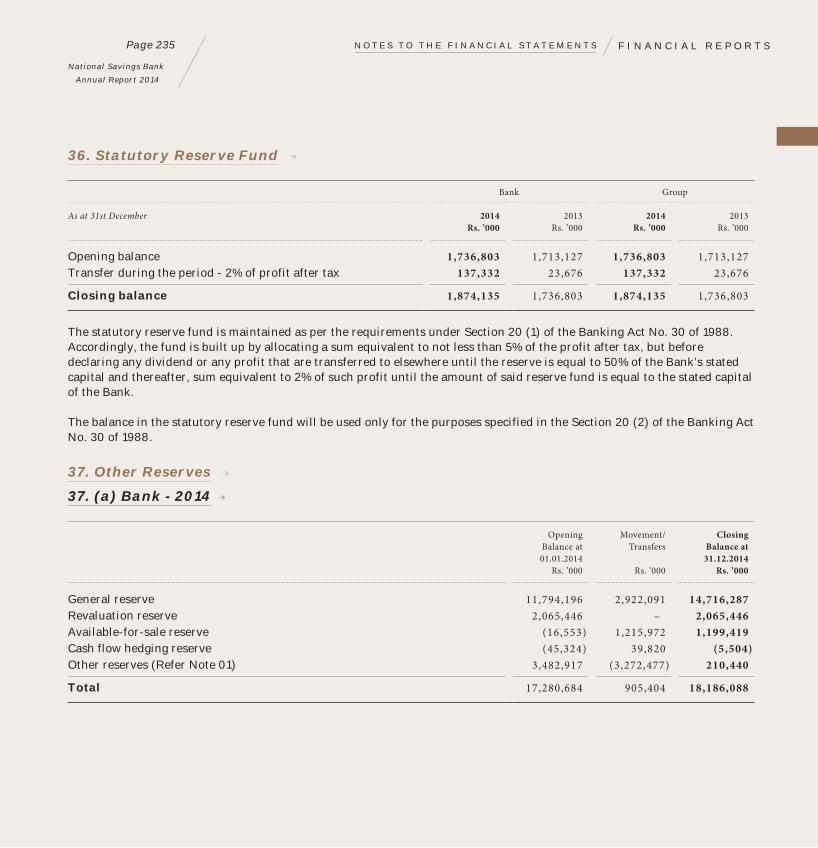
F I N A N C I A L R E P O R T S
National Savings Bank
Annual Report 2014
Page 235 N O T E S T O T H E F I N A N C I A L S T A T E M E N T S
36. Statutory Reserve Fund
Bank Group
As at 31st December 2014Rs. ’000
2013Rs. ’000
2014Rs. ’000
2013Rs. ’000
Opening balance 1,736,803 1,713,127 1,736,803 1,713,127 Transfer during the period - 2% of profit after tax 137,332 23,676 137,332 23,676
Closing balance 1,874,135 1,736,803 1,874,135 1,736,803
The statutory reserve fund is maintained as per the requirements under Section 20 (1) of the Banking Act No. 30 of 1988. Accordingly, the fund is built up by allocating a sum equivalent to not less than 5% of the profit after tax, but before declaring any dividend or any profit that are transferred to elsewhere until the reserve is equal to 50% of the Bank’s stated capital and thereafter, sum equivalent to 2% of such profit until the amount of said reserve fund is equal to the stated capital of the Bank.
The balance in the statutory reserve fund will be used only for the purposes specified in the Section 20 (2) of the Banking Act No. 30 of 1988.
37. Other Reserves
37. (a) Bank - 2014
Opening Balance at 01.01.2014
Rs. ’000
Movement/ Transfers
Rs. ’000
Closing Balance at
31.12.2014Rs. ’000
General reserve 11,794,196 2,922,091 14,716,287Revaluation reserve 2,065,446 – 2,065,446Available-for-sale reserve (16,553) 1,215,972 1,199,419Cash flow hedging reserve (45,324) 39,820 (5,504)Other reserves (Refer Note 01) 3,482,917 (3,272,477) 210,440
Total 17,280,684 905,404 18,186,088

F I N A N C I A L R E P O R T S
National Savings Bank
Annual Report 2014
Page 236N O T E S T O T H E F I N A N C I A L S T A T E M E N T S
37. Other Reserves (Cont.)
37. (b) Bank - 2013
Opening Balance at 01.01.2013
Rs. ’000
Movement/ Transfers
Rs. ’000
Closing Balance at31.12.2013
Rs. ’000
General reserve 14,254,137 (2,459,941) 11,794,196Revaluation reserve 1,583,340 482,106 2,065,446Available-for-sale reserve 136,119 (152,672) (16,553)Cash flow hedging reserve – (45,324) (45,324)Other reserves (Refer Note 01) 2,880,373 602,544 3,482,917
Total 18,853,971 (1,573,286) 17,280,684
37. (c) Group - 2014
Opening Balance at 01.01.2014
Rs. ’000
Movement/ Transfers
Rs. ’000
Closing Balance at
31.12.2014Rs. ’000
General reserve 12,995,126 3,057,016 16,052,142Revaluation reserve 2,065,446 – 2,065,446Available-for-sale reserve (16,553) 1,215,972 1,199,419Cash flow hedging reserve (45,324) 39,820 (5,504)Other reserves (Refer Notes 01 and 02) 3,861,326 (3,221,951) 639,375
Total 18,860,023 1,090,857 19,950,880

F I N A N C I A L R E P O R T S
National Savings Bank
Annual Report 2014
Page 237 N O T E S T O T H E F I N A N C I A L S T A T E M E N T S
37. Other Reserves (Cont.)
37. (d) Group - 2013
Opening Balance at 01.01.2013
Rs. ’000
Movement/ Transfers
Rs. ’000
Closing Balance at31.12.2013
Rs. ’000
General reserve 15,197,799 (2,202,673) 12,995,126Revaluation reserve 1,583,340 482,106 2,065,446Available-for-sale reserve 136,119 (152,672) (16,553)Cash flow hedging reserve – (45,324) (45,324)Other reserves (Refer Notes 01 and 02) 3,172,471 688,855 3,861,326
Total 20,089,730 (1,229,707) 18,860,023
Note 01 - Investment Fund Reserve
Bank Group
2014Rs. ’000
2013Rs. ’000
2014Rs. ’000
2013Rs. ’000
Opening balance 3,261,864 2,829,999 3,261,864 2,829,999Prior year adjustment – (176,368) – (176,368)
Restated balance 3,261,864 2,653,631 3,261,864 2,653,631 Add: Transferred during the year – 608,233 – 608,233 Less: Amount transferred to general reserve 3,261,864 – 3,261,864 –
Closing balance – 3,261,864 – 3,261,864
As required by the Government Budget 2011 and subsequent direction from Central Bank of Sri Lanka, with effect from 1st January 2011, the Bank is required to transfer an amount equivalent to 8% of the profit calculated for the payment of VAT on Financial services and 5% of the profit before tax calculated for the payment of Income Tax to an Investment Fund Account.
The operations of this fund were ceased with effect from 1st October 2014 and the balance as at that date was transferred to Retained earnings/General reserve.

F I N A N C I A L R E P O R T S
National Savings Bank
Annual Report 2014
Page 238N O T E S T O T H E F I N A N C I A L S T A T E M E N T S
37. Other Reserves (Cont.)
Investment Made Under Investment Fund Account
Bank Group
Interest Rate Tenure 2014 2013 2014 2013
Loan - Road Development Authority 9.0% 14.5 Years – 1,049,956 – 1,049,956Long-Term Agriculture Loan 10.5% 5 Years – 2,580 – 2,580Long-Term Government Bonds 1 7.5% 7 Years – 14,279 – 14,279Long-Term Government Bonds 2 7.0% 12 Years – 539,650 – 539,650Short-Term Government Securities – 1,690,698 – 1,690,698
Total investment – 3,297,163 – 3,297,163
Note 02 - Special Risk Reserve (NSB Fund Management Company Ltd.)
Bank Group
2014Rs. ’000
2013Rs. ’000
2014Rs. ’000
2013Rs. ’000
Opening balance – – 379,931 294,036Transferred during the year - 25% of profit after tax – – 50,516 85,895
Closing balance – – 430,447 379,931
In order to promote the safety, soundness and the stability of the Primary Dealer (PD) system and to build up PD capital base, with effect from 1st July 2004, Primary Dealers (PDs) are required to transfer a percentage of their profit after tax annually to a Special Risk Reserve as follows:
I. 50% of the profit after tax annually by the PDs who maintain capital funds less than Rs. 400 Million.
II. 25% of the profit after tax annually by the PDs who maintain capital funds in excess of Rs. 400 Million.

F I N A N C I A L R E P O R T S
National Savings Bank
Annual Report 2014
Page 239 N O T E S T O T H E F I N A N C I A L S T A T E M E N T S
38. Contingent Liabilities and Commitments
In the normal course of business, the Bank makes various commitments and incurs certain contingent liabilities with legal recovers to its customers. No material losses are anticipated as a result of these transactions.
Bank Group
As at 31st December 2014Rs. ’000
2013Rs. ’000
2014Rs. ’000
2013Rs. ’000
Guarantees 355,250 309,065 355,250 309,065Other contingent items 49,700 51,890 49,700 51,890Undrawn loan commitments 59,039,688 69,229,188 59,039,688 69,229,188
Total 59,444,638 69,590,143 59,444,638 69,590,143
39. Related Party Disclosures
39. (a) Transactions with State and State Controlled Entities
Bank Group
As at 31st December 2014Rs. ’000
2013Rs. ’000
2014Rs. ’000
2013Rs. ’000
AssetsLoans to Government 4,122,500 7,511,719 4,122,500 7,511,719Investments made on Government Securities 514,003,337 442,444,935 521,477,856 450,243,339Investments on State and State Controlled Entities 95,943,765 23,294,211 95,943,765 23,294,211Securities purchased under Resale Agreements 498,705 1,548,565 500,791 1,850,125Tax Receivable 4,276,544 3,259,465 4,276,544 3,259,465Postmaster-General’s Current Account 98,547 228,071 98,547 228,071Other Advance payment to Government 6,666,667 8,000,000 6,666,667 8,000,000
625,610,065 486,286,966 633,086,670 494,386,930
LiabilitiesSecurities sold under Repurchase Agreements 56,828,947 20,285,108 62,339,774 26,633,198
Taxes paidIncome Tax 3,605,541 1,094,954 3,710,276 1,141,437Value Added Tax 1,744,872 624,445 1,784,099 672,464Nation Building Tax 290,812 – 298,134 –Contribution to Consolidated Fund/Dividend 4,000,000 3,000,000 4,001,661 3,000,000
9,641,225 4,719,399 9,794,170 4,813,901

F I N A N C I A L R E P O R T S
National Savings Bank
Annual Report 2014
Page 240N O T E S T O T H E F I N A N C I A L S T A T E M E N T S
39. Related Party Disclosures (Cont.)
39. (b) Transactions with Subsidiary Company (NSB Fund Management Company Ltd.)
The Bank has contributed Rs. 150 Million towards the share capital of the Company. The Company invested its funds in Treasury Bills, Bonds and Repo during the year on a regular basis. All investment in Treasury Bills and Treasury Bonds of the Bank are being made through the NSB Fund Management Co. Ltd. on which a service charge of Rs. 34.5 Million has been made (Rs. 33 Million in 2013)
39. (c) Transactions with Post Employment Benefit Plans of the Bank
Transactions which had taken place between the Bank and Post Employment Benefit Plans of the Bank as at the year end are summarised below:
Bank Group
As at 31st December 2014Rs. ’000
2013Rs. ’000
2014Rs. ’000
2013Rs. ’000
National Savings Bank Employees’ Pension SchemeFixed deposits 4,597,588 5,527,256 4,597,588 5,527,256 Securities purchased under resale agreements 217,174 533,804 217,174 533,804
Medical Assistance Scheme for the Retired Employees of NSBFixed deposits 256,741 219,781 256,741 219,781 Securities purchased under resale agreements – 5,844 – 5,844
National Savings Bank Employees’ Provident FundFixed deposits 2,191,427 2,769,446 2,191,427 2,769,446 Securities purchased under resale agreements 159,478 93,611 159,478 93,611
7,422,408 9,149,743 7,422,408 9,149,743

F I N A N C I A L R E P O R T S
National Savings Bank
Annual Report 2014
Page 241 N O T E S T O T H E F I N A N C I A L S T A T E M E N T S
39. Related Party Disclosures (Cont.)
39. (d) Transactions with Key Managerial Persons
(i) Key managerial persons include members of the Board of Directors of the Bank and key employees of the Bank holding directorships in subsidiary, NSB Fund Management Company of the Bank.
(ii) Loans and advances in the names of key managerial persons are given below:
As at 31st December 2014Rs. ’000
2013Rs. ’000
Loans & Advances 15,702 17,937
(iii) Chairperson’s, Directors’, GM/CEO’s and DGMM’s emoluments and fees amounted to Rs. 27.27 Million in 2014 (Rs. 28.68 Million in 2013).
39. (e) Net Accommodation Granted to Related Parties
(Disclosure under rule 3 (8) (ii) (e) of the Governance Direction of No. 12 of 2007 issued by the Central Bank of Sri Lanka.)
As at 31st December 2014Rs. ’000
2013Rs. ’000
Key Managerial Persons
Loan & Advances 15,702 17,937
Total net accommodation 15,702 17,937
Regulatory Capital 21,527,650 15,096,707
Net accommodation as a percentage of the Bank’s Regulatory Capital 0.1 0.1

F I N A N C I A L R E P O R T S
National Savings Bank
Annual Report 2014
Page 242N O T E S T O T H E F I N A N C I A L S T A T E M E N T S
40. Net Assets Value per Ordinary Share
Bank Group
As at 31st December 2014Rs. ’000
2013Rs. ’000
2014Rs. ’000
2013Rs. ’000
Amount used as the numerator
Share holders’ Funds 23,260,223 22,217,487 25,025,015 23,796,826
Number of ordinary share used as the denominator
Total number of shares 320,000 320,000 335,000 335,000
Net assets value per ordinary share (Rs.) 72.69 69.43 74.70 71.04
41. Non-Cash items included in Profit Before Tax
Bank Group
For the year ended 31st December 2014Rs. ’000
2013Rs. ’000
2014Rs. ’000
2013Rs. ’000
Depreciation of property, plant & equipment 253,024 284,163 253,205 284,380Amortisation of leasehold property 7,228 7,228 7,228 7,228Amortisation of intangible assets 43,279 42,546 43,357 42,625Impairment losses on loans and receivables 3,475,695 1,380,003 3,475,695 1,380,003Profit on disposal of property, plant & equipment (9,631) (2,119) (9,631) (2,119)Accretion of discounts and amortisation of premiums of investment securities (2,166,992) 149,183 (2,166,896) 148,767
Total 1,602,603 1,861,004 1,602,959 1,860,883

F I N A N C I A L R E P O R T S
National Savings Bank
Annual Report 2014
Page 243 N O T E S T O T H E F I N A N C I A L S T A T E M E N T S
42. Change in Operating Assets
Bank Group
For the year ended 31st December 2014Rs. ’000
2013Rs. ’000
2014Rs. ’000
2013Rs. ’000
Change in derivative financial instruments 2,238,684 (5,099,813) 2,238,684 (5,099,813)Net increase in debt securities, treasury bills & bonds and equity shares held at fair value through profit or loss (71,055,084) (126,272,611) (70,748,235) (124,904,121)Net increase in loans and receivables to banks 1,016,407 5,823,498 1,315,867 6,241,330Net increase in loans and receivables to other customers (60,768,021) (11,146,408) (60,768,007) (11,144,261)Change in other assets 157,082 (4,900,248) 143,411 (4,870,998)
Total (128,410,932) (141,595,582) (127,818,280) (139,777,863)
43. Change in Operating Liabilities
Bank Group
For the year ended 31st December 2014Rs. ’000
2013Rs. ’000
2014Rs. ’000
2013Rs. ’000
Change in deposits from banks, customers and debt securities issued 52,170,624 44,239,301 48,783,810 41,821,940 Change in other liabilities 1,672,576 5,922,884 1,671,428 5,926,376
Total 53,843,200 50,162,185 50,455,238 47,748,316

F I N A N C I A L R E P O R T S
National Savings Bank
Annual Report 2014
Page 244N O T E S T O T H E F I N A N C I A L S T A T E M E N T S
44. Litigation Against the Bank
Litigation is a common occurrence in the banking industry due to the nature of the business. The Bank has an established protocol for dealing with such legal claims. Once professional advice has been obtained on the certainty of the outcome and the amount of damages reasonably estimated, the Bank makes adjustments to account for any adverse effects which the claims may have on its financial standing. The unresolved court cases against the Bank as at the year end for which adjustments to the Financial Statements have not been made due to the uncertainty of its outcome are as follows:
As at 31st December 2014 2013
Tribunal/CourtLabour Tribunal 8 10District Court 28 22Commercial High Court 8 10Supreme Court 1 2Magistrate’s Court 9 4
45. Event Occurring after the Reporting Date
No circumstances have arisen since the reporting date which would require adjustments to or disclosure in the Financial Statements, other than those disclosed below;
Super Gain Tax
The Minister of Finance announced at the interim budget proposals on 29th January 2015, (which was passed in Parliament on 07th February 2015) that an additional one-off tax of 25% is to be charged on profits of entities which earned in excess of Rs. 2,000 Million for the year of assessment 2013/14. The Bank made a profit before tax in excess of such amount for the said year of assessment and accordingly, may be liable to pay such additional tax in the future.
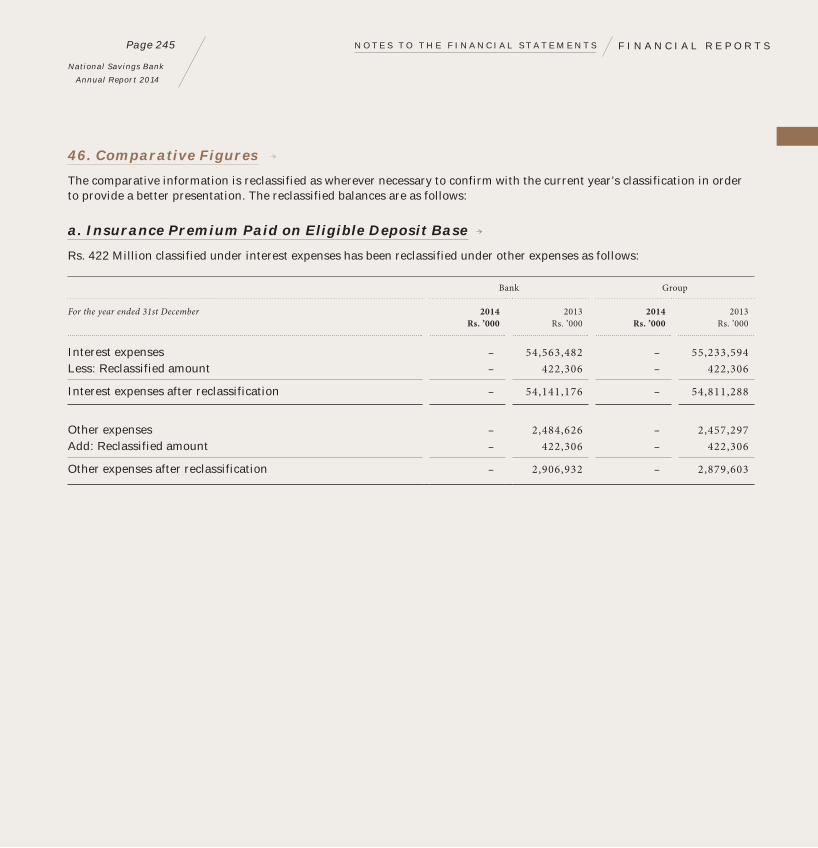
F I N A N C I A L R E P O R T S
National Savings Bank
Annual Report 2014
Page 245 N O T E S T O T H E F I N A N C I A L S T A T E M E N T S
46. Comparative Figures
The comparative information is reclassified as wherever necessary to confirm with the current year’s classification in order to provide a better presentation. The reclassified balances are as follows:
a. Insurance Premium Paid on Eligible Deposit Base
Rs. 422 Million classified under interest expenses has been reclassified under other expenses as follows:
Bank Group
For the year ended 31st December 2014Rs. ’000
2013Rs. ’000
2014Rs. ’000
2013Rs. ’000
Interest expenses – 54,563,482 – 55,233,594Less: Reclassified amount – 422,306 – 422,306
Interest expenses after reclassification – 54,141,176 – 54,811,288
Other expenses – 2,484,626 – 2,457,297Add: Reclassified amount – 422,306 – 422,306
Other expenses after reclassification – 2,906,932 – 2,879,603

F I N A N C I A L R E P O R T S
National Savings Bank
Annual Report 2014
Page 246N O T E S T O T H E F I N A N C I A L S T A T E M E N T S
47. Financial Risk Management
47.1 Risk Management Framework
Risk management requires an integrated approach that interacts with a number of factors such as strategy, structure, policies, procedures and functions etc. since all activities are interrelated and interconnected in achieving the organisation’s goals. A cohesive approach of management, development of an atmosphere for positive cultural and organisational changes, policy and structure based systems and procedures, risk identification and reporting etc. are the pillars of achieving the establishment of an Integrated Risk Management (IRM) framework in the Bank.
Risk Management Structure
The Bank has been improving its effort for establishing a cohesive risk management structure to ensure adequate oversight due to the mature and complexity of and risk inherent in the Bank’s operation. The principle responsibilities set out below extend throughout the Bank:
IRMC Integrated Risk Management Committee BAC Board Audit Committee ERMC Executive Risk Management Committee ALCO Asset and Liability Management Committee RMD Risk Management Division ORM/Rep Operational Management Representative MO Middle Office CRMU Credit Risk Management Unit
47.2 Board Risk Categories in Focus
Following board risk categories arising from financial instruments are in focus.
a. Credit risk
b. Liquidity risk
c. Market risk
d. Operational risk
e. Equity risk
f. Interest Rate risk
(a) Credit Risk
Credit risk is the possibility of losses arising from the diminution in the credit quality of borrowers or counterparties which could materialise from the banking book and both on or Off-Balance Sheet.

F I N A N C I A L R E P O R T S
National Savings Bank
Annual Report 2014
Page 247 N O T E S T O T H E F I N A N C I A L S T A T E M E N T S
47. Financial Risk Management (Cont.)
47.2 Board Risk Categories in Focus (Cont.) Credit Risk Exposures of the Bank
The total credit exposure which is 28.57% of the Bank’s total assets is the second major line of business (the investment in risk free securities is 65.94% of total assets). Hence, the magnitude of credit risk is comparatively moderate to the Bank, albeit the fact that the Bank considers credit risk as a major type of risk.
The credit exposure of the Bank is created from two main categories i.e. ‘lending to banks’ and ‘lending to other customers’ such as corporate and retail borrowers, Government and Government Institutions.
Management of the Credit Portfolio
The Bank monitors the concentration of credit risk by product and sectors. An analysis of concentration risk of the Bank portfolio (Loans and Receivables to other customers) is given below:
Bank Group
As at 31st December 2014Rs. ’000
2013Rs. ’000
2014Rs. ’000
2013Rs. ’000
Concentration by SectorAgriculture and Fishing 1,001,737 1,195,539 1,001,737 1,195,539Tourism 145,375 163,577 145,375 163,577Transport 913,895 456,551 913,895 456,551Construction/Housing 56,776,500 53,483,331 56,776,500 53,483,331Others
Infrastructure 52,692,775 6,595,707 52,692,775 6,595,707Leasing and Finance 4,521,533 5,728,880 4,521,533 5,728,880Government 4,122,500 7,511,719 4,122,500 7,511,719Education 12,924,747 3,398,654 12,924,747 3,398,654Telecommunication – 91,063 – 91,063Power and Energy 13,126,850 3,185,665 13,126,850 3,185,665Health care – 74,482 – 74,482Pawning 38,184,641 52,000,487 38,184,641 52,000,487Loan against deposit 19,802,230 20,470,214 19,802,230 20,470,214Others 15,874,541 6,519,535 15,876,627 6,521,635
Gross total 220,087,324 160,875,404 220,089,410 160,877,504

F I N A N C I A L R E P O R T S
National Savings Bank
Annual Report 2014
Page 248N O T E S T O T H E F I N A N C I A L S T A T E M E N T S
47. Financial Risk Management (Cont.)
47.2 Board Risk Categories in Focus (Cont.)
Bank Group
As at 31st December 2014Rs. ’000
2013Rs. ’000
2014Rs. ’000
2013Rs. ’000
Concentration by productLoans and receivables to other customersPawning 38,184,641 52,000,487 38,184,641 52,000,487Staff loans 2,791,077 2,659,967 2,791,077 2,659,967Term loans
Short-term 1,000,000 1,192,959 1,000,000 1,192,959Long-term 169,647,494 91,905,182 169,647,494 91,905,182
Securities purchased under resale agreements – – 2,086 2,100Others
Securitisation/Commercial papers 3,797,575 5,427,665 3,797,575 5,427,665Sri Lanka Government Securities 4,122,500 4,122,500 4,122,500 4,122,500Administrative Borrowings – 3,389,220 – 3,389,220Others 544,037 177,425 544,037 177,425
Gross total 220,087,324 160,875,404 220,089,410 160,877,504

F I N A N C I A L R E P O R T S
National Savings Bank
Annual Report 2014
Page 249 N O T E S T O T H E F I N A N C I A L S T A T E M E N T S
47. Financial Risk Management (Cont.)
47.2 Board Risk Categories in Focus (Cont.)
Bank Group
As at 31st December 2014Rs. ’000
2013Rs. ’000
2014Rs. ’000
2013Rs. ’000
Loans and Receivables to Other Customer and Impairment AnalysisIndividual impaired
Gross amount – – – –Allowance for impaired – – – –
Carrying amount – – – –
Collective impairedGross amount 193,442,661 127,607,135 193,442,661 127,607,135Allowance for impaired (3,925,172) (2,005,578) (3,925,172) (2,005,578)
Carrying amount 189,517,489 125,601,557 189,517,489 125,601,557
Past due but not individually impaired 39,707 30,064 39,707 30,064
Carrying amount 39,707 30,064 39,707 30,064
Neither past due nor impaired 26,604,956 33,238,205 26,607,042 33,240,305
Carrying amount 26,604,956 33,238,205 26,607,042 33,240,305
Total carrying amount - amortised cost 216,162,152 158,869,826 216,164,238 158,871,926
(b) Liquidity Risk
Liquidity risk is the risk that a given security or asset cannot be traded quickly enough in the market to prevent a loss ( or make the required profit).
Liquidity risk would occur in a situation where the Bank would not be able to fulfil its obligations promptly due to inadequate cushions maintained.

F I N A N C I A L R E P O R T S
National Savings Bank
Annual Report 2014
Page 250N O T E S T O T H E F I N A N C I A L S T A T E M E N T S
47. Financial Risk Management (Cont.)
47.2 Board Risk Categories in Focus (Cont.)
Concentration of Liquid Assets
The Bank’s regulatory requirement to invest 60% of its deposits in Government Securities forces the Bank to maintains a high Statutory Liquid Assets Ratio. Currently, the Bank maintains a liquidity ratio at 92% which is well above the statutory requirement of 20%. The investment in Government Securities represent 96% from the total liquid assets of the Bank.
Bank Group
Item 2014Rs. ’000
2013Rs. ’000
2014Rs. ’000
2013Rs. ’000
Liquidly assets ratioYear end 91.5 92.7 91.5 92.730th June 89.5 70.8 89.5 70.8Year beginning 92.7 69.5 92.7 69.5
Gross loans and receivables to deposit 40.9 33.9 40.9 33.9
Net loans and receivables to total assets 28.6 25.6 28.6 25.6
(c) Market Risk
Market risk to the Bank stems from movements in market prices, in particular, changes in interest rates, foreign exchange rates and equity prices. Market risk is often propagated by other forms of financial risk such as credit and market-liquidity risk. The risk of losses would arise from On-Balance Sheet as well as Off-Balance Sheet activities.
Sources of Market Risk to NSB
The exposure to market risk arise to National Savings Bank from the following sources:
Treasury securities portfolio (Government Securities and other permitted fixed income securities) Repo and reverse repo transaction Direct foreign currency borrowings and lending Foreign exchange deposits Derivatives Assets-liabilities mismatch
Foreign Exchange Risk
Foreign Exchange Risk (also known as exchange rate risk or currency risk) is a financial risk posed by an exposure to unanticipated changes in the exchange rate between two currencies.

F I N A N C I A L R E P O R T S
National Savings Bank
Annual Report 2014
Page 251 N O T E S T O T H E F I N A N C I A L S T A T E M E N T S
47. Financial Risk Management (Cont.)
47.2 Board Risk Categories in Focus (Cont.)
(d) Operational Risk
The BASEL Committee on Banking Supervision defines operational risk as ‘the risk of loss resulting from inadequate or failed internal processes, people and systems or from external events’. This definition includes legal risk but excludes strategic and reputational risk.
Operational Risk Management Framework
The Bank’s operational risk management framework provides a mechanism for improving the overall risk culture and behaviour towards operational risk management and understanding the Bank’s inherent risk through the operational risk management process which leads to making sound decisions in order to achieve the objectives of the Bank. Further, the Bank’s operational risk management functions are guided by the Board approved operational risk management policy of the Bank.
(e) Equity Risk
Equity risk is the risk that one’s investments will depreciate because of stock market dynamic causing one to lose money.
The investment in equity represent 1.00% of the total assets while investments in quoted and unquoted equity are 0.95% and 0.05% respectively. Hence, the Bank does not have a major exposure to equity risk. However, the adverse movements in the stock market affected the yield on equity investments. The investment in non-quoted companies are made due to policy decisions on market and economic development and strategic reasons.
(f) Interest Rate Risk
Interest rate risk is the risk that an investment’s value will change in the absolute level of interest rates, in the spread between two rates, in the shape of the yield curve or in any other interest rate relationships. The Bank’s major source of funding is deposits which represent 71% of total on Balance Sheet liabilities. Of this, 26% represent savings deposits where 74% represent term deposits. On the other hand, the majority of investments in Government Securities in short to medium term which represent 66% of total on Balance Sheet Assets. Hence the Bank is subject to interest rate risk to a greater extent.

F I N A N C I A L R E P O R T S
National Savings Bank
Annual Report 2014
Page 252N O T E S T O T H E F I N A N C I A L S T A T E M E N T S
47. Financial Risk Management (Cont.)
47.2 Board Risk Categories in Focus (Cont.)
Bank’s Interest Rate Sensitivity Report as at 31st December 2014 is Presented below:
Bank 0-1 monthRs. ’000
0-3 monthsRs. ’000
0-6 monthsRs. ’000
0-12 monthsRs. ’000
Interest-Bearing Assets 23,765,072 84,578,626 123,950,848 250,128,810 Bank balances and placements 1,811,641 4,422,723 9,741,251 9,741,251 Other financial assets held-for-trading 16,949 618,224 822,514 2,038,082 Loan and receivables to banks 498,705 506,427 1,257,865 5,423,312 Loan and receivables to other customers 3,253,654 10,131,916 20,315,559 55,711,719 Financial investment held-to-maturity 18,184,123 68,899,336 91,813,659 177,214,446
Interest-Bearing Liabilities 198,280,086 392,745,782 462,505,979 590,966,496 Due to banks 90,150 90,150 90,150 90,150 Due to other customers 168,584,766 344,445,592 406,228,018 533,175,216 Other borrowings 29,605,170 48,210,040 56,187,811 57,701,130
Net Rate Sensitive Assets (Liabilities) (174,515,014) (308,167,156) (338,555,131) (340,837,686)
Interest Rate Sensitivity Ratio (%) 12 22 27 42
Group’s Interest Rate Sensitivity Report as at 31st December 2014 is Presented below
Group 0-1 monthRs. ’000
0-3 monthsRs. ’000
0-6 monthsRs. ’000
0-12 monthsRs. ’000
Interest-Bearing Assets 24,014,898 85,327,771 122,035,859 252,956,482Bank balances and placements 1,811,808 4,422,890 6,384,442 9,741,418Other financial assets held-for-trading 93,861 848,960 1,520,234 3,669,770Loan and receivables to banks 498,705 506,427 1,257,865 5,423,312Loan and receivables to other customers 3,254,154 10,133,416 20,317,254 55,713,805Financial investment held-to-maturity 18,356,370 69,416,078 92,556,064 178,408,177
Interest-Bearing Liabilities 199,443,563 396,236,213 466,669,875 596,477,323Due to banks 291,723 694,869 694,869 694,869Due to other customers 168,584,766 344,445,592 406,228,018 533,175,216Other borrowings 30,567,074 51,095,752 59,746,988 62,607,238
Net Rate Sensitive Assets (Liabilities) (175,428,665) (310,908,442) (344,634,016) (343,520,841)
Interest Rate Sensitivity Ratio (%) 12 22 26 42

F I N A N C I A L R E P O R T S
National Savings Bank
Annual Report 2014
Page 253 N O T E S T O T H E F I N A N C I A L S T A T E M E N T S
47. Financial Risk Management (Cont.)
47.2 Board Risk Categories in Focus (Cont.)
Bank’s Interest Rate Sensitivity Report as at 31st December 2013 is Presented below:
Bank 0-1 monthRs. ’000
0-3 monthsRs. ’000
0-6 monthsRs. ’000
0-12 monthsRs. ’000
Interest-Bearing Assets 22,583,769 93,821,833 154,459,872 225,159,256Bank balances and placements 43,480 11,341,840 11,341,840 11,341,840Other financial assets held-for-trading 58,828 1,125,871 2,731,708 4,282,347Loan and receivables to banks 1,658,700 1,958,700 1,961,181 1,961,181Loan and receivables to other customers 13,783,743 27,678,849 45,834,563 67,783,723Financial investment held-to-maturity 7,039,018 51,716,573 92,590,580 139,790,165
Interest-Bearing Liabilities 90,657,051 254,031,743 340,567,164 484,353,904
Due to banks 126,989 126,989 126,989 126,989Due to other customers 80,665,472 242,004,615 325,954,106 464,694,475Other borrowings 9,864,589 11,900,139 14,486,069 19,532,440
Net Rate Sensitive Assets (Liabilities) (68,073,282) (160,209,911) (186,107,291) (259,194,649)
Interest Rate Sensitivity Ratio (%) 25 37 45 46
Group’s Interest Rate Sensitivity Report as at 31st December 2013 is Presented below:
Group 0-1 monthRs. ’000
0-3 monthsRs. ’000
0-6 monthsRs. ’000
0-12 monthsRs. ’000
Interest-Bearing Assets 27,675,508 94,237,520 183,241,890 227,744,075Bank balances and placements 43,683 11,342,042 11,342,042 11,342,042Other financial assets held-for-trading 409,820 1,229,461 4,104,679 5,542,288Loan and receivables to banks 728,297 2,184,890 2,235,391 2,260,641Loan and receivables to other customers 9,226,812 27,680,436 54,417,361 67,785,823Financial investment held-to-maturity 17,266,897 51,800,691 111,142,418 140,813,281
Interest-Bearing Liabilities 86,051,019 258,153,057 413,185,682 490,701,995
Due to banks 906,125 2,718,376 3,651,807 4,118,522Due to other customers 80,668,205 242,004,615 390,464,522 464,694,475Other borrowings 4,476,689 13,430,066 19,069,354 21,888,997
Net Rate Sensitive Assets (Liabilities) (58,375,511) (163,915,537) (229,943,793) (262,957,920)
Interest Rate Sensitivity Ratio (%) 32 37 44 46

F I N A N C I A L R E P O R T S
National Savings Bank
Annual Report 2014
Page 254N O T E S T O T H E F I N A N C I A L S T A T E M E N T S
48. Maturity Analysis
Bank Up to 3 months
Rs. ’000
3 - 12 months
Rs. ’000
1 - 3 years
Rs. ’000
3 - 5 years
Rs. ’000
More than 5 years
Rs. ’000
Total as at 31.12.2014
Rs. ’000
Total as at 31.12.2013
Rs. ’000
Assets with Contractual Maturity (Interest-Bearing Asset)Cash and cash equivalents 95,630 – – – – 95,630 43,480Balances with central banks – – – – – – –Placements with banks 4,327,093 5,318,528 – – – 9,645,621 11,298,360Other financial assets held-for-trading 618,224 1,419,858 1,053,737 570,181 – 3,661,999 9,979,823Loans and receivables to banks 506,427 4,916,885 278,490 832,300 – 6,534,102 7,550,509Loans and receivables to other customers 10,131,916 45,579,803 45,420,407 39,087,588 75,942,438 216,162,152 158,869,826Financial investments – held-to-maturity 68,899,336 108,315,110 127,775,599 137,640,216 67,711,076 510,341,337 432,465,113
84,578,626 165,550,184 174,528,233 178,130,285 143,653,514 746,440,841 620,207,110
Other Asset (Non-Interest- Bearing Asset)Cash and cash equivalents 1,830,964 – – – – 1,830,964 1,502,741Derivative financial instruments – 575,986 1,151,972 1,151,972 – 2,879,931 5,118,615Other financial assets held-for-trading 942,365 2,827,094 – – – 3,769,459 3,828,417Financial investments – available-for-sale – – – – 4,036,956 4,036,955 2,926,082Investments in subsidiaries – – – – 150,000 150,000 150,000Property, plant & equipment – – – – 5,529,743 5,529,743 5,610,413Intangible assets – – – – 64,652 64,652 81,803Deferred tax assets – – – – – – –Other assets 701,972 2,008,060 5,354,826 5,354,826 1,344,080 14,763,764 14,942,811
3,475,301 5,411,140 6,506,798 6,506,798 11,125,431 33,025,468 34,160,882
Total Asset 88,053,927 170,961,324 181,035,031 184,637,083 154,778,945 779,466,309 654,367,993
Liabilities with Contractual Maturity (Interest-Bearing Liability)Due to banks 90,150 – – – – 90,150 126,989Due to other customers 344,445,592 188,729,624 17,120,874 3,764,222 – 554,060,312 501,889,688Other borrowings 48,210,040 9,491,090 1,713,358 131,687,636 – 191,102,124 120,433,536
392,745,782 198,220,714 18,834,232 135,451,858 – 745,252,586 622,450,213
Other Liabilities (Non-Interest- Bearing Liability)Current tax liabilities – – – – – – –Deferred tax liabilities – – – – 269,754 269,754 143,450Other liabilities 277,632 734,242 1,946,806 1,944,896 5,780,169 10,683,745 9,556,844Stated capital/Assigned capital – – – – 3,200,000 3,200,000 3,200,000Statutory reserve fund – – – – 1,874,135 1,874,135 1,736,803Other reserves – – – – 18,186,088 18,186,088 17,280,684
277,632 734,242 1,946,806 1,944,896 29,310,146 34,213,723 31,917,780
Total Liabilities 393,023,414 198,954,956 20,781,038 137,396,754 29,310,146 779,466,309 654,367,993

F I N A N C I A L R E P O R T S
National Savings Bank
Annual Report 2014
Page 255 N O T E S T O T H E F I N A N C I A L S T A T E M E N T S
48. Maturity Analysis (Cont.)
Group Up to 3 months
Rs. ’000
3 - 12 months
Rs. ’000
1 - 3 years
Rs. ’000
3 - 5 years
Rs. ’000
More than 5 years
Rs. ’000
Total as at 31.12.2014
Rs. ’000
Total as at 31.12.2013
Rs. ’000
Assets with Contractual Maturity (Interest-Bearing Asset)Cash and cash equivalents 95,630 – – – – 95,630 43,480Balances with central banks 167 – – – – 167 203Placements with banks 4,327,093 5,318,528 – – – 9,645,621 11,298,360Other financial assets held-for-trading 848,960 2,820,810 1,392,912 1,931,742 791,304 7,785,727 14,283,494Loans and receivables to banks 506,427 4,916,885 278,490 832,300 – 6,534,102 7,849,969Loans and receivables to other customers 10,133,416 45,580,389 45,420,407 39,087,588 75,942,438 216,164,238 158,871,926Financial investments – held-to-maturity 69,416,078 108,992,099 129,163,733 138,426,178 67,711,076 513,709,164 435,959,845
85,327,771 167,628,711 176,255,542 180,277,808 144,444,818 753,934,649 628,307,276
Other Asset (Non-Interest- Bearing Asset)Cash and cash equivalents 1,834,897 – – – – 1,834,897 1,513,787Derivative financial instruments – 575,986 1,151,972 1,151,972 – 2,879,931 5,118,615Other financial assets held-for-trading 942,365 2,827,094 – – – 3,769,459 3,828,417Financial investments – available-for-sale – – – – 4,037,956 4,037,955 2,927,082Investments in subsidiaries – – – – – – –Property, plant & equipment – – – – 5,530,622 5,530,622 5,611,100Intangible assets – – – – 64,659 64,659 81,888Deferred tax assets – – – – 668 668 568Other assets 703,135 2,011,550 5,364,134 5,364,134 1,348,734 14,791,687 14,957,063
3,480,397 5,414,630 6,516,106 6,516,106 10,982,639 32,909,878 34,038,520
Total Asset 88,808,168 173,043,341 182,771,648 186,793,914 155,427,457 786,844,527 662,345,797
Liabilities with Contractual Maturity (Interest-Bearing Liability)Due to banks 694,869 – – – – 694,869 4,118,522Due to other customers 344,445,592 188,729,624 17,120,874 3,764,222 – 554,060,312 501,889,688Other borrowings 51,095,752 11,511,486 1,713,358 131,687,636 – 196,008,232 122,790,093
396,236,213 200,241,110 18,834,232 135,451,858 – 750,763,413 628,798,304
Other Liabilities (Non-Interest- Bearing Liability)Current tax liabilities – 86,575 – – – 86,575 33,205Deferred tax liabilities – – – – 269,754 269,754 143,450Other liabilities 278,300 736,245 1,952,147 1,950,237 5,782,840 10,699,769 9,574,014Stated capital/Assigned capital – – – – 3,200,000 3,200,000 3,200,000Statutory reserve fund – – – – 1,874,135 1,874,135 1,736,803Other reserves – – – – 19,950,880 19,950,880 18,860,023
278,300 822,820 1,952,147 1,950,237 31,077,609 36,081,114 33,547,494
Total Liabilities 396,514,513 201,063,930 20,786,379 137,402,095 31,077,609 786,844,527 662,345,797

F I N A N C I A L R E P O R T S
National Savings Bank
Annual Report 2014
Page 256N O T E S T O T H E F I N A N C I A L S T A T E M E N T S
49. Capital Adequacy and Management (As per Regulatory Reporting)
Capital adequacy measures the adequacy of Bank’s aggregate capital in relation to the risks, which may arise from its assets and off-balance sheet transaction, its dealing operations and its human activities, technology and natural incident. Central Bank of Sri Lanka has prescribed the minimum risk sensitive capital and effective from January 2008 required the Bank to compute the regulatory capital requirements in accordance with the “International Convergence of Capital Measurement and Capital Standards - a Revised Framework” (BASEL - II ). The Bank’s capital adequacy position has been computed under the following approaches of BASEL II, which are currently effective to the local banking industry:
Standardised approach for credit risk Standardised measurement method for market risk Basic indicator approach for operational risk
Capital and Risk-Weighted Assets - Bank
Bank Group
As at 31st December Minimum Requirement 2014 2013 2014 2013
Capital to Risk-Weighted Assets RatioTier I (%) 22.96 21.19 24.01 22.43Deduction - Tier I (%) (2.50) (2.69) (2.42) (2.59)
Core Capital Ratio (%) 5 20.46 18.50 21.59 19.84Tier II (%) 21.48 19.41 22.61 20.74Deduction - Tier II (%) (2.50) (2.69) (2.42) (2.59)
Total Capital Ratio (%) 10 18.98 16.72 20.19 18.15

F I N A N C I A L R E P O R T S
National Savings Bank
Annual Report 2014
Page 257 N O T E S T O T H E F I N A N C I A L S T A T E M E N T S
Details of Computation
Capital Base
Bank Group
As at 31st December 2014Rs. ’000
2013Rs. ’000
2014Rs. ’000
2013Rs. ’000
Tier I: Core CapitalStated Capital 3,200,000 3,200,000 3,200,000 3,200,000 Statutory reserve fund 1,903,809 1,737,993 1,903,809 1,737,993 General and other reserves 20,941,142 14,194,721 22,282,734 15,400,626
26,044,951 19,132,714 27,386,543 20,338,619
Less: Deductions50% Investment in the capital of other banks and financial institutions/subsidiary 2,839,759 2,427,298 2,764,759 2,352,298
Total Tier I Capital 23,205,192 16,705,416 24,621,784 17,986,321
Tier II: Supplementary capital
General provisions and Revaluation Reserve 1,162,217 818,589 1,162,217 818,589
Less: Deductions50% Investment in the capital of other banks and financial institutions/subsidiary 2,839,759 2,427,298 2,764,759 2,352,298
Eligible Tier II Capital (1,677,542) (1,608,709) (1,602,542) (1,533,709)
Capital Base 21,527,650 15,096,707 23,019,242 16,452,612
Composition of Total Risk-Weighted Assets
Total risk-weighted assets and off-balance sheet exposure for credit risk 77,087,034 58,008,991 77,090,344 58,028,301 Total risk-weighted assets equivalent for market risk 12,397,030 11,067,470 12,710,870 11,309,850 Total risk-weighted assets equivalent for operational risk 23,930,514 21,223,336 24,235,794 21,299,422
Total Risk-Weighted Assets 113,414,578 90,299,797 114,037,008 90,637,573

F I N A N C I A L R E P O R T S
National Savings Bank
Annual Report 2014
Page 258N O T E S T O T H E F I N A N C I A L S T A T E M E N T S
50. Fair Value of Financial Instruments
50.1 Financial Instruments Recorded at Fair Value
The following is a description of how fair values are determined for financial instruments that are recorded at fair value using valuation techniques. These incorporate the Bank’s estimate of assumptions that a market participant would make when valuing the instruments.
DerivativesDerivative products (Foreign Currency swaps/Cash Flow Hedges) valued using valuation techniques incorporating various inputs such as foreign exchange spot rates and foreign exchange forward rates.
Financial Assets Held-for-Tradingi. Government Treasury Bills and Bonds.Financial assets held-for-trading are valued using a valuation technique consists of Government Treasury Bills and Treasury Bonds. The Bank values the securities using discounted cash flow valuation models which incorporate observable data. Observable inputs include assumptions regarding current rates of interest, broker statements and market data publishing by Central Bank of Sri Lanka.
ii. Equity SecuritiesThe Bank values the equity securities using the quoted prices available for the identical securities in active market.
Available-for-SalesThe Bank values the quoted equity securities using the quoted prices available for the identical securities in active market.
The unquoted equity securities have been fair valued using a valuation model based on observable data.
50.2 Determination of Fair Value and Fair Value Hierarchy
The Bank uses the following hierarchy for determining and disclosing the fair value of financial instruments by valuation technique:
Level 1: Quoted (unadjusted) price in active markets for identical assets or liabilities.
Level 2: Other techniques for which all inputs which have a significant effect on the recorded fair value are observable, either directly or indirectly.
Level 3: Techniques which use inputs that have a significant effect on the recorded fair value that are not based on observable market data.

F I N A N C I A L R E P O R T S
National Savings Bank
Annual Report 2014
Page 259 N O T E S T O T H E F I N A N C I A L S T A T E M E N T S
50. Fair Value of Financial Instruments (Cont.)
50.2 Determination of Fair Value and Fair Value Hierarchy (Cont.)
The following table shows an analysis of financial instruments recorded at fair value by level of the fair value hierarchy:
BankAs at 31st December 2014 Level 1
Rs. ’000Level 2
Rs. ’000Level 3
Rs. ’000Total
Rs. ’000
Derivative Financial Instruments Foreign currency swaps – – 2,879,931 2,879,931 Financial assets held-for-trading Government Treasury Bills and Bonds 3,662,000 – – 3,662,000 Equity Securities 3,769,459 – – 3,769,459 Available-for-sale Equity Securities - Quoted 3,634,808 – – 3,634,808 Equity Securities - Unquoted – 344,656 – 344,656
Total financial assets 11,066,267 344,656 2,879,931 14,290,854
BankAs at 31st December 2013 Level 1
Rs. ’000Level 2
Rs. ’000Level 3
Rs. ’000Total
Rs. ’000
Derivative Financial Instruments Foreign currency swaps – – 5,118,615 5,118,615 Financial assets held-for-trading Government Treasury Bills and Bonds 9,979,822 – – 9,979,822 Equity Securities 3,828,417 – – 3,828,417 Available-for-sale Equity Securities - Quoted 2,628,554 – – 2,628,554 Equity Securities - Unquoted – 240,037 – 240,037
Total financial assets 16,436,792 240,037 5,118,615 21,795,444

F I N A N C I A L R E P O R T S
National Savings Bank
Annual Report 2014
Page 260N O T E S T O T H E F I N A N C I A L S T A T E M E N T S
50. Fair Value of Financial Instruments (Cont.)
50.2 Determination of Fair Value and Fair Value Hierarchy (Cont.)
GroupAs at 31st December 2014 Level 1
Rs. ’000Level 2
Rs. ’000Level 3
Rs. ’000Total
Rs. ’000
Derivative Financial Instruments Foreign currency swaps – – 2,879,931 2,879,931 Financial assets held-for-trading Government Treasury Bills and Bonds 7,768,693 – – 7,768,693 Equity Securities 3,769,459 – – 3,769,459 Debt Securities - Debenture – 17,035 – 17,035 Available-for-sale Equity Securities - Quoted 3,634,808 – – 3,634,808 Equity Securities - Unquoted – 344,656 – 344,656
Total financial assets 15,172,960 361,691 2,879,931 18,414,581
GroupAs at 31st December 2013 Level 1
Rs. ’000Level 2
Rs. ’000Level 3
Rs. ’000Total
Rs. ’000
Derivative Financial Instruments Foreign currency swaps – – 5,118,615 5,118,615 Financial assets held-for-trading Government Treasury Bills and Bonds 14,283,494 – – 14,283,494 Equity Securities 3,828,417 – – 3,828,417 Available-for-sale Equity Securities - Quoted 2,628,554 – – 2,628,554 Equity Securities - Unquoted – 240,037 – 240,037
Total financial assets 20,740,464 240,037 5,118,615 26,099,116

F I N A N C I A L R E P O R T S
National Savings Bank
Annual Report 2014
Page 261 N O T E S T O T H E F I N A N C I A L S T A T E M E N T S
50. Fair Value of Financial Instruments (Cont.)
50.3 Fair Value of financial instruments – Bank
Determination of fair value and fair value hierarchy
2014 2013
As at 31st December Carrying amountRs. ’000
Fair valueRs. ’000
Carrying amountRs. ’000
Fair valueRs. ’000
Financial AssetsCash and cash equivalents 1,926,594 1,926,594 1,546,221 1,546,221 Balances with central banks – – – – Placement with banks 9,645,621 9,645,621 11,298,360 11,298,360 Derivative financial instruments 2,879,931 2,879,931 5,118,615 5,118,615 Other financial assets held-for-trading 7,431,458 7,431,458 13,808,239 13,808,239Loans and receivable to banks 6,534,102 6,534,102 7,550,509 7,550,509 Loans and receivable to other customers 216,162,152 216,941,792 158,869,826 157,234,740 Financial investments – available-for-sale 4,036,955 4,036,955 2,926,082 2,926,082 Financial investments – held-to-maturity 510,341,337 524,654,742 432,465,113 434,395,138
758,958,150 774,051,195 633,582,965 633,877,905
Financial LiabilitiesDue to banks 90,150 90,150 126,989 126,989 Due to other customers 554,060,312 550,043,022 501,889,688 495,777,197 Other borrowings 191,102,124 191,102,124 120,433,536 120,433,536
745,252,586 741,235,297 622,450,212 616,337,722

F I N A N C I A L R E P O R T S
National Savings Bank
Annual Report 2014
Page 262N O T E S T O T H E F I N A N C I A L S T A T E M E N T S
50. Fair Value of Financial Instruments (Cont.)
50.3 Fair Value of financial instruments – Group
2014 2013
As at 31st DecemberCarrying amount
Rs. ’000Fair value
Rs. ’000Carrying amount
Rs. ’000Fair value
Rs. ’000
Financial AssetsCash and cash equivalents 1,930,527 1,930,527 1,557,267 1,557,267 Balances with central banks 167 167 203 203 Placement with banks 9,645,621 9,645,621 11,298,360 11,298,360 Derivative financial instruments 2,879,931 2,879,931 5,118,615 5,118,615 Other financial assets held-for-trading 11,555,186 11,555,186 18,111,911 18,111,911 Loans and receivable to banks 6,534,102 6,534,102 7,849,969 7,849,969 Loans and receivable to other customers 216,164,238 216,943,878 158,871,926 157,236,840 Financial investments – available-for-sale 4,037,955 4,037,955 2,927,082 2,927,082 Financial investments – held-to-maturity 513,709,164 528,042,145 435,959,845 437,783,773
766,456,891 781,569,512 641,695,178 641,884,021
Financial LiabilitiesDue to banks 694,869 694,869 4,118,522 4,118,522 Due to other customers 554,060,312 550,043,022 501,889,688 495,777,197 Other borrowings 196,008,232 196,008,232 122,790,093 122,790,093
750,763,413 746,746,124 628,798,302 622,685,812

F I N A N C I A L R E P O R T S
National Savings Bank
Annual Report 2014
Page 263 N O T E S T O T H E F I N A N C I A L S T A T E M E N T S
50. Fair Value of Financial Instruments (Cont.)
50.4 Determination of Fair Value and Fair Value Hierarchy
Fair Value of Financial Assets and Liabilities not Carried at Fair Value
The following describes the methodologies and assumptions used to determine the fair values for those financial instruments which are not recorded at fair value in the Financial Statements.
Assets for which Fair Value Approximates Carrying Value
For financial assets and financial liabilities that have a short-term maturity (original maturities less than a year). It is assumed that the carrying amount approximate their fair values. This assumption is also applied to savings deposits without specific maturity.
Long-term deposits accepted from customers for which periodical interest is paid and loan & advances granted to customers with a variable rate are also considered to be carried at fair value in the books.
Fixed Rate Financial Instruments
Carrying amounts are considered as fair values for short-term credit facilities. In Fair valuing held-to-maturity securities, rates published by the CBSL for similar trading securities were used. Loans and advance with fixed interest rates were fair valued using market rates at which fresh loans were granted during the fourth quarter of the reporting year. Conversely, fixed deposits with original tenors above one year and interest paid at maturity were discounted using current market rates offered to customers during the fourth quarter of the reporting year.

F I N A N C I A L R E P O R T S
National Savings Bank
Annual Report 2014
Page 264N O T E S T O T H E F I N A N C I A L S T A T E M E N T S

A N N E X E S
National Savings Bank
Annual Report 2014
Page 265
Annexes
Statement of Comprehensive Income in US Dollars – 266Statement of Financial Position in US Dollars – 268
Statistical Indicators 2005-2014 – 269Analysis of Deposits – 271
Our Products and Services – 272Branch Network – 278
Correspondent Banks – 280Exchange Companies – 281
GRI Content Index: ‘In accordance’ with Core Criteria – 283Glossary of Financial and Banking Terms – 287
Corporate Information – 291
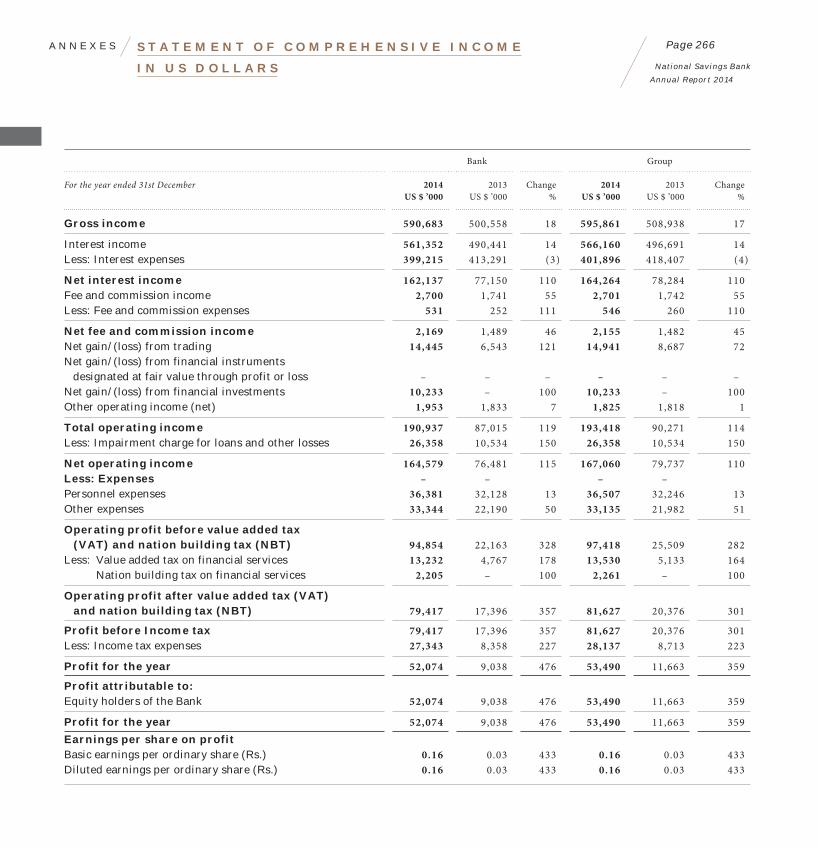
A N N E X E S
National Savings Bank
Annual Report 2014
Page 266S T A T E M E N T O F C O M P R E H E N S I V E I N C O M E
I N U S D O L L A R S
Bank Group
For the year ended 31st December 2014US $ ’000
2013US $ ’000
Change %
2014US $ ’000
2013US $ ’000
Change %
Gross income 590,683 500,558 18 595,861 508,938 17
Interest income 561,352 490,441 14 566,160 496,691 14 Less: Interest expenses 399,215 413,291 (3) 401,896 418,407 (4)
Net interest income 162,137 77,150 110 164,264 78,284 110 Fee and commission income 2,700 1,741 55 2,701 1,742 55 Less: Fee and commission expenses 531 252 111 546 260 110
Net fee and commission income 2,169 1,489 46 2,155 1,482 45 Net gain/(loss) from trading 14,445 6,543 121 14,941 8,687 72 Net gain/(loss) from financial instruments designated at fair value through profit or loss – – – – – –Net gain/(loss) from financial investments 10,233 – 100 10,233 – 100 Other operating income (net) 1,953 1,833 7 1,825 1,818 1
Total operating income 190,937 87,015 119 193,418 90,271 114 Less: Impairment charge for loans and other losses 26,358 10,534 150 26,358 10,534 150
Net operating income 164,579 76,481 115 167,060 79,737 110Less: Expenses – – – – Personnel expenses 36,381 32,128 13 36,507 32,246 13Other expenses 33,344 22,190 50 33,135 21,982 51
Operating profit before value added tax (VAT) and nation building tax (NBT) 94,854 22,163 328 97,418 25,509 282 Less: Value added tax on financial services 13,232 4,767 178 13,530 5,133 164 Nation building tax on financial services 2,205 – 100 2,261 – 100
Operating profit after value added tax (VAT) and nation building tax (NBT) 79,417 17,396 357 81,627 20,376 301
Profit before Income tax 79,417 17,396 357 81,627 20,376 301 Less: Income tax expenses 27,343 8,358 227 28,137 8,713 223
Profit for the year 52,074 9,038 476 53,490 11,663 359
Profit attributable to:Equity holders of the Bank 52,074 9,038 476 53,490 11,663 359
Profit for the year 52,074 9,038 476 53,490 11,663 359 Earnings per share on profit Basic earnings per ordinary share (Rs.) 0.16 0.03 433 0.16 0.03 433 Diluted earnings per ordinary share (Rs.) 0.16 0.03 433 0.16 0.03 433
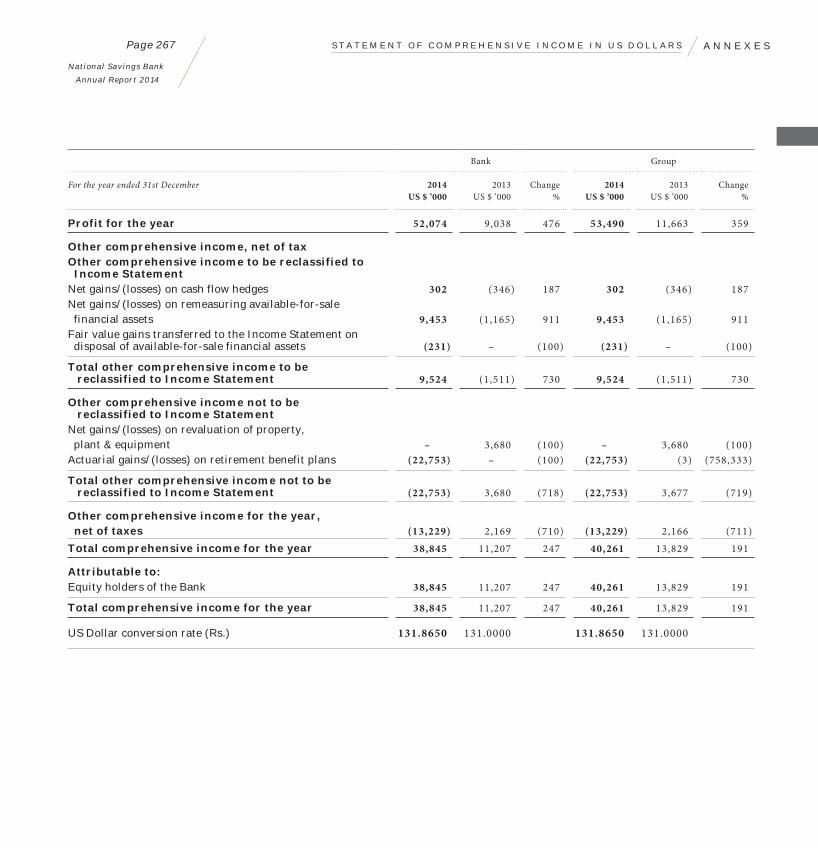
A N N E X E S
National Savings Bank
Annual Report 2014
Page 267 S T A T E M E N T O F C O M P R E H E N S I V E I N C O M E I N U S D O L L A R S
Bank Group
For the year ended 31st December 2014US $ ’000
2013US $ ’000
Change %
2014US $ ’000
2013US $ ’000
Change %
Profit for the year 52,074 9,038 476 53,490 11,663 359
Other comprehensive income, net of taxOther comprehensive income to be reclassified to Income StatementNet gains/(losses) on cash flow hedges 302 (346) 187 302 (346) 187 Net gains/(losses) on remeasuring available-for-sale financial assets 9,453 (1,165) 911 9,453 (1,165) 911 Fair value gains transferred to the Income Statement on disposal of available-for-sale financial assets (231) – (100) (231) – (100)
Total other comprehensive income to be reclassified to Income Statement 9,524 (1,511) 730 9,524 (1,511) 730
Other comprehensive income not to be reclassified to Income StatementNet gains/(losses) on revaluation of property, plant & equipment – 3,680 (100) – 3,680 (100)Actuarial gains/(losses) on retirement benefit plans (22,753) – (100) (22,753) (3) (758,333)
Total other comprehensive income not to be reclassified to Income Statement (22,753) 3,680 (718) (22,753) 3,677 (719)
Other comprehensive income for the year, net of taxes (13,229) 2,169 (710) (13,229) 2,166 (711)Total comprehensive income for the year 38,845 11,207 247 40,261 13,829 191
Attributable to:Equity holders of the Bank 38,845 11,207 247 40,261 13,829 191
Total comprehensive income for the year 38,845 11,207 247 40,261 13,829 191
US Dollar conversion rate (Rs.) 131.8650 131.0000 131.8650 131.0000

A N N E X E S
National Savings Bank
Annual Report 2014
Page 268S T A T E M E N T O F F I N A N C I A L P O S I T I O N
I N U S D O L L A R S
Bank Group
As at 31st December 2014US $ ’000
2013US $ ’000
Change %
2014US $ ’000
2013US $ ’000
Change %
AssetsCash and cash equivalents 14,610 11,803 24 14,640 11,888 23 Balances with Central Banks – – – 1 2 (50)Placements with banks 73,148 86,247 (15) 73,148 86,247 (15)Derivative financial instruments 21,840 39,073 (44) 21,840 39,073 (44)Other financial assets held-for-trading 56,357 105,406 (47) 87,629 138,259 (37)Financial assets designated at fair value through profit or loss – – – – – – Loans and receivables to banks 49,551 57,637 (14) 49,551 59,923 (17)Loans and receivables to other customers 1,639,269 1,212,747 35 1,639,284 1,212,763 35 Financial investments – Available-for-sale 30,614 22,337 37 30,622 22,344 37 Financial investments – Held-to-maturity 3,870,180 3,301,260 17 3,895,720 3,327,938 17 Investments in subsidiaries 1,138 1,145 (1) – – – Property, plant & equipment 41,935 42,828 (2) 41,942 42,833 (2)Intangible assets 490 624 (21) 490 625 (22)Deferred tax assets – – – 5 4 25 Other assets 111,961 114,067 (2) 112,173 114,176 (2)
Total assets 5,911,094 4,995,175 18 5,967,048 5,056,074 18
LiabilitiesDue to banks 684 969 (29) 5,270 31,439 (83)Due to other customers 4,201,724 3,831,219 10 4,201,724 3,831,219 10 Other borrowings 1,449,226 919,340 58 1,486,431 937,329 59 Current tax liabilities – – – 657 253 160 Deferred tax liabilities 2,046 1,095 87 2,046 1,095 87 Other liabilities 81,020 72,953 11 81,142 73,084 11
Total liabilities 5,734,700 4,825,576 19 5,777,270 4,874,419 19
EquityStated capital 24,267 24,427 (1) 24,267 24,427 (1)Statutory reserve fund 14,213 13,258 7 14,213 13,258 7 Other reserves 137,914 131,914 5 151,298 143,970 5
Total equity of the owners of the Parent 176,394 169,599 4 189,778 181,655 4
Total equity 176,394 169,599 4 189,778 181,655 4
Total equity and liabilities 5,911,094 4,995,175 18 5,967,048 5,056,074 18
Contingent liabilities and commitments 450,799 531,222 (15) 450,799 531,222 (15)
US Dollar conversion rate (Rs.) 131.8650 131.0000 131.8650 131.0000

A N N E X E S
National Savings Bank
Annual Report 2014
Page 269 S T A T I S T I C A L I N D I C A T O R S 2 0 0 5 - 2 0 1 4
2005Rs. Million
2006Rs. Million
2007Rs. Million
2008Rs. Million
2009Rs. Million
2010Rs. Million
2011Rs. Million
2012Rs. Million
2013Rs. Million
2014Rs. Million
Operating ResultsGross Income 21,213 24,439 30,830 41,247 49,803 50,070 46,545 52,903 65,573 77,890 Interest Income 20,196 23,956 30,370 40,834 49,046 48,142 47,096 52,531 64,248 74,023 Interest Expenses 13,480 16,536 22,188 31,190 36,067 31,487 29,296 39,142 54,141 52,642 Net Interest Income 6,716 7,420 8,182 9,643 12,979 16,655 17,800 13,389 10,107 21,380 Other Income 1,017 483 460 413 757 1,929 (578) 347 1,292 3,798 Operating Expenses, provisions & VAT 4,276 4,402 5,340 6,956 6,792 8,807 7,967 7,396 9,120 14,706 Profit before Tax 3,457 3,501 3,302 3,100 6,943 9,777 9,255 6,340 2,279 10,472 Income Tax 1,351 1,616 1,729 2,041 3,229 4,386 3,193 2,578 1,095 3,606 Profit after Tax 2,106 1,885 1,573 1,059 3,714 5,391 6,062 3,763 1,184 6,867 Contribution to the Government 3,100 3,573 3,974 4,287 7,277 10,107 7,970 6,327 4,731 11,043
AssetsCash & Short-Term Funds 861 480 533 1,146 855 1,355 1,398 1,466 1,546 1,927Loans & Investments 212,116 224,642 256,705 277,157 335,520 395,334 455,914 492,009 632,187 757,182Property,Plant & Equipment/ Leasehold Property/ Intangible Assets 1,564 1,934 2,513 3,006 3,584 4,971 5,247 5,264 5,692 5,594Other Assets 7,574 8,522 10,453 13,010 14,463 2,733 3,415 10,075 14,943 14,764
Total 222,115 235,578 270,204 294,319 354,422 404,393 465,974 508,813 654,368 779,466
Liabilities and Shareholders’ FundsTotal Deposits 202,424 212,233 235,304 259,562 313,007 364,430 421,849 457,650 501,890 554,060Repo/Borrowings 22 2,075 10,789 6,205 8,730 11,436 16,270 22,958 120,561 191,192Differed Taxation 32 16 29 56 84 27 96 123 143 270Other Liabilities 7,116 8,274 10,819 13,497 14,841 5,997 4,707 4,314 9,557 10,684Shareholders’ Funds 12,521 12,979 13,263 15,000 17,760 22,503 23,052 23,767 22,217 23,260
Total 222,115 235,578 270,204 294,319 354,422 404,393 465,974 508,813 654,368 779,466

A N N E X E S
National Savings Bank
Annual Report 2014
Page 270S T A T I S T I C A L I N D I C A T O R S 2 0 0 5 - 2 0 1 4
2005Rs. Million
2006Rs. Million
2007Rs. Million
2008Rs. Million
2009Rs. Million
2010Rs. Million
2011Rs. Million
2012Rs. Million
2013Rs. Million
2014Rs. Million
RatiosIncome Growth 9.6 15.2 26.2 33.8 20.7 0.5 7.0 13.7 23.9 18.8 Interest Margin 3.2 3.2 3.2 3.4 4.0 4.4 4.1 2.7 1.7 3.0 NIM/Gross Income 31.7 30.4 26.5 23.4 26.1 33.3 38.2 25.3 15.4 27.4 Personnel Cost/Gross Income 10.5 11.2 8.8 7.5 6.9 7.4 8.9 7.7 6.4 6.2 Overheads (Excluding Prov.)/ Gross Income 14.4 15.1 12.6 11.2 10.7 12.0 13.5 12.0 10.9 11.8 Profit Before Tax/ Gross Income 16.3 14.3 10.7 7.5 13.9 19.5 19.9 12.0 3.5 13.4 Contribution to the GOSL/ Gross Income 14.6 14.6 12.9 10.4 14.6 20.2 17.1 12.0 7.2 14.1Cost to Deposits 2.0 2.3 2.2 2.4 2.7 2.7 2.0 1.7 1.6 2.1 Cost to Income with VAT 50.4 59.4 56.5 58.5 55.5 48.9 45.4 52.8 67.7 44.5 Cost to Income without VAT 39.4 46.7 44.9 46.1 38.8 32.4 36.4 46.1 62.2 36.4 Return on Average Shareholders’ Funds (ROE) 17.6 14.8 12.0 7.5 22.7 27.3 26.6 16.1 5.1 30.2Return on Average Assets (ROA) 1.6 1.5 1.3 1.1 2.1 2.6 2.1 1.3 0.4 1.5Capital Adequacy - Tier I (Minimum 5%) 45.0 40.7 33.3 23.2 25.1 22.2 20.1 20.4 18.5 20.5Capital Adequacy - Tier II (Minimum 10%) 21.8 11.8 12.2 17.7 21.5 19.2 17.7 19.1 16.7 19.0Deposits as % of Assets 91.1 90.1 87.1 88.2 88.3 88.0 90.5 89.9 76.7 71.1Profit per Employee (Rs. ’000) 1,196 1,207 1,152 1,077 2,382 3,205 2,826 2,027 774 3,119Deposit per Employee (Rs. ’000) 70,043 73,184 82,073 90,157 107,378 116,513 128,809 146,308 170,537 164,997
Other InformationNo of Employees 2,890 2,900 2,867 2,879 2,915 3,050 3,275 3,128 2,943 3,407No of Branches 128 130 130 137 157 186 210 219 229 236Post Offices/Sub-Post Offices 4,043 4,048 4,042 4,045 4,055 4,053 4,058 4,053 4,063 4,063Account Holders (Million) 14.6 15.1 15.5 15.6 16.3 16.7 17.0 17.4 17.9 18.3

A N N E X E S
National Savings Bank
Annual Report 2014
Page 271
2008Rs. Million
2009Rs. Million
2010Rs. Million
2011Rs. Million
2012Rs. Million
2013Rs. Million
2014Rs. Million
Local Currency DepositsSavings 71,667 79,280 94,118 105,108 106,177 113,165 139,384 Time 185,755 230,147 266,007 311,569 345,794 379,969 408,309
257,422 309,427 360,125 416,677 451,971 493,134 547,692 Growth % 10.0 20.2 13.5 15.7 8.5 9.1 11.1
Foreign Currency DepositsSavings 826 1,255 1,517 1,750 1,963 2,101 2,215 Time 1,314 2,325 2,788 3,422 3,717 6,654 4,153
2,140 3,580 4,305 5,172 5,679 8,755 6,368
Growth % 59.3 67.3 20.3 20.1 9.8 54.2 -27.3
Total Deposits 259,562 313,007 364,430 421,849 457,650 501,890 554,060
Growth % 10.3 20.6 13.5 15.8 8.5 9.7 10.4
A N A L Y S I S O F D E P O S I T S

A N N E X E S
National Savings Bank
Annual Report 2014
Page 272O U R P R O D U C T S A N D S E R V I C E S

A N N E X E S
National Savings Bank
Annual Report 2014
Page 273
Savings Accounts
Ordinary Savings Account
Ordinary Savings Accounts can be opened on behalf of individuals/special funds/social organisations/bank guarantees/legal compensations and or as joint accounts with a minimum deposit of Rs.100/-. Any citizen over seven years of age can open a Savings Account for themselves. All Savings Account holders are entitled to a gratuity scheme upto Rs. One Million, an ATM Shopping Card or Platinum Card with Master/ Visa Card facility, standing order facility and loans against savings balance. Further, account holders can enjoy doorstep banking experience with SMS Banking and Internet Banking facility.
Salary Earners’ Savings Account (SESA)
Salary Earners’ Savings Account (SESA) facilitates salary earners to receive the salary on the same day. SESA account holders are entitled to competitive rates on pawning advances and purchasing of cheques and they can also pay monthly bills and make withdrawals via these accounts. Further, with the assistance of SMS Banking and Internet Banking facilities, they can process numerous banking activities while they are at work and inturn save time. The SESA account holders are allowed to transfer funds and issue standing orders for NSB A/Cs free of charge.
O U R P R O D U C T S A N D S E R V I C E S
Hapan Children’s Savings Account
Hapan Children’s Savings Account is for children upto 16 years of age. The children aged 7 -16 can function the account by themselves, while children below 7 can open and operate the account, in care of their parents/guardians. Hapan Children’s Savings Account holders are offered a 1% additional interest than the ordinary savings to encourage the good old habit of saving. The account holders who maintain a minimum balance of Rs. 2,500/- are also eligible for “Hapan Scholarship Awards”. The Bank expects to conduct over 150 free scholarship seminars annually for grade five students in both Sinhala and Tamil mediums. Thus far, we have conducted over 1,200 free scholarships seminars during the past 14 years.
Ithuru Mithuru Savings Account
To encourage the savings habit among the youth, we offer a cluster of benefits to young people between 16 - 30 years of age and they can maintain the account until the age of 35. Ithuru Mithuru Savings Account holders are entitled to an additional interest of 0.5% than the ordinary savings. They are also entitled to NSB Shopping Card with Master/ Visa Card facility. Students can apply for the ISIC International Student Master Card that brings discounts and other benefits, both locally and in 120 countries. An Ithuru Mithuru Savings Account holder can request for a Buddhi Higher Education Loan, Personal Loans, Auto Loans, Computer Loans and Housing Loans.
Sthree Savings Account
Little drops of water make the mighty ocean, likewise your dream to strengthen the economy of your family by saving ‘Sathen Sathe, Rupiyalen Rupiyala’, will come true with Sthree Savings Account. Sthree Savings Account is exclusively designed for ladies over 16 years of age. Account holders are entitled to NSB Shopping Card with Master/Visa Card facility. You can obtain loans against the balance in your Sthree Savings Account. Attractive interest rates are applicable to Personal Loans. You will also receive special interest concessions on Ran Sahana Pawning Facility, where you will be entitled to 0.5% less interest upto a pawning advance of Rs. 100,000/-. In addition, Sthree Account holders are entitled to a gift on their wedding day by way of a cash prize of Rs.25,000/- and they are eligible to receive a free Prarthana Children’s Savings Certificate with a face value of Rs.100,000/- for one baby. You can open Sthree Thepal Savings Accounts and operate them through Post Offices and Sub-Post Offices islandwide.
NSB Divi Surakum
The twilight years of life after 55 could be a challenge for anyone, whose income is not secured; NSB Divi Surakum is an ideal option that offers you a monthly pension installment (annuity) for life from the first month since reaching 55. If you are above 35, you can choose either the monthly deposit or the lump sum deposit option to draw your pension. If you are aged 55 to 64 years you
can make a lump sum deposit and be entitled for a pension. Married account holders can nominate their spouse and children below 18 years of age. An insurance cover is also available for the beneficiaries aged 55 to 75 years of age.
NSB Pension+ Account
If you want to have a pension together with the money saved, you should open a NSB Pension+ Account. It is a contributory retirement benefit scheme with a higher rate of return along with a free life cover and a medical cover, upto Rs. One Million each. Any person over 16 can open a NSB Pension+ Account. The deposit amount and the period of contribution are at the choice of the customer. Retirement benefits can be drawn from the age of 55 as a pension for lifetime or for a predetermined period of time or as a lump sum or in any form of combination of these. (Conditions will apply.)
Smile Savings Account
Being the banker of the underprivileged, NSB has introduced Smile Savings Account as an attractive account with many benefits to customers. Citizens above the age of 16 may open and operate the account individually or jointly, while the children aged 7 -16 can function the account by themselves and children below 7 can open and operate the account in care of their parents/guardians. You can make deposits and withdrawals at any NSB Branch or Post Office or Sub-Post Office.

A N N E X E S
National Savings Bank
Annual Report 2014
Page 274
NSB Extra XL Savings Account
You will receive dual benefits by owning a NSB ‘Extra XL’ Bonus Savings Account. On one hand, the account promises an array of benefits and a high rate of interest similar to that of Fixed Deposits depending on the account balance, and on the other hand, it acts as a normal Savings Account, giving the account holder the flexibility to withdraw funds at any time. Any citizen over 16 years can open a NSB Extra XL Bonus Savings Account, the minimum balance you need to maintain to receive a bonus is Rs. 5,000/- and you are entitled to a 100% bonus with a deposit of Rs. 500,000/-. Account holders would be treated as VIP customers of the Bank and will receive an Easy Card as well.
NSB Happy Savings Account
If you want a good interest while enjoying the freedom of withdrawing funds anytime, the best option for you is NSB Happy Savings Account with the highest interest rates for savings depending on the account balance. You can open this account with a minimum deposit of Rs. 1,000/- and in order to earn a higher interest, the balance of the account should be enhanced. There are no restrictions for withdrawals. You are eligible for the gratuity payment as well.
Gift Token
This is the easiest and the best way to give gifts for your loved ones. Gift Tokens are available in various
denominations and are easy to purchase and encash whenever you need them. They accrue interest from the date of purchase and you can deposit Gift Tokens in any savings account. NSB Gift Tokens are available in a range of values from Rs. 100/- to Rs. 2,500/- at any NSB Branch.
Friends Savings Account
Friends is a savings scheme that ensures the depositors with a monthly income for life. If you are above 18, a Friends Account will ensure you a monthly income for life, after a series of equal monthly payments or a lump sum. All you have to do is to open an account with a minimum deposit of Rs. 100/- or multiples thereof and deposit an equivalent amount monthly, for a specified period (approximately 98 installments) at the end of which you can commence drawing a monthly income equivalent to your monthly deposit, for the rest of your life. You are also eligible for an insurance cover to complete monthly payments in case of death/complete disablement.
Pas Aurudu Savings Account
Any person aged above 16 years can open and operate a Pas Aurudu Savings Account and a higher rate of interest will be offered for higher amount of deposits. The account should be opened and maintained with a monthly deposit of Rs. 100/-, Rs. 200/-, Rs. 300/-, Rs. 400/-, Rs. 500/-, Rs. 1000/- or denominations, for 60 months. This amount could be deposited on any
convenient day within the particular month. Account holders are entitled to receive a gratuity payment up to Rs. One Million.
Long-Term Deposit Schemes
NSB Fixed Deposit
A Fixed Deposit at NSB symbolises financial stability. If you are over 16 years of age, you can open a Fixed Deposits Account at NSB while minors below 16 years of age can open a Fixed Deposits Account in care of their parents/guardians. Fixed Deposits can be opened as joint accounts/special funds and also on behalf of social organisations.
While the minimum opening amount of the annual interest earning Fixed Deposit is Rs. 1,000/-, the minimum opening balance for the monthly interest earning Fixed Deposit is Rs. 25,000/-. You can open Fixed Deposit Accounts for 3, 6, 12 and 24 months, yielding an annual, a biannual or monthly interest. You can obtain loans against deposits or NSB Easy Card (Visa/Master enabled), which allows you a revolving credit facility of 80% against your fixed deposits.
Triple A Fixed Deposit
This offers 3-year or 5-year long-term deposits with a high interest for farsighted depositors. The interest plus capital are payable at maturity and the instant credit facility is available.
Gaurawa Fixed Deposit
Senior citizens over 55 years of age can open Gaurawa Fixed Deposit Accounts that pay a monthly interest, which will always be 0.5% more than that of normal monthly Fixed Deposits. The minimum deposit amount required is Rs. 25,000/- and the maximum limit in an account is Rs. 5 Million. Special benefits to you as Gaurawa Account holders include, ‘service through special counters’ where you will receive the assistance of Bank Officers when filling up forms etc. In the case of disabled customers, arrangements will be made to provide them with banking services at their residence. This service will be provided twice a month for the needy customers who reside within a radius of 15 km from the Branch.
Savings Certificate
Prarthana Children’s Savings Certificate
Prarthana Children’s Savings Certificate is an ideal gift for a child; a long-term deposit scheme for kids with attractive interest rates which will be paid upfront; paid on the date of purchase and the Certificate will mature when the account holder reaches 16 years of age. The Certificates are available in the maturity values of Rs. 5,000/-, Rs. 10,000/-, Rs. 25,000/-, Rs. 50,000/- and Rs. 100,000/-. When you purchase a Prarthana Children’s Savings Certificate, NSB gives you an assurance that the face value of the Certificate will not be affected by any adverse fluctuations of interest rates.
O U R P R O D U C T S A N D S E R V I C E S
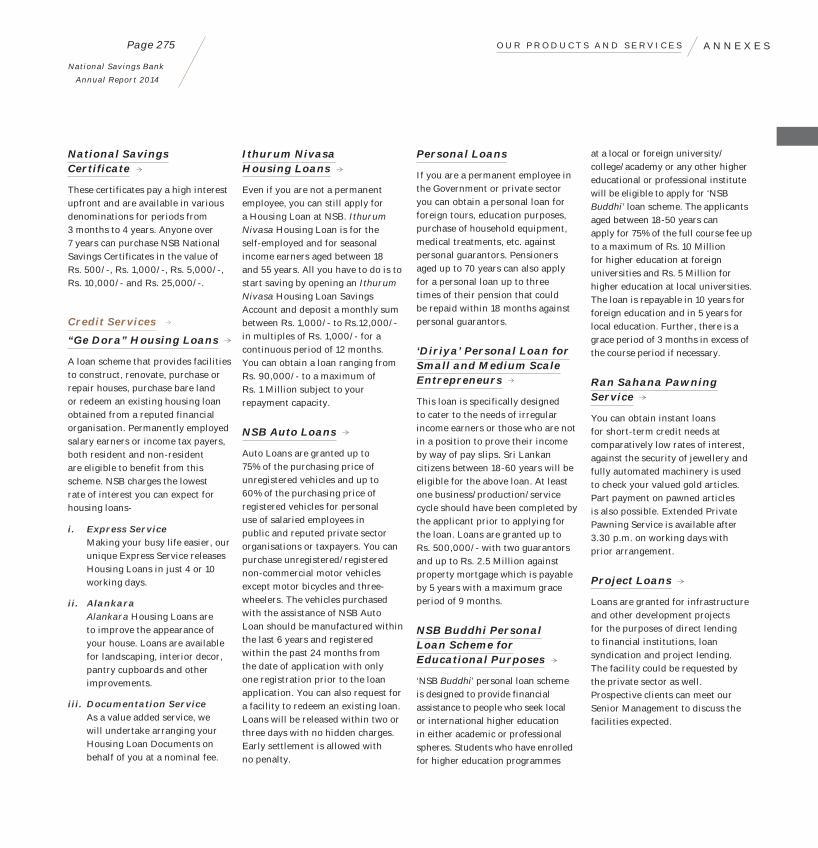
A N N E X E S
National Savings Bank
Annual Report 2014
Page 275
National Savings Certificate
These certificates pay a high interest upfront and are available in various denominations for periods from 3 months to 4 years. Anyone over 7 years can purchase NSB National Savings Certificates in the value of Rs. 500/-, Rs. 1,000/-, Rs. 5,000/-, Rs. 10,000/- and Rs. 25,000/-.
Credit Services
“Ge Dora” Housing Loans
A loan scheme that provides facilities to construct, renovate, purchase or repair houses, purchase bare land or redeem an existing housing loan obtained from a reputed financial organisation. Permanently employed salary earners or income tax payers, both resident and non-resident are eligible to benefit from this scheme. NSB charges the lowest rate of interest you can expect for housing loans-
i. Express Service Making your busy life easier, our
unique Express Service releases Housing Loans in just 4 or 10 working days.
ii. Alankara Alankara Housing Loans are
to improve the appearance of your house. Loans are available for landscaping, interior decor, pantry cupboards and other improvements.
iii. Documentation Service As a value added service, we
will undertake arranging your Housing Loan Documents on behalf of you at a nominal fee.
Ithurum Nivasa Housing Loans
Even if you are not a permanent employee, you can still apply for a Housing Loan at NSB. Ithurum Nivasa Housing Loan is for the self-employed and for seasonal income earners aged between 18 and 55 years. All you have to do is to start saving by opening an Ithurum Nivasa Housing Loan Savings Account and deposit a monthly sum between Rs. 1,000/- to Rs.12,000/- in multiples of Rs. 1,000/- for a continuous period of 12 months. You can obtain a loan ranging from Rs. 90,000/- to a maximum of Rs. 1 Million subject to your repayment capacity.
NSB Auto Loans
Auto Loans are granted up to 75% of the purchasing price of unregistered vehicles and up to 60% of the purchasing price of registered vehicles for personal use of salaried employees in public and reputed private sector organisations or taxpayers. You can purchase unregistered/registered non-commercial motor vehicles except motor bicycles and three-wheelers. The vehicles purchased with the assistance of NSB Auto Loan should be manufactured within the last 6 years and registered within the past 24 months from the date of application with only one registration prior to the loan application. You can also request for a facility to redeem an existing loan. Loans will be released within two or three days with no hidden charges. Early settlement is allowed with no penalty.
Personal Loans
If you are a permanent employee in the Government or private sector you can obtain a personal loan for foreign tours, education purposes, purchase of household equipment, medical treatments, etc. against personal guarantors. Pensioners aged up to 70 years can also apply for a personal loan up to three times of their pension that could be repaid within 18 months against personal guarantors.
‘Diriya’ Personal Loan for Small and Medium Scale Entrepreneurs
This loan is specifically designed to cater to the needs of irregular income earners or those who are not in a position to prove their income by way of pay slips. Sri Lankan citizens between 18-60 years will be eligible for the above loan. At least one business/production/service cycle should have been completed by the applicant prior to applying for the loan. Loans are granted up to Rs. 500,000/- with two guarantors and up to Rs. 2.5 Million against property mortgage which is payable by 5 years with a maximum grace period of 9 months.
NSB Buddhi Personal Loan Scheme for Educational Purposes
‘NSB Buddhi’ personal loan scheme is designed to provide financial assistance to people who seek local or international higher education in either academic or professional spheres. Students who have enrolled for higher education programmes
at a local or foreign university/college/academy or any other higher educational or professional institute will be eligible to apply for ‘NSB Buddhi’ loan scheme. The applicants aged between 18-50 years can apply for 75% of the full course fee up to a maximum of Rs. 10 Million for higher education at foreign universities and Rs. 5 Million for higher education at local universities. The loan is repayable in 10 years for foreign education and in 5 years for local education. Further, there is a grace period of 3 months in excess of the course period if necessary.
Ran Sahana Pawning Service
You can obtain instant loans for short-term credit needs at comparatively low rates of interest, against the security of jewellery and fully automated machinery is used to check your valued gold articles. Part payment on pawned articles is also possible. Extended Private Pawning Service is available after 3.30 p.m. on working days with prior arrangement.
Project Loans
Loans are granted for infrastructure and other development projects for the purposes of direct lending to financial institutions, loan syndication and project lending. The facility could be requested by the private sector as well. Prospective clients can meet our Senior Management to discuss the facilities expected.
O U R P R O D U C T S A N D S E R V I C E S

A N N E X E S
National Savings Bank
Annual Report 2014
Page 276
E-Card Facilities
NSB Easy Card
NSB Easy is a Master Card Credit Facility which is issued against your fixed deposit at a low annual interest rate of 2.5 % above the FD rate. The individuals or joint account holders of over 18 years, who maintain a fixed deposit for a period of 12 months or more (monthly or annual interest rates) under automatically renewed basis, are eligible to obtain this facility which exempts Joining Fee, Annual Fee, Overdue and Late Payment Fees. This card offers you Master Debit Card facilities as well.
Shopping Card/ Platinum Card
Money to be encashed at your convenience: NSB enables you to make use of the ATM facility 24 hours a day and 7 days a week with Master/Visa Card facility. You can withdraw up to Rs. 40,000/- from a Shopping Card and Rs. 80,000/- from a Platinum Card or purchase goods from any merchant with Master/Visa Card International Network up to Rs. 100,000/- from a Shopping Card and Rs. 150,000/- from a Platinum Card within 24 hours.
Your single NSB ATM card allows you to transact with 10 different accounts through its islandwide network of ATMs globally connected with over 10,000 ATMs. Further, facilities such as fund transfers, issue of statements and change of PIN etc., will also be provided by the ATM. All ATMs are equipped with security cameras.
ISIC Card
The ISIC (International Student Identity Card) is a Master Debit Card issued by National Savings Bank in collaboration with ISIC Organisation for NSB Ithuru Mithuru Savings Account holders. The ISIC is the only internationally recognised student ID and thus ISIC holders become members of a truly global club. Every year, more than 4.5 Million students from 120 countries use their student card to take advantage of offers on travel and shopping, worldwide. Ithuru Mithuru account holders can apply for student loans up to Rs. 10 Million. The ISIC will enable students to enjoy the best value added services, benefits and discounts all around the world.
Foreign Currency Products
NSB Ranmasu Non-Resident Foreign Currency Account (NRFC)
Sri Lankan nationals employed abroad and those who hold foreign passports are eligible to open NRFC Accounts with NSB in the form of Savings or Fixed Deposits for periods of 1, 3, 6 or 12 months in US Dollars (USD), Euros (EUR), Sterling Pounds (GBP) and Australian Dollars (AUD).
Prospective migrants could visit any NSB Branch or the International Division at Head Office and obtain an account number prior to the departure, to channel funds to the correct account. Interest is paid in the currency in which the account
is maintained and is exempted from tax. NRFC Accounts could also be opened for non-resident minors whose parents are employed abroad.
NSB Ranmasu Resident Foreign Currency Account (RFC)
Sri Lankan nationals, resident in Sri Lanka, who are in possession of foreign currency or who receive remittances in foreign currency are eligible to open RFC Accounts in the form of Savings and Fixed Deposits for periods of 1, 3, 6 and 12 months, in US Dollars (USD), Euros (EUR), Sterling Pounds (GBP) and Australian Dollars (AUD). Interest is paid in the currency in which the account is maintained and is exempted from tax. RFC Accounts could also be opened for resident minors whose parents are employed abroad.
Special Foreign Investment Deposit Account (SFIDA)
A Special Foreign Investment Deposit Account could be opened as a Savings and Fixed Deposit Account in the currencies of USD, EUR, GBP and AUD or Sri Lankan Rupees by citizens of foreign states, Sri Lankan citizens resident abroad, corporate bodies incorporated outside Sri Lanka and Foreign Institutional Investors such as Country funds, Mutual funds and Regional funds. These accounts too are tax-exempted.
Eurogiro
NSB joined the Eurogiro Network in early 2008 and prides itself of being the sole Eurogiro Member in Sri Lanka. Eurogiro is a low cost electronic money transfer system pioneered by Western Postal Organisations and Banks. Our membership at Eurogiro facilitates transferring funds through Deutsche Postbank (Germany), Korea Post (Korea), Israel Post (Israel), Poste Italiane (Italy), Thai Post Bank (Thailand) and La Banque Postale (France).
Foreign Inward Remittances
Sri Lankan nationals living/ employed abroad can remit funds to their own family members’ and relatives’ LKR/NRFC/RFC Accounts at NSB or to any other account at any other bank in Sri Lanka via Exchange Houses and Banks with whom NSB has already established relations regarding fund transfers.
Web-based Remittances
We are also agents in Sri Lanka for global money transfer channels such as ‘MoneyGram’ ‘INSTANT CASH’, “XPRESS MONEY’, ‘UNIStream’, ‘EzRemit’, and ‘Transfast’. Sri Lankan expatriates all over the world can remit funds easily, safely and at a low cost through these money transferring companies.
O U R P R O D U C T S A N D S E R V I C E S

A N N E X E S
National Savings Bank
Annual Report 2014
Page 277
Money Exchange Services
We have been permitted by the Central Bank of Sri Lanka to provide money exchange services to our customers. Accordingly, we have commenced this business initially at 10 selected branches. Therefore, customers who possess Foreign Currency Notes can exchange them to Sri Lankan Rupees and also customers who travel abroad can purchase foreign currency notes at selected NSB Branches at competitive exchange rates.
Other Services
Speed Cash
NSB Speed Cash is a secured and fast over-the-counter fund transfer service which facilitates transfer of funds between any two parties. Whether you are an account holder or not, NSB Speed Cash service is available for you. The minimum amount of cash, a person could transfer through ‘NSB SpeedCash’ is Rs. 1,000/-, and the maximum amount is Rs. 2 Million. Only one transaction is permitted per person per day.
Gratuity Payment Scheme
NSB also offers a Gratuity Payment Scheme up to Rs. One Million where payments are made at the death of account holders to their nominee/s or heir/s. On the basis of the balance in their accounts, any active account holder, aged between 18 to 70 years with a minimum balance of Rs. 15,000/-, will be entitled to this facility.
Utility Bill Payments
Utility Bill Payment Services are available at NSB and you can pay utility bills at any of our branches. Bills will be updated online as soon as you pay your bill. You can pay the following bills at NSB:
Electricity Bills of Lanka Electricity Company (LECO) and Ceylon Electricity Board (CEB);
Telephone Bills of Sri Lanka Telecom (SLT), Dialog CDMA, Dialog TV, Lanka Bell, Mobitel, Dialog and Airtel (postpaid only);
Water Bills;
Insurance premiums of Union Assurance, Aviva NDB Insurance, Ceylinco Insurance and Allianz Insurance, HNB Assurance;
Credit Card bills of HSBC;
Fees of Institute of Bankers of Sri Lanka (IBSL) and Association of Accounting Technicians of
Sri Lanka (AATSL).
Internet Banking
NSB Internet Banking is the latest addition to the E-banking facilities provided by us. You can enjoy a wide range of banking facilities including balance inquiries (Savings, Fixed Deposits, NRFC/RFC, Postal accounts, Housing Loans, Easy Card, Loans against Savings), fund transfers to NSB and other bank accounts, Speed Cash and Utility Bill Payments with a 24/7 service from anywhere in the world at any time via the Internet.
SMS Banking
You can view your savings account balance at any time from your mobile phone. Since SMS Banking is available for Savings Accounts Holders, you can enjoy a number of banking facilities such as balance inquiries, fund transfers to NSB and other bank accounts, Speed Cash and Utility Bill Payments via the same.
Mobile Banking
Point of Sale Banking or Door Step Banking is available for you with the latest mobile banking technology. Our sales team visits houses, shops, schools and weekly fairs making your life much more easier; hence you can deposit money with NSB while being at home, school or workplace.
NSB Call Centre
NSB Call Centre is established for facilitating inquiries related to banking activities. You can obtain information and make inquiries related to NSB Products and Services by contacting the Call Centre via telephone, e-mail, Skype or Web chat. Our well-trained Call Centre agents do not only provide information but also deliver a superior customer service for your convenience.
O U R P R O D U C T S A N D S E R V I C E S

National Savings Bank
Annual Report 2014
Page 278A N N E X E S A N N E X E S
Central Province
1. Dambulla2. Digana3. Galewela4. Gampola5. Hatton6. Kandy7. Kandy City Centre8. Kandy 39. Kandy 210. Katugastota11. Matale12. Alawathugoda13. Mulgampola14. Nawalapitiya15. Nuwara-Eliya16. Pilimatalawa17. Pundaluoya18. Pussellawa19. Rikillagaskada20. Talawakelle21. Wattegama22. Naula23. Ginigathhena24. Delthota25. Gelioya26. Ragala
Eastern Province
27. Akkaraipattu28. Ampara29. Ampara 230. Arayampathy31. Batticaloa32. Chenkaladi33. Kalawanchikudi34. Kalmunai35. Kantale36. Palugama37. Pothuvil38. Sammanthurai39. Trincomalee40. Valaichchenai
B R A N C H N E T W O R K
0.75
19
13
142426
1121
76
32
Northern
North Central
Eastern
Southern
Sabaragamuwa
North Western
Western
Central
Uva

A N N E X E S
National Savings Bank
Annual Report 2014
Page 279
Northern Province
41. Atchuvely42. Chankanai43. Chavakachcheri44. Chunnakam45. Jaffna46. Jaffna 247. Karainagar48. Kayts49. Kilinochchi50. Manipay51. Mannar52. Nelliady53. Point Pedro54. Thirunalveli55. Vavuniya56. Vankalai57. Mallavi58. Kodikamam59. Mullaitivu
North Western Province
60. Alawwa61. Anamaduwa62. Chilaw63. Hettipola64. Ibbagamuwa65. Galgamuwa66. Kuliyapitiya67. Kurunegala68. Kurunegala 269. Madampe70. Marawila71. Mawathagama72. Narammala73. Nattandiya74. Nikaweratiya75. Polgahawela76. Puttalam77. Wariyapola78. Wennappuwa79. Melsiripura80. Bingiriya81. Giriulla82. Rideegama83. Dankotuwa
North Central Province
84. Anuradhapura85. Anuradhapura 286. Galnewa87. Hingurakgoda88. Kaduruwela89. Kahatagasdigiliya90. Kebithigollewa91. Kekirawa92. Medawachchiya93. Nochchiyagama94. Tambuttegama95. Medirigiriya96. Eppawala
Sabaragamuwa Province
97. Aranayake98. Balangoda99. Bulathkohupitiya100. Deraniyagala101. Eheliyagoda102. Embilipitiya103. Kahawatta104. Kalawana105. Kegalle106. Kegalle 2107. Kuruwita108. Mawanella109. Pelmadulla110. Rambukkana111. Ratnapura112. Ruwanwella113. Warakapola114. Yatiyantota115. Nivithigala116. Kiriella117. Godakawela
Southern Province
118. Akuressa119. Ambalangoda120. Ambalantota121. Angunakolapelessa122. Baddegama123. Beliatte124. Deniyaya125. Devinuwara126. Dickwella127. Elpitiya128. Galle129. Galle 2130. Habaraduwa131. Hakmana132. Hikkaduwa133. Imaduwa134. Kamburupitiya135. Karapitiya136. Matara137. Matara 2138. Middeniya139. Morawaka140. Neluwa141. Sooriyawewa142. Tangalle143. Tissamaharama144. Uragasmanhandiya145. Walasmulla146. Weeraketiya147. Weligama148. Kekanadura149. Hambanthota
Uva Province
150. Badulla151. Bandarawela152. Hali-Ela153. Bibile154. Buttala155. Mahiyangana156. Moneragala157. Passara158. Welimada159. Wellawaya160. Badalkumbura
B R A N C H N E T W O R K
Western Province
161. Aluthgama162. Athurugiriya163. Avissawella164. Bambalapitiya165. Bandaragama166. Battaramulla167. Beruwala168. Boralesgamuwa169. Borella170. Bulathsinhala171. City172. Dehiwela173. Delgoda174. Delkanda175. Divulapitiya176. Gampaha177. Gampaha 2178. Ganemulla179. Hanwella180. Head Office181. Homagama182. Horana183. Ingiriya184. Ja-Ela185. Kadawatha186. Kaduwela187. Kahathuduwa188. Kalubowila189. Kalutara190. Kalutara 2191. Katubedda192. Katunayake193. Kelaniya194. Kiribathgoda195. Kirindiwela196. Kochchikade197. Kollupitiya 2198. Kotahena199. Kottawa200. Mahabage201. Maharagama202. Malabe203. Maligawatta204. Matugama 205. Meegoda
206. Minuwangoda207. Mirigama208. Moratumulla209. Moratuwa210. Mt. Lavinia211. Mulleriyawa New Town212. Mutwal213. Narahenpita214. Nawala215. Negombo216. Nittambuwa217. Nugegoda218. Panadura219. Peliyagoda220. Pettah221. Piliyandala222. Kirulapone223. Puwakaramba224. Raddolugama225. Ragama226. Rajagiriya227. Veyangoda228. Wadduwa229. Wattala230. Wellampitiya231. Wellawatta232. World Trade Center233. Yakkala234. Thalawathugoda235. Baduraliya236. Pugoda

A N N E X E S
National Savings Bank
Annual Report 2014
Page 280C O R R E S P O N D E N T B A N K S
Citi Bank NA
Wall Street, New York,NY 10005, USA.Tel: 12125591000www.citibank.comSWIFT: CITIUS33
Deutsche Postbank
AG.,Friedrich-Ebert-Allee53113 Bonn,Germany.Tel: 114-126, 492289200www.postbank.deSWIFT: PBNKDEFF
Commonwealth Bank
Sydney, NSW 2001.AustraliaGPO Box 5227,Tel: 61 293782000www.commbank.com.auSWIFT: CTBAAU2S
Deutsche Bank Trust Company
Americas,No. 60, Wall Street,New York, NY 10005,USATel: 1 212 2502500Tel: 1 212 7970291www.deutsche-bank.comSWIFT: BKTRUS33
Bank of Ceylon
No. 01,Devonshire Squre LondonEC2M4WDTel: 0207 377 1888Tel: 44 [email protected]: BCEYGB2L
Woori Bank
1-203, Hoehyeon-don9, Jun9-9u, SeoulTel: 82 - 2 -21252001www.wooribank.comSWIFT: HVBK KR SE
Deutsche Bank AG
P.O.B 60202Frankfurt am Main, Germany.Tel: 496991000Tel: 49 6991034225www.deutsche-bank.cemSWIFT: DEUTDEFF
Banca Popolari Di Sondrio
Piazza Garibaldi 1623100,Sondrlom SO,ItalyTel: 390 342 528.111Tel: 390 342 528 [email protected]: POSOIT22
National Australia Bank
330, Collins StreetMelbourne, VIC 3000.AustraliaTel: 61386413500www.national.com.auSWIFT: CTBAAU2S
Unicredito SPA
Estero F.S.D. - Via Volta 1, 20093 CoI09nOMonzese, MI, ItalyTel: 390288621Tel: 39 02 88623340WNW. unicreditgroup.e’USWIFT: UNCRITMM
Hana Bank
55, Eulji-ro,Jung-guSeoulRepublic of KoreaTel: 82-02-2002-1111www.hanabank.comSWIFT: HNBNKRSE

A N N E X E S
National Savings Bank
Annual Report 2014
Page 281
Al Ahalia Exchange
P.O. Box 2419,Abu Dhabi, U.A.E.Tel: 97126269341www.alahaliamoneyexchange.com
Al Rostamani International Exchange
Al Rostamani International Exchange,P.O. Box 10072, Dubai, U. A. E.Tel: 97146098152www.alrostamaniexchange.comariemgt@alrostamanigroup.ae
CB Unistream Bank
20, Verhnyaya Maslovka str,bldg. 2, 127083,Moscow, RussiaTel: [email protected]
Al Ansari Exchange
P.O. Box 325,Abu Dhabi, U.A.E.Tel: 97126108 [email protected]
Arabian Exchange Co.
P.O. Box 3535,Doha-QatarTel: [email protected]
Citi Global Remittance
Baharain Financing Co.P.O. Box 243, ManemoKingdom of Baharain
Al Dar For Exchange Works
P.O. Box 24048,Doha State of QatarTel: 9744550455
City International Exchange
Abdullah Dashti Building,Abdullah Mubarak Street,P.O. Box 21804,Safar 13079, KuwaitTel: [email protected]
Al Fardan Exchange- Abu Dhabi
P.O. Box 498, Amin Khourl Building, Liwa Street, Abu Dhabi, U.A.E.Tel: [email protected]@alfardanexchange.com
Asia Express Exchange
P.O. Box 881-RUWI,PC 112, Muscat,Sultanate of OmanTel: [email protected]
Colombo International
Money TransferColombo Money Transfer Services Pty Ltd., 3 Clow St, Dandenong,Victoria 3175,AustraliaTel: (03)[email protected]
Al Fardan Exchange- Qatar
Alfardan Centre, Grand Hamad Avenue, P.O. Box 339, Doha, QatarTel: [email protected]
Bahrain Exchange
P.O. Box 29149,Safat 13152, KuwaitTel: [email protected]
Al Mulla International
Al Mulla Group Head Office,Free Trade Zone,Shuwaikh, KuwaitTel: 96522250888
Bahrain Finance Co.
P.O. Box 243, ManamaKingdom of Bahrain
Dollarco Exchange
P.O. Box 26270,Safat 13123, KuwaitTel: [email protected]
Al Rajhi Bank
P.O. Box 28,Riyadh 11411,Kingdom of Saudi ArabiaTel: 96612116000www.alrajhibank.com.sa
Bank Al Bilad
P.O. Box 140,Riyadh-11411, Saudi ArabiaTel: 96614798888www.bankalbilad.com.sa
Emirates International Exchange
P.O. Box 7190,Dubai, U.A.E.Tel: 600522248www.emiratesexchange.ae
Habib Exchange-Abu Dhabi
Central Office, Hamdan Street,P.O. Box 2370, Abu Dhabi, U.A.E.Tel: [email protected]
Habib Qatar International Exchange
P.O. Box 1188, Mushirib Street,Doha QatarTel: [email protected]
E X C H A N G E C O M P A N I E S
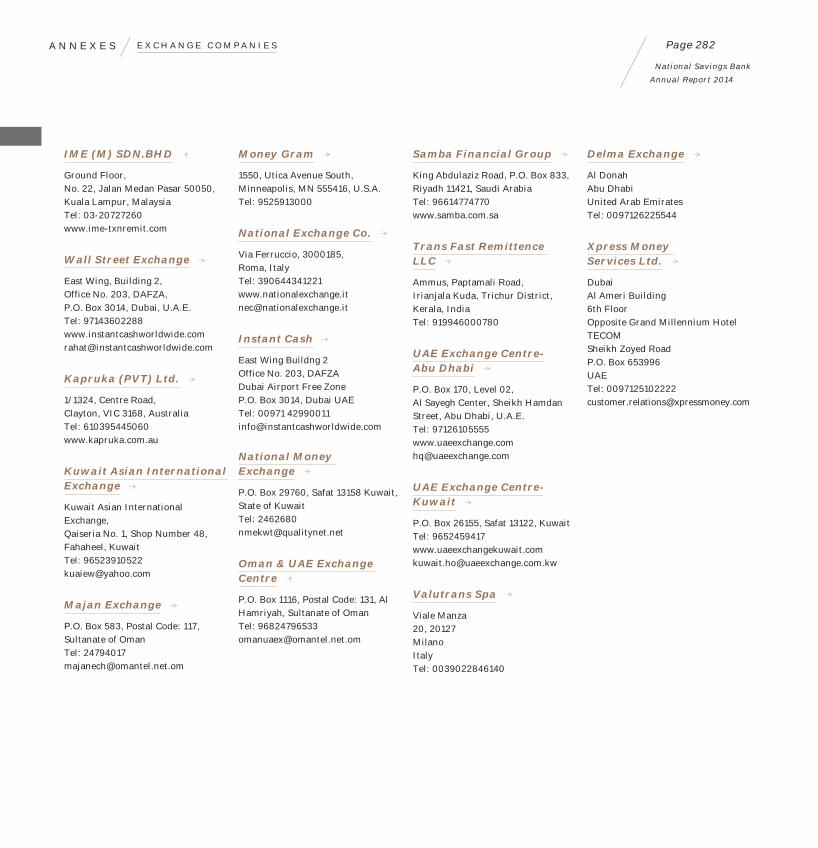
A N N E X E S
National Savings Bank
Annual Report 2014
Page 282E X C H A N G E C O M P A N I E S
IME (M) SDN.BHD
Ground Floor,No. 22, Jalan Medan Pasar 50050,Kuala Lampur, MalaysiaTel: 03-20727260www.ime-txnremit.com
Wall Street Exchange
East Wing, Building 2,Office No. 203, DAFZA,P.O. Box 3014, Dubai, U.A.E.Tel: 97143602288www.instantcashworldwide.comrahat@instantcashworldwide.com
Kapruka (PVT) Ltd.
1/1324, Centre Road,Clayton, VIC 3168, AustraliaTel: 610395445060www.kapruka.com.au
Kuwait Asian International Exchange
Kuwait Asian International Exchange,Qaiseria No. 1, Shop Number 48,Fahaheel, KuwaitTel: [email protected]
Majan Exchange
P.O. Box 583, Postal Code: 117,Sultanate of OmanTel: [email protected]
Money Gram
1550, Utica Avenue South,Minneapolis, MN 555416, U.S.A.Tel: 9525913000
National Exchange Co.
Via Ferruccio, 3000185,Roma, ItalyTel: [email protected]
Instant Cash
East Wing Buildng 2Office No. 203, DAFZADubai Airport Free ZoneP.O. Box 3014, Dubai UAETel: 00971 [email protected]
National Money Exchange
P.O. Box 29760, Safat 13158 Kuwait, State of KuwaitTel: [email protected]
Oman & UAE Exchange Centre
P.O. Box 1116, Postal Code: 131, AlHamriyah, Sultanate of OmanTel: [email protected]
Samba Financial Group
King Abdulaziz Road, P.O. Box 833,Riyadh 11421, Saudi ArabiaTel: 96614774770www.samba.com.sa
Trans Fast Remittence LLC
Ammus, Paptamali Road, Irianjala Kuda, Trichur District, Kerala, IndiaTel: 919946000780
UAE Exchange Centre- Abu Dhabi
P.O. Box 170, Level 02,Al Sayegh Center, Sheikh Hamdan Street, Abu Dhabi, U.A.E.Tel: [email protected]
UAE Exchange Centre-Kuwait
P.O. Box 26155, Safat 13122, KuwaitTel: [email protected]
Valutrans Spa
Viale Manza20, 20127MilanoItalyTel: 0039022846140
Delma Exchange
Al DonahAbu DhabiUnited Arab EmiratesTel: 0097126225544
Xpress Money Services Ltd.
DubaiAl Ameri Building6th FloorOpposite Grand Millennium Hotel TECOMSheikh Zoyed RoadP.O. Box 653996UAETel: [email protected]

A N N E X E S
National Savings Bank
Annual Report 2014
Page 283
GRI Indicator
Description Reported in Page No./ Explanations
General Standard DisclosuresStrategy and AnalysisG4-1 Statement from the Chairman Letter from the
Chairman17
Organisation Profile
G4-3 Name of the Organisation Business Model 27G4-4 Primary Brands, Products and/or Services Our Products and
Services272
G4-5 Location of Organisation’s Headquarters Corporate Information 291G4-6 Number of countries where the Organisation operates and names of countries with either major
operations or that are specifically relevant to the sustainability issues covered in the ReportBusiness Model 27
G4-7 Nature of ownership and legal form Business Model 27G4-8 Markets served Business Model 27G4-9 Scale of the Reporting Organisation Business Model 28G4-10 Total workforce by employment type, employment contract and region, broken down by gender Employee Capital 65G4-11 Report the percentage of total employees covered by collective bargaining agreements Employee Capital 65G4-12 Organisation’s supply chain Business Model 43G4-13 Significant changes during the reporting period regarding size, structure or ownership About this Report 9G4-14 Report whether and how the precautionary approach or principle is addressed by the organisation About this Report 10G4-15 List externally developed economic, environmental and social charters, principles or other initiatives to
which the organisation subscribes or which it endorsesBusiness Model 38
G4-16 List of membership of associations and national or internal advocacy organisations Business Model 38
Identified Material Aspects and Boundaries
G4-17 Operational Structure of the Organisation Business Model 27G4-18 Process for Defining Report Content About this Report 10G4-19 Material Aspects identified for Report Content Business Model 39-41G4-20 Aspect Boundary for identified Material Aspects within the organisation About this Report 10G4-21 Aspect Boundary for identified Material Aspects outside the organisation About this Report 10G4-22 Report the effect of any restatements of information provided in previous reports and the reasons
for such restatementsAbout this Report 10
G4-23 Report significant changes from previous reporting periods in the Scope and Aspect Boundaries About this Report 10
Stakeholder Engagement
G4-24 List of stakeholder groups engaged by the Organisation Business Model 34G4-25 Basis for identification and selection of stakeholders with whom to engage Business Model 34G4-26 Approaches to stakeholder engagement, including frequency of engagement by type and by
stakeholder groupBusiness Model 34-38
G4-27 Key topics and concerns raised through stakeholders engagement and how the Organisation responded to them
Business Model 34-38
G R I C O N T E N T I N D E X : ‘ I N A C C O R D A N C E ’
W I T H C O R E C R I T E R I A

A N N E X E S
National Savings Bank
Annual Report 2014
Page 284
GRI Indicator
Description Reported in Page No./ Explanations
Report ProfileG4-28 Reporting period About this Report 10G4-29 Date of most recent previous report About this Report 10G4-30 Reporting cycle About this Report 10G4-31 Contact point for questions regarding the Report or its Contents About this Report 10G4-32 Compliance with GRI G4 guidelines, GRI Content index and the External Assurance Report. About this Report 10G4-33 Policy and current practice with regard to seeking external assurance for the Report N/A
Governance
G4-34 Governance Structure of the Organisation, including committees under the highest governance body responsible for decision-making on economic, environment and social impacts
Corporate Governance 84
Ethics and Integrity
G4-56 The values, principles, standards and norms of behaviour Business Model 58
Specific Standard Disclosures
G4 - DMA Aspect and Materiality fulfilled Business Model 42-45
CATEGORY: ECONOMICAspect Economic PerformanceG4-EC1 Direct economic value generated, distributed and retained Financial Capital 55G4-EC3 Coverage of the Organisation’s defined benefit plan obligations Employee Capital 66 and 67Aspect Market PresenceG4-EC6 Proportion of senior management hired from the local community at locations of significant
locations of operation Social & Environmental Capital
65
Aspect Indirect Economic ImpactG4-EC7 Development and impact of infrastructure investments and services supported Social & Environmental
Capital70
Aspect Procurement PracticesG4-EC9 Proportion of spending on local suppliers at significant locations of Operations. Social & Environmental
Capital70
CATEGORY: ENVIRONMENTAspect MaterialsG4-EN2 Percentage of materials used that are recycled input materials Social & Environmental
Capital69
Aspect EnergyG4-EN3 Energy consumption within the organisation Social & Environmental
Capital69
G R I C O N T E N T I N D E X : ‘ I N A C C O R D A N C E ’ W I T H C O R E C R I T E R I A

A N N E X E S
National Savings Bank
Annual Report 2014
Page 285 G R I C O N T E N T I N D E X : ‘ I N A C C O R D A N C E ’ W I T H C O R E C R I T E R I A
GRI Indicator
Description Reported in Page No./ Explanations
CATEGORY: SOCIALLabour Practices And Decent WorkAspect EmploymentG4-LA1 Total number and rate of new employee hires and employee turnover by age group, gender and region Employee Capital 65G4-LA2 Benefits provided to full-time employees that are not provided to temporary or part-time employees, by
significant locations of operation Employee Capital 66
G4-LA3 Return to work and retention rates after parental leave, by gender. Employee Capital 66Aspect Labour/Management RelationsG4-LA4 Minimum notice periods regarding operational changes including whether these are specified in
collective agreements Employee Capital 65
Aspect Occupational Health and SafetyG4-LA6 Type of injury and rates of injury, occupational disease, lost days and absenteeism, and total number of
work-related fatalities, by region and by genderEmployee Capital 66
Aspect Training and EducationG4-LA9 Average hours of training per year per employee by gender and by employee category Employee Capital 67G4-LA10 Programmes for skills management and lifelong learning that support the continued employability of
employees and assist them in managing career endings Employee Capital 67
G4-LA11 Percentage of employees receiving regular performance and career development reviews by gender and employee category
Employee Capital 67
Aspect Diversity and Equal OpportunityG4-LA12 Composition of governance bodies and breakdown of employees per employee category according to
gender, age group, minority group membership and other indicators of diversity Employee Capital 65
Aspect Equal Remuneration for Women and MenG4-LA13 Ratio of basic salary and remuneration of women to men by employee category, by significant
locations of operation Employee Capital 66
Aspect Labour Practices Grievance MechanismsG4-LA16 Number of grievances about labour practices filed, addressed and resolved through formal
grievance mechanisms Employee Capital 67
Human Rights
Aspect Non-DiscriminationG4-HR3 Total number of incidents of discrimination and corrective action taken Employee Capital 67Aspect Freedom of Association and Collective BargainingG4-HR4 Operations and suppliers identified in which the right to exercise freedom of association and collective
bargaining may be violated or at significant risk and measures taken to support these rightsEmployee Capital 65
Aspect Human Rights Grievance MechanismsG4-HR12 Number of grievances about Human Rights impacts filed, addressed and resolved through
formal grievance mechanismsEmployee Capital 67

A N N E X E S
National Savings Bank
Annual Report 2014
Page 286
GRI Indicator
Description Reported in Page No./ Explanations
SocietyAspect Local CommunitiesG4-SO1 Percentage of operations with implemented local community engagement, impact assessments, and
development programmesSocial & Environmental Capital
70 and 71
Aspect Anti- CorruptionG4-SO3 Total number and percentage of operations assessed for risks related to corruption and the significant
risks identified Risk Management 140-143
Aspect ComplianceG4-SO8 Monitory value of significant fines and total number of non-monetory sanctions for
non-compliance with laws and regulationsBusiness Model 45
Aspect Anti-competitive Behaviour
G4-SO7 Total number of legal actions for anti-competitive behaviour, anti-trust and monopoly practices and their outcomes
Business Model 45
Aspect Supplier Assessment for Impact on Society
G4-S09 Percentage of new suppliers that was screened using criteria for impacts on society Business Model 45Aspect Grievance Mechanisms for Impacts on SocietyG4-S011 Number of grievances about impacts on society filed, addressed, and resolved through formal grievance
mechanismsBusiness Model 45
Product ResponsibilityAspect Product and Service labellingG4-PR3 Type of product & service Information required by the organisation’s procedures for product and service
information and labelling and percentage of significant product and service categories subject to such information requirements
Customer Capital 60-62
G4-PR5 Results of surveys measuring customer satisfaction Business Model 45Aspect Marketing CommunicationG4-PR7 Total number of incidents of non-compliance with regulations and voluntary codes concerning marketing
communications, including advertising, promotion and sponsorship by type of outcomesBusiness Model 45
Aspect Customer PrivacyG4-PR8 Total number of substantial compliance regarding breaches of customer privacy and losses of
customer dataBusiness Model 45
Aspect ComplianceG4-PR9 Monetary value of significant fines for non-compliance with laws and regulations concerning the
provision and use of products and servicesBusiness Model 45
G R I C O N T E N T I N D E X : ‘ I N A C C O R D A N C E ’ W I T H C O R E C R I T E R I A

A N N E X E S
National Savings Bank
Annual Report 2014
Page 287
A
Accounting Policies The specific principles, bases, conventions, rules and practices adopted by an entity in preparing and presenting Financial Statements.
Accrual Basis Recognising the effects of transactions and other events when they occur without waiting for receipt or payment of cash or its equivalent.
Amortisation The systematic allocation of the depreciable amount of an intangible asset over its useful life.
Amortised Cost Amount at which the financial asset or financial liability is measured at initial recognition, minus principal repayments, plus or minus the cumulative amortisation using the effective interest method of any difference between that initial amount and the maturity amount and minus any reduction for impairment or uncollectability.
Available-for-Sale Financial Assets Available-for-sale financial Assets are those non-derivative financial assets that are designated as available-for-sale or are not classified as loans and receivables, held-to-maturity investments or financial assets at fair value through profit or loss.
G L O S S A R Y O F F I N A N C I A L A N D
B A N K I N G T E R M S
C
Capital Adequacy Ratio The relationship between capital and risk-weighted assets as defined in the framework developed by the Bank for International Settlements (BIS) and as modified by the Central Bank of Sri Lanka to suit local requirements.
Capital Expenditure Total of additions to property, plant & equipment.
Capital Gain (Capital Profit) The gain on the disposal of an asset calculated by deducting the cost of the asset from the proceeds received on its disposal.
Capital Reserves Capital reserves consist of revaluation reserves arising from revaluation of properties owned by the Bank and Reserve Fund set aside for specific purposes defined under the Banking Act No. 30 of 1988 and shall not be reduced or impaired without the approval of the Monetary Board.
Carrying Value Value of an asset or a liability as per books of the organisation before adjusting for fair value.
Cash Equivalents Short-term highly liquid investments that are readily convertible to known amounts of cash and which are subject to an insignificant risk of changes in value.
Collective Agreement A tripartite agreement entered into among the NSB, Ministry of Finance and Trade Unions.
Collectively Assessed Loan Impairment Provisions Also known as portfolio impairment provisions. Impairment assessment on a collective basis for homogeneous groups of loans that are not considered individually significant and to cover losses that has been incurred but has not yet been identified at the Reporting date. Loans (housing, personal, auto loans etc.) are assessed on a portfolio basis.
Commitments Credit facilities approved but not yet utilised by the clients as at the Reporting date.
Concentration Risk Risk arisen from uneven distribution of counterparty and portfolio exposures to business sector or geographic region.
Contingencies A condition or situation existing at Reporting date where the outcome will be confirmed only by occurrence or non-occurrence of one or more future events.
Corporate Governance The process by which corporate entities are governed. It is concerned with the way in which power is exercised over the management and the direction of entity, the supervision of executive actions and accountability to owners and others.
Cost/Income Ratio Operating expenses excluding impairment provision and provisioning for fall in value in dealing securities as a percentage of net income.
Cost Method A method of accounting whereby the investment is recorded at cost. The Income Statement reflects income from the investment only to the extent that the investor receives distributions from accumulated net profits of the investee.
Credit Ratings An evaluation of a corporate’s ability to repay its obligation or the likelihood of not defaulting, carried out by an independent rating agency.
Credit Risk Credit risk or default risk is most simply defined as the potential that a borrower or counterparty will fail to meet its obligations in accordance with agreed terms and conditions.
Customer Deposits Money deposited by account holders. Such funds are recorded as liabilities.
D
Dealing Securities Marketable securities that are acquired and held with the intention of reselling them in the short-term.
Debenture A medium-term debt instrument issued by a corporate entity.

A N N E X E S
National Savings Bank
Annual Report 2014
Page 288G L O S S A R Y O F F I N A N C I A L A N D B A N K I N G T E R M S
Deferred Tax Sum set aside for tax in the Financial Statements that will become payable in a financial year other than the current financial year.
Depreciation The systematic allocation of the depreciable amount of an asset over its useful life.
Derecognition Removal of previously recognised financial assets or financial liability from an entity’s statement of financial position.
Derivative Financial contract of which the value is derived from the value of underlined assets.
E
Economic Value Added (EVA) A measure of productivity which takes into consideration cost of total invested equity.
Effective Income Tax Rate Provision for taxation divided by the profit before taxation.
Effective Interest Rate Rate that exactly discounts estimated future cash payments or receipts through the expected life of the financial instruments or when appropriate a shorter period to the net carrying amount of the financial asset or financial liability.
Equity Method The equity method is a method of accounting whereby the investment is initially recognised at cost and adjusted thereafter for the post-acquisition changes in the investor’s share of net assets of the investee. The profit or loss of the investor includes the investor’s share of the profit or loss of the investee.
Equity Risk Risk of depreciating equity investments due to stock market dynamics.
Exchange Gain/Loss Profit earned on foreign currency transactions arising from the difference in foreign exchange rates between the transaction/last Reporting date and the settlement/Reporting date. Also arises from trading in foreign currencies.
F
Fair Value The amount for which an asset could be exchanged or a liability settled, between knowledgeable, willing parties in an arm’s length transaction.
Financial Asset Is any asset that is cash, an equity instrument of another entity or a contractual right to receive cash or another financial asset from another entity.
Financial Asset or Financial Liability at Fair Value through Profit or Loss Financial asset or financial liability that is held-for-trading or upon initial recognition designated by the entity as ‘at fair value through profit or loss’.
Financial Instrument Financial instrument is any contract that gives rise to a financial asset of one entity and a financial liability or equity instrument of another entity.
Financial Liability Is a contractual obligation to deliver cash or another financial asset to another entity.
Foreclosed Properties Properties acquired in full or partial; satisfaction of debts.
Foreign Currency Risk Risk exists in transaction other than the local currency. Adverse movements in foreign exchange rates may decline the value of Assets/Liabilities held in terms of foreign currency.
Foreign Exchange Contract Agreement between two parties to exchange one currency for another at a future date at a rate agreed upon today.
G
General Provisions These are provisions made on loans and advances for anticipated losses on aggregate exposures where credit losses cannot yet be determined on an individual facility basis.
Group A group is a parent and all its subsidiaries.
Guarantees Three party agreement involving a promise by one party (the guarantor) to fulfill the obligations of a person owing a debt if that person fails to perform.
H
Hedging A strategy under which transactions are effected with the aim of providing cover against the risk of unfavourable price movements (interest rates and prices of commodities etc.).
Held-to-Maturity Investments (HTM) Non-derivative financial assets with fixed or determinable payments and fixed maturity that an entity has the positive intention and ability to hold to maturity.
Held-for-Trading (HFT) Debt and equity investments that are Purchased with the intent of selling them within a short period of time (usually less than one year).

A N N E X E S
National Savings Bank
Annual Report 2014
Page 289
I
ICCAP Process by which the Bank ensures additional capital is provided for banking risks other than those covered in Pillar I.
Impairment This occurs when recoverable amount of an asset is less than its carrying amount.
Impaired Assets Portfolio Impaired assets portfolio is the total of the individually significant impaired loans and individually insignificant loans which are overdue above 180 days.
Impairment Allowances Impairment allowances are provisions held on the Statement of Financial Position as a result of the raising of a charge against profit for the incurred loss. An impairment allowance may either be identified or unidentified as individual (specific) or collective (portfolio) impairment allowance.
Impairment Charge/ (Reversal) The difference between the carrying value of an asset and the sum of discounted future cash flows generating from the same asset.
Impaired Loans Loans where the Group does not expect to collect all the contractual cash flows or expects to collect them later than they are contractually due.
Individually Assessed Impairment Exposure to loss is assessed on all individually significant accounts and all other accounts that do not qualify for collective assessment.
Intangible Asset An asset that is not physical in nature. Corporate intellectual property (items such as patents, trademarks, copyrights, business methodologies), goodwill software and brand recognition are all common intangible assets in today’s marketplace.
Interest in Suspense Interest suspended on non-performing loans and advances.
Interest Margin Net interest income expressed as a percentage of average interest earning assets.
Interest Rate Risk
The risk that the fair value or future cash flows of a financial instrument will fluctuate because of changes in market interest rates.
Interest Rate Swap An interest rate Swap is a derivative in which one party exchanges a stream of interest payments for another party’s stream of cash flows.
Interest Spread Represents the difference between the average interest rate earned and the average interest rate paid on interest earning assets and interest bearing liabilities, respectively. variables such as interest rates, exchange rates, credit spreads and other asset prices.
Investment Properties Investment property is property (land or a building – or part of a building – or both) held (by the owner or by the lessee under a finance lease) to earn rentals or for capital appreciation or both, rather than for use or sale.
Investment Securities Securities acquired and held for yield or capital growth purposes and are usually held-for-maturity.
K
Key Managerial Personnel Key managerial personnel are those persons having authority and responsibility for planning, directing and controlling the activities of the Bank, directly or indirectly.
L
Liquid Assets Assets that are held in cash or in a form that can be converted to cash readily, such as deposits with other banks, bills of exchange and Treasury Bills.
Liquid Assets Ratio Assets that are held in cash or in a form that can be converted to cash readily (as prescribed by the Central Bank of Sri Lanka) divided by the total liabilities including contingent liabilities.
Liquidity Risk The risk that an entity will encounter difficulty in meeting obligations associated with financial liabilities.
Loans and Receivables Conventional loan assets that are unquoted (originated or acquired).
Loss Given Default (LGD) LGD is the percentage of an exposure that a lender expects to loose in the event of obligor default.
M
Market Risk This refers to the possibility of loss arising from changes in the value of a financial instrument as a result of changes in market variables such as interest rates, exchange rates, credit spreads and other asset prices.
Materiality The relative significance of a transaction or an event, the omission or misstatement of which could influence the decisions of users of Financial Statements.
N
Net Interest Income The difference between the interest income from investment portfolio and the interest paid on deposits.
Non-Performing Loans (NPL) The loans which are in default for more than three months.
NPL Ratio Total non-performing loans and advances (net of interest in suspense) divided by total loans and advances portfolio (net of interest in suspense).
O
Off-Balance Sheet Transactions Transactions that are not recognised as assets or liabilities in the Statement of Financial Position, but which give rise to contingencies and commitments.
G L O S S A R Y O F F I N A N C I A L A N D B A N K I N G T E R M S

A N N E X E S
National Savings Bank
Annual Report 2014
Page 290
Operational Risk This refers to the risk of loss resulting from inadequate or failed internal processes, people and systems or from external events.
P
Parent A parent is an entity that has one or more subsidiaries.
Portfolio A pool of investments including investment in Government Securities, loans and advances, equities, etc.
Probability of Default (PD) PD is an internal estimate for each borrower grade of the likelihood that an obligor will default on an obligation.
R
Return on Average Assets (ROAA) Net income expressed as a percentage of average total assets, used along with ROE, as a measure of profitability and as a basis of intra-industry performance comparison.
Return on Average Equity (ROAE) Net income, less preferred share dividends if any, expressed as a percentage of average ordinary shareholders’ equity.
Related Parties Parties where one party has the ability to control the other party or exercise significant influence over the other party in making financial and operating decisions, directly or indirectly as per the Sri Lanka Accounting Standard No. 30 on ‘Related Party Disclosures’.
REPOs Repurchase agreements. Securities sold to lenders with the commitment to buy back on a later date at a fixed price plus interest.
Return on Average Equity (ROAE) Net income, less preferred share dividends if any, expressed as a percentage of average ordinary shareholders’ equity.
Revenue Reserve Reserves set aside for future distribution and investment.
Risk-Weighted Assets Used in the calculation of risk-based capital ratios. The face amount of lower risk assets is discounted using risk weighting factors in order to reflect a comparable risk per Rupee among all types of assets. The risk inherent in off-balance sheet instruments is also recognised, first by adjusting notional values to balance sheet (or credit) equivalents and then by applying appropriate risk-weighting factors.
Rupee Loan Rupee securities issued by the Central Bank of Sri Lanka on behalf of the Government of Sri Lanka.
S
Shareholders’ Funds A capital reserve created as per the provisions of the Banking Act No. 30 of 1988.
Single Borrower Limit 33% of the regulatory capital base.
Statutory Reserve Fund A capital reserve created as per the provisions of the Banking Act No. 30 of 1988.
Stress Test Integrated test that shows to varying degrees whether the Bank can withstand unforeseen scenarios of varying severity.
Subsidiary An entity, including an unincorporated entity such as a partnership, which is controlled by another entity known as the parent.
Substance Over Form The consideration that the accounting treatment and the presentation in Financial Statements of transactions and events should be governed by their substance and financial reality and not merely by legal form.
Stress Test Integrated test that shows to varying degrees whether the Bank can withstand unforeseen scenarios of varying severity.
Swaps (Currency) The simultaneous purchase of an amount of a currency for spot settlement and the sale of the same amount of the same currency for forward settlement. Alternatively a simultaneous spot sale and forward purchase of a currency.
T
Tier I Capital Consists of the sum total of ordinary share capital, statutory reserve fund and general reserves.
Tier II Capital Supplementary capital representing 50% of the revaluation reserve and general provisions.
Total Capital Capital base is summation of the core capital (Tier I) and the supplementary capital (Tier II).
Treasury Bill A short-term debt instrument issued on auction basis by the Central Bank of Sri Lanka on behalf of the Government of Sri Lanka.
U
Unit Trust An undertaking formed to invest in securities under the terms of a trust deed.
V
Value Added Wealth created by providing banking and other services less the cost of providing such services. The value added is allocated among the employees, the providers of capital, to Government by way of taxes and retained for expansion and growth.
G L O S S A R Y O F F I N A N C I A L A N D B A N K I N G T E R M S

A N N E X E S
National Savings Bank
Annual Report 2014
Page 291
Name of The BankNational Savings Bank
Legal FormA Government owned Bank incorporated in Sri Lanka by the National Savings Bank Act No. 30 of 1971 and was granted the status of the Licensed Specialised Bank in terms of the Banking Act No. 30 of 1988.
Registered Office and Head Office‘Savings House’,No. 255, Galle Road, Colombo 03, Sri Lanka.Tel: 94-11-2573008-15Fax: 94-11-2573178E-mail: [email protected]: http://www.nsb.lkSwift Code: NSBALKLX
Service Outlets236 Branches 2,287 School Bank Units260 ATMs
Agency Network653 Post Offices and 3,410 Sub-Post Offices throughout the Island.
Credit RatingThe Bank has been assigned AAA (lka) long-term credit rating by the Fitch Rating Lanka (Pvt) Ltd.
B+ Stable International Credit Rating from Standard and Poors
BB- Stable International Credit Rating by Fitch Ratings
Board of DirectorsAswin De Siva – Chairman (From 9th February 2015)
Ms. W.A. Nalani – Chairperson (Up to 19th January 2015)
D.L.P.R. Abeyaratne – Director
Mahinda Siriwardana – Director (From 25th February 2015)
Bradley Emerson – Director (From 11th February 2015)
Suranga Naulage – Director (From 9th February 2015)
Ajith Pathirana – Director (From 20th March 2015)
S.T. Abeygunawardena – Working Director (Up to 12th January 2015)
S.R. Attygalle – Director (Up to 24th February 2015)
Lione4l P. Fernando – Director (Up to 13th January 2015)
Sumith Wijesinghe – Director (Up to 2nd February 2015)
H. Madiwela – Director (Up to 27th January 2015)
General Manager/CEOS.D.N. Perera (From 12th March 2015) (Acting General Manager/CEO from 20th June 2014 to 11th March 2015)
H.M. Hennayake Bandara (Up to 19th June 2014)
Board SecretaryMs. Y.F. Deen
Board Audit CommitteeBradley Emerson – Chairman (From 12th March 2015)
Lionel P. Fernando – Chairman (Up to 13th January 2015)
Mahinda Siriwardana – Member (From 12th March 2015)
S.R. Attygalle – Member (Up to 24th February 2015)
H. Madiwela – Member (Up to 27th January 2015)
Human Resources & Remuneration CommitteeAswin De Silva – Chairman (From 12th March 2015)
Ms. W.A. Nalani – Chairperson (Up to 19th January 2015)
D.L.P.R. Abeyrathne – Member (From 12th March 2015)
S.R. Attygalle – Member (Up to 24th February 2015)
H. Madiwela – Member (Up to 27th January 2015)
Board Nomination CommitteeAswin De Silva – Chairman (From 12th March 2015)
S.R. Attygalle – Chairman (Up to 24th February 2015)
Mahinda Siriwardene – Member (From 12th March 2015)
Sumith Wijesinghe – Member (Up to 2nd February 2015)
S.T. Abeygunawardena – Member (Up to 12th January 2015)
Board Integrated Risk Management CommitteeD.L.P.R. Abeyaratne – Chairman
Bradley Emerson — Member (From 12th March 2015)
Mahinda Siriwardene – Member (From 12th March 2015)
Lionel P. Fernando – Member (Up to 13th January 2015)
Sumith Wijesinghe – Member (Up to 2nd February 2015)
Compliance OfficerMs. I.K.L. Sasi Mahendran
AuditorsAuditor General
SubsidiaryNSB Fund Management Co. Ltd.
Registered Office and Head Office1st Floor, ‘Savings House’National Savings Bank,No. 255, Galle Road,Colombo 03, Sri Lanka.Tel: 94-11-2564601, 2467731Fax: 94-11-2564706E-mail: [email protected] Code: NSBFLKLXXXX
Board of DirectorsAswin De Silva – Chairman (From 12th March 2015)
Ms. W.A. Nalani – Chairperson (Up to 19th January 2015)
D.L.P.R Abeyaratne – Director
Suranga Naulage – Director (From 12th March 2015)
S.D.N. Perera – Director (From 26th July 2014)
S.T. Abeygunawardena – Director (Up to 12th January 2015)
Lionel P. Fernando – Director (Up to 13th January 2015)
H.M. Hennayake Bandara – Director (Up to 20th June 2014)
Chief Executive OfficerN.K. Dahanayake
AuditorsErnst & Young Co.
Company SecretaryMs. Y.F. Deen
C O R P O R A T E I N F O R M A T I O N


![RESORT SAVINGS & LOANS PLC [RC:198901] ANNUAL REPORT … · 2019-01-02 · Report of the Audit Committee 15 b. Report of the Independent Auditors 16 ... Current Account, Savings and](https://img.pdfslide.net/doc/110x75/5e73a4f4ac17e6372932e24a/resort-savings-loans-plc-rc198901-annual-report-2019-01-02-report-of.jpg)


![RESORT SAVINGS & LOANS PLC [RC:198901] ANNUAL REPORT …](https://img.pdfslide.net/doc/110x75/616d28815e957015971288cc/resort-savings-amp-loans-plc-rc198901-annual-report-.jpg)