Embed Size (px)
Citation preview


2020
| Greek Energy Market Report |

| Greek Energy Market Report |
HAEE 2020
Disclaimer: “The contents of this report are the authors’ sole responsibility. Theydo not necessarily represent the views of the Hellenic Association for EnergyEconomics or any of its Members.”

HAEE was founded in 2015 in Greece, and has a global orientation welcoming theparticipation of researchers and practitioners from around the world interested inenergy, environmental and economic related subjects. It acts as an independentconsulting body for national and international organizations to whom it provides abroad contribution on issues related to energy, economics, policymaking and theory.
Through meetings and joint initiatives HAEE also provides a means of professionalcommunication and exchange within its members and the authorities defining theGreek energy policy. HAEE organizes meetings amongst experts and specialistsinterested in networking - organizes conferences and seminars on both national andinternational levels - promotes training initiatives in the energy and economic sector -provides researches, studies and other services for its members.
HAEE promotes the understanding of energy, environment and economy related topicswithin universities and encourages the participation in the Association’s activities ofyoung students who are invited to seminars and conferences and can make use ofthe IAEE library for their academic works. HAEE is financially supported by memberdues, contributions for research activities carried out for companies and bodiesinvolved in the energy field, and by the sale of conference proceedings as well asconference fees and other initiatives.
Hellenic Association for Energy Economics
Hellenic Association for Energy Economics (HAEE) brings together allthose who study, debate and promote the knowledge of energy,environment and economy in our country. HAEE is the Greek affiliateof the International Association for Energy Economics (IAEE), whichis a non-profit research and professional organization acting as aninterdisciplinary forum for the exchange of ideas and experiencesamong energy experts.
With its 179-year participation in the country's economic andsocial life, NBG is one of the most significant Greek financialorganizations, as it plays a key role in efforts to support theGreek economy and enable the economic transformation of thecountry.
The Bank’s broad customer base, respected brand name, strong market share indeposits and enhanced capital adequacy ratios that provide the liquidity needed tofinance Greek businesses, reflect the long-standing relationship of trust it enjoys withits clientele.
NBG has long been the leading Greek bank in financing the energy sector and hasestablished a strong footprint across all segments of the industry, with investments of€3 billion in corporate customers, €1 billion in renewable energy sources of totalcapacity (either in operation or under construction) amounting to about 1.45 GW andover €100 million in private-public sector partnerships. Being committed to the backingof all major projects that aim to foster economic growth, NBG provides tangiblesupport to the country’s aspiration to evolve into a key energy hub for Europe, withobvious benefits for the domestic economy.
National Bank of Greece

The coronavirus (Covid-19) pandemic has caused an unprecedented global economicand social crisis, significantly affecting all aspects of life. The energy sector is alsoseverely affected by this crisis, which has slowed transport, trade and economicactivity across the globe. The whole range of consequences is yet to be revealed and isdifficult to predict, however it is already clear that demand for energy resources hasdropped, prices have plummeted and production has been declining. The implicationsof the pandemic for energy systems are still evolving but clean energy transition(s)must be at the center of economic recovery and stimulus plans. Renewables, energyefficiency and energy storage, smart grids, cross-sectoral integration, hydrogen,sustainable agriculture will be some of the cornerstones of the upcoming era. Thedecline in CO2 emissions needs to continue, while The Clean Energy Package and theNew Green Deal should not slip away from the list of national policymakers’ andregulators’ priorities.
With the newly released "Greek Energy Market Report 2020" the Hellenic Associationfor Energy Economics presents an analysis and detailed review of the Greek Energymarket based on the most recent data and valuable insights. In this regard, HAEE’sannual report manages to identify the relative strengths and weaknesses of the Greekenergy market during a time of great change. The goal is to provide a full picture tointernational or domestic companies, market participants, regulators and policymakers. Progress is assessed through a series of variables including the country's goalsfor 2030 and 2050, regulatory frameworks, energy security, sustainability,liberalization and through the use of detailed statistics.
On behalf of HAEE, I wish to express my sincere gratitude to our partner, NationalBank of Greece, for its significant support and contribution towards the completion ofthis report. Namely, I would like to thank the CEO of NBG, Mr. Pavlos Mylonas, forendorsing the production of this report, Mr. Vassilis Karamouzis, with whom the ideawas born, and of course Ms Argyro Banila and Mr. Harry Vovos for an excellentcollaboration.
Foreword
2 | Greek Energy Market Report
Assoc. Prof. Dr. Spiros PapaefthimiouChairman HAEE

3 | Greek Energy Market Report
The COVID-19 pandemic has created at the beginning of 2020 the biggest crisis ingenerations, sending shock waves through health systems, economies, and energysystems around the world. Those developments put additional pressure for faster andmore efficient implementation of the European Green Deal Investment Plan. Thisframework is anticipated to mobilize EU funding and create an enabling background tofacilitate and stimulate the public and private investments needed for the transition toa climate-neutral, green, competitive, and circular economy. In light of this crisis, theneed for a sustainable, green recovery has become even more pressing, but also theneed to provide support to the most vulnerable regions. This is why the EuropeanCommission wants to reinforce the Just Transition Fund as part of its crisis responsemechanism.
Nowadays, the Greek government has shown determination towards this direction,throughout a series of new measures and innovative legislations assisting the ongoingEnergy Transition. This willingness is reflected in the revised and ambitious NationalEnergy and Climate Plan that provides exact targets and strict deadlines. Until the endof 2030, the Plan projects new investments related to the Energy sector, which areestimated at around 40 billion euros, reflecting its very promising growth potential andsignificant contribution to the Greek economy. Special attention is paid towardsDecarbonization, Renewable Energy Sources, Digitalization, Eco-mobility, and ofcourse Energy Efficiency. Finally, the state’s planned privatization of major energyassets, such as the two companies of the Public Gas Corporation, DEPA Infrastructureand DEPA Commercial respectively, the Hellenic Electricity Distribution NetworkOperator (HEDNO), and Hellenic Petroleum among others, are additional steps towardsthe further liberalization of the Greek energy market.
This 2nd version of the “Greek Energy Market Report” is based on the successful initialedition of 2019. The challenge of this year’s edition was to adopt and include thesevere impact of the pandemic on all aspects of our analysis, hence particular interestis paid in this direction. Besides, another novelty is that the Report includes insightfulhighlights and a short overview on each of the chapters under examination. Precisely,the chapters focus on the Country Profile in terms of basic economic and energy-related indicators, the Energy Transition and the projections of the National Energyand Climate Plan, the Hellenic Energy Exchange that is anticipated to officially operateunder the Target Model in September 2020. Moreover, the Report reviews all thedevelopments and statistics derived from the Electricity and Natural Gas markets, theincreased penetration of Renewable Energy Sources, the importance of Oil & Refiningfor Greece, the recent developments in terms of Energy Efficiency and the projectedInvestments towards the Energy market. Above all, I hope that the “Greek EnergyMarket Report 2020” will act as a tool supporting the dialogue among marketparticipants and policymakers in order to assist sustainable economic growth andincrease social welfare.
Foreword
Prof. Dr. Kostas Andriosopoulos Project Coordinator

Foreword
4 | Greek Energy Market Report
It is a pleasure to introduce for a second consecutive year the “Greek Energy MarketReport”, an important sponsorship of National Bank of Greece (NBG). Via thispublication we continue to support the country’s energy transformation.
The economic repercussions of Covid-19 are leaving a clear footprint on the globalenergy market. According to the International Energy Agency, energy demand in 2020is expected to contract by 6 per cent - the largest drop in 70 years in percentage termsand the largest ever in absolute terms. Moreover, energy investment globally could fallby one-fifth this year, with many governments and private investors adopting a “wait-and-see” strategy.
In contrast to the times, Greece appears determined not to stray from its path toachieve the ambitious National Plan for Energy and the Climate – that is, to ensurethat two-thirds of Greek electricity production come from renewable sources by 2028.Persisting with bold reforms, Greece is cutting project approval times and isstreamlining spatial planning processes. In fact, investments in renewable energysources, electricity interconnections and energy pipelines of the range of €10-12bn areprojected to materialize over the next three years, which in turn could evolve into avital recovery factor for the Greek economy in the post-covid era. Moreover, furthermomentum could be added through the implementation of the Recovery Plan forEurope, as key guidelines of the Green Deal is expected to be at the heart of thisblueprint.
NBG considers itself a leader in Energy initiatives in Greece. With a total energyportfolio exceeding €2.5bn in utilized credit limits, NBG has a large and diverseportfolio across energy projects of the primary and the secondary market, supportinglarge as well as SME clients, both local as well as international. Moreover, NBG haschanneled more than 1/3 of its funding towards renewable energy projects. Suchinvolvement spans across traditional technologies covering Wind, Solar andHydroelectric power, but we are also expanding towards innovative technologies suchHybrid (Solar, PV and storage), FSRU and CCGT. Having a clear corporate vision topreserve its leading ranking in Energy investments in Greece, NBG is committed todiversify and broaden further its Energy portfolio. We believe this publication plays animportant role in informing the public about the specifics of the Greek energy sectorand we remain available to actively explore cooperation opportunities in support ofyour organic expansion in the Energy sector.
Mr. Paul Mylonas CEO, National Bank of Greece

Coordinator
Dr. Kostas Andriosopoulos holds the position of full Professor in Finance and EnergyEconomics at ESCP Business School, where he is the Executive Director of the EnergyManagement Centre. Dr Andriosopoulos is currently the Vice Chairman at the PublicGas Corporation of Greece (DEPA) and the Chairman of the Energy Committee of theAmerican-Hellenic Chamber of Commerce. Kostas holds a PhD in Finance (CassBusiness School, City University London), where he has been the recipient of theprestigious Alexander S. Onassis Public Benefit Foundation’s scholarship. He also holdsan MBA and MSc in Finance (Northeastern University, Boston, USA), and a bachelor’sdegree in Production Engineering and Management (Technical University of Crete,Greece). Kostas is the Founder and former Chairman of the Hellenic Association forEnergy Economics.
Lead Researcher
Filippos Ioannidis is a PhD candidate at the Department of Economics at AristotleUniversity of Thessaloniki, Greece. Filippos holds an MSc in Banking and Finance fromthe School of Economics, Business Administration and Legal Studies (InternationalHellenic University, Thessaloniki, Greece) and an MSc in Economics from School ofEconomics and Management (Lund University, Lund, Sweden). He obtained hisbachelor’s degree in Economics from the Department of Economics (University ofMacedonia, Thessaloniki, Greece). Currently, he is a research associate of HAEE.
Research Team
Konstantinos Ioannidis is an electrical engineer holding an MSc in Electrical andComputing Engineering from Democritus University of Thrace (DUTH). He was alsoawarded an MSc with distinction in Wind Energy Systems from the University ofStrathclyde, Glasgow, UK. His expertise lies in the Energy Sector and specifically in theRenewable Energy Sources, and he is a research associate and energy advisor of theHellenic Association for Energy Economics on Renewable energy topics.
Christos Zisakis is a research associate and energy consultant for the HellenicAssociation of Energy Economics (HAEE). Christos holds a MEng in MechanicalEngineering, with a major in Energy Engineering, from the National TechnicalUniversity of Athens (NTUA), Greece, the country’s oldest technical university. He hasbeen awarded an MSc with distinction in Energy Management from ESCP BusinessSchool following his studies in London, UK and Paris, France. Before joining the HAEEteam, Christos has held positions in the energy industry in Greece and the UnitedKingdom.
Leonidas Ourgantzidis is an economist working as a research assistant for theHellenic Association for Energy Economics. He holds an MSc in Economics withdistinction from the University of Nottingham (UoN) and a BSc in Economics withhonors from the University of Macedonia (UoM). His academic interests focus on theefficacy of environmental policies and the energy efficiency challenges.
Contributors
The authors are grateful to Konstantinos Dimitrainas (Sector Head/ Large CorporateBanking Division - NBG), and Eleftherios Soumpasis (Relationship Manager/ LargeCorporate Banking Division - NBG) for their significant contribution towards thecompletion of the “Greek Energy Market Report - 2020”.
5 | Greek Energy Market Report
Executive Summary
Aligned with the initial version of 2019, the second edition of the “Greek EnergyMarket Report 2020” reviews all the developments related to the Greek energy sector,by providing the most recent available data. Special focus is placed on theexternalities occurred due to the outbreak of the COVID-19 crisis. Moreover, aconcrete analysis is provided for different sectors affecting the road towards theEnergy Transition. In order to achieve that, the report provides both global andEuropean energy trends and then assesses the role of Greece in terms of following ornot those patterns.
Moreover, the report identifies all energy aspects that Greece is lagging behind,hampering the accomplishment of the country’s energy and climate targets. At thesame time, it functions as a useful tool for those who want to have a solid view of theGreek energy market. Aiming to capture all the topics mentioned above, the Reportconsists of nine distinct chapters, covering the majority of the energy sector:
• Chapter 1 covers the Country Profile of Greece by analyzing and providing the keydemographic, macroeconomic and energy statistics, accompanied by a carefulexamination of the pandemic effect on the Greek energy market.
• Chapter 2 provides an illustrative summary of the National Plan for Energy andClimate by pointing out the country’s energy related targets towards the EnergyTransition.
• A robust examination of the formation and role of the newly established HellenicEnergy Exchange is provided in Chapter 3.
• The next chapter, focuses on the Electricity sector, highlighting various issuesrelated to generation, capacities, prices, imports, exports and the important marketof Eco mobility.
• Chapter 5 is dedicated to Natural Gas and explores all the developments thatoccurred in the market followed by the recent liberalization. Again, all thecharacteristics affecting supply, demand and import prices are carefully investigatedin parallel with the projected plans for expansion of the market through new gridconstruction and use of LNG & CNG technologies.
• Chapter 6 focuses on the significant penetration of Renewable Energy Sources inGreece, by providing unique data, geographical and market analysis, and an updatein regard to the recent regulatory framework.
• Chapter 7 covers the Oil and Refining market, which continues to play a crucialrole for the country, and the recovery of the Greek economy.
• The concept of Energy Efficiency is extensively analyzed in Chapter 8, highlightingthe progress of Greece towards achieving all its energy related goals in varioussectors, such as transportation, industry and households.
• Finally, by linking global and European energy Investment trends with the currentdevelopments in Greece, Chapter 9 outlines the existing framework in terms of allthe ongoing and future energy investments, covering all aspects of the sector.
Data sources are robust and reliable since figures come from freely accessibledatabases such as, World Bank, OECD, Eurostat, IEA and Bloomberg, while statisticsand data considering the Greek energy market were carefully collected from domesticsources such as, EnEx, ADMIE, DESFA, RAE and Elstat.
6 | Greek Energy Market Report HAEE 2020
In summary, Greece is implementing comprehensive energy sector reforms to fostercompetitive energy markets, create opportunities for investors, support thetransformation of the energy system and provide sustainable outcomes for theenvironment and Greek society. The ample availability of renewable energy potentialcombined with the ongoing large-scale infrastructure projects show that Greece will bean important player in the formulation of the European Union (EU) energy mix and willprovide significant investment opportunities in all energy industries. Besides, locatedat the crossroads between East and West Greece is anticipated to play a key role inthe South Balkans and East Mediterranean, as well.
Greece has currently the opportunity to leverage its economic recovery to accelerateemission reductions through energy efficiency and increased shares of Natural Gas andRenewable Energy Sources (RES) in the energy mix. A key part of this process is thedevelopment of a strong and coherent National Energy and Climate Plan for 2030 andbeyond, as well as incorporating climate objectives into integrated energy planning.The country has seen an impressive increase in the share of Renewables in electricitygeneration, even over-achieving the targets set for solar PV. Better exploitation of itsRenewable energy potential could result in a more balanced energy mix and contributeto increasing energy security.
In recent years, the Greek energy system is characterized by the decreasingconsumption of conventional fuels based in large part on lignite which was strategicallychosen for electricity production after the oil crisis of the 70s. Another basiccharacteristic of Greece is that the country is highly dependent on imports, whichinclude Crude Oil, Oil Products and Natural Gas. In that context, over the last decadewe observe an increasing penetration of Natural Gas into final consumption, althoughit still represents a small share of total consumption in Greece and falls short from theEuropean average. On the other hand, following the introduction of the CO2 tax,Natural Gas represents a significant share in electricity production, as percentagewhich is steadily growing over the years.
Furthermore, the energy sector in Greece has a higher contribution to gross valueadded and employment than in most EU countries and is poised to grow significantly inthe coming years, driven by a number of significant factors. First and foremost, therequired optimization of the energy mix, which consists the reduction of fossil-fuelgenerated electricity and increased contribution from RES. This shift will be drivenboth by the revised EU policy of 35% renewable energy sources by 2030, and by thepreference for cheaper and cleaner energy sources, such as Natural Gas.
Next, the outbreak of the COVID-19 delayed the state’s planned privatization of majorenergy assets, such as the Natural Gas distributor (DEPA), the Hellenic ElectricityDistribution Network Operator (HEDNO) and the Hellenic Petroleum. Nationalauthorities seek to further liberalize the Electricity and Natural Gas markets and toseparate the production and supply from transmission networks. The country aims toexplore the potential to become a European gateway for Natural Gas, Electricity andOil resources through mega-infrastructure projects such as, the TAP, IGB, EastMed gaspipelines, EuroAsia Interconnector or gas and oil exploration and production.
Another important aspect of the upcoming energy investments is directed towardsenergy efficiency and cost reduction driven by such technologies as smart metering,smartgrid and energy efficient buildings. Finally, major infrastructure developmentinitiatives such as the interconnection of the Greek islands with the main electricitygrid and the establishment of the Hellenic Energy Exchange in accordance with theelectricity Target Model support the development of the Single Energy market inEurope.
Above all, Greece should continue pursuing the implementation of ambitious energyrelated policies, drawing on the evaluation of outcomes from past and currentmeasures and on the lessons learned by other countries.
7 | Greek Energy Market ReportExecutive Summary

1. Country Profile 3. Energy Exchange
4. Electricity
Contents
5. Natural Gas 6. Renewable Energy Sources
7. Oil & Refining 8. Energy Efficiency
2. Energy Transition
9. Investments
| 9 | | 23 | | 47 |
| 65 | | 89 | |105|
| 121 | | 141 |
“Everything that an investor needs to know about the Greek Energy Market”
| 153 |
8 | Greek Energy Market Report HAEE 2020

1. Country Profile
Impact of
COVID-19
9 | Greek Energy Market ReportHAEE 2020

Highlights
Greece’s Economic Sentiment Indicator dropped by more than
20% as an aftermath
of the pandemic
The unemployment rate fell
to 15.5% in the first
quarter of 2020 but is expected to sharply increase as a consequence of a hampered touristic period
Greek 10-year bond yield dropped below
1% for first time in
February 2020 and remained in low levels during the COVID-19 crisis
The Greek economy is forecasted to decrease
by 10% in 2020 and
return to a 5.1%
growth in 2021
Gross energy consumption in Greece is projected to drop by
11% in 2020 due to
COVID-19 impact
The increased penetration of RES continue in Greece
representing 48% of
primary energy production for 2019 compared to the
40% achieved in the
previous year
Energy market represented
3.7% of
Greece GDP for 2018A single-hit scenario
projects a Greek debt to
GDP ratio of 188%
for 2020 and a double-hit scenario a ratio of
195%
Due to the lockdown effect, a significant annual drop of more
than 20% is
anticipated for 2020 in terms of total CO2 emissions
HAEE 202010 | Greek Energy Market Report

Overview
Greece has earned praises for tackling the Covid-19 threat to public health butnow faces a challenge in containing the impact on the country's fragileeconomy. Even in the best-case scenario, the recession is likely to rival theworst years of the recent debt crisis. The biggest blow is expected in thetourism sector, which is the lifeblood of the Greek economy. The arrival ofvisitors from key destinations is the most important issue troubling nationalauthorities. The total amount that could be a direct loss from the negative effecton tourism is projected to be 10 billion euros.
The crisis is also expected to trigger a big drop in domestic demand, which isanother vital element of the economy. Private consumption accounts for around70% of the Greek GDP. In March 2020, an estimated 2 million workers, justover half of Greece’s entire workforce, received financial support. Householdspending fell by 10% at the peak of the crisis in 2011, but there are fears of abigger drop this year due to the unprecedented lockdown in the wholeeconomy. A slowdown in investments is also likely, just as the government wastargeting an increase of 13.4% in investment spending during 2020. The IMFpredicts Greece will suffer the biggest recession of all European economies, withGDP contracting by 10% before a rebound of 5.1% in 2021. The EuropeanCommission also believes Greece’s dependency on hospitality and its manysmall enterprises will lead to the economy taking a big hit. Brussels expects theGreek economy to contract by 9.7%, a drop that is way bigger compared to allthe other European Union countries. Again, a strong rebound of 7.9 is expectedin 2021.
The IMF expects Greek unemployment to rise by five points this year, reaching22.3%. This translates into 1.1 million unemployed during a time when Greecehad been hoping to see the jobless figure drop below 700.000 this year. Thethreat to jobs was evident in March 2020 employment figures, when 41.903people lost their jobs, compared to 2019 when this amount represented totaljobs creation. The government has adopted a range of mitigating fiscalmeasures to provide businesses and workers with temporary help. The FinanceMinistry believes these interventions could limit the recession around 8%.Whichever way this plays out, the COVID-19 crisis will impact Greece’seconomy. The contraction will likely be larger than in many of Greece’seurozone peers. In that context, the Greek economy will have to find a way tobounce back from this new setback.
Considering the case of the Greek energy market, gross energy consumption isanticipated to decrease by almost 11% in 2020 due to the COVID-19 outbreak,however a quick rebound is expected to take place over 2021. Aiming to depictthe impact of this drop, the following analysis illustrates prior projections of theevolution of various energy variables before and after the COVID-19 crisis. Inoverall, consumption decline during 2020 is attributed to the drop of the generaldemand for Natural Gas, Oil and Coal. Current estimations project that aftertwo years, the energy market will return to prior projections and be aligned withthe targets of the National Plan for Energy and Climate.
11 | Greek Energy Market ReportCountry Profile

Population in Greece (million people), [2009 – 2019]
Increased unemployment rate following theCOVID-19 crisis is a crucial issue that needs to betackled
Unemployment Rate (%), [2006 – 2020 Q1]
Source: Eurostat, Elstat, HAEE’s analysis
11.1
10.7
10.5
10.6
10.7
10.8
10.9
11
11.1
11.2
2009
2010
2011
2012
2013
2014
2015
2016
2017
2018
2019
• Greece’s population numbered 10.724.868 million people in 2019. The population’sdecline can be linked to the severe economic crisis and the brain drain that followed.
• An estimated 500.000 people moved abroad during the financial crisis, during whichthe Greek economy shrunk by a quarter and unemployment skyrocketed to 28%.
• Even though unemployment decreased to 15.5% during the first quarter of 2020,following the COVID-19 is anticipated to sharply increase during Q2 and Q3 of 2020 .
• Youth unemployment rate in Greece continues to be the highest in the developedcountries, since it reached 32.4% in March 2020.
• The successful management of the coronavirus crisis by the Greek authorities duringspring 2020, gives confidence for a quick drop of unemployment rate in 2021.
Highlights
9.0%
27.5%
15.5%
0%
5%
10%
15%
20%
25%
30%
2006
2007
2008
2009
2010
2011
2012
2013
2014
2015
2016
2017
2018
2019
2020 Q
1
HAEE 202012 | Greek Energy Market Report

Economic Sentiment Indicator [2015- May 2020]
The analysis of various economic indicators depictthe catastrophic effect of COVID-19 in terms ofbusiness confidence
Consumer Confidence Indicator[2015- May 2020]
Industrial, Construction, Retail Trade & Service Sector Confidence Indicators[2015- May 2020]
Source: IOBE, HAEE’s analysis
• Following a path of a steady upsurge, Economic Sentiment Indicator reached itsmaximum value in February 2020 and then collapsed to 2015 levels.
• In overall, Economic Sentiment Index in Greece sharply dropped as a result of thestrict lockdown measures with the subsequent effects in all sectors.
• The same downward trend holds for the Consumer Confidence Indicator which isanticipated to return to prior levels by the end of 2020.
• Considering the Confidence Indicators of Retail Trade, Services, Industry andConstruction we observe a sudden drop during the first months of 2020.
• Based on autumn 2019 figures, the Construction Confidence Indicator is anticipatedto quickly recover which is apparent by a small shift in May 2020.
Highlights
70
80
90
100
110
120
Jan
May
Sep
Jan
May
Sep
Jan
May
Sep
Jan
May
Sep
Jan
May
Sep
Jan
May
2015 2016 2017 2018 2019 2020
-80
-70
-60
-50
-40
-30
-20
-10
0
Jan
May
Sep
Jan
May
Sep
Jan
May
Sep
Jan
May
Sep
Jan
May
Sep
Jan
May
2015 2016 2017 2018 2019 2020
0
20
40
60
80
100
120
140
Jan
Mar
May
Jul
Sep
Nov
Jan
Mar
May
Jul
Sep
Nov
Jan
Mar
May
Jul
Sep
Nov
Jan
Mar
May
Jul
Sep
Nov
Jan
Mar
May
Jul
Sep
Nov
Jan
Mar
May
2015 2016 2017 2018 2019 2020
Retail Trade Service Sector Industrial Construction
13 | Greek Energy Market ReportCountry Profile

Based on IMF’s scenario, real GDP in Greece isforecasted to decrease by 10% in 2020 andreturn to a 5.1% growth in 2021
GDP at Current Prices (billion €), [2004-2021]
GDP Growth Rate (%), Quarter Change [2004 - 2020 Q1]
Change in Total Consumption (%), [2004 – 2020]
Source: Elstat, HAEE’s analysis
• Over the previous decade, the Greek economy suffered the longest recession of anyadvanced capitalist economy to date.
• Prior to COVID-19 crisis, the Greek economy was estimated to grow by 2.2% in 2020and around 2% in 2021.
• For 2019, the GDP of Greece stood at 187 billion euros, however, estimations for2020 project a drop to €168 bil. followed by an increase to €177 bil. in 2021.
• During the last quarter of 2019 and first quarter of 2020, the Greek economysuffered significant contraction after 11 quarters of achieving positive growth rates.
• Total consumption reached positive values for 2018 (1%) and 2019 (1.72%),however a sharp drop to -3.52% is anticipated for 2020.
Highlights
0
50
100
150
200
250
300
2004
2005
2006
2007
2008
2009
2010
2011
2012
2013
2014
2015
2016
2017
2018
2019
2020e.
2020e.
-15%
-10%
-5%
0%
5%
10%
15%
2004
2005
2006
2007
2008
2009
2010
2011
2012
2013
2014
2015
2016
2017
2018
2019
2020
-10%
-5%
0%
5%
10%
2005
2006
2007
2008
2009
2010
2011
2012
2013
2014
2015
2016
2017
2018
2019
2020e.
HAEE 202014 | Greek Energy Market Report

Source: Bloomberg, Bank of Greece
10 Year Greek Government Bond (%), [2010 – May 2020]
Deposits of the Private Sector (billion €), [2004 – May 2020]
• Supported by an improving economy and credit ratings upgrades, Greek debt hasbeen one of the euro zone bond market's top performers in 2019.
• In January 2020, Fitch upgraded Greece's credit rating to 'BB' from 'BB-’, due to theachievement of GDP growth and budget discipline.
• The trajectory was for further upgrades and a first investment-grade rating wasabout to follow, possibly by the end of 2021.
• The continuous increase in bank deposits and the improvement in liquidity allowedthe elimination of capital controls as from the 1st of September 2019.
• However, the negative impact due to the Coronavirus put additional pressure on thefragile Greek economy that is mainly affected by the hard-hit sector of Tourism.
Highlights
05
1015202530354045
4/1
/2010
4/1
/2011
4/1
/2012
4/1
/2013
4/1
/2014
4/1
/2015
4/1
/2016
4/1
/2017
4/1
/2018
4/1
/2019
4/1
/2020
0
50.000
100.000
150.000
200.000
250.000
1/1
/2004
1/1
/2005
1/1
/2006
1/1
/2007
1/1
/2008
1/1
/2009
1/1
/2010
1/1
/2011
1/1
/2012
1/1
/2013
1/1
/2014
1/1
/2015
1/1
/2016
1/1
/2017
1/1
/2018
1/1
/2019
1/1
/2020
Greece's 10-year government bond yield droppedbelow 1% in February of 2020, and remained atlow levels during the COVID-19 crisis
15 | Greek Energy Market ReportCountry Profile

Unlike the positive outcome for public health, theGreek economy will emerge shaken from theCOVID-19 crisis
Government Debt as Share of GDP (%), [2004-2024]
Source: Eurostat, HAEE’s analysis
Government Deficit / Surplus as % of GDP, [2004-2020]
• Greece continues to hold the Eurozone’s highest ratio of public debt compared to itsGDP, reaching 173% in 2019, followed by Italy at 132.2%.
• Greece recorded a Government Budget surplus equal to 1.5% of the country's GrossDomestic Product in 2019.
• However, even in the best case scenario, the recession is likely to rival the worstyears of the recent debt crisis.
• The OECD warned that among the advanced and emerging economies, Greece wasrated as the most vulnerable from the imposed shutdown.
• The prevailed optimism about the dropping projection of debt to GDP at 146% in2025, quickly disappeared since revised estimations fluctuate around 185%.
Highlights
171%
146%
188%182%173%
195% 189%
90%
110%
130%
150%
170%
190%
210%
2004
2005
2006
2007
2008
2009
2010
2011
2012
2013
2014
2015
2016
2017
2018
2019
2020
2021
2022
2023
2024
2025
Historical Data IMF's Prior Projection
Revised Projection Revised Projection - 2nd wave
1.50%
-9%
-20%
-15%
-10%
-5%
0%
5%
2004
2005
2006
2007
2008
2009
2010
2011
2012
2013
2014
2015
2016
2017
2018
2019
2020e.
HAEE 202016 | Greek Energy Market Report
0
5.000
10.000
15.000
20.000
25.000
30.000
2018
2019
2020
2021
2022
2023
2024
2025
Coal Oil Products Natural GasElectricity RES After COVID-19Before COVID-19
Actual Forecast
Evolution of Gross Energy Consumption in Greece (ktoe), [2018-2025]
Source: HAEE’s analysisHighlights
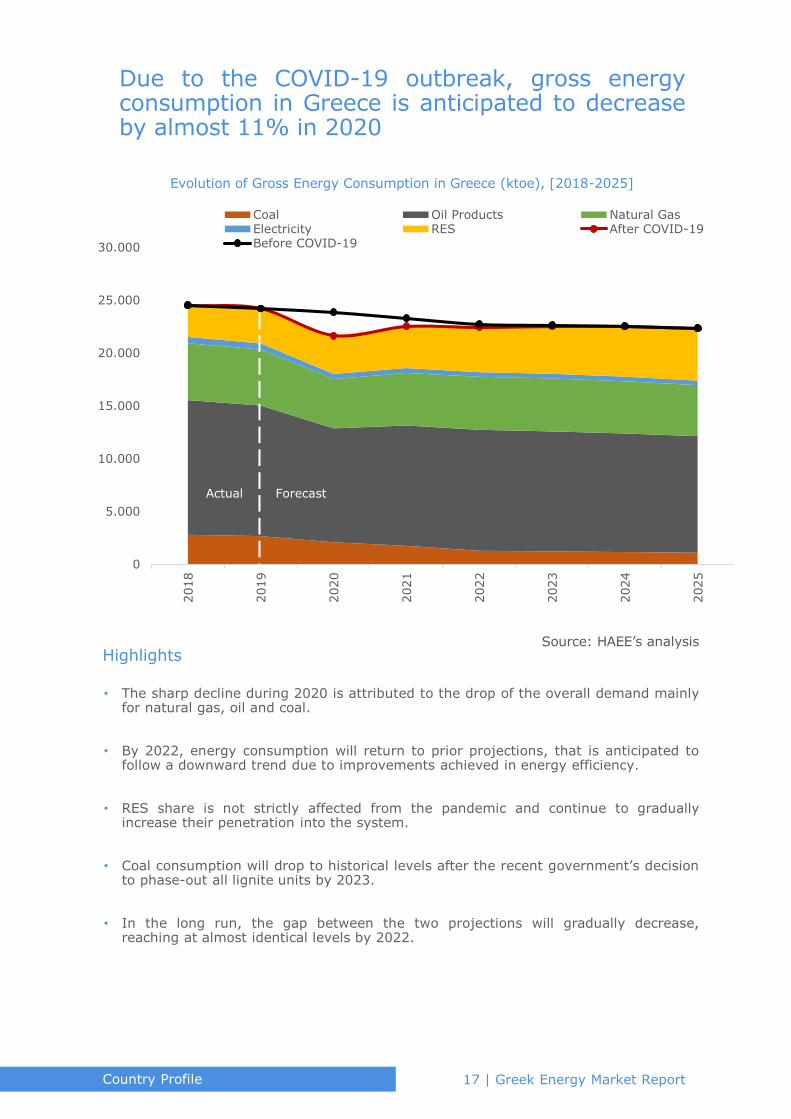
Due to the COVID-19 outbreak, gross energyconsumption in Greece is anticipated to decreaseby almost 11% in 2020
• The sharp decline during 2020 is attributed to the drop of the overall demand mainlyfor natural gas, oil and coal.
• By 2022, energy consumption will return to prior projections, that is anticipated tofollow a downward trend due to improvements achieved in energy efficiency.
• RES share is not strictly affected from the pandemic and continue to graduallyincrease their penetration into the system.
• Coal consumption will drop to historical levels after the recent government’s decisionto phase-out all lignite units by 2023.
• In the long run, the gap between the two projections will gradually decrease,reaching at almost identical levels by 2022.
17 | Greek Energy Market ReportCountry Profile

0
1.000
2.000
3.000
4.000
5.000
6.000
7.000
2018
2019
2020
2021
2022
2023
2024
2025
Coal Oil Products Natural Gas
RES After COVID-19 Before COVID-19
Actual Forecast
Evolution of Primary Energy Production in Greece (ktoe), [2018-2025]
Primary energy production in Greece isanticipated to follow an upward trend mainlydriven by the increased penetration of RES
Highlights
• By the end of 2025, RES are anticipated to represent 75% of total energy producedin Greece, since both coal and oil will follow a downward trend.
• In order to achieve the increased penetration of RES, flexible and quick-responsetechnologies such as Batteries and Demand Response are needed.
• For 2019, coal consumption represented 45% out of total domestic energyproduction while RES stood at 48% and oil at 6%.
• COVID-19 significantly affected the future projections of primary energy productionin Greece since the updated estimations for 2020 are reduced by 20%.
• Based on the National Plan for Climate & Energy, oil production in Greece isanticipated to represent a steady share of 6% throughout the projected period.
Source: HAEE’s analysis
HAEE 202018 | Greek Energy Market Report

Highlights
Net energy imports, are projected to suffer ahuge drop of almost 15% for 2020, attributed tothe overall collapse of the domestic demand
Evolution of Net Energy Imports in Greece (ktoe), [2018-2025]
0
5.000
10.000
15.000
20.000
25.000
2018
2019
2020
2021
2022
2023
2024
2025
Coal Oil Products Natural Gas
Electricity Bioenergy After COVID-19
Before COVID-19
Actual Forecast
Source: HAEE’s analysis
• This short-term drop in energy imports will end by 2021, when energy relatedimports will increase by 6% reaching more than 18.000 ktoe.
• After 2021, a gradual increase of net energy imports is anticipated, reaching theprior estimations provided by the National Plan for Energy & Climate.
• Oil products currently represented 68% out of total energy imports and this share isexpected to remain stable until 2025.
• Both projections of net energy imports follow a downward trend that is reduced by14% in 2025 compared to 2018 levels.
• This tendency is driven by the increased penetration of RES into the system and thegradual replacement of the imported natural gas absorbed in electricity generation.
19 | Greek Energy Market ReportCountry Profile

Highlights
40000
45000
50000
55000
60000
65000
2006
2007
2008
2009
2010
2011
2012
2013
2014
2015
2016
2017
2018
2019
2020
2021
2022
2023
2024
2025
Historical Data After COVID-19 Before COVID-19
Global Financial Crisis
COVID-19
Actual Forecast
Evolution of Total Demand for Electricity in Greece (GWh), [2006-2025])
Source: HAEE’s analysis
• The economic crisis during the last decade, heavily affected the total demand forelectricity which, compared to 2008 levels, dropped by almost 11% in 2014.
• The projections based on the increased demand for electricity during 2019,forecasted that by 2021 the demand would equal 56.5000 GWh.
• However, following the outbreak of COVID-19, this scenario was revised for 2023,meaning that the expected growth in electricity demand will fall short by 2 years.
• This negative effect from the electricity market, partially reflects the adverseoutcome that is anticipated in the aggregate consumption in Greece.
• This U-shaped return, could be easily modified to a V-shaped return or even an L-shaped based on the resurgence of the COVID-19 crisis.
Following the COVID-19 crisis, the target forreturning to 2008 levels in terms of electricitydemand is projected for 2023 instead of 2021
HAEE 202020 | Greek Energy Market Report

15%
20%
25%
30%
35%
40%
45%
50%
2018
2019
2020
2021
2022
2023
2024
2025
After COVID-19 Before COVID-19
Actual Forecast
RES share in Gross Electricity Consumption in Greece (%), [2018-2025]
Highlights
The share of RES in gross electricity consumptionwill be slightly affected by the impact of thepandemic reaching 46% in 2025
Source: HAEE’s analysis
• This small drop of 2% compared to previous estimations is attributed to minor delaysrelated to the construction and financing of new RES projects.
• Since investments in RES are expected to be supported at national level during theCOVID-19 crisis, the trajectory returns back to the path of steady growth quite soon.
• Under development RES projects who secured Tariffs through a tender face strictconnection deadlines, with the risk of bank guarantees forfeiture.
• Supported mainly by the European Commission, national authorities need toguarantee flexibility for the development and completion of renewable projects.
• The European Green Deal aims to completely decarbonize the energy sector over theupcoming decades by moving to clean and circular economy.
21 | Greek Energy Market ReportCountry Profile

Actual Forecast
Evolution of Total CO2 Emissions in Greece (MtCO2), [2018-2025]
Highlights
50
60
70
80
90
100
110
2018 2019 2020 2021 2022 2023 2024 2025
After COVID-19 Before COVID-19
Source: HAEE’s analysis
• Tackling air pollution will not just save millions of lives but will also bring multiplebenefits to issues including climate change and sustainability across the globe.
• Air pollution is a global problem but the burden on health is disproportionately higherin poorer countries and has a pronounced impact on economic progress.
• A significant drop in air pollution has been observed in Athens since the governmenttook strict precautionary measures to counter the spread of the Coronavirus.
• Based on a comparison of the average daily values, in March 2020 there was anannual decrease of 11.4 % in nitrogen dioxide pollutants.
• Member-states are required under European Union directives to draw up andimplement programs to limit their annual emissions.
On the positive side of the current crisis, the totalamount of CO2 emissions in Greece is expected tosharply decrease in 2020
HAEE 202022 | Greek Energy Market Report

2. Energy Transition
23 | Greek Energy Market ReportHAEE 2020

Highlights
Electricity generation by coal will completely phase-out by 2023
Greece aims to achieve improvement in energy efficiency
by 38%
Compared to 1990 levels, the National Plan for Energy projects reduction of total greenhouse gas emissions by
40% in 2030
45% of Greece’s
energy requirements are currently covered by imports of oil products
The share of RES in final gross energy consumption of Greece is anticipated to
rise at least at 35% until 2030
Greece targets to
accomplish a 30% increase of electrical vehicles in the share of new registrations
Βy 2030, natural gas will
represent 22% of final
energy consumption and
32% of total electricity
generation
RES contribution forelectricity generationis projected to reach
61% by 2030
The dependency rate of Greece on energy
imports reached
70.4 % in 2018
HAEE 202024 | Greek Energy Market Report

Overview
The European Green Deal is a roadmap for the promotion of clean, affordableand secure energy for a sustainable future. Supportive towards this direction isthe Emissions Trading System which is considered as the cornerstone of theEU's policy to combat climate change. Over the past decade, significantprogress is observed in terms of the Greek energy market development andliberalization. In that context, the three pillars of the revised National Energyand Climate Plan announced by national authorities at the end of 2019 are (i)Reduction of greenhouse gas emissions, (ii) Increase of Renewable EnergySources penetration, and (iii) Achieve improvement in Energy Efficiency.
Currently, in terms of the energy balance, imports in Greece are almost doublecompared to exports, fact that highlights energy security issues. Greece importsthe majority of its oil and gas needs, which crucially affects the security ofsupply. However, the interplay between energy supply and consumption inGreece reveals a significant drop of oil products over the past decade. Still, dueto the COVID-19 impact, both values representing net energy imports andenergy consumption by sector decreased for 2020.
For 2018, transportation and households absorbed 64.7% of final energyconsumption in Greece. One crucial issue that national authorities need totackle is the percentage of homes unable to get warm, which is still high inGreece and is expected to increase even more due to the COVID-19 crisis.
At the same time, the country reports sufficient progress in terms ofEnvironmental Sustainability which peaked at 135% in 2019. By 2030, CO2emissions are expected to primarily reduce in the electricity generation sector,mainly due to the phase-out of coal units. In parallel, Renewable EnergySources will gradually occupy increased proportion of both domestic productionand consumption. By 2030, more than 1/3 in terms of final energy consumptionwill be generated by RES. Besides, total electricity generation from RES isprojected to double in 2030, reaching 38.1 TWh.
The target for installed capacity of RES until 2030 is to reach 18.9GW from10.1GW in 2020. The ambitious progress of Renewable Energy Sources to reach2030 targets differs among sectors and timing. Considering the developments inNatural gas market, it will continue to play major role, as a bridging fuel, interms of electricity generation, supporting the ongoing Energy Transition.Finally, by 2030, Greece aims to achieve a sharp increase in the share ofelectrical vehicles following the plethora of incentives announced in June 2020.
25 | Greek Energy Market ReportEnergy Transition

The European Green Deal
Source: European Commission, HAEE’s analysis
Aims to transform the EU into a fair and prosperoussociety, with a modern, resource-efficient andcompetitive economy
Targets zero net emissions of greenhouse gasesin 2050 and economic growth to be decoupled fromresource use
Aims to protect, conserve and enhance the EU'snatural capital, and protect the health and well-being of citizens from environment-related risksand put the economy on a more sustainable path
• Between 1990 and 2018, EU reduced greenhouse gas emissions by 23%, while theeconomy grew by 61%.
• Currently, the production and use of energy across economic sectors account formore than 75% of the EU’s greenhouse gas emissions.
• To achieve climate neutrality, a 90% reduction in transport emissions is needed to beaccomplished by 2050.
• The Commission has estimated that achieving the current 2030 climate and energytargets will require €260 billion of additional annual investment (1.5% of 2018 GDP).
• According to the new European Green Deal, at least 30% of the “InvestEU” Fund willcontribute to fighting climate change.
Highlights
The European Green Deal is a roadmap for thepromotion of clean, affordable and secure energyfor a sustainable future
HAEE 202026 | Greek Energy Market Report

Energy Security
Score: 51/100
Energy Equity
Score: 88/100Environmental Sustainability
Score: 72/100
Greece ranks 47th in the Trilemma Global Indexwith diverse performance across the threedimensions
Source: World Energy Council, HAEE’s analysis
• Greece has achieved a relatively high Energy Equity score (88/100) and a sufficientranking in terms of Environmental Sustainability (72/100).
• The country has put in place a number of policy instruments to meet the increasingelectricity demand, favoring the market uptake of Renewable Energy Sources.
• The aim is to minimize the share of coal in electricity generation in order to improvethe country's environmental sustainability performance.
• High dependence on energy imports such as oil and natural gas, significantly affectsthe Energy Security Index.
• Strict policies and precise targets have been announced by the revised National Planfor Energy and Climate which aims to increase environmental sustainability.
Highlights
Trilemma Global Index [2019]
27 | Greek Energy Market ReportEnergy Transition

99%
1%
Oil and
petroleumproducts
Others
In terms of the energy balance, imports in Greeceare almost double compared to exports, fact thathighlights energy security issues
Source: European Commission, HAEE’s analysis
7.54
38.77
20.57
Energy
Production
Imports Exports
57%
3%
40%
Brown coal
Crude oil
Renewables
and biofuels
86%
11%
3%
Oil and petroleum
products
Natural gas
Others
Energy Balance (Mtoe), [2018]
• Greece produced 7.54 Mtoe of energy for 2018, out of which 57% stands for browncoal, 40% for renewables and 3% for crude oil.
• Energy imports reached 38.77 Mtoe in 2018 with oil and petroleum productsrepresenting 88% of the total amount and natural gas 11%.
• For 2018, oil and petroleum products denoted 99% of energy exports, or almost20.57 Mtoe.
• As the figures reveal, the high dependence on oil and gas imports is driving Greecetowards exploration efforts.
• In general, large-scale RES development can significantly contribute towardsimproving the energy security ranking of Greece.
Highlights
HAEE 202028 | Greek Energy Market Report

Source: Eurostat, IEA, HAEE’s analysis
1.7
1.9
2.1
2.3
2.5
2.7
2.9
1990
1992
1994
1996
1998
2000
2002
2004
2006
2008
2010
2012
2014
2016
2018
Total Primary Energy Supply per Capita (toe/capita), [1990-2018]
12
14
16
18
20
22
24
261990
1992
1994
1996
1998
2000
2002
2004
2006
2008
2010
2012
2014
2016
2018
Net Energy Imports (Mtoe), [1990-2018]
30
35
40
45
50
55
60
65
70
75
1990
1992
1994
1996
1998
2000
2002
2004
2006
2008
2010
2012
2014
2016
2018
Greece EU
Energy Dependence (%), [1990-2018]
Greece imports the majority of its oil and gasneeds, which crucially affects the security ofsupply
70
98
62
50
60
70
80
90
100
1990
1992
1994
1996
1998
2000
2002
2004
2006
2008
2010
2012
2014
2016
2018
Total CO2 Emissions (Mt of CO2),
[1990-2018]
• Over a 28-year period (1990-2018), energy dependence in Greece is constantlyfluctuating above EU’s average, reaching 70.46% in 2018.
• A steady upward trend is apparent in EU’s energy dependence since the percentagehiked from 44% in 1990 to the maximum ever recorded 55.7% in 2018.
• Crude oil largely dominated EU’s imports of energy products in the first semester of2019 with a share of 71%, followed by natural gas with 24%.
• Total CO2 emissions and total primary energy supply per capita in Greece depictidentical patterns and this symmetry reflects the correlation between the two graphs.
• Since 1990, net energy imports have been constantly rising until 2008, when a sharpdecrease followed up to 2013.
Highlights
29 | Greek Energy Market ReportEnergy Transition

For 2018, transportation and households needsrepresented 64.7% of final energy consumption inGreece
Source: European Commission, HAEE’s analysis
18.2%
38.9%
25.8%
13.8%
1.8%
1.5%
0%
10%
20%
30%
40%
50%
60%
70%
80%
90%
100%
1990
1991
1992
1993
1994
1995
1996
1997
1998
1999
2000
2001
2002
2003
2004
2005
2006
2007
2008
2009
2010
2011
2012
2013
2014
2015
2016
2017
2018
Industry Transport Households Services Agriculture and Fishing Other
Final Energy Consumption by Sector (%), [1990-2018]
• Final energy consumption for 2018 is consisting by the following categories: Industry18.2%, Transport 38.9%, Households 25.8%, Services 13.8% and Others 3.3%.
• The industrial sector follows a constant decline in terms of final energy consumptionsince 1990, when it represented almost one third of total consumption.
• The share of services has almost tripled compared to 1990 percentage (4.7%), whileagriculture and fishing dropped to 1.8% in 2018 from 7.5% in 1990.
• Given the significant share that corresponds to the transport sector in terms of finalconsumption, the country’s quick shift towards eco-mobility is crucial.
• At the same time, since household consumption represents more than 25% of finalconsumption, the need to focus on energy efficiency policies is vital.
Highlights
HAEE 202030 | Greek Energy Market Report

Source: Eurostat, HAEE’s analysis
2.642.91
3.283.65 3.71 3.81 3.77
3.973.69
2.37 2.41 2.45 2.47 2.47 2.45 2.47 2.42 2.41
0
1
2
3
4
5
2010 2011 2012 2013 2014 2015 2016 2017 2018
Greece EU
1500
2500
3500
4500
5500
6500
100000
150000
200000
250000
300000
1995
1996
1997
1998
1999
2000
2001
2002
2003
2004
2005
2006
2007
2008
2009
2010
2011
2012
2013
2014
2015
2016
2017
2018
EU Greece
Energy Tax Revenue (millions €), [1995-2018]
Environmental Tax Revenues (% of GDP), [2010-2018]
• Across the European Union, the environmental tax revenue-to-GDP ratios for 2018ranged from the lowest 1.6 % in Ireland to the highest 3.7 % in Greece.
• This percentage met in Greece (3.7%) is significantly greater compared to theaverage rate of EU Member States which is 2.4%.
• For the majority of the countries the ratio decreased in 2018, with the largestdecrease recorded in Greece (-0.28 percentage points).
• At national level, the European Green Deal will create the context for broad-basedtax reforms, mainly by removing subsidies for fossil fuels.
• EU’s Just Transition Mechanism, will mobilize at least €150 billion in investments overthe period 2021-2027 to support a fair and just green transition.
Highlights
Following 2009, data reveal a sharp increase inenergy taxation revenues compared to thecorresponding average value for the EU members
31 | Greek Energy Market ReportEnergy Transition

Source: Eurostat, HAEE’s analysis
15.4
18.6
26.1
29.5
32.9
29.2 29.1
25.7
22.7
9.5 9.8 10.8 10.8 10.3 9.4 8.7 7.8 7.3
0
5
10
15
20
25
30
35
2010 2011 2012 2013 2014 2015 2016 2017 2018
Greece EU
Inability to Keep Home Adequately Warm (%), [2010-2018]
18.8
23.3
31.835.2
37.3
42 42.2
38.535.6
9.1 9 9.9 10.2 9.9 9.1 8.1 7 6.60
5
10
15
20
25
30
35
40
45
2010 2011 2012 2013 2014 2015 2016 2017 2018
Greece EU
Arrears on utility bills (%), [2010-2018]
• Energy poverty is defined as the inability to keep homes adequately warm or to payoff energy utility bills.
• Among the EU countries, Greece has experienced the biggest increase concerningthe inability to keep homes adequately warm, though this trend seems to decline.
• The impact of the financial crisis in Greece increased the inability of households tomeet the energy utilities obligations, peaking at 42.2% in 2016.
• In particular, the percentage of households which encountered difficulties in utilitybills, was 18.8% in 2010, while it reached 35.6% of households for 2018.
• Currently, the majority of European Union countries introduce national measures inorder to curb the sources of energy poverty.
Highlights
The percentage of homes unable to get warm isstill high and is expected to increase even moredue to the COVID-19 crisis
HAEE 202032 | Greek Energy Market Report

Over the past decade, significant progress isobserved in terms of the energy marketdevelopment and liberalization
- Liberalization of electricity market
- Establishment of RAE
1999 2003 2011
Dec. 2000Establishment
of DESMIE
Organization & operation of the
liberalized electricity & natural gas market
Feb. 2012Establishment of ADMIE & LAGIE
2016
Wholesale financial electricity market
Jun. 2018Establishment of HEnEx & DAPPEP
Restructuring of electricity market
Timeline of the Liberalization Process in the Greek Energy Market
2014
Hydrocarbon exploration and
drilling ratified by the Greek Parliament
2017
Wholesale natural gas liberalization
2018
Retail natural gas liberalization
Source: HAEE’s analysis
Feb. 20111st Energy
Efficiency Package
Mar. 20182nd Energy
Efficiency Package
Aug. 2011Establishment
of HEDNO
2012
Sep. 2020Target Model
Initiation
20202019
Nov. 2019Last Resort
Aggregator enter the DAS
Dec. 2019Revised National
Energy Plan announced
Introduction of simplifying RES
licensingprocedures
2nd Energy Package
19961st Energy Package
20093rd Energy Package
2019Green Energy
Deal
• Plethora of measures have been adopted since 1996 to address market access,transparency, regulation, consumer protection and interconnections support.
• Competition in electricity market is still weak, since PPC’s dominates the marketshare (71.48% in January 2020).
• The same holds also for the wholesale and retail gas markets since currently only asmall but growing number of competitors exist in the specific market.
• The constant implementation of electricity and gas market reforms are the necessarysteps towards the implementation of the Target Model in 2020.
• The main priority of the new National Plan for Energy and Climate includes asustainable development model along with environmental protection.
Highlights
33 | Greek Energy Market ReportEnergy Transition

Total greenhouse gas emissions to be reduced by at least 40% compared to1990 (percentage achieved reduction> 42%)
▪ Achieve equivalent objectives in terms of emissions reduction in the individual areasinside and outside of the trading system of allowances.
▪ Quantitative achievement of national targets for the reduction of specific air pollutants.
▪ Withdrawal of lignite units power generation by 2023.
Reduction of Greenhouse Gas Emissions and other Environmental Targets
Increase of Renewable Energy Sources penetration
The share of RES in final gross energy consumption to rise at least at 35%
▪ The share of RES in final gross electricity consumption energy to rise at least 60%.
▪ The share of RES for the heating needs and cooling to overcome 40%.
▪ The share of RES in transport sector to exceed 14% (achieves 19%) according to therelative methodology calculation of the EU.
Achieve improvement in energy efficiency by 38% according to Europeanmethodology
▪ The final consumption of energy should not to exceed 16.5 Mtoe the year 2030.
▪ The primary energy consumption should not exceed 22.5 Mtoe in the year 2030.
▪ To be achieved at least 7 M toe cumulative energy saving in the period 2021 2030.
▪ 3% annually energy renovation of the total buildings area of the central publicadministration by year 2030.
Source: National Energy and Climate Plan, Ministry of Environment and Energy (2019)
Achieve improvement in Energy Efficiency
The three pillars of the revised National Energyand Climate Plan announced by the Ministry ofEnvironment and Energy by the end of 2019
HAEE 202034 | Greek Energy Market Report

Source: World Energy Council & National Energy and Climate Plan
78% 78%
75%
73%
71%
66%
68%
70%
72%
74%
76%
78%
80%
2020 2022 2025 2027 2030
Energy Dependency (%), [2020-2030]
60%
70%
80%
90%
100%
110%
120%
130%
140%
2000
2001
2002
2003
2004
2005
2006
2007
2008
2009
2010
2011
2012
2013
2014
2015
2016
2017
2018
2019
Environmental Sustainability
Energy Equity
Energy Security
Historical Trilemma Scores (Baseline=2000), [2000-2019]
Highlights
• Most sustainability indicators have been improving considerably since the late 2000s,particularly low carbon electricity generation and GHG emissions.
• However, the equity index has been decreasing during the same period, mainly dueto higher electricity prices that are among the highest in Europe.
• Diversity of the energy mix remains a challenge for security, with lower performancein this dimension due to increased dependence on oil and natural gas.
• The Greek energy sector is still largely dependent on fossil fuels, most of which areimported, with 45% of its energy requirements covered by petroleum products alone.
• These petroleum products are not only used in the transport sector, but they are alsoconverted in relevant amounts into electricity, mainly at non-interconnected islands.
The country reports sufficient progress in termsof Environmental Sustainability which peaked at135% in 2019
35 | Greek Energy Market ReportEnergy Transition

Source: National Energy and Climate Plan, HAEE’s analysis
53%63% 67% 69%
76%
2020 2022 2025 2027 2030
Targets for Emission Reductions for the Sectors Included in ETS Compared to
2005 (%), [2020-2030]
26% 27% 29% 30% 33%
2020 2022 2025 2027 2030
Targets for Emission Reductions for the Sectors in non-ETS Compared to 2005
(%), [2020-2030]
41%47% 50% 51%
56%
2020 2022 2025 2027 2030
Total Greenhouse Gases (GHG) Emission Reductions Compared to 2005 (%),
[2020-2030]
22%30% 33% 35%
42%
2020 2022 2025 2027 2030
Total GHG Emissions Reduction Compared to 1990 (%), [2020-
2030]
Highlights
• The 76% reduction for sectors included in the ETS compared to 2005 levels is moreintense compared to the corresponding 33% for non-ETS sectors.
• Through a complete guide of policies, total emissions from greenhouse gases in 2030are anticipated to be reduced by more than 50% compared to 2005 levels.
• Compared to 1990 levels the total GHG emissions are aimed to be lessened byalmost double (42%) in 2030, compared with the current level of 22%.
• Apart from the operating airlines, these targets limit emissions from heavy energy-using installations, such as power stations and industrial plants in Greece.
• Following the above targets is a key tool for reducing greenhouse gas emissions in amanner that could be characterized as cost-effective.
The European Union Emissions Trading Systemis the cornerstone of the EU's policy to combatclimate change
HAEE 202036 | Greek Energy Market Report
74%
31%
54%
7%
35%
88%
55%62%
10%
50%
Sulfur dioxide (SO2) Nitrogen oxides (NOx) Volatile organiccompounds other than
methane (NMVOC)
Ammonia (NH3) Fine particulate matter(PM2.5)
2020-2029 2030
Target for Percentage Decrease of Atmospheric Pollutants Compared to 2005 (%), [2020-2030]
0
5
10
15
20
25
2020 2022 2025 2027 2030
Electricity Generation Energy Sector Industry
Households Servises Transportation
CO2 Emissions by Sector (MtCO2), [2020-2030]
Highlights
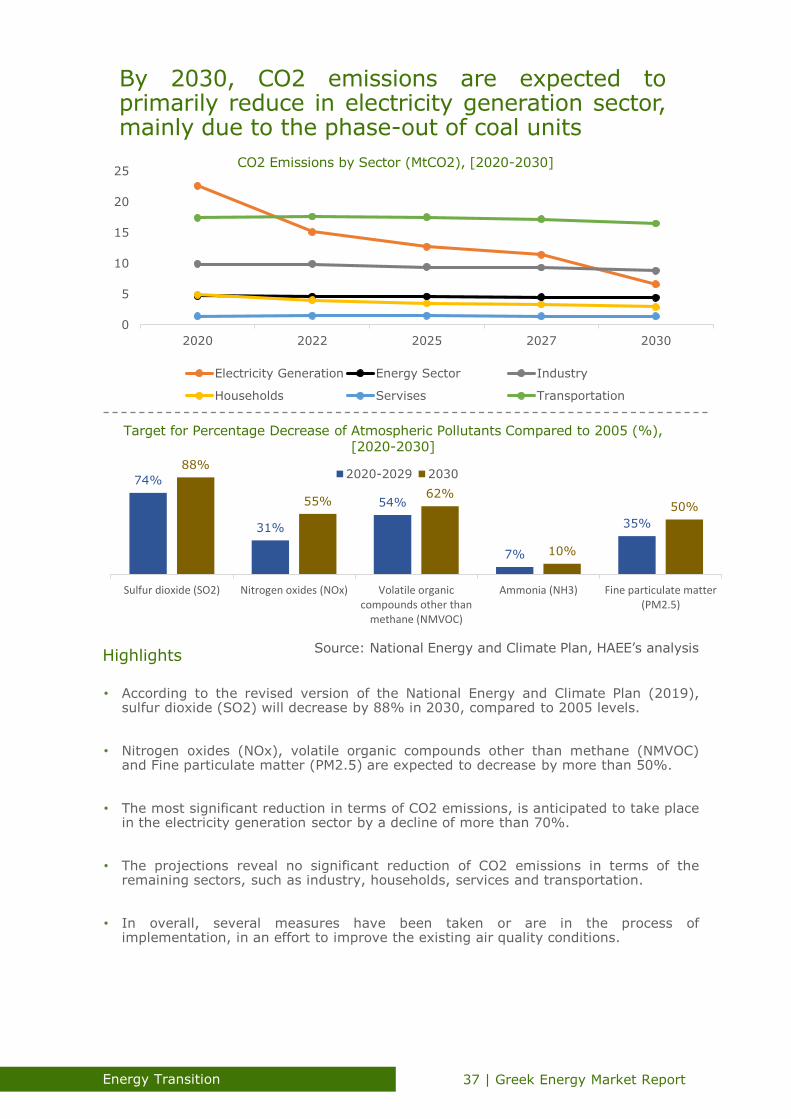
• According to the revised version of the National Energy and Climate Plan (2019),sulfur dioxide (SO2) will decrease by 88% in 2030, compared to 2005 levels.
• Nitrogen oxides (NOx), volatile organic compounds other than methane (NMVOC)and Fine particulate matter (PM2.5) are expected to decrease by more than 50%.
• The most significant reduction in terms of CO2 emissions, is anticipated to take placein the electricity generation sector by a decline of more than 70%.
• The projections reveal no significant reduction of CO2 emissions in terms of theremaining sectors, such as industry, households, services and transportation.
• In overall, several measures have been taken or are in the process ofimplementation, in an effort to improve the existing air quality conditions.
Source: National Energy and Climate Plan, HAEE’s analysis
By 2030, CO2 emissions are expected toprimarily reduce in electricity generation sector,mainly due to the phase-out of coal units
37 | Greek Energy Market ReportEnergy Transition

Evolution of Primary Energy Production in Greece (ktoe), [2020-2030]
Evolution of Gross Energy Consumption (ktoe), [2020-2030]
Highlights
• A sizeable gap between the total energy produced in Greece relatively with the totaldemand for consumption is observed, fact that underlines energy security issues.
• The most important figure from the evolution of primary energy production in Greeceis the ongoing reduction of fossil fuels that is almost zero in 2030.
• At the same time, regarding the production from RES, a sharp increase of almost90% is expected to take place during the next decade.
• In terms of the gross energy consumption the pattern that can be derived from theprojections is the downward trend in total consumption due to the phase-out of coal.
• Total energy consumed by RES is again expected to be 90% greater at the end of2030, while natural gas and oil will slightly reduce.
Source: National Energy and Climate Plan, HAEE’s analysis
46995195
60316696
7021
0
1000
2000
3000
4000
5000
6000
7000
8000
2020 2022 2025 2027 2030
RES
Natural Gas
Oil Products
Fossil Fuels
Primary Energy
Production
21626 21628 22359 22275 22191
0
5000
10000
15000
20000
25000
2020 2022 2025 2027 2030
RES
Electricity
Natural Gas
Oil Products
Fossil Fuels
Total Consumption
Renewable Energy Sources will gradually occupyincreased proportion of both domesticproduction and consumption
HAEE 202038 | Greek Energy Market Report
Evolution of Net Energy Imports in Greece (ktoe), [2020-2030]
Evolution of Final Energy Consumption by sector (ktoe), [2020-2030]
Highlights
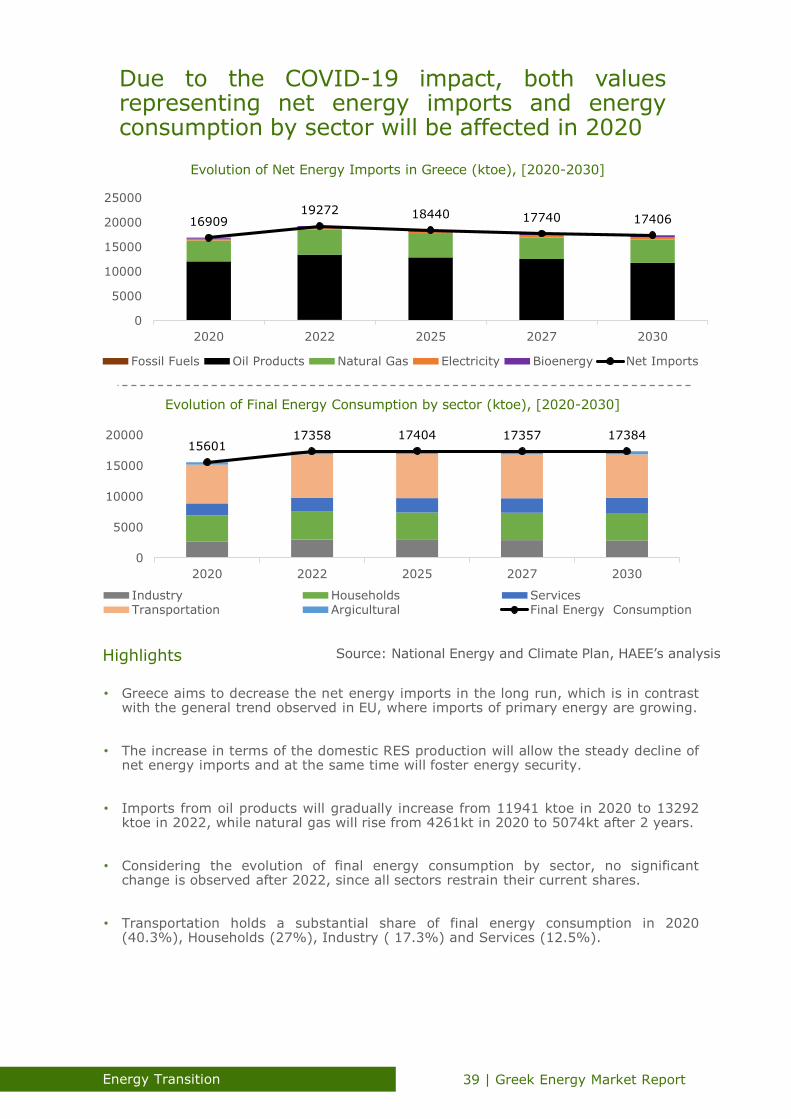
• Greece aims to decrease the net energy imports in the long run, which is in contrastwith the general trend observed in EU, where imports of primary energy are growing.
• The increase in terms of the domestic RES production will allow the steady decline ofnet energy imports and at the same time will foster energy security.
• Imports from oil products will gradually increase from 11941 ktoe in 2020 to 13292ktoe in 2022, while natural gas will rise from 4261kt in 2020 to 5074kt after 2 years.
• Considering the evolution of final energy consumption by sector, no significantchange is observed after 2022, since all sectors restrain their current shares.
• Transportation holds a substantial share of final energy consumption in 2020(40.3%), Households (27%), Industry ( 17.3%) and Services (12.5%).
Source: National Energy and Climate Plan, HAEE’s analysis
1690919272 18440 17740 17406
0
5000
10000
15000
20000
25000
2020 2022 2025 2027 2030
Fossil Fuels Oil Products Natural Gas Electricity Bioenergy Net Imports
1560117358 17404 17357 17384
0
5000
10000
15000
20000
2020 2022 2025 2027 2030
Industry Households ServicesTransportation Argicultural Final Energy Consumption
Due to the COVID-19 impact, both valuesrepresenting net energy imports and energyconsumption by sector will be affected in 2020
39 | Greek Energy Market ReportEnergy Transition

15.49%9.84% 8.36% 8.28%
6.87%
5.16%4.07% 3.45%
43.84%
41.45%
35.31%29.60%
31.99%
13.75%
19.00%
23.04%
26.17%
29.91%
8.83%11.81%
15.67%18.27%
21.18%
10.41% 11.72% 11.65% 11.53% 11.17%
2020 2022 2025 2027 2030
Coal Oil Natural Gas Wind PV
Hydro Bioenergy Geothrrmal Solar Stations
52379GWh 52822GWh 54283GWh 54833GWh 57220GWh
Evolution of Electricity Generation by Source (%) & Total Electricity Generation (GWh), [2020-2030]
Highlights
• In general, electricity generation in Greece will slightly increase each year reaching57.220 GWh in 2030 from the level of 52.379 GWh in 2020.
• Greece aims to eliminate the use of coal for electricity generation by 2030, and atthe same time drop the use of oil mainly in non-interconnected islands to 1.45%.
• Natural gas will continue to play a dominant role as a bridging fuel in the ongoingenergy transition, since its share is estimated to be 31.9% in 2030.
• Electricity produced by Renewable Energy Sources will follow a sharp increasereaching 51% in 2030. An increase of 28% compared to current levels (22.58%).
• The levels of Hydro will remain relatively stable (around 10%), while the proportionsof Geothermal and Bioenergy will slightly increase.
Source: National Energy and Climate Plan, HAEE’s analysis
Coal phase-out and substantial penetration ofRenewable Energy Sources are the two mostimportant trends until 2030
HAEE 202040 | Greek Energy Market Report

6604
50674331 4054
3670
0
1000
2000
3000
4000
5000
6000
7000
2020 2022 2025 2027 2030Fossil Fuels Oil Products Natural Gas
Bioenergy Geothermal Total Production
Evolution of Electricity Generation by Fuel (ktoe), [2020-2030]
Energy Savings by Sector (Mtoe), [2020-2030]
Highlights
• The total amount of electricity generation provided by fuels such as, coal, oil andnatural gas is anticipated to be reduced by 44.4% over the next years.
• This sizeable reduction in terms of electricity generation will occur due to the gradualelimination of coal and oil that currently represent more than 40% of generation.
• The projection regarding the use of bioenergy and geothermal is that those twosources of generation will end up representing 23% of total generation by fuels.
• Greece has introduced measures and incentives that promote total energy savings,that are anticipated to reach 10.3 Mtoe by 2030.
• The greatest proportion of those savings will originate from Transportation (36%),Households (33%), Services and Agriculture (16.5%), and Industry (14.5%).
Source: National Energy and Climate Plan, HAEE’s analysis
Natural gas will continue to play major role as abridging fuel in terms of electricity generation,supporting the ongoing Energy Transition
41 | Greek Energy Market ReportEnergy Transition

20% 23% 27%30%
35%
2020 2022 2025 2027 2030
RES share in Final Energy Consumption (%), [2020-2030]
31% 34% 37% 38%43%
2020 2022 2025 2027 2030
RES share in Final Consumption for Heating and Cooling (%), [2020-2030]
29%39%
47%53%
61%
2020 2022 2025 2027 2030
RES share in Gross Electricity Consumption (%), [2020-2030]
7% 7% 10%12%
19%
2020 2022 2025 2027 2030
RES Share in Final Consumption for Transport (%), [2020-2030]
Highlights
• Final energy consumption from RES is currently at 20%, while this share is expectedto increase by 15% and reach the level of 35% in 2030.
• Significant contribution of RES is also projected to occur for heating and coolingpurposes given that the share will amplify from 31% in 2020 to 43% in 2030.
• The most important increase of RES share is attributed in terms of gross electricityconsumption since the share is projected to triple at the level of 61%.
• However, more progress should be reported in transportations since RES share interms of final consumption at this sector is currently at disappointing levels.
• Despite major growth in renewables, the targets for total emission reduction arechallenging, demonstrating once again that urgent action is needed on all fronts.
Source: National Energy and Climate Plan, HAEE’s analysis
By 2030, more than 1/3 in terms of final energyconsumption will be generated by RenewableEnergy Sources
HAEE 202042 | Greek Energy Market Report

32%
54%
69%
100%
2022 2025 2027 2030
27%
52%
65%
100%
2022 2025 2027 2030
30%
55%
75%
100%
2022 2025 2027 2030
Progress of RES in Gross Energy Consumption (%), [2022-2030]
6%
28%
41%
100%
2022 2025 2027 2030
Progress of RES in Final Consumption for Heating and
Cooling (%), [2022-2030]
Progress of RES in Gross ElectricityConsumption (%), [2022-2030]
Progress of RES in Final Consumption for Transportation (%), [2022-2030]
• Over the next decade, we observe a relatively steady growth in the growth of RESuse in gross energy consumption.
• Regarding the utilization of RES for heating and cooling purposes, the majority of theprogress (35%) is estimated to be achieved as we approach in 2030.
• In terms of electricity consumption, the gradual phase out of coal units and decreaseof oil use will allow RES increase their penetration reaching 61% in 2030.
• Achieving this goal requires doubling the current installed capacity of almost all REStechnologies with the exception of large hydroelectric projects.
• During the next five years, slow progress is reported in terms of RES contribution inTransportation, since 59% of the progress will be accomplished after 2027.
Highlights Source: National Energy and Climate Plan, HAEE’s analysis
The ambitious progress of Renewable EnergySources to reach 2030 targets differs amongsectors and timing
43 | Greek Energy Market ReportEnergy Transition

10.111.9
14.516.3
18.9
2020 2022 2025 2027 2030
33.6 3.4
0.1
3.94.2
3.7
0.1
5.3 5.2
3.7
0.2
6.36
3.7
0.3
7.7
7
3.7
0.5
Photovoltaics Wind Hydro Other
2020 2022 2025 2027 2030
RES Electricity Generation – Total Installed Capacity (GW), [2020-2030]
RES Electricity Generation - Installed Capacity by source (GW), [2020-2030]
* Other include Biomass, Biogas, Solar Thermal & Geothermal
• Photovoltaics are anticipated to achieve a huge rise in terms of total capacity,reaching 7.7GW in 2030 which is 150% greater compared to current levels.
• Substantial increase in total installed capacity is also anticipated in terms of windparks from 3.6GW in 2020 to 7GW in 2030.
• The projection regarding the capacity of hydro units is to remain at stable levelsthroughout the next decade, contributing with 19% in total capacity of 2030.
• Small but gradually increasing proportion of total electricity capacity will originatefrom other RES, such as biomass, biogas, solar thermal and geothermal.
• The current design of policies in terms of total installed electricity capacity prioritizethe steady growth of RES, and more precisely Photovoltaics and Wind.
Highlights Source: National Energy and Climate Plan, HAEE’s analysis
The target for installed capacity of RenewableEnergy Sources until 2030 is to reach 18.9GWfrom 10.1GW in 2020
HAEE 202044 | Greek Energy Market Report

17.7
23
28.432.2
38.1
2020 2022 2025 2027 2030
7.2
4.65.5
0.4
10
6.3 6.2
0.5
12.5
8.5
6.3
1.1
14.3
10
6.3
1.6
17.1
12.1
6.4
2.5
Wind Photovoltaics Hydro Other
2020 2022 2025 2027 2030
RES Electricity Generation (TWh), [2020-2030]
RES Electricity Generation (TWh), [2020-2030]
* Other include Biomass, Biogas, Solar Thermal & Geothermal
• Energy Transition is about to allow Renewables to become the main source ofenergy, while guaranteeing security of supply to all citizens, at an affordable price.
• In 2030, almost 45% of total electricity generated from RES will come from Wind,32% from Photovoltaics, 17% from Hydro and the remaining 6% from other RES.
• Over the years, significant increase of electricity generation is observed in terms ofWind and Photovoltaics, while Hydro remains relatively stable.
• Due to the stochastic nature of Photovoltaics and Wind, Greece should emphasize onother RES that can provide flexibility and lessen severe price fluctuation.
• In that context, electricity generation from RES such as Biomass, Biogas, Solarthermal and Geothermal is projected to be 5 times greater in 2030 (2.5TWh).
Highlights Source: National Energy and Climate Plan, HAEE’s analysis
Total electricity generation from RenewableEnergy Sources is projected to double in 2030,reaching 38.1 TWh
45 | Greek Energy Market ReportEnergy Transition

10.80%
24.10%
12.80%
30.00%
0%
5%
10%
15%
20%
25%
30%
2018 2019 2020 2021 2022 2023 2024 2025 2026 2027 2028 2029 2030
Baseline Scenario
Strong Scenario
Evolution of the Share of Electric Vehicles in Annual New Registrations of the Greek Market (%), [2018-2030]
Highlights
• According to the “baseline scenario”, the share of electric vehicles in terms of annualnew registrations will reach 10.8% in 2025 and 24.1% in 2030.
• However, the more ambitious “strong scenario” indicates that new registrations ofelectric vehicles will be 12.8% in 2025 and will reach 30% in 2030.
• In overall, during the next three years, we observe a slow progress in terms of newelectric vehicle registrations that will start to gain significant growth after 2023.
• Electric vehicle buyers in Greece benefit from various incentives, still substantialprogress needs to be made in order to boost eco-mobility and reach targets.
• Innovative actions concerning electric vehicles and their charging strategies will besupported, with emphasis on the electricity consumed from RES and hydrogen.
Source: National Energy and Climate Plan, HAEE’s analysis
By 2030, Greece aims to achieve a sharpincrease in the share of electric vehiclesfollowing the plethora of incentives announced
HAEE 202046 | Greek Energy Market Report

3. Hellenic Energy Exchange
47 | Greek Energy Market ReportHAEE 2020

Highlights
Target Model is going to be implemented in
September of 2020
The market design of a fully operational Natural Gas Exchange is currently under development
Energy Derivatives Market launched its operations in March
2020Liquidity in the Energy Derivatives Market is almost zero after 3 months of operation
Aggregators have entered the Day-Ahead Scheduling as of the 1st
of November 2019
HEnEx complies with various European licenses, such as REMIT, EMIR, MIFID II, MAR CAD and CRD
Covid-19 has delayed the implementation of the Target Model and negatively affected the liquidity of Energy Derivatives Market
EUPHIMIA Algorithm which couples the Paneuropean Intraday markets is expected to be available by the end
of 2022
Continuous Trading and Complementary Regional Intraday Auctions are anticipated to be available at the
beginning of 2021
HAEE 202048 | Greek Energy Market Report

Overview
After a long delay the Hellenic Energy Exchange is expected to launch itsoperations under the Target Model on September 2020. The new marketstructure involves the cooperation of various entities such as the HEnEx, theEnEx Clear, the Athex Clear and ADMIE as the Transmission System Operator.Besides, the Regulatory Authority for Energy and the Hellenic Capital MarketCommission cooperate for the effective implementation of the legal frameworkthat supervises the daily operation of all energy markets. The newly establishedclearing house, EnEx Clear, is responsible for invoicing to market participants,financial settlement and risk management of all transactions. The requirementsfor being a General or a Direct Clearing Member are identical both for the Day-Ahead and the Intraday Market.
The sharp volatility of spot prices has always preoccupied producers, suppliersand electricity traders. The sudden rise of the System Marginal Price, following aprolonged downward trend since the beginning of 2020, is one example andseems to be of great concern to all market participants. These changes may bedue to a number of factors, unforeseen or predictable. Such factors are thechange in demand, the availability of units and interconnections, the prices ofnatural gas and carbon dioxide emissions, the variability of renewable sources,but also in general social and economic turmoil such as those caused by theCOVID-19 raid. Hence, participants can take advantage of the flexibilityprovided by the Derivatives Market that has started its operations since March2020.
The design of electricity markets varies in terms of market time units, auctionmechanisms, allocation of interconnection capacities and participation. Apartfrom the Day-Ahead Market and the Intraday Market participants can takeadvantage of the Continuous IDM assisting European Coupling. The clearingprice for each hour of the day is settled when the aggregate curves of demandand supply intersect. HEnEx submits buy and sell orders on behalf of theparticipants of energy financial instruments executed within the energyderivatives market and Over-The-Counter transactions. In that context, HEnExaspires to play a crucial role in the development of the national and regionaleconomy through the implementation of the Target Model. The participation ofRES aggregation in the market will decrease the reliance on support schemessince RES units with capacity greater than 400 kW will face multiple marketobligations.
Despite the outbreak of the coronavirus, the market design of a fullyoperational Natural Gas Exchange is currently under development. Following theelectricity market, natural gas trading platform will be available to participantsat a later stage. Creating a gas market within the limits of the Energy Exchangewould be a huge step for the energy sector, since it is an initiative that could bebased on the latest developments in Cyprus and Northern Greece with TAP, aswell as the other major projects being promoted.
49 | Greek Energy Market ReportHellenic Energy Exchange

Highlights
Timeline
February 2017
June 2018
MoU: LAGIE + ATHEX
November 2018
March2020
November 2019
Establishment of EnEx Clear
Establishment of HEnEx
Officialoperation
of the Target Model
OTC contracts
Aggregators
Source: HAEE’s analysis
Derivatives Market
September2020
• In line with the Third Energy Package, the transition to the new Target Model,includes the formation of a Power Exchange and Over the Counter (OTC) contracts.
• HEnEx will allow participants to submit different orders for the supply of electricity fordifferent production levels and time intervals, and keep record of all OTC contracts.
• On January 2018, HEnEx was established as the successor of LAGIE, and currently isassigned with all the responsibilities considering the operation of the energy market.
• On March 2020, HEnEx announced the launch of the Derivatives Market, aiming toreplace the gap created following the abolishment of “NOME” type auctions.
• Due to the COVID-19 outbreak, the initial planning for the implementation of theTarget Model had to been postponed to the September of 2020.
After a long delay the Hellenic Energy Exchangeis expected to launch its operations under theTarget Model on September 2020
HAEE 202050 | Greek Energy Market Report

Functional Breakdown by Entity in Spot and Derivatives Markets
Market
Market Operator
Clearing, Settlement
& Risk Management
Platforms & Technical Services
Intraday Balancing
Energy Derivatives
Market
Day Ahead
Hellenic Energy
Exchange
EnExClear
Hellenic Energy
Exchange
ADMIE
AthexGroup
ADMIE
Athex Group
AthexGroup
ADMIE
EnExClear
Source: HEnEx, HAEE’s analysis
Type of Market
Physical Physical PhysicalCash Settlement
with optional Physical Delivery
AthexClear
Hellenic Energy
Exchange
Highlights
• Spot Markets include physical delivery of electricity, while energy Derivatives marketincludes cash settlements with optional physical delivery.
• Hellenic Energy Exchange is the Market Operator for the Day Ahead Market, IntradayMarket and Energy Derivatives Market.
• EnEx Clear is responsible for clearing settlement & risk management of the DayAhead and Intraday market while Athex Clear is responsible for Derivatives Market.
• Athex Group supervises the smooth operation of the platforms as well as thetechnical services for all markets.
• ADMIE is the Market Operator for the Balancing market and is responsible for theclearing, settlement, risk management and technical assistance.
The new structure involves the cooperation ofvarious entities such as the HEnEx, the EnExClear, the Athex Clear and ADMIE
51 | Greek Energy Market ReportHellenic Energy Exchange

Interplay Among Market Participants in the Wholesale Market
Market Participant (General Clearing Member)
Settlement Bank
EnEx Clear
Target 2
Market Participant
(Direct Clearing Member)
Settlement Bank
Payment Transfers
Source: HEnEx, HAEE’s analysisHighlights
Trade Confirmation
• EnEx Clear intervenes between counterparties transactions and undertakes the roleof buyer vs each seller and vice versa for the clearing of transactions.
• The clearing house is responsible for the completion of the financial obligationsbefore the delivery process starts by the Transmission System Operator.
• It performs the financial settlement of the transactions, the collaterals managementand the clearing fund contribution management under the Target 2 system.
• Members could be either Direct Clearing Members which are common energy marketparticipants or General Clearing Members such as banks and investment firms.
• Default takes place when there is no sufficient amount, in the settlement account ofthe Clearing Member in Target 2, to match their obligations.
ADMIE
HellenicEnergy
Exchange
Risk Information
Orders
Trade Confirmation
Ord
ers
Technic
al
Info
Daily
Schedule
The EnEx Clear is responsible for invoicing tomarket participants, financial settlement andrisk management of all transactions
HAEE 202052 | Greek Energy Market Report

*act only as Direct Clearing Members
**act only as General Clearing Members
Balancing Market Participants*
local or remote
Financial** entities
local or remote
Power Producers
Power Suppliers
Energy Trading
companies
RES aggregators
RES producers
Highlights
Credit Institutions
Investment firms
• Companies need to prove organizational and financial reliability and need to haveminimum equity capital and minimum contribution to the clearing fund.
• The minimum equity capital for a General Clearing Member is 3.000.000 € and theminimum contribution to the clearing fund is 500.000 €.
• Consistently, the minimum equity capital for a Direct Clearing Member is 500.000 €and the minimum contribution to the clearing fund is 30.000 €.
• All clearing members need to have at least one Certified Energy Trader who meetsEnEx Clear professional qualification and has completed the certification program.
• Every clearing member should maintain suitable technical infrastructure and maintainclearing accounts for the well functioning of the clearing process.
Source: HEnEx, HAEE’s analysis
Entities Eligible to apply for EnExClear Membership
The requirements for being a General or aDirect Clearing Member are identical both forthe Day-Ahead and the Intraday Market
53 | Greek Energy Market ReportHellenic Energy Exchange

Sequence of the Introduced Markets at HEnEx
Energy Derivatives Market[Year until Week]
• Long-term planning• Hedging• Speculation• Yearly-quarterly-monthly-weekly
contracts
Day Ahead Market[D-1]
• Main arena for trading power• Auction D-1
Intraday Market[D-1 until D]
• Auction and/or continuous trading
• Usually accounts for 5-10% of spot transactions
Balancing Market[Real time during D]
• Balancing Capacity/ Reserve Market
• Close to real-time system operation
Source: HEnEx, HAEE’s analysis
• The Derivatives market refers to agreements between two participants for buying orselling a specific quantity of electricity at a specific price, on a specified future date.
• Currently the Derivatives market at HEnEx faces low liquidity and zero activity, sincedue to the COVID-19 crisis, spot prices are lower than expected.
• Day-Ahead market refers to transactions in each D-1 calendar day, where supplycontracts are auctioned for each market time unit of physical delivery in day D.
• Intraday is the market in which transactions to buy and sell electricity with physicaldelivery obligation are auctioned after the gate closure of the Day-Ahead market.
• The objective of balancing market is the optimal use of available resources tobalance generation and load by introducing significant technical complexity.
Highlights
Participants can take advantage of the flexibilityprovided by the Derivatives Market and Intradaysessions
HAEE 202054 | Greek Energy Market Report

Day - Ahead Intraday MarketContinuous Intraday
Market
Auctions with marginal pricing
Auctions with marginal pricing
Continuous Trading
Hourly Market Time Units Hourly Market Time UnitsHalf- Hourly Market Time
Units
Single Auction once per Delivery Day
3 Auctions per Delivery Day
Algorithm: EUPHIMIA Algorithm: EUPHIMIA Algorithm XBID
Allocation of interconnection capacities
• Explicit during isolated phased
• During coupling implicit allocation of
interconnection capacities (with
coupled bidding zones
Allocation of interconnection capacities
• 1st Phase: Explicit (LIDA-local level)
• 2nd Phase: Implicit (CRIDA –regional
level)• 3rd Phase: Implicit (IDA –European level)
Products • Hourly
• Half-hourly• User-defined Blocks
Asset-based participation Asset-based participation Asset-based participation
Mandatory Participation for Producers
Optional Participation Optional Participation
Highlights Source: HEnEx, HAEE’s analysis
Design of DAM, IDM and Continuous IDM
• The Spot Market products include energy products that are traded by MWh andcomprise of commercial contracts of electricity with physical delivery.
• Delivery takes place within the Bidding Zones, defined as the geographical areawithin which participants are able to exchange energy without capacity allocation.
• Currently, there is a single Bidding Zone in Greece as provided by the TSO, but thiswill probably be modified when Crete is going to interconnect with the mainland.
• The reference point of sell orders is the metering point at interconnection node (forimports), while for buy orders is the Transmission/ Distribution network Boundary.
• EUPHIMIA algorithm solves the market coupling problem on PCR, by maximizing thesocial welfare through efficient cross-boarder capacity allocations.
The design of electricity markets varies in termsof MTUs, auction mechanisms, allocation ofinterconnection capacities and participation
55 | Greek Energy Market ReportHellenic Energy Exchange

DAMauction
IDMauction
IDMcontinuous
Local Go-Live
IsolatedEuropean Coupling Italy
European Coupling Italy & Bulgaria
Highlights
Isolated(LIDA)
Regional Coupling Italy (CRIDA)
European Coupling (IDA)
European Coupling (XBID)
Source: HEnEx, HAEE’s analysis
• The Day-Ahead market is divided into three phases, included the isolated mode, theEuropean coupling with Italy and later on with Bulgaria.
• The Intraday market again is introduced into three different phases, first comes theIsolated Local Intraday Market, then the Regional and finally the European coupling.
• The XBID solution is based on a common IT system with one Shared Order Book(SOB), a Capacity Management Module (CMM) and a Shipping Module (SM).
• This means that orders entered by participants for Continuous Matching in onebidding zone can be matched by orders similarly submitted by market participants.
• Bids can be placed in any other bidding zone within the project’s reach as long astransmission capacity is available, both for explicit and implicit trading.
Apart from the Day-Ahead and the IntradayMarket participants can take advantage of theContinuous IDM assisting European Coupling
Implementation Phases of the Various Markets
HAEE 202056 | Greek Energy Market Report
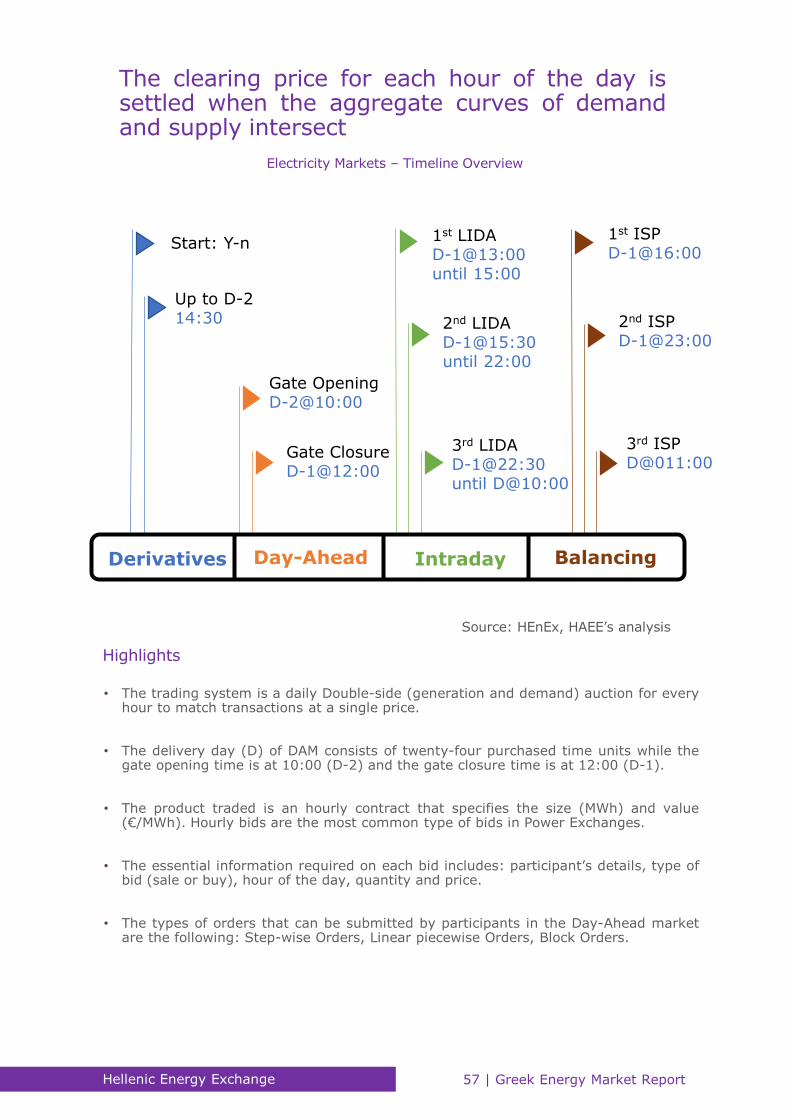
Derivatives Day-Ahead Intraday Balancing
Start: Y-n
Up to D-214:30
Gate OpeningD-2@10:00
Gate ClosureD-1@12:00
1st LIDAD-1@13:00 until 15:00
2nd LIDAD-1@15:30 until 22:00
3rd LIDAD-1@22:30 until D@10:00
Highlights
1st ISPD-1@16:00
2nd ISPD-1@23:00
3rd ISPD@011:00
• The trading system is a daily Double-side (generation and demand) auction for everyhour to match transactions at a single price.
• The delivery day (D) of DAM consists of twenty-four purchased time units while thegate opening time is at 10:00 (D-2) and the gate closure time is at 12:00 (D-1).
• The product traded is an hourly contract that specifies the size (MWh) and value(€/MWh). Hourly bids are the most common type of bids in Power Exchanges.
• The essential information required on each bid includes: participant’s details, type ofbid (sale or buy), hour of the day, quantity and price.
• The types of orders that can be submitted by participants in the Day-Ahead marketare the following: Step-wise Orders, Linear piecewise Orders, Block Orders.
Electricity Markets – Timeline Overview
Source: HEnEx, HAEE’s analysis
The clearing price for each hour of the day issettled when the aggregate curves of demandand supply intersect
57 | Greek Energy Market ReportHellenic Energy Exchange

Participant Asset
ProducerGenerating UnitPumping Unit
RES Producer / RES AggregatorLast Resort Aggregator
RES Portfolio (Dispatchable & Non-Dispatchable)
Supplier / Self-Suppling ConsumerLast Resort Supplier
Universal Services Supplier
Load Portfolio (differentiated per Voltage Level)
Traders / Suppliers / Self-Supplying Consumers
Non-coupled Interconnection
TSO
Generation Unit (under Commissioning & Testing, Mandatory
Hydro)RES Portfolio ((under Commissioning
& Testing)Transmission System Losses
RES & GO OperatorRES FiT Portfolio
Rooftop PhotovoltaicsDispatchable High Efficiency CHP Unit
HENEX Above assets for nominated quantities
Highlights
Source: HEnEx, HAEE’s analysis
• Registration in Energy Derivatives Market is required only for contracts with PhysicalDelivery and the registration is performed by the Central Counter Party.
• Considering the OTC Market, registration is required again and one of the twocounter parties registers the contract in ETSS and the other accepts or reject it.
• The TSO shall submit to the ETSS of HEnEx, the available capacity of generatingunits and RES units or Dispatchable RES units Portfolio.
• For each MTU of Day D, the Net Delivery Position for each Participant is calculated asthe sum of sales minus the sum of purchases of the Energy Financial Instruments.
• Following each successful submission of Physical Delivery Nominations and PhysicalOfftake Nominations, the ETSS recalculates for each MTU of Delivery Day D.
HEnEx submits buy and sell orders on behalf ofthe participants of energy financial instrumentsexecuted within the Derivatives Market and OTC
HAEE 202058 | Greek Energy Market Report

DER
EnEx Clear
DAM IDM BM
HEnEx TSO
ProducerSupplier
or Energy Company
ProducerSupplier
or Energy Company
Consumer
OTC
Consumer
LargeConsumer
RESAggregator
Connections Throughout the Market Structure
Source: HAEE’s analysis
Highlights
• In the upcoming energy market, generators, suppliers, traders and consumers cantrade electricity either via OTC contracts or on a power exchange.
• Due to the confidentiality of the OTC market many players may use the PowerExchange price index as a reference for their bilateral contract.
• Transactions ensure greater liquidity in the energy market, and at the same timeprovide a competitive environment for the benefit of the final consumers.
• HEnEx is expected to act as a central risk-taking and risk-management platform forall participants, enabling them to diversify their variable costs and pricing policy.
• Those radical reforms, will allow participants to enhance their expertise in energytrading and develop risk-taking and risk-management strategies.
HEnEx aspires to play a crucial role in thedevelopment of the national economy throughthe implementation of the Target Model
59 | Greek Energy Market ReportHellenic Energy Exchange
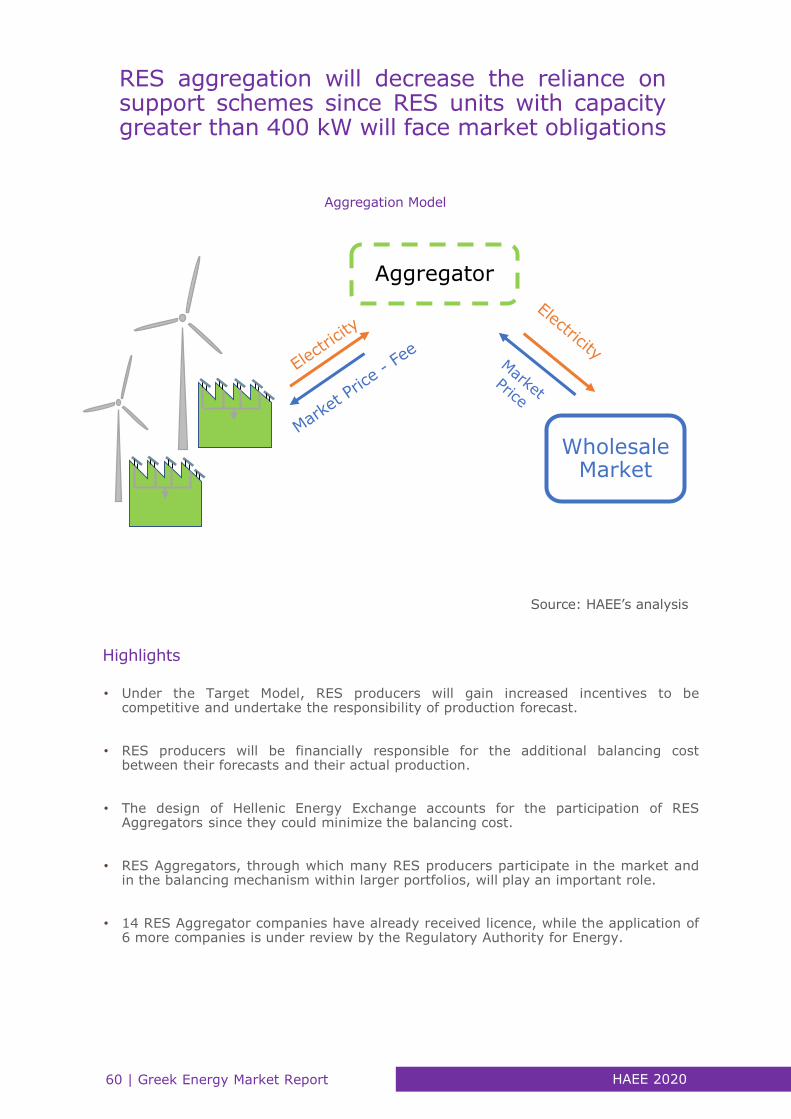
Aggregation Model
Wholesale Market
Aggregator
Source: HAEE’s analysis
• Under the Target Model, RES producers will gain increased incentives to becompetitive and undertake the responsibility of production forecast.
• RES producers will be financially responsible for the additional balancing costbetween their forecasts and their actual production.
• The design of Hellenic Energy Exchange accounts for the participation of RESAggregators since they could minimize the balancing cost.
• RES Aggregators, through which many RES producers participate in the market andin the balancing mechanism within larger portfolios, will play an important role.
• 14 RES Aggregator companies have already received licence, while the application of6 more companies is under review by the Regulatory Authority for Energy.
Highlights
RES aggregation will decrease the reliance onsupport schemes since RES units with capacitygreater than 400 kW will face market obligations
HAEE 202060 | Greek Energy Market Report

Aggregator Name MW Date of Application Status Member of HEnEx
Optimus Energy 1,250 8/10/2018 Approved ✓
Mytilineos 500 12/3/2019 Approved ✓
Renoptipower 400 10/4/2019 Approved ✓
Solar Energy 100 23/5/2019 Approved ✓
Elpedison 1,500 10/9/2019 Approved ✓
Motor Oil 300 10/9/2019 Approved ✓
Inaccess 600 10/9/2019 Approved ✓
Eunice 300 20/9/2019 Approved ✓
Vatt & Volt 350 18/11/2019 Pending -
Sentrade 200 18/11/2019 Approved -
Solaris Energy 100 13/12/2019 Pending -
NC Energy 250 13/12/2019 Pending -
HELPE Renewables 300 13/12/2019 Approved -
NRG Trading House 200 27/1/2010 Approved ✓
Forena Energy 200 29/1/2020 Approved ✓
Arinomario Limited 200 5/2/2020 Approved -
PPC R 1,000 12/3/2020 Pending -
Vootis 200 12/3/2020 Pending -
RES Aggregators in the Greek Electricity Market
There are 18 Aggregators in the market, 12 ofthem with trading licence and 10 alreadyparticipating at the Hellenic Energy Exchange
61 | Greek Energy Market ReportHellenic Energy Exchange
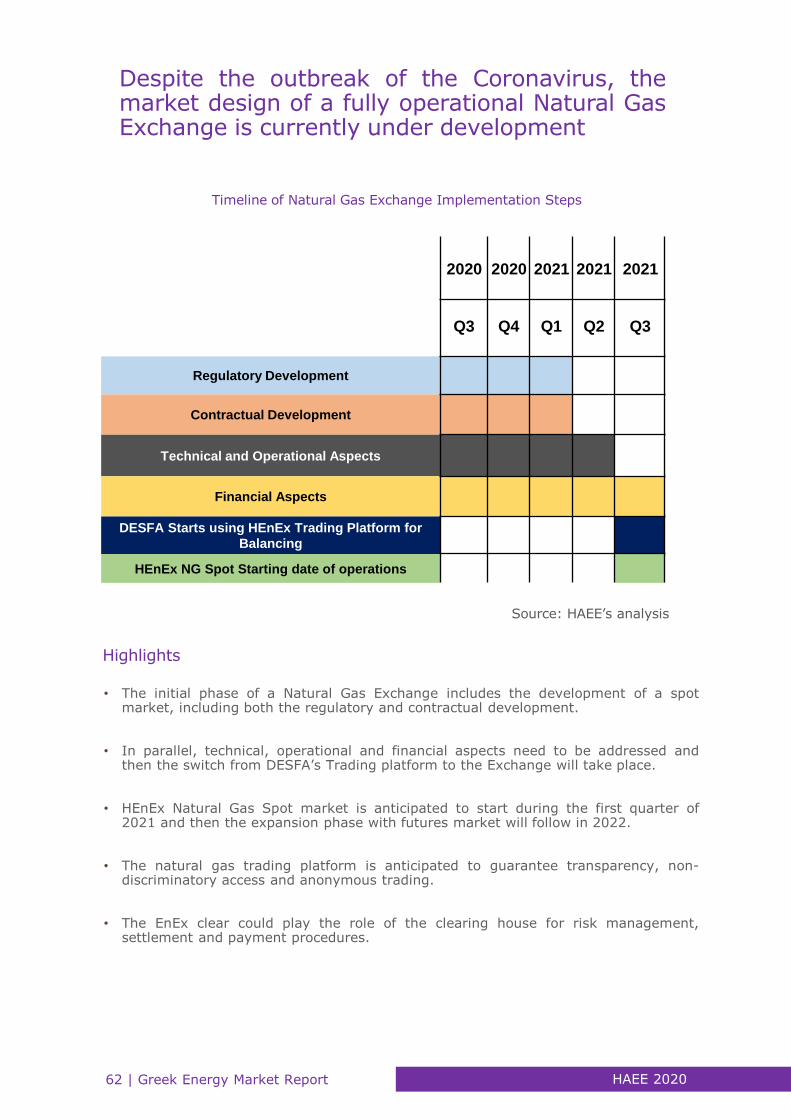
2020 2020 2021 2021 2021
Q3 Q4 Q1 Q2 Q3
Regulatory Development
Contractual Development
Technical and Operational Aspects
Financial Aspects
DESFA Starts using HEnEx Trading Platform for
Balancing
HEnEx NG Spot Starting date of operations
Highlights
Source: HAEE’s analysis
Timeline of Natural Gas Exchange Implementation Steps
• The initial phase of a Natural Gas Exchange includes the development of a spotmarket, including both the regulatory and contractual development.
• In parallel, technical, operational and financial aspects need to be addressed andthen the switch from DESFA’s Trading platform to the Exchange will take place.
• HEnEx Natural Gas Spot market is anticipated to start during the first quarter of2021 and then the expansion phase with futures market will follow in 2022.
• The natural gas trading platform is anticipated to guarantee transparency, non-discriminatory access and anonymous trading.
• The EnEx clear could play the role of the clearing house for risk management,settlement and payment procedures.
Despite the outbreak of the Coronavirus, themarket design of a fully operational Natural GasExchange is currently under development
HAEE 202062 | Greek Energy Market Report

Source: HAEE’s analysis
Information exchange protocol• Trade notifications• Qualified market participants
HellenicEnergy
Exchange
Trading results
Operating limits ofparticipants (margins)Qualified
participants
EnEx Clear
DESFA
Market Participants
ARISACER REMIT
Information System
Data providers(future stage)
Publicly availableReference prices for imbalance
Market Results: Volumes and Prices
GuaranteesPayment obligations
OrdersOrder book visualizationTrading results
Information Exchange System of Natural Gas Trading Platform
Highlights
• HEnEx will proceed with the establishment of a Natural Gas exchange to cover theneeds of the domestic and regional wholesale market.
• This involves the operation of a Natural Gas Trading Platform, where anonymoustransactions between gas market participants will take place.
• The basic characteristics of this platform is to provide easy access to users,possibility of cross-border transactions, liquidity and transparency in transactions.
• It will act as a supply source assisting diversity and connectivity, while transparencyon data and regulatory processes would directly reduce risk for market participants.
• The establishment of a Greek Gas Hub will facilitate the wholesale trading of NaturalGas between participants and enable competitive markets to function in SE Europe.
Following the Electricity market, Natural GasTrading Platform will be available to participantsat a later stage
63 | Greek Energy Market ReportHellenic Energy Exchange

Regulatory Framework
EuropeanFinancial
Legislation
SupervisoryAuthorities
European Energy
Legislation
3rd Energy Package
Directions ERGEG
REMITRegulation 1348/2014
Recordοf Transactions
and Data
ESMA
ACER RAE
HCMC
Participant at HEnEx
MADMarket Abuse
Inside Information
MIFID/ MIDIF IITransparency of
transactions
CAD/CRDCapital
adequacy
EMIROTC Market
Source: HAEE’s analysis
• A set of Directions and Regulations imposed by the European Union, ensuresconfidence in the integrity of Hellenic Energy Exchange.
• Effective oversight of wholesale energy markets requires the regular monitoring ofdetails of contracts including orders, capacity, assets, consumption and transmission.
• HEnEx complies with various European licenses, such as the REMIT, the EMIR, theMIFID II, the MAR and CAD/CRD.
• EU countries are obliged to ensure the monitoring of security of supply and to definetechnical safety criteria to ensure the integration of their markets at a regional level.
• In addition, the national regulatory authorities are to cooperate with the ACER toguarantee the compatibility of regulatory frameworks between regions.
Highlights
RAE and the HCMC cooperate for the effectiveimplementation of the legal framework thatsupervises the operation of all energy markets
HAEE 202064 | Greek Energy Market Report

4. Electricity
65 | Greek Energy Market ReportHAEE 2020
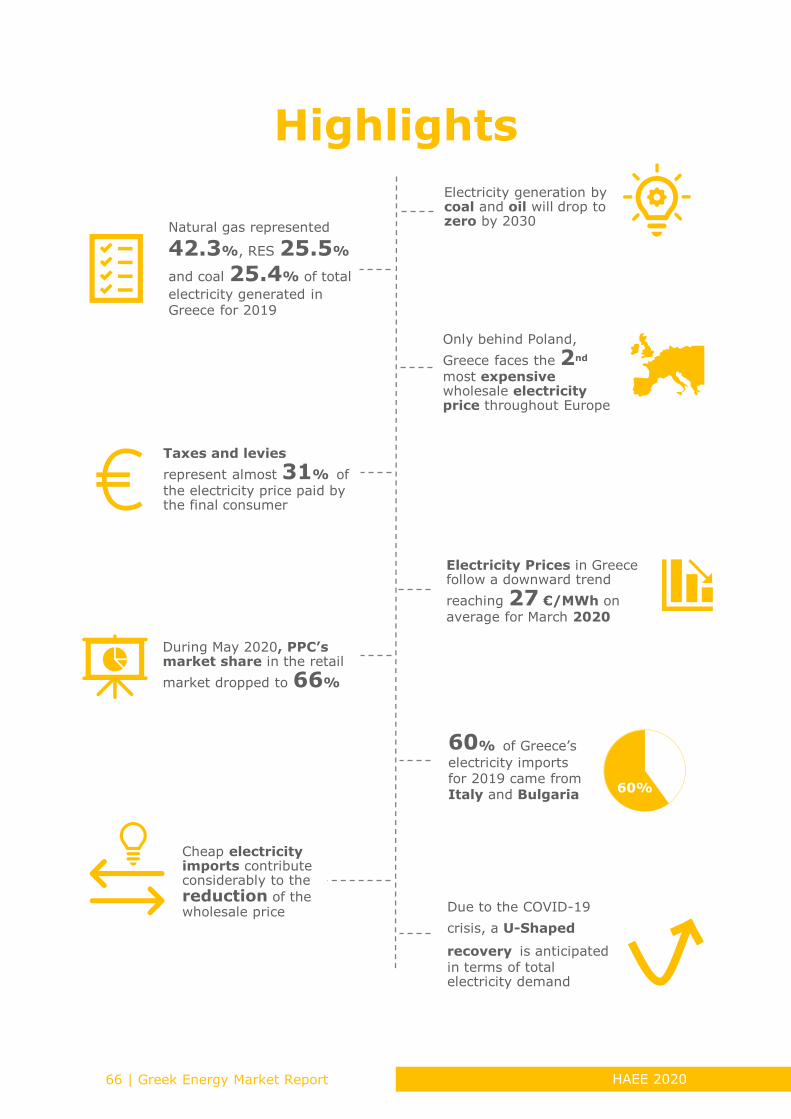
Highlights
Electricity Prices in Greece follow a downward trend
reaching 27 €/MWh on
average for March 2020
60% of Greece’s
electricity imports for 2019 came from Italy and Bulgaria
Only behind Poland,
Greece faces the 2nd
most expensive wholesale electricity price throughout Europe
Electricity generation by coal and oil will drop to zero by 2030
Taxes and levies
represent almost 31% of
the electricity price paid by the final consumer
Natural gas represented
42.3%, RES 25.5%
and coal 25.4% of total
electricity generated in Greece for 2019
Due to the COVID-19
crisis, a U-Shaped
recovery is anticipated
in terms of total electricity demand
During May 2020, PPC’s market share in the retail
market dropped to 66%
Cheap electricity imports contribute considerably to the
reduction of the wholesale price
60%
66 | Greek Energy Market Report HAEE 2020

Overview
Greece’s legislative framework on the electricity market is strongly governed by
law and regulation that is in line with European Directions and guidelines.
Focusing on sustainability and achieving a Fair Energy Transition during the
next decade are the foremost goals of national authorities. Aiming to achieve
environmental targets Europe needs to rapidly decarbonize its power sector, a
trend that is apparent all over the continent. At the same time, CO2 emission
allowances directly affect electricity prices and contribute to emissions reduction
through Europe.
Greece faces the 2nd most expensive wholesale electricity price throughout
Europe only behind Poland which is also a coal-based market. During 2018
electricity prices increased, however a downward trend was apparent
throughout 2019, mainly due to the cheap imports of natural gas.
During the COVID-19 outbreak, wholesale electricity price dropped at historical
levels reaching 18 €/MWh throughout the first week of April 2020 when strict
mobility restrictions were imposed. Another impact of the pandemic is that
electricity consumption in Greece declined in the short-term and is expected to
rebound after 2022. An average drop of 20% in electricity load during the 2nd
week of April 2020 reveals the negative externalities expected in the Greek
economy, as well. The collapse in electricity load is apparent during the
lockdown period, plunged by 32.4% and 35.5% compared to 2018 and 2019,
respectively. In the short-term, COVID-19 crisis is anticipated to significantly
hamper the annual demand for electricity.
Gross electricity generation for 2018 dropped to 51GWh while electricity imports
increased from 11.8% to 23.4% in 2019. Greece is well connected with
neighboring countries and active in electricity trading mainly with Italy and
Bulgaria. Cheap electricity imports during March, April and November of 2019
contributed considerably to the reduction of the System Marginal Price.
Furthermore, as part of the economic adjustment programme, Public Power
Cooperation (PPC) share in the retail market has to fall below the benchmark of
50%. For 2019, the incumbent PPC, retained a dominant share in electricity
generation (43.2%), while RES and Hydro represented bigger capacity
compared to Coal and Natural Gas combined.
Finally, European Union countries provide plethora of both financial and non-
financial incentives towards Eco-mobility. The Greek government announced in
June 2020 a package of incentives supporting the promotion of electric cars.
These incentives and the necessary infrastructure are anticipated to support the
penetration of electric vehicles in Greece at this initial stage of development.
67 | Greek Energy Market ReportElectricity

Electricity Market Legislative Framework
1999 2005
L. 2773/1999
2011 20182016
L. 4389/2016L. 4414/2016L. 4425/2016
System & Market CodeL.3446/2005
L. 4533/2018L.4512/2018
2019
NOME Auctions
Mandatory Pool / Day Ahead Scheduling Target Model
L. 4001/2011
Highlights
Source: HAEE’s analysis
2020
L. 4643/2019
• NOME-type auctions officially abolished in November 2019 and currently theoperated Derivatives Market is anticipated to provide source of diversification.
• Besides, the current legislative framework, law 4643/2019 introduces all thenecessary regulations to support energy production from Renewable Energy Sources.
• The same law includes regulations regarding the organization and supervision ofEnergy Markets, including regulations for the organization and operation of PPC.
• In order to cover the gap that is going to be created by the phase-out of the thermalgeneration units, legislation should support the gas-fired generation units.
• Finally, the new energy laws 4643/2019 and 4685/2020 introduce new regulationson energy efficiency and the promotion of electrification in transportations.
Greece’s legislative framework on the electricitymarket is strongly governed by regulations thatare in line with EU Directions and guidelines
68 | Greek Energy Market Report HAEE 2020
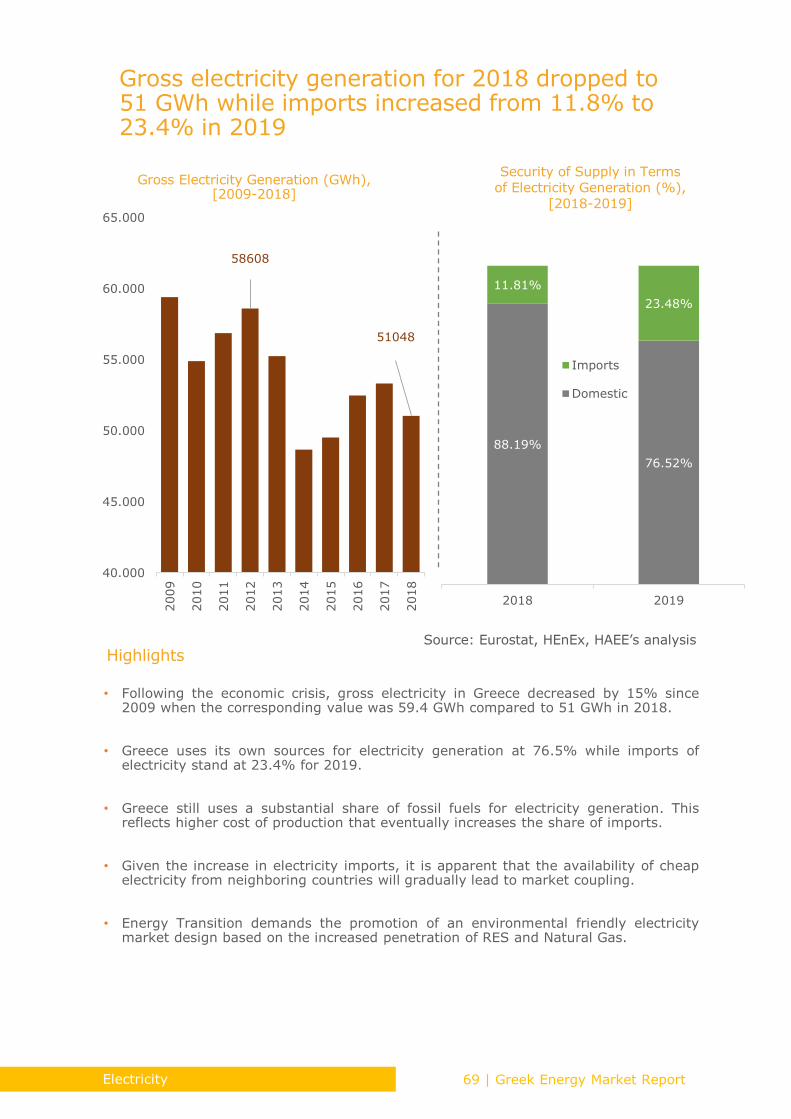
Gross Electricity Generation (GWh), [2009-2018]
Security of Supply in Terms of Electricity Generation (%),
[2018-2019]
58608
51048
40.000
45.000
50.000
55.000
60.000
65.000
2009
2010
2011
2012
2013
2014
2015
2016
2017
2018
88.19%
76.52%
11.81%
23.48%
2018 2019
Imports
Domestic
HighlightsSource: Eurostat, HEnEx, HAEE’s analysis
• Following the economic crisis, gross electricity in Greece decreased by 15% since2009 when the corresponding value was 59.4 GWh compared to 51 GWh in 2018.
• Greece uses its own sources for electricity generation at 76.5% while imports ofelectricity stand at 23.4% for 2019.
• Greece still uses a substantial share of fossil fuels for electricity generation. Thisreflects higher cost of production that eventually increases the share of imports.
• Given the increase in electricity imports, it is apparent that the availability of cheapelectricity from neighboring countries will gradually lead to market coupling.
• Energy Transition demands the promotion of an environmental friendly electricitymarket design based on the increased penetration of RES and Natural Gas.
Gross electricity generation for 2018 dropped to 51 GWh while imports increased from 11.8% to 23.4% in 2019
69 | Greek Energy Market ReportElectricity

Gross Electricity Generation by Fuel (%), [1990 – 2018]
Gross Electricity Generation by Fuel (%),
[2018-2019]
0%
10%
20%
30%
40%
50%
60%
70%
80%
90%
100%
1990
1992
1994
1996
1998
2000
2002
2004
2006
2008
2010
2012
2014
2016
2018
Coal Oil Natural Gas Renewables
Highlights Source: IEA, HEnEx, HAEE’s analysis
• Fossil fuels have played an important role in Greek power generation, and accountedfor more than 70% of the total electricity generated in the early 1990s.
• Based on historical data, the dominance of fossil fuels has significantly decreasedcompared to 1990 levels, while RES increased to 25% over the same period.
• By 2028, the share of coal in Electricity generation is projected to gradually reachzero, while Natural Gas and RES will cover the additional needs in terms of demand.
• For 2019, Natural Gas represented 42.33% of Electricity generation, RES 25.58%,Coal 25.43% and the remaining 6.65% is attributed to Hydroelectric stations.
• Compared to the values of 2018, we observe a major increase in terms of NaturalGas and RES use, while Hydro and coal lost substantial share out of total generation.
33.90%25.43%
33.96%42.33%
21.54%25.58%
10.60%6.65%
2018 2019Coal Natural Gas
RES Hydro
Focusing on sustainability and achieving a FairEnergy Transition during the next decade are thetwo foremost goals of national authorities
70 | Greek Energy Market Report HAEE 2020
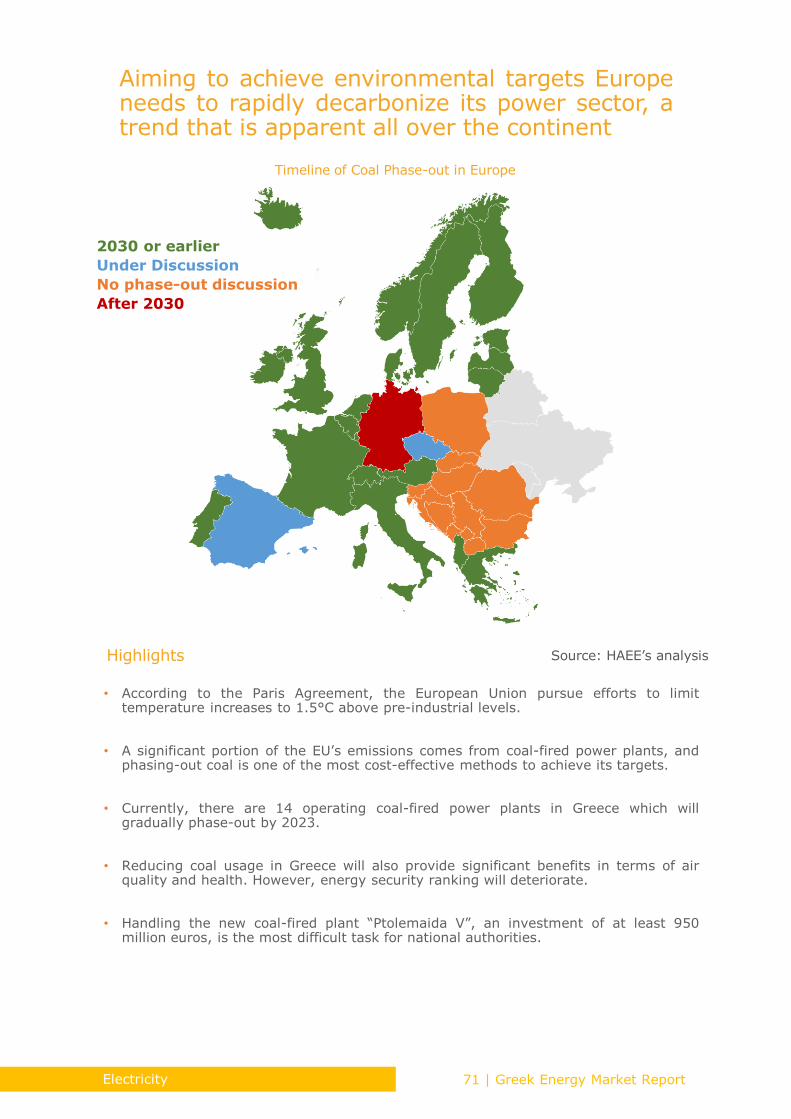
2030 or earlier
Under Discussion
No phase-out discussion
After 2030
Highlights Source: HAEE’s analysis
• According to the Paris Agreement, the European Union pursue efforts to limittemperature increases to 1.5°C above pre-industrial levels.
• A significant portion of the EU’s emissions comes from coal-fired power plants, andphasing-out coal is one of the most cost-effective methods to achieve its targets.
• Currently, there are 14 operating coal-fired power plants in Greece which willgradually phase-out by 2023.
• Reducing coal usage in Greece will also provide significant benefits in terms of airquality and health. However, energy security ranking will deteriorate.
• Handling the new coal-fired plant “Ptolemaida V”, an investment of at least 950million euros, is the most difficult task for national authorities.
Timeline of Coal Phase-out in Europe
Aiming to achieve environmental targets Europeneeds to rapidly decarbonize its power sector, atrend that is apparent all over the continent
71 | Greek Energy Market ReportElectricity

Percentage of Total Quarterly Generation per Participant and Fuel Type (%), [2019]
6.4
1%
3.6
2% 5.2
7% 7
.95
%
18
.02
%
4.9
9%
2.8
6%
21
.50
%
5.5
6%
23
.82
%
4.3
6%
4.8
0%
5.8
0% 7.7
5%
16
.61
%
8.1
6%
3.2
1%
15
.87
%
6.8
4%
26
.60
%
7.5
5%
4.3
8%
5.3
8% 7
.97
%
21
.00
%
5.6
0%
2.6
5%
11
.45
%
8.3
6%
25
.65
%
10
.29
%
3.5
6%
6.7
1% 8.7
7%
12
.39
%
5.0
4%
1.9
9%
18
.87
%
5.6
9%
25
.79
%
Elp
edis
on
Hero
n
Kori
nth
os P
ow
er
Mytilineos
PPC
Lig
_M
eg
Lig
_M
el
PPC
PPC
DAPPEP
Natural Gas Coal Hyrdo RES
Qtr1 Qtr2 Qtr3 Qtr4
Highlights Source: HEnEx, HAEE’s analysis
• The electricity generation mix of Greece shows some differences compared to the EUaverage with the dominance of Natural Gas, Coal and RES.
• The liberalization process delivered private investment in gas-fired generation. In2013 generation from private gas-fired units accounted for 18% of total generation.
• In 2019 gas-fired plants of PPC (12.3%), Elpedison (10.2%), Mytillineos (8.7%),Korinthos Power (6.7%) and Heron (3.5%) contributed to total generation.
• Interestingly, RES preserve their share of 25% on average throughout the fourquarters of the year, while Coal is mainly used during the winter months.
• Aiming to comply with environmental policies, the expected reduction in the share oflignite production, raises concerns about adequacy of supply during winter months.
For 2019, the incumbent Public PowerCooperation (PPC), retained a dominant share inelectricity generation (43.28%)
72 | Greek Energy Market Report HAEE 2020

Total Electricity Consumption in Greece (TWh), [1990-2018]
32.85
64.31
59.00
0
10
20
30
40
50
60
70
1990
1991
1992
1993
1994
1995
1996
1997
1998
1999
2000
2001
2002
2003
2004
2005
2006
2007
2008
2009
2010
2011
2012
2013
2014
2015
2016
2017
2018
Highlights Source: IEA, HAEE’s analysis
• Electricity consumption can be affected by various factors, such as, the various typesof activities, weather conditions and the overall macroeconomic framework.
• Greece’s electricity consumption was increasing steadily until it reached a peak of64.3 TWh in 2008, while, in the aftermath of the economic crisis, a decline followed.
• According to the most recent data, electricity consumption seems to recover at levelsprior to the COVID-19 crisis following a long period under restrictions in mobility.
• Current electricity consumption in Greece is estimated to be around 5500 kWh perperson annually, while in 1990 the corresponding size was about 3000 kWh.
• The discrepancy between the amount of electricity generated/imported and theamount consumed/exported is considered as a loss in transmission and distribution.
Another impact of the pandemic is that theelectricity consumption in Greece will decline inthe short-term and rebound after 2022
73 | Greek Energy Market ReportElectricity

Total Electricity Capacity per Fuel (MW), [2019]
Total: 18,330 MW
34,67 %
8,596
810
767
511433422
289147
0%
10%
20%
30%
40%
50%
60%
70%
80%
90%
100%
Heron
Lig_Melitis
Herron II Viotias
Korinthos Power
Lig_Megalopolis
Mytilineos
Elpedison
PPC
Electricity Capacity of Conventional Units, Hydro Included, per Producer (MW), [2019]
11,975 MW(65.3% of total)
2019
6355
3904
4900
3171
RES Coal Natural
Gas
Hydro
21,30 % 26,73 % 17,30 %
Highlights Source: IEA, HAEE’s analysis
• Total electricity capacity for 2019 in Greece was 17,444 MW, out of which 34.6% isattributed to RES, 26.7% to Natural Gas, 21.3% to Coal and 17.3% to Hydro.
• It is apparent that conventional power plants are still crucial for the balance of thesystem since their capacity stands at 65.3% of total electricity capacity in Greece.
• Coal used to be a significant domestic fossil fuel in Greece, however current policieslead to its gradual replacement mainly by RES and Natural Gas.
• Yet, PPC’s huge investment of a new lignite unit with a total capacity of 660MW isanticipated to be ready for use until the end of 2022.
• Greece has a large potential to grow the shares of clean power once its non-interconnected islands (NIIs) become integrated into the mainland electricity system.
For 2019, RES and Hydro represent biggercapacity compared to Coal and Natural Gascombined
74 | Greek Energy Market Report HAEE 2020

Highlights
• During the forth quarter of 2019, the average wholesale baseload electricity priceamong countries in Europe was 44.2 € per MWh.
• The lowest price recorded in Germany (36.7 €/MWh), while the most expensivewholesale electricity price recorded in Greece 59.6 €/MWh and Poland 49.1 €/MWh.
• Apart from the increased electricity prices, another common characteristic betweenGreece and Poland is the fact that both countries are still highly dependent on coal.
• Market coupling is intended to link market areas in order to harmonize differentsystems of electricity exchanges and, in particular, to reduce price differences.
• Market coupling systems exist both in Day-ahead trading and in Intraday markets,and this interconnection among markets ensures efficient electricity trading.
Source: European Commission, HAEE’s analysis
Wholesale Baseload Electricity Prices (€/ΜWh) , [Q4 2019]
59,6
48,1
Country €/MWh
Belgium 39.3
Luxembourg 36.7
Portugal 41.0
Ireland 46.2
Croatia 46.9
Slovenia 46.2
Netherlands 39.4
Denmark 38.7
Switzerland 42.3
Slovakia 41.0
Estonia 44.1
Latvia 43.9
Malta 55.6
Greece faces the 2nd most expensive wholesaleelectricity price throughout Europe only behindPoland which is also a coal-based market
75 | Greek Energy Market ReportElectricity

Daily System Marginal Price (€/ΜWh), [2008-2019]
0
20
40
60
80
100
120
1/1
/2008
1/1
/2009
1/1
/2010
1/1
/2011
1/1
/2012
1/1
/2013
1/1
/2014
1/1
/2015
1/1
/2016
1/1
/2017
1/1
/2018
1/1
/2019
Highlights Source: HEnEx, HAEE’s analysis
• Wholesale prices are highly sensitive to available production and transmissioncapabilities, mainly due to lack of storage and the need for instant consumption.
• Over the last decade, wholesale prices in Greece fluctuate around 40 to 60 €/MWh,however in 2018 prices followed un upward trend reaching the level of 80 €/MWh.
• At the end of 2019, prices fluctuated around 60 €/MWh which is considerably higherthan the EU average wholesale electricity price for the same period (43.3 €/MWh).
• The maximum price ever recorder over the period 2008 – 2019 was in February 2012(118 euros per MWh), while the minimum, in February 2013 at 10 euros per MWh.
• This increased sensitivity of price fluctuations is anticipated to surge even more asthe penetration of RES increases, heavily affecting the profitability of participants.
Following 2018 when electricity prices increased,a downward trend was apparent throughout2019 mainly due to the cheap imports of gas
76 | Greek Energy Market Report HAEE 2020
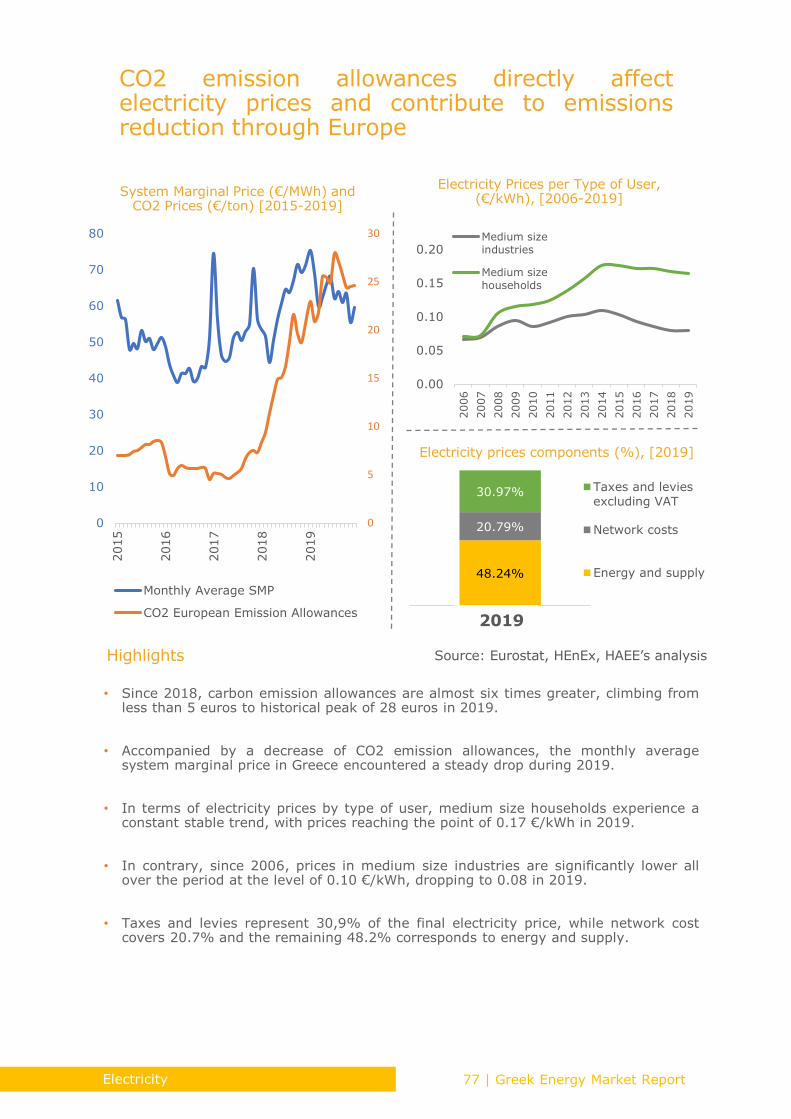
System Marginal Price (€/MWh) and CO2 Prices (€/ton) [2015-2019]
Electricity Prices per Type of User, (€/kWh), [2006-2019]
Electricity prices components (%), [2019]
0.00
0.05
0.10
0.15
0.20
2006
2007
2008
2009
2010
2011
2012
2013
2014
2015
2016
2017
2018
2019
Medium sizeindustries
Medium sizehouseholds
48.24%
20.79%
30.97%
1
Taxes and levies
excluding VAT
Network costs
Energy and supply
2019
0
5
10
15
20
25
30
0
10
20
30
40
50
60
70
80
2015
2016
2017
2018
2019
Monthly Average SMP
CO2 European Emission Allowances
Highlights Source: Eurostat, HEnEx, HAEE’s analysis
• Since 2018, carbon emission allowances are almost six times greater, climbing fromless than 5 euros to historical peak of 28 euros in 2019.
• Accompanied by a decrease of CO2 emission allowances, the monthly averagesystem marginal price in Greece encountered a steady drop during 2019.
• In terms of electricity prices by type of user, medium size households experience aconstant stable trend, with prices reaching the point of 0.17 €/kWh in 2019.
• In contrary, since 2006, prices in medium size industries are significantly lower allover the period at the level of 0.10 €/kWh, dropping to 0.08 in 2019.
• Taxes and levies represent 30,9% of the final electricity price, while network costcovers 20.7% and the remaining 48.2% corresponds to energy and supply.
CO2 emission allowances directly affectelectricity prices and contribute to emissionsreduction through Europe
77 | Greek Energy Market ReportElectricity

Seasonal Daily System Marginal Price (€/MWh), [2017 – 2018 - 2019]
Winter Spring Summer Autumn0
20
40
60
80
100
120
January
Febru
ary
Marc
h
Apri
l
May
June
July
August
Septe
mber
Octo
ber
Novem
ber
Decem
ber
2017 2018 2019
HighlightsSource: HEnEx, HAEE’s analysis
• Aiming to identify the effect of seasonality on prices, the daily system marginal priceis plotted over the past three years, with no clear evidence supporting seasonality.
• 2017 was a year of great discrepancies since both during winter and autumn months,the daily SMP escalated above 100 euros per MWh.
• In the first semester of 2018, prices were lower on average compared to 2017 and2019 but gradually increased following an upward trend until the end of the year.
• Wholesale electricity price for 2019 in Greece follows a slight downward trend andfluctuatee among 85 to 43 euros per MWh, without any spike recorded over the year.
• Based on recent data, the comparison among other EU countries continue to showthat wholesale electricity prices in Greece are still the highest recorded in the Union.
Despite the fact that electricity prices are high, aclear downward trend is apparent for 2019 inGreece
78 | Greek Energy Market Report HAEE 2020

Highlights
Daily Electricity Price in Greece (€/ΜWh)
0
10
20
30
40
50
60
70
80
90
January
Febru
ary
Marc
h
Apri
l
2018 2019 2020
Source: HEnEx, HAEE’s analysis
• In terms of daily electricity prices in Greece the graph depicts the first four months of2020 compared to the respective months of 2018 and 2019.
• The reduction in electricity prices is significant all over the period, but especiallyduring April when the restrictions were more severe, prices dropped to 27.5 €/ΜWh.
• This is a historical low for an average monthly price for Greece, since the normalfluctuation of electricity prices was around 40 to 60 €/ΜWh over the previous years.
• In that context, a historical minimum of 18.7€/MWh was recorded during the firstweek of April 2020.
• This drop is interpreted as a 70% decrease compared to the price of 64€/MWh thatwas recorded for the same day one year earlier in 2019.
Wholesale electricity price dropped at historicallevels at 18 €/MWh during the first week of April2020 when strict restrictions were imposed
79 | Greek Energy Market ReportElectricity

Retail Market Share (%), [January 2020]
PPC’s retail market share (%), [2016-2019]
Companies with Retail Market Share > 2% (%), [2019]
94.39%
71.75%
65%
70%
75%
80%
85%
90%
95%
2016
2017
2018
2019
71%
29% PPC
Others
5.25%
5.51%
4.35%
2.51%
2.18%
1.87%
0%
5%
10%
15%
20%
25%
1 2 3 4 5 6 7 8 9 10 11 12
Heron Mytilineos
Elpedison Watt and Volt
NRG Voltera
Highlights Source: HEnEx, HAEE’s analysis
• Market share in January 2020 was still dominated by PPC at 71%, while theremaining 29% is distributed among the rest 25 active companies.
• The majority of this share is attributed to 6 companies that try to strengthen theirposition in the retail market, since they represent 21.6% of retail market share.
• In December 2019 we observe the following shares: Mytilineos 5.51%, Heron 5.25%,Elpedison 4.35%, Watt and Volt 2.51%, NRG 2.18% and Voltera 1.87%.
• The introduction of NOME-type auctions were supposed to serve as the tool to reducePPC’s significant market share, however, NOME auctions repealed at the end of 2019.
• The Derivatives Market that officially started to operate in March 2020 aims toreplace the gap that was created after the abolishment of NOME-type auctions.
As part of the economic adjustment programme,PPC’s share in the retail market has to fall belowthe benchmark of 50%
80 | Greek Energy Market Report HAEE 2020

Monthly Percentage (% - Left Axis) by Source of Generation that Determined the SMP (€/MWh – Right Axis), [2019]
0
10
20
30
40
50
60
70
80
0%
10%
20%
30%
40%
50%
60%
70%
80%
90%
100%
Jan Feb Mar Apr May Jun Jul Aug Sep Oct Nov Dec
Coal Natual Gas Hydro Imports Exports Average Monlty SMP
Highlights Source: HEnEx, HAEE’s analysis
• Throughout 2019 the average System Marginal Price is 63.8 €/MWh, while for Spring62.7 €/MWh, Summer 64.7 €/MWh, Autumn 59.8 €/MWh and Winter 68 €/MWh.
• During March and November 2019, increased percentage of cheap electricityimported from neighboring countries (20%), led to a drop of SPM below 60 €/MWh.
• However, during January and June 2019, the share of imports was reduced to lowerthan 5% and prices fluctuated around 70 €/MWh.
• Natural Gas is the fuel that mostly determines the System Marginal Price such asduring June 2019 when it contributed to almost 80% in the system.
• For 2019, the average contribution of Coal towards the formation of the SystemMarginal Price was 20% while Hydro stations mainly used during January 2019.
Cheap electricity imports during March, April andNovember of 2019 contributed considerably tothe reduction of the System Marginal Price
81 | Greek Energy Market ReportElectricity
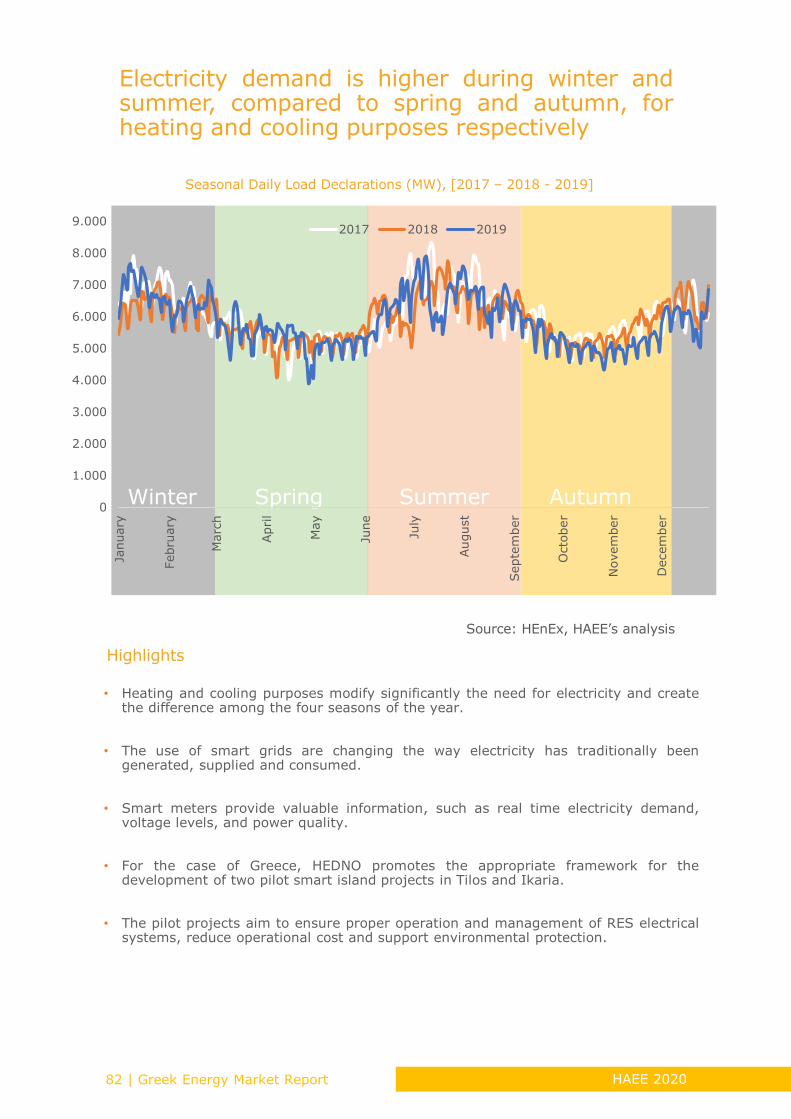
Seasonal Daily Load Declarations (MW), [2017 – 2018 - 2019]
Winter Spring Summer Autumn0
1.000
2.000
3.000
4.000
5.000
6.000
7.000
8.000
9.000
January
Febru
ary
Marc
h
Apri
l
May
June
July
August
Septe
mber
Octo
ber
Novem
ber
Decem
ber
2017 2018 2019
Highlights
Source: HEnEx, HAEE’s analysis
• Heating and cooling purposes modify significantly the need for electricity and createthe difference among the four seasons of the year.
• The use of smart grids are changing the way electricity has traditionally beengenerated, supplied and consumed.
• Smart meters provide valuable information, such as real time electricity demand,voltage levels, and power quality.
• For the case of Greece, HEDNO promotes the appropriate framework for thedevelopment of two pilot smart island projects in Tilos and Ikaria.
• The pilot projects aim to ensure proper operation and management of RES electricalsystems, reduce operational cost and support environmental protection.
Electricity demand is higher during winter andsummer, compared to spring and autumn, forheating and cooling purposes respectively
82 | Greek Energy Market Report HAEE 2020

Total Hourly Electricity Load in Greece (MWh)
0
1.000
2.000
3.000
4.000
5.000
6.000
7.000
8.000
8/4
/2020
9/4
/2020
10/4
/2020
11/4
/2020
12/4
/2020
13/4
/2020
14/4
/2020
2018 2019 2020
HighlightsSource: HEnEx, HAEE’s analysis
• The graph focuses on the total hourly electricity load during the second week of Aprilcompared to the same series during 2019 and 2018.
• Due to the effects of the pandemic, demand decreased by 13% and the lignite powergeneration in April 2020 recorded a drastic fall of 88% compared to 2019 levels.
• On the other hand, the Renewable Energy Sources recorded a large increase of+50%, the Hydroelectric power plants of +32%, the Gas Units of +16%.
• Given the absence of lignite units, the system faced a major downturn in demandduring the COVID-19 outbreak and responded without any issues of stability.
• This framework underlined by the increased penetration of RES and Natural Gas usein Electricity generation has been characterized as a “Window to the Future”.
An average drop of 20% in electricity load duringthe 2nd week of April 2020 reveals the negativeexternalities expected in the Greek economy
83 | Greek Energy Market ReportElectricity

Forecast of Total Annual Demand for Electricity (GWh), [2006-2028]
Highlights Source: ADMIE, HAEE’s analysis
45.000
50.000
55.000
60.000
65.000
70.000
2006
2007
2008
2009
2010
2011
2012
2013
2014
2015
2016
2017
2018
2019
2020
2021
2022
2023
2024
2025
2026
2027
2028
Historical Data Low demand Scenario
Reference scenario High demand scenario
• According to HAEE’s projections, demand for electricity during the upcoming yearswill increase in different scenarios, but with a 2 year delay due to Covid-19 crisis.
• In all three scenarios electricity demand will face a U-shape trend that depending onthe duration of lock-down measures will decrease aggregate demand.
• The sharp rise that will follow in 2022, is mainly attributed to the general recovery ofthe Greek economy that is anticipated to boost electricity consumption.
• Compared to the 56.310 GWh which were generated in 2008, the low demandscenario projects that in 2023 electricity demand in Greece will stand at 56.750GWh
• Upcoming years require rapid changes of market structure within a relatively shorttime frame, since authorities need to re-organize the wholesale electricity market.
COVID-19 crisis is anticipated to significantlyhamper the annual demand for electricity, andthis is apparent in all three scenarios
84 | Greek Energy Market Report HAEE 2020

Imports and Exports with Neighboring Countries (%), [2019]
ExportsImports
14%
29%
31%
21%
5%
Albania Bulgaria Italy North Macedonia Turkey
23%
13%
34%
29%
1%
Highlights Source: HEnEx, HAEE’s analysis
• Greece imported 31% of its electricity needs from Italy, 29% from Bulgaria, 21%from North Macedonia, 14% from Albania and 5% from Turkey.
• In terms of electricity exports, 34% is directed towards Italy, 29 towards NorthMacedonia, 23% towards Albania, 13% towards Bulgaria and 1% towards Turkey.
• The fluctuations in the volume of electricity imports, can be explained by a number offactors such as the excess of electricity supply in some countries.
• Electricity imports are being carried out mainly for competitive reasons since theprice is lower than the generation cost of domestic plants.
• However, electricity imports in Greece are expected to decrease significantly in thenext years due to the constantly increasing penetration of RES in the system.
Greece is well connected to neighboringcountries and active in electricity trading mainlywith Italy and Bulgaria
85 | Greek Energy Market ReportElectricity

Alternative Fuel Vehicle Registrations in Europe [2008-2018]
2017 2018 Growth
Electric cars (BEV) 50 87 (+74%)
Plug-in Hybrid (PHEV) 141 228 (+61,7%)
Hybrid (HEV) 2.356 3.635 (+54,3%)
Alternative fuel vehicle (NG) 359 1.030 (+186,9%)
Gasoline 46.068 61.320 (+33,1%)
Diesel 39.014 36.885 (-5,50%)
Total 87.988 103.185 (+17,3%)
Car Sales in Greece [2017-2018]
-
100.000
200.000
300.000
400.000
500.000
600.000
700.000
800.000
900.000
1.000.000
2008
2009
2010
2011
2012
2013
2014
2015
2016
2017
2018
2019
BEV CNG FCEV
LPG PHEV
Highlights Source: Alternative Fuel Observatory, HAEE’s analysis
• The advantage of zero emissions of electric vehicles transforms them to an excellentchoice for transportation in large and crowded urban centers.
• The gain from the transition to electric mobility can be extremely large, taking intoaccount the additional benefit of the significant reduction in noise pollution.
• Despite the fact that sales of electric cars is slowly increasing, by the end of 2019,there were only 140 charging stations for electric cars throughout the country.
• The National Plan for Climate and Energy provides incentives such as subsidizing thepurchase price and tax exemptions to reduce the cost of registration and use.
• The whole effort will be largely based on the expected reduction in the cost ofbatteries, so that electric vehicles alone can approach the conventional ones.
Financial incentives and infrastructure willsupport the penetration of electric vehicles inGreece at this initial stage of development
86 | Greek Energy Market Report HAEE 2020

• The amount of 100 million euros covers the period 2020-2021 and similar packagesare anticipated to follow in the coming years.
• The European Union embraces electric mobility and provides funding for 1 millionchargers across Europe.
• The cost of fuel for a conventional vehicle that travels 10.000 km annually is 1.200€,while for an electric vehicle, the cost for the same distance is 420€.
• In case night tariff is included in the calculations, the cost drops to 220€, or in otherwords 80% lower than the conventional one.
• Apart from low cost of maintenance, electric cars are exempted from road tax,circulate freely in the city center and will not be charged for parking for two years.
Cars: Discount equal to 15% of the retail pricebefore taxes with a limit of 5.500€. Besides, 500€for those who will proceed with the installation of ahome charger.
Scooters: Discount equal to 20% of the retail price before taxes with a limit of 800€.
Bicycles: Discount equal to 40% of the retail price before taxes with a limit of 800€.
Highlights
Withdrawal bonus amounting to 1.000€ for cars and 400€ euros for motorcycles if the buyer of the electric vehicle proceeds to withdraw the old one
The budget of 100 million€ comprises an amount that willsubsidize the purchase of 1.700 cars, 1.500 motorcycles, 1.500bicycles, 1.000 taxis, 6.000 corporate vehicles and the installation of1.000 home charging points.
Source: HAEE’s analysis
Incentives for the Promotion of Eco-Mobility
The Greek government announced in June 2020a series of incentives supporting the promotionof Eco-mobility
87 | Greek Energy Market ReportElectricity

Country
Purchase
incentive
or
subsidies
Tax benefits
and
exemptions
Other
Benefits
(i.e. free
parking)
Infrastructure
promotion
measures
Traffic
Regulations
(i.e. bus
lanes, low
emission
zones)
Austria • • • •
Belgium • • •
Bulgaria • • •
Croatia •
Cyprus • •
Czech
Republic• •
Denmark • • • •
Finland • •
France • • • •
Germany • • • • •
Greece • • • • •
Hungary • • •
Iceland • • • •
Ireland • • • •
Italy • •
Latvia • • •
Lithuania • • •
Luxembourg • •
Malta • • •
Netherlands • •
Norway • • • • •
Portugal • • • •
Slovakia • • •
Spain • • • • •
Sweden • • • •
Switzerland • •
United
Kingdom• • • • •
Source: European Fuel Observatory, HAEE’s analysis
Fiscal and Non-Fiscal Incentives Towards Eco-Mobility for All EU Countries
European Union countries provide plethora ofboth financial and non-financial incentivestowards Eco-mobility
88 | Greek Energy Market Report HAEE 2020

5. Natural Gas
89 | Greek Energy Market ReportHAEE 2020

Highlights
Natural gas consumption in Greece grew in 2019 by
almost 10% reaching an all
time high at around 5 bcm
Natural gas import price following the COVID-19 outbreak dropped to
11.8 €/MWh in March
2020
For the first time in 2019 the primary entry point for natural gas in the country was Revithousa, from which
48% of the gas was imported
TAP pipeline will become available by the end of 2020, bringing natural gas quantities from Azerbaijan to Europe
In 2019, 50 cargos were
unloaded in Revythousa
coming from 10 different
countries, thus enhancing the country’s energy security of supply
The penetration rate in the region of Thessaloniki reached
50%, in Thessaly 51%,
while in Attiki it has reached
only 39%Household consumption prices dropped from almost 50 €/MWh to less
than 40 €/MWh, while
taxes fluctuate around
10-12 €/MWh
CNG and LNG technologies can offer reliable solutions to remote areas in which pipeline construction is costly
Future technologies around natural gas are coming to bridge the gap to a zero-carbon transition
€
CNG
TAP
90 | Greek Energy Market Report HAEE 2020

Overview
Natural gas consumption in Greece hit an all-time high in 2019, while the March
2020 average natural gas import price was the lowest in a 5-year period. In
2019, the Revithousa LNG terminal was for the first time, the major entry point
of natural gas in Greece, and exports to Bulgaria increased dramatically.
Existing and proposed infrastructure will transform Greece to a natural gas hub,
increasing the importance of the country in terms of security of supply.
In that context, LNG was the main source of natural gas imports in Greece,
diversifying the suppliers and enhancing security of supply. The most
challenging future project is the East Med Pipeline, proposing to transfer 10
bcma of natural gas from the Levantine basin to the European market crossing
the Mediterranean Sea. The final investment decision is expected to be taken in
2021 and the pipeline is planned to be ready by 2025.
Besides, the binding market test for capacity booking for the proposed FSRU in
Alexandroupolis was completed in March 2020 with binding offers of 2.6 bcm of
gas. The final investment decision is expected to be taken in Q1 2021. The
FSRU will have a regasification capacity of 6.1 bcma and is planned to be
connected with the IGB interconnector. The planned Under Ground Storage
(UGS) in Kavala, which will consist the first and only natural gas storage facility,
where depleted gas fields, can allow the storage of 1 bcm. UGS Kavala is a
project handled by HRADF and has been already included in the 4th PCI list by
the European Commission and the Member States.
Retail market exists mainly in the regions of Thessaloniki, Thessaly and Attiki,
yet there is an ambitious plan for expansion of the market through new grid
construction and use of CNG/LNG technologies for remote areas. The areas of
Thessaloniki and Thessaly are under “EDA THESS” DSO, being the first areas to
have been provided with natural gas. The area of Attiki is under “EDA Attiki”
DSO, being the area with the lowest penetration rate and therefore with the
greatest dynamic for market expansion. “DEDA” is the DSO for the rest of
Greece. 2019 was the first year that licenses for gas distribution were issued to
private companies. Retail market is almost nonexistent, and the Grid expansion
plan is the most ambitious of all. Natural gas retail prices have decreased
substantially the past years both for household and non-household users.
CNG & LNG technologies can offer reliable solutions to remote areas in which
pipeline construction is costly, and at the same time are considered as ideal
technologies for the expansion of the market to the islands. The retail market
consists of more than 8 active suppliers some of which have started selling
quantities in the B2B market before 2018. Future technologies around natural
gas are coming to bridge the gap to a zero-carbon transition.
91 | Greek Energy Market ReportNatural Gas
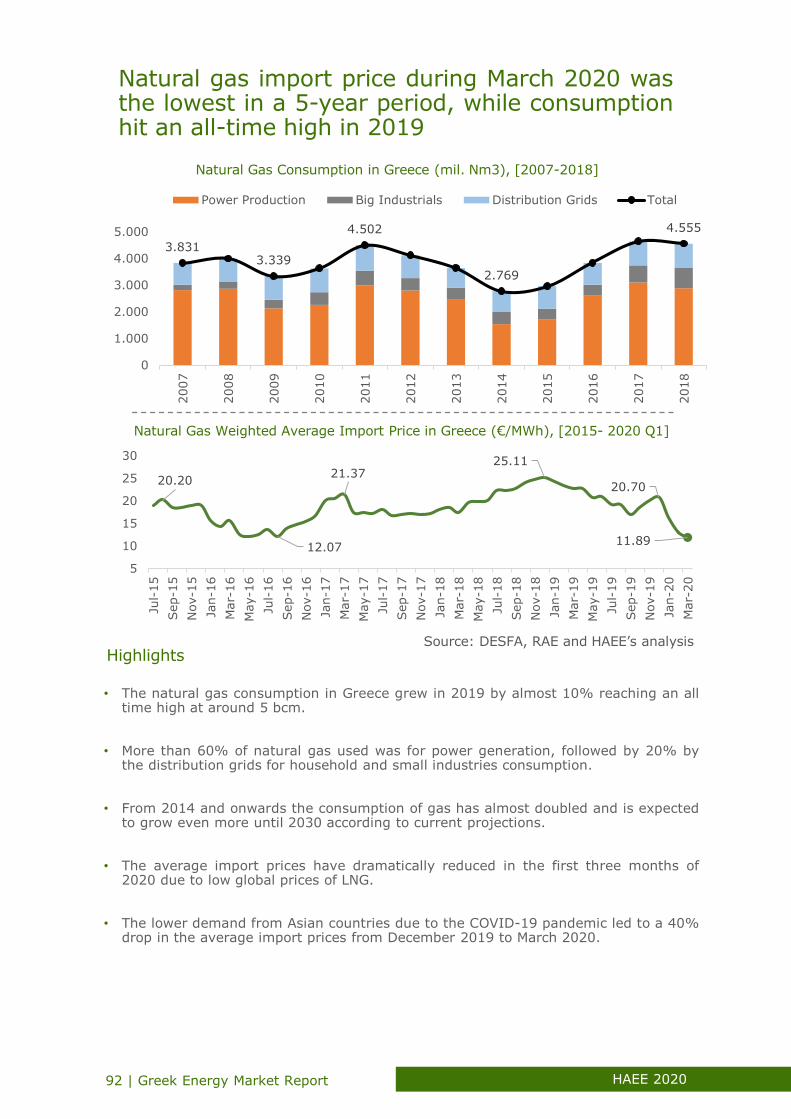
Natural Gas Consumption in Greece (mil. Nm3), [2007-2018]
Natural Gas Weighted Average Import Price in Greece (€/MWh), [2015- 2020 Q1]
Source: DESFA, RAE and HAEE’s analysis
3.8313.339
4.502
2.769
4.555
0
1.000
2.000
3.000
4.000
5.000
2007
2008
2009
2010
2011
2012
2013
2014
2015
2016
2017
2018
Power Production Big Industrials Distribution Grids Total
20.20
12.07
21.3725.11
20.70
11.89
5
10
15
20
25
30
Jul-
15
Sep-1
5
Nov-1
5
Jan-1
6
Mar-
16
May-1
6
Jul-
16
Sep-1
6
Nov-1
6
Jan-1
7
Mar-
17
May-1
7
Jul-
17
Sep-1
7
Nov-1
7
Jan-1
8
Mar-
18
May-1
8
Jul-
18
Sep-1
8
Nov-1
8
Jan-1
9
Mar-
19
May-1
9
Jul-
19
Sep-1
9
Nov-1
9
Jan-2
0
Mar-
20
Natural gas import price during March 2020 wasthe lowest in a 5-year period, while consumptionhit an all-time high in 2019
Highlights
• The natural gas consumption in Greece grew in 2019 by almost 10% reaching an alltime high at around 5 bcm.
• Μore than 60% of natural gas used was for power generation, followed by 20% bythe distribution grids for household and small industries consumption.
• From 2014 and onwards the consumption of gas has almost doubled and is expectedto grow even more until 2030 according to current projections.
• The average import prices have dramatically reduced in the first three months of2020 due to low global prices of LNG.
• The lower demand from Asian countries due to the COVID-19 pandemic led to a 40%drop in the average import prices from December 2019 to March 2020.
92 | Greek Energy Market Report HAEE 2020

Entry Points and Quantities (mil. Nm3), [2007-2019]
21%
48% 55%
66%
40%38%
14% 13% 7%
2018 2019 2020 (Jan-Apr)
Kipoi
Sidirokastro
LNG
0
1.000
2.000
3.000
4.000
5.000
6.000
2007 2008 2009 2010 2011 2012 2013 2014 2015 2016 2017 2018 2019
Sidirokastro Kipoi LNG Total
Import Entry Points (%), [2018-2020]
In 2019, the Revithousa LNG terminal was forthe first time the major entry point of NaturalGas in Greece
HighlightsSource: DESFA, HAEE’s analysis
• There are three entry points from which natural gas is flowing to Greece. One inSidirokastro, at the Greek Bulgarian borders, carrying Russian gas.
• The second entry point is at Kipoi located at the Greek-Turkish borders, bringingAzeri gas and the LNG terminal at Revithousa island near Athens.
• For the first time in 2019 the primary entry point for Natural Gas in the country wasRevithousa, from which almost half of the gas was imported.
• This trend continues in 2020 with more than 55% of Natural Gas imports getting inthe country in LNG form.
• Furthermore the expansion of the Revithousa terminal made possible the increase ofexports to Bulgaria, that in 2019 reached more than 0,65 bcm of Natural Gas.
93 | Greek Energy Market ReportNatural Gas

Route of Trans Anatolia Pipeline (TANAP) and Trans Adriatic Pipeline (TAP)
Source: TANAP, TAP, IGI Poseidon, HAEE’s analysis
Route of IGB , East Med and Poseidon Pipelines
Infrastructure will transform Greece to a NaturalGas Hub, increasing the ranking of the country interms of security of supply
Highlights
• TAP pipeline will become available by the end of 2020, bringing Natural Gasquantities from Azerbaijan to Europe.
• Its capacity within the European ground will be 10 bcma. At the end of June 2020,96% of the pipeline has been installed.
• Interconnector Greece Bulgaria, with 3 bcma capacity, is going to connect Bulgarianwith the Greek Natural Gas system, the TAP pipeline and the FSRU Alexandroupolis.
• East Med Pipeline, is proposed to transfer 10 bcma of Natural Gas from the Levantinebasin to the European market crossing the Mediterranean Sea.
• The Alexandroupolis FSRU will have a regasification capacity of 6.1 bcma and isplanned to be connected with the IGB interconnector.
94 | Greek Energy Market Report HAEE 2020

Norway LNG
19.4%
Algeria LNG
19.3%
Qatar LNG
18.2%
Nigeria LNG
15.4%
Egypt LNG
9.2%
USA LNG
8.2%
France LNG3.2%
Angola LNG3.2%
Netherlands LNG3.0%
Trinidad LNG0.9%
LNG Imports by Partner Country in Greece (%), [2019]
LNG was the main source of Natural Gas importsin Greece, diversifying the suppliers andenhancing security of supply
Highlights
Source: DESFA, HAEE’s analysis
• In December 2018, the expansion of the storage capacity at the Revithousa LNGterminal took place and the upgrade in the regasification facilities was completed.
• The expansion of the port facilities now allow the unloading of 260k m3 ships and theupgrade of cryogenic facilities led to a regasification capacity of 7 bcma.
• In 2018 only 3 countries delivered LNG cargoes in Greece, among them it was theUSA with the first ever cargo delivered in December 2018.
• In 2019 50 cargos were unloaded in Revythousa coming from ten different countries,thus enhancing the country’s energy security of supply.
• The main LNG counterparties in 2019 were Norway, Algeria and Qatar, followed byNigeria and Egypt and the USA.
95 | Greek Energy Market ReportNatural Gas

Natural Gas–Fired Power Plants per Operator (%), [2010]
50.5%
15.5% 14.7%
10.9%8.3%
PPC Elpedison Mytilineos Heron Korinthos Power
Total Installed Capacity: 4,900 MW
Highlights
• More than 50% of total Natural Gas installed capacity is operated by the PPC, in fivepower plants in Megalopoli, Lavrio, Komotini and Aliveri.
• Independent Power Producers (IPPs) like Mytilineos, Elpedison, Heron and KorinthosPower have installed capacity of 2,580 MW, representing the rest 49.5%.
• Elpedison has two power plants one in Thessaloniki and one in Thisvi, whileMytilineos has two power plants in Viotia and Heron 4 more plants in Viotia.
• A number of companies have plans for the construction of new power plants usingnatural gas as fuel. The capacity of all these projects is more than 4 GW.
• Mytilineos has already started the construction of a new Combined Cycle Gas Turbine(CCGT) plant of 826 MW installed capacity in Viotia.
The installed capacity of Natural Gas-fired powerplants exceeds 5 GW, while plans fordevelopment of further 4 GW are underway
Source: HEnEx, HAEE’s analysis
96 | Greek Energy Market Report HAEE 2020
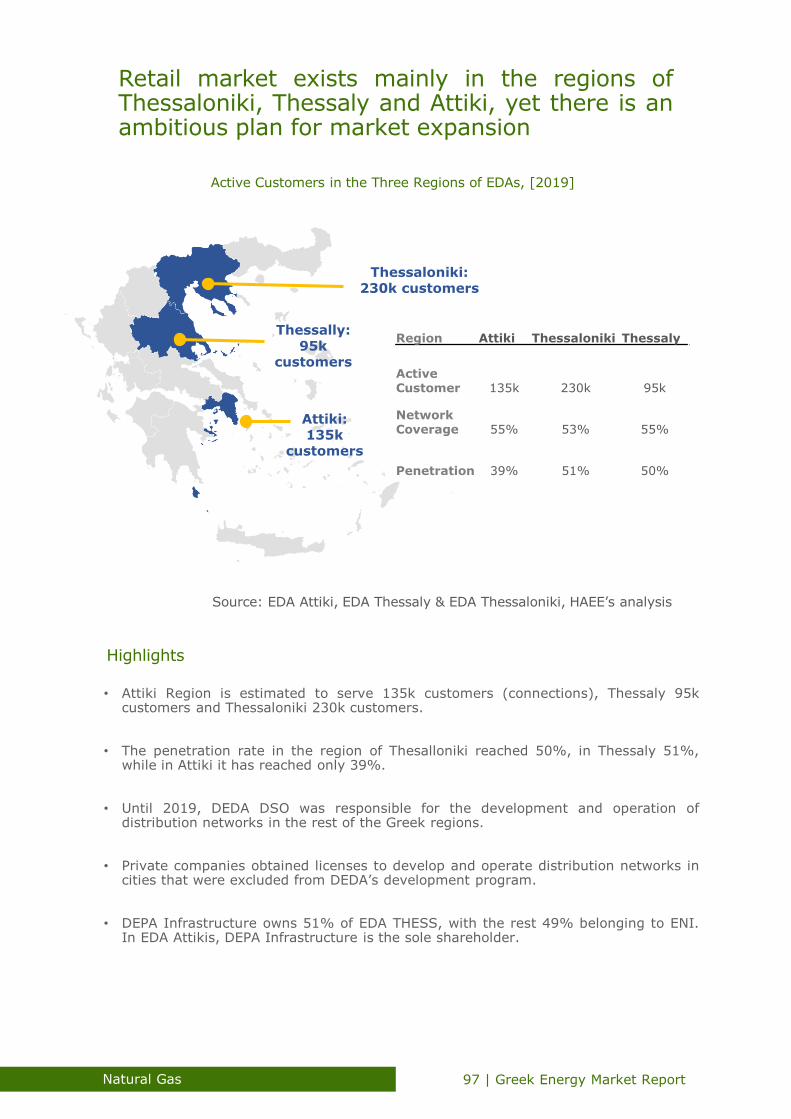
Thessaloniki: 230k customers
Thessally: 95k
customers
Attiki: 135k
customers
Region Attiki Thessaloniki Thessaly
Active Customer 135k 230k 95k
Network Coverage 55% 53% 55%
Penetration 39% 51% 50%
Active Customers in the Three Regions of EDAs, [2019]
Source: EDA Attiki, EDA Thessaly & EDA Thessaloniki, HAEE’s analysis
Retail market exists mainly in the regions ofThessaloniki, Thessaly and Attiki, yet there is anambitious plan for market expansion
Highlights
• Attiki Region is estimated to serve 135k customers (connections), Thessaly 95kcustomers and Thessaloniki 230k customers.
• The penetration rate in the region of Thesalloniki reached 50%, in Thessaly 51%,while in Attiki it has reached only 39%.
• Until 2019, DEDA DSO was responsible for the development and operation ofdistribution networks in the rest of the Greek regions.
• Private companies obtained licenses to develop and operate distribution networks incities that were excluded from DEDA’s development program.
• DEPA Infrastructure owns 51% of EDA THESS, with the rest 49% belonging to ENI.In EDA Attikis, DEPA Infrastructure is the sole shareholder.
97 | Greek Energy Market ReportNatural Gas

Source: EDA Thess, HAEE’s analysis
300000
325000
350000
375000
400000
425000
450000
350
375
400
425
450
475
500
525
550
2019
2020
2021
2022
2023
2024
EDA THESS 5-Years Plan: Grid Construction (km), [2020-2024]
EDA THESS 5-Years Plan: New Connections (thousand costumers), [2020-2024]
EDA THESS: Active Customers and Distributed Quantities (mcm), [2020-2024]
The areas of Thessaloniki and Thessaly are under“EDA THESS” DSO, being the first areas to havebeen provided with natural gas
Highlights
• The region of EDA THESS is the one with the biggest penetration rate, including 13and 14 municipalities in the prefecture of Thessaloniki and Thessaly respectively.
• The expansion of the grid includes also the supply of regions outside the mediumpressure pipeline system, through CNG technology.
• The 5-year plan of EDA THESS is designing a grid expansion of 470km (250km inThessaloniki and 170km in Thessaly) until 2024.
• The final number of active customers is projected to increase by 30% reaching 420k,while the distributed quantities are estimated to surpass 0.5 bcm.
• The cost of the total investment of the expansion of the Network is estimated at 135million euros, which are intended for investments in Distribution Networks.
98 | Greek Energy Market Report HAEE 2020

EDA Attikis 5-Years Plan: Grid Construction (km), [2020-2024]
EDA Attikis 5-Years Plan: New Connections, [2020-2024]
EDA Attikis: Active Customers and Distributed Quantities (mcm), [2020-2024]
Source: EDA Attikis, HAEE’s analysis
357 385 412 439 466
100000
150000
200000
250000
200
250
300
350
400
450
500
2020 2021 2022 2023 2024
Distributed Quantities (mcm) (LHA) Active Customers (RHA)
The area of Attiki has the lowest penetration rateand therefore has the greatest dynamic formarket expansion
Highlights
• The areas of Attiki covered by the existing distribution network include 52municipalities in the Prefecture of Attiki.
• The existing distribution network covers around 55% of the road network wherethere is the basic infrastructure for further network development.
• The penetration of the natural gas is very low at 39%, thus EDA Attikis has a veryambitious plan to further construct 665 km of low-pressure network.
• The new connections are expected to be more than 20k per year, with a number ofactive customers increasing by more than 60% compared to 2019 levels.
• The distributed quantities are expected to be more than 450 mcm by 2024, a 30%increase from 2019 levels and the planned investment cost will reach € 140 million.
99| Greek Energy Market ReportNatural Gas

DEDA 5-Years Plan: Grid Construction (km), [2020-2024]
DEDA 5-Years Plan: New Connections, [2020-2024]
DEDA: New Connections and Distributed Quantities (mcm), [2020-2024]
Source: DEDA, HAEE’s analysis
0
5000
10000
15000
20000
0
50
100
150
200
250
2020 2021 2022 2023 2024
Quantities (mcm) (LHA) New Connections (RHA)
“DEDA” is the DSO for the rest of Greece, whereretail market is almost non existent and the Gridexpansion plan is the most ambitious of all
• DEDA has designed the most ambitious 5-year plan until 2024, compared to theother two DSOs.
• DEDA is planning to construct 1700km of low pressure pipelines and more than 140km of medium pressure pipelines in more than 25 cities in continental Greece.
• According to the plan Natural Gas will be available to 60k customers in comparisonwith less than 1k that have access today.
• The distributed quantities of Natural Gas are expected to reach more than 200 mcmper year by 2024.
• In certain areas where the network expansion is not economically viable, the supplyof Natural Gas will be achieved through LNG and CNG.
Highlights
100 | Greek Energy Market Report HAEE 2020

Source: Eurostat, HAEE’s analysis
0
10
20
30
40
50
60
2012S2
2013S1
2013S2
2014S1
2014S2
2015S1
2015S2
2016S1
2016S2
2017S1
2017S2
2018S1
2018S2
2019S1
2019S2
Price without taxes Taxes
Retail Price for Non-Household Consumers in EU 28, Band I3 (€/MWh), [2012-2019]
0
10
20
30
40
50
60
70
2012S2
2013S1
2013S2
2014S1
2014S2
2015S1
2015S2
2016S1
2016S2
2017S1
2017S2
2018S1
2018S2
2019S1
2019S2
Price without taxes Taxes
Retail Price for Non-Household Consumers in Greece (€/MWh), Band I3 [2012-2019]
0
20
40
60
80
2012S2
2013S1
2013S2
2014S1
2014S2
2015S1
2015S2
2016S1
2016S2
2017S1
2017S2
2018S1
2018S2
2019S1
2019S2
Price without Taxes Taxes
Retail Price for Household Consumers in EU 28, Band D2 (€/MWh), [2012-2019]
Retail Price for Household Consumers in Greece, Band D2 (€/MWh), [2012-2019]
0
20
40
60
80
100
120
2012S2
2013S1
2013S2
2014S1
2014S2
2015S1
2015S2
2016S1
2016S2
2017S1
2017S2
2018S1
2018S2
2019S1
2019S2
Price without Taxes Taxes
Natural Gas retail prices have decreasedsubstantially the past years both for householdand non household users
Highlights
• The average retail price for a household with medium gas consumption hassignificantly decreased since S1 2013.
• Prices dropped from almost 50 €/MWh to less than 40 €/MWh. The taxes fluctuate inthe range of 10-12 €/MWh.
• On the other hand, in Greece the retail price for these consumers is almost half in S22019 compared to S2 2012, reaching at 35 €/MWh.
• The European Union average price for non-household users has been fluctuatingaround 70 €/MWh for the last years.
• In Greece the price for non-household users has witnessed a sharp drop, especiallyafter 2015, while the current price is close to 60 €/MWh.
101| Greek Energy Market ReportNatural Gas

Remote cities&
single Client
Industry Agriculture
PowerChemical
Distribution
Transport
Co Generation
Remote Cities
Compression Station
Trailers Decompression
LNG Terminal
Truck Loading
LNG Ship
Small Terminal
Power Generation
CNG/LNG Potential Market
CNG supply chain
LNG supply chain
Industries
Source: HAEE’s analysis
CNG and LNG technologies can offer reliablesolutions to remote areas in which pipelineconstruction is costly
Highlights
• Greece’s specific geographic characteristics have hindered the expansion of thepipeline grid to certain remote areas and islands.
• Through CNG & LNG technologies, DSOs can provide natural gas to areas where themarket is inexistent.
• Individual suppliers/providers of Natural Gas, will have the chance to provide bigindustrial consumers with gas, allowing the reduction of the energy costs.
• There are 3 compression stations that operate in Thessaloniki, Larissa and Thessaly,providing CNG to city grids which are not connected with the system.
• LNG truck loading is not an option currently, as there is no relevant infrastructureconstructed in Revithousa terminal.
102 | Greek Energy Market Report HAEE 2020

Fixed Amount per month
DEPA Auctions Premium1st Formula:Professional
Fixed Amount per month
Supply Price Premium
2nd Formula:Residential
Central Heating
Fixed Amount per month
Fixed Amount per month on
quantity
3rd Formula:Residential
Autonomous
Single Product
Double Offer
(Power)
OR Services
Pricing Formulas used by Greek Natural Gas Suppliers
Source: HAEE’s analysis
Highlights
The retail market consists of more than 8 activesuppliers some of which have started sellingquantities in the B2B market before 2018
• The type of companies which are active in the market are mainly power utilities(producers and suppliers of electricity) and electricity retail suppliers.
• Except for the 2 dominant companies (Zenith & Aerio Attikis), there are currentlymore than 8 suppliers actively providing products and services.
• The main pricing principles of the market participants are not yet sophisticated andremain relatively simple.
• One of the two common pricing formulas offered by suppliers, is based on the DEPAauctions, while the 2nd formula is based on the cost of supply.
• The third formula used is based on a fixed price, which does not change according tothe supply cost or the level of competition in DEPA auctions.
103| Greek Energy Market ReportNatural Gas

Sync Gas & Hydrogen
Technology
Biogas Technology
H20 Nat. Gas Grid
H2
Syn Gas
Penetration of Biogas and Sync Gas Into the Natural Gas Grid
Source: HAEE’s analysis
Future technologies around natural gas arecoming to bridge the gap to a zero-carbontransition
Highlights
• According to the new Energy Directive of the EU, among the new targets set, there isan end target of 14% renewables in the transport sector by 2030.
• This target aims to promote the further deployment of electric mobility, but it alsoincludes a sub-target of 3.5% for advanced biofuels and biogas.
• Biogas is planned to substitute fossil Natural Gas, being transported in the same gridinfrastructure that Natural Gas is already using.
• Biogas starts being acknowledged worldwide as one of the most upfront technologyfor upgrading waste to valuable fertiliser and renewable energy.
• Syn Gas is produced from a mixture of carbon monoxide, carbon dioxide, andhydrogen and it can be also used in the existing natural gas infrastructure.
104 | Greek Energy Market Report HAEE 2020
5. Renewable Energy Sources
105 | Greek Energy Market ReportHAEE 2020

HighlightsHighlights
Another 964 MW of
RES capacity (482 MW for Wind & 482 MW for Solar) are expected to be auctioned within 2020
During the last auctionsof December 19 and April 2020, the awarded tariff prices continued their declining trend
As of the end of 2019,
more than 50% of
the total RES installed capacity is from Wind stations
The majority of the increase in terms of installed capacity is credited to Wind
power, with 728 MW
being commissioned within 2019
During 2019, the installed RES capacity increased by
15.6% reaching a total
of 6,355 MW at the end of the year
The new Energy Law L.4685/2020 aims to accelerate the Licensing procedure by providing strict deadlines and regulations
The implementation of the Target Model will modify the daily obligations of RES producers
The revised estimations are more optimistic than last year’s, and indicate that the total RES capacity
could reach 15,674 MW by 2030
51.6%
The majority of the Windcapacity is located at Central Greece with a
share equal to 25.3%,
while Central Macedonia
accounts for 17.2% of
PV installations
106 | Greek Energy Market Report HAEE 2020

Overview
European Union member states, as well as Greece, continued to increase their
energy share generating from RES in 2019. RES installed capacity in Greece
increased by 16% compared to 2018, mainly due to the significant increase of
Wind capacity. This grow peaked at 6,355 MW of RES installed capacity at the
end of 2019. Wind remains the dominant RES in Greece, with the majority of
the capacity located in Central Greece. Solar production shows more dispersion
around the various regions in Greece compared to Wind production.
The impact of the COVID-19 is anticipated to slightly affect the share of RES in
gross electricity consumption in Greece, mainly due to minor delays related to
the construction of new projects. This reduction is not anticipated to be severe,
since only a drop of 2% compared to prior projections is expected and then the
trajectory returns back to the prior rising path. In that context, it is important
to have key segments of Renewable Energy value chains within Europe, as a
“strategic” approach so as to reach the sustainable growth targets set out in the
EU “Green Deal”. By the end of 2025, RES are anticipated to represent 75% of
the total energy produced in Greece, since both primary energy production from
Coal and Oil will follow a downward trend. Hence, until that time, it is important
to secure the development of flexible and quick-response technologies such as
batteries and Demand Response to support this high RES penetration.
Following the implementation of the Target Model, RES market is heavily
affected as well, since the upcoming scheme includes significant operating costs
such as, clearance charges, deviations charges and non-compliance charges.
The Feed-in Premium (FiP) mechanism for the support of Renewable Energy
Sources has been adopted in Greece since 2016. This mechanism includes the
constant balance by crediting or charging the difference of Reference Value with
monthly Renumeration Market Price (RMP) technology. The Renumeration
Market Price is based on the hourly production of energy by the specific RES
technology.
Since 2018, four auctions for Renewable Energy projects per technology have
been held by the Regulating Authority for Energy (RAE). Except from the
auctions per technology, two common auctions (technology neutral) have been
held in 2019 and 2020. The new Energy Law aims to accelerate the Licensing
procedure and invite significant investments by providing strict deadlines and
obligations. Finally, RES capacity is projected to rapidly increase until 2030, in
order to reach the National Energy Targets.
107 | Greek Energy Market ReportRenewable Energy Sources

Share of Energy from Renewable Sources in the EU Member States (%), [2018]
Source: Eurostat, HAEE’ analysis
17
.98
%
18.0
0%
7.3
9%
0%
10%
20%
30%
40%
50%
60%
70%
80%
EU
28
Norw
ay
Icela
nd
Sw
eden
Fin
land
Latv
ia
Monte
negro
Denm
ark
Alb
ania
Austr
ia
Port
ugal
Esto
nia
Cro
atia
Kosovo
Lithuania
Rom
ania
Slo
venia
Bulg
ari
a
Serb
ia
Nort
h…
Gre
ece
Italy
Spain
Fra
nce
Germ
any
Czechia
Cypru
s
Turk
ey
Hungary
Slo
vakia
Pola
nd
Irela
nd
United…
Belg
ium
Luxem
bourg
Malta
Neth
erlands
12.62%
13.41%
15.38%
16.73%
17.98%
2009
2010
2011
2012
2013
2014
2015
2016
2017
2018
Highlights
• Following the medium and long-term goals set by EU, Member States continued toincrease their share of energy from RES.
• EU 28 (as an average of the 28 member states) has steadily increased its RES shareduring the last years, from 12.62% in 2009 to 17.98% in 2018.
• Most of the EU Members have achieved their 2018 goals, nevertheless, somecountries still have not reached their targets and additional effort should be made.
• Greece has reached the share of 18% in 2018 and 19.5% in 2019, compared to the16.9% achieved in 2017.
• Greece is expected to remain on the same path, aiming to reach a 20% by the end of2020, which is set as a RES national target.
European Union member states, as well asGreece, continued to increase their energy sharefrom RES in 2018
EU-28 RES Share Evolution (%), [2009-2018]
108 | Greek Energy Market Report HAEE 2020

Installed Capacity in Greece by Month (MW), [2019]
Source: DAPEEP, HAEE’s analysis
5.494 5.578 5.609 5.624 5.671 5.696 5.835 5.865 5.962 6.063
6.189 6.355
0
1000
2000
3000
4000
5000
6000
7000
Jan Feb Mar Apr May Jun Jul Aug Sep Oct Nov Dec
Hydro Lignite Natural Gas RES
Highlights
The installed Renewable Energy Sources capacityis steadily increasing reaching 6,355 MW at theend of 2019
• As the figure illustrates, in 2019, the total RES installed capacity continued to showan increasing trend.
• Especially after June, the increase seems to be more rapid with the total capacityreaching 6,355 MW by the end of the year.
• The capacity of the Hydro, Lignite and Natural Gas remained stable throughout theyear since no modifications occurred.
• However, this is expected to change in the following period, as several lignitestations are scheduled to be decommissioned.
• The resulting “capacity gap” is expected to be covered mainly by RES stations,meaning that, RES capacity is expected to grow even more in the future.
109 | Greek Energy Market ReportRenewable Energy Sources

Installed Capacity of RES by Type in Greece (MW), [2018 - 2019]
Source: DAPEEP, HAEE’s analysis
51.66%
41.53%
3.78%
1.37%1.66%
Wind
Solar
Hydro
Biomass
CHP
RES Share by Type in Greece (%) [2019]
2555
2139
3282
2287
0
500
1000
1500
2000
2500
3000
3500
Win
d
Sola
r
Sola
r (r
ooft
op)
Hydro
Bio
mass
CH
P
2018 2019
Highlights
• The increase of RES capacity continued in 2019, with an annual increase of 16%,from 5,469 MW in 2018 to 6,355 MW in 2019.
• Renewable Energy Sources capacity now holds a 34.6% or 18,329 MW of the totalinstalled capacity in the country.
• For another year, Wind capacity showed the most significant increase, from 2,555MW in 2018 to 3,283 MW in 2019, an increase of almost 28.5%.
• Solar capacity increased by almost 148 MW while Hydro, Biomass and CHP stationsremained practically at the same levels.
• The solar capacity is expected to show a significant increase in the following years,as thousands of applications for PV installations have been submitted to RAE.
In 2019, RES capacity increased by 16%compared to 2018, mainly due to the significantincrease of Wind capacity
110 | Greek Energy Market Report HAEE 2020

Installed Wind Capacity by Region (%), [2019]
Source: DAPEEP, HAEE’s analysis
25.3%
18.7%
14.6%
14.2%
9.3%
13.5%
Central Greece
Peloponnese
Euboia
East Macedonia & Thrace
Western Greece
Rest of Greece
Installed Wind Capacity by Project Size (MW), [2019]
3159
124
Projects above 5MW
Projects below 5MW
Wind remains the dominant RES in Greece, withthe majority of the capacity located in CentralGreece
Highlights
• The total installed wind capacity in Greece was 3,283 MW in December 2019, andmany project are now awaiting for the Issuance of “Production Certificate”.
• The majority of the wind capacity is located at Central Greece with a share equal to25.3% while a significant amount is also installed in Peloponnese, at 18.7%.
• Euboea represent 14.6%, East Macedonia and Thrace 14.2%, Western Greece 9.3%and the remaining 13.5% found at the rest of Greece.
• Most of the installed capacity concerns Projects that have capacity of at least 5 MW,3,159 MW or 96% out of the total 3,283 MW.
• Only 123 MW of the total capacity are small-scale wind installations below 5 MW.Nevertheless, projects below 5 MW show a significant increase compared to 2018.
111 | Greek Energy Market ReportRenewable Energy Sources

Solar Capacity by Region (MW), [2019] Installed MW per PV Station Capacity (%), [2019]
Source: HEDNO, ELETAEN, HAEE’s analysis
17.2%
14.7%
13.4%
13.2%
11.9%
10.5%
19.0%
Central Macedonia
Cental Greece
Peloponnese
Thessaly
Western Greece
East Macedonia & Thrace
Rest of Greece
7.6%
24.3%
10.8%
21.8%
35.5%
PV>5Mw 1MW<PV≤5MW
500kW<PV≤1MW 100kW<PV≤500kW
PV≤100kW
Highlights
Solar production shows more dispersion aroundthe various regions in Greece compared to Windproduction
• PV installations are nearly evenly dispersed across the mainland Greece, with CentralMacedonia showing the biggest concentration (17.2%).
• Next, Central Greece represents 14.7%, Peloponnese 13.4%, Thessaly 13.2%,Western Greece 11.9% and East Macedonia & Thace 10.5%.
• At the end of 2019, the total installed solar capacity in Greece was 2,288 MW andonly 7.6% of this amount was provided by large scale PVs (above 5 MW).
• The majority of the solar production comes from small PV installations (P<100kW),holding a 35.5% of the total solar capacity.
• This is explained by the rapid growth of PVs during 2011-2013, when a significantnumber of individuals installed PVs due to the subsidies that were provided.
112 | Greek Energy Market Report HAEE 2020

2019
Evolution of System Marginal Price (€/MWh), [2017 – 2019]
Source: HEnEx, IPTO, HAEE’s analysis
75
45
70
44
75
60
60
0
10
20
30
40
50
60
70
80
Jan
Feb
Mar
Apr
May
Jun
Jul
Aug
Sep
Oct
Nov
Dec
Jan
Feb
Mar
Apr
May
Jun
Jul
Aug
Sep
Oct
Nov
Dec
Jan
Feb
Mar
Apr
May
Jun
Jul
Aug
Sep
Oct
Nov
Dec
2017
The deviation of the System Marginal Priceshowed signs of stabilization during the lastmonths of 2019
2018
Highlights
• SMP is calculated based on the combination of the capacity (and price) offered by theproducers and hourly load demand determined by the consumers.
• SMP is the actual price that each electricity producer is being paid and eachconsumer pays at each time of the year.
• The Average System Marginal Price for 2019 was equal to 63.82 €/MWh, increasedby 3.43 €/MWh compared to 2018.
• The lowest SMP was recorder on March 2018 (44.2 €/MWh), while the highest pricewas recorded on January 2019 (75.2 €/MWh).
• The deviation between lowest and highest SMPs was significant on 2017 and 2018but seems to be steadily normalizing in 2019.
113 | Greek Energy Market ReportRenewable Energy Sources

Participation in all relevant markets
Market participants Registry / Plant’s Registry
Possibility for representation by RES aggregators or evenlast resort RES aggregator
Forecasting adjustment during IDM
Imbalances settlement at the level of the balancingmarket with the final position after IDM
Provision for charges of non-compliance (strategicbidding) similar to the charges and methodology that areapplicable to all market participants
The upcoming scheme includes significantoperating costs such as, clearance charges,deviations charges and non-compliance charges
Highlights
• RES Producers are obliged to participate in wholesale markets, submit bidsautonomously or through Aggregators or through the Last Resort Aggregator.
• Following the participation to the market, RES producers are committed to optimalforecasting accuracy.
• For the transitional period, until the official operation of the Target Model,participants will be credited with a Fixed Management Premium equal to 1€/MWh.
• For the same period, RES producers will be charged by the Mechanism for AccurateForecasting (MAF) that equals 2.91 €/MWh for 2020.
• In overall, RES producers should be balanced by crediting or charging based on theSliding FiP which is the difference of Reference Value with monthly RMP technology.
Source: HAEE’s analysis
New RES Framework
114 | Greek Energy Market Report HAEE 2020
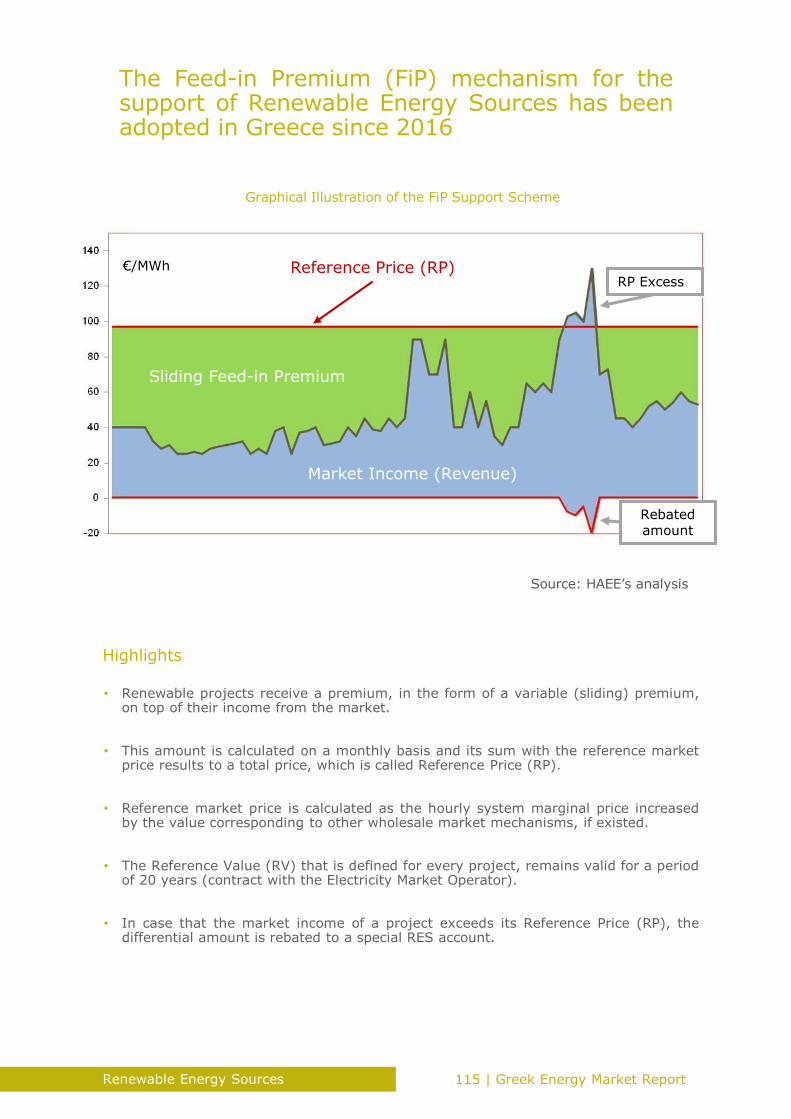
Graphical Illustration of the FiP Support Scheme
Source: HAEE’s analysis
Sliding Feed-in Premium
Market Income (Revenue)
Reference Price (RP)RP Excess
Rebated amount
€/MWh
Highlights
• Renewable projects receive a premium, in the form of a variable (sliding) premium,on top of their income from the market.
• This amount is calculated on a monthly basis and its sum with the reference marketprice results to a total price, which is called Reference Price (RP).
• Reference market price is calculated as the hourly system marginal price increasedby the value corresponding to other wholesale market mechanisms, if existed.
• The Reference Value (RV) that is defined for every project, remains valid for a periodof 20 years (contract with the Electricity Market Operator).
• In case that the market income of a project exceeds its Reference Price (RP), thedifferential amount is rebated to a special RES account.
The Feed-in Premium (FiP) mechanism for thesupport of Renewable Energy Sources has beenadopted in Greece since 2016
115 | Greek Energy Market ReportRenewable Energy Sources

2019 2020
Technology November December January February March April
Wind 54.01 56.19 56.65 46.52 41.53 27.07
PV 56.73 61.56 58.98 45.83 37.81 25.07
Hydro 55.23 59.53 58.33 49.20 43.84 28.38
Biomass 56.42 61.36 59.85 50.29 45.43 29.50
CHP 56.42 61.36 59.85 50.29 45.43 29.50
Renumeration Market Price is based on thehourly production of energy by the specific REStechnology
Highlights
Source: HAEE’s analysis
Historical Prices of Renumeration Market Price by Month
• The total production of energy by all units of the same RES technology is being takeninto consideration, no matter if the contract is FiT or FiP.
• The solution of RMP leads to the monthly calculation of the sliding premium which isidentical for all producers of each RES technology.
• Hence guaranteeing that the total profits in terms of technology is the ReferencePrice multiplied by the total production for the specific time unit.
• The outcome of RMP should not be linked with the “Quality” of the forecastingprocedure by each participant but only to reflect the overall picture.
• Hence, the “Quality” of the forecast by each participant, should count for anyexpenditure or revenue for his participation in the electricity market.
116 | Greek Energy Market Report HAEE 2020

Source: RAE, HAEE’s Analysis
Auction Results, Wind≤50MW (3MW≤Wind≤50MW for July & Dec 18), [€/MWh]
Auction Results, PV≤20MW (1MW≤PV≤20MW for July & Dec 18), [€/MWh]
63 62
54
64 63 60
7168 66
July 18 Dec 18 July 19 Dec 19
Lowest Bid Weighted Price Highest Bid
Cancelled
68
5559
56
7059
67
58
7265
6962
July 18 Dec 18 July 19 Dec 19
Lowest Bid Weighted Price Highest Bid
• Small PV plants (PV<1MW) are unified with the 1MW≤PV≤20MW category, thuscreating Category PV≤20MW which is still the case until today.
• For the PV<1MW category, a total of 115.47 MW were auctioned while the weightedauctioned price was 78.4 €/MWh in July 18 and 66.6 €/MWh in December 18.
• In total, 416.67 MW of solar capacity have been auctioned, while for wind projects,742 MW have been auctioned (337.33 MW in 2018 and 404.95 MW in 2019).
• Overall, the weighted price of PVs seems to be steadily decreasing, from the 63.81€/MWh in July 2018 to 59.98 €/MWh in December 2019.
• In the wind projects case, the price is also decreasing despite the unexpectedincrease in the price occurred in the July 2019 auction.
Highlights
Since 2018, four auctions for Renewable Energyprojects per technology have been held by theRegulating Authority for Energy (RAE)
117 | Greek Energy Market ReportRenewable Energy Sources

Source: RAE, HAEE’s Analysis
2020 Auction Timeline
Common Auction (Technology Neutral) Results, PV≥20MW & Wind≥50MW, [€/MWh]
April 2020 Common AuctionAuctioned Capacity: 502.94MW
Next planned auction: July 2020Per specific technology
(PV<20MW & Wind<50MW)
Dec 2020 Planned AuctionPer specific technology
(PV<20MW & Wind<50MW)
Remaining Capacity to be auctioned within 2020: 482 MW for PV & 482MW for Wind
57.03
51.59
53
49.11
64.72
54.82
April 19 April 20
Weighted Price
Lowest Bid
Highest Bid
• The common auctions concern Solar and Wind projects of big capacity (PV≥20MWand Wind≥50MW).
• So far, a total of 940.72MW have been auctioned with the most recent auction takingplace in April 2020, while the next auction is scheduled to be held in July 27.
• During April 2020 auction, 502.94MW were auctioned with a weighted price of 51.59€/MWh.
• The prices in this category are also steadily decreasing and are expected to continuefollowing this trend in the following period.
• According to RAE’s timeline, another 964 MW of capacity are expected to beauctioned within 2020 (482 for PV and 482 for Wind).
Highlights
Except from the auctions per technology, twocommon auctions (technology neutral) havebeen held in 2019 and 2020.
118 | Greek Energy Market Report HAEE 2020

Source: HAEE’s analysis
Chart Flow of the New RES Licensing Procedure
Application for RES Production
Certificate
Issuance of Certificate
Application for ETA
Issuance of ETA
40 – 55 days 70 – 90 days6 months
(+12 in special cases)
Installation License
Participation in Auction
Binding Connection Terms Offer
Construction License
Highlights
The new Energy Law aims to accelerate thelicensing procedure and invite significantinvestments by providing stricter deadlines
• The RES Production Certificate replaces the RES Production License and applicationssubmitted after September 2018 will be assessed based on this new procedure.
• From the moment of the submission of the application, the Certificate must be issuedwithin 40 days (55 days in case of objections from third parties).
• Within 6 months of the RES Production Certificate issuance (+12 months in specialecological cases) the applicant must apply for ETA.
• Within 70 days (90 days for cases that some Opinions may be absent, and theRegional Environmental Licensing Council is called) the ETA is issued.
• Overall, the new Energy Law significantly accelerates the licensing procedure andreduces the potential bottlenecks in the process.
119 | Greek Energy Market ReportRenewable Energy Sources

Long-Term Forecast of RES Installed Capacity in Greece (MW), [2020 – 2030]
Source: DAPEEP, ADMIE, HAEE’s analysis
Forecast and Actual RES Installed Capacity in Greece (MW), [2019]
6108
6355
5.200
5.400
5.600
5.800
6.000
6.200
6.400
Jan Feb Mar Apr May Jun Jul Aug Sep Oct Nov Dec
Energy Market Report 2019 Forecast Actual6.5
12
13.7
94
6.5
47
15.6
74
0
2000
4000
6000
8000
10000
12000
14000
16000
2020 2021 2022 2023 2024 2025 2026 2027 2028 2029 2030
2019 estimation Revised 2020 Estimation
RES capacity is expected to rapidly increase until2030, in order to reach the National EnergyTargets
• The recorded actual increase in RES capacity exceeded the estimations of theprevious year reaching 6,355 MW at the end of 2019.
• Projections presented in 2019 Greek Energy Market Report, forecasted 6,108 MW ofRES installed capacity for 2019, which is 4% lower than the actual values.
• Especially during Q3 and Q4 of 2019, a significant increase was recorded, which wasequal to almost 700 MW in 6 months.
• This increase is expected to even accelerate the following years, reaching 15,674 MWat the end of 2030.
• In fact, the new estimations are significantly higher compared to the last yearscalculations, with almost a 12% increase in the prediction for 2030.
Highlights
120 | Greek Energy Market Report HAEE 2020

6. Oil & Refining
121 | Greek Energy Market ReportHAEE 2020

Highlights
Oil consumption in Greece is picking up the last years to reach slightly more than
7.2 billion tonnes in 2019
Domestic crude oil production was less than
170 thousand tons in
2019 and has slumped to zero in March and April 2020
In 2018, 25% of the
output was road diesel, while fuel oil and motor
gasoline make up 20%
and 16.3% of the
refined productsThe sector with the major part in the oil and oil products final consumption is transportations both at
European level - 68.6%,
and in Greece - 70.5%The main source of crude oilin Greece for 2019 was Iraq, representing almost
50% of the imports,
with imports of 82 million barrels of crude oil
Crude oil imports in Greece
have risen by 20% since
2011 to reach almost 23 million tons in 2019
The average unleaded price in 2019 in Greece
was 1.5 €/litre, when
the average price a decade ago was less than 1 €/litre In April 2020 the retail price
of unleaded decreased to
1.3 €/litre, yet 72% of
the final price stood for taxes
As result of the pandemicthe West Texas Intermediate (WTI) hit for the first time in history negative prices
122 | Greek Energy Market Report HAEE 2020
Overview
At the beginning of 2020 and before the outbreak of the pandemic, global Oil
was expected to grow, mainly driven by the better economic conditions
worldwide. Hence, world and EU Oil production have taken a major hit from the
pandemic, since Oil demand will struggle to regain an upward trajectory.
However, even before the COVID-19, oil consumption in the European Union
was growing at a slower pace, with gas oil and diesel oil representing almost
50% of the total consumption. The refinery output at European Union level has
remained relatively stable over the past decade with road diesel representing
the biggest share.
Regarding the case of Greece, Oil consumption is showing a slight upward
trend, after a steep fall during the first four years of the economic crisis. The
Greek domestic Oil market consists of three different sectors and is dominated
by two refining companies. Greece’s Oil production is small, yet its refining
capacity is substantial, adding extra value to the country’s economy. Greece’s
refining capacity has significantly grown over the past ten years by almost 50%,
providing the country with various distillates. Currently, the transport sector
represents more than 2/3 of the Oil final consumption both at European and
national level. Greece has developed trade relations with a number of countries
to fulfil its crude Oil import needs.
Although the transition to alternative sources of energy has started, the
country’s dependency on imports of crude Oil and petroleum products remains
high. In that framework, retail prices of unleaded and diesel oil are burdened by
significant taxes both in Greece and in European Union. Following the 2009
financial crisis heating oil price gap between Greece and the EU increased, while
the prices of fuel oil remained lower in Greece.
Nowadays, the impact of COVID–19 is evident in the retail prices of Oil
products, since prices in March, April and May 2020 reduced by almost 30%. In
February and April 2020, production of crude Oil in Greece was zero barrels per
day compared to 2.3 thousands barrels per day in February 2020. Finally, over
the following years, refining sector is expected to evolve in a way that mitigates
climate change by adopting new low-carbon technologies. Thus, future
refineries are expected to become hubs for the production and distribution of
low-emission products and raw material.
123 | Greek Energy Market ReportOil & Refining

Source: IEA, HAEE’s analysis
Oil Products Consumption Globally (thousand tons), [1990-2019]
0
500.000
1.000.000
1.500.000
2.000.000
2.500.000
3.000.000
3.500.000
4.000.000
4.500.000
1990
1991
1992
1993
1994
1995
1996
1997
1998
1999
2000
2001
2002
2003
2004
2005
2006
2007
2008
2009
2010
2011
2012
2013
2014
2015
2016
2017
2018
2019e.
Naphtha Motor Gasoline
Jet Kerosene Gas/diesel
Crude Oil/Natural gas liquids Liquified petroleum gases/Ethane
Other kerosene Fuel Oil
Other Oil Products
Before the outbreak of the pandemic, global oilwas expected to grow in 2020, mainly driven bythe better economic conditions worldwide
Highlights
• Worldwide Oil products consumption since 1990 is dominated by gas/diesel andmotor gasoline.
• The global consumption of Oil and products continued to increase in 2019 globallyfollowing the trend of the past 30 years.
• Due to the effects of the COVID-19 Pandemic global Oil demand is expected to bealmost 8 mb/d lower in 2020 than in 2019.
• As result of the pandemic the West Texas Intermediate (WTI) hit for the first time inhistory negative prices.
• That means Oil producers are paying buyers to take the commodity off their handsover fears that storage capacity could run out in May 2020.
124 | Greek Energy Market Report HAEE 2020

Source: IEA, HAEE’s Analysis
Oil Products Consumption in the EU 28 (thousand tons), [1990-2019]
0
100.000
200.000
300.000
400.000
500.000
600.000
1990
1991
1992
1993
1994
1995
1996
1997
1998
1999
2000
2001
2002
2003
2004
2005
2006
2007
2008
2009
2010
2011
2012
2013
2014
2015
2016
2017
2018
2019e.
Naphtha Motor Gasoline
Jet Kerosene Gas/diesel
Crude Oil/Natural gas liquids Liquified petroleum gases
Other kerosene Fuel Oil
Other Oil Products
Highlights
Oil consumption in the European Union isgrowing at a slower pace, with gas oil and dieseloil representing almost 50% of the consumption
• For decades, crude oil and petroleum products have had the largest share in grossinland energy consumption in the EU-28.
• Despite decreasing production and consumption in the EU in recent years, crude oiland its derived products remain the largest contributors to energy consumption.
• Historically, the major oil imports in Europe come from Russia, Norway, Iraq,Kazakhstan and Saudi Arabia.
• The pandemic has revealed deep-seated structural vulnerabilities in our fossil fuel-dependent economy.
• Under the current conditions it is likely to take more than a year before demand inEurope reaches the pre-pandemic levels.
125 | Greek Energy Market ReportOil & Refining

Source: IEA, HAEE’s analysis
Oil Production - Crude and Other Products Globally (thousand tons), [1990-2019]
Oil Production - Crude and Other Products in the EU 28 (thousand tons), [1990-2019]
0
500000
1000000
1500000
2000000
2500000
3000000
3500000
4000000
4500000
1990
1993
1996
1999
2002
2005
2008
2011
2014
2017
Crude Oil
Natural Gas Liquids
Other Primary Oil
0
20000
40000
60000
80000
100000
120000
140000
160000
180000
1990
1992
1994
1996
1998
2000
2002
2004
2006
2008
2010
2012
2014
2016
2018
Crude Oil
Natural Gas Liquids
Other Primary Oil
• The oil production globally was expected to rise in 2020 but due to the pandemic andaccording to new estimations there will be a decrease of 7.2 mb/day.
• In May 2020, the OPEC+ countries along with the United States have agreed in anunprecedented accord to cut oil production by 12 mb/d.
• The forecast for 2021 production is to expect an increase in production by 1.8 mb/dfrom 2020 levels.
• The production of crude oil at EU level has been decreasing steadily since 2000, toreach less than 70 million tons in 2019.
• The production of crude oil at EU level is expected to decrease further after Brexit,since the UK was the major oil producing country of the Union.
Highlights
World and EU oil production have taken a majorhit from the pandemic since oil demand willstruggle to regain an upward trajectory
126 | Greek Energy Market Report HAEE 2020
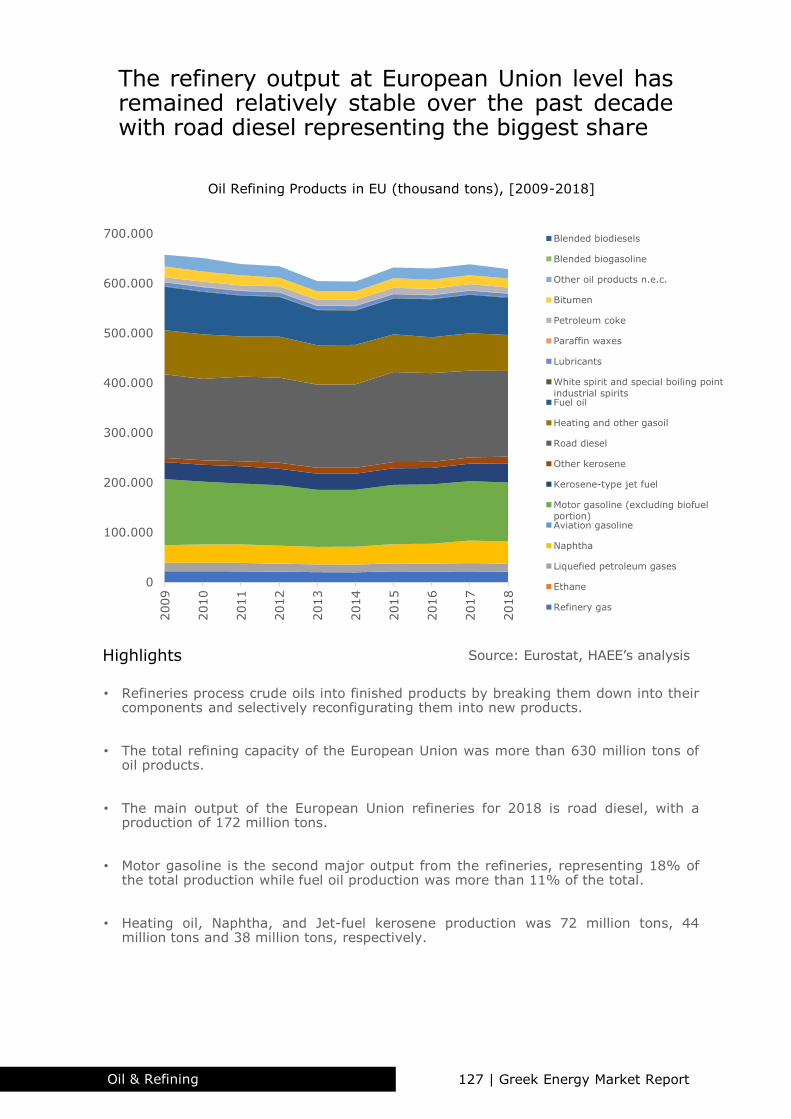
Oil Refining Products in EU (thousand tons), [2009-2018]
Source: Eurostat, HAEE’s analysis
0
100.000
200.000
300.000
400.000
500.000
600.000
700.000
2009
2010
2011
2012
2013
2014
2015
2016
2017
2018
Blended biodiesels
Blended biogasoline
Other oil products n.e.c.
Bitumen
Petroleum coke
Paraffin waxes
Lubricants
White spirit and special boiling point
industrial spiritsFuel oil
Heating and other gasoil
Road diesel
Other kerosene
Kerosene-type jet fuel
Motor gasoline (excluding biofuel
portion)Aviation gasoline
Naphtha
Liquefied petroleum gases
Ethane
Refinery gas
Highlights
• Refineries process crude oils into finished products by breaking them down into theircomponents and selectively reconfigurating them into new products.
• The total refining capacity of the European Union was more than 630 million tons ofoil products.
• The main output of the European Union refineries for 2018 is road diesel, with aproduction of 172 million tons.
• Motor gasoline is the second major output from the refineries, representing 18% ofthe total production while fuel oil production was more than 11% of the total.
• Heating oil, Naphtha, and Jet-fuel kerosene production was 72 million tons, 44million tons and 38 million tons, respectively.
The refinery output at European Union level hasremained relatively stable over the past decadewith road diesel representing the biggest share
127 | Greek Energy Market ReportOil & Refining

Source: Elstat, HAEE’s analysis
Oil Products Consumption in Greece (thousand tons), [2000-2019]
0
2.000
4.000
6.000
8.000
10.000
12.000
2000
2001
2002
2003
2004
2005
2006
2007
2008
2009
2010
2011
2012
2013
2014
2015
2016
2017
2018
2019
Super Unleaded
Super Unleaded 98/100 Heating Oil
Diesel Oil Low Sulphur Fuel
High Sulphur Fuel Liqiud Petroleum Gas (LPG)
Oil consumption in Greece is showing a slightupward trend, after a steep fall during the firstfour years of the economic crisis
Highlights
• The financial crisis has totally changed the shape of the oil consumption in Greece,with a decline in consumption of 35% from 2009 to 2013.
• The consumption is picking up the last years to reach slightly more than 7.2 billiontonnes in 2019.
• Diesel has taken the lead from unleaded as the most consumed oil product over thepast years, representing almost 37% of the total consumption.
• Unleaded consumption corresponds to 27%. The demand for heating oil is still verylow compared to the pre-crisis level, demonstrating the shift to alternative fuels.
• Finally another result of the crisis is the increase of LPG use as a transport fuel. In2011 LPG consumption was practically zero, but in 2019 consumption made 9%.
128 | Greek Energy Market Report HAEE 2020

Oil Market
License Type:A. Oil Products
Trade LicenseB. Naval Fuel
Trade LicenseC. Jet Fuel Trade
LicenseD. LPG Trade
LicenseE. Bitumen Trade
License
License Type:A. Liquid Fuel
Station Operation License
B. LPG Station Operation License
C. Heating Oil Trade License
D. LPG Distribution License
Oil RefiningWholesale
Market
Retail Market
Domestic Oil Market Structure
Source: HAEE’s analysis
The Greek domestic Oil market consists of threedifferent sectors and is dominated by tworefining companies
• The Oil Refining sector consists of 4 refineries, which are owned by two differentcompanies, HELPE and Motor Oil.
• The whole Greek Oil market is principally served by these two refining companies andtheir subsidiaries in the wholesale and retail markets.
• In the wholesale petroleum sector, over 53 companies operate, holding 80 licenses,with HELPE currently holding a wholesale market share of about 65%.
• Regarding the retail market, HELPE merged its two retail companies in 2016 into onecompany which accounts for over 30% of the market.
• Motor Oil’s subsidiary (Avin Oil) alongside the Shell network (which is owned byMotor Oil) account for another 32% of the total retail market.
Highlights
129 | Greek Energy Market ReportOil & Refining

Crude Oil Production Greece (thousand tons), [2010-2019]
Total Refining Sales, (million €), [2019]
Source: Eurostat ,HELPE, Motor Oil, HAEE’s analysis
0
500
1000
1500
2000
2500
3000
3500
4000
4500
5000
Domestic
Sales
Exports Aviation &
Bunkering
Sales
HELPE SA MOTOR OIL SA
0
50
100
150
200
250
2010
2011
2012
2013
2014
2015
2016
2017
2018
2019
Greece’s Oil production is small, yet its refiningcapacity is substantial, adding extra value to thecountry’s economy
Highlights
• Private company Energean Oil & Gas SA is the country’s current only crude oilproducer. The producing offshore fields, are located in the North Aegean Sea.
• Domestic crude oil production was less than 200 thousand tons in 2019, which isexpected to be even lower in 2020, as a result of low crude prices by the COVID-19.
• Three refineries are owned by HELPE and are situated in Aspropyrgos, Elefsina, andThesalloniki. These refineries account for almost 2/3 of Greece’s refining capacity.
• The fourth refinery is owned by Motor Oil, covers rest of the capacity and is locatedin Agioi Theothoroi, near Korinthos.
• The Greek refineries offer a wide range of products serving domestic andinternational market with sales of over 15 billion € in 2019.
130 | Greek Energy Market Report HAEE 2020
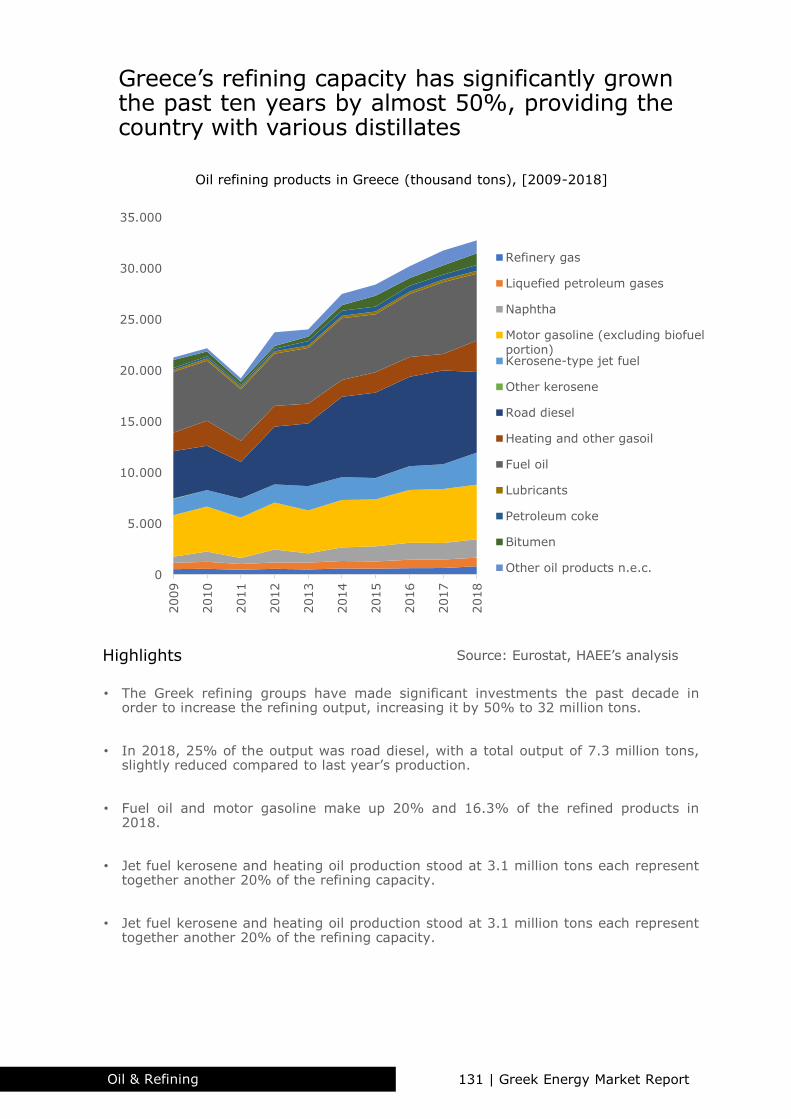
Source: Eurostat, HAEE’s analysis
0
5.000
10.000
15.000
20.000
25.000
30.000
35.000
2009
2010
2011
2012
2013
2014
2015
2016
2017
2018
Refinery gas
Liquefied petroleum gases
Naphtha
Motor gasoline (excluding biofuel
portion)Kerosene-type jet fuel
Other kerosene
Road diesel
Heating and other gasoil
Fuel oil
Lubricants
Petroleum coke
Bitumen
Other oil products n.e.c.
Oil refining products in Greece (thousand tons), [2009-2018]
Greece’s refining capacity has significantly grownthe past ten years by almost 50%, providing thecountry with various distillates
Highlights
• The Greek refining groups have made significant investments the past decade inorder to increase the refining output, increasing it by 50% to 32 million tons.
• In 2018, 25% of the output was road diesel, with a total output of 7.3 million tons,slightly reduced compared to last year’s production.
• Fuel oil and motor gasoline make up 20% and 16.3% of the refined products in2018.
• Jet fuel kerosene and heating oil production stood at 3.1 million tons each representtogether another 20% of the refining capacity.
• Jet fuel kerosene and heating oil production stood at 3.1 million tons each representtogether another 20% of the refining capacity.
131 | Greek Energy Market ReportOil & Refining
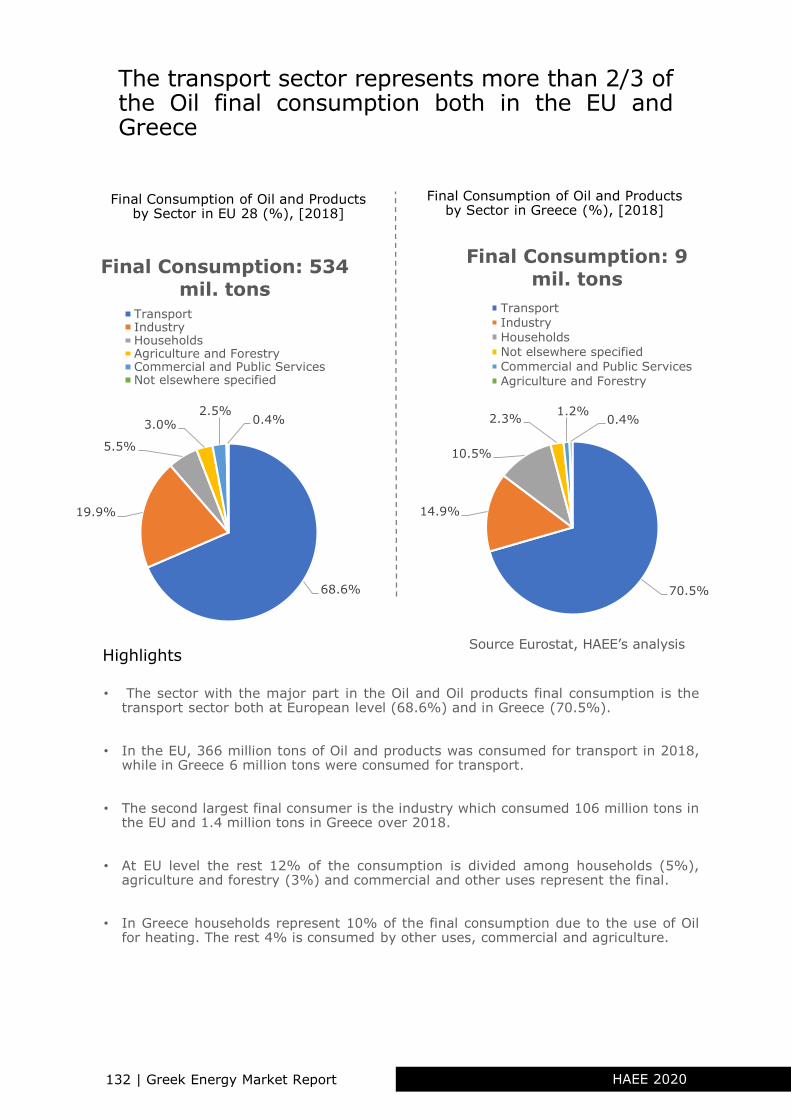
Source Eurostat, HAEE’s analysis
Final Consumption of Oil and Products by Sector in EU 28 (%), [2018]
Final Consumption of Oil and Products by Sector in Greece (%), [2018]
68.6%
19.9%
5.5%
3.0%2.5%
0.4%
Final Consumption: 534 mil. tons
TransportIndustryHouseholdsAgriculture and ForestryCommercial and Public ServicesNot elsewhere specified
70.5%
14.9%
10.5%
2.3%1.2%
0.4%
Final Consumption: 9 mil. tons
Transport
Industry
Households
Not elsewhere specified
Commercial and Public Services
Agriculture and Forestry
The transport sector represents more than 2/3 ofthe Oil final consumption both in the EU andGreece
Highlights
• The sector with the major part in the Oil and Oil products final consumption is thetransport sector both at European level (68.6%) and in Greece (70.5%).
• In the EU, 366 million tons of Oil and products was consumed for transport in 2018,while in Greece 6 million tons were consumed for transport.
• The second largest final consumer is the industry which consumed 106 million tons inthe EU and 1.4 million tons in Greece over 2018.
• At EU level the rest 12% of the consumption is divided among households (5%),agriculture and forestry (3%) and commercial and other uses represent the final.
• In Greece households represent 10% of the final consumption due to the use of Oilfor heating. The rest 4% is consumed by other uses, commercial and agriculture.
132 | Greek Energy Market Report HAEE 2020
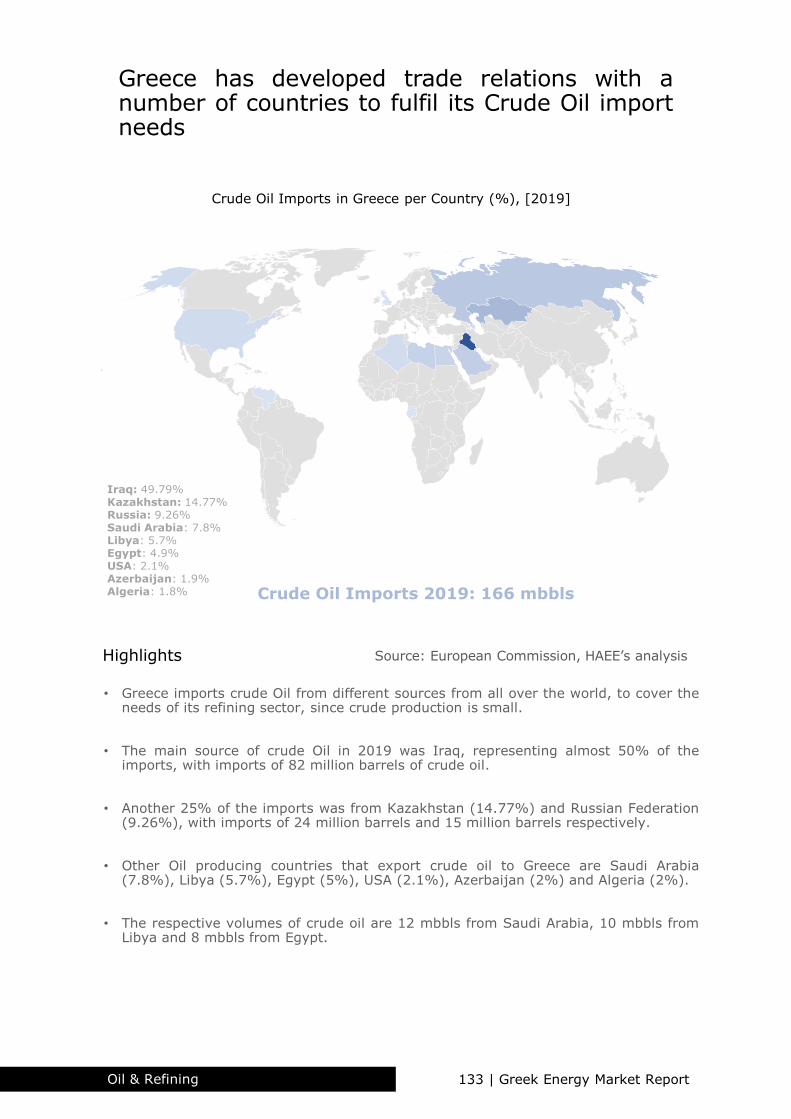
Source: European Commission, HAEE’s analysis
Crude Oil Imports in Greece per Country (%), [2019]
Crude Oil Imports 2019: 166 mbbls
Highlights
Greece has developed trade relations with anumber of countries to fulfil its Crude Oil importneeds
Iraq: 49.79%Kazakhstan: 14.77% Russia: 9.26%Saudi Arabia: 7.8%Libya: 5.7%Egypt: 4.9%USA: 2.1%Azerbaijan: 1.9%Algeria: 1.8%
• Greece imports crude Oil from different sources from all over the world, to cover theneeds of its refining sector, since crude production is small.
• The main source of crude Oil in 2019 was Iraq, representing almost 50% of theimports, with imports of 82 million barrels of crude oil.
• Another 25% of the imports was from Kazakhstan (14.77%) and Russian Federation(9.26%), with imports of 24 million barrels and 15 million barrels respectively.
• Other Oil producing countries that export crude oil to Greece are Saudi Arabia(7.8%), Libya (5.7%), Egypt (5%), USA (2.1%), Azerbaijan (2%) and Algeria (2%).
• The respective volumes of crude oil are 12 mbbls from Saudi Arabia, 10 mbbls fromLibya and 8 mbbls from Egypt.
133 | Greek Energy Market ReportOil & Refining

Source: Eurostat, HAEE’s analysis
Crude Oil Exports (thousand tons), [1990-2019]
Crude Oil Imports (thousand tons), [1990-2019]
400.000
450.000
500.000
550.000
600.000
650.000
0
5.000
10.000
15.000
20.000
25.000
30.000
1990
1992
1994
1996
1998
2000
2002
2004
2006
2008
2010
2012
2014
2016
2018
Greece
EU 28
0
20.000
40.000
60.000
80.000
100.000
120.000
-200
0
200
400
600
800
1.000
1.200
1.400
1990
1992
1994
1996
1998
2000
2002
2004
2006
2008
2010
2012
2014
2016
2018
Greece
EU 28
Although the transition to alternative sources ofenergy has started, dependency on imports ofCrude Oil and Petroleum Products remains high
Highlights
• Crude oil exports are declining at EU level since 2000 reaching in 2019 only 45million tons, a slight pick up from 36 million tons in 2015.
• In Greece a similar trend is observed with a pickup of crude oil exports in 2003 onlyto reach 240 thousand tons of crude oil exports in 2019.
• The EU crude oil imports are also in a downward trend since the mid 00s, standing at550 billion tons in 2019, while fifteen years ago the volume was 610 billion.
• On the contrary crude oil imports in Greece have risen by 20% since 2011 to reachalmost 23 million tons in 2019.
• Russian oil exports to Europe are set to hit their lowest levels in two decades in July2020, with an output cut deal prompting other suppliers to fill the gap left.
134 | Greek Energy Market Report HAEE 2020

Source: European Commission, HAEE’s analysis
Retail Prices of Petroleum Products (€/litre), [2005-2020]
0.70
0.90
1.10
1.30
1.50
1.70
1.90
2005
2006
2007
2008
2009
2010
2011
2012
2013
2014
2015
2016
2017
2018
2019
2020
Unleaded 95
GR
EU 0.70
0.90
1.10
1.30
1.50
1.70
2005
2006
2007
2008
2009
2010
2011
2012
2013
2014
2015
2016
2017
2018
2019
2020
Diesel Oil
GREU
40%
45%
50%
55%
60%
65%
70%
2005
2006
2007
2008
2009
2010
2011
2012
2013
2014
2015
2016
2017
2018
2019
2020
Unleaded 95
Greece
EU35%
40%
45%
50%
55%
60%
65%2005
2006
2007
2008
2009
2010
2011
2012
2013
2014
2015
2016
2017
2018
2019
2020
Diesel Oil
GreeceEU
Retail prices of Unleaded and Diesel Oil areburdened by significant taxes both in Greece andin the European Union
Highlights
Taxes as Share of the Final Price (%), [2005-2020]
• Since 2010 the retail price of Unleaded in Greece is higher than the average EUprice, as a result of a tax increase due to the financial crisis of 2009.
• The unleaded average price in 2019 in Greece was 1,586 €/litre, when the averageprice a decade ago was less than 1 €/litre. In 2019 the EU price was 1,416 €/litre.
• The tax burden for unleaded in 2019 in Greece was close to 65% of the final retailprice while at EU level it stood lower at 60%.
• As far as diesel oil is concerned the average price in Greece and the EU are quiteclose, with the price in Greece settling at 1,380 €/litre and 1,336 €/litre in the EU.
• Taxes on diesel consumption are significantly higher in the EU than Greece,representing 55% for the EU price and 50% for the Greek price in 2019.
135 | Greek Energy Market ReportOil & Refining

Retail Prices of Petroleum Products (€/litre), [2005-2020]
0.40
0.60
0.80
1.00
1.20
1.40
2005
2006
2007
2008
2009
2010
2011
2012
2013
2014
2015
2016
2017
2018
2019
2020
Heating Oil GR
EU
0.20
0.40
0.60
0.80
2005
2006
2007
2008
2009
2010
2011
2012
2013
2014
2015
2016
2017
2018
2019
2020
Fuel Oil GREU
0%
5%
10%
15%
2005
2006
2007
2008
2009
2010
2011
2012
2013
2014
2015
2016
2017
2018
2019
2020
Fuel Oil Greece
EU
20%
30%
40%
50%
2005
2006
2007
2008
2009
2010
2011
2012
2013
2014
2015
2016
2017
2018
2019
2020
Heating Oil Greece
EU
Highlights
Taxes as Share of the Final Price (%), [2005-2020]
• Heating oil prices discrepancy between the EU average and Greece as a result of theincreased taxes imposed by the Greek Governments due to the 2009 crisis.
• Greek consumers payed on average 25% more for Heating Oil than the EU average.The price in Greece for Heating Oil was around 1 €/litre in 2019.
• The taxes imposed in Greece for the consumption of Heating Oil consumption are60% higher than the EU average for 2019.
• Fuel Oil prices are lower in Greece than the EU average by almost 15%, settling 2019at 0,496 €/litre in Greece while the EU prices was 0,561 €/litre.
• Taxes on Fuel Oil remain both in Greece and the European Union well below 15% ofthe final price.
After the 2009 financial crisis, Heating Oil pricegap between Greece and the EU increased, whilethe prices of Fuel Oil remained lower in Greece
Source: European Commission, HAEE’s analysis
136 | Greek Energy Market Report HAEE 2020

Retail Prices of Petroleum Products in Greece (€/litre), [2019-2020]
Share of Taxes in Retail Prices of Petroleum Products in Greece (%), [2019-2020]
Highlights
0.6
0.8
1
1.2
1.4
1.6
1.8
Jan-1
9
Feb-1
9
Mar-
19
Apr-
19
May-1
9
Jun-1
9
Jul-
19
Aug-1
9
Sep-1
9
Oct-
19
Nov-1
9
Dec-1
9
Jan-2
0
Feb-2
0
Mar-
20
Apr-
20
May-2
0
Jun-2
0
Unleaded 95 Diesel Oil
45
50
55
60
65
70
75
Jan-1
9
Feb-1
9
Mar-
19
Apr-
19
May-1
9
Jun-1
9
Jul-
19
Aug-1
9
Sep-1
9
Oct-
19
Nov-1
9
Dec-1
9
Jan-2
0
Feb-2
0
Mar-
20
Apr-
20
May-2
0
Jun-2
0
Unleaded 95 Diesel Oil
• As a result of the COVID-19 pandemic the retail prices of oil products have collapsedin March, April and May of 2020.
• In April 2020 the retail price of Unleaded was 1,3 €/litre when in April 2019 the pricewas 1,6 €/litre. More than 72% of the unleaded price in April were taxes.
• The price of diesel in April was 1,097 €/litre when the February 2020 price was 1,352€/litre. The taxes in April and May represented more than 55% of the price.
• The low prices of heating Oil led to the extension of its distribution from April 31st toMay 15th. The price of heating Oil in May 2020 was less than 0.75 €/litre.
• The gradual relaxing of the containment measures led to a slight increase in theprices in June 2020.
Source: European Commission, HAEE’s analysis
The impact of COVID–19 was evident in theretail prices of Oil Products in March-May 2020,with a reduction of almost 30%
137 | Greek Energy Market ReportOil & Refining

Grading of RES indicators (max:100) [2017]
Source: HHRM, HAEE’s analysis
Exploration and Discovery, [March 2019]
Highlights
• The output of Prinos turned loss-making long before the slump in Oil rates, forcingEnergean, the developer of the Oil field, to slash its investment program.
• Since Oil prices plummeted, Energean informed the government that production willcease without funding, as it cannot continue to keep operating at a loss.
• The outcome will depend on the answer the government gives to the dilemma overwhether or not the state participates in Prinos Oil extraction.
• Apart from COVID-19 developments, a number of new Oil exploration blocks couldlead to further investment and increased domestic production.
• Nevertheless, the confidence shown by investors in the Greek economy could be animportant catalyst for further investment in the energy sector and beyond.
Crude Oil Production in Greece(k barrels per day), [2019 -2020]
0
0.5
1
1.5
2
2.5
3
3.5
4
4.5
5
Apr-
19
May-1
9
Jun-1
9
Jul-
19
Aug-1
9
Sep-1
9
Oct-
19
Nov-1
9
Dec-1
9
Jan-2
0
Feb-2
0
Mar-
20
Apr-
20
In February and April 2020, production of crudeoil in Greece was zero barrels per day from 2.3thousands barrels per day in February 2019
138 | Greek Energy Market Report HAEE 2020

Refining Efficiency Increase CCS/
CCU* ‘Green’
HydrogenFuel
QualitySustainable
BiofuelsAdvanced Biofuels RES
utilization for biofuel production
Reduction of CO2 in refining process
Increase of oil substitution from new feedstock
Source: Fuels Europe, HAEE’s analysis
Tota
l Carb
on R
eduction
*CCS: Carbon Capture and StorageCCU: Carbon Capture and Utilization
Available and Proposed Technologies for Carbon Reduction
Available technology
New/ Under discussion technology
Highlights
• The refining system is expected to play a vital role in the transition to the low carboneconomy as the global demand for liquid hydrocarbons will continue to grow.
• Refining industries are required to develop new business plans and evolve in order togradually reduce the liquid hydrocarbon CO2 emissions.
• This can be achieved by the utilization of alternative raw material mixes (such asbiomass, waste and captured CO2) in a very efficient manner.
• This evolution of the refining sector could be divided in three different steps-phases:Early stage, Evolution stage and Future stage.
• In the Future stage, refineries are estimated to become efficient manufacturingcenters, processing a variety of feedstocks and products.
Refining sector is expected to evolve in a waythat mitigates climate change by adopting newlow-carbon technologies in the following years
139 | Greek Energy Market ReportOil & Refining

Future Refinery Conceptual Overview
Source: Fuels Europe, HAEE analysis
Crude Oil
Biomass
CO2
Waste
Renewable Electricity
Green Hydrogen
Low GHG products
Low GHG fuels
Residual Heat
Sustainable Biofuel
Low GHG products
Low GHG fuels
Low GHG petrochemical feedstock
CCS/CCU
Future refineries are expected to become hubsfor the production and distribution of low-emission products and raw materials
Highlights
• Refineries will find ways to reduce CO2 emissions through a combination ofoperational measures and targeted investments.
• Low-grade heat resulting from refinery operations could be used to produceelectricity for both internal and external consumption.
• The extension of heat-pump technology to achieve higher temperatures andalternatives to electric power could also be a point for development.
• Closer integration with other industries such as petrochemicals, which are oftenlocated within the same industrial hub, could also be pursued.
• The development of alternative fuels for production and for distribution is also anarea of high interest for companies active in Oil and refining industry.
140 | Greek Energy Market Report HAEE 2020

8. Energy Efficiency
141 | Greek Energy Market ReportHAEE 2020

Highlights
39% of industry’s
energy consumption stems from electricity
39% of energy is
consumed by transport sector
Energy productivity
in Greece is 10%
less than EU-27
Oil represents 53%
of the Greek energyconsumption
Households energy consumption has
decreased by 12%
over the last years
17% is the energy
efficiency index fortransportation
European energyefficiency target for 2030 will be revised after Brexit
RES and biofuels are
used 34% more
today compared to the previous decade
The recovery of the Greek economy should be accompanied by decreased energy consumption and increased Energy Efficiency
142 | Greek Energy Market Report HAEE 2020

Overview
The global decline in energy efficiency underlines the necessity for additionalpolicies that will reverse the prevailing trend and simultaneously boost economicgrowth. In this direction, Europe introduced specific targets for energy efficiency tomitigate climate change and ensure efficiency in energy markets. Brexit will causereasonable adjustments to those targets which refer to 2030 and 2050.
The European Commission's plan includes austere fiscal and monetary policiesnamely green bonds, efficient public and private buildings, and eco-mobility,amongst others. Hence, it aims at increasing energy productivity, dropping theunits of energy used per unit of GDP and thus increasing energy efficiency.
Greece, as a member of the European Union, has managed to attain thecorresponding energy efficiency target concerning energy consumption.Nevertheless, the reduction of energy consumption does not imply efficiency. Theprimary cause of energy reduction is the European debt crisis which reduced theaggregate demand for energy rather than the establishment of energy-efficientpolicies.
On the other hand, Greek performance on energy efficiency indicators attests twonotable outcomes. Firstly, it has adopted a series of energy-efficient policies as anEU-28 member, and thus it has managed to increase efficiency. Secondly, theGreek energy performance is considerably weak compared to the rest of Europeancountries and hence, should initially exploit the totality of EU tools for energyefficiency and then implement further policies at a national level.
Decomposing the Greek economy into sectors, transportation constitutes the mostenergy-consuming one, which is responsible for 39% of the overall energyconsumption. Industry accounts for 18%, households for 26% and services for14%. In terms of fuels, the Greek economy is based solely on oil & petroleumproducts, while efforts have been made for the reduction of oil share in totalenergy consumption.
Furthermore, electricity which is used intensively in the industry sector, possessthe second-highest share in total energy consumption. The effect of renewables onthe Greek economy has been more conspicuous during the recent years, while thenatural gas which is considered as the transition fuel, is expected to grow its sharein the upcoming years.
Last but not least, COVID-19 is probable to cause a severe world recession whichwill question the ability of Greece to immediately respond to it in a national level,which means that shortly energy efficiency may be considered as a secondaryissue. However, climate change remains a priority and to cope with it, COVID-19has taught us some very important tutoring, such as that we are all vulnerable toglobal crises, we should trust the experts and act immediately.
143 | Greek Energy Market ReportEnergy Efficiency

Final Energy Consumption for EU-28 and the Corresponding Target for 2020 (Mtoe), [1990-2018]
Source: Eurostat, HAEE’s analysis
Final Energy Consumption for EU-27 and the Corresponding Target for 2030 (Mtoe), [1990-2018]
1000
1050
1100
1150
1200
1990
1991
1992
1993
1994
1995
1996
1997
1998
1999
2000
2001
2002
2003
2004
2005
2006
2007
2008
2009
2010
2011
2012
2013
2014
2015
2016
2017
2018
Final Energy Consumption before Brexit EU target for 2020
600
700
800
900
1000
1990
1991
1992
1993
1994
1995
1996
1997
1998
1999
2000
2001
2002
2003
2004
2005
2006
2007
2008
2009
2010
2011
2012
2013
2014
2015
2016
2017
2018
Final Energy Consumption after Brexit EU target for 2030 (before Brexit)
Possible EU target for 2030 (after Brexit)
• The EU-28 has introduced a maximum bound for final energy consumption at 1.086Mtoe for 2020, a target that can be partially achieved due to the recent recession.
• The corresponding target for 2030 is at the level of 956 Mtoe, but it will downwardadjust after Brexit.
• Each European country is obligated to conduct a national energy plan to accomplishthe efficiency target set by the European Union for 2030.
• Another target revision will be made in 2023 following observation of the EnergyEfficiency performance of European countries.
• EU has primarily used fiscal policy to mitigate climate change, but the role ofmonetary policy will be more prominent in the achievement of the 2030 target.
Highlights
European Union needs further environmentalpolicies and guidelines to meet 2030 energyefficiency targets
144 | Greek Energy Market Report HAEE 2020

Energy Productivity for EU-28, EU-27 & Greece (€/Mtoe), [2000-2018]
Source: Eurostat, HAEE’s analysis
• Energy Efficiency can be spuriously increased when the aggregate economic outputdeclines and thus generates a decrease in the level of energy used for that output.
• Consequently, high energy productivity secures that a decrease in energy usage isassociated with expanding growth rates.
• Energy productivity improved by 22% during the previous decade in Greece, butthenceforth Greek productivity is inferior to the European Union’s average.
• EU-28 and EU-27 have increased energy productivity by 35% and 27% in 2018,reaching 8.5 and 8.1 €/Mtoe respectively.
• Despite the sanitary and financial measures against it, COVID-19 has already causedanother lasting crisis and thus the role of energy productivity becomes essential.
Highlights
6.2 6.3
6.8
7.7 7.8 7.9 8
.1
6.3 6
.5
7.1
8.1 8.2 8.3 8
.5
6.0
6.8
7.3
7.1 7.3
7.1 7
.3
2000 2005 2010 2015 2016 2017 2018
EU-27 EU-28 Greece
Energy productivity is a pivotal factor whichensures that economic growth aligns with energyefficiency
145 | Greek Energy Market ReportEnergy Efficiency

GDP per Capita (constant 2010 US$) & Primary energy Consumption (toe) in Greece, [2000-2018]
Source: World Bank, Eurostat, HAEE’s analysis
0
5
10
15
20
25
30
0
5000
10000
15000
20000
25000
30000
2000
2001
2002
2003
2004
2005
2006
2007
2008
2009
2010
2011
2012
2013
2014
2015
2016
2017
2018
GDP per capita (US$) Primary Energy Consumption (toe)
• Energy efficiency analysis can be decomposed into the trends of GDP per capita andfinal (or primary) energy consumption.
• GDP per capita continues to follow an upward trend in the Greek economy reaching23.558 US$ in 2018 (constant 2010) whereas energy consumption contracts.
• Particularly, GDP has increased by 6% from 2012 to 2018 while primary energyconsumption decreased by 15%, indicating evidence of energy efficiency.
• Nevertheless, Greece must follow the National Plan for Energy and Climate whichincludes aggressive actions for the completion of the 2030 energy efficiency targets.
• The revised Plan takes into account the diversification of fuels that contribute toGreek energy consumption and additionally, the peculiarities of the Greek market.
Highlights
The recovery of the Greek economy isaccompanied by decreased energy consumptionand increased Energy Efficiency
146 | Greek Energy Market Report HAEE 2020

Source: Eurostat, HAEE’s analysis
Final Energy Consumption by Fuel (toe) [2007-2018]
Final Energy Consumption by Sector (%) [2007-2018]
0 10000 20000
2007
2008
2009
2010
2011
2012
2013
2014
2015
2016
2017
2018
Electricity
Natural Gas
Solid Fossil Fuels
Oil & petroleum products
Renewables & Biofuels
Other
0% 20% 40% 60% 80% 100%
2007
2009
2011
2013
2015
2017
Industry
Transport
Households
Commercial and Public Services
Other
• The intensity of oil and petroleum products on Greek energy consumption has beendecreased the last decade but remains the fuel with the highest share.
• The share of electricity is approximately constant (28% in 2018), while theexploitation of renewables and biofuels has been enlarged (11% in 2018).
• The role of Natural Gas is crucial for the energy transition and cannot be neglected,albeit it has been decreased by 23% from 2016 to 2018 in the Greek economy.
• In terms of economic activity, the shares of sectors remain almost steady throughoutthis decade with transportation to lead the consumption of energy.
• On a decade average, industry utilizes 19% of the national energy, while the sharesof transportation, households and services are 38%, 27% and 12% respectively.
Highlights
Oil and Petroleum products dominate theGreek fuels while transport is the sectordriving the energy consumption
147 | Greek Energy Market ReportEnergy Efficiency

Source: Eurostat, HAEE’s analysis
Fuels Contribution to the Final Energy Consumption of Transportation (%), [2018]
Final energy consumption of transportation sector (toe), [2007-2018]
7746.28278.1
5903.9
4000
5000
6000
7000
8000
9000
2007 2008 2009 2010 2011 2012 2013 2014 2015 2016 2017 2018
18%
14%
26%
3%3%4%
16%
17%
39%
Industry
Commercial & Public Services
Households
Other
Liquefied petroleum gases &
blended biodieselsElectricity, Natural Gas,
Kerosene-type jet fuel & fuel OilMotor gasoline
Gas oil and diesel oil
• The final energy consumption of transport was 5.904 toe in 2018 (39%), butdifferent fuels contribute disproportionately to this aggregate amount.
• Gas oil and diesel oil used in transportation account for 42% of the transport energyconsumption and 17% of the total energy utilized, which translates to 2.504 toe.
• Another principal fuel utilized in transportation is the motor gasoline which isresponsible for 16% of the entire energy consumption.
• The notable shares of those fuels highlight the need of eco-mobility since they areprimarily used in road transportation.
• Finally, the Greek crisis in 2009-2012 led to a 33% decrease in energy used intransportation, while hereafter a slightly increasing trend prevails.
Highlights
Gas oil, diesel oil and motor gasoline are theprevailing fuels in transportation, representing33% of final consumption in transportation
148 | Greek Energy Market Report HAEE 2020

Source: Eurostat, HAEE’s analysis
Fuels Contribution to the Final Energy Consumption of Industry (%), [2018]
Final Energy Consumption of Industry Sector (toe),
[2007-2018]
2000
2500
3000
3500
4000
4500
5000
2007
2008
2009
2010
2011
2012
2013
2014
2015
2016
2017
2018
39%
14%
26%3%
1%
2%
2%
6%7%
18%
TransportCommercial & Public ServicesHouseholdsOtherRenewables and BiofuelsSolid Fossil FuelsNatural GasPetroleum & Oil ProductsElectricity
• Some fuels supply more than others to the energy consumption of industry, namelypetroleum products and electricity constitute the dominant energy sources.
• Specifically, electricity is responsible for 39% of the energy utilized in the industrysector and 7% of the total energy consumption, which is equivalent to 1.067 toe.
• The % of petroleum & oil products in overall energy usage is notable (6%), as well asthe share of this fuel in the energy consumption of the industry sector (34%).
• Natural Gas, solid fossil fuels, Renewables and biofuels are the remaining crucialsources of energy consumption of the industry sector.
• Moreover, the final energy used in the industry sector follows a downward trendsince the Greek crisis in 2008 and onwards.
Highlights
Electricity, Petroleum and Oil Products dominatethe fuels market while energy consumption ofindustrial sector has shrinked by 40% since 2007
149 | Greek Energy Market ReportEnergy Efficiency
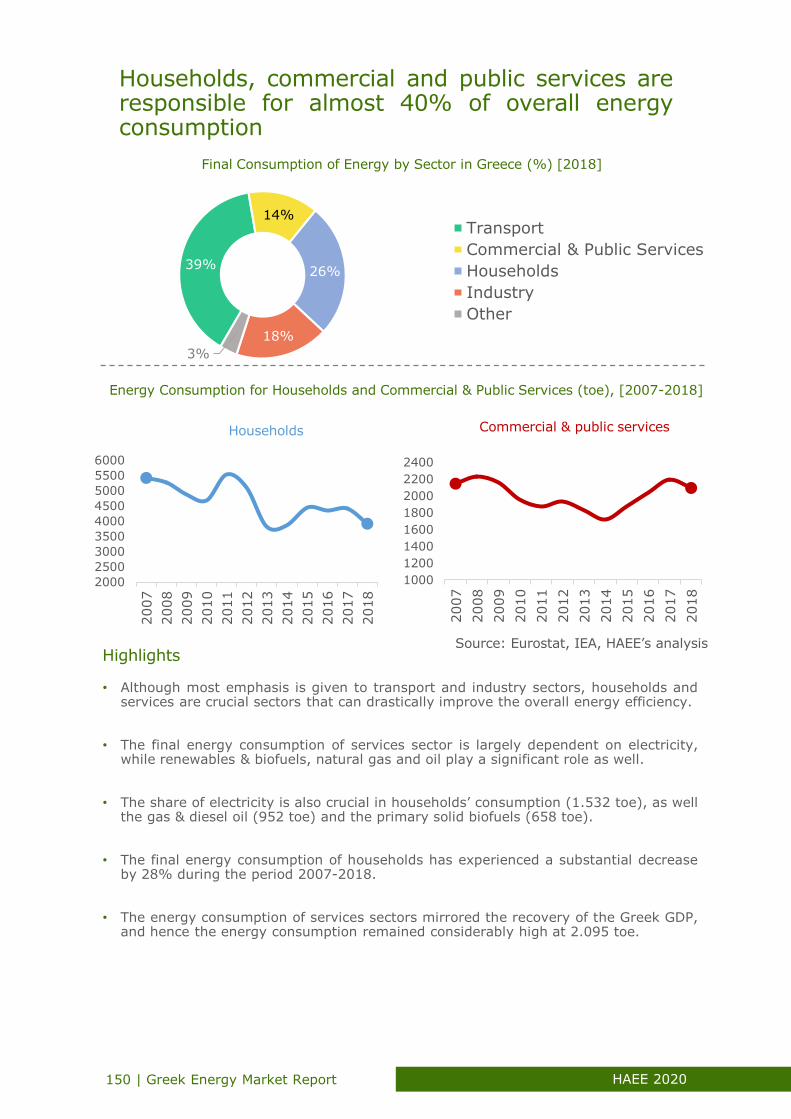
Source: Eurostat, IEA, HAEE’s analysis
Final Consumption of Energy by Sector in Greece (%) [2018]
Energy Consumption for Households and Commercial & Public Services (toe), [2007-2018]
Commercial & public services
1000
1200
1400
1600
1800
2000
2200
24002007
2008
2009
2010
2011
2012
2013
2014
2015
2016
2017
2018
2000
2500
3000
3500
4000
4500
5000
5500
6000
2007
2008
2009
2010
2011
2012
2013
2014
2015
2016
2017
2018
39%
14%
26%
18%
3%
Transport
Commercial & Public Services
Households
Industry
Other
Households
• Although most emphasis is given to transport and industry sectors, households andservices are crucial sectors that can drastically improve the overall energy efficiency.
• The final energy consumption of services sector is largely dependent on electricity,while renewables & biofuels, natural gas and oil play a significant role as well.
• The share of electricity is also crucial in households’ consumption (1.532 toe), as wellthe gas & diesel oil (952 toe) and the primary solid biofuels (658 toe).
• The final energy consumption of households has experienced a substantial decreaseby 28% during the period 2007-2018.
• The energy consumption of services sectors mirrored the recovery of the Greek GDP,and hence the energy consumption remained considerably high at 2.095 toe.
Highlights
Households, commercial and public services areresponsible for almost 40% of overall energyconsumption
150 | Greek Energy Market Report HAEE 2020

Source: IEA, HAEE’s analysis
Residential Energy Intensity (GJ/m2) [2000-2015]
4
5
6
7
8
9
2000
2001
2002
2003
2004
2005
2006
2007
2008
2009
2010
2011
2012
2013
2014
2015
2016
2017
Manufacturing Energy Intensity (MJ/USD PPP 2010) [2000-2017]
0.2
0.3
0.4
0.5
0.6
0.7
0.8
2000
2001
2002
2003
2004
2005
2006
2007
2008
2009
2010
2011
2012
2013
2014
2015
0.25
0.3
0.35
0.4
0.452000
2001
2002
2003
2004
2005
2006
2007
2008
2009
2010
2011
2012
2013
2014
2015
Services Energy Intensity (MJ/USD PPP 2010) [2000-2015]
0.750.850.951.051.151.251.351.451.551.65
2000
2001
2002
2003
2004
2005
2006
2007
2008
2009
2010
2011
2012
2013
2014
2015
Passenger Transport Energy Intensity (MJ/pkm) [2000-2015]
Energy Intensity by Sector
• Energy-efficient policies should aim at the entirety of the economy, but every sectorreacts differently depending on its particular characteristics.
• Energy intensity of transportation has undergone the largest percentage decline(46%) among all economic sectors, through the period 2000-2015.
• In the same time period, residential energy intensity reduced by 22%, reaching thevalue of 0,47 GJ per 𝑚2 in 2015.
• Manufacturing energy intensity has undergone several fluctuations during 2000-2017, succeeding to reduce energy dependence by 2 MJ/$.
• The upward trend of energy intensity in the services sector, questioning the currentenergy effectiveness and calls for further action in this sector.
Highlights
Energy efficiency significantly varies acrosssectors in the Greek economy, yet a downwardtrend is apparent in all of them
151 | Greek Energy Market ReportEnergy Efficiency

Source: RISE, HAEE’s analysis
Energy Efficiency Indicators for Greece (%)
Carbon Pricing & Monitoring (%) Information Provided to Consumers about Electricity Usage(%)
Energy Labeling Systems (%) Transport (%)
0
10
20
30
40 50 60
70
80
90
100
0
10
20
30
40 50 60
70
80
90
1000
10
20
30
40 50 60
70
80
90
100
0
10
20
30
40 50 60
70
80
90
100
• Greece has accomplished to receive the highest possible score for Carbon Pricing &Monitoring due to the participation in the European Union Emission Trading System.
• The rating for electricity usage information is also satisfactory, but furtherimprovements are possible, e.g. comparison between current and previous bills.
• There is room for improvement in “Energy Labeling Systems” which could have alsoincluded industrial electric motors, other industrial equipment and vehicles.
• Transport indicator is very low due to lack of both a national reporting system forefficiency metrics and a mandate to support the reduction in transport demands.
• Overall, the Greek economy has achieved a sufficient level of energy efficiency, butmore policies needed in-country and international level to meet the current targets.
Highlights
Participation in EU guarantees successfulperformance in a range of efficiency indicators,but further effort is still required
152 | Greek Energy Market Report HAEE 2020

9. Investments
153 | Greek Energy Market ReportHAEE 2020

HighlightsHighlightsHighlights
The total outstanding loans in energy sector stood at €5.2bn in 2020 increasing steadily by
almost 11% sine 2017
The energy sector outperforms in terms of credibility with an annual rate of non performing exposure for 2018 at
3.4%
€1.5 billion of new
investments will be directed towards new interconnections in the Greek islands
The revised National Energy Plan of 2019 is increased by
11.1 billion euros
compared to 2018 projections
reaching the total of 43.8 billion in terms of future energy related investments
Over the upcoming years,
about 8,200 MW of
RES projects or investments equivalent to
8.5 billion euros will
proceed to implementation
For every single euro ofinvestments in RES, another
3 to 8 euros is returned to
the economy, depending on the technology and the local conditions
Due to the COVID-19 crisis, fuel supply investments have been hit hardest in 2020, while utility-scale renewable power has been more resilient
Technology cost of Solar panels, Wind parks and battery storage have declined
by 85%, 49% and 85%
respectively, since 2010
Global new investments in RES for 2019 account for
41% of new investments
in upstream and downstream of Oil and Gas sector
154 | Greek Energy Market Report HAEE 2020
Overview
Current investment trends at a global scale, show the need for bolder decisions
required to make the energy system more sustainable. Energy investments
should satisfy the world’s growing demand for low-carbon technologies to
accelerate the pace of global energy transition. Wind and Solar are anticipated
to represent almost 50% of world electricity in 2050 and help put the power
sector on track for 2 degrees to at least 2030. Specifically, by 2050, Solar and
Wind make up 80% of the energy mix in Europe, 78% in Australia, 55% in
India, 48% in China and 35% in the USA.
Global clean energy investment in 2019 reached 364 billion dollars, growing by
86% compared to a decade ago in 2009. However, no significant annual growth
in new global investments for clean energy recorded in 2019, since the various
renewable energy sources preserved at 2018 levels. The European Union is
leading the way of RES penetration and is actively promoting Europe’s evolution
to a low carbon society and facilitates new investments in the clean energy
transition.
Considering the case of Greece, the ample availability of Renewable Energy
potential show that the country could be a key player in the formulation of the
European Union energy mix. In parallel, the Greek banking system favors to
provide loans on the robust Greek Energy sector, since its non-performing
exposure share is considerably low. In that context, loans towards the Energy
sector rose by 10.7% compared to 2017 levels, despite the huge drop in terms
of total lending. The next day for Greek banking system is to provide a set of
new investment opportunities that could assist win-win potentials in the market.
Currently, borrowing at Corporate level, Project and Acquisition Financing
remain the basic source of funding.
Despite the COVID-19 outbreak, major energy investments have already been
announced which are unaffected by the overall deterioration of economic
activity and at the same time, Greece creates energy investment opportunities
due to the availability of RES potential and the ongoing sizeable infrastructure
projects. Finally, huge investment amounts will be directed towards the support
of Circular Economy, Climate Change and Refining adding €8.5 billion in the
projections included in the revised National Plan for Climate and Energy. The
total projected amount until 2030, equal 43.8 billion euros with RES and Energy
Efficiency representing almost 46% of the total new investments.
155 | Greek Energy Market ReportInvestments

Global Energy Investment (billion $), [2019]
Current investment trends show the need forbolder decisions required to make the energysystem more sustainable
Highlights
311
273
130
39
483
273
139
63
38
9034
0
100
200
300
400
500
600
700
800
Power Sector Oil & Gas Energy Efficiency Coal Supply RES for transport
and heat
Nuclear
RES
Networks
Fossil Fuel
Upstream
Downstream, midstream and refining
Buildings
Transport
Industry
• Energy investment remained at $1.85 trillion in 2018, while a rise in fossil fuel supplyinvestment offset lower power and stable efficiency spend.
• Despite the shift, power was the largest sector for the third year in a row,representing almost 38% of total energy investments.
• The largest investment growth was in the United States, which has been catching upwith China, mainly due to Oil and Gas supply and electricity networks.
• Investment decisions for coal power are down by 80% this decade, but the fleetcontinued to grow in Asia in 2019.
• While energy R&D spending rose modestly in 2019, led by the USA and China, mostcountries are not spending more of their economic output on energy research.
Source: IEA, HAEE’s analysis
156 | Greek Energy Market Report HAEE 2020

152
145
10.3
1.7
1.3
0.7
Wind
Solar
Biomass and Waste
Small Hydro
Geothermal
Bionfuels
Energy investments should satisfy the world’sgrowing demand for low-carbon technologies toaccelerate the pace of global energy transition
Highlights
[-43%]
[-56%]
[-3%]
[+9%]
[-3%]
[+6%]
Global Investment in RES Capacity by Sector & Annual Growth (billion $), [2019]
Source: IEA, HAEE’s analysis
• Renewables investment edged down, as net additions to capacity were flat and costsfell in some technologies, but was also supported by plants under development.
• Lower solar PV investment in China was partly offset by higher renewable spend insome areas such as the United States and developing Asia.
• Adjusting investment to 2018 cost levels shows a rising trend in spending activity forrenewable power, up around 55% since 2010.
• Compared to 2015, investment in renewable power remained relatively stable, but athigh levels, with China being the largest market for energy investments in RES.
• In 2019, renewable spending continued to exceed that for fossil fuel-based power,supported by tendering for solar PV and Wind.
2.7
2.4
5
2.4 2
.85
2.7
5
2.4
2.3
2
1.8
1.7
2010
2011
2012
2013
2014
2015
2016
2017
2018
2019
Average Renewable Power Generation Construction Time
Under Capacity Weighted (years), [2010-2019]
157 | Greek Energy Market ReportInvestments
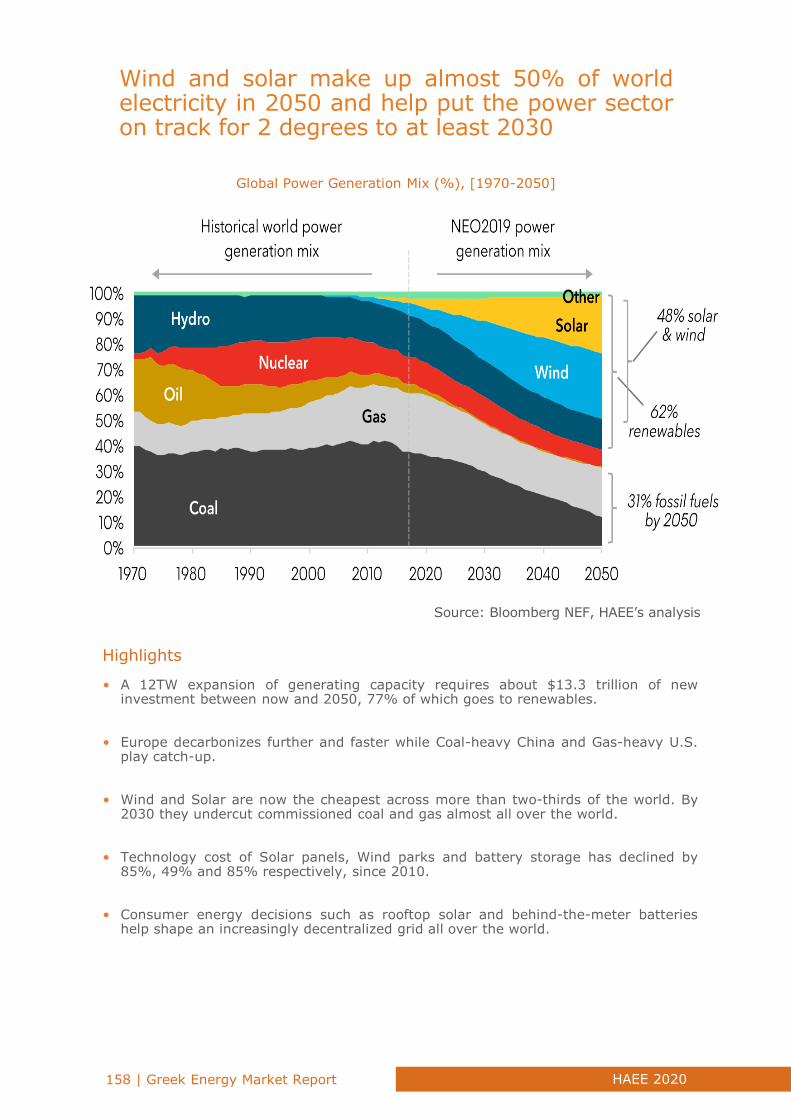
Source: Bloomberg NEF, HAEE’s analysis
Global Power Generation Mix (%), [1970-2050]
• A 12TW expansion of generating capacity requires about $13.3 trillion of newinvestment between now and 2050, 77% of which goes to renewables.
• Europe decarbonizes further and faster while Coal-heavy China and Gas-heavy U.S.play catch-up.
• Wind and Solar are now the cheapest across more than two-thirds of the world. By2030 they undercut commissioned coal and gas almost all over the world.
• Technology cost of Solar panels, Wind parks and battery storage has declined by85%, 49% and 85% respectively, since 2010.
• Consumer energy decisions such as rooftop solar and behind-the-meter batterieshelp shape an increasingly decentralized grid all over the world.
Highlights
Wind and solar make up almost 50% of worldelectricity in 2050 and help put the power sectoron track for 2 degrees to at least 2030
158 | Greek Energy Market Report HAEE 2020

• 2019• 2050
U.S.A10%35%
Europe16%80%
India8%55%
China24%48%
Australia18%78%
Solar and Wind Penetration in the Energy Mix (%), [2019 & 2050]
Source: Bloomberg NEF, HAEE’s analysis
• The U.S electricity system continues to replace aging coal and nuclear with cheaperrenewables and gas, which become the premier source of power generation.
• Cheap renewables, flexible demand and batteries shift the European power systemaway from fossil fuels and nuclear to one built around emission-free energy.
• India’s sustained electricity demand growth drives more than a sixfold increase of thepower system.
• China sees peak coal generation and emissions in 2027, as the world’s biggestelectricity system reaches 37% renewables penetration.
• Australia's power system is on track to become the most decentralized in the world,with consumer PV and behind-the-meter batteries making up 38% of all capacity.
Highlights
By 2050, solar and wind make up 80% of theenergy mix in Europe, 78% in Australia, 55% inIndia, 48% in China and 35% in the USA
159 | Greek Energy Market ReportInvestments

30
94
230
172
47
143
76
88
43
86
87
104
120
323
393
364
0
50
100
150
200
250
300
350
400
450
2006
2007
2008
2009
2010
2011
2012
2013
2014
2015
2016
2017
2018
2019
Asia-Pacific Europe, Middle East & Africa
North, Central and South America Total
Global New Investment in Clean Energy by Region ($bn), [2006-2019]
HighlightsSource: Bloomberg NEF, HAEE’s analysis
• China was yet again the biggest investor in renewables, at $83.4 billion in 2019, butthis was 8% down on 2018 and the lowest since 2013.
• China, saw a 10% rise in wind investment to $55 billion, but solar fell 33% to $25.7billion, less than a third of the boom figure reached in 2017.
• New investments in clean energy in Europe, Middle East & Africa stood at $88 billionin 2019, meaning that no significant acceleration occurred over the past decade.
• On the other hand, the latest data coming from North, Central & South Americareveal a substantial increase, from $88 billion in 2018 to $104 billion in 2019.
• By 2032, there is more Wind and Solar electricity in the world than coal-firedelectricity and by 2050, Coal-fired generation stands at 12% of electricity generation.
Global clean energy investment in 2019 reached364 billion dollars, growing by 86% compared toa decade ago in 2009
160 | Greek Energy Market Report HAEE 2020
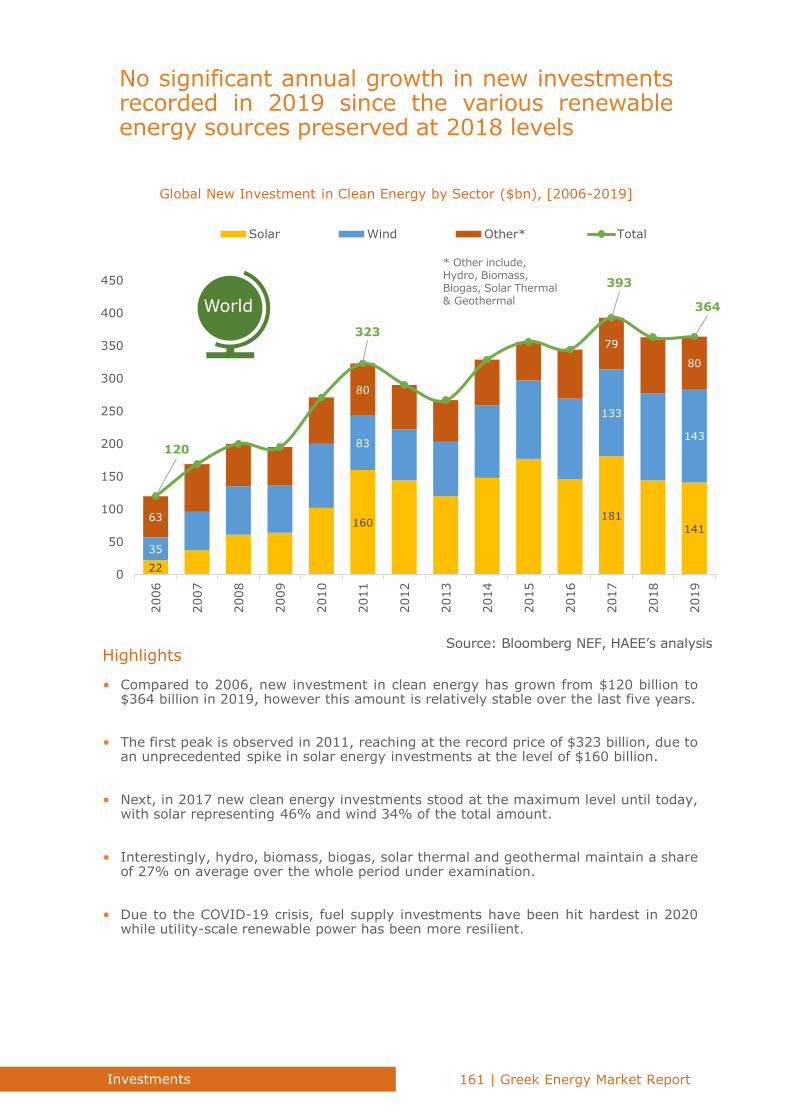
22
160181
141
35
83
133
143
63
80
79
80
120
323
393
364
0
50
100
150
200
250
300
350
400
450
2006
2007
2008
2009
2010
2011
2012
2013
2014
2015
2016
2017
2018
2019
Solar Wind Other* Total
* Other include, Hydro, Biomass, Biogas, Solar Thermal & Geothermal
Global New Investment in Clean Energy by Sector ($bn), [2006-2019]
World
HighlightsSource: Bloomberg NEF, HAEE’s analysis
No significant annual growth in new investmentsrecorded in 2019 since the various renewableenergy sources preserved at 2018 levels
• Compared to 2006, new investment in clean energy has grown from $120 billion to$364 billion in 2019, however this amount is relatively stable over the last five years.
• The first peak is observed in 2011, reaching at the record price of $323 billion, due toan unprecedented spike in solar energy investments at the level of $160 billion.
• Next, in 2017 new clean energy investments stood at the maximum level until today,with solar representing 46% and wind 34% of the total amount.
• Interestingly, hydro, biomass, biogas, solar thermal and geothermal maintain a shareof 27% on average over the whole period under examination.
• Due to the COVID-19 crisis, fuel supply investments have been hit hardest in 2020while utility-scale renewable power has been more resilient.
161 | Greek Energy Market ReportInvestments

1522
31 26
9
16
5.514
88
12
2415
20.7
24.620.945
139.7
83.6
76.4
0
20
40
60
80
100
120
140
160
2006
2007
2008
2009
2010
2011
2012
2013
2014
2015
2016
2017
2018
2019
Wind-onshore Wind-offshore Solar Other* Total
European New Investment in Clean Energy, by Sector ($ bn) [2006-2019]
Highlights
* Other include, Hydro, Biomass, Biogas, Solar Thermal & Geothermal
Source: Bloomberg NEF, HAEE’s analysis
• In terms of total annual investments in clean energy over the whole European Union,a stagnation at the level of around $80 billion is apparent since 2013.
• From the level of $45 billion in 2006, total new clean energy investments rapidlyincreased to almost $140 billion in 2013 mainly due to the boom in the solar sector.
• European new investments in onshore Wind were relatively stable over the pastdecade, however, after 2014 offshore investments grew considerably.
• The rapid decrease in the cost of renewables, combined with improved design ofsupport policies, has already benefited consumer welfare across the member states.
• In line with the European Green Deal, further decarbonizing the energy system iscritical to reach climate objectives in 2030 and 2050.
The EU is actively promoting Europe’s transitionto a low-carbon society, and facilitates newinvestments in the clean energy transition
162 | Greek Energy Market Report HAEE 2020

0
2000
4000
6000
8000
10000
12000
2006
2007
2008
2009
2010
2011
2012
2013
2014
2015
2016
2017
2018e.
2019e.
0
500
1000
1500
2000
2500
2007
2008
2009
2010
2011
2012
2013
2014
2015
2016
2017
2018e.
2019e.
Total RES Wind
Cumulative RES Investments in Greece, (million euros) [2006-
2019]
Total Annual RES (Wind, PV, Hydro) Investments in Greece (million
euros), [2007-2019]
Highlights
Source: HAEE’s analysis
• The Greek energy system is characterized by increased RES electricity production,reflecting Greece’s efforts to adopt European and national policies.
• Investments in renewable energy sources could evolve into a vital recovery factor forthe Greek economy in the post-coronavirus era.
• Currently, there are ready, fully licensed investments in RES with a total capacity of2,400 MW per annum.
• At the same time, another 5,800 MW of RES projects have already securedenvironmental clearance.
• This means a total of about 8,200 MW of RES projects, adding up to some € 8.5-9billion, can immediately proceed to implementation within the next three years.
The ample availability of renewable energypotential show that Greece will be a key player inthe formulation of the EU energy mix
163 | Greek Energy Market ReportInvestments

Source: Bank of Greece, HAEE’s analysis
1.5
%
2.0
%
3.4
%
16.4
%
28.6
%
33.7
%
34.3
%
35.2
%
36.8
%
36.8
%
38.3
%
41.0
%
41.1
%
45.3
%
45.9
%
47.5
%
48.9
%
50.7
%
56.6
%
57.9
%
64.5
%
64.8
%
66.3
%
Petr
ole
um
Pro
ducts
Public A
dm
inis
tration
Energ
y
Fin
ancia
l Firm
s
Ship
pin
g
Chem
ical &
Pharm
aceuticals
Tra
nsport
& S
tora
ge
Accom
odation
Ele
ctr
onic
Pro
ducts
& M
achin
es
Food,
Bevera
ge &
Tobaco
Health
Oth
er
Industr
ies
Pro
cessin
g
Real Esta
te M
anagem
ent
Constr
uction
Agri
culture
Meta
llurg
y
Com
merc
ial
Oth
er
Manufa
ctu
ring A
ctivites
Tele
com
munic
ations,
IT &
Media
Cate
ring
Paper,
Wood &
Furn
iture
Textile
Non-Performing Exposure by Sector in Greece (%), [2018]
The Greek banking system favors to provideloans on the robust Greek Energy sector, sinceits NPE percentage is considerably low
Highlights
• Despite the gradual banking sector’s deleverage in key sectors of the economy, adifferent trend is observed with new target – sectors for creditworthiness.
• According to the latest figures coming from the Bank of Greece, Energy is, inter alia,a sector which face an increasing trend of its credibility starting from 2017.
• The average non performing exposure of all 23 sectors for 2018 is 38.1%, withpetroleum products being the most creditworthy sector at 1.5%.
• On the other hand, the sectors of, Catering with 64.5%, Paper, Wood & Furniturewith 64.8% and Textile with 66.3% are not considered as reliable borrowers.
• The energy sector outperforms in terms of reliability and credibility with an annualrate of non performing exposure for 2018 at 3.4%.
164 | Greek Energy Market Report HAEE 2020
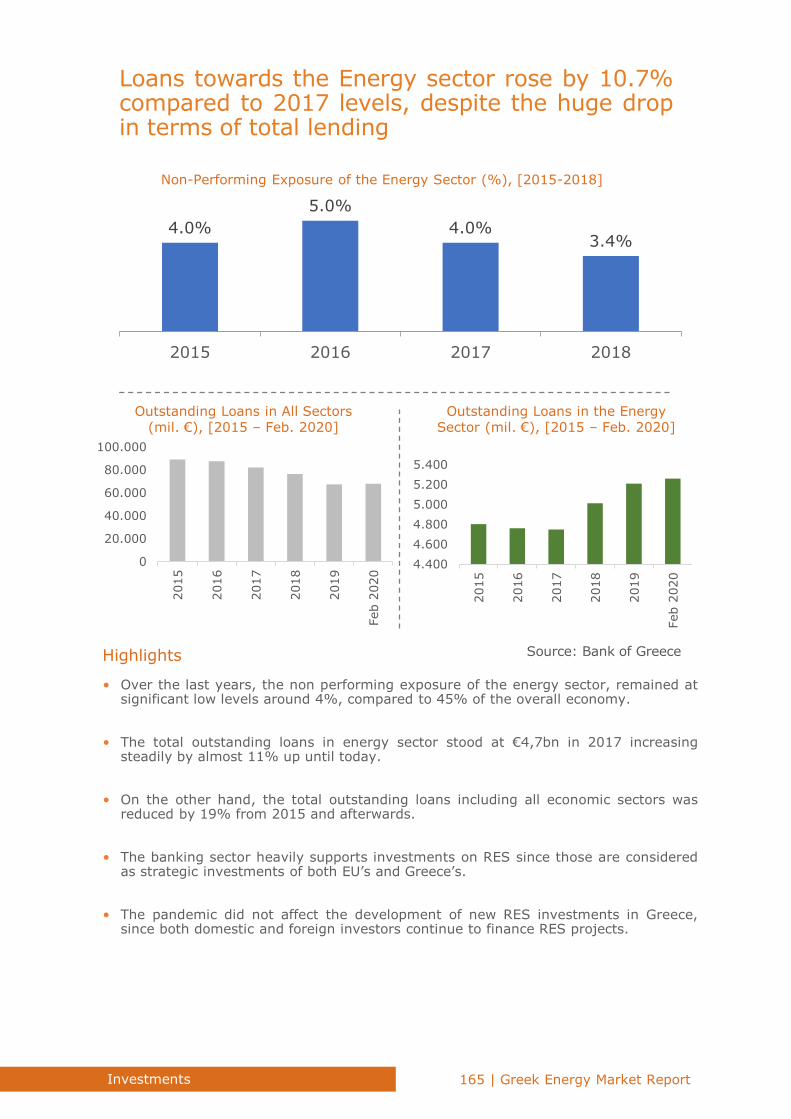
4.400
4.600
4.800
5.000
5.200
5.4002015
2016
2017
2018
2019
Feb 2
020
Outstanding Loans in the Energy Sector (mil. €), [2015 – Feb. 2020]
0
20.000
40.000
60.000
80.000
100.000
2015
2016
2017
2018
2019
Feb 2
020
Outstanding Loans in All Sectors (mil. €), [2015 – Feb. 2020]
4.0%
5.0%
4.0%3.4%
2015 2016 2017 2018
Loans towards the Energy sector rose by 10.7%compared to 2017 levels, despite the huge dropin terms of total lending
Non-Performing Exposure of the Energy Sector (%), [2015-2018]
Highlights
• Over the last years, the non performing exposure of the energy sector, remained atsignificant low levels around 4%, compared to 45% of the overall economy.
• The total outstanding loans in energy sector stood at €4,7bn in 2017 increasingsteadily by almost 11% up until today.
• On the other hand, the total outstanding loans including all economic sectors wasreduced by 19% from 2015 and afterwards.
• The banking sector heavily supports investments on RES since those are consideredas strategic investments of both EU’s and Greece’s.
• The pandemic did not affect the development of new RES investments in Greece,since both domestic and foreign investors continue to finance RES projects.
Source: Bank of Greece
165 | Greek Energy Market ReportInvestments

Source: HAEE’s analysis
New National Energy Plan3
New Energy Projects2
New Privatization1
New RES Market Model4
Digital Transformation 5
Integrated Operation6
Fin Tech1
Banking Transformation2
Bad Debt Decrease3
Lower Risk4
Economic Value Added5
Capital Efficiency6
Highlights
• The new energy projects and the upcoming privatization of significant energy assetscreate a promising collaboration between energy and banking sector.
• The digital era and the effort of both energy companies and banks to transform theiroperations making them more efficient develop gradually multiple synergies.
• The new RES Model combining with a planning integrated operation and mergers ofenergy companies create a more solid sector's function.
• The new operation model and the upcoming transformation of energy sector giventhe low credit risk allow banks to invest in a relative safe sector.
• The efficient collaboration between the energy sector and the banking system, addsvalue for all the participants and maximizes their capital efficiency.
The next day for Greek banking system is toprovide a set of new investment opportunitiesthat could assist win-win potentials in the market
The New Energy Framework in Line With the Challenges of the Banking Sector
166 | Greek Energy Market Report HAEE 2020

Source: HAEE’s analysis
Corporate Loans
Eurobonds Minibonds
Acquisition Financing
Project Finance
Trade Finance
Factoring & Leasing
Borrowing at Corporate level, Project andAcquisition Financing remain the basic source offunding
Highlights
• Corporate loans remain the main financing tool for the largest and most traditionalenergy groups and companies in Greek economy.
• Project finance is also a basic source funding especially for the development of RESbecoming increasingly a useful financing tool due to the upcoming Investments.
• Acquisition financing is another specialized way to support new investors who intendto invest in Greek economy, acquiring an established energy company.
• Euro Bonds and Mini Bonds are funding instruments which are used increasingly bycompanies following the country’s risk decline the recent years.
• Banks participate to the issuance (consulting or/and underwriting) of Bonds throughthe primary market becoming a major financing part of energy companies.
Various Financing Mechanisms
167 | Greek Energy Market ReportInvestments

Source: HAEE’s analysis
€5.0 bnRES Development
€1.5 bnGas-fired Power Plants
Major energy investments which remainunaffected by the impact of COVID-19 havealready been announced
€1.5 bn Islands Interconnections
Highlights
€0.7 bn Gas Distribution Networks
• The announced and already planned major energy projects by large energy Groupsand Companies seem to be most likely unaffected by the implication of COVID-19.
• Gas networks, islands interconnections and RES are the most preferable investmentsdue to the predetermined tariffs.
• The RES development is highly correlated with the islands interconnections since theGreek islands are the preferable location for the development of Wind Projects.
• The investment in new power plants are mainly driven by the gradualdecarbonization of energy production and the transition to the preferable natural gas.
• Plethora of new applications concerning natural gas fired plants have been submittedto RAE and some of them are currently under construction.
Strategic Investments
168 | Greek Energy Market Report HAEE 2020

RES Share in Final Energy and Electricity Consumption %, [2010-2030]
Source: National and Climate Plan 2019, HAEE’s analysis
19%
32%
45%
61%
27%
35%
0%
10%
20%
30%
40%
50%
60%
70%
2010
2011
2012
2013
2014
2015
2016
2017
2018
2019
2020
2021
2022
2023
2024
2025
2026
2027
2028
2029
2030
% of Electricity Consumption from RES
% of Energy Consumption from RES
Greece creates energy investment opportunitiesdue to the availability of RES potential and theongoing sizeable infrastructure projects
Highlights
• Apart from the announced investments in Wind and Solar, an extra 1,000 MW ofelectricity storage projects worth €1.5-2 billion are also mature in terms of licenses.
• Green energy projects have a high added-value rate with Wind energy projects havea 50% rate, Hydro 70% and power storage projects 75%.
• According to a study published by IRENA in 2020, investments in RES also have agreat multiplier effect in the national economy and employment.
• For every single euro of investments in RES, another 3 to 8 euros are returned to theeconomy, depending on the technology and the local conditions.
• In terms of employments, RES investments could quadruple the number of jobs inthe sector in the medium to long term.
169 | Greek Energy Market ReportInvestments

Source: National Plan for Climate & Energy (2018 & 2019), HAEE’s analysis
43.8
TotalProjected Figures of National Plan for Energy and Climate (billion €), [2020-2030]
1.9
3.3
8.5
9
1.5
2
5
1.3
2
2.2
3.5
5.5
9
11
Refining
Climate Change
Circular Economy - Recycle
Research and Development
New conventional power plants andupgrading existing
Network and Storage
Natural Gas Pipelines
Electricity Distribution Network -
Digitalization
Infrastructure in Electricity
RES Electricity Generation
Energy Efficiency
2019 Projections
2018 Projections
32.7
43.8
2018 Total 2019 Total
Funds towards the support of Circular Economy,Climate change and Refining add €8.5 billion inthe revised National Plan for Climate and Energy
Highlights
• The National Energy Plan is in accordance with the UN Agenda 2030 and with therecently adopted European Green Deal, setting challenging goals at national level.
• The revised National Energy Plan of 2019 is increased by 11.1 billion euros comparedto 2018 projections, which represent a growth of 33%.
• This substantial increase came up from reviewed estimations on Energy Efficiency,RES electricity generation, R&D, Circular economy, Climate Change and Refining.
• In line with the aim of national authorities to support clean energy, the new Planprojects reduction of total €0.6 billion towards conventional power plants.
• Greece is currently emerging as a key player in the transportation of energy throughpipeline projects and electricity grid interconnectivity ensuring security of supply.
170 | Greek Energy Market Report HAEE 2020

Five Global Trends
Shaping our Future
171 | Greek Energy Market Report
Climate Change
Renewable Energy Sources
Digitalization
Circular
Economy
Energy Efficiency

Five Global Trends Shaping our Future
In response to the extraordinary circumstances stemming from the coronavirus
pandemic, the “Greek Energy Market Report 2020” has extended its analysis to
include all the developments to date and possible future directions. The
uncertainty surrounding public health, the economy and, hence, the energy
over the rest of 2020 is unprecedented. This analysis, therefore, not only charts
a possible path for energy use in 2020 but also highlights the many factors that
could lead to differing outcomes.
In that context, today’s global energy industry is characterized by significant
shifts, which are creating new opportunities. New trends and technologies are
changing the way energy is produced, delivered and consumed. In parallel, and
under the current production-consumption model, world demand for raw
materials could double by 2050. Investment, innovation and public-private
collaboration are needed to accelerate the transition to a more sustainable,
secure and affordable energy system, while optimizing the net social and
economic value delivered by materials. Aiming to achieve the above, 5 global
energy trends shape current and future way of living:
1. Climate ChangeToday, our world is changing faster and in more ways, than we could have ever
imagined. With social and economic disruption on a scale rarely seen since the
end of World War II, 75 years ago, the pandemic is also forcing us to
completely rethink the notion of ‘business as usual’. As some countries start to
emerge from the first acute phase of the pandemic, the COVID-19 crisis is
shifting people’s thinking substantially. Human health and healthcare in general
have rightly become the number-one priority for global leaders, and a healthy
planet remains fundamental to all of our actions to make the world healthier
and more sustainable.
2. Renewable Energy SourcesAdditional deployment of Renewable Energy Sources beyond 2020 is vital in
order to further reduce greenhouse gas emissions and lead to low-carbon
growth. Countries worldwide have already agreed to increase renewable energy
penetration, however, challenges for further progress in renewable energy are
multiple. For instance, a key challenge is to arrive at a more unified and
comprehensive market design for energy. The ideal design would maximize the
use of intermittent renewable energy sources through cross-border
interconnections, energy storage, wholesale trading and a flexible consumer
demand.
3. DigitalizationDigitalization is a game-changer with profound impacts in the economy, society
and cities as it can be considered as a broader and long-term societal transition,
affecting among others the way of how people work and communicate. Digital
innovation is at the heart of discourse around Smart Cities to build more
efficient and livable urban environments, by using data and digital technology.
Digitalization is anticipated to improve citizens’ life and create sustainable cities
through connectivity, publicly accessible data, IT platforms communicating with
each other, sensors and other advanced technologies.
172 | Greek Energy Market Report HAEE 2020

4. Circular EconomyThe circular economy concept is gaining attention as the consumption and use
of resources increases to serve a fast-growing population with rising standards
of living. Circularity refers to the circular flow and efficient use and reuse of
resources, materials and products. This new economic model represents
sustainable green growth, moving from a consumption and disposal-based
linear model to a system that extends the life of products and materials and
minimizes waste. The circular model has many environmental, climate, social
and economic benefits.
5. Energy EfficiencyBy using energy more efficiently and thereby consuming less, citizens can lower
their energy bills, help protect the environment and reduce reliance on oil and
gas. In order to achieve these benefits, energy efficiency needs to be improved
throughout the full energy chain, from production to final consumption. At the
same time, the benefits of energy savings must outweigh the costs, for instance
those that result from carrying out renovations. National policies therefore
should focus on sectors where the potential for savings is the greatest, such as
energy efficient buildings, appliances and reduction in energy intensity of
industrial output.
Business as usual
Clim
ate
Ris
ks
Time
When sustainability is priority
THE EARTH’S CAPACITY
LET’S ALSO FLATTEN THIS CURNVE
173| Greek Energy Market Report

Data Sources
https://www.worldbank.org/ https://ec.europa.eu https://ec.europa.eu/eurostat
https://www.iea.org/ https://www.oecd.org/ https://about.bnef.com/
https://www.igu.org/ http://www.rae.gr http://www.enexgroup.gr/
https://ape.dapeep.gr http://www.admie.gr/ https://www.deddie.gr/en/
http://www.desfa.gr/ http://eletaen.gr/en http://helapco.gr/en/
http://iobe.gr/ http://www.statistics.gr/ https://www.greekhydrocarbons.gr/
174 | Greek Energy Market Report HAEE 2020

Ministry of Environment and Energy http://www.ypeka.gr/
Useful links
Centre for Renewable Energy Sources and Saving
http://www.cres.gr/kape/index_eng.htm
Ministry of Finance
https://www.minfin.gr/
Regulatory Authority for Energy
http://www.rae.gr/old/en/
Hellenic Competition Commission
https://www.epant.gr/en/
Hellenic Republic Asset Development Fund
https://www.hradf.com/en/fund
Energy Exchange Group
http://www.enexgroup.gr/nc/en/home/
The Independent Power Transmission Operator
http://www.admie.gr/nc/en/home/
Hellenic Electricity Distribution Network Operator
https://www.deddie.gr/en/i-etaireia/profil
Natural Gas System Operator
http://desfa.gr/
175| Greek Energy Market Report

ADMIE Independent Power Transmission Operator CRES Centre for Renewable Energy Sources and Saving DAS Day-Ahead scheduling DEDA Gas Distribution Company Rest of Greece DEPA Public Gas Corporation S.A. DESFA Hellenic Gas Transmission System Operator DSO Distribution System Operator EC European Commission ETMEAR Existing renewable energy source levy ETS Emissions Trading System EU European Union FiT Feed-in Tariff FiP Feed-in Premium FSRU Floating Storage and Regasification Unit GDP Gross Domestic Product HCC Hellenic Competition Commission HENEX Hellenic Energy Exchange HEDNO Hellenic Electricity Distribution Network Operator HELPE Hellenic Petroleum HHRM Hellenic Hydrocarbon Resources Management S.A. HRADF Hellenic Republic Asset Development Fund IPP Independent Power Producers ITO Independent Transmission Operator LAGIE Hellenic Electricity Market Operator LNG Liquefied Natural Gas NII Non-Interconnected IslandNNGS National natural gas systemNOME Nouvelle Organisation due Marché de l’ElectricitéPCI Project of Common InterestPPC Public Power CorporationPV PhotovoltaicRAE Regulatory Authority for EnergyR&D Research and DevelopmentTFC Total Final ConsumptionTPES Total Primary Energy SupplyTSO Transmission system operator
Acronyms and abbreviations
Units of measurementbcm billion cubic metersCO2 carbon dioxideGJ gigajouleGW gigawattkL kilolitrekm kilometrektoe thousand tonnes of oil equivalentkW kilowattkWh kilowatt hourm3 cubic metermcm million cubic metresMt million tonnesMtCO2 million tonnes of carbon dioxideMtCO2-eq million tonnes of carbon dioxide equivalentMtoe million tonnes of oil equivalentMW megawattMWh megawatt hourtCO2 tonne of carbon dioxidetoe tonne of oil equivalentTWh terawatt hour

Hellenic Association for Energy Economics (HAEE)
The Hellenic Association for Energy Economics (HAEE - www.HAEE.gr) is a non-profitresearch and professional organization acting as an interdisciplinary forum for theexchange of ideas and experiences among energy experts. It acts as an independentconsulting body for national and international organizations to whom it provides a broadcontribution on issues related to energy, economics, policymaking and theory. HAEE isthe Greek affiliate of the International Association for Energy Economics (www.IAEE.org)
Copyright @ 2020 Hellenic Association for Energy Economics
The use or translation of the content of this report is strictly forbidden without the priorconsent of the publisher.