Embed Size (px)
Citation preview
+
How accurate and timely are BSO address data? An assessment using the Northern Ireland Longitudinal Study (NILS)
Paul Barr and Ian ShuttleworthNILS User ForumMarch 11th, 2011
+Outline
Introduction and context
The data The NILS and migration The problem: defining non-response and lagged response
Modelling approach
Results
Implications

+
Introduction
+Introduction
Address information from health cards is currently important
For health programmes – monitoring, interventions For UK longitudinal studies (eg NHSCR and the ONS
England & Wales LS; BSO and the NILS) Other statistical purposes – migration estimates
And, post 2011, depending on census developments, these or similar data might be important as part of administrative data systems as replacements/supplements to the census

+Introduction
Important, therefore, to know how accurate these data are, what sorts of errors there might be, and their social/demographic/ geographic incidence
The presentation aims to begin to answer these questions Who fails to report or lags in reporting moves? Where do they live?
Not a complete answer – key verb is ‘to begin’

+
The data
+The data
The analysis is based on the NILS – a large data linkage study – it deals only with internal migrants in NI
Address information is provided from the Business Service Organisation (BSO) in regular 6-monthly downloads
These downloads start in April 2001 (eg not the year before the census)
Address information can be coded to Super Output Area (SOA)
+The data
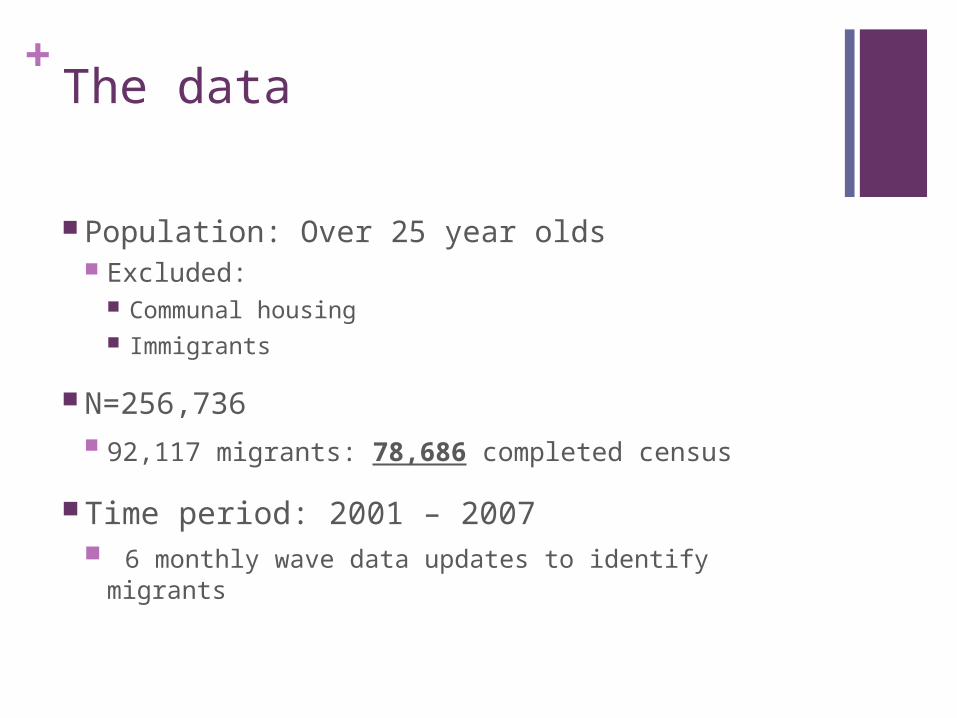
Population: Over 25 year olds Excluded:
Communal housing Immigrants
N=256,736 92,117 migrants: 78,686 completed census
Time period: 2001 – 2007 6 monthly wave data updates to identify migrants

+The data
The SOA recorded in the 2001 Census is a ‘gold standard’ – it can be compared with that reported via the Health Card Registration System when recording address changes
A non-reported move occurred when: A move via BSO was reported 2001-2007 but neither the
origin or destination SOA matched the SOA that was recorded in the 2001 Census – the assumption being that a move occurred that was not reported
+The data
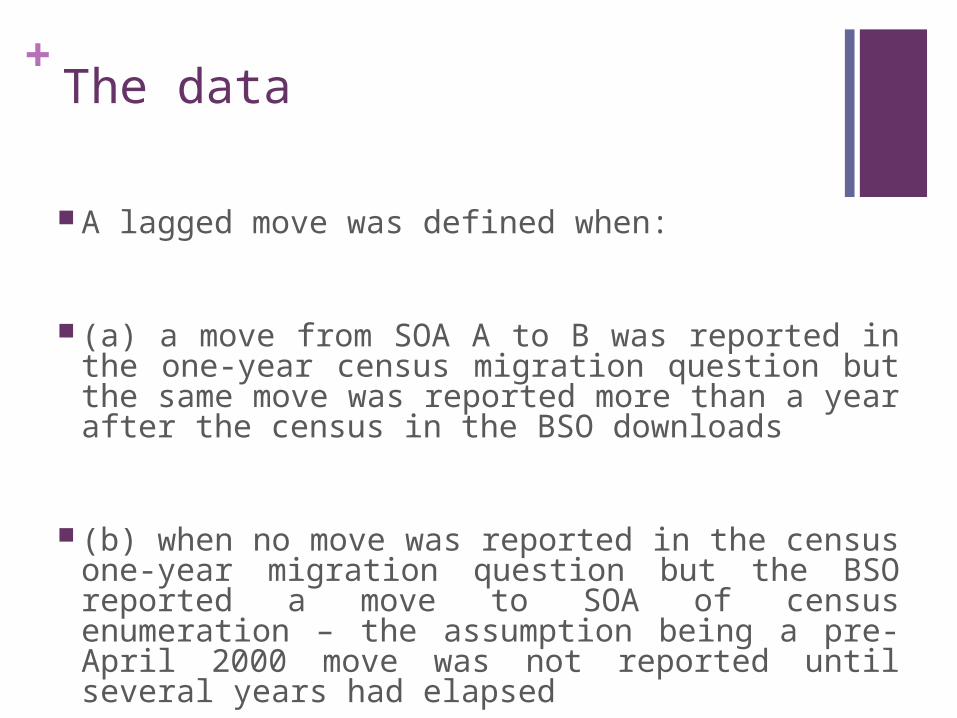
A lagged move was defined when:
(a) a move from SOA A to B was reported in the one-year census migration question but the same move was reported more than a year after the census in the BSO downloads
(b) when no move was reported in the census one-year migration question but the BSO reported a move to SOA of census enumeration – the assumption being a pre-April 2000 move was not reported until several years had elapsed
+The data
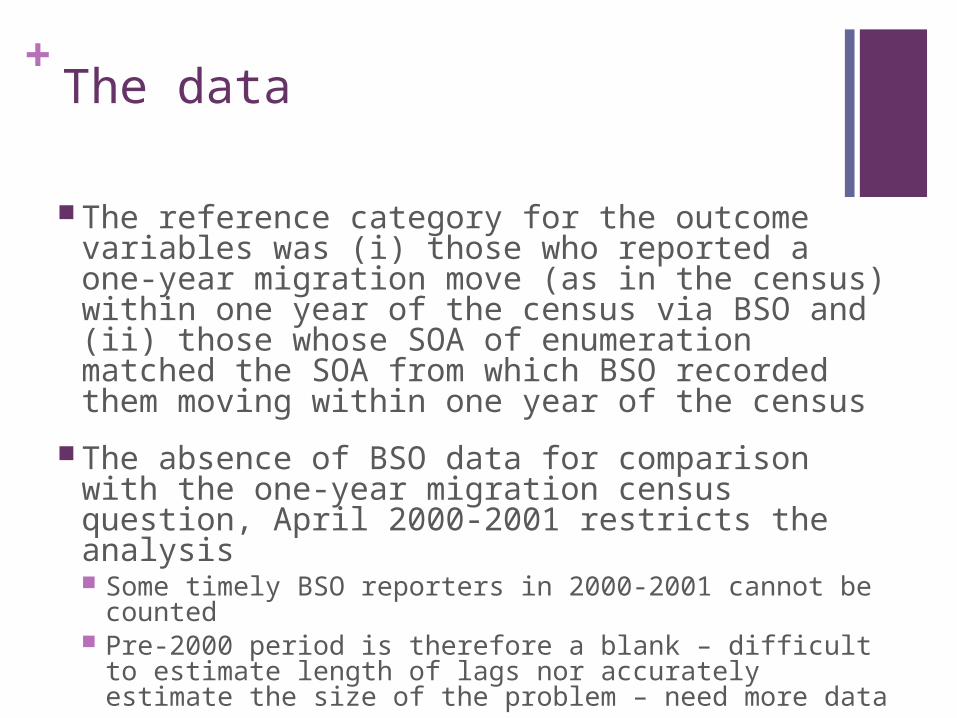
The reference category for the outcome variables was (i) those who reported a one-year migration move (as in the census) within one year of the census via BSO and (ii) those whose SOA of enumeration matched the SOA from which BSO recorded them moving within one year of the census
The absence of BSO data for comparison with the one-year migration census question, April 2000-2001 restricts the analysis Some timely BSO reporters in 2000-2001 cannot be
counted Pre-2000 period is therefore a blank – difficult to estimate
length of lags nor accurately estimate the size of the problem – need more data


+
Modelling approach
+Modelling approach
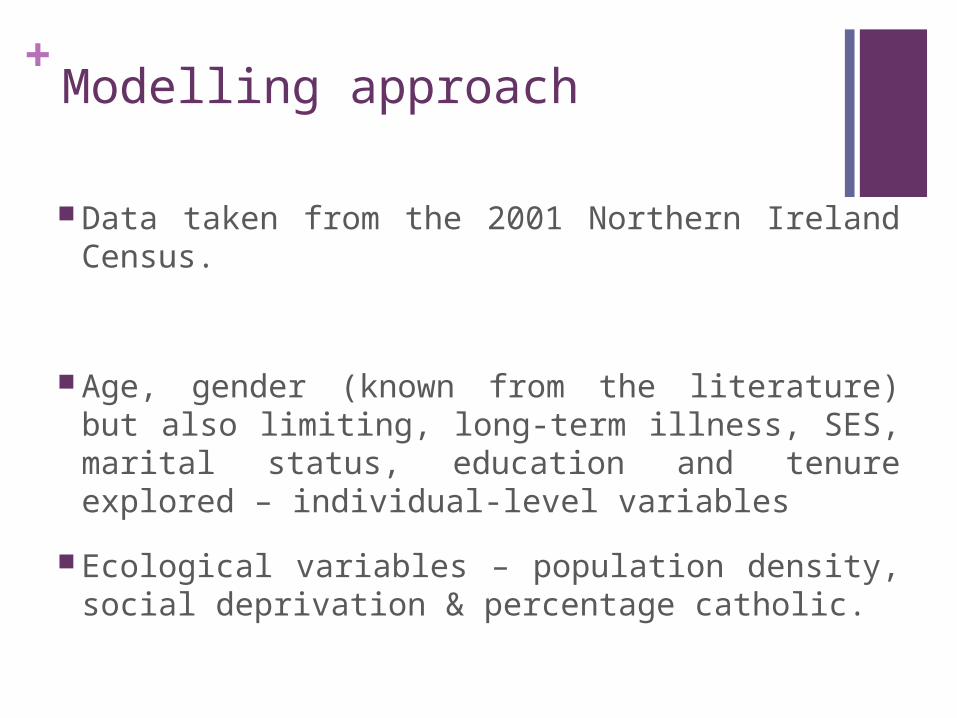
Data taken from the 2001 Northern Ireland Census.
Age, gender (known from the literature) but also limiting, long-term illness, SES, marital status, education and tenure explored – individual-level variables
Ecological variables – population density, social deprivation & percentage catholic.
+Modelling approach
Descriptive analysis – overall patterns, bivariate relationships
MLM approach – but most interest in model coefficients (eg fixed effects) and not the random part of the model
Analysis exploratory – what other factors besides age and gender influence lagging and non-response?

+
Results
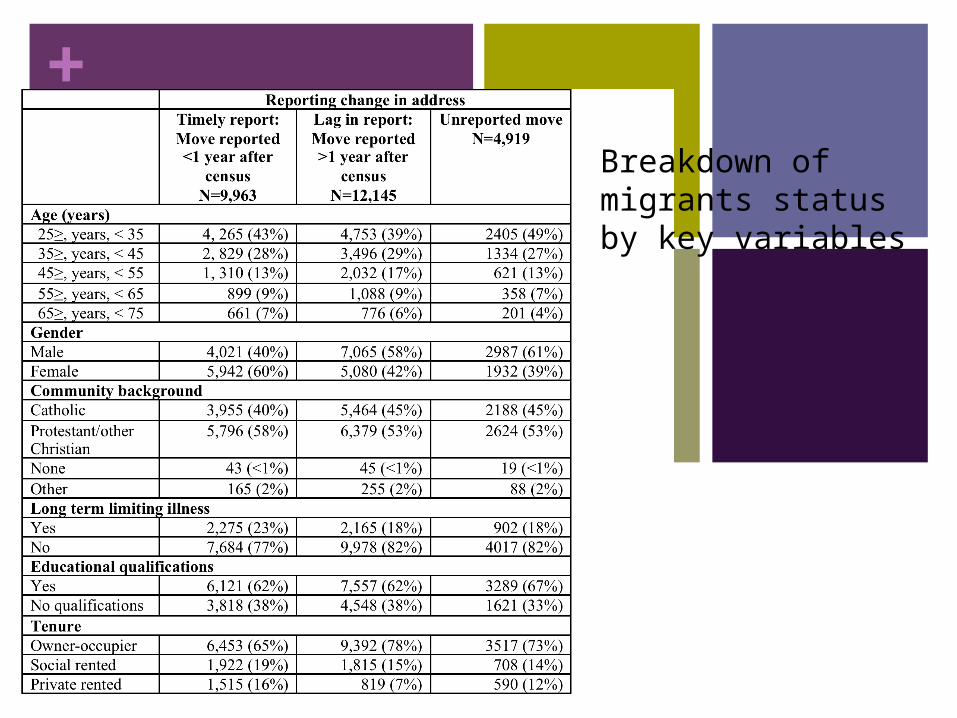
+Breakdown of migrants status by key variables
+
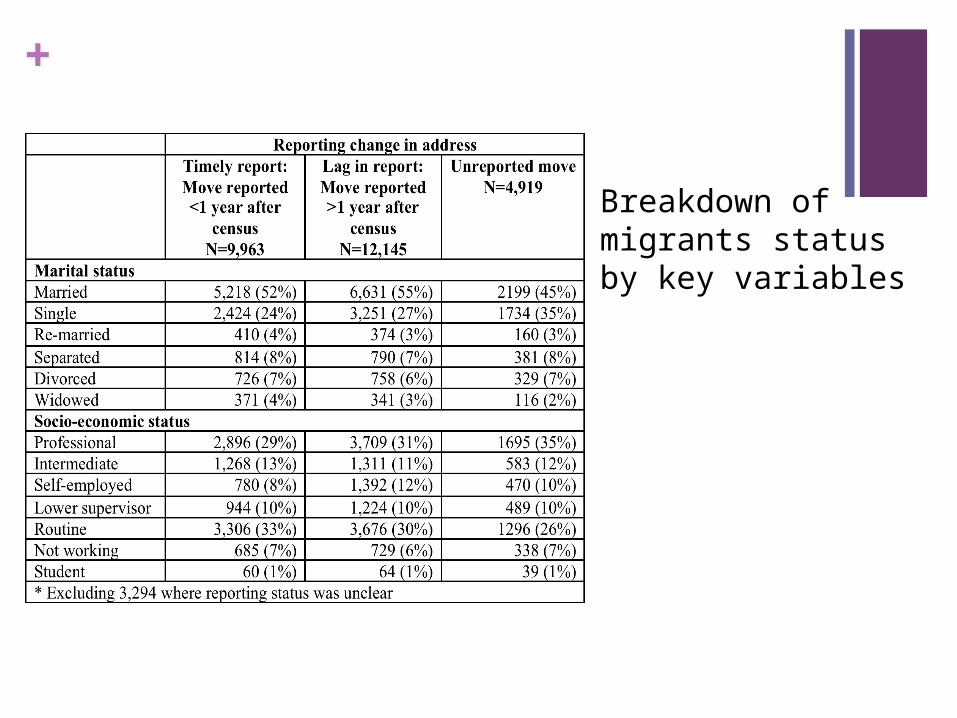
Breakdown of migrants status by key variables
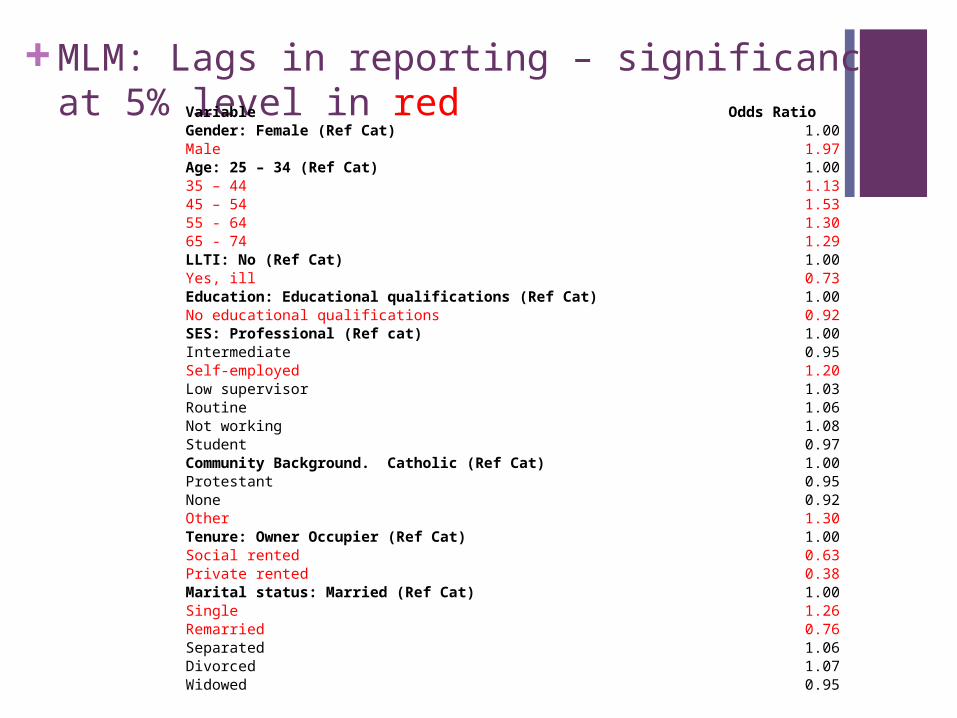
+MLM: Lags in reporting – significance at 5% level in redVariable Odds Ratio
Gender: Female (Ref Cat) 1.00Male 1.97Age: 25 – 34 (Ref Cat) 1.0035 – 44 1.1345 – 54 1.5355 - 64 1.3065 - 74 1.29LLTI: No (Ref Cat) 1.00Yes, ill 0.73Education: Educational qualifications (Ref Cat) 1.00No educational qualifications 0.92SES: Professional (Ref cat) 1.00Intermediate 0.95Self-employed 1.20Low supervisor 1.03Routine 1.06Not working 1.08Student 0.97Community Background. Catholic (Ref Cat) 1.00Protestant 0.95None 0.92Other 1.30Tenure: Owner Occupier (Ref Cat) 1.00Social rented 0.63Private rented 0.38Marital status: Married (Ref Cat) 1.00Single 1.26Remarried 0.76Separated 1.06Divorced 1.07Widowed 0.95
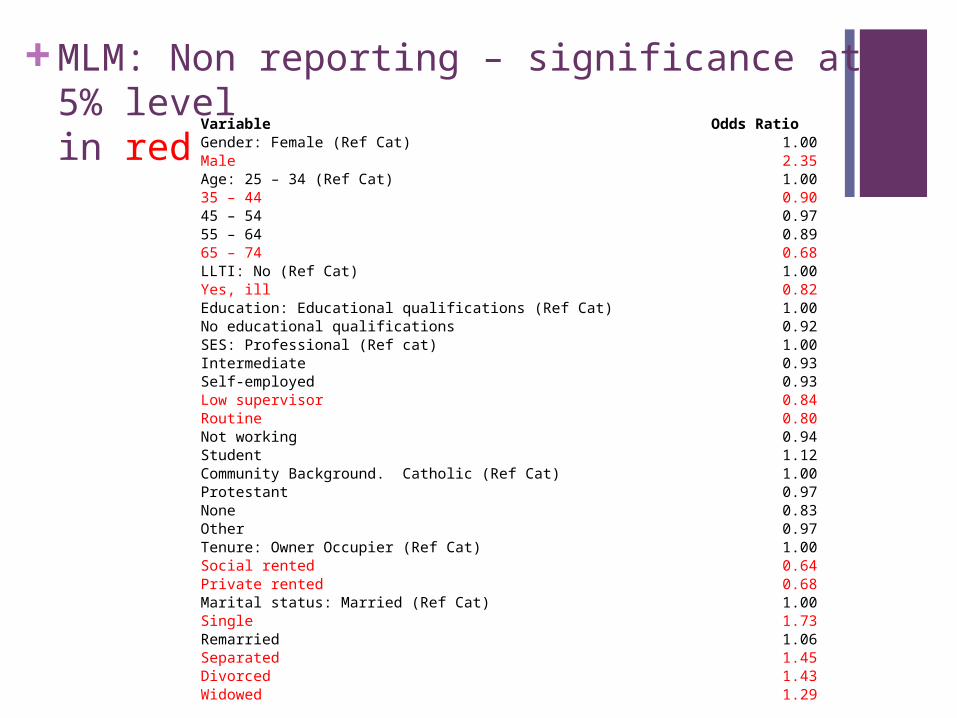
+MLM: Non reporting – significance at 5% level in red
Variable Odds RatioGender: Female (Ref Cat) 1.00Male 2.35Age: 25 – 34 (Ref Cat) 1.0035 – 44 0.9045 – 54 0.9755 – 64 0.8965 – 74 0.68LLTI: No (Ref Cat) 1.00Yes, ill 0.82Education: Educational qualifications (Ref Cat) 1.00No educational qualifications 0.92SES: Professional (Ref cat) 1.00Intermediate 0.93Self-employed 0.93Low supervisor 0.84Routine 0.80Not working 0.94Student 1.12Community Background. Catholic (Ref Cat) 1.00Protestant 0.97None 0.83Other 0.97Tenure: Owner Occupier (Ref Cat) 1.00Social rented 0.64Private rented 0.68Marital status: Married (Ref Cat) 1.00Single 1.73Remarried 1.06Separated 1.45Divorced 1.43Widowed 1.29

+ Results More likely to lag in reporting
Individual: Males, older age groups, self employed, single, other community background. Neighbourhood: Small increase with increase in MDM score &
Population density.
Less likely to lag in reporting Those with limiting long-term illness, social and private renters,
remarried
More likely to non-report moves Individual: Males, single, separated, widowed and divorced,
younger people Neighbourhood: Small increase with increase in MDM score &
Population density.
Less likely to non-report Those with limiting long-term illness, lower SES, social and private
renters

+
Implications
+Implications
Differences between ‘laggers’ and ‘non-reporters’
Non-reporters more similar to those who are hard to survey (or to enumerate) in censuses in that they tend to be younger and male and other marital statuses than married
Commonality between laggers and non reporters is limiting long-term illness – those who are ill are less likely to lag and to non-report – not surprising since they are more likely to be in contact with the health system

+Implications
Those who lag differ in some ways from the stereotype of young and male (tend to be older, owner occupiers)
But the analysis also suggests that besides the categories associated with transience (eg youth, males, urban areas) other factors such as lower SES (relative to professionals) is associated with lower non reporting
Risks of non reporting (and lagging to some extent) seem thus to be twofold:
+Implications
More problems with greater transience/ deprivation Younger people Males Urban areas
But also with more affluence and better health Owner occupiers Those with no limiting long-term illness

+Implications
Suggests two distinct types of lack of engagement and two challenges
Health card registration systems sometimes find it hard to deal with groups that are difficult to capture in surveys and the census
But, by their nature, it may well be they also sometimes miss out the more healthy and the more affluent who do not engage with them for different reasons
+Implications
When screening or monitoring the population, the healthy need to be given special attention….
For statistical purposes, efforts should be made to tease out these patterns – some unexpected parts of the population could be missed out
For the NILS, our judgement is that although some moves are not reported on time, most address changes are captured eventually

+ Issues at the Health professional level? Another distinct possibility is variation among
recording of up-to-date address information at the practice level
Some practices ask every time, others not at all. Not just health professional, problem at the administration level?
Anecdotal evidence Receptionist “Is that everything?” Me “Actually no, I have recently changed my address
from ‘A’ to ‘B’” Receptionist “[ignores my statement] OK, so just call
back tomorrow. Bye”
Potential Quality & Outcomes Framework (QOF) indicator in the Organisational Domain?
+Implications
The proportion of address changes missed altogether is probably small and inaccuracies are also probably also small
However…..the available data are insufficient to explore fully this aspect, and there is scope for more work
This might take the form of matching SOA recorded in the BSO in April 2001 with SOA of enumeration in 2001
Also interesting to consider those aged <25
+Implications
These issues are likely to become more important if the UK Census is abandoned after 2011 and replaced by data linkage and administrative schemes
Is the information from the health professional the most accurate for assessing home address? Should an alternative be considered?
Analysis based on people reporting something to Health professional and completing census. Still missing a group of people (ENTER DICK CHENNY QUOTE?)

The help provided by the staff of the Northern Ireland Longitudinal Study (NILS) and NILS Research Support Unit is acknowledged. NILS is funded by the HSC R&D Division of the Public Health Agency. ESRC and the Northern Ireland Government fund the NILS RSU. The authors alone are responsible for the interpretation of the data.
Acknowledgements