Embed Size (px)
Citation preview
� ��
�
������������� ���������
������������ ��������
�
������� ��������
�
�
�������� ��
Table of Contents
1. General …………………………………………………………………… 1 History of Control Network ….…………………………………….. 1
2. Disclaimer …………………………. …………………………………… 1 3. Horizontal Datum………………………………………………………… 1 4. Vertical Datum …………………………………………………………… 1 5. Field Procedures and Equipment…………………………………………. 2 5.1 Global Positioning System …………………………………….. 2 5.2 Total Station ……………………………………………………. 2 5.3 Differential Leveling …………………………………………… 2 6. Office Procedures ……………………………………………………….. 2 6.1 Data Capture …………………………………………………… 2 6.2 Adjustment Software …………………………………………... 2 6.3 Network Ties to Existing NGS Horizontal Control .…………… 3 6.4 Network Ties to Existing NGS Vertical Control ………………. 4 6.5 Data Outlier Detection ………………………………………… 5 6.6 Horizontal Constraints, Weighting and Residuals ……………… 6 6.7 Vertical Constraints, Weighting and Residuals ………………… 7 7. Point Format …...……………………………………………………….. 8 7.1 Name …………………………………………………………… 8 7.2 Northing ………………………………………………………... 8 7.3 Easting ……………………………………………..…………… 8 7.4 Elevation ……………………………………….………………. 8 7.5 Code …………………………………………………………… 8 7.6 Metadata …………………………………………….…………… 9 7.7 Status …………………………………………………………… 10 7.8 Reference ………………………………………………………. 10 8. National Spatial Reference System ……………………………………… 10 9. Summary …………………………………………………………………. 11
Appendices
A. NGS Horizontal Control – DIAGRAM H B. NGS Vertical Control – DIAGRAM V
City of Huntsville, Texas Mapping Control Network 2010 Technical Report
�
!�"���� �
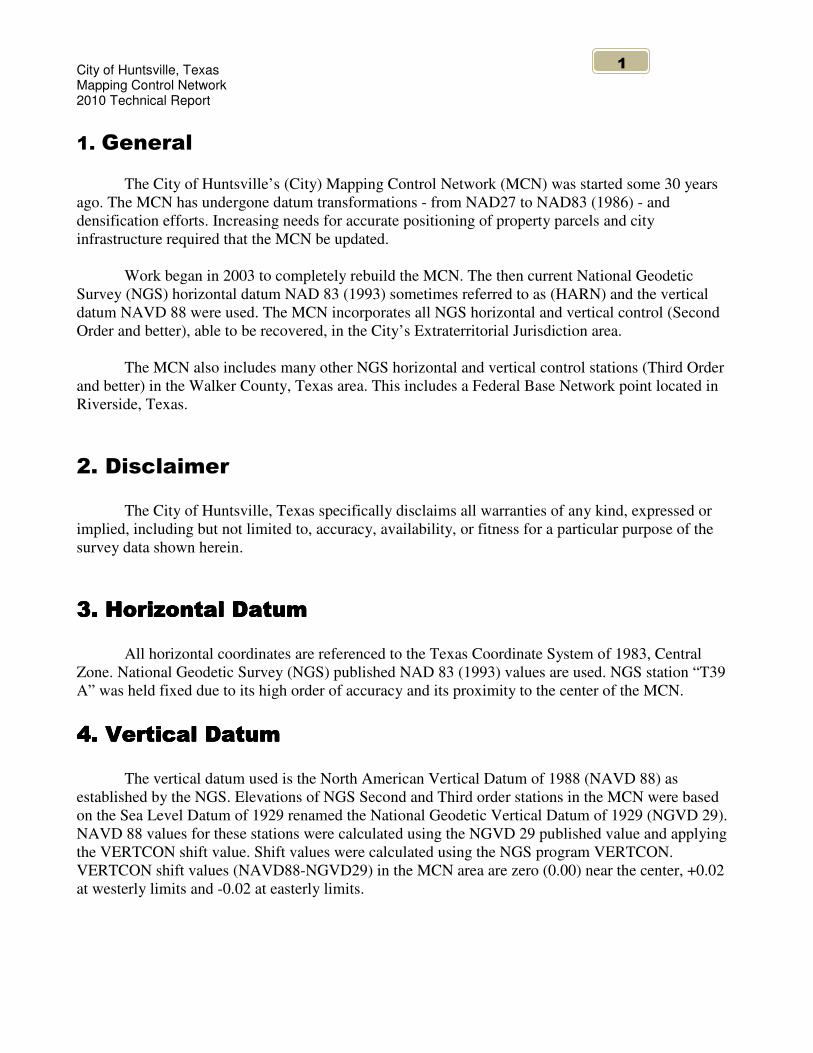
The City of Huntsville’s (City) Mapping Control Network (MCN) was started some 30 years ago. The MCN has undergone datum transformations - from NAD27 to NAD83 (1986) - and densification efforts. Increasing needs for accurate positioning of property parcels and city infrastructure required that the MCN be updated.
Work began in 2003 to completely rebuild the MCN. The then current National Geodetic Survey (NGS) horizontal datum NAD 83 (1993) sometimes referred to as (HARN) and the vertical datum NAVD 88 were used. The MCN incorporates all NGS horizontal and vertical control (Second Order and better), able to be recovered, in the City’s Extraterritorial Jurisdiction area.
The MCN also includes many other NGS horizontal and vertical control stations (Third Order and better) in the Walker County, Texas area. This includes a Federal Base Network point located in Riverside, Texas.
�!�#��� ��$ ��� The City of Huntsville, Texas specifically disclaims all warranties of any kind, expressed or implied, including but not limited to, accuracy, availability, or fitness for a particular purpose of the survey data shown herein.
%!�%!�%!�%!�����&��� �#��$����&��� �#��$����&��� �#��$����&��� �#��$ ���� All horizontal coordinates are referenced to the Texas Coordinate System of 1983, Central Zone. National Geodetic Survey (NGS) published NAD 83 (1993) values are used. NGS station “T39 A” was held fixed due to its high order of accuracy and its proximity to the center of the MCN.
'!�(������ '!�(������ '!�(������ '!�(������ ����#��$#��$#��$#��$ ���� The vertical datum used is the North American Vertical Datum of 1988 (NAVD 88) as established by the NGS. Elevations of NGS Second and Third order stations in the MCN were based on the Sea Level Datum of 1929 renamed the National Geodetic Vertical Datum of 1929 (NGVD 29). NAVD 88 values for these stations were calculated using the NGVD 29 published value and applying the VERTCON shift value. Shift values were calculated using the NGS program VERTCON. VERTCON shift values (NAVD88-NGVD29) in the MCN area are zero (0.00) near the center, +0.02 at westerly limits and -0.02 at easterly limits.
City of Huntsville, Texas Mapping Control Network 2010 Technical Report
��
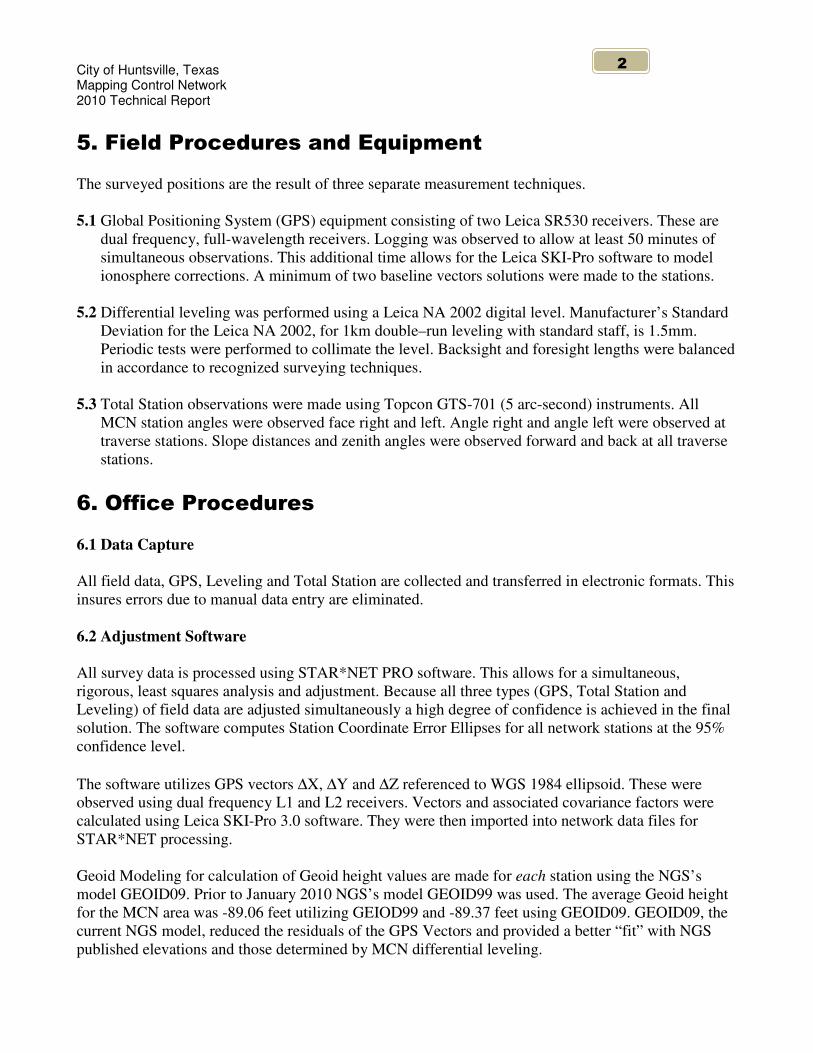
)!�*�� +�,����+�����+�-.��$ ��� The surveyed positions are the result of three separate measurement techniques. 5.1 Global Positioning System (GPS) equipment consisting of two Leica SR530 receivers. These are
dual frequency, full-wavelength receivers. Logging was observed to allow at least 50 minutes of simultaneous observations. This additional time allows for the Leica SKI-Pro software to model ionosphere corrections. A minimum of two baseline vectors solutions were made to the stations.
5.2 Differential leveling was performed using a Leica NA 2002 digital level. Manufacturer’s Standard
Deviation for the Leica NA 2002, for 1km double–run leveling with standard staff, is 1.5mm. Periodic tests were performed to collimate the level. Backsight and foresight lengths were balanced in accordance to recognized surveying techniques.
5.3 Total Station observations were made using Topcon GTS-701 (5 arc-second) instruments. All
MCN station angles were observed face right and left. Angle right and angle left were observed at traverse stations. Slope distances and zenith angles were observed forward and back at all traverse stations.
/!�0������,����+���� 6.1 Data Capture All field data, GPS, Leveling and Total Station are collected and transferred in electronic formats. This insures errors due to manual data entry are eliminated. 6.2 Adjustment Software All survey data is processed using STAR*NET PRO software. This allows for a simultaneous, rigorous, least squares analysis and adjustment. Because all three types (GPS, Total Station and Leveling) of field data are adjusted simultaneously a high degree of confidence is achieved in the final solution. The software computes Station Coordinate Error Ellipses for all network stations at the 95% confidence level. The software utilizes GPS vectors ∆X, ∆Y and ∆Z referenced to WGS 1984 ellipsoid. These were observed using dual frequency L1 and L2 receivers. Vectors and associated covariance factors were calculated using Leica SKI-Pro 3.0 software. They were then imported into network data files for STAR*NET processing. Geoid Modeling for calculation of Geoid height values are made for each station using the NGS’s model GEOID09. Prior to January 2010 NGS’s model GEOID99 was used. The average Geoid height for the MCN area was -89.06 feet utilizing GEIOD99 and -89.37 feet using GEOID09. GEOID09, the current NGS model, reduced the residuals of the GPS Vectors and provided a better “fit” with NGS published elevations and those determined by MCN differential leveling.
City of Huntsville, Texas Mapping Control Network 2010 Technical Report
%�
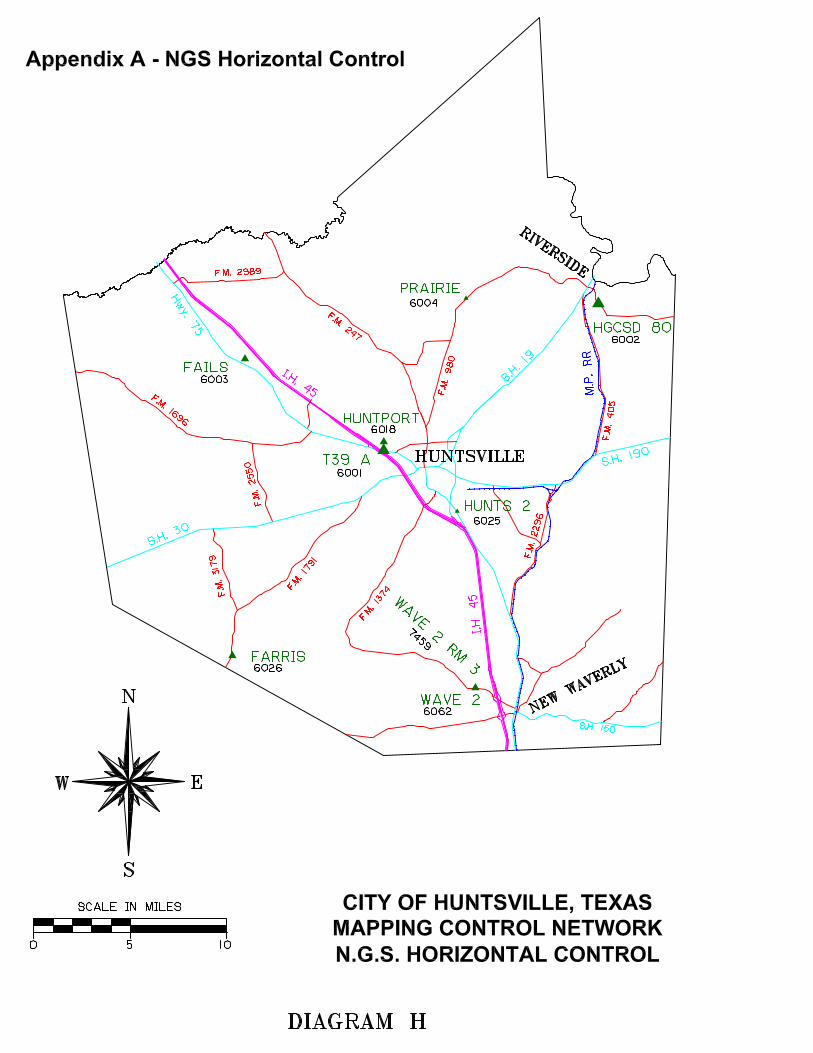
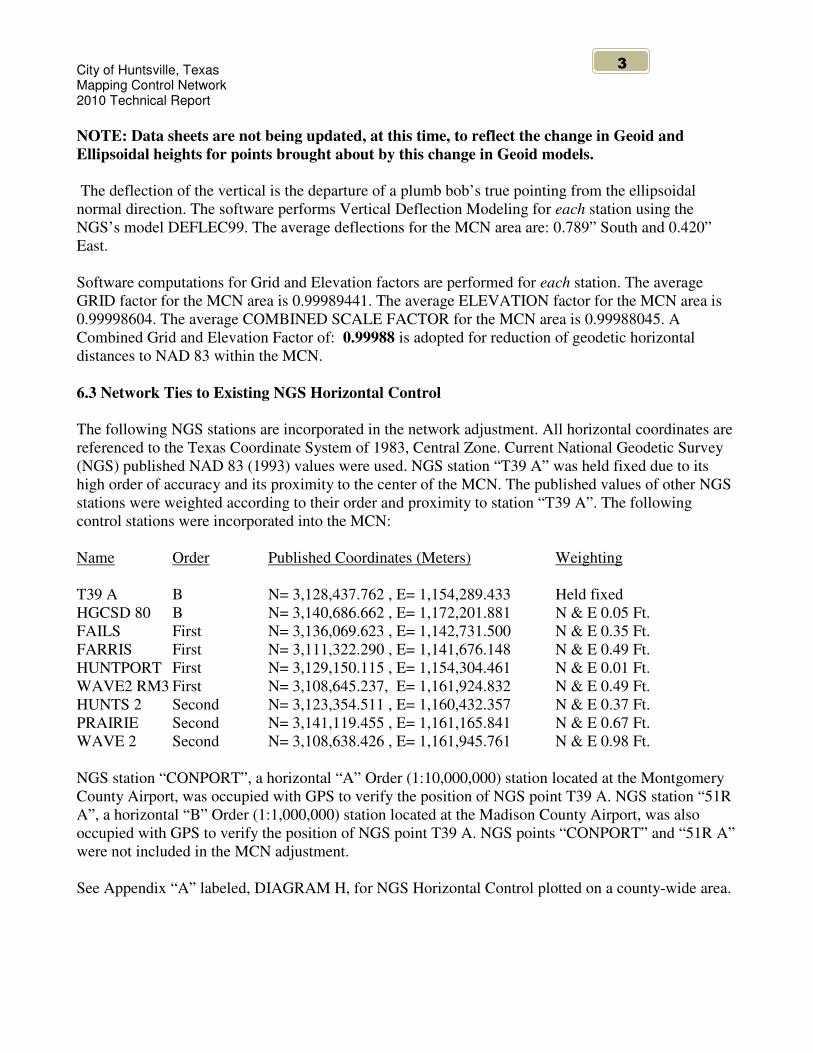
NOTE: Data sheets are not being updated, at this time, to reflect the change in Geoid and Ellipsoidal heights for points brought about by this change in Geoid models. The deflection of the vertical is the departure of a plumb bob’s true pointing from the ellipsoidal normal direction. The software performs Vertical Deflection Modeling for each station using the NGS’s model DEFLEC99. The average deflections for the MCN area are: 0.789” South and 0.420” East. Software computations for Grid and Elevation factors are performed for each station. The average GRID factor for the MCN area is 0.99989441. The average ELEVATION factor for the MCN area is 0.99998604. The average COMBINED SCALE FACTOR for the MCN area is 0.99988045. A Combined Grid and Elevation Factor of: 0.99988 is adopted for reduction of geodetic horizontal distances to NAD 83 within the MCN. 6.3 Network Ties to Existing NGS Horizontal Control The following NGS stations are incorporated in the network adjustment. All horizontal coordinates are referenced to the Texas Coordinate System of 1983, Central Zone. Current National Geodetic Survey (NGS) published NAD 83 (1993) values were used. NGS station “T39 A” was held fixed due to its high order of accuracy and its proximity to the center of the MCN. The published values of other NGS stations were weighted according to their order and proximity to station “T39 A”. The following control stations were incorporated into the MCN: Name Order Published Coordinates (Meters) Weighting T39 A B N= 3,128,437.762 , E= 1,154,289.433 Held fixed HGCSD 80 B N= 3,140,686.662 , E= 1,172,201.881 N & E 0.05 Ft. FAILS First N= 3,136,069.623 , E= 1,142,731.500 N & E 0.35 Ft. FARRIS First N= 3,111,322.290 , E= 1,141,676.148 N & E 0.49 Ft. HUNTPORT First N= 3,129,150.115 , E= 1,154,304.461 N & E 0.01 Ft. WAVE2 RM3 First N= 3,108,645.237, E= 1,161,924.832 N & E 0.49 Ft. HUNTS 2 Second N= 3,123,354.511 , E= 1,160,432.357 N & E 0.37 Ft. PRAIRIE Second N= 3,141,119.455 , E= 1,161,165.841 N & E 0.67 Ft. WAVE 2 Second N= 3,108,638.426 , E= 1,161,945.761 N & E 0.98 Ft. NGS station “CONPORT”, a horizontal “A” Order (1:10,000,000) station located at the Montgomery County Airport, was occupied with GPS to verify the position of NGS point T39 A. NGS station “51R A”, a horizontal “B” Order (1:1,000,000) station located at the Madison County Airport, was also occupied with GPS to verify the position of NGS point T39 A. NGS points “CONPORT” and “51R A” were not included in the MCN adjustment. See Appendix “A” labeled, DIAGRAM H, for NGS Horizontal Control plotted on a county-wide area.
City of Huntsville, Texas Mapping Control Network 2010 Technical Report
'�
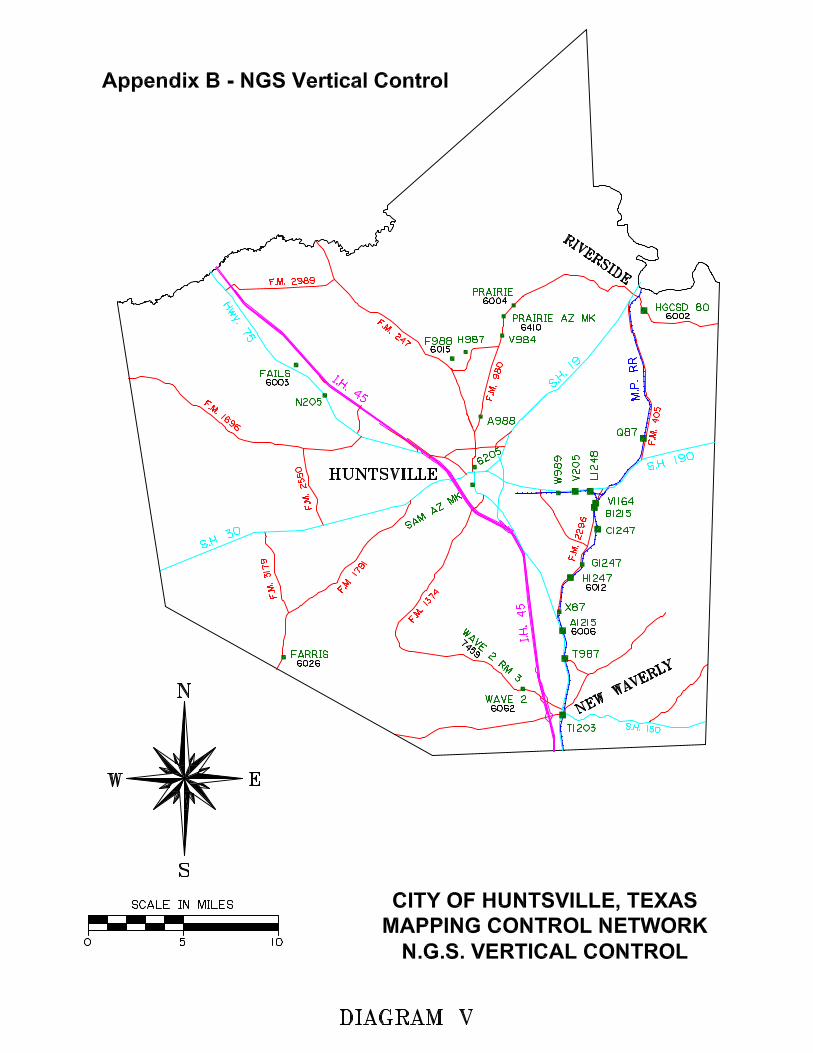
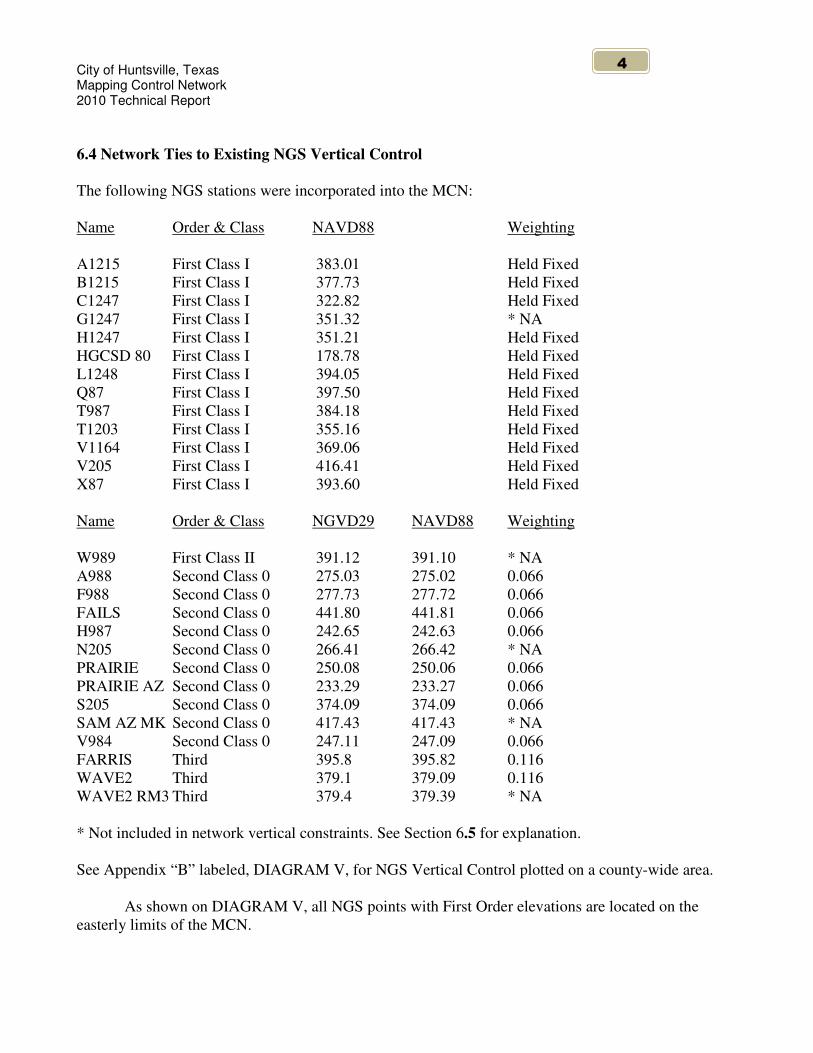
6.4 Network Ties to Existing NGS Vertical Control The following NGS stations were incorporated into the MCN: Name Order & Class NAVD88 Weighting A1215 First Class I 383.01 Held Fixed B1215 First Class I 377.73 Held Fixed C1247 First Class I 322.82 Held Fixed G1247 First Class I 351.32 * NA H1247 First Class I 351.21 Held Fixed HGCSD 80 First Class I 178.78 Held Fixed L1248 First Class I 394.05 Held Fixed Q87 First Class I 397.50 Held Fixed T987 First Class I 384.18 Held Fixed T1203 First Class I 355.16 Held Fixed V1164 First Class I 369.06 Held Fixed V205 First Class I 416.41 Held Fixed X87 First Class I 393.60 Held Fixed Name Order & Class NGVD29 NAVD88 Weighting W989 First Class II 391.12 391.10 * NA A988 Second Class 0 275.03 275.02 0.066 F988 Second Class 0 277.73 277.72 0.066 FAILS Second Class 0 441.80 441.81 0.066 H987 Second Class 0 242.65 242.63 0.066 N205 Second Class 0 266.41 266.42 * NA PRAIRIE Second Class 0 250.08 250.06 0.066 PRAIRIE AZ Second Class 0 233.29 233.27 0.066 S205 Second Class 0 374.09 374.09 0.066 SAM AZ MK Second Class 0 417.43 417.43 * NA V984 Second Class 0 247.11 247.09 0.066 FARRIS Third 395.8 395.82 0.116 WAVE2 Third 379.1 379.09 0.116 WAVE2 RM3 Third 379.4 379.39 * NA * Not included in network vertical constraints. See Section 6.5 for explanation. See Appendix “B” labeled, DIAGRAM V, for NGS Vertical Control plotted on a county-wide area.
As shown on DIAGRAM V, all NGS points with First Order elevations are located on the easterly limits of the MCN.
City of Huntsville, Texas Mapping Control Network 2010 Technical Report
)�
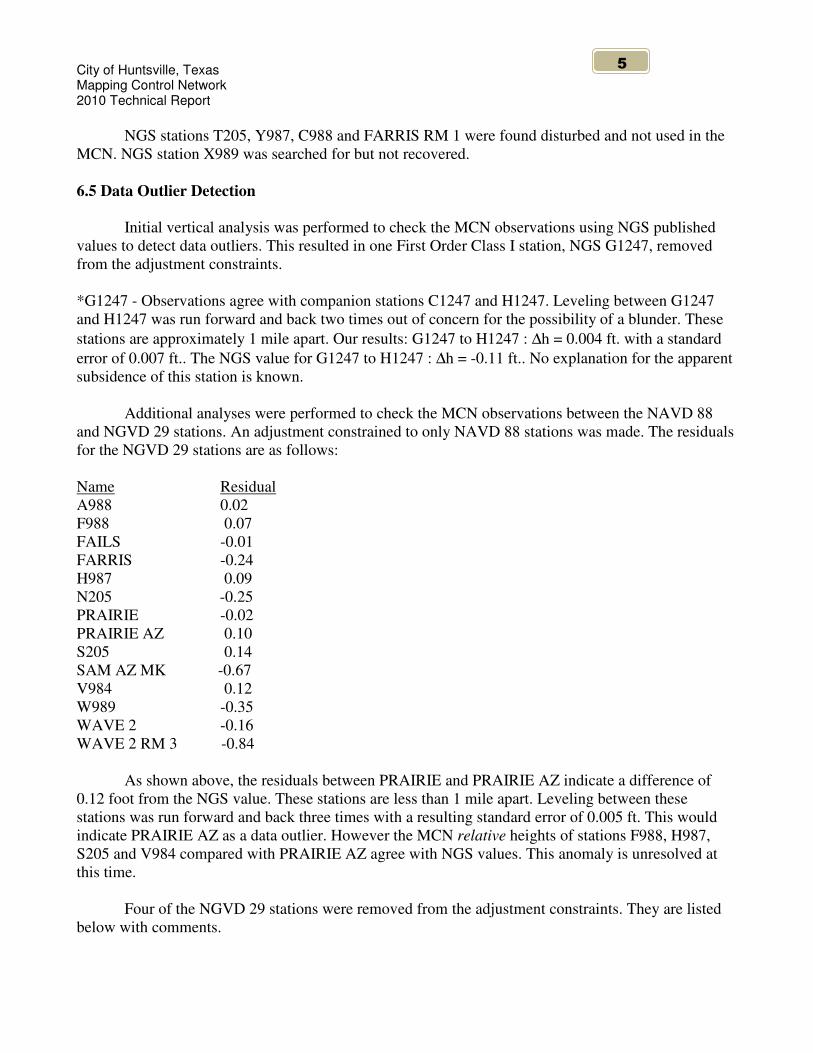
NGS stations T205, Y987, C988 and FARRIS RM 1 were found disturbed and not used in the MCN. NGS station X989 was searched for but not recovered. 6.5 Data Outlier Detection
Initial vertical analysis was performed to check the MCN observations using NGS published values to detect data outliers. This resulted in one First Order Class I station, NGS G1247, removed from the adjustment constraints. *G1247 - Observations agree with companion stations C1247 and H1247. Leveling between G1247 and H1247 was run forward and back two times out of concern for the possibility of a blunder. These stations are approximately 1 mile apart. Our results: G1247 to H1247 : ∆h = 0.004 ft. with a standard error of 0.007 ft.. The NGS value for G1247 to H1247 : ∆h = -0.11 ft.. No explanation for the apparent subsidence of this station is known.
Additional analyses were performed to check the MCN observations between the NAVD 88 and NGVD 29 stations. An adjustment constrained to only NAVD 88 stations was made. The residuals for the NGVD 29 stations are as follows: Name Residual A988 0.02 F988 0.07 FAILS -0.01 FARRIS -0.24 H987 0.09 N205 -0.25 PRAIRIE -0.02 PRAIRIE AZ 0.10 S205 0.14 SAM AZ MK -0.67 V984 0.12 W989 -0.35 WAVE 2 -0.16 WAVE 2 RM 3 -0.84
As shown above, the residuals between PRAIRIE and PRAIRIE AZ indicate a difference of 0.12 foot from the NGS value. These stations are less than 1 mile apart. Leveling between these stations was run forward and back three times with a resulting standard error of 0.005 ft. This would indicate PRAIRIE AZ as a data outlier. However the MCN relative heights of stations F988, H987, S205 and V984 compared with PRAIRIE AZ agree with NGS values. This anomaly is unresolved at this time.
Four of the NGVD 29 stations were removed from the adjustment constraints. They are listed
below with comments.
City of Huntsville, Texas Mapping Control Network 2010 Technical Report
/�
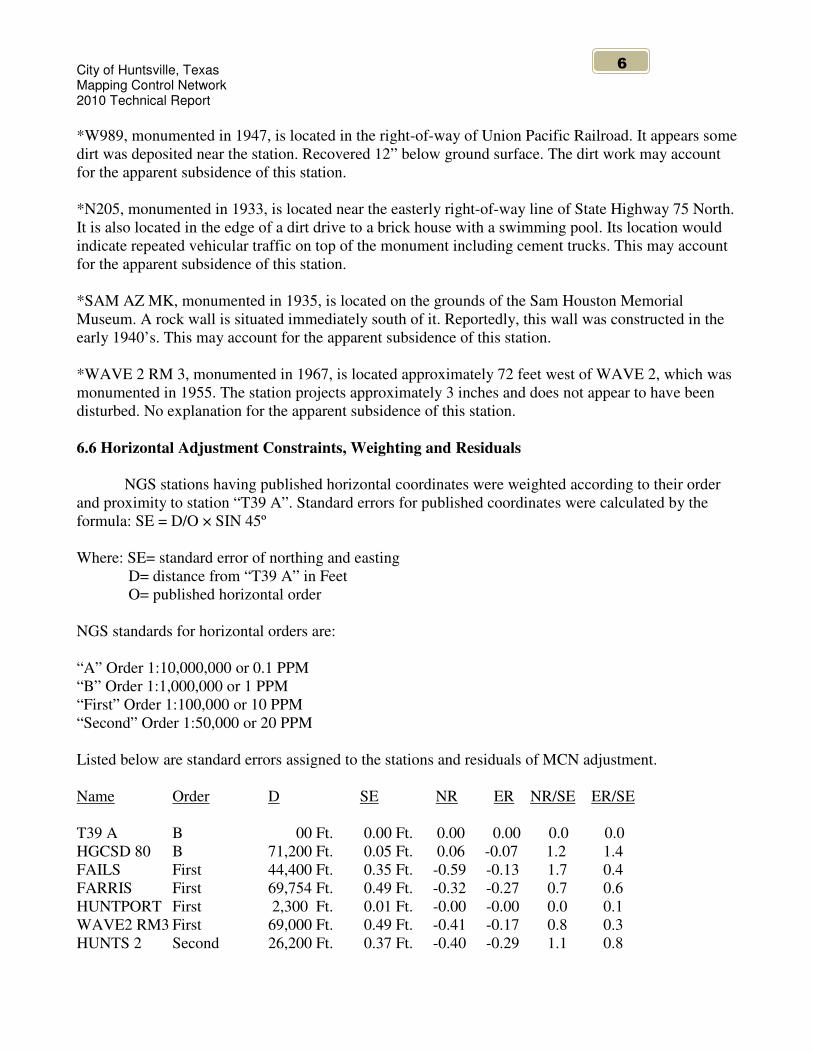
*W989, monumented in 1947, is located in the right-of-way of Union Pacific Railroad. It appears some dirt was deposited near the station. Recovered 12” below ground surface. The dirt work may account for the apparent subsidence of this station. *N205, monumented in 1933, is located near the easterly right-of-way line of State Highway 75 North. It is also located in the edge of a dirt drive to a brick house with a swimming pool. Its location would indicate repeated vehicular traffic on top of the monument including cement trucks. This may account for the apparent subsidence of this station. *SAM AZ MK, monumented in 1935, is located on the grounds of the Sam Houston Memorial Museum. A rock wall is situated immediately south of it. Reportedly, this wall was constructed in the early 1940’s. This may account for the apparent subsidence of this station. *WAVE 2 RM 3, monumented in 1967, is located approximately 72 feet west of WAVE 2, which was monumented in 1955. The station projects approximately 3 inches and does not appear to have been disturbed. No explanation for the apparent subsidence of this station. 6.6 Horizontal Adjustment Constraints, Weighting and Residuals
NGS stations having published horizontal coordinates were weighted according to their order and proximity to station “T39 A”. Standard errors for published coordinates were calculated by the formula: SE = D/O × SIN 45º Where: SE= standard error of northing and easting D= distance from “T39 A” in Feet O= published horizontal order NGS standards for horizontal orders are: “A” Order 1:10,000,000 or 0.1 PPM “B” Order 1:1,000,000 or 1 PPM “First” Order 1:100,000 or 10 PPM “Second” Order 1:50,000 or 20 PPM Listed below are standard errors assigned to the stations and residuals of MCN adjustment. Name Order D SE NR ER NR/SE ER/SE T39 A B 00 Ft. 0.00 Ft. 0.00 0.00 0.0 0.0 HGCSD 80 B 71,200 Ft. 0.05 Ft. 0.06 -0.07 1.2 1.4 FAILS First 44,400 Ft. 0.35 Ft. -0.59 -0.13 1.7 0.4 FARRIS First 69,754 Ft. 0.49 Ft. -0.32 -0.27 0.7 0.6 HUNTPORT First 2,300 Ft. 0.01 Ft. -0.00 -0.00 0.0 0.1 WAVE2 RM3 First 69,000 Ft. 0.49 Ft. -0.41 -0.17 0.8 0.3 HUNTS 2 Second 26,200 Ft. 0.37 Ft. -0.40 -0.29 1.1 0.8

City of Huntsville, Texas Mapping Control Network 2010 Technical Report
1�
PRAIRIE Second 47,300 Ft. 0.67 Ft. -0.77 -0.12 1.1 0.2 WAVE 2 Second 69,646 Ft. 0.98 Ft. -0.37 -0.09 0.4 0.1 Average 0.8 0.4 This indicates the overall MCN adjustment agrees with the published NAD 83 (1993) horizontal coordinate values of all 9 (nine) NGS stations in the MCN. 6.6 Vertical Adjustment Constraints, Weighting and Residuals
Estimated standard errors and weightings of NGS stations were made according to published values. NAVD 88 stations of the MCN were held fixed. NGVD 29 stations were assigned a standard error of 2cm or 0.066 ft. This is due to the VERTCON model being considered only accurate to +/- 2cm. Stations FARRIS and WAVE 2, third order stations, are only published to the nearest 0.1 ft. A standard error of 0.05 + 0.066 = 0.116 was used for FARRIS and WAVE2.
Listed below are standard errors assigned to all NGS stations and residuals of MCN adjustment. Name Pub. Elev. Adj. Elev. SE Residual Residual / SE A1215 383.01 383.010 0.000 0.000 0.0 A988 275.02 275.028 0.066 0.008 0.1 B1215 377.73 377.730 0.000 0.000 0.0 C1247 322.82 322.820 0.000 0.000 0.0 F988 277.72 277.777 0.066 0.057 0.9 FAILS 441.81 441.793 0.066 -0.017 0.3 FARRIS 395.82 395.587 0.116 -0.233 2.0 G1247 351.32 351.200 * NA -0.120 * NA H987 242.63 242.709 0.066 0.080 1.2 H1247 351.21 351.210 0.000 0.000 0.0 HGCSD 80 178.78 178.780 0.000 0.000 0.0 L1248 394.05 394.050 0.000 0.000 0.0 N205 266.42 266.164 * NA -0.252 * NA PRAIRIE 250.06 250.031 0.066 -0.029 0.4 PRAIRIE AZ 233.27 233.362 0.066 0.092 1.4 Q87 397.50 397.500 0.000 0.000 0.0 S205 374.09 374.200 0.066 0.110 1.7 SAM AZ MK 417.43 416.743 * NA -0.686 * NA T1203 355.16 355.160 0.000 0.000 0.0 T987 384.18 384.180 0.000 0.000 0.0 V205 416.41 416.410 0.000 0.000 0.0 V984 247.09 247.195 0.066 0.106 1.6 V1164 369.06 369.060 0.000 0.000 0.0 W989 391.10 390.744 * NA -0.356 * NA WAVE 2 379.09 378.942 0.116 -0.159 1.3
City of Huntsville, Texas Mapping Control Network 2010 Technical Report
2�
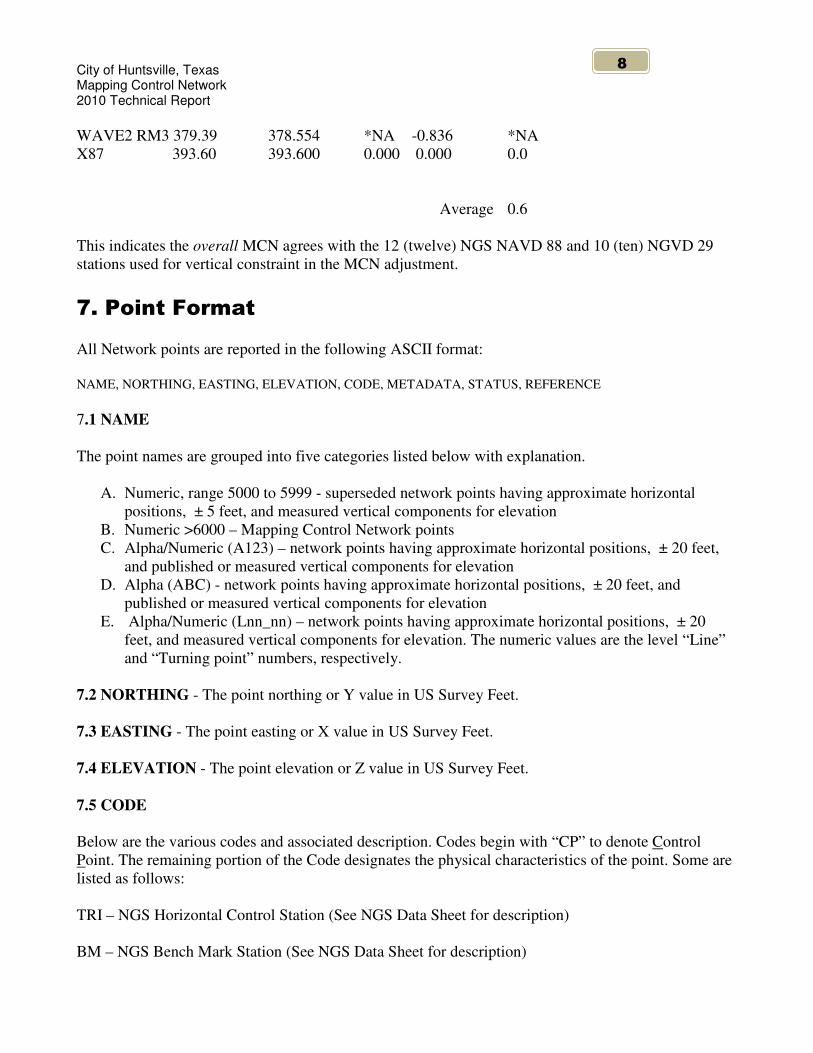
WAVE2 RM3 379.39 378.554 *NA -0.836 *NA X87 393.60 393.600 0.000 0.000 0.0 Average 0.6 This indicates the overall MCN agrees with the 12 (twelve) NGS NAVD 88 and 10 (ten) NGVD 29 stations used for vertical constraint in the MCN adjustment.
1!�,����*��$ ��� All Network points are reported in the following ASCII format: NAME, NORTHING, EASTING, ELEVATION, CODE, METADATA, STATUS, REFERENCE 7.1 NAME The point names are grouped into five categories listed below with explanation.
A. Numeric, range 5000 to 5999 - superseded network points having approximate horizontal positions, ± 5 feet, and measured vertical components for elevation
B. Numeric >6000 – Mapping Control Network points C. Alpha/Numeric (A123) – network points having approximate horizontal positions, ± 20 feet,
and published or measured vertical components for elevation D. Alpha (ABC) - network points having approximate horizontal positions, ± 20 feet, and
published or measured vertical components for elevation E. Alpha/Numeric (Lnn_nn) – network points having approximate horizontal positions, ± 20
feet, and measured vertical components for elevation. The numeric values are the level “Line” and “Turning point” numbers, respectively.
7.2 NORTHING - The point northing or Y value in US Survey Feet. 7.3 EASTING - The point easting or X value in US Survey Feet. 7.4 ELEVATION - The point elevation or Z value in US Survey Feet. 7.5 CODE Below are the various codes and associated description. Codes begin with “CP” to denote Control Point. The remaining portion of the Code designates the physical characteristics of the point. Some are listed as follows: TRI – NGS Horizontal Control Station (See NGS Data Sheet for description) BM – NGS Bench Mark Station (See NGS Data Sheet for description)
City of Huntsville, Texas Mapping Control Network 2010 Technical Report
3�
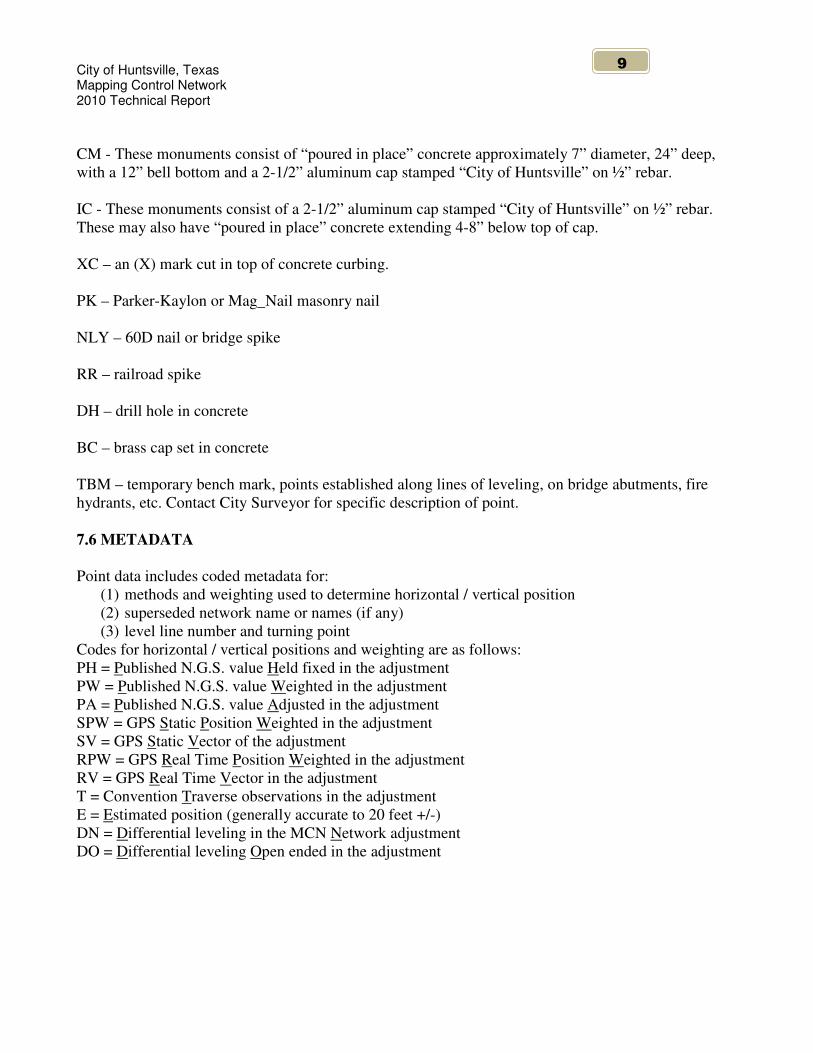
CM - These monuments consist of “poured in place” concrete approximately 7” diameter, 24” deep, with a 12” bell bottom and a 2-1/2” aluminum cap stamped “City of Huntsville” on ½” rebar. IC - These monuments consist of a 2-1/2” aluminum cap stamped “City of Huntsville” on ½” rebar. These may also have “poured in place” concrete extending 4-8” below top of cap. XC – an (X) mark cut in top of concrete curbing. PK – Parker-Kaylon or Mag_Nail masonry nail NLY – 60D nail or bridge spike RR – railroad spike DH – drill hole in concrete BC – brass cap set in concrete TBM – temporary bench mark, points established along lines of leveling, on bridge abutments, fire hydrants, etc. Contact City Surveyor for specific description of point. 7.6 METADATA Point data includes coded metadata for:
(1) methods and weighting used to determine horizontal / vertical position (2) superseded network name or names (if any) (3) level line number and turning point
Codes for horizontal / vertical positions and weighting are as follows: PH = Published N.G.S. value Held fixed in the adjustment PW = Published N.G.S. value Weighted in the adjustment PA = Published N.G.S. value Adjusted in the adjustment SPW = GPS Static Position Weighted in the adjustment SV = GPS Static Vector of the adjustment RPW = GPS Real Time Position Weighted in the adjustment RV = GPS Real Time Vector in the adjustment T = Convention Traverse observations in the adjustment E = Estimated position (generally accurate to 20 feet +/-) DN = Differential leveling in the MCN Network adjustment DO = Differential leveling Open ended in the adjustment
City of Huntsville, Texas Mapping Control Network 2010 Technical Report
��
7.7 STATUS Point status of a point is indicated in four categories:
(1) ACTIVE – existing points with N.G.S. published or surveyed horizontal coordinates and N.G.S. published or surveyed elevations
(2) VERTICAL ONLY - existing points with estimated horizontal coordinates and published or surveyed elevations
(3) DESTROYED – points that have been destroyed (4) DISTURBED? – points that may have been disturbed since surveyed
7.8 REFERENCE – used to link reference sheet to point
�
2!������� �4����� ����������4����$ � The NGS’s most recent nation-wide readjustment is referred to as the National Spatial Reference System (NSRS). The NGS officially has named the adjustment “NAD 83 (NSRS 2007)”.
As stated in Section 3, NGS station, PID AB2827, designated “T39 A” was held fixed due to its high order of accuracy and its proximity to the center of the MCN. The NAD 83 (1993) and NAD 83 (NSRS 2007) coordinates were compared for T39 A. Listed below are the results. T39A - NAD 83 (1993) MCN Latitude 30°44’16.25238” N (Published) Longitude 95°35’15.23500” W (Published) Ellipsoid Height 84.106 Meters *See Note below. T39A - NAD 83 (NSRS 2007) Published Latitude 30°44’16.25250” N Longitude 95°35’15.23519” W Ellipsoid Height 84.164 Meters Accuracy Estimates: Lat. 1.78 cm, Long. 1.33 cm, Ellip. Ht. 2.04 cm Deltas (1993-2007) Lat. -00.00012” Long. -00.00019” Ellip. Ht. -5.8 cm Northing +0.013 Ft. / 0.40 cm Easting -0.016 Ft. / 0.49 cm
The change in horizontal position is less than the NGS’s Accuracy Estimates. Therefore the differences in position were considered insignificant and not applied.
City of Huntsville, Texas Mapping Control Network 2010 Technical Report
�
The NGS’s NAD 83 (NSRS 2007) adjustment included only three of the nine horizontal stations incorporated in the MCN adjustment. These three are: T39 A, HGCSD 80 and HUNTPORT.
Stations T39 A and HUNTPORT are both located at the Huntsville Municipal Airport and HGCSD 80 in Riverside, Texas. Due to this fact, and the insignificant changes in position, the MCN continues to constrain to the nine NGS stations and their NAD 83 (1993) values.
NOTE: This MCN Ellipsoid Height was calculated by taking the MCN NAVD 88 height, determined by differential leveling from NAVD 88 First Order Stations, and applying the Geoid height value derived from NGS model “GEOID 09”. The orthometric height (elevation), for T39A is 111.316 meters. The computed Geoid height is -27.21 meters. This results in an Ellipsoidal Height of 84.106 meters. The current NGS model “GEOID 09” is now used for the MCN adjustment. Previous modeled Geoid height values for this station are: GEOID ‘99 = -27.13 meters GEOID ‘03 = -27.06 meters GEOID ‘09 = -27.21 meters The change from ’03 to ’09 is 15 cm or 0.49 ft. The Geoid height value derived from MCN leveling and the NGS adjusted Ellipsoidal Height. NGS adjusted Ellipsoidal Height: 84.164 (+/- 2 cm) MCN adjusted NAVD 88 height: 111.316 (+/- 2 cm) Geoid height= -27.152 meters.
The published NGS NAVD 88 height of T39A is 365.7 Ft. The MCN value is 365.21 Ft. or a difference of 0.49 Ft.
The NGS data sheet states the height was derived by GPS observations. Also stated on the NGS
data sheet “GPS derived orthometric heights for airport stations designated as PACS or SACS are published to 2 decimal places. This maintains centimeter relative accuracy between the PACS or SACS. It does not indicate centimeter accuracy relative to other marks which are part of the NAVD 88 network.”
In consultation with the NGS’s State Advisor, concerning these height discrepancies, I was
informed “Due to the methods used to determine the NAVD 88 height for this station, a half of a foot would not be unreasonable, I suggest you use the elevation determined by differential leveling”.
�

City of Huntsville, Texas Mapping Control Network 2010 Technical Report
��
3!�4$ $ ����
� The City of Huntsville, Texas, Public Works – Surveying, provides this data to serve the public and to promote safe and unified development.
Efforts are ongoing to improve the accuracy and densification of the MCN. Due to the dynamic
nature of this network slight differences may occur between coordinate and elevation values of a point and those shown on its reference sheet. The values extracted from the web data base are the current values and should be used.
Updates to this Report will be made, as needed, as work progresses on the MCN. Additional
network points will be added as this work progresses. Users are encouraged to report any discrepancies or points found destroyed. Comments and inquires, concerning the MCN, should be directed to:
Leonard E. “Gene” Woods, R.P.L.S., L.S.L.S. City Surveyor 448 State Hwy. 75 North Huntsville, Texas 77320 Business: 936-294-5792 Fax: 936-294-5795 Email: [email protected]