Embed Size (px)
Citation preview

' >'"'! < iif^ .*>.'*''.*
: V.'
»ilf^i^iev^^: :.;:-:
Pink Salmon, Oncorhynchus gorbuscha,
Tagging Experinnents in Soutlieastern
Alaska, 1938-42 and 1945
ROY E. NAKATANI, GERALD J. PAULIK, and RICHARD VAN CLEVE
SEATTLE. WA
April 1975
noaa NATIONAL OCEANIC AND / National Marine
ATMOSPHERIC ADMINISTRATION / Fisheries Service
NOAA TECHNICAL REPORTS
National Marine Fisheries Service, Special Scientific Report—Fisheries Series
The major responsibilities of the National Marine Fisheries Service (NMFS) are to monitor and assess the abundance and geographic distribution of fisher>' resources, to
understand and predict fluctuations in the quantity and distribution of these resources, and to establish levels for optimum use of the resources. NMFS is also charged with
the development and implementation of policies for managing national fishing grounds, development and enforcement of domestic fisheries regulations, surveillance of foreign
fishing off United States coastal waters, and the development and enforcement of international fishery agreements and policies. NMFS also assists the fishing industry through
marketing ser\'ice and economic analysis programs, and mortgage insurance and vessel construction subsidies. It collects, analyzes, and publishes statistics on various phases of
the industry.
The Special Scientific Report—Fisheries series was established in 1949. The series carries reports on scientific investigations that document long-term continuing programs
of NMFS. or intensive scientific reports on studies of restricted scope. The reports may deal with applied fishery problems. The series is also used as a medium for the publica-
tion of bibliographies of a specialized scientific nature.
NOAA Technical Reports NMFS SSRF are available free in limited numbers to governmental agencies, both Federal and State. They are also available in exchange for
other scientific and technical publications in the marine sciences. Individual copies may be obtained (unless otherwise noted) from D83. Technical Information Division,
Environmental Science Information Center, NOAA. Washington, D.C. 20235. Recent SSRF's are:
619. Macrozooplankton and small nekton in the coastal waters off Vancouver Island
(Canada) and Washington, spring and fall of 1963. By Donald S. Day, January 1971. iii +
94 pp., 19 figs.. 13 tables.
635. A bibliography of the blackfin tuna, Thunnus atlanticus (Lesson). By Grant L.
Beardsley and David C. Simmons. August 1971, 10 pp. For sale by the Superintendent of
Documents. U.S. Government Printing Office, Washington, D.C. 20402.
620. The Trade Wind Zone Oceanography Pilot Study. Part IX: The sea-level wind field
and wind stress values. July 1963 to June 1965. By Gunter R. Seckel. June 1970, iii + 66
pp., 5 figs.
636. Oil pollution on Wake Island from the tanker R. C- Stoner. By Reginald M.Gooding. May 1971. iii + 12 pp.. 8 figs.. 2 tables. For sale by the Superintendent of
Documents, U.S. Government Printing Office, Washington, D.C. 20402.
621. Predation by sculpins on fall chinook salmon, Oncorhynchus tshawytscha. fry of
hatchery origin. By Benjamin G. Patten. February 1971, iii + 14 pp.. 6 figs., 9 tables.
622. Number and lengths, by season, of fishes caught with an otter trawl near Woods
Hole, Massachusetts, September 1961 to December 1962. By F. E. Lux and F. E. Nichy.
February 1971, iii + 15 pp., 3 figs.. 19 tables.
623. Apparent abundance, distribution, and migrations of albacore, Thunnus aialunga.
on the North Pacific longline grounds. By Brian J. Rothschild and Marian Y. Y. Yong.
September 1970. v + 37 pp., 19 figs., 5 tables.
624. Influence of mechanical processing on the quahty and yield of bay scallop meats. By
N. B. Webb and F, B. Thomas. April 1971, iii + 11 pp., 9 figs.. 3 tables.
637. Occurrence of larval, juvenile, and mature crabs in the vicinity of Beaufort Inlet.
North Carolina. By Donnie L. Dudley and Mayo H. Judy. August 1971. iii + 10 pp.. 1 fig..
5 tables. For sale bv the Superintendent of Documents. U.S. Government Printing Office,
Washington. D.C. '20402.
638. Length-weight relations of haddock from commercial landings in New England.1931-55. By Bradford E, Brown and Richard C. Hennemuth. August 1971, v -t- 13 pp.. 16
figs., 6 tables. 10 appendix A tables. For sale by the Superintendent of Documents, U.S.
Government Printing Office. Washington, D.C. 20402.
639. A hydrographic survey of the Galveston Bay system, Texas 1963-66. By E. J. Pullen,
W. L.Trent, and G. B. Adams. October 1971. v + 13 pp.. 15 figs,. 12 Ubies. For saleby the
Superintendent of Documents. U.S. Government Printing Office. Washington, D.C.20402.
625. Distribution of salmon and related oceanographic features in the North Pacific
Ocean, spring 1968. By Robert R. French, Richard G. Bakkala. Masanao Osako. and Jun
Ito. March 1971. iii + 22 pp.. 19 figs.. 3 tables.
626. Commercial fishery and biology of the freshwater shrimp. Macrobrachium, in the
LowerSt. Paul River. Liberia, 1952-53. By George C. Miller. February 1971. iii -t- 13 pp.. 8
figs.. 7 tables.
627. Calico scallops of the Southeastern United States, 1959-69. By Robert Cummins, Jr.
June 1971, iii -t- 22 pp.. 23 figs,, 3 tables.
628. Fur Seal Investigations. 1969. By NMFS. Marine Mammal Biological Laboratory-
August 1971. 82 pp.. 20 figs.. 44 tables. 23 appendix A tables. 10 appendix B tables.
629. Analysis of the operations of seven Hawaiian skipjack tuna fishing vessels. June-
August 1967. By Richard N. Uchida and Ray F. Sumida. March 1971. v + 25 pp., 14 figs..
21 tables. For sale by the Superintendent of Documents. U.S. Government Printing Of-
fice. Washington. D.C. 20402.
640- Annotated bibliography on the fishing industn,- and biolog>- of the blue crab,
CaUinectes sapidus. By Marlin E Tagatz and Ann Bowman Hall. August 1971. 94 pp. For
sale by the Superintendent of Documents, U.S. Government Printing Office, Washington,
D.C. 20402.
641. Llse of threadfin shad. Dorosoma petenense, as live bait during experimental pole-
and-line fishing for skipjack tuna, KaCsuwonus pelamin. in Hawaii. By Robert T, B.
Iversen. August 1971. iii + 10 pp., 3 figs., 7 tables. For sale by the Superintendent of
Documents, U.S. Government Printing Office, Washington. DC. 20402.
642. Atlantic menhaden Brevoortia tyrannus resource and fishery—analysis of decline.
By Kenneth A. Henr>'. August 1971. v + 32 pp.. 40 figs.. 5 appendix figs., 3 tables. 2
appendix tables. For sale by the Superintendent of Documents. U.S. Government Printing
Office, Washington. D.C. 20402.
643. Surface winds of the southeastern tropical Atlantic Ocean, By John M. Steigner andMerton C. Ingham, October 1971. iii + 20 pp.. 17 figs. For sale by the Superintendent of
Documents, U.S. Government Printing Office, Washington. D.C, 20402.
630. Blue crab meat. I. Preservation by freezing, July 1971. iii -f 13 pp.. 5 figs., 2 tables.
n. Effect of chemical treatments on acceptability. By Jurgen H. Strasser. Jean S. Lennon.
and Frederick J. King. July 1971. iii + 12 pp.. 1 fig., 9 tables.
631. Occurrence of thiaminase in some common aquatic animals of the United States
and Canada. By R. A. Greig and R. H. Gnaedinger, July 1971. iii + 7 pp.. 2 tables.
632. An annotated bibliography of attempts to rear the larvae of marine fishes in the
laboratory. By Robert C. May. August 1971, iii + 24 pp.. 1 appendix I table. 1 appendix II
table. For sale Idv the Superintendent of Documents. U.S. Government Printing Office,
Washington. D.C. 20402.
633. Blueing of processed crab meat. U. Identification of some factors involved in the
blue discoloration of canned crab meat CaUinectes sapidus By Melvin E. Waters. May1971. iii + 7 pp.. 1 fig., 3 tables.
634. Age composition, weight, length, and sex of herring, Clupea pallasii. used for reduc-
tion in Alaska. 1929-66. By Gerald M. Reid. July 1971. iii + 25 pp.. 4 figs.. 18 tables.
644. Inhibition of fiesh browning and skin color fading in frozen fillets of yelloweye
snapper (Lutzanus vivanus). By Harold C. Thompson, Jr., and Mary H. Thompson.
February 1972. iii + 6 pp.. 3 tables. For sale by the Superintendent of Documents, U.S.
Government Printing Office. Washington, D.C 20402.
645. Traveling screen for removal of debris from rivers. By Daniel W. Bates. Ernest W.Murphey. and Martin G. Beam. October 1971, iii + 6 pp.. 6 figs.. 1 table. For sale by the
Superintendent of Documents, U.S. Government Printing Office. Washington. D.C.
20402.
646. Dissolved nitrogen concentrations in the Columbia and Snake Rivers in 1970 and
their effect on chinook salmon and steelhead trout. By Wesley J. Ebel. August 1971, iii + 7
pp.. 2 figs.. 6 tables. For sale by the Superintendent of Documents, U.S. GovernmentPrinting Office. Washington, D.C. 20402.
647. Revised annotated list of parasites from sea mammals caught off the west coast of
North America. By L. Margolis and M. D. Dailey. March 1972, iii + 23 pp. For sale by the
Superintendent of Documents. U.S. Government Printing Office, Washington, D.C20402.
Continued on inside back cover.

NOAA Technical Report NMFS SSRF-686
Marine Biological Laboratory
LIBRARY
OCT 14 1992
Woods Hole, Mass.
Pink Salmon, Oncorhynchus
gorbusha, Tagging Experiments
in Southeastern Alaska,
1938-42 and 1945
ROY E. NAKATANI, GERALD J. PAULIK, andRICHARD VAN CLEVE
SEATTLE, WA
April 1975
UNITED STATES
DEPARTMENT OF COMMERCEFrederick B. Dent, Secretary
NATIONAL OCEANIC ANDATMOSPHERIC ADMINISTRATION
Robert M White, Administrator
Far aale by the Superintendent of Documents, U.S. GovernmentPrinting Office, Washington, D.C. 20402
National Marine
Fisheries Service
Robert W. Schoning. Director
"""'sr^*"

The National Marine Fisheries Service (NMFS) does not approve, rec-
ommend or endorse any proprietary product or proprietary material
mentioned in this publication. No reference shall be made to NMFS, or
to this publication furnished by NMFS, in any advertising or sales pro-
motion which would indicate or imply that NMFS approves, recommends
or endorses any proprietary product or proprietary material mentioned
herein, or which has as its purpose an intent to cause directly or indirectly
the advertised product to be used or purchased because of this NMFSpublication.

CONTENTS
Page
Introduction 1
Historical review 3
Experimental and analytic methods 3
Tags and tagging 3
Preliminary processing of data 4
Release and recovery information 4
Migration routes as determined from tag recoveries 8
Migration between northern and southern southeastern Alaska 8
Migration through Peril Strait 8
Distribution of trap recoveries from experiments in Icy Strait and Chatham Strait 9
Icy Strait 9
Upper Chatham Strait 12
Middle Chatham Strait 17
Lower Chatham Strait 19
Summary and discussion of general migration patterns as determined from tag recaptures ... 21
Relative abundance and migration as determined from trap catch data 24
Rate of travel determined from tagging data 28
Mortality rates 29
Recommendations for the design of future tagging experiments 36
Summary 38
Acknowledgments 39
Literature cited 39
Figures
1. Southeastern Alaska, area of pink salmon tagging experiments in 1938-42 and 1945 2
2. Northern part of southeastern Alaska showing major statistical areas and subareas used for
computer analysis of pink salmon tag recapture data 5
3. Locations and code numbers of principal trap sites, 1938-42 and 1945 7
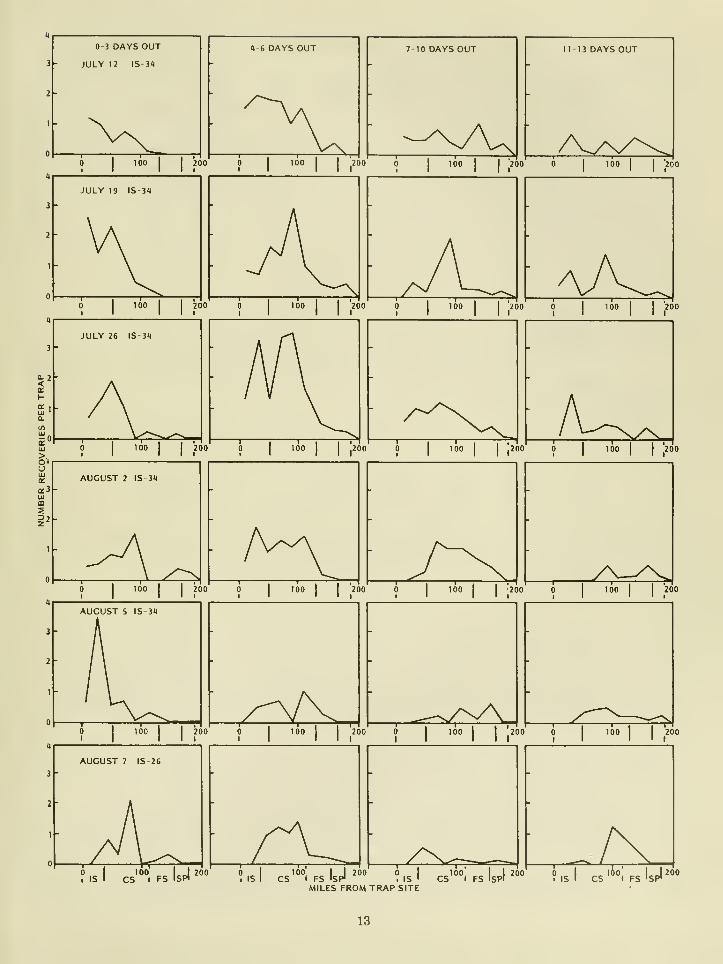
4. Tag recoveries per trap by 20-mile intervals measured from points of release in Icy Strait,
1941 . 13
5. Tag recoveries per trap by 20-mile intervals measured from points of release in Icy Strait,
1942 14
6. Tag recoveries per trap per time period by 20-mile intervals measured from point of release
in upper Chatham Strait, 1940 15
7. Tag recoveries per trap by 20-mile intervals measured from point of release in upper ChathamStrait, 1941 16
8. Tag recoveries per trap per time period by 20-mile intervals measured from point of release
in upper Chatham Strait, 1942 17
9. Tag recoveries per trap per time period by 20-mile intervals measured from point of release
in middle Chatham Strait, 1940.
10. Tag recoveries per trap per time period by 20-mile intervals measured from point of release
in middle Chatham Strait, 1941.
11. Tag recoveries per trap per time period by 20-mile intervals measured from point of release
in middle Chatham Strait, 1942.
12. Tag recoveries per trap per time period by 20-mile intervals measured from point of release
in lower Chatham Strait, 1938.
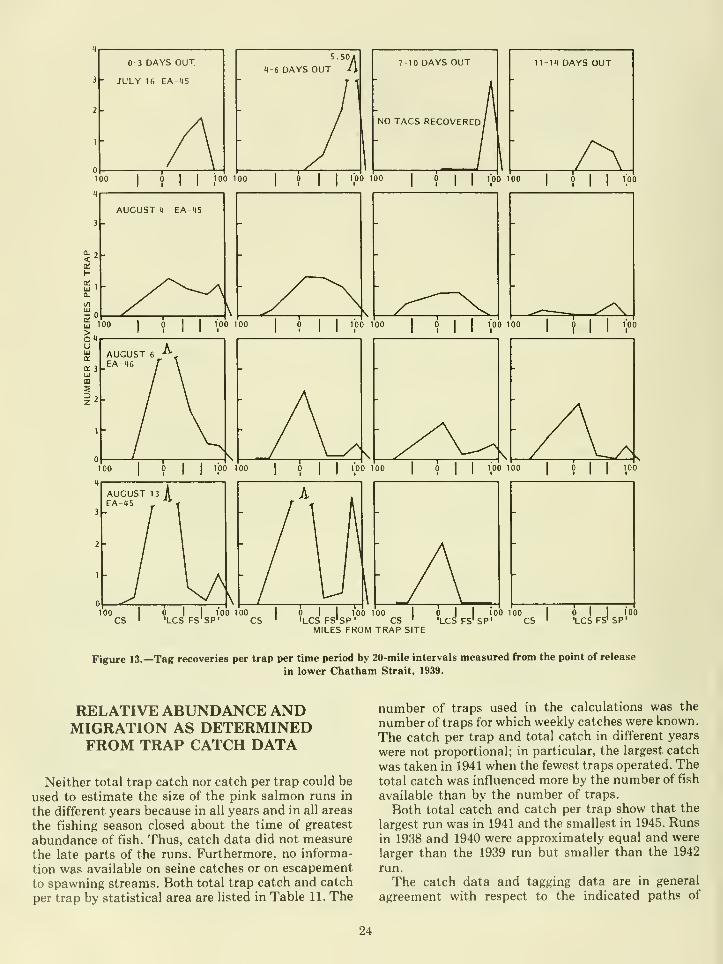
13. Tag recoveries per trap per time period by 20-mile intervals measured from point of release
in lower Chatham Strait, 1939.
2514. Tag recoveries per trap per time period by 20-mile intervals measured from point of release
in lower Chatham Strait, 1941
15. Tag recoveries per trap per time period by 20-mile intervals measured from point of release
in lower Chatham Strait, 1942 25
18
20
21
22
24
HI

16. Average number of pink salmon caught per trap per week in each major statistical area in
1938 26
17. Average number of pink salmon caught per trap per week in each major statistical area in
1939 26
18. Average number of pink salmon caught per trap per week in each major statistical area in
1940 27
19. Average number of pink salmon caught per trap per week in each major statistical area in
1941 27
20. Average number of pink salmon caught per trap per week in each major statistical area in
1942 28
21. Exploitation isopleth for the total pink salmon run entering the northern part of south-
eastern Alaska, 1938 35
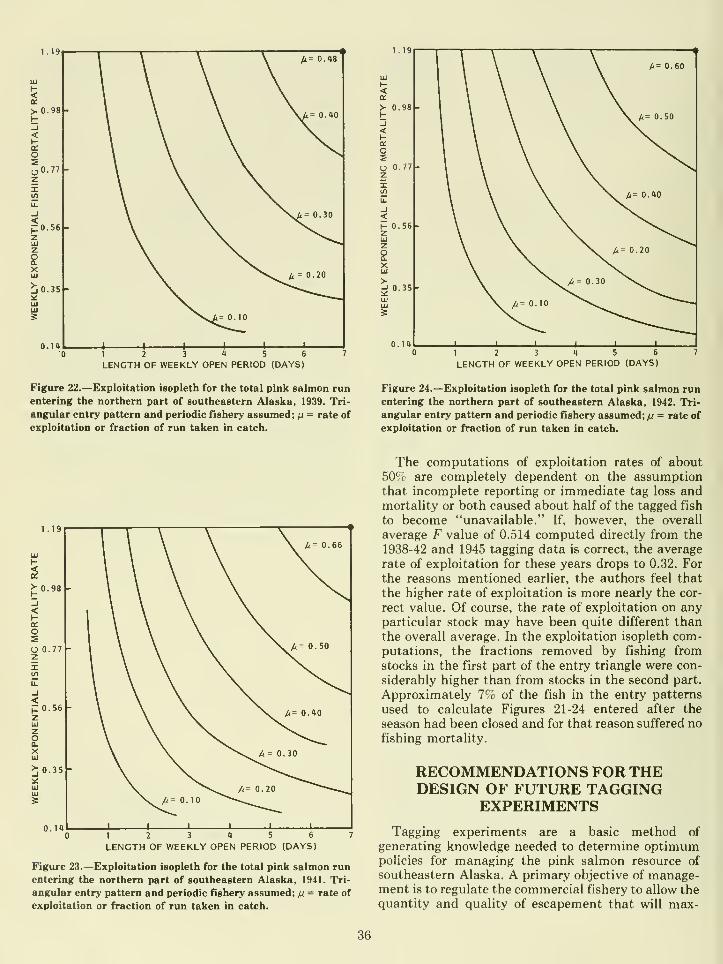
22. Exploitation isopleth for the total pink salmon run entering the northern part of south-
eastern Alaska, 1939 36
23. Exploitation isopleth for the total pink salmon run entering the northern part of south-
eastern Alaska, 1941 36
24. Exploitation isopleth for the total pink salmon run entering the northern part of south-
eastern Alaska, 1942 36
Tables
1. Closing dates of fishing season in major statistical subareas of southeastern Alaska,1938-42 6
2. Number of salmon traps in major statistical subareas in southeastern Alaska in 1938-42
and 1945 63. Number of tagging experiments conducted in southeastern Alaska areas during 1938-42
and 1945 6
4. Number of tags released and number recovered in tagging experiments in southeasternAlaska, 1938-42 and 1945 8
5. Summary of release and recovery information from tagging conducted in southeasternAlaska during 1938-42 and 1945 10
6. Comparison between recoveries in Sumner Strait and total recoveries, July and August1938-42 and 1945 12
7. Recovery areas of tags released from traps in Icy Strait, 1941-42 14
8. Recovery areas of tags released from traps in upper Chatham Strait, 1940-42 15
9. Recovery areas of tags released from traps in middle Chatham Strait, 1940-42 18
10. Recovery areas of tags released from traps in lower Chatham Strait, 1938-39 and 1941-42. . . 23
11. Total trap catch and catch per trap in major statistical subareas in southeastern Alaska,1938-42 and 1945 26
12. Time difference between average weekly catches of fish in traps in outer Icy Strait andfour inner areas and miles traveled per day 29
13. Time difference between average weekly catches of fish in traps in lower Chatham Strait
and two inner areas and miles traveled per day 3014. Rates of travel of tagged fish estimated by regression technique 31
15. List of ^-values for comparison between mean days out for trap recoveries and mean daysout for seine recoveries 32
16. Weekly survival rates, weekly exploitation rates, experimental fishing mortality rates,
and other-loss rates for 30 groups of tagged fish 33
IV

Pink Salmon, Oncorhynchus gorbuscha,Tagging Experiments in Southeastern
Alaska, 1938-42 and 1945'
ROY E. NAKATANI,^ GERALD J. PAULIK,' and RICHARD VAN CLEVE'
ABSTRACT
A total of 20,532 pink salmon {Oncorhynchus gorbuacha) were tagged and released in
southeastern Alaska north of Sumner Strait during the years of 1938 to 1942 inclusive, and in
1945. The recovery of 7,027 of these tags in the fish traps confirmed the findings of other in-
vestigators that the pink salmon stocks of the northern part of southeast Alaska are separate
from those in the southern part. They also show that pink salmon enter the northern part of
southeast Alaska through two paths: (1) through Icy Strait, and (2) through the lower end of
Chatham Strait. No evidence was found of movement through Peril Strait from Salisbury
Sound into Chatham Strait. The centers of density of each group of tags appeared to move in a
consistent manner, but a smaller number of tags from each release were dispersed throughout
the northern part of southeastern Alaska. Differences were noted between the movements of
fish in odd and even years. Also a larger proportion of earlier tagged fish moved to recovery
locations father inland. In all areas and in all years the fishing season closed about the time of
the greatest abundance of fish in the fishery, therefore the later parts of the runs were not
studied. Apparently the 1941 run was the largest and that in 1945 the smallest. Migration rates
were studied by plotting the catch per trap as well as by the recovery of tags. The latter showed
movements of 9.05 to 33.37 miles per day. Survival rates computed for thirty releases with total
tag recovery periods of two or more weeks averaged 0.384. Weekly exploitation rates varied
from 0.142 to 0.452 averaging 0.250. The weekly F exponential rate of fishing averaged 0.514.
Recoveries of tags from seines were not used since their proportion of tags recovered was less
than one-half their proportion of the catch. Recommendations are made for future tagging ex-
periments based upon the results of this analysis.
INTRODUCTION
From about 1920 to 1950 the U.S. Fish and Wildhfe
Service (FWS) collected considerable data on Alaska
fisheries. An inventory of these data, made under a
contract between the University of WashingtonCollege of Fisheries and the FWS, disclosed records of
pink salmon, Oncorhynchus gorbuscha, tagged in the
northern part of southeastern Alaska (Fig. 1) in 1938-
42 and 1945. A total of 20,532 tagged fish were released
in 55 tagging experiments during the 6 yr; 7,027 of the
tags were recovered. In this report the tagging andrecovery data are analyzed; supplemented by records
of the daily catches of pink salmon from about 100
traps that operated in the area in the years covered bythe experiments.
'Contribution No. 401 from the College of Fisheries, University
of Washington.
'Assistant Director, Fisheries Research Institute, College of Fish-
eries, University of Washington, Seattle.
'Deceased. Formerly Professor, College of Fisheries, University
of Washington, Seattle.
'Professor, College of Fisheries, University of Washington,
Seattle.
All recovery and catch data were transferred to
punch cards and processed through an electronic
digital computer at the Research ComputerLaboratory, University of Washington. Details of
programming for the different analyses, including
tables of the data used in the computations, are on file
at the National Marine Fisheries Service Auke BayFisheries Laboratory at Auke Bay, Alaska, and at the
College of Fisheries.' Past reports on salmon tagging
experiments in Alaska include those by Rich (1927),
Rich and Suomela (1929), and Rich and Morton(1930).
The tagging experiments covered in this report
must be evaluated with a full understanding of the
restrictions imposed on the staff originally responsible
for them. The difficulties involved in executing a
tagging and recovery program covering an area the
size of the northern half of southeastern Alaska andinvolving a fishery as complex as the pink salmon
'Nakatani, R. E.. G. J. Paulik, and R. Van Cleve. 1963. Analysis
of past Alaskan pink salmon tagging experiments, 19.38-1945. Un-
published manuscript, 163 p. Fisheries Research Institute, Univer-
sity of Washington, Seattle, WA 98195.

T139°
Figure 1. — Southeastern
Alaska, area of pink salmon
tagging experiments in 1938-
42 and 1945.
^^o
"%0
•Sifo
-Li 1 1—
fishery in this area can be appreciated by those whohave attempted such work. Our evaluation has been
possible only because of the efforts of the early
biologists who collected and preserved the data under
difficult conditions. Any criticisms of the techniques
or any deficiencies noted in the programs are
presented only to facilitate the design of future ex-
periments.
HISTORICAL REVIEW
The first major tagging experiments on pink salmonin southeastern Alaska were conducted in 1924 and1925 by the Bureau of Fisheries under the direction of
Willis H. Rich (Rich 1927) "... to discover the mainroutes of the salmon migrating through the maze of
channels of the Alexander Archipelago and the dis-
tribution of the fish following these routes to the
various spawning grounds." This work was continued
by Rich and Suomela (1929) and Rich and Morton(1930).
One of the most significant findings of these early
workers was the virtual separation of the southeastern
Alaska fishery into two distinct areas—one to the
north of Kuiu, Kupreanof, and Mitkof islands, and
the other to the south. The interchange of tagged pink
salmon between these areas was so small that for all
practical purposes the areas could be considered
separate. The northern area included Icy Strait, LynnCanal, Chatham Strait, Frederick Sound, andStephens Passage; the southern area included
Sumner Strait, Clarence Strait, and the south andwest coasts of Prince of Wales Island.
Tagged pink salmon released in Icy Strait movedeastward and then southward in Chatham Strait to
Frederick Sound. In Frederick Sound they traveled
eastward and then northward. Most of the pink
salmon released in lower Chatham Strait during mid-
July moved into Frederick Sound, and those released
in early August moved north into upper ChathamStrait and south into Sumner Strait. Fish released in
Frederick Sound in early August distributed
themselves throughout Frederick Sound and along
Stephens Passage.
An extensive series of experiments in the southern
area and some tagging experiments in the northern
portion of southeastern Alaska were reported byVerhoeven.' Verhoeven concluded that the pink
salmon spawning migration is a "random to-and-fro"
wandering through the fishery. He maintained that
the apparent directional tendencies found by other in-
vestigators resulted from random movement com-bined with the location of the fishery in relation to the
location of the tagging stations. The validity of
'Verhoeven, L. A. 1952. A report to the salmon fishing industry of
Alaska on the results of the 1947 tagging experiments. Unpublishedmanuscript, 21 p. Fisheries Research Institute, University of Wash-ington, Seattle, WA 98195.
Verhoeven's hypothesis of random to-and-fro move-
ment is of critical importance to the formulation of anacceptable policy for regulating the fishery. If pink
salmon move randomly within an area, anygeographical variation in fishing intensity in the area
would not differentially affect the population. Only
the total fishing pressure would determine the escape-
ment of any particular stream and would affect all
races in the same manner. The primary function of
management would then be to define each of these
homogeneous areas and to regulate each area as one
unit.
The independence of salmon stocks in the southern
and northern portions of southeastern Alaska was also
shown by Verhoeven (citation in footnote 6, Figs. 25,
26).
During 1950, 17,400 pink salmon were tagged in Icy
Strait and upper Chatham Strait by the FWS (Elling
and Macy 1955). Tagged fish were released daily from
tagging stations in Icy Strait from 25 July through 14
August, ending the day before the opening of the com-mercial fishing season. Generally speaking, the results
of the 1950 tagging experiments agreed with the
results of Rich and his colleagues in the twenties.
Stream surveys, combined with a daily schedule of
tagging, enabled Elling and Macy (1955) to determine
when pink salmon destined for a particular spawning
stream passed the various tagging sites. However, the
limited period during which daily releases were maderestricted the utility of the experiments. Different
races of pink salmon passing the Icy Strait tagging
stations were not separated in time into clear-cut
groups. Elling and Macy (1955) found that fish boundfor streams in Stephens Passage, Chatham Strait, and
Icy Strait passed through Icy Strait about the sametime.
EXPERIMENTAL AND ANALYTICMETHODS
Tags and Tagging
The method used in tagging during the 1938-42 and1945 experiments was described to us by S. J.
Hutchinson in a personal interview. S. J. Hutchinson
participated in the experiments. Fish were captured
in salmon traps and were tagged with a metal strap
tag clipped to the dorsal margin of the caudal fin. Themethod of handling during tagging was similar to that
described by Davidson and Christey (1938).
In 1938-41, tags were serially numbered so that each
fish could be identified on recovery. In 1942 and 1945,
a single number was used to identify all fish tagged in
an experiment, and in some cases the same identifica-
tion number was used for more than one experiment.
Problems arising from the confusion between tags
recovered from two experiments in 1945 will be dis-
cussed in the section on migration through Peril
Strait.
Preliminary Processing ofData
The original tagging and recovery data discussed in
this report were found in logbooks, original return
forms, summary tables, manuscripts, and cor-
respondence. Inasmuch as a large part of the recovery
information was taken from summary tables, whichwere sometimes incorrect or incomplete, considerable
effort was expended in comparing these summarieswith original records. There was no method by which
the date and place of recovery could be absolutely
verified, and it was assumed that the summary tables
were correct if no evidence to the contrary was found.
If information was lacking or if a discrepancy wasfound which could not be resolved by a search of the
records, the recovery was classified as having an un-
known date or place of recovery. The changes made as
a result of comparison with original records were not
many and were usually corrections of obvious errors.
In analyses where the recoveries were pooled bygeographical areas, recovery reassignments had little
effect on the results because the recoveries wereusually reassigned to traps near the traps to whichthey had originally been assigned in the summarytables.
The tag return information was transferred to
punch cards and processed through an IBM 650digital computer to compute such additional informa-
tion as days out and distance from the tagging station
and to punch a final basic card for each return.
There were omissions as well as inaccuracies in thedata relating to a number of important factors.
Distribution of the seine fleet in time and space, thesize of the seine catches and the spawning escape-ment, and an accurate measure of recovery effort or
outline of the program used for recovery were all un-known. Each of these factors will be discussed in moredetail in later sections where they are pertinent.
Because almost no information was available on thesize and distribution of the seine fleet and its catch,
this report is restricted to a consideration of trapcatch data and trap recoveries of tagged fish, exceptin the section on mortality rates. Since about 80% of
the recoveries were made by traps, this limitation is
not severe.
To validate trap catch data, which were submittedby the canneries to the FWS, persons acquainted with
trap operations in the areas during the years con-
sidered in this report were consulted on methods usedto estimate the daily and weekly catches of a salmontrap. No method was found to verify all of the catch
data; therefore, no corrections were made in the
original cannery records. The fact that catch records
kept independently by certain canneries showed ex-
cellent agreement with the data submitted to the
FWS increased our confidence in the data.
Daily catch data for each trap were transferred fromthe cannery forms to IBM cards identical to those
used by the FWS for recording daily trap catches.
When more than one brailing in a day was recorded,
the sum of the recorded catches was entered on the
IBM card. Records from licensed traps that caughtfew or no fish were omitted.
The actual daily catch was not always recorded,
and the analysis was based on the weekly catch. Trapswere frequently fished more than 1 day without beingbrailed; they were emptied daily only during the last 2
wk of the fishing season. During the latter part of the
season when the runs were heavy, some traps werebrailed on Saturday and also on Sunday, a closed day,
for the usual fishing period of 5'/2 days a week.Because the operation of traps during the weekendclosure is unknown, there is some doubt as to whatday those fish recorded as taken on Sunday actually
entered the trap. All traps were assumed to have beenempty at the beginning of each fishing week and the
catches were summed from Monday through Sunday.
Release and Recovery Information
A statistical coding scheme was used to group the
waters of the northern part of southeastern Alaskainto statistical areas and subareas (Fig. 2) for com-puter analysis of the tag-recapture and catch data.
The closing dates of the fishing season for the years
1938-42 in the major statistical subareas were es-
timated from data on the daily trap catches (Table 1).
A description of the statistical coding system is
available in Simpson (1960).
The locations and code numbers of the principal
trap sites and the tagging stations are shown in Figure
3. The code numbers used throughout this report are
the same as those shown in Figure 3 except for a few
minor changes such as those employed in what is
known as the Vaughn system (for further information
on this system, see the publication cited in footnote
5). The number of traps operating in each major sta-
tistical subarea (Fig. 2) each year is given in Table 2.
The numbers of tagging experiments conductedduring 1938-42 and 1945 are given in Table 3. Release
and recovery data are summarized by year in Table 4.
Total recoveries, omitting those from streams, during
the period from 1938 to 1945 varied from 28% to 38%.The total, over all years, of 7,027 tags recovered fromall sources represents 34.3% of the total releases;
79.8% of the total recoveries were recovered in traps
and 16.1% in seines. Because only 30 tagged fish were
recovered in streams, stream recoveries were not usedin any of the analyses and will not be discussed.
Basic release and recovery information for each ex-
periment is presented in Table 5. The timing of the
releases during the season varied considerably fromyear to year. In only three experiments were less than
100 fish released. Many of the tagging experimentsappear to have had a goal of about 500 fish. In addi-
tion to recovery percentages by type of gear, Table 5
also contains the mean and variance of the days-out

Figured—NOTth-em part of south-
eastern Alaskashowing majorstatistical areas
and subareas
used for com-puter analysis
of pink salmontag recapture
data.

Table 1.—Closing dates of fishing season in major statistical subareas in southeastern Alaska as
estimated from records of daily trap catches, 1938-42.
Statistical subarea 1938 1939 1940 1941 1942
Outer Icy Strait 5 August 5 August 5 August 5 August 5 August
Inner Icy Strait 7 August 8 August 8 August 8 August 12 August
Lynn Canal 11 August 11 August 9 August 10 August 15 August
Upper Chatham Strait 21 August 19 August 19 August 21 August 21 August
Middle Chatham Strait 21 August 19 August 19 August 21 August 21 August
Lower Chatham Strait 21 August 19 August 19 August 21 August 23 August
Frederick Sound 21 August 19 August 19 August 21 August 23 August
Stephens Passage 21 August 19 August 19 August 21 August 23 August
Table 2.— Number of salmon traps in major statistical subareas in southeastern Alaska,
1938-42 and 1945.
Statistical subarea

10 20 30
• TRAP LOCATIONA TRAP SITE USED AS TAGGING SITE

Table 4. --Number of tags released and number recovered 1n tagging experiments in southeastern
Alaska, 1938-42 and 1945.

were again used and were distinguishable from those
used on 5 August only by a hole punched in them.
Tags with the number 13 were also released on 12
August. The original records for 1945 showed con-
siderable confusion in differentiating between number12 tags with and without the punched hole. Thus,number 12 tags recovered after 11 August could not be
assigned to a single release.
A total of 456 (33.6'^) of the tags were recovered;
41.6% of the total recoveries were made at the point of
release. Four hundred and eight of the tags were
recovered in Salisbury Sound, 12 in other inlets on the
west coasts of Baranof and Chichagof islands, 1 in
Sumner Strait, and 35 in Chatham Strait close to the
east end of Peril Strait. No tags were recovered in
Peril Strait or in spawning streams.
The 1945 experiments do not provide conclusive
evidence on the extent of migration eastward through
Peril Strait. The data indicate that most fish in
Salisbury Sound in August remained there, but moreexperiments are necessary.
Only seven recoveries were made in Salisbury
Sound of the 19,179 tagged fish released in inside
waters during 1938-42. Six of the seven were released
in Icy Strait and upper Chatham Strait. They mayhave traveled west through Icy Strait and then south
along the west coast of Chichagof Island. The remain-
ing recovery was released in lower Chatham Strait.
The fact that none of the seven were released in mid-dle Chatham Strait suggests that there is no majormigration westward through Peril Strait.
Distribution ofTrap Recoveries fromExperiments in Icy Strait
and Chatham Strait
The number and percent of recoveries by statistical
area for each experiment are listed in Tables 7 to 10
and illustrated in Figures 4 to 15. These figures wereconstructed as follows: A line was drawn along the
center of the channel starting at the tagging station
and extending through the main waterways in
northern southeastern Alaska. The line was sub-
divided into 20-mile intervals in both directions fromthe tagging station which was taken as the zero point.
The number of recoveries per trap in each interval wascalculated by alternating 3- and 4-day periods for 2
wk after the release; Sundays (when the fishery wasclosed) were usually included in the 4-day periods.
Thus, each period included about 2% days of fishing.
The number of tags recovered after the first 2 wk wassmall. The lines in Figures 4 to 15 connect the points
representing average numbers of recoveries per trapper time period plotted at the centers of the 20-mileintervals. Abbreviations used in Figures 4 to 15 are:
IS—Icy Strait; CS—upper and middle ChathamStrait; FS—Frederick Sound; SP—Stephens Passage;and LCS—lower Chatham Strait.
In general, the experiments indicated that pinksalmon entered the inner waters through Icy Strait
and lower Chatham Strait and then spread eastwardto Frederick Sound and north into Stephens Passage.
For most experiments, fish continued to be recapturedin or near the trap from which they were released until
the end of the season. Although the movements oi the
centers of maximum density for most groups of taggedfish appeared to be directional, these directed
movements were accompanied by a wide dispersion of
smaller numbers of tags throughout the entire
northern portion of southeastern Alaska.
Icy Strait.^—Six experiments were conducted in Icy
Strait in 1941 (Fig. 4, Table 7) and three in 1942 (Fig.
5, Table 7).
The recoveries from Icy Strait releases in 1941 in-
dicated no clear-cut differences in distribution
between the six experiments conducted during July
and August. Recoveries of tagged fish in Icy Strait
from releases in early August were restricted by the
closure of fishing about 8 August. By the third dayafter release tagged fish from Icy Strait were spreadthroughout middle Chatham Strait. While some mov-ed rapidly others lagged behind, with the result that
the fish were distributed along the entire route
traversed. Usually the center of density of the tagged
population was found in middle Chatham Strait dur-
ing the second half of the first week (days out 4-6, Fig.
4). Although the tagged fish appeared to delay at the
entrance to Frederick Sound, by the first part of the
second week they were well distributed throughout
Frederick Sound and lower Stephens Passage. Duringthe third and fourth weeks after release it was usually
difficult to recognize any center of density for one of
the tagged populations.
There was little migration into lower ChathamStrait of the fish released in Icy Strait in either 1941 or
1942; 1.04% of all releases in 1941 and 0.07% of those
in 1942 were recovered in lower Chatham Strait.
There were some striking differences between the
movements of the tagged groups in 1941 and 1942.
These differences may indicate a difference in the
racial composition of the even-year and odd-year
stocks in Icy Strait. Tagged pink salmon released in
1942 (Table 7) did not move to the east and south as
rapidly as those released in 1941. The proportion ul-
timately destined for Frederick Sound or StephensPassage seemed to be less in 1942 than in 1941. This
difference is especially large for the release made on 18
July 1942, as compared with the three July releases in
1941. Recoveries in Icy Strait from the July release in
1942 were slightly greater than from the July releases
in 1941, but the percentage of recoveries in waters to
the south and east in 1942 was markedly reduced.
Total percentages recovered for the August releases in
the 2 yr were similar; the 1942 experiments showedproportionately more fish recovered in Icy Strait and

Table 5. --Summary of release and recovery information from tagging conducted in southeastern Alaska during 1938-42 and 1945. (See
Figure 3 for location of traps where tags were released.)
Trap numberand release

T«ble 5. --Summary of release and recovery information from tagging conducted in southeastern Alaska during 1938-42 and 1945. (S(
Figure 3 for location of traps where tags were released. )— Continued.
Trap numberand release

Table 6. --Comparison between recoveries 1n Sumner Strait and total recoveries (grouped by release
area and month), July and August, 1938-42 and 1945.
Release area
3 DAYS OUT
JULY \2 IS it
200
200
200
100CS I FS ISP
100,. _ ---
CS i FS ISP" . IS
MILES FROM TRAP SITECS'^°I FS Ispl
">' 100CS I FS
200
13

Table 7. --Recovery areas of tags released from traps in Icy Strait, 1941-42.
Year and date
of release(trap number

I I h" I' cs 'fs' sp
MILES FROM TRAP SITE
Figure 6.—Tag recoveries per trap per time period by 20-inile
intervals measured from the point of release in upper ChathamStrait, 1940.
fish from both the July and August releases in upperChatham Strait were recovered to the northwest of
the point of release in northern Chatham Strait and in
Icy Strait, but most tags were recovered in middleChatham Strait and in Frederick Sound. For all of the
1941 releases except the last one on 9 August, the
center of density of the tagged population movedrapidly to the middle Chatham Strait area andremained there for the first l'/2 wk after release (Fig.
7). For the 9 August release the center of maximumdensity shifted from middle Chatham Strait to
Frederick Sound at the beginning of the second week.There was a minor movement of tagged fish into lower
Chatham Strait in 1941. The major movement,however, was clearly eastward into Frederick Soundfrom middle Chatham Strait. Most of the recoveries
were made in Chatham Strait during the first weekafter release. Of course, the usual trickle of scattered
recoveries continued until the end of the fishing
season. The recovery percentage of 46% from the 26
July release was unusually high and was the result of
unusually high recovery percentages in both ChathamStrait and Frederick Sound.
Six releases were made in upper Chatham Strait in
1942, all quite late in the season (Fig. 8, Table 8). The
Table 8.— Recovery areas of tags released from traps in Upper Chatham Strait, 1940-42.

AUGUST 9 WE 2H
100 I
FS ISP100 I
I FS 'SP IS I CSMILES FROM TRAP SITE
J ' FS 'SP
Figure 7.—Tag recoveries per trap by 20-niile intervals measured from the point of release in upper ChathamStrait, 1941.
first release was on 25 July and the last on 18 August.
The distributions of recoveries from all releases in-
dicate extensive milling of pink salmon in the eastern
end of Icy Strait and throughout upper and middle
Chatham Strait. The type of movement observed in
1942 is in direct contrast to that observed in 1941,
when the fish moved rapidly to the south.
For the earlier experiments in 1942 the center of
density remained at the tagging station and there wasa slow diffusion in both directions. In the later
releases the closure of the fishing season in Icy Strait
restricted recoveries there. Nevertheless there wasonly a slight shift of the center of density of the tags to
the south of the release point. Although there wassome movement of tagged fish into Frederick Soundfrom releases in August, this movement was of a
secondary nature. The 1942 experiments did not showany clear progression of centers of concentration to the
south and east in successive recovery periods as did
the 1941 experiments.
Recoveries from the two experiments on opposite
sides of the channel on 18 August 1942 indicate that
fish tagged in the northwestern part of upper
Chatham Strait (at trap WE-24) had ceased moving
rapidly and were probably milling about near the
spawning streams, whereas a large pecentage of those
tagged to the south on the eastern shore (at trap WE-43) were still moving actively through Chatham Strait
headed for the inner waters of Frederick Sound and
Stephens Passage.
In summary, the results of the tagging experiments
conducted in upper Chatham Strait supported the
general movement patterns hypothesized above on
the basis of releases made in Icy Strait. In 1941, and to
a lesser extent in 1940, fish tagged in upper ChathamStrait moved rapidly southward in Chatham Strait
and then dispersed into Frederick Sound. The most
dense concentrations of tagged fish remained in the
middle Chatham Strait area for the first 1 V2 wk after
release. In 1942, however, the fish tagged in upper
16

I100 I |?oo Id
I">o
I200 |o I
'<>o| I loo I o I lool |
' FS $? ' IS ' CS ' FS 'SP IS ' CS ' FS "SP IS ' CS ' FS 'spMILES FROM TRAP SITE
Figure 8.—Tag recoveries per trap per time period by 20-inile intervals measured from the point of
release in upper Chatham Strait, 1942.
Chatham Strait exhibited a much stronger tendency
to linger in the upper Chatham Strait area and a
much weaker tendency to migrate southward andeastward. There appears to be considerable variabili-
ty from year to year in the racial composition of the
pink salmon runs found in upper Chatham Strait in
the months of July and August.
Middle Chatham Strait.—Two tagging
experiments were conducted in middle Chatham
Strait in 1940, six in 1941, and two in 1942. All
releases of tagged fish, with the exception of that on 13
July 1941, were made from trap WE-69 within 15
miles of the junction of Chatham Strait and Frederick
Sound. The exception was from trap WE-65, 4 miles
north of the site of the other releases.
Results from the two 1940 experiments are shown in
Figure 9 and Table 9. The first release (12 August) in-
volved 999 tagged fish, and thus constituted the
largest single release of the experiments covered in
17

I I
100 ioo|
7-10 DAYS OUT
100 100IS" CS ' FS ' SP' IS
'
MILES FROM TRAP SITE
100
CS FS ' SP'100
Figure 9.—Tag recoveries per trap per time period by 20-mile intervals measured from the point of
release in middle Chatham Strait, 1940.
Table 9. --Recovery areas of tags released from traps in Middle Chatham Strait, 1940-42.

this report. For the second experiment (16 August),
only 13.8% of the tags were recovered because it wasclose to the end of the fishing season. The most promi-
nent feature of the recoveries from both of these
releases was the rapid movement of a large proportion
of the tagged fish into Frederick Sound; 66.4% of the
total recoveries from both releases were made in
Frederick Sound. Less than 1% were made in lower
Chatham Strait. Although there was some dispersion
northward into middle Chatham Strait, few tagged
fish traveled as far north as upper Chatham Strait. It
appears that most fish in the vicinity of trap WE-69 in
August were en route to streams in Frederick Soundand Stephens Passage.
The most noticeable feature of the distributions of
recoveries from the six experiments in 1941 (Fig. 10,
Table 9) is the uniformly high percentage returned
from Frederick Sound—70.8%. In 1941 the movementof tagged pink salmon from middle Chatham Strait
into Frederick Sound was even more rapid and morepronounced than in 1940. Only a negligible movementin the direction of Icy Strait was indicated. Recoveries
in middle and upper Chatham Strait were not large,
even though they were augmented by heavy recap-
tures in trap WE-67 just 2 miles from the point of
release. Proportionately more of the tagged fish
entered lower Chatham Strait in 1941 than in either
1940 or 1942. This was partly the result of the timing
of the releases. Only in 1941 were releases made in Ju-
ly; recoveries in lower Chatham Strait from these July
releases were higher than from the August releases in
any of the 3 yr (Table 9). In 1941, 2.7% of the total
recoveries from all six releases were made in lower
Chatham Strait.
The geographical distributions of the recoveries
from the two releases in 1942 in middle ChathamStrait were similar (Fig. 11, Table 9). The distribution
of recoveries in 1942 differed markedly from those in
1940 and 1941. Tagged fish were recaptured in aboutequal numbers in Frederick Sound and in middleChatham Strait. The 48.6% of the recoveries made in
Frederick Sound are considerably lower than the
66.4% in 1940 and the 70.8% in 1941. Recoveries in
lower Chatham Strait were scarce in 1942; only twotagged fish were reported from there. Recoverypatterns for both experiments in 1942 weresymmetrically distributed about the release point.
In summary, tagged fish released in middleChatham Strait showed little movement into thelower Chatham Strait area. In 1941, and to a
somewhat lesser extent in 1940, there was a strongly
directed movement of tagged pink salmon from mid-dle Chatham Strait into Frederick Sound andsouthern Stephens Passage. Fish tagged in 1942 didnot exhibit a strongly directed movement but rather
milled about in the general area of the release point in
middle Chatham Strait, gradually dispersing bothnorthward into Chatham Strait and eastward into
Frederick Sound. The difference between the
migratory behavior of fish tagged in 1942 and those
tagged in 1940 and 1941 in middle Chatham Strait is
exactly the same as observed for fish tagged in Icy
Strait and upper Chatham Strait in these 3 yr.
Lower Chatham Strait.—There were 10 ex-
periments in lower Chatham Strait in 1938, 7 in 1939,
2 in 1941, and 1 in 1942. Only four of the experiments
in each year in 1938 and 1939 provided enoughrecoveries to give a coherent picture of the movementof the tagged fish. All of the releases in lower ChathamStrait were made from either trap EA-45 or trap EA-46 in Tebenkof Bay.The results of the 1938 experiments (Fig. 12, Table
10) show that the tagged pink salmon were recaptured
mainly in lower Chatham Strait—79.5% of the
recoveries were made in the six traps along the west
coast of Kuiu Island within 22 miles of the point of
release. Of the combined recoveries from the four
releases, 15.8% were made in Frederick Sound, 2.1%in middle Chatham Strait, and 2.6% in SumnerStrait.
Although the total percentage of recoveries from the
1939 experiments (Fig. 13, Table 10) remainedremarkably constant from the first release on 16 July
until the last on 13 August, the geographic distribu-
tion of the recoveries changed drastically between the
first and last releases. The percentage recoveries
returned from Frederick Sound were as follows: 91.8%for the 16 July release, 62.7% for 4 August, 33.1% for 6
August, and 16.5% for 13 August. And, as the percent-
age of recoveries taken in Frederick Sound decreased,
the percentage taken in lower Chatham Strait in-
creased (Table 10). The strong movement into
Frederick Sound for the earlier releases in 1939 is in
sharp contrast to the results obtained in 1938.
Although the timing of the 1938 releases was similar
to that of the 1939 releases, the relative numbers of
recoveries made in Frederick Sound and Stephens
Passage were consistently low for all of the 1938 ex-
periments.
There was a minor movement of tagged pink
salmon into middle Chatham Strait and into SumnerStrait in 1939; 6.4% of the recoveries were from middle
Chatham Strait and 5.2% from Sumner Strait. For
the last release in 1939, as in 1938, the fish showed a
strong tendency to linger in Tebenkof Bay near the
release trap.
The distribution of recoveries from the two tagging
experiments in lower Chatham Strait in 1941 are
shown in Figure 14 and Table 10. Releases were madeon 10 and 16 August; the recoveries were restricted
because it was close to the end of the fishing season.
For both experiments the recoveries were apportioned
in a similar manner between general recovery areas
(Table 10): 62.4% of the pooled recoveries were from
Frederick Sound, 32.0% from lower Chatham Strait,
and 5.6% from upper and middle Chatham Strait.
The center of density of the tagged fish released on 10
19

Figure 10. — Tagrecoveries per trap
per time period by
20-niile intervals
measured from the
point of release in
middle ChathamStrait. 1941.
100IS
I I100 lOOl
cs I FS I spi is' csMILES FROM TRAP SITE
I Ilo'o Tool
1 FSlspl isl CS I FS I SPl
20

0-3 DAYS OUTAugust 11 WE-69
ISl CS I FS 'SP FS I SPl is' CS I FS • SPIMILES FROM TRAP SITE
CS I FS ISPl
Figure 1 1 .—Tag recoveries per trap per time period by 20-inile intervals measured from the point of release in middle Chatham Strait,
1942.
August had moved into Frederick Sound during the
latter part of the first week and during the second
week continued to drift eastward. Thus, in 1941 the
migratory behavior of fish tagged during August in
lower Chatham Strait was quite different from that of
those tagged during August in 1938 and in 1939, whenmore of the fish remained near the tagging station in-
stead of moving into Frederick Sound.
The infrequent recoveries in lower Chatham Strait
from releases in Icy Strait and in upper and middleChatham Strait in 1941, coupled with the sparse
recoveries in the northern areas from releases in lower
Chatham Strait, indicate that most of the fish movingthrough lower Chatham Strait in mid-August of 1941
were en route to streams in lower Chatham Strait,
Frederick Sound, and Stephens Passage.
The results from the single release in lower
Chatham Strait in 1942 are given in Figure 15 andTable 10. For 68 of the tags recovered from this experi-
ment, only the date of recovery was given. The dis-
tribution of the recoveries for which the locations wereknown was similar to the distributions observed for
the 1941 experiments except that relatively moretagged fish were recaptured in middle ChathamStrait. However, unless it is assumed that the 89 tags
with known recovery locations constituted a represen-
tative sample of the recoveries, the movements in-
dicated cannot be accepted without serious reserva-
tion.
Summary and Discussion of GeneralMigration Patterns as Determinedfrom Tag Recaptures
From each of the pink salmon tagging experiments
a sequence of spatial distributions of tag recaptures
per unit of effort during successive recovery periods
was determined. The apparent migratory pattern
generated by the recaptures from a single release maybe described as the result of an interaction of twobasic types of movement—one directional, the other
random. The directional component is defined as a
movement with complete spatial orientation, whereasthe random component is a nondirected movement in
which the fish disperse in all possible directions about
a center of density. It is obvious, of course, that anyparticular geographical distribution of recoveries is
affected by the distribution of recovery effort and also
by the particular mixture of racial stocks represented
in the population of tagged fish.
Verhoeven (see footnote 6) concluded that pink
salmon migration consisted largely of a random to-
and-fro movement. He was influenced by multiple
recaptures of several fish tagged in the Ketchikan area
of southeastern Alaska, and it is not possible to deter-
mine if the successive recapturing altered the natural
migratory behavior of the fish. The experiments
reported here neither confirm nor definitely refute
Verhoeven's hypothesis of random to-and-fro move-ment. However, the results of these experiments do
21

3 -
2 -
0-3 DAYS OUT
JULY 7 EA-'45
a.i<H
UI0.
5°LU
umq:
q:3LUDQ
5:3 2
? I I
lioo 200
AUGUST 6 -EA H5
I h"
.^,12.00 / AUGUST 9 EA-45
I I
100
1113 DAYS OUT
? I I I
100 200
200 |100 200
I1''°°
AUGUST 12 EA-15
I I llOO1 FS r rs <;plCS > FS LCS SPl
200 Oil 100 200 Oil jlOOCS IPSLCSSPI CS 'FSLCSSP'
MILES FROM TRAP SITE
200 Oil 100CS IFS LCS SPI
Figure 12.—Tag recoveries per trap per time period by 20-inile intervals measured from the point of release in lower Chatham Strait,
1938.
indicate that the movement of pink salmon can bemore adequately described as consisting of a randomand a directional component with the relative impor-tance of the two components varying from year to
year. In 1942 fish tagged in Icy Strait, upper ChathamStrait, and middle Chatham Strait distributed them-selves as might have been predicted on the basis of therandom to-and-fro hypothesis. In 1941 the move-ments of fish tagged at the same locations showed a
much stronger directional component. These taggedfish migrated in large numbers to the Frederick
Sound-Stephens Passage region. Thus, it appears thatthe particular mixture of racial stocks in a given sec-
tor of the fishing grounds varies greatly from year to
year. There was some indication from these ex-
periments that the random component of movementwas relatively stronger in even years.
The apparent random component of the migration
of pink salmon may be an inherent characteristic of
this species, which spawns in a large number of widely
dispersed streams. A different behavior might be ex-
pected for sockeye salmon, Oncorhynchus nerka,
seeking one major spawning ground. The results of
these experiments do not provide information on the
cause of the random dispersion of tagged fish. Thiseffect could be caused either by the erratic wanderingsof tagged fish or could be the result of the superim-position of a great number of directional migrations
22

Table 10. --Recovery areas of tags released from traps 1n Lower Chatham Strait, 1938-39 and 1941-42.
csI I
Ii'oo 100
I I I 100 100I I I
i
I 'LC5 Fs'sp' rs ' ii r.s F?;'<;p ' rs ' m r<; pc' <;piCS100
I I I>00 100 I ^00
'LCSFS'SP' CS ' 'LCSFS'SP' CS ' ! r«; F=;l i^p-
MILES FROM TRAP SITE'LCS FS' SP"
Figure 13.—Tag recoveries per trap per time period by 20-inile intervals measured from the point of release
in lower Chatham Strait, 1939.
RELATIVE ABUNDANCE ANDMIGRATION AS DETERMINEDFROM TRAP CATCH DATA
Neither total trap catch nor catch per trap could be
used to estimate the size of the pink salmon runs in
the different years because in all years and in all areas
the fishing season closed about the time of greatest
abundance of fish. Thus, catch data did not measure
the late parts of the runs. Furthermore, no informa-
tion was available on seine catches or on escapement
to spawning streams. Both total trap catch and catch
per trap by statistical area are listed in Table 11. The
number of traps used in the calculations was the
number of traps for which weekly catches were known.
The catch per trap and total catch in different years
were not proportional; in particular, the largest catch
was taken in 1941 when the fewest traps operated. Thetotal catch was influenced more by the number of fish
available than by the number of traps.
Both total catch and catch per trap show that the
largest run was in 1941 and the smallest in 1945. Runsin 1938 and 1940 were approximately equal and were
larger than the 1939 run but smaller than the 1942
run.
The catch data and tagging data are in general
agreement with respect to the indicated paths of
24

3 -
Ui
^2-
^
0-3 DAYS OUT
AUGUST 10
EA-45
uj 100I I I
VOO 100I
1-1 -
ai
^,inUJ
cnUJ
>ouLU
onLUCQ
5Z
4-6 DAYS OUT 7-10 DAYS OUT 11-13 DAYS OUT
I I
VOO 100I I I
100
3 -AUGUST 16 EA-45
100CS
I I100 100
Lcs'fs'sp' CS I
'LCS' FS100
SP' CS '
MILES FROM TRAP SITElcs'fs' SP'
100CS
J I100
"LCSFS'SP'
Figure 14.—Tag recoveries per trap per time period by 20-inile intervals measured from the point of release in lower ChathamStrait, 1941.
migration. Both types of data show two main migra-
tion routes, one starting in Icy Strait and leading
south through upper and middle Chatham Strait into
Frederick Sound and the other leading from lower
Chatham Strait into Frederick Sound. In Figures 16
to 20, the weekly catch per trap is plotted against timein weeks for the major statistical subareas for the
years 1938-42. Lynn Canal is included with upperChatham Strait. The vertical lines represent the
dates, obtained by linear interpolation, at which the
catches per trap were 10,000 and 20,000 fish per week.The time difference in days between the 10,000- and
20,000-fish-per-week levels in outer Icy Strait and four
inner areas is given in Table 12. The catch per trap
during the seventh week in inner Icy Strait in 1938
reached 19,806 but not 20,000 and, although omitted
from Figure 16, the time difference was calculated andis given in Table 12. Table 13 lists time differences
between lower Chatham Strait and two inner areas.
In all years, the average catch increased first in out-
er Icy Strait and then in inner Icy Strait, upperChatham Strait, and middle Chatham Strait in that
order, as would be expected if the fish were entering
through Icy Strait and moving south. Since traps in
100Ilcs' fs'sp'
from trap site
Figure 15.—Tag recoveries per trap per time period by 20-mile intervals measured from the point of release in lower
Chatham Strait, 1942.
25

Table 11. --Total trap
Alaska, 1938-
catch and catch per trap
42 and 1945. (See Table
In major statistical subareas in southeastern
2 for number of traps in each area.)
1935Catch Catch/trap
1939Catch Catch/trap~
1J40Catch Catch/trapStatistical subarea
Outer Icy Strait
Inner Icy Strait
Lynn Canal
Upper Chatham Strait
Middle Chatham Strait
Lower Chatham Strait
Frederick Sound
Stephens Passage
Total
Outer Icy Strait
Inner Icy Strait
Lynn Canal
Upper Chatham Strait
Middle Chatham Strait
Lower Chatham Strait
Frederick Sound
Stephens Passage
Total
584,181 72,023
604,388 31,810
86,230 43,115
2,188,491 115,184
1,627,369 81.368
608,327 101,388
1,239,817 82,654
483,807 40,317
258,991 32,374
249.440 13,128
51,105 25,553
844,979 44,473
817,293 43,015
531,542 106,308
1,464,014 97,601
917,698 76,745
379,451 54,207
860.957 45,314
53.947 26,974
2,503.038 125.152
1.318.151 73.231
515.610 171.870
1.066.645 66,665
710,431 64,585
7,422,610 73,491 5,135,062 51,869 7,408,230 77,169
1941 1942
Catch Catch/trap Catch Catch/trap1945
Catch Catch/traF
1,209,224 201,537
1,934,492 193,449
102,915 102,915
4,701,101 361,623
2,866,237 238,853
2,622,128 655,532
5,139,320 321,208
2,794,745 254,068
425,860 70,977
1,121,161 65,951
136,218 68,109
2.616,757 145,375
940,765 58,798
824,650 206,163
1,962,959 122,685
1 ,088,965 98,997
176,234 29,372
395,678 24.730
44.806 22.403
827,868 48,698
647,114 38,066
413,057 103,264
681.857 48,704
421,055 32,389
21,370,162 292,742 9,117,335 101,304 3,607.669 40.536
I23<l5t7e9l0 1J3456789I1j I I I I
WEEK FROM BEGINNING OF SEASONI | | | |
27 3 10 17 21) 31
JUNE JULYlU 21 28 27 3 10 17 24 31 7 14 21 28
AUGUST JUNE JULY AUGUSTDATE AT END OF WEEK
Figure 16.—Average number of pink salmon caught per trap per
weeli in each major statistical area in 1938. The approximate
dates on which the catch per trap per week reached 10,000 fish
and 20,000 fish are shown by the vertical lines.
LOWER CHATHAM STRAIT
1 I I
2 9 16 23 30
JULY13 20 27 25 2
AUGUST JUNEDATE AT END OF WEEK
Figure 17.—Average number of pink salmon caught per trap per
week in each major statistical area in 1939. The approximate
dates on which the catch per trap per week reached 10,000 fish
and 20,000 fish are shown by the vertical lines.
26

ou


Table 12. --Time difference (In days) between average weekly catches of 10,000 and 20,000 fish In
traps in outer Icy Strait and four inner areas and miles traveled per day (M/D) calculated from
the time difference.
Year and

Table 13.—Time difference (in days) between
average weekly catches of 10.000 and 20,000
fish in traps in lower Chatham Strait and two
inner areas and miles traveled per day (M/D)
calculated from the time difference.
Year and
catch level

Table 14. --Rate of travel of tagged f1sh estimated by regression technique using the
distant recoveries and the median distance traveled per day.
second most
Area, trap number,
and release date

Table 15. --List of t^-values for comparison between mean days out for trap recoveries and mean days
out for seine recoveries. (Only releases with 10 or more seine recoveries Included.)
Area, trap number.

Table 16. --Weekly survival rates (s), weekly exploitation rates (;j), experimental fishing mortal-
ity rates (F), and other-loss rates (X) for 30 groups of tagged fish.
Area, trap number.

The other-loss rate for both tagged and untagged fish
includes natural mortality and outmigration. In addi-
tion, the other-loss rate for tagged fish is augmentedby tag dropoff and any additional natural mortality
caused by the tag. Although no information wasavailable on the relative importance of the different
contributors to the other-loss rate, it is believed that
escapement to spawning streams was the dominantfactor. Continuing tag dropoff may have been a
significant factor in these experiments. The type of
tag used was a strap tag attached to the dorsal edge of
the caudal fin. As mentioned above, the fishing mor-
tality rate would be underestimated if there were
either immediate tagging mortality or incomplete
recovery and reporting of recaptured tagged fish.
Original correspondence which accompanied some of
the tag returns indicated that there was substantial
nonreporting of tags during these experiments. Unfor-
tunately there is not sufficient information to es-
timate the magnitude of this type of error. In the opin-
ion of the authors the estimated fishing mortality
rates given in Table 16 are too low.
The estimates of F and X given in Table 16 were
calculated from the values of ^ and s under the
assumption that the fishery during the years of these
experiments was periodic; i.e., the fishing season wasopen for 5.5 days and closed for 1.5 days of each week.
The method of calculation will be outlined briefly:
Let F = weekly exponential fishing mortality rate,
X = weekly exponential other-loss rate,
Ai = length of first part of weekly open period,
A2 = length of weekly closed period,
A3 = length of second part of weekly open period,
and
A, + A, -1- A3 = 1.
Then
_ -(f(Ai+d2)+X)
F ., -(f + X)A,
F + X
+ e(Fa,+X (Ai+i2)) F .r, ^
£ (1p-(f+X)A3)F + X^
Since the length of the weekly closed period was 1 '2
days, A2 = 1.5/7 and A, + A3 = 5.5/7. It was assumedthat A3 = for releases on Sunday and that Ai = for
those on Saturday. Values of A, and A, for midweekexperiments were assigned on the assumption that
releases were made exactly at midnight of the tagging
day. The two nonlinear equations shown above weresolved for the unknowns F and X by an approximationtechnique using nomographs.
The estimates for F and X for each of the 30 experi-
ments together with their averages by area and yearare listed in Table 16. The F values varied from 0.207
to 1.208 and averaged 0.514. The X values rangedfrom 0.234 to 1.287 and averaged 0.595. Thus, for
these experiments the estimated rate of removal of
tagged fish by the fishery was slightly less than the
rate of removal by all other causes.
Estimates of F and X computed from the results of
the tagging experiments conducted in 1950 in Icy
Strait by Elling and Macy (1955) were reported byPaulik (1963). The opening date for the commercialfishing season in 1950 (15 August) was later than the
closing dates of the seasons during the years 1938through 1945. In 1938-45 the season in Icy Strait wasusually opened about 20 June and closed the first
week in August. Elling and Macy (1955) tagged fish
on consecutive days from 25 July through 14 August.Using their data Paulik (1963) obtained an in-
traseasonal weekly X value of 0.641 and a weekly Fvalue of 1.230. Although the value forX in 1950 agrees
fairly well with the overall average of the X values for
the tagging experiments in 1938-42 and 1945, the
1.230 value for F in 1950 is considerably higher thanthe average F of 0.514 for 1938-42 and 1945. Wesuggest that the discrepancy between these F values is
due in a large degree to nonreporting of recaptured
tags in the earlier experiments.
In 1941 the X rate increased as the release site wasmoved from Icy Strait to middle Chatham Strait
(Table 16) . The F values appear to be highest for mid-dle Chatham Strait. Although the intraseasonal
variability in F and X values was extremely high,
there appeared to be an increasing trend in the values
of F and X during the season.
To estimate the fraction removed by the fishery of
the total run entering the northern part of
southeastern Alaska during a given year, it is
necessary to take into account the pattern of recruit-
ment of pink salmon into the fishing areas during the
fishing season. A computer program which calculates
the rate of exploitation as a function of the fishing
mortality rate and the temporal pattern of fishing
(i.e., opening and closing dates and the number of
days of fishing per week) when there is intraseasonal
recruitment is decribed by Paulik and Greenough(1966). To use this program it is necessary to assumethat the recruitment into the fishing area can be ap-
proximated by a triangular entry pattern. Data input
to this program includes the times of the beginning,
the peak, and the end of the entry pattern; the begin-
ning and the end of the fishing season; and seasonal
variations in the fishing mortality rate and the other-
loss rate.
The cumulative catch at any time during the seasonis calculated by means of two simple algorithms:
34

Ci = Q.i + j-^ \i-exp {-(F, + ;;:, ) \\s,..
i^/+^.jl-exp [-(Pi+ X,) m] Ri.v,
and
S,= S,., exp[-(f, + J?,)]
where
C.
Si
Ri.y,
Pi
Pi
Xi
+ Ri.,^ exp[-(f, + X,)/2],
= total catch in numbers at time t = i,
= number offish surviving in fishery att = i,
= number of recruits entering fishery in pulse
at ^ = 1-V2,
= average exponential fishing rate betweent = i-l and t = i if season is open,
= if season is closed between t = i-l andt = i, and
= average exponential other-loss rate be-
tween t = t'-l and t = i.
The seasonal rate of exploitation is found by dividing
the total catch at the end of the season by the size of
the total run. The exploitation rate may now berepresented as a response surface that is a function of
two variables, a fishing intensity multiplier that is
used to scale all of the exponential fishing rates usedduring the season and the fraction of the basic period
that the fishery is open (Paulik and Greenough 1966).
Exploitation isopleths were computed for 1938,
1939, 1941, and 1942. The various times associated
with entry patterns and fishing seasons were es-
timated from Figures 16, 17, 19, and 20 and Table 1. It
was necessary to approximate the entry patterns fromthe weekly catch-per-trap data. Of the several
different entry patterns tried, the one that showed the
closest agreement with both the catch data and the
tagging data for all years peaked 5 wk after starting
and ended 2 wk after the close of the season. For the
isopleth calculations it was assumed that the ex-
ponential fishing mortality rate remained constant
from the beginning to the middle of the fishing season
and then increased linearly so that its value at the endof the season was 1 V2 times what it had been at the
beginning. The yearly averages given in Table 16 of
the other-loss rates computed from tagging ex-
periments were used in the isopleth computations for
1938, 1939, and 1942. For 1941 the other-loss rate wasset equal to 0.444 (the average value for tagged fish
released in Icy Strait) from the beginning of the entry
triangle to its peak and was then increased linearly to
0.820 (the average for the middle Chatham Strait
releases, excluding the anomalous results obtainedfrom the release of 10 August). This intraseasonal
modification of the other-loss rate followed from theassumption that the average rate of escapement for
the total run at any time during the season in 1941depended on the location of the center of density of
the run, which varied with time.
Exploitation isopleths for the years 1938, 1939,
1941, and 1942 are shown in Figures 21-24. In thesefigures the number of days in the weekly open periodis shown on the abscissa and the weekly exponentialfishing mortality rate (the constant rate applied dur-ing the first half of the season) on the ordinate. Themaximum rate of exploitation in each of these figures
appears at the upper right-hand corner of the figure
when fishing is permitted for 7 days a week and the
exponential fishing mortality rate is highest. Thehighest fishing exponential rate in this series of figures
is 1.19 for the first part of the season, which cor-
responds to an average rate of 1.34 for the entire
season. The highest fishing rate computed from a
single tagging experiment was 1.21, which is very close
to the value of 1.23 obtained using data from the 1950tagging experiments by EUing and Macy (1955). For a
5 V2 -day weekly open period the total seasonal rate of
exploitation at the highest F value was 0.46 in 1938,
0.43 in 1939, 0.61 in 1941, and 0.56 in 1942. Theaverage over the 4 yr (0.51) indicates that the fishery
captured about one-half of the total run entering the
northern part of southeastern Alaska. It is of interest
to note that if the same computations were carried out
for a weekly fishing period of 7 days, the seasonal ex-
ploitation rate would be increased to 0.56.
1.19
1 2 3 4 5 6
LENGTH OF WEEKLY OPEN PERIOD (DAYS)
Figure 21.—Exploitation isopleth for the total pink salmon runentering the northern part of southeastern Alaska, 1938. Tri-
angular entry pattern and periodic fishery assumed; fj= rate
of exploitation or fraction of run taken in catch.
35
12 3 4 5 6 7
LENGTH OF WEEKLY OPEN PERIOD (DAYS)
Figure 22.—Exploitation isopleth for the total pink salmon run
entering the northern part of southeastern Alaska, 1939. Tri-
angular entry pattern and periodic fishery assumed; n = rate of
exploitation or fraction of run taken In catch.
1 .19
imize either biological or economic productivity of the
resource.
It is obvious that any tagging experiment should be
designed to answer specific questions which are clear-
ly stated at the time the experiment is being designed.
The suggestions offered here are general and
applicable to most tagging experiments regardless of
whether their primary objective is to determine
migratory routes, rates of travel, rates of exploitation
on various stock units, rates of escapement into par-
ticular watersheds, racial compositions of populations
in various fishing areas at different times, numerical
abundance of particular stock components, or any
combination of these.
Establishment of an efficient data collection system
is essential. Accurate and complete records of tag
releases, recoveries, commercial effort (in terms of
standardized units and catches by time-area strata of
appropriate size), and timing and abundance of es-
capements into various watersheds are needed.
Release information should include hydrological and
meteorological data. Fish should be released in
groups, and conditions prevailing at the time of
release should be recorded.
Exact locations and recapture times for a purse
seine fishery can probably be obtained only through a
logbook system. Logbooks also should be used to
collect data on the number and location of the sets
made each day by an individual boat.
To determine the amount of incomplete recovery
and reporting of recaptured tags, trained fishery
biologists should sample the catch independently in a
manner that does not interfere with normal recovery
procedures used by fishermen. Sampling designs for
estimating the extent of incomplete reporting are
given by Paulik (1961). In some circumstances it is
advisable to include double tagging experiments to
determine tag loss (GuUand 1963).
Data collection and record-keeping methods should
be standardized, and data forms that allow im-
mediate transfer of field data to punch cards should
be used. With proper mechanization and data-han-
dling procedures, it is feasible to carry out an analysis
of partial data from an experiment while the experi-
ment is still in progress. Feedback from this type of
simultaneous analysis permits an evaluation of ex-
perimental techniques that would not otherwise be
possible until it was too late to correct faulty
procedures.
A special effort should be made to collect recovery
information on a daily basis in the immediate vicinity
of release sites. These data can be used to develop cor-
rection factors to adjust mortality rate estimates for
the bias caused by nonavailability of tagged fish
shortly after their release (see discussion of type Cerror in Ricker 1958, p. 122-126).
The method of capturing fish for tagging and the
types of tags applied should not interfere with the ob-
jectives of the experiment. Installation of salmontraps at key locations along primary migration routes
should be considered for major tagging experiments.These traps would be used for the sole purpose of cap-turing fish for tagging and would assure a fixed pointof release and permit closer control of tagging tech-
niques than would be possible with purse seines.
Traps should also provide holding facilities so thatfish could be released in batches of some minimumcritical size. Migratory delays should be held to aminimum to reduce the possibility of abnormalbehavior. If tagging is carried out from both seines
and traps, simultaneous releases should be made to
allow a comparison between the two methods of tag-
ging. The numbers of tags released at any one timeshould be as large as feasible, e.g., at least 500 fish, or
if a breakdown of recoveries into fine time-area strata
is desired, 1,000 fish. The use of re-releases of recap-
tured tagged fish and also the possibility of tagging a
selected subsample of fish with battery-poweredtransmitting tags should be investigated for studies of
migratory behavior.
The spatial and temporal distribution of the
releases should cover the entire geographical region-
time space occupied by the populations being studied.
Extrapolation of tagging results to populations foundat times and in places not included as part of the tag-
ging experiment is generally not advisable. In somecases it may be necessary to make preseason releases,
closed-period releases, and postseason releases.
Preseason and closed-period releases provide data for
separating the fishing mortality rate from the escape-
ment rate and for testing various hypotheses abouttemporal changes in the escapement rate. Thepossibility of using simultaneous translocation ex-
periments to study migratory patterns should be in-
vestigated.
It is advisable, if funds are limited, to make fewer
releases and to allow sufficient funds for an adequaterecovery program. Depending somewhat on the objec-
tives of the experiments, it is usually desirable to con-
duct spawning ground surveys in major watersheds
and to enumerate spawning populations wherever
possible. Even if great effort is expended on tagging,
the results of a tagging experiment will be in-
conclusive if the recovery effort is inadequate.
When possible, new experiments should maintaincontinuity with earlier experiments. Experimentalmethods should be standardized and changesthereafter should be made only with proper duplica-
tion using old and new techniques at the same timeand place to obtain correction factors that will allow
assimilation of the new findings with knowledgegained from past experiments.
It has now become technically feasible to integrate
a great deal of information concerning the dynamicbehavior of a complex system such as the pink salmonfishery in southeastern Alaska into a large-scale com-puter simulation program. Agencies concerned with
37

managing the salmon resources in southeastern
Alaska should investigate the practical feasibility of
establishing and maintaining an open-ended com-puter simulation model of this resource for use as a
basic planning tool. Alternative policies could be
evaluated on this type of simulation model to deter-
mine which ones are most promising. Such a simula-
tion model would be an invaluable aid in designing
future tagging experiments. This type of model could
be used to optimize the distribution of tagging andrecovery effort and would aid in development of
techniques for analyzing and interpreting tagging
data. A more detailed discussion of the uses of simula-
tion models for planning resource managementstrategies is given by Paulik (1967).
SUMMARYRecords of pink salmon tagging experiments
conducted by the U.S. Fish and Wildlife Service in
the northern part of southeastern Alaska each year
from 1938 through 1942 and in 1945 were transferred
to punch cards and analyzed using electronic dataprocessing equipment.During these 6 yr 55 releases were made: 20,472 fish
were tagged and 7,027 of the tags were recovered. Nospawning ground surveys were made, and only 30
tagged fish were recovered in streams. Totalrecoveries from all sources other than streams varied
from a low of 28.6% in 1940 to a high of 38.7% in 1941;
79.8% of the recoveries were from traps and 16.1%from seines. The analysis of tag recoveries is
supplemented by an analysis of the recorded daily
catches of pink salmon from about 100 traps that
operated in the northern part of southeastern Alaskaduring these years.
In most years (with the exception of 1941 and to a
lesser extent 1942) releases of tagged fish wererestricted to a few localities and were not well dis-
tributed in time. No multiple recaptures werereported. Little information could be found on the size
and distribution of the seine fleet, and the recorded
data accompanying tag recoveries by seines were in-
complete. The analysis is restricted for the most part
to trap catches and trap recoveries.
Recoveries in the southern part of southeastern
Alaska, i.e., to the south of Kuiu, Kupreanof, andMitkof islands, were infrequent from these releases,
which were made in the northern part. The lack of
movement to the south confirms findings of earlier in-
vestigators that exchange of pink salmon between the
northern and southern parts of southeastern Alaska is
of no practical significance and that the pink salmonruns in these areas should be regarded as distinct fromone another and managed as two independent units.
None of the tagged fish released in middle ChathamStrait were recovered in Salisbury Sound on the westcoast of Baranof Island, which indicates that there
was no westward movement through Peril Strait.
Limited tagging in Salisbury Sound in 1945 suggests
that Peril Strait is not an important entryway into in-
ner waters, but the experiments were too few to es-
tablish the magnitude of the eastward movementthrough Peril Strait.
The geographical distribution of recoveries showedthat one main migration route is through Icy Strait
and upper Chatham Strait to middle Chatham Strait;
from there the pink salmon disperse eastward into
Frederick Sound and Stephens Passage. The othermajor passageway from the ocean is through lowerChatham Strait into Frederick Sound and StephensPassage. While some segment of each tagged groupmoved rapidly along one of the main migratory paths,
others lagged behind, with the result that tagged fish
were distributed along the entire way traversed andrecoveries continued to be made from all points alongthe route until the end of the season. Some fish re-
leased in Icy Strait moved through upper and middleChatham Strait in 1 to 2 days and were found in
Frederick Sound within 3 to 5 days.
The data show there was not a major exchange of
fish between lower Chatham Strait and middleChatham Strait. The stocks found in Icy Strait, upperChatham Strait, and middle Chatham Strait are to a
large extent distinct from those found in lower
Chatham Strait.
Fish tagged later in the season exhibited a morerestricted range of movements about the point of
release than those tagged earlier. Groups tagged
earlier in the season contained larger proportions of
fish destined for spawning grounds distant from the
release points.
The movement pattern of a group of tagged pink
salmon appears to be made up of a random compo-nent superimposed upon a directional component.The relative strengths of these two components vary
considerably from year to year. Also the particular
mixture of racial stocks in a given sector of the fishing
ground at any time during the season varies greatly
from year to year.
Analysis of data on catch per trap per week con-
firmed the major migratory routes as determined fromthe analysis of the tagging data. Catches increased in
an orderly fashion for traps along the northern entry
route. The buildup of catches in Frederick Sound andStephens Passage was earlier than in middleChatham Strait but never preceded the increase in
lower Chatham Strait. The timing of catch increases
in lower Chatham Strait was similar to that in inner
Icy Strait. The populations in Frederick Sound andStephens Passage were composed of a mixture of fish
that had entered through both the northern and the
southern entryways.
The rate of movement of the center of density of a
single release of tagged fish was estimated fromlocations of median tag recaptures on successive days;
the rate of movement of the leading edge was es-
timated from the second farthest recovery each day.
38
The leading edge moved at rates of 9.1 to 33.4 miles
per day and averaged about 18 miles per day, and the
center of density moved at rates of 1.0 to 15.4 miles
per day and averaged about 8 miles per day. In 1942
both of these measures of rate of travel for tagged fish
were considerably lower than in 1941.
Weekly rates of survival and exploitation were
calculated for 30 experiments which had sufficient
numbers of recoveries adequately distributed in time.
For these experiments the average weekly survival
rate is 39.4^r and the average weekly exploitation rate
is 25.0%. A comparison of the exponential fishing rate
of 0.514 with the exponential other-loss rate of 0.595
indicates that the rate of removal of tagged fish by the
fishery was slightly less than the rate of removal from
all other causes combined. The estimates of exponen-
tial fishing rates were considerably lower than es-
timates obtained from tagging experiments in Icy
Strait in 1950. Part of the discrepancy between the es-
timated fishing rates in 1950 and in the earlier years
appears to be the result of incomplete detection andreporting of recaptured tags in the earlier ex-
periments.
A computer program that calculates the total rate
of exploitation on a run of salmon when recuitment,
outmigration, and fishing occur simultaneously wasused to estimate the fraction of the total run removedby the fishery in 1938, 1939, 1941, and 1942. The tim-
ing of the entry of pink salmon into the fishing groundwas determined from an analysis of the catch data.
The average rate of exploitation on the total run dur-
ing the years included in this analysis is between 32%and 51%. The exact figure cannot be estimated
without further knowledge of the extent of incomplete
reporting and tag loss.
A series of recommendations for designing future
tagging experiments is presented. It is suggested that
the planning and design of tagging experiments could
be improved significantly by first simulating the ex-
periments on an open-ended digital computer simula-
tion model of the pink salmon fishery in southeastern
Alaska.
ACKNOWLEDGMENTSIt is a pleasure to acknowledge three persons who
contributed substantially to the preparation of this
manuscript. Sandra Anderson edited an early draft of
the report and carried out many of the numerical
calculations; much of the section on migration rates is
based on her ideas. Jerry Jaffee and Lawrence Galeswrote the computer programs used to process thetagging data.
LITERATURE CITEDDAVIDSON, F. A., and L. S. CHRISTEY.
1938. The migrations of pink salmon (Oncorhynchus gor-
buscha) in the Clarence and Sumner Straits regions of South-
eastern Alaska. U.S. Bur. Fish., Bull. 48:643-666.
ELLING, C. H., and P. T. MACY.1955. Pink salmon tagging experiments in Icy Strait and Upper
Chatham Strait, 1950. U.S. Fish Wildl. Serv., Fish. Bull.
56:331-371.
FISHER, R. A.
1950. Statistical methods for research workers. 11th ed., rev.
Oliver and Boyd, Edinb., 354 p.
GULLAND, J. A.
1963. On the analysis of double-tagging experiments. Int.
Comm. Northwest Atl. Fish., Spec. Publ. 4:228-229.
PAULIK, G. J.
1961. Detection of incomplete reporting of tags. J. Fish. R«s.
Board Can. 18:817-832.
1962. Use of the Chapman-Robson survival estimate for
single- and multi-release tagging experiments. Trans. Am.Fish. Soc. 91:95-98.
1963. Exponential rates of decline and type (1) losses for
populations of tagged pink salmon. Int. Comm. Northwest
Atl. Fish,, Spec. Publ. 4:230-237.
1967. Digital simulation of natural animal communities. In
T. A. Olson and F. J. Burgess (editors). Pollution and marine
ecology, p. 67-85. Intersci. Publ., N.Y.
PAULIK, G. J., and J. W. GREENOUGH, JR.
1966. Management analysis for a salmon resource system.
In K. E. F. Watt (editor). Systems analysis in ecology, p. 215-
252. Acad. Press, N.Y.
RICH, W. H.
1927. Salmon-tagging experiments in Alaska, 1924 and 1925.
U.S. Bur. Fish., Bull. 42:109-146.
RICH, W. H., and F. G. MORTON.1930. Salmon-tagging experiments in Alaska, 1927 and 1928.
U.S. Bur. Fish., Bull. 45:1-23.
RICH, W. H., and A. J. SUOMELA.1929. Salmon-tagging experiments in Alaska, 1926. U.S.
Bur. Fish., Bull. 43(Part 2):71-104.
RICHER, W. E.
1958. Handbook of computations for biological statistics of
fish populations. Fish. Res. Board Can., Bull. 119, 300 p.
SIMPSON, R. R.
1960. Alaska commercial salmon catch statistics 1951 - 1959.
U.S. Fish Wildl. Serv., Stat. Dig. 50, 115 p.
WELCH, B. L.
1938. The significance of the difference between two means
when the population variances are unequal. Biometrika
29:350-362.
39
ft U. 5 GOVERNMENT PRINTING OFFICE: 1975-698- 199/26 REGION 10


G4S. Weifjht loss of pond-raiHed channel catfish {Ictolurus punctatus) during holding in
processini; plant vats. By Donald C. Greenland and Robert L. Gilt. December 1971. iii + 7
pp., 3 figs., 2 tables. For sale by the Superintendent of Documents. U.S. GovernmentPrinting Office. Washington, D.C. 20402.
649. Distribution of forage of skipjack tuna iEuthynnus pelamis) in the eastern trt>pical
Pacific. By Maurice Blackburn and Michael Laurs. January 1972. iii + 16 pp., 7 figs., 3
tables. For sale bv the Superintendent of Documents. U.S. Government Printing Office.
Washington, D.C. 20402.
650. Effects of some antioxidants and EDTA on the development of rancidity in Spanishmackerel iScomberomorus maculatus) during frozen storage. By Robert N. Farragut.
February 1972, iv + 12 pp.. 6 figs., 12 tables. For sale by the Superintendent of
Documents. U.S. Government Printing OITice, Washington, D.C. 20402
651. The effect of premortem stress, holding temperatures, and freezmg on the
biochemistry and quality of skipjack tuna. By Ladell Crawford. April 1972, iii + 23 pp.. 3
figs., 4 tables. For sale by the Superintendent of Documents. U.S. Government Printing
Office. Washington. D.C. 20402.
653. The use of electricity in conjunction with a 12.5-meter (Headrope) Gulf-of. Mexicoshrimp trawl in Lake Michipan. By .James E, Ellis. March 1972. iv + 10 pp.. 11 figs.. 4
tables. For sale by the Supenntendent of Documents. U.S. Government Printing Office,
Washington. DC. 20402.
654. An electric detector system for recovering internally tagged menhaden, genusBreuoortia By R. O Parker. .Ir. February 1972. iii + 7 pp., .i figs.. 1 appendix table. Forsale by the Superintendent of Documents. U.S. Government Printing Office. Washington.
DC. 20402.
6,55, Immobilization of fingerling salmon and trout by decompression. By Doyle F.
Sutherland. March 1972. iii + 7 pp.. 3 figs.. 2 tables. For sale by the Superintendent of
Documents, U.S. Government Printing Office. Washington, D.C. 20402.
662. Seasonal distribution of tunas and billfisliet* in the Atlantic. By John P Wise andCharles W Davis January 1973, iv + 24 pp.. 13 figs . 4 tables For sale by the Superinten-dent of Documents, U.S. Government Printing Office, Washington, D.C. 20402.
663. Fish larvae collected from the northeastern Pacific Ocean and Puget Sound duringApril and May 1%7 By Kenneth D. Waldron. December 1972. iii ^ 16 pp.. 2 figs., 1 table,4 appendix tables For sale by the Superintendent of DocumenU. U.S. Government Print-ing Office. Washington. DC 20402
664. Tagging and tag-recovery experimenU with Atlantic menhaden, Brtvoortia tyran-nus. By Richard L. Kroger and Flobert L. Dryfoos. December 1972. \v + 11 pp., 4 figs., 12tables For sale by the Superintendent of Documents. US. Government Printing OfficeWashington, DC. 20402
665. Larval fish survey of Humbolt Bay, California. By Maxwell B. Eldridge and CharlesF. Bryan. December 1972, iii + 8 pp.. 8 figs., 1 table. For sale by the Superintendent ofDocuments, U.S. Government Printing Office, Washington, DC. 20402.
666. Distribution and relative abundance of fishes in Newport River, North Carolina. ByWilliam R. Turner and George N. Johnson. September 1973, iv + 23 pp.. 1 fig.. 13 tables.For sale by the Superintendent of Documents, U.S. Government Printing Office,Washington, DC 20402.
667. An analysis of the commercial lobster {Homarm americanus) fishery along the coastof Maine, August 1966 through December 1970. By James C. Thomas. June 1973, v -f 57
pp , 18 figs., 11 tables. For sale by the Superintendent of Documents. U.S. GovernmentPrinting Office. Washington, DC. 20402.
668. An annotated bibliography of the cunner, Tautogolabrus adspersus (Walbaum). ByFredric M. Serchuk and David W Frame. May 1973. ii + 43 pp. For sale by theSuperintendent of Documents, U.S. Government Printing Office, Washington, DC.20402.
6,56. The calico scallop, ^r^opecfen ^t66ti5. By Donald M. Allen and T. J. Costelio. May1972, iii + 19 pp., 9 figs.. 1 table. For sale by the Superintendent of Documents, U.S.Government Printing Office, Washington. D.C. 20402.
657. Making fish protein concentrates by enzymatic hydrolysis. A status report onresearch and some processes and products studied by NMFS. By Malcolm B. Hale.November 1972. v -f 32 pp.. 15 figs.. 17 tables. 1 appendix table. For sale by theSuperintendent of Documents, U.S. Government Printing Office, Washington. D.C.20402.
658. List of fishes of Alaska and adjacent waters with a guide to some of their literature.
By Jay C. Quasi and Elizabeth L. Hall. July 1972, iv + 47 pp. For sale by the Superinten-dent of Documents. U.S. Government Printing Office. Washington. D.C. 20402.
669. Subpoint prediction for direct readout meteorological satellites. By L. E. Eber.August 1973, iii + 7 pp., 2 figs., 1 table. For sale by the Superintendent of Documents,U.S. Government Printing Office. Washington. D.C. 20402.
670. Unharvested fishes in the U.S. commercial fishery of western Lake Erie in 1969. ByHarry D. Van Meter. July 1973, iii + 11 pp., 6 figs., 6 tables. For sale by the Superinten-dent of Documents, U.S. Government Printing Office. Washington. D.C. 20402.
671. Coastal upwelling indices, west coast of North America. 1946-71. By AndrewBakun June 1973. iv -l- 103 pp.. 6 figs., 3 tables. 45 appendix figs. For sale by theSuperintendent of Documents. U.S. Government Printing Office, Washington. D.C.20402.
659. The Southeast Fisheries Center bionumeric code. Part I: Fishes. By Harvey R.Bullis. Jr.. Richard B. Roe. and Judith C. Gatlin. July 1972. xl + 95 pp.. 2 figs. For sale bythe Superintendent of Documents. U.S. Government Printing Office. Washington. DC.20402.
660. A freshwater fish electro-motivator (FFEM)-its characteristics and operation. ByJames E. Ellis and Charles C. Hoopes. November 1972. iii + U pp.. 9 figs.
661. A review of the literature on the development of skipjack tuna fisheries in the cen-tral and western Pacific Ocean. By Frank J Hester and Tamio Otsu. January 1973. iii +13 pp.. 1 fig. For sale by the Superintendent of Documents. U.S. Government Printing Of-fice. Washington. D.C. 20402.
672. Seasonal occurrence of young Gulf menhaden and other fishes in a northwesternFlorida estuary By Marlin E. Tagatz and E. Peter H. Wilkins. August 1973. iii ¥ 14 pp., 1
fig.. 4 tables. For sale by the Superintendent of DocumenU, U.S. Government Printing Of-fice, Washington, DC. 20402.
673. Abundance and distribution of inshore benthic fauna off southwestern Long Island,
NY. By Frank W. Steimle. Jr. and Richard B. Stone. December 1973, iii ¥ 50 pp., 2 figs.,
5 appendix tables.
674. Lake Erie bottom trawl explorations. 1962-66. By Edgar W. Bowman. January 1974,iv + 21 pp.. 9 figs.. 1 table. 7 appendix tables.
MBL WHOI Librai
IP iiiiiimiip
WHSE 04495

UNITED STATESDEPARTMENT OF COAAMERCE
NATIONAl OCEANIC AND ATMOSPHERIC ADMINISTRATIONNATIONAl MARINE FISHERIES SERVICE
SCIENTIFIC PUBLICATIONS STAFF
ROOM 450
1107 N.e 45TH ST.
SEATTLE, WA 98105
OFFICIAL BUSINESS
FOURTH CLASSPOSTAGE AND FEES PAID
US DEPARTMENT OF COMMERCE
COM 210
»^
ov.ut;o/^
^^^6-191^