Embed Size (px)
Citation preview
© Imperial College LondonPage 1
Probing molecular structure and dynamics using laser driven electron
recollisions
30th April 2009
Sarah Baker
Quantum Optics and Laser Science group Blackett Laboratory
© Imperial College LondonPage 2
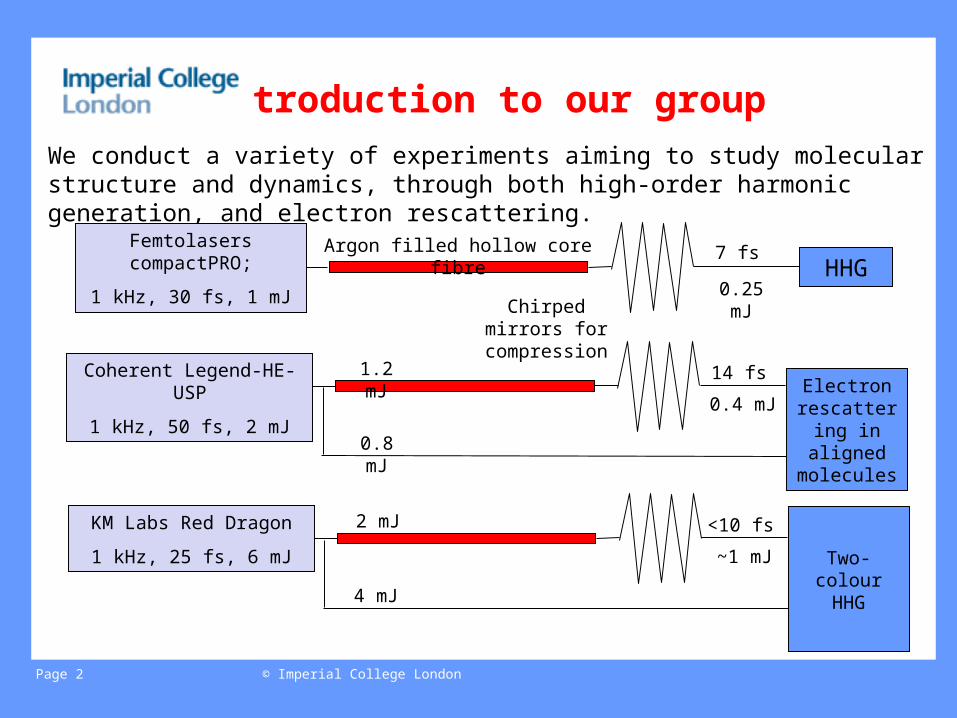
Introduction to our groupWe conduct a variety of experiments aiming to study molecular structure and dynamics, through both high-order harmonic generation, and electron rescattering.
Femtolasers compactPRO;
1 kHz, 30 fs, 1 mJ
Argon filled hollow core fibreHHG
7 fs
0.25 mJChirped mirrors for compression
Coherent Legend-HE-USP
1 kHz, 50 fs, 2 mJElectron
rescattering in aligned molecules
14 fs
0.4 mJ
1.2 mJ
0.8 mJ
KM Labs Red Dragon
1 kHz, 25 fs, 6 mJ Two-colour HHG
<10 fs
~1 mJ
2 mJ
4 mJ
© Imperial College LondonPage 3
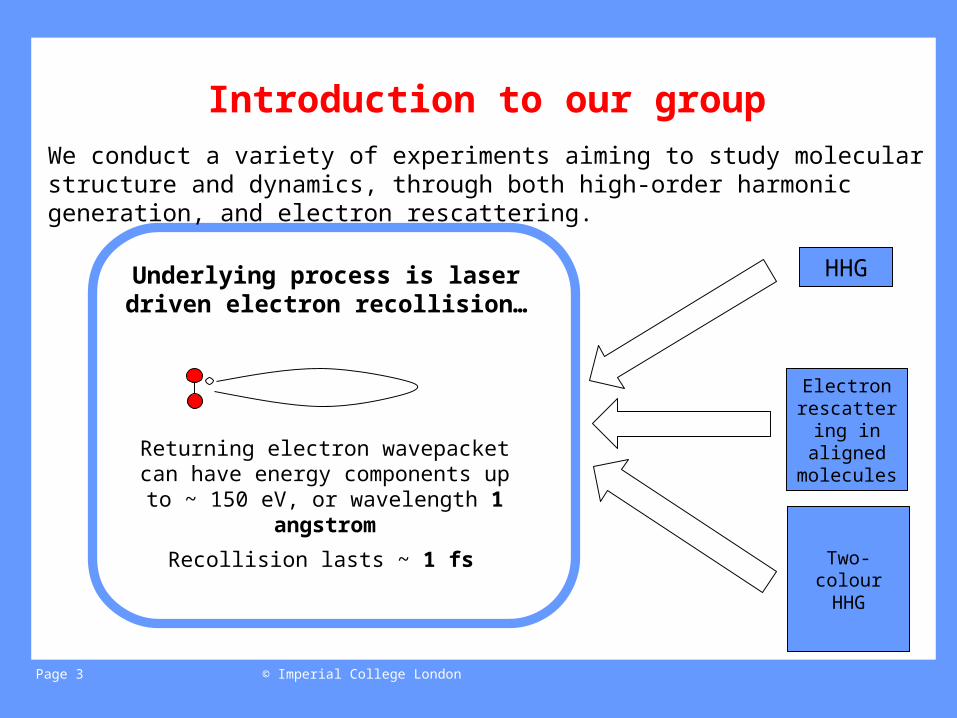
Introduction to our group
Electron rescattering in aligned molecules
HHG
Two-colour HHG
Underlying process is laser driven electron recollision…
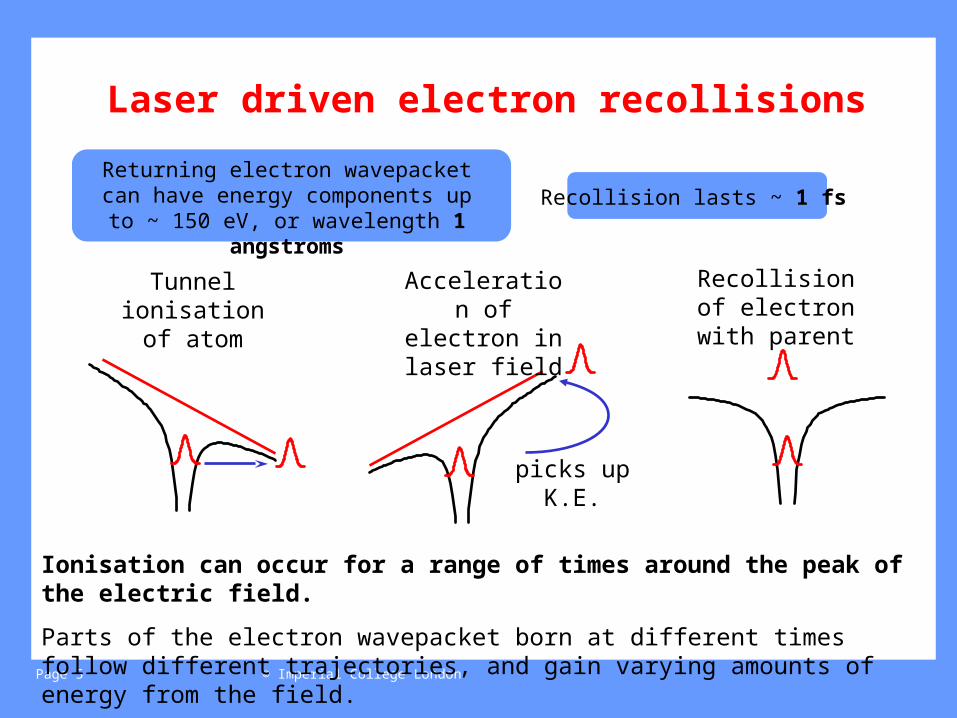
Returning electron wavepacket can have energy components up to ~ 150 eV, or
wavelength 1 angstrom
Recollision lasts ~ 1 fs
We conduct a variety of experiments aiming to study molecular structure and dynamics, through both high-order harmonic generation, and electron rescattering.
© Imperial College LondonPage 4
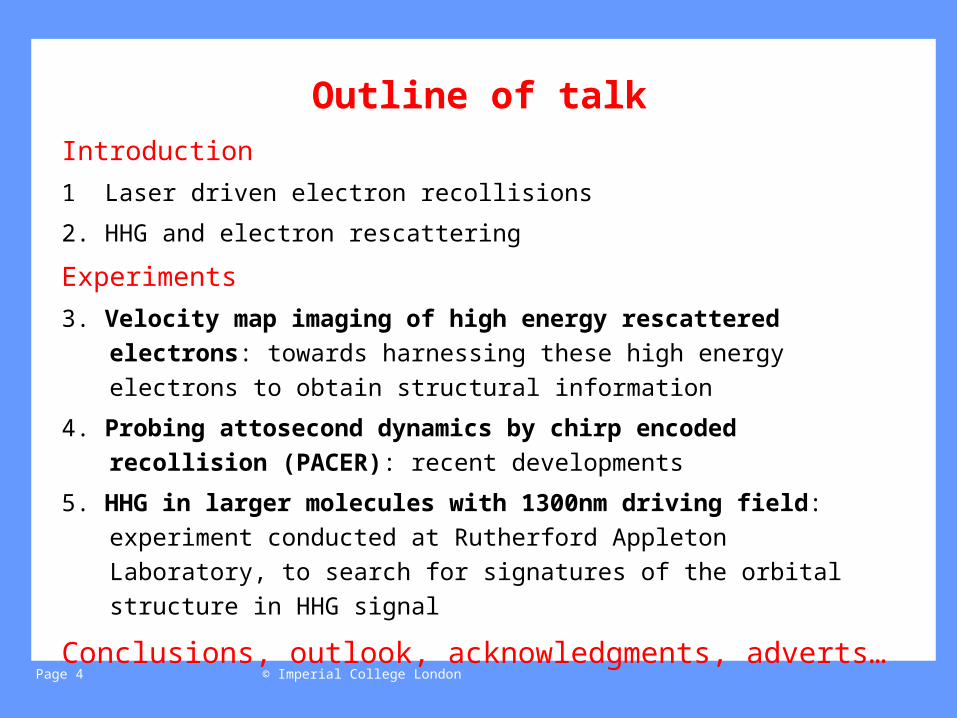
Outline of talkIntroduction
1 Laser driven electron recollisions
2. HHG and electron rescattering
Experiments
3. Velocity map imaging of high energy rescattered electrons: towards
harnessing these high energy electrons to obtain structural information
4. Probing attosecond dynamics by chirp encoded recollision (PACER):
recent developments
5. HHG in larger molecules with 1300nm driving field: experiment
conducted at Rutherford Appleton Laboratory, to search for signatures of
the orbital structure in HHG signal
Conclusions, outlook, acknowledgments, adverts…
© Imperial College LondonPage 5
Laser driven electron recollisions
Returning electron wavepacket can have energy components up to ~ 150 eV, or
wavelength 1 angstromsRecollision lasts ~ 1 fs
Tunnel ionisation of
atom
picks up K.E.
Acceleration of electron in laser field
Recollision of electron with
parent
Ionisation can occur for a range of times around the peak of the electric field.
Parts of the electron wavepacket born at different times follow different trajectories, and gain varying amounts of energy from the field.
© Imperial College LondonPage 6
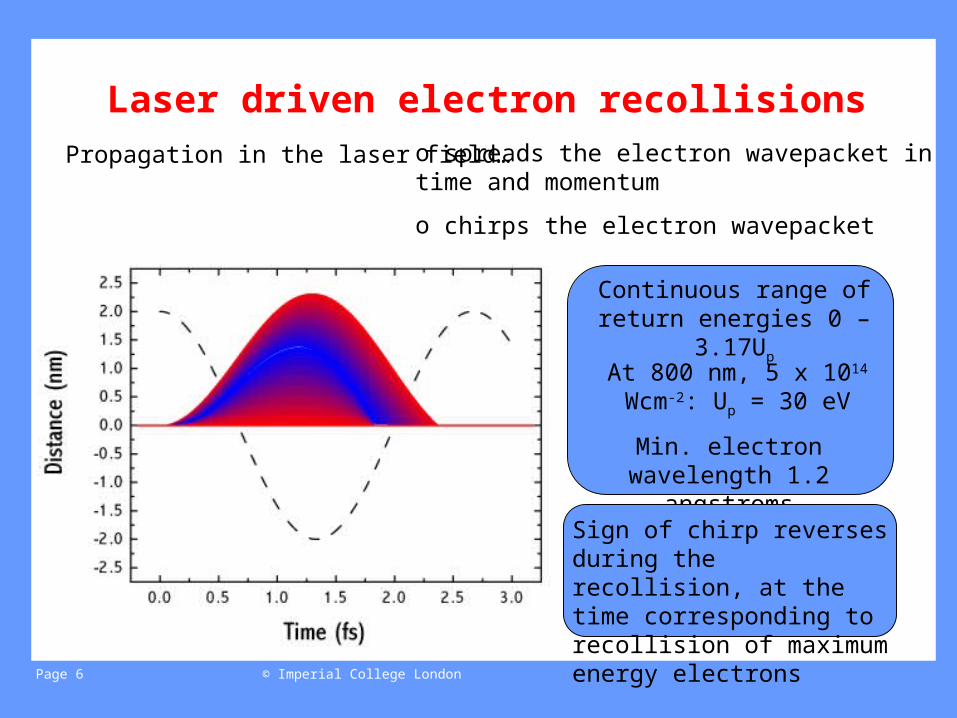
Propagation in the laser field… o spreads the electron wavepacket in time and momentum
o chirps the electron wavepacket
Laser driven electron recollisions
Continuous range of return energies 0 – 3.17Up
At 800 nm, 5 x 10¹⁴ Wcm-2: Up = 30 eV
Min. electron wavelength 1.2 angstroms
Sign of chirp reverses during the recollision, at the time corresponding to recollision of maximum energy electrons
© Imperial College LondonPage 7
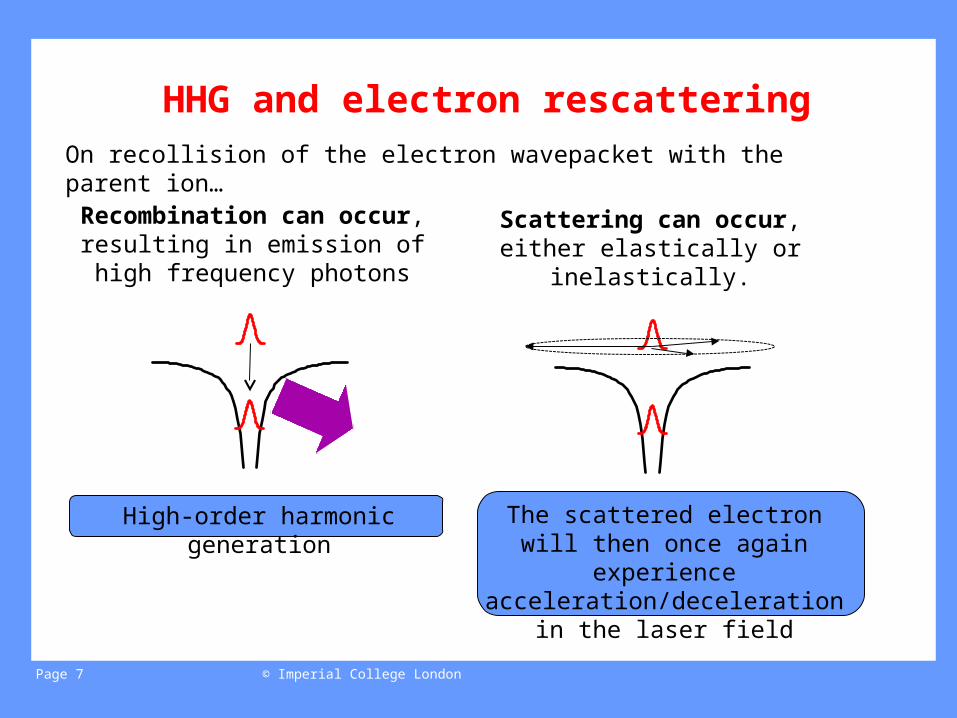
On recollision of the electron wavepacket with the parent ion…
HHG and electron rescattering
Recombination can occur, resulting in emission of high
frequency photons
High-order harmonic generation
Scattering can occur, either elastically or inelastically.
The scattered electron will then once again experience
acceleration/deceleration in the laser field
© Imperial College LondonPage 8
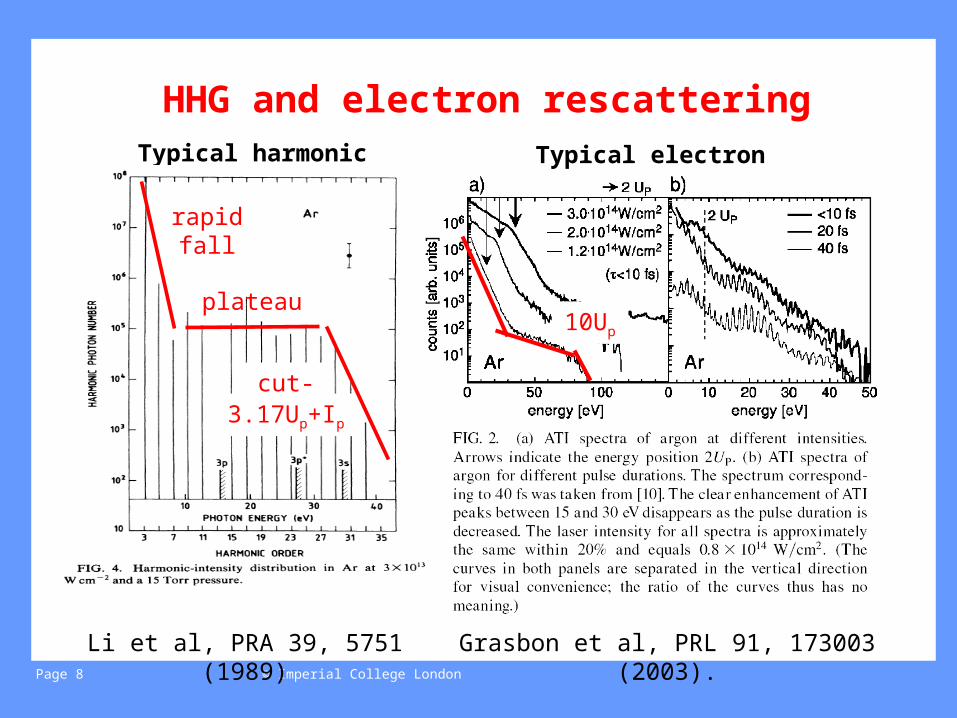
HHG and electron rescatteringTypical harmonic spectrum Typical electron spectrum
Li et al, PRA 39, 5751 (1989) Grasbon et al, PRL 91, 173003 (2003).
plateau
rapid fall
cut-off3.17Up+Ip
10Up
© Imperial College LondonPage 9
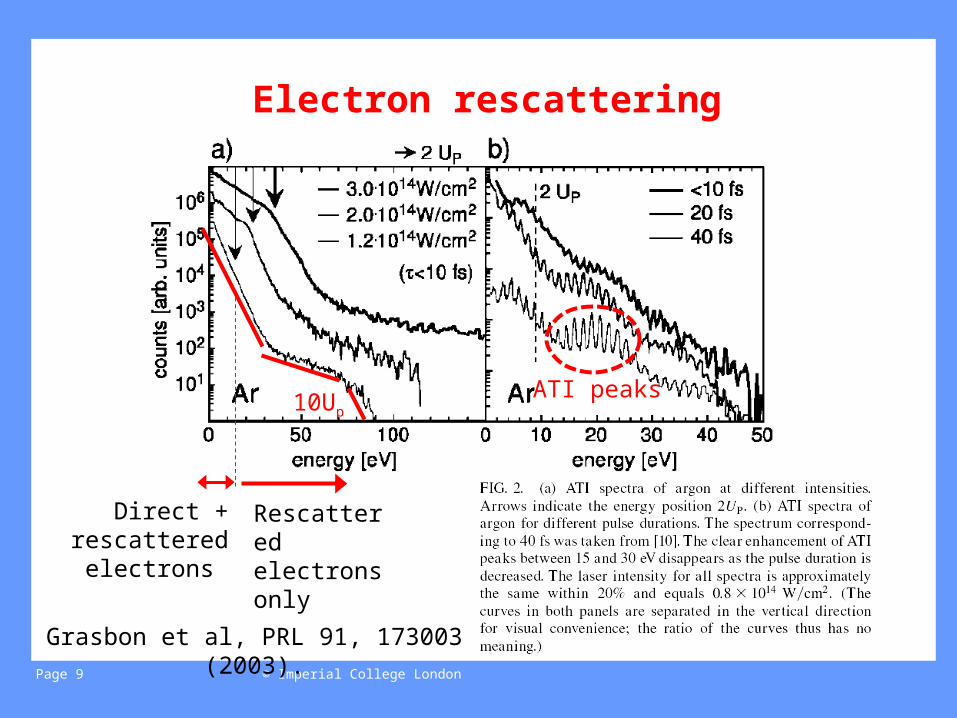
Electron rescattering
Grasbon et al, PRL 91, 173003 (2003).
10Up
Direct + rescattered
electrons
Rescattered electrons only
ATI peaks
© Imperial College LondonPage 10
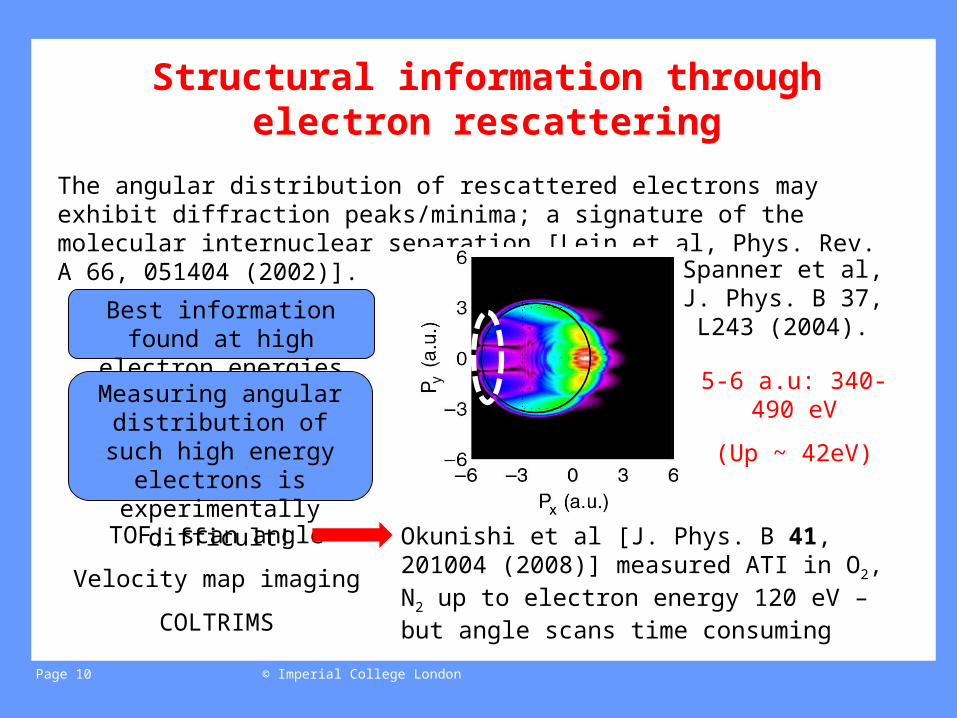
Structural information through electron rescattering
The angular distribution of rescattered electrons may exhibit diffraction peaks/minima; a signature of the molecular internuclear separation [Lein et al, Phys. Rev. A 66, 051404 (2002)].
Spanner et al, J. Phys. B 37, L243
(2004).Best information found at
high electron energies
5-6 a.u: 340-490 eV
(Up ~ 42eV)Measuring angular
distribution of such high energy electrons is
experimentally difficult!
TOF, scan angle
Velocity map imaging
COLTRIMS
Okunishi et al [J. Phys. B 41, 201004 (2008)] measured ATI in O2, N2 up to electron energy 120 eV – but angle scans time consuming
© Imperial College LondonPage 11
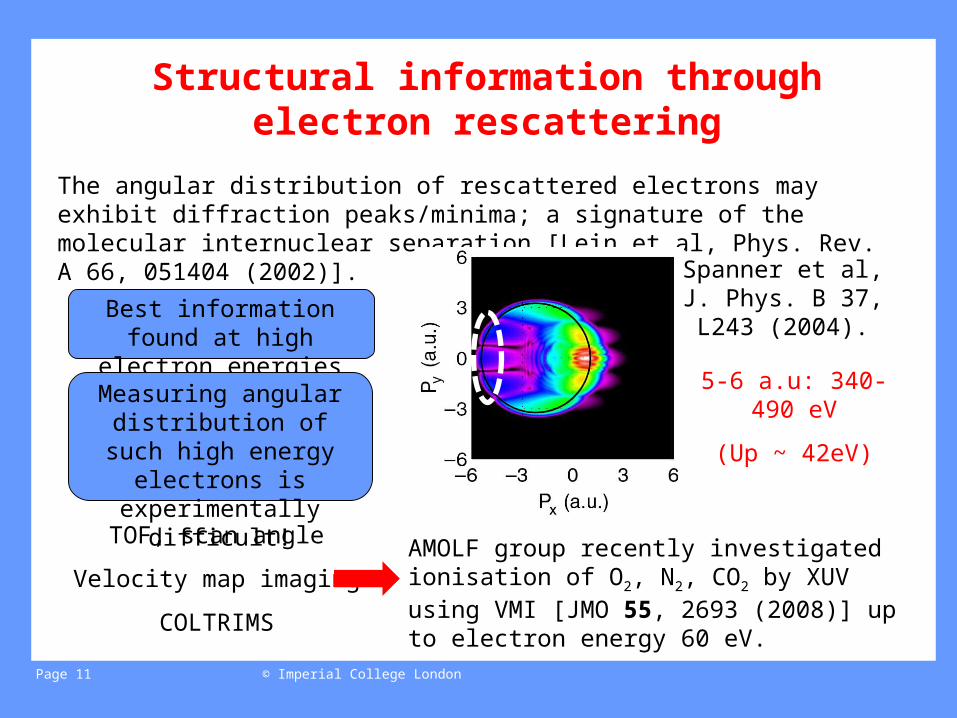
Structural information through electron rescattering
The angular distribution of rescattered electrons may exhibit diffraction peaks/minima; a signature of the molecular internuclear separation [Lein et al, Phys. Rev. A 66, 051404 (2002)].
Spanner et al, J. Phys. B 37, L243
(2004).Best information found at
high electron energies
Measuring angular distribution of such high
energy electrons is experimentally difficult!
5-6 a.u: 340-490 eV
(Up ~ 42eV)
TOF, scan angle
Velocity map imaging
COLTRIMS
AMOLF group recently investigated ionisation of O2, N2, CO2 by XUV using VMI [JMO 55, 2693 (2008)] up to electron energy 60 eV.
© Imperial College LondonPage 12
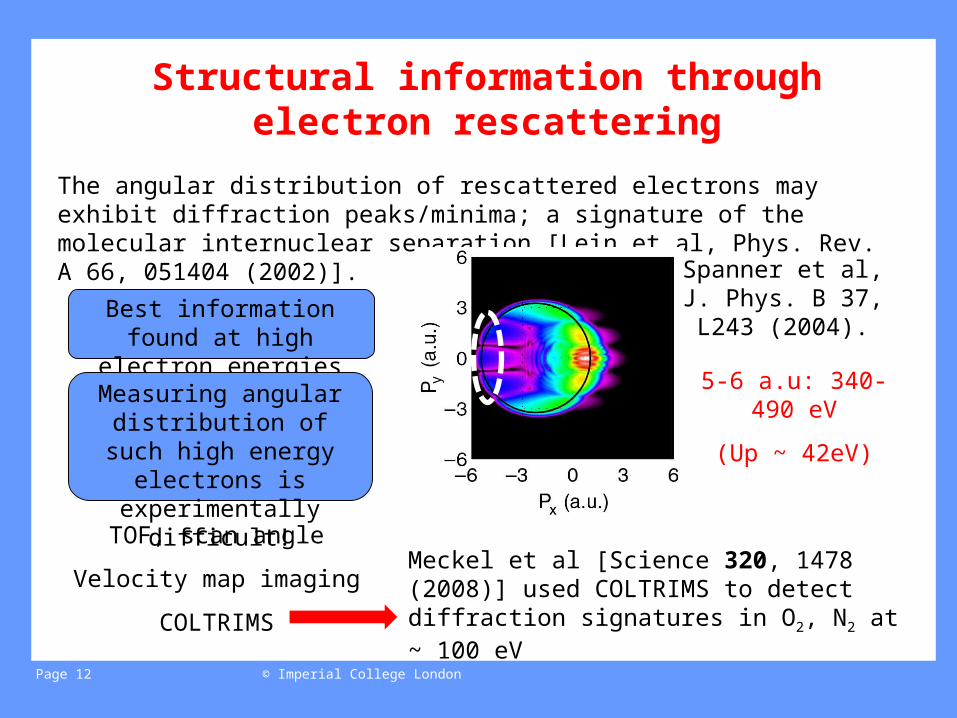
Structural information through electron rescattering
The angular distribution of rescattered electrons may exhibit diffraction peaks/minima; a signature of the molecular internuclear separation [Lein et al, Phys. Rev. A 66, 051404 (2002)].
Spanner et al, J. Phys. B 37, L243
(2004).Best information found at
high electron energies
Measuring angular distribution of such high
energy electrons is experimentally difficult!
5-6 a.u: 340-490 eV
(Up ~ 42eV)
TOF, scan angle
Velocity map imaging
COLTRIMS
Meckel et al [Science 320, 1478 (2008)] used COLTRIMS to detect diffraction signatures in O2, N2 at ~ 100 eV
© Imperial College LondonPage 13
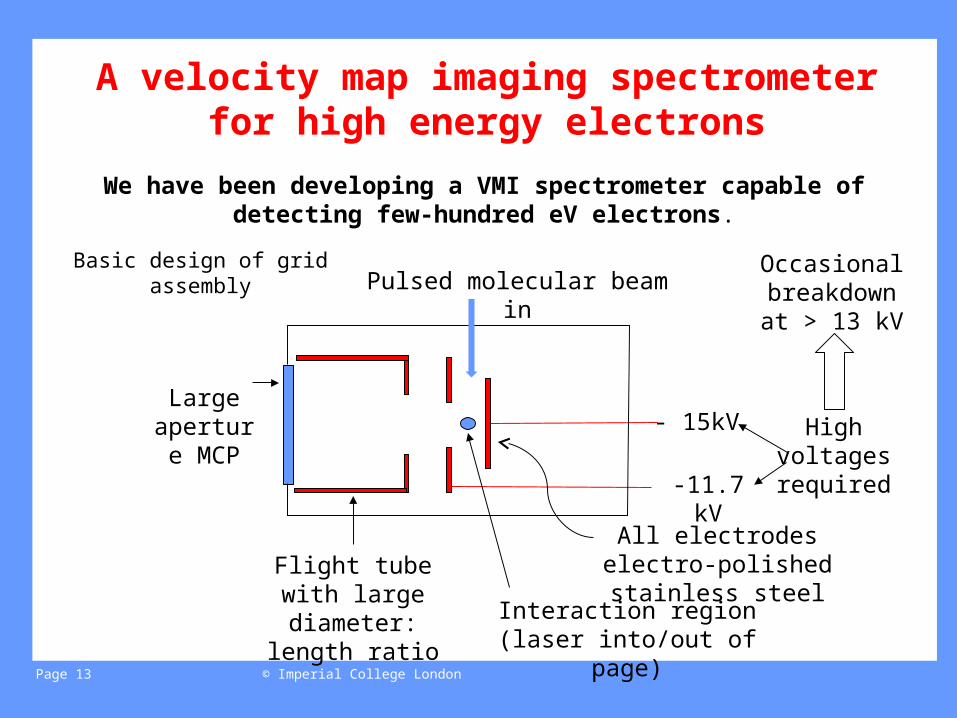
A velocity map imaging spectrometer for high energy electrons
We have been developing a VMI spectrometer capable of detecting few-hundred eV electrons.
Basic design of grid assembly
All electrodes electro-polished stainless steel
- 15kV
-11.7 kV
High voltages required
Large aperture
MCP
Flight tube with large diameter:
length ratio
Pulsed molecular beam inOccasional
breakdown at > 13 kV
Interaction region (laser into/out of page)
© Imperial College LondonPage 14
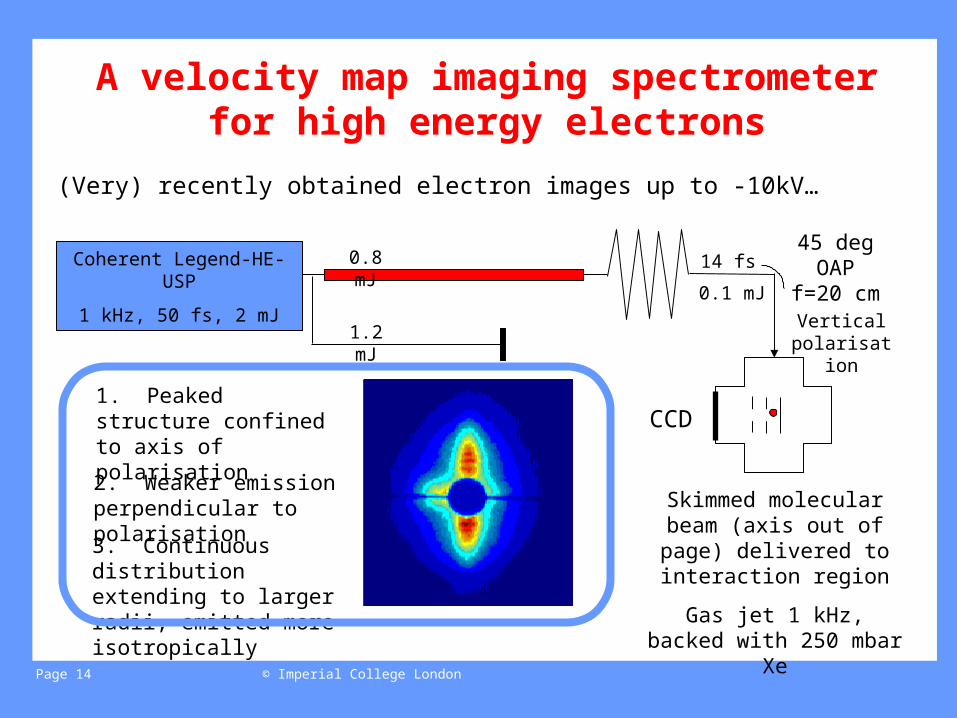
A velocity map imaging spectrometer for high energy electrons
(Very) recently obtained electron images up to -10kV…
Coherent Legend-HE-USP
1 kHz, 50 fs, 2 mJ
14 fs
0.1 mJ
0.8 mJ
1.2 mJ
45 deg OAP
f=20 cm
Skimmed molecular beam (axis out of page) delivered
to interaction region
Gas jet 1 kHz, backed with 250 mbar Xe
CCD
Vertical polarisation
1. Peaked structure confined to axis of polarisation
3. Continuous distribution extending to larger radii, emitted more isotropically
2. Weaker emission perpendicular to polarisation
© Imperial College LondonPage 15
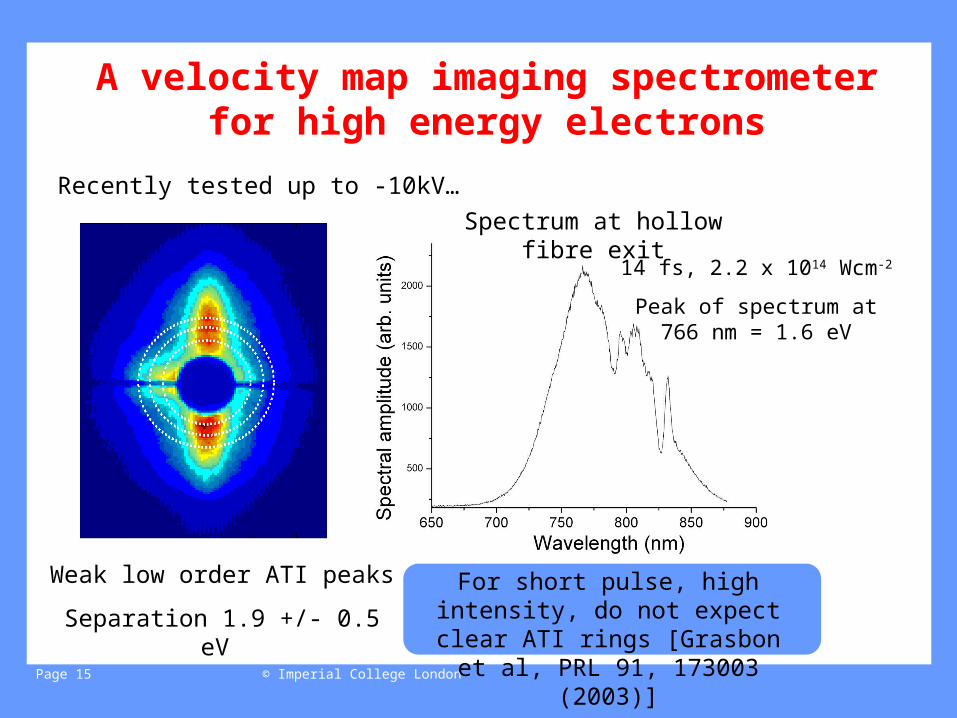
A velocity map imaging spectrometer for high energy electrons
Recently tested up to -10kV…
Weak low order ATI peaks
Separation 1.9 +/- 0.5 eV
14 fs, 2.2 x 10¹⁴ Wcm-2
Peak of spectrum at 766 nm = 1.6 eV
Spectrum at hollow fibre exit
For short pulse, high intensity, do not expect clear ATI rings [Grasbon
et al, PRL 91, 173003 (2003)]
© Imperial College LondonPage 16
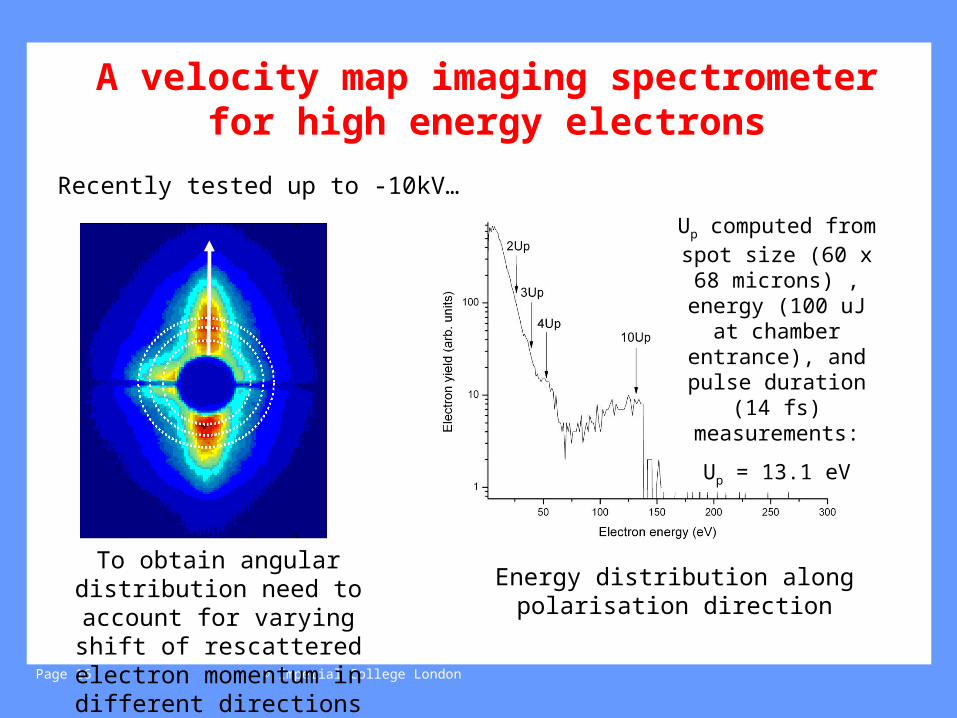
A velocity map imaging spectrometer for high energy electrons
Recently tested up to -10kV…
To obtain angular distribution need to account for varying shift
of rescattered electron momentum in different directions
Energy distribution along polarisation direction
Up computed from spot size (60 x 68 microns) , energy
(100 uJ at chamber entrance), and pulse
duration (14 fs) measurements:
Up = 13.1 eV
© Imperial College LondonPage 17
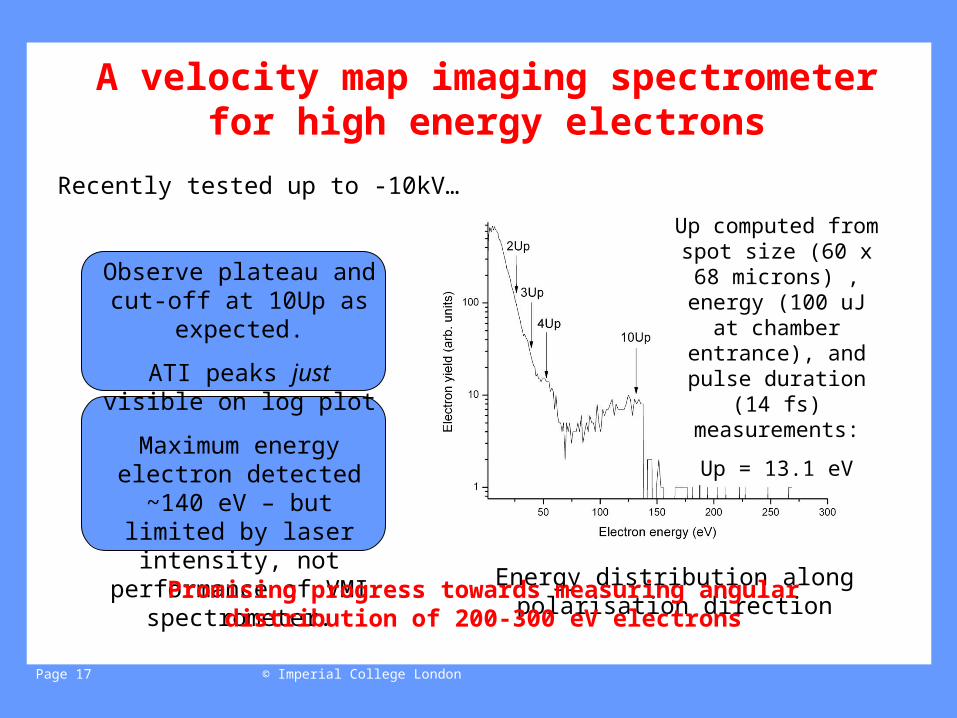
A velocity map imaging spectrometer for high energy electrons
Recently tested up to -10kV…
Energy distribution along polarisation direction
Up computed from spot size (60 x 68 microns) , energy
(100 uJ at chamber entrance), and pulse
duration (14 fs) measurements:
Up = 13.1 eV
Observe plateau and cut-off at 10Up as expected.
ATI peaks just visible on log plot
Maximum energy electron detected ~140 eV – but limited by laser intensity, not performance of VMI
spectrometer.
Promising progress towards measuring angular distribution of 200-300 eV electrons
© Imperial College LondonPage 18
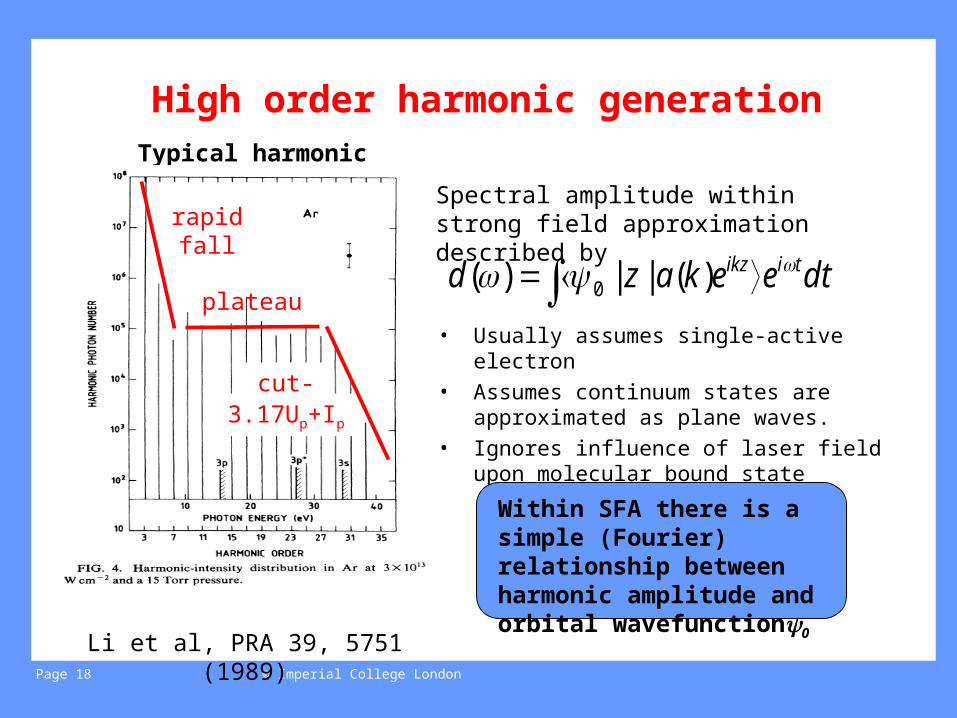
High order harmonic generationTypical harmonic spectrum
Li et al, PRA 39, 5751 (1989)
rapid fall
plateau
cut-off3.17Up+Ip
dteekazd tiikz )(||)( 0
Spectral amplitude within strong field approximation described by
• Usually assumes single-active electron • Assumes continuum states are
approximated as plane waves.• Ignores influence of laser field upon
molecular bound state
Within SFA there is a simple (Fourier) relationship between harmonic amplitude and orbital wavefunction0
© Imperial College LondonPage 19
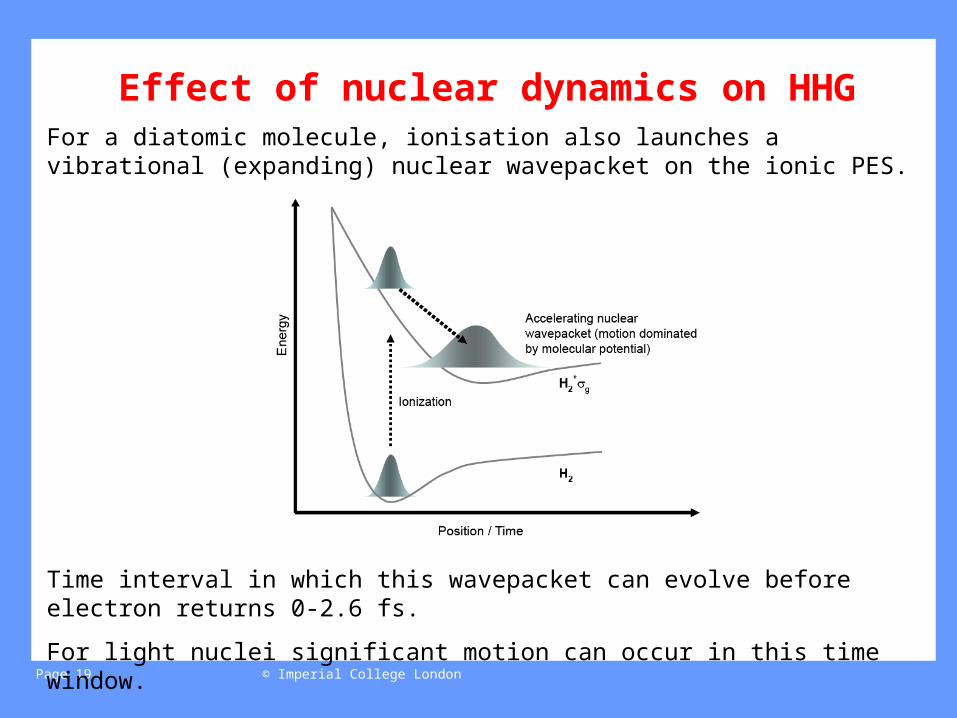
Effect of nuclear dynamics on HHGFor a diatomic molecule, ionisation also launches a vibrational (expanding) nuclear wavepacket on the ionic PES.
Time interval in which this wavepacket can evolve before electron returns 0-2.6 fs.
For light nuclei significant motion can occur in this time window.
© Imperial College LondonPage 20
Vibrational wavefunctions (nuclear contribution) Electronic
ground states
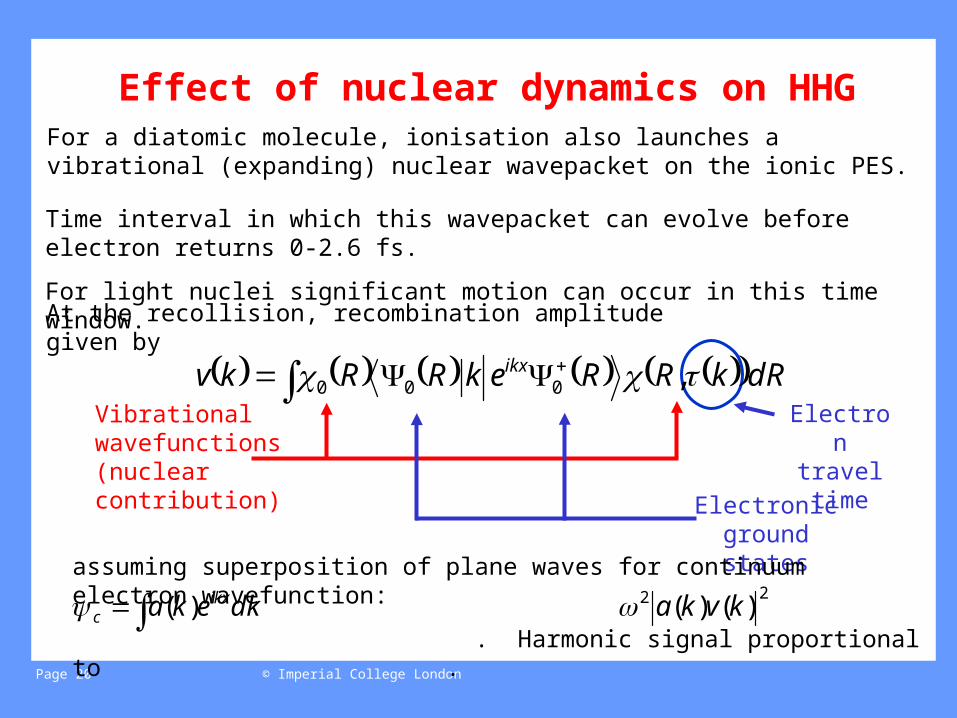
Effect of nuclear dynamics on HHG
Electron travel time
For a diatomic molecule, ionisation also launches a vibrational (expanding) nuclear wavepacket on the ionic PES.
Time interval in which this wavepacket can evolve before electron returns 0-2.6 fs.
For light nuclei significant motion can occur in this time window.
dRkRRekRRkv ikx ,000
assuming superposition of plane waves for continuum electron wavefunction:
. Harmonic signal proportional to .22 )()( kvka dkeka ikx
c )(
At the recollision, recombination amplitude given by
© Imperial College LondonPage 21
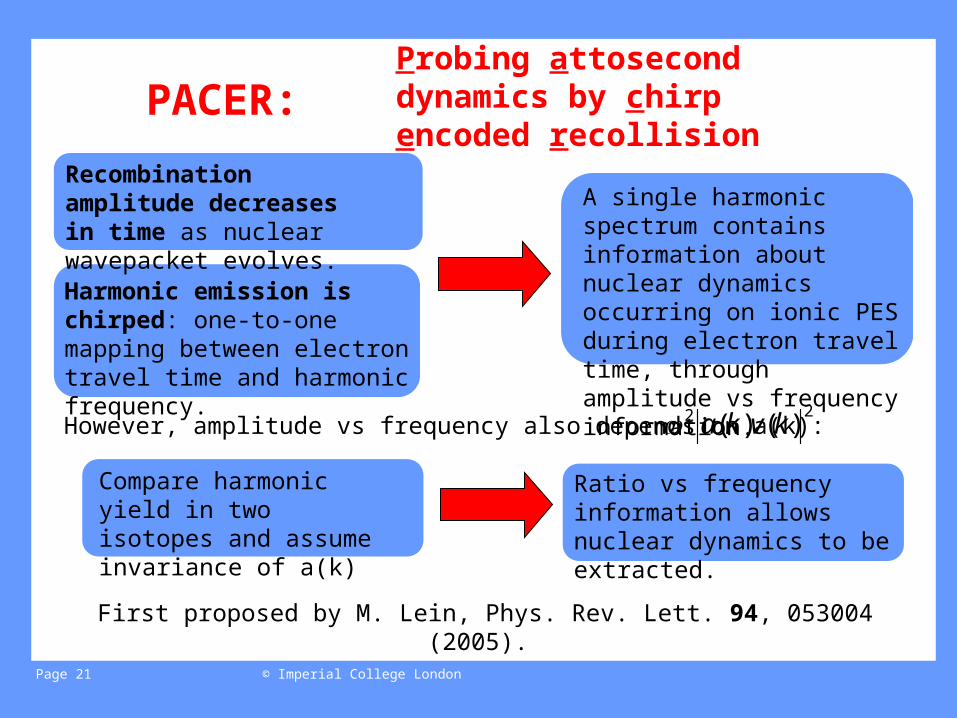
A single harmonic spectrum contains information about nuclear dynamics occurring on ionic PES during electron travel time, through amplitude vs frequency information.
However, amplitude vs frequency also depends on a(k): 22 )()( kvka
Probing attosecond dynamics by chirp encoded recollisionPACER:
Compare harmonic yield in two isotopes and assume invariance of a(k)
Ratio vs frequency information allows nuclear dynamics to be extracted.
First proposed by M. Lein, Phys. Rev. Lett. 94, 053004 (2005).
Harmonic emission is chirped: one-to-one mapping between electron travel time and harmonic frequency.
Recombination amplitude decreases in time as nuclear wavepacket evolves.
© Imperial College LondonPage 22
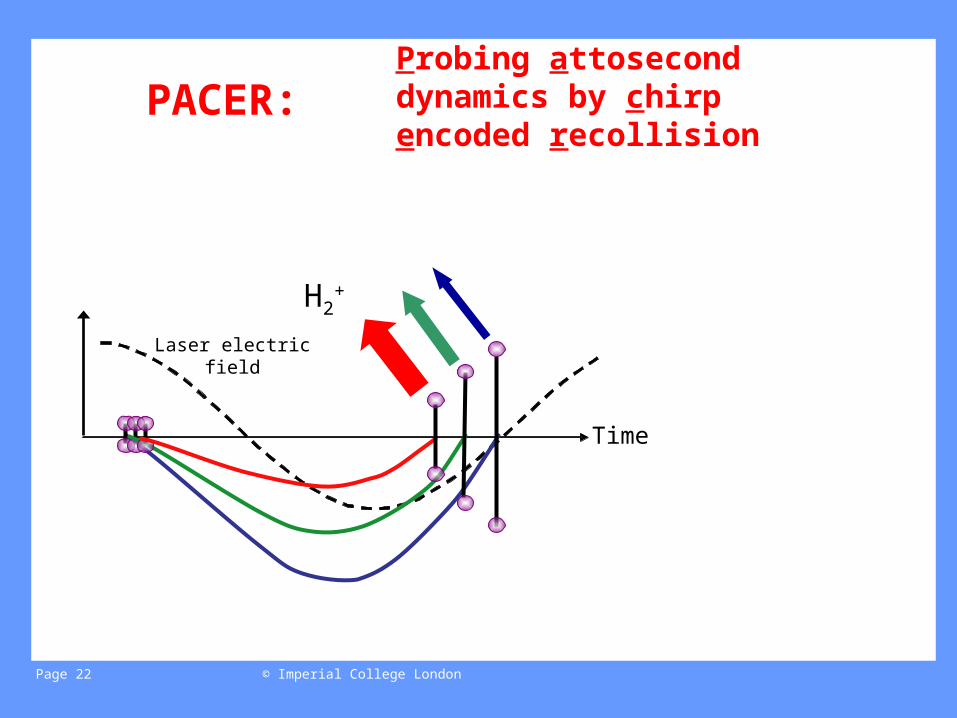
Probing attosecond dynamics by chirp encoded recollision
Laser electric field
Time
PACER:
H2+
© Imperial College LondonPage 23
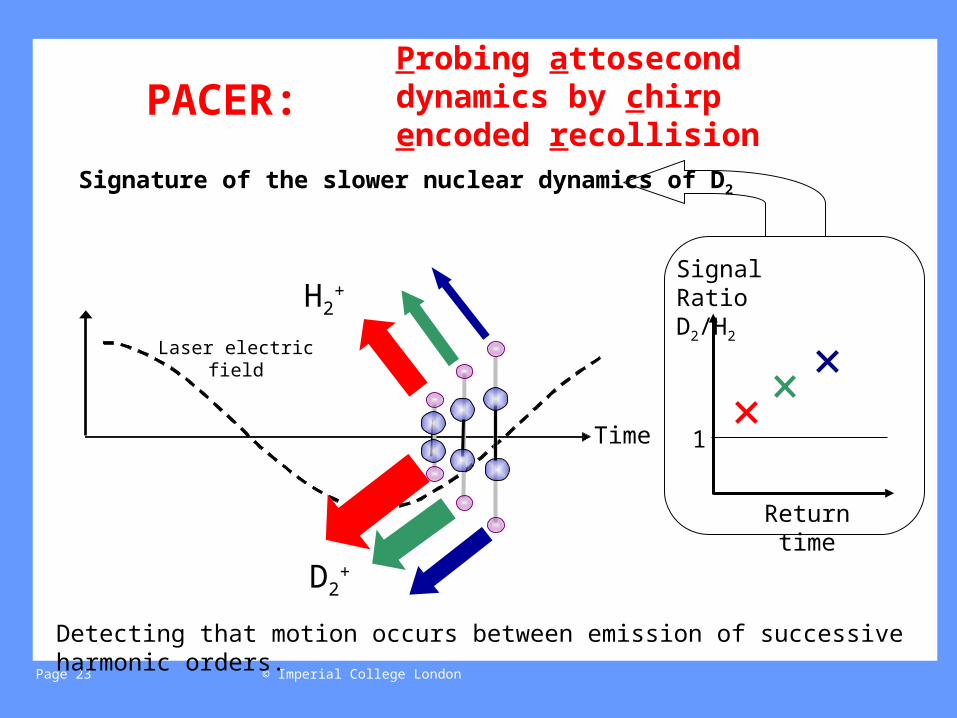
Probing attosecond dynamics by chirp encoded recollisionPACER:
H2+
Laser electric field
Time
D2+
Detecting that motion occurs between emission of successive harmonic orders.
Signal Ratio D2/H2
Return time
1
Signature of the slower nuclear dynamics of D2
© Imperial College LondonPage 24
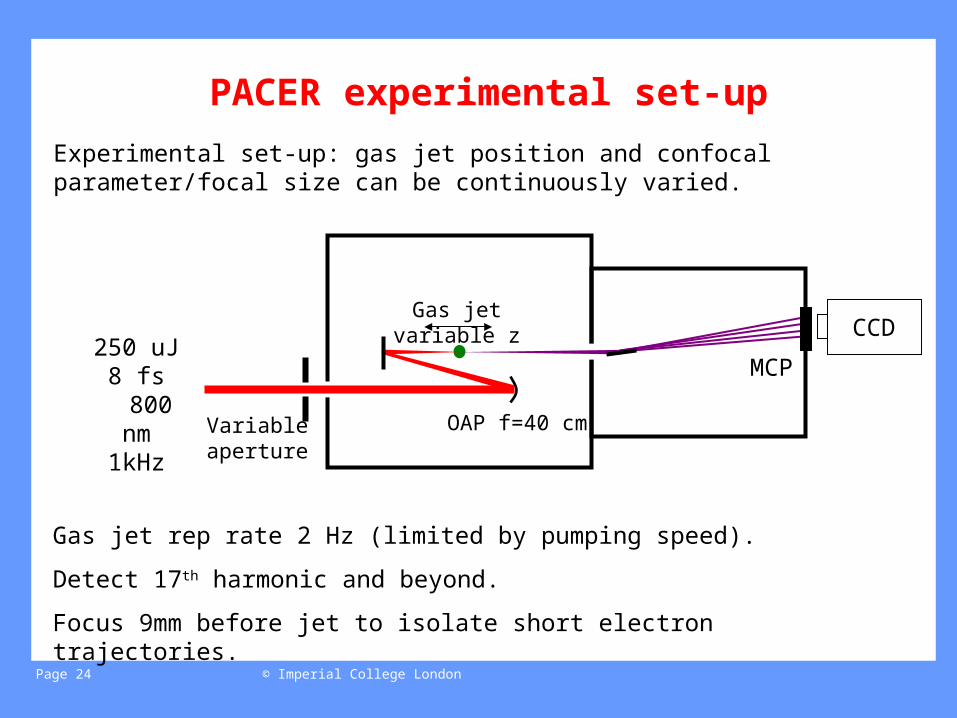
PACER experimental set-up
Gas jet rep rate 2 Hz (limited by pumping speed).
Detect 17th harmonic and beyond.
Focus 9mm before jet to isolate short electron trajectories.
CCD
OAP f=40 cm
Gas jet variable z
Variable aperture
250 uJ 8 fs
800 nm 1kHz
MCP
Experimental set-up: gas jet position and confocal parameter/focal size can be continuously varied.
© Imperial College LondonPage 25
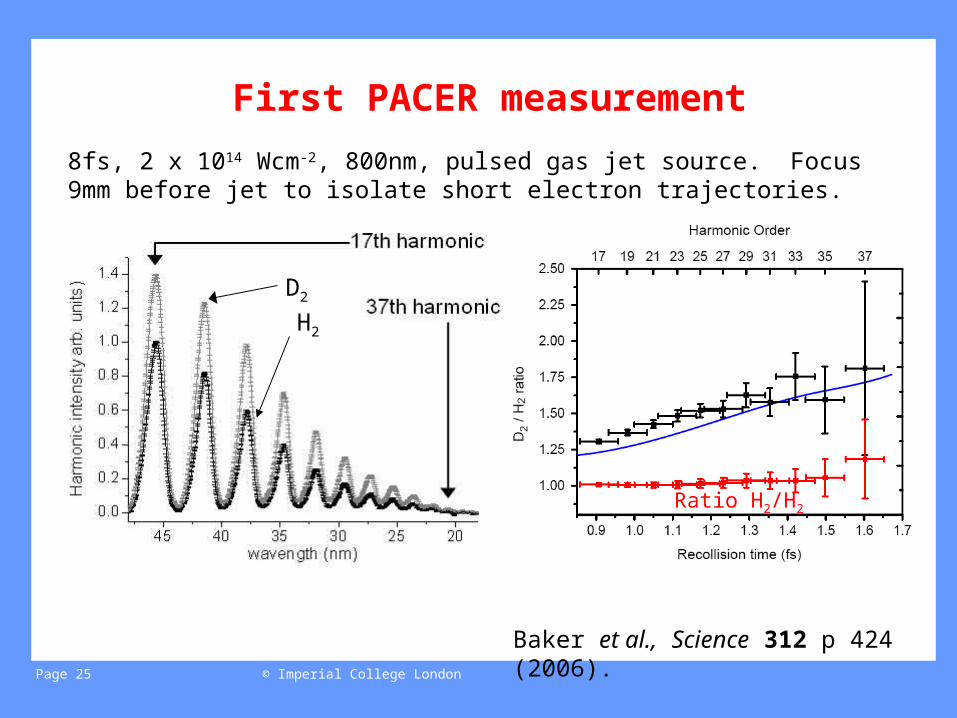
First PACER measurement
Ratio H2/H2
D2
H2
8fs, 2 x 10¹⁴ Wcm-2, 800nm, pulsed gas jet source. Focus 9mm before jet to isolate short electron trajectories.
Baker et al., Science 312 p 424 (2006).
Ratio H2/H2
© Imperial College LondonPage 26
First PACER measurement
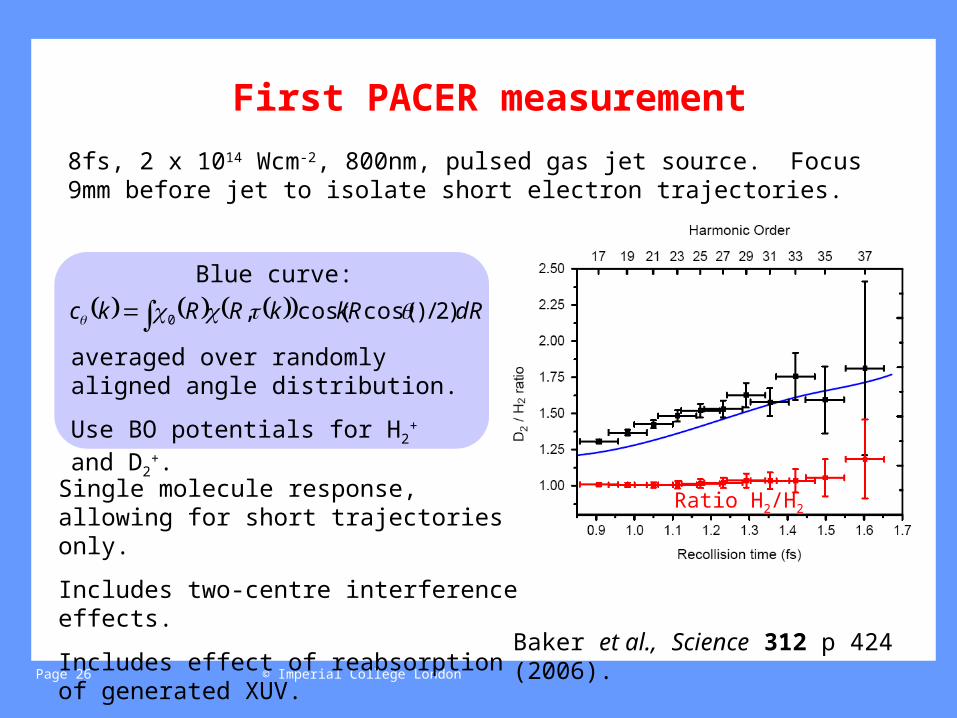
8fs, 2 x 10¹⁴ Wcm-2, 800nm, pulsed gas jet source. Focus 9mm before jet to isolate short electron trajectories.
Baker et al., Science 312 p 424 (2006).
Single molecule response, allowing for short trajectories only.
Includes two-centre interference effects.
Includes effect of reabsorption of generated XUV.
dRkRkRRkc )2/)cos(cos(,0
Blue curve:
averaged over randomly aligned angle distribution.
Use BO potentials for H2+ and D2
+.
Ratio H2/H2
© Imperial College LondonPage 27
First PACER measurement
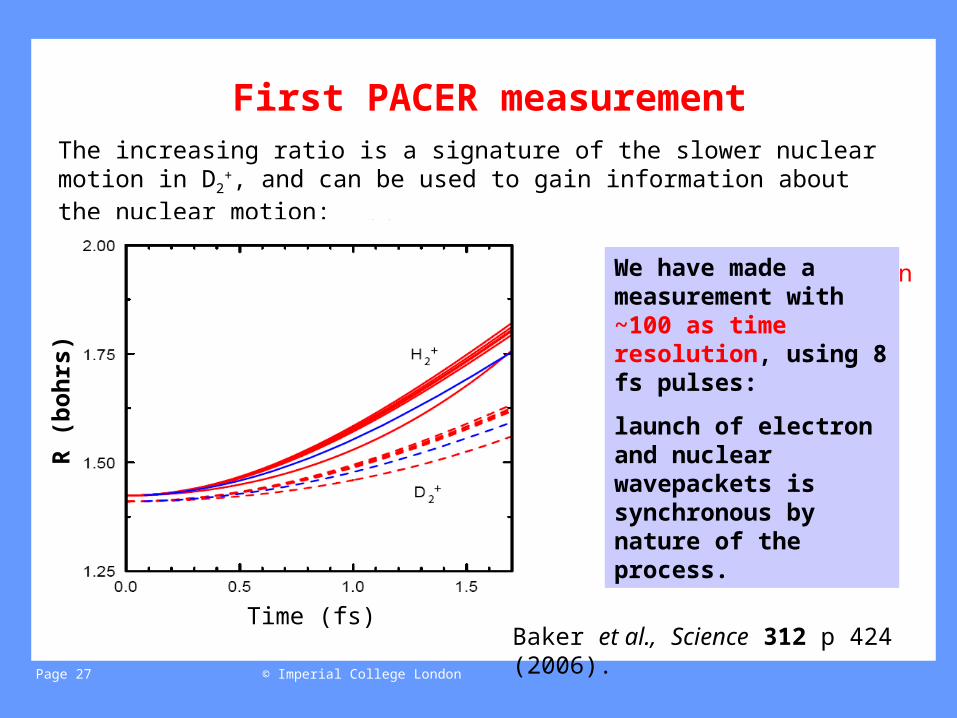
Red: time evolution as reconstructed from harmonic spectra, different runs of genetic algorithm
Blue: time evolution calculated from known BO potential
The increasing ratio is a signature of the slower nuclear motion in D2+, and can
be used to gain information about the nuclear motion:
We have made a measurement with ~100 as time resolution, using 8 fs pulses:
launch of electron and nuclear wavepackets is synchronous by nature of the process.
Baker et al., Science 312 p 424 (2006).
R (
bo
hrs
)
Time (fs)
© Imperial College LondonPage 28
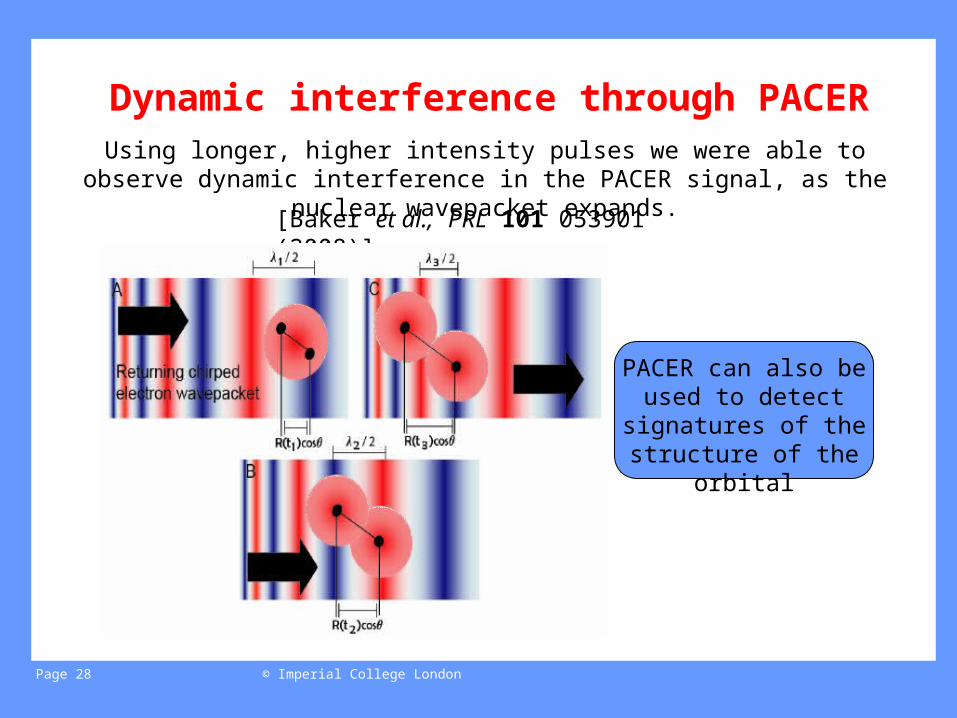
Dynamic interference through PACERUsing longer, higher intensity pulses we were able to observe dynamic interference in the PACER signal, as the nuclear wavepacket expands.
[Baker et al., PRL 101 053901 (2008)].
PACER can also be used to detect
signatures of the structure of the orbital
© Imperial College LondonPage 29
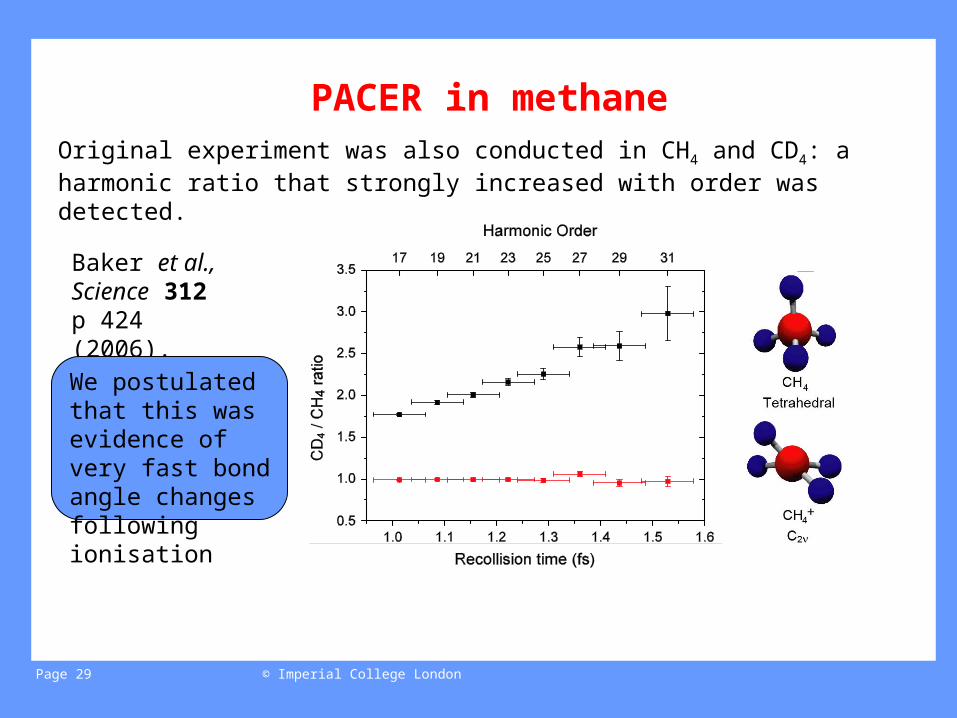
PACER in methaneOriginal experiment was also conducted in CH4 and CD4: a harmonic ratio that strongly increased with order was detected.
Baker et al., Science 312 p 424 (2006).
We postulated that this was evidence of very fast bond angle changes following ionisation
© Imperial College LondonPage 30
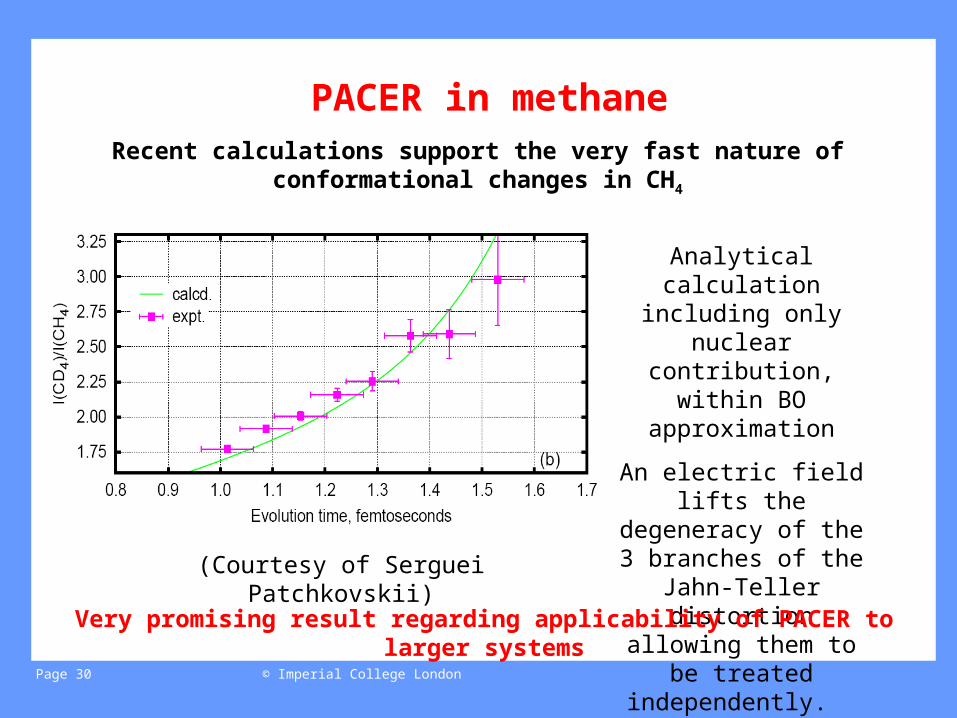
PACER in methaneRecent calculations support the very fast nature of conformational
changes in CH4
(Courtesy of Serguei Patchkovskii)
Analytical calculation including only nuclear contribution, within BO
approximation
An electric field lifts the degeneracy of the 3
branches of the Jahn-Teller distortion allowing
them to be treated independently.
Very promising result regarding applicability of PACER to larger systems
© Imperial College LondonPage 31
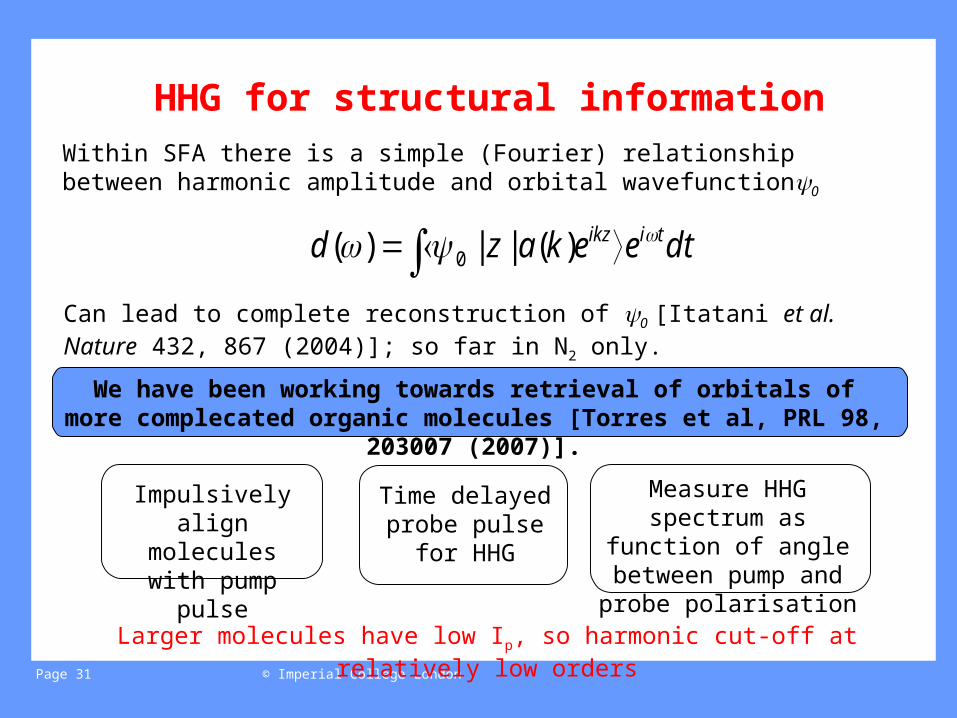
HHG for structural information
Can lead to complete reconstruction of 0 [Itatani et al. Nature 432, 867 (2004)]; so far in N2 only.
dteekazd tiikz )(||)( 0
Within SFA there is a simple (Fourier) relationship between harmonic amplitude and orbital wavefunction0
Larger molecules have low Ip, so harmonic cut-off at relatively low orders
Impulsively align molecules with pump pulse
Time delayed probe pulse for
HHG
Measure HHG spectrum as function of angle between pump and probe polarisation
We have been working towards retrieval of orbitals of more complecated organic molecules [Torres et al, PRL 98, 203007 (2007)].
© Imperial College LondonPage 32
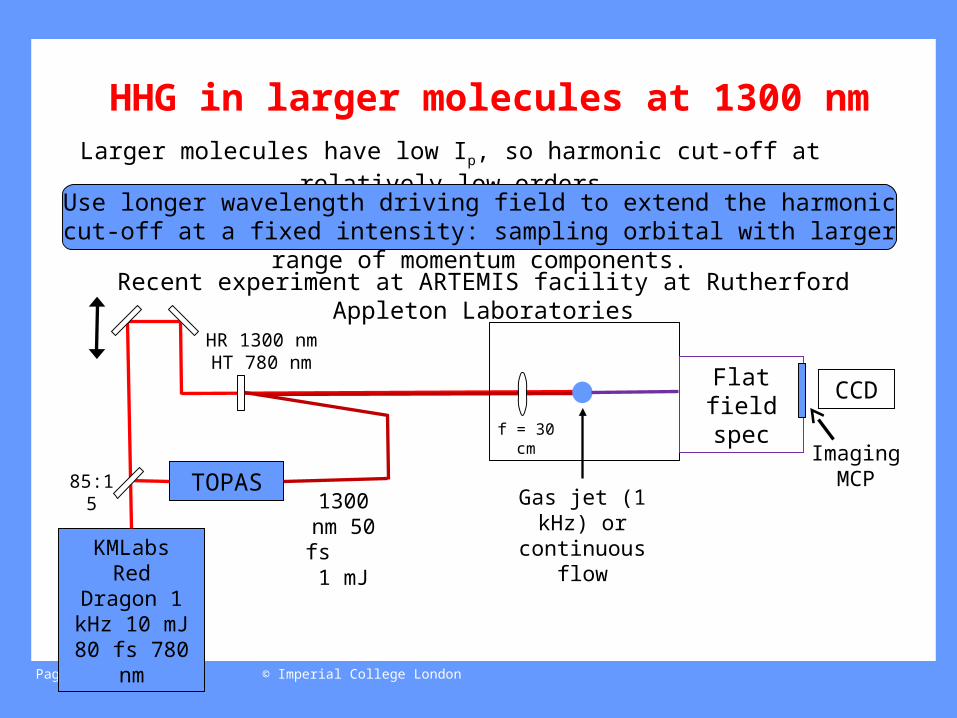
HHG in larger molecules at 1300 nmLarger molecules have low Ip, so harmonic cut-off at relatively low orders
Recent experiment at ARTEMIS facility at Rutherford Appleton Laboratories
Use longer wavelength driving field to extend the harmonic cut-off at a fixed intensity: sampling orbital with larger range of momentum components.
KMLabs Red Dragon 1
kHz 10 mJ 80 fs 780 nm
TOPAS
Flat field spec
CCD
Imaging MCP85:15
1300 nm 50 fs
1 mJ
HR 1300 nm HT 780 nm
f = 30 cm
Gas jet (1 kHz) or continuous
flow
© Imperial College LondonPage 33
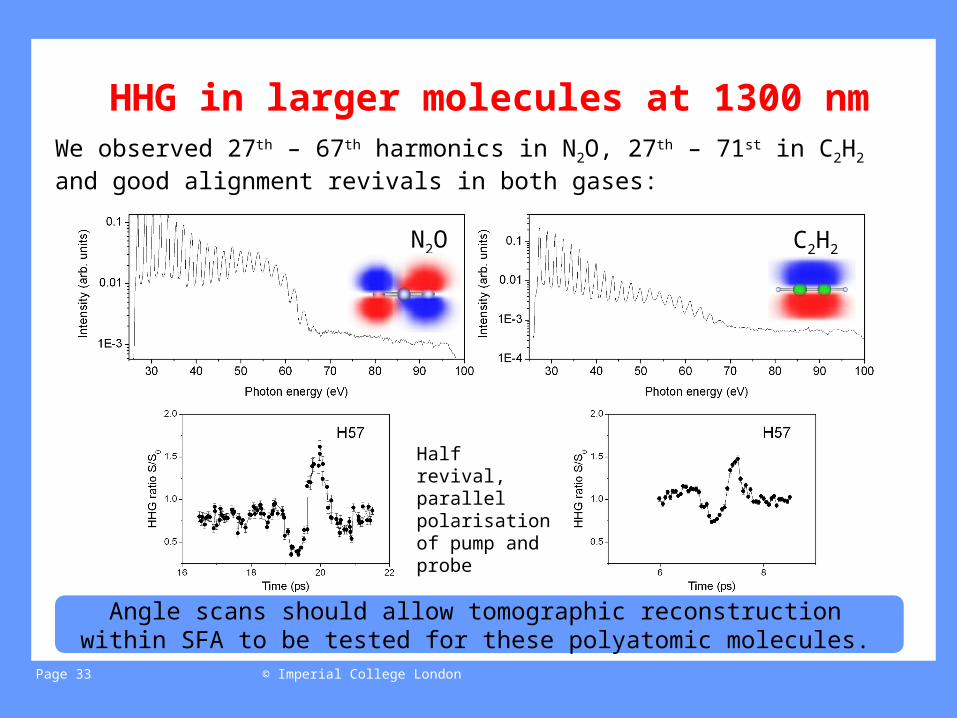
HHG in larger molecules at 1300 nmWe observed 27th – 67th harmonics in N2O, 27th – 71st in C2H2 and good alignment revivals in both gases:
N2O C2H2
Half revival, parallel polarisation of pump and probe
Angle scans should allow tomographic reconstruction within SFA to be tested for these polyatomic molecules.

© Imperial College LondonPage 34
ConclusionsPACER is a promising new technique for probing fast nuclear motion in molecules
Time resolution ~100 as
May be applicable to larger molecules…
We have developed a VMI spectrometer capable of measuring angular and energy distribution of few-hundred eV electrons: useful for obtaining structural information through electron rescattering.
PACER with larger range of molecules: C3H4?
Outlook
PACER with long trajectories: compare retrieved R(t) with that from short trajectories -> any detectable effect of the different field strengths at recombination?
Full analysis of long wavelength HHG experiment to test tomographic reconstruction for polyatomic molecules
Measurement of angular distribution of 200-300 eV electrons in diatomic molecule (N2…)
© Imperial College LondonPage 35
People
Adverts!
Delphine Darios; VMI of high energy electrons
Imma Procino; Retrieval of molecular axis alignment from Coulomb explosion imaging experiments without cylindrical symmetry
Two posters:
PACER work:
Joe Robinson Manfred Lein
Ciprian Chirila
Long wavelength HHG:
Tom Siegel Ricardo Torres
Leonardo Brugnera Imma Procino
Jonathan Underwood
Staff at ARTEMIS facility
E. Springate, I.C. E. Turcu, C. Froud
Jon Marangos John Tisch
Electron VMI:
Delphine Darios Marco Siano David Holland (STFC)