Embed Size (px)
Citation preview
Preparation of Sub Regional Plan for Haryana Sub-Region of NCR-2021: Interim Report -II
Scott Wilson India Page 13-1
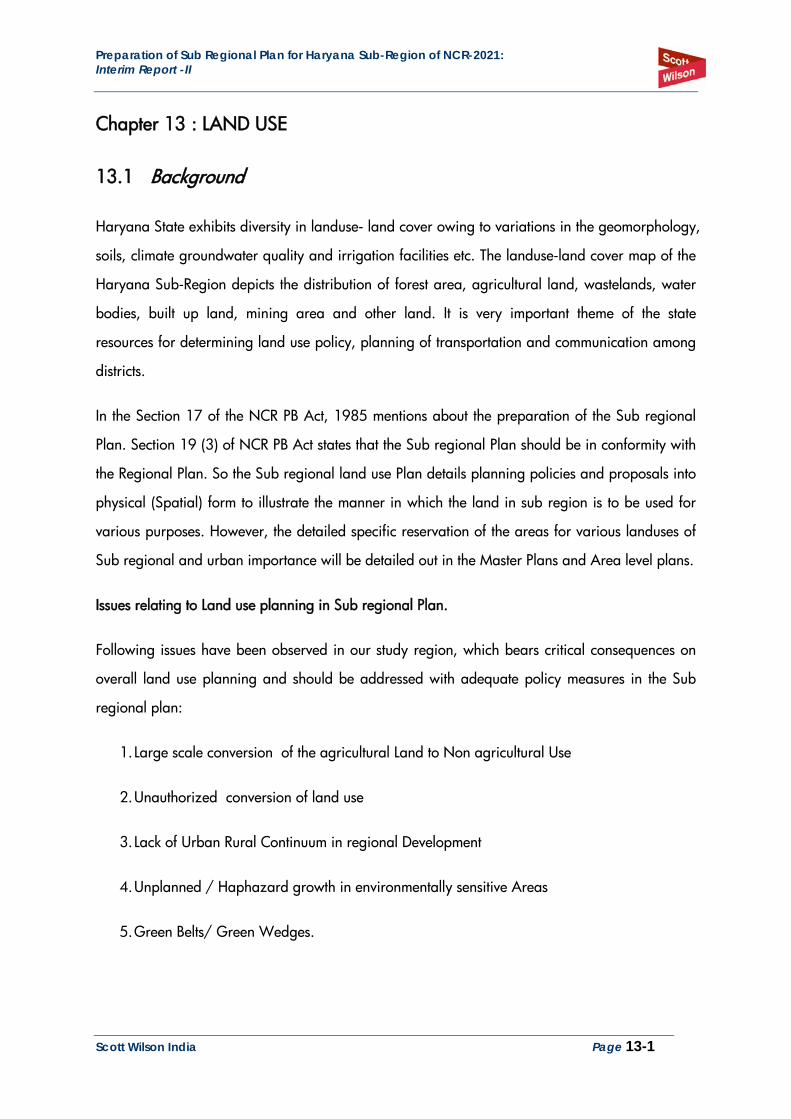
Chapter 13 : LAND USE
13.1 Background
Haryana State exhibits diversity in landuse- land cover owing to variations in the geomorphology,
soils, climate groundwater quality and irrigation facilities etc. The landuse-land cover map of the
Haryana Sub-Region depicts the distribution of forest area, agricultural land, wastelands, water
bodies, built up land, mining area and other land. It is very important theme of the state
resources for determining land use policy, planning of transportation and communication among
districts.
In the Section 17 of the NCR PB Act, 1985 mentions about the preparation of the Sub regional
Plan. Section 19 (3) of NCR PB Act states that the Sub regional Plan should be in conformity with
the Regional Plan. So the Sub regional land use Plan details planning policies and proposals into
physical (Spatial) form to illustrate the manner in which the land in sub region is to be used for
various purposes. However, the detailed specific reservation of the areas for various landuses of
Sub regional and urban importance will be detailed out in the Master Plans and Area level plans.
Issues relating to Land use planning in Sub regional Plan.
Following issues have been observed in our study region, which bears critical consequences on
overall land use planning and should be addressed with adequate policy measures in the Sub
regional plan:
1. Large scale conversion of the agricultural Land to Non agricultural Use
2. Unauthorized conversion of land use
3. Lack of Urban Rural Continuum in regional Development
4. Unplanned / Haphazard growth in environmentally sensitive Areas
5. Green Belts/ Green Wedges.
Preparation of Sub Regional Plan for Haryana Sub-Region of NCR-2021: Interim Report -II
Scott Wilson India Page 13-2
13.2 Land Use Analysis
Haryana Sub region exhibits diversity in the Land use and land cover. This chapter depicts the
distribution of forest area, agricultural land, waste land, water bodies and built –up land. This
chapter is supportive to determine land use policy, planning of transportation and communication
among districts.
13.2.1 Forest
The forests confer manifold ecological benefits on the State economy. They have great bearing on
ground water occurrence, soil erosion, floods and environment. They supply a variety of raw
material to many industries. Forests are source of revenue to the Government and provide
employment to a large number of people. The forests in Haryana are classified under Reserved
Forests, Protected forests, unclassed forests, closed U/S 38 of IFA (Indian Forest Act) and Areas
closed U/S 4 & 5 of LPA (Land Preservation Act). Major reserved and protected forest areas in
Haryana state are mainly confined to the Himalayan ranges in Panchkula and Yamunanagar
districts. Small reserved forests are found at a number of places in the districts of Yamunanagar,
Kaithal, Ambala, Jind and Hissar, Majority of forests in the State belong to subtropical dry
deciduous category whereas subtropical thorny forests are found only in the Aravalli hills in the
southern parts of the State.
Major Forest areas in the region are confined to Aravalli ranges. The Aravalli hills consist of sub
tropical thorny forests. The maximum forest area in the sub region is confined to Sonipat
(7,359.00 Ha.) and followed by Faridabad (5,851.01 Ha.) and Rohtak (4,594.05 Ha.). The least
forest area is confined to Gurgaon (2,381.55 Ha.) under Jhajjar (3,902.38 Ha.) and Mewat
(4,073.87 Ha.)
Hence in the NCR part of Haryana Sub-Region, it is having very little forest cover which is mainly
confined to Gurgaon, Rewari and Mewat district. Few patches of forest are also in Rohtak,
Jhajjar and Sonipat.
Preparation of Sub Regional Plan for Haryana Sub-Region of NCR-2021: Interim Report -II
Scott Wilson India Page 13-3
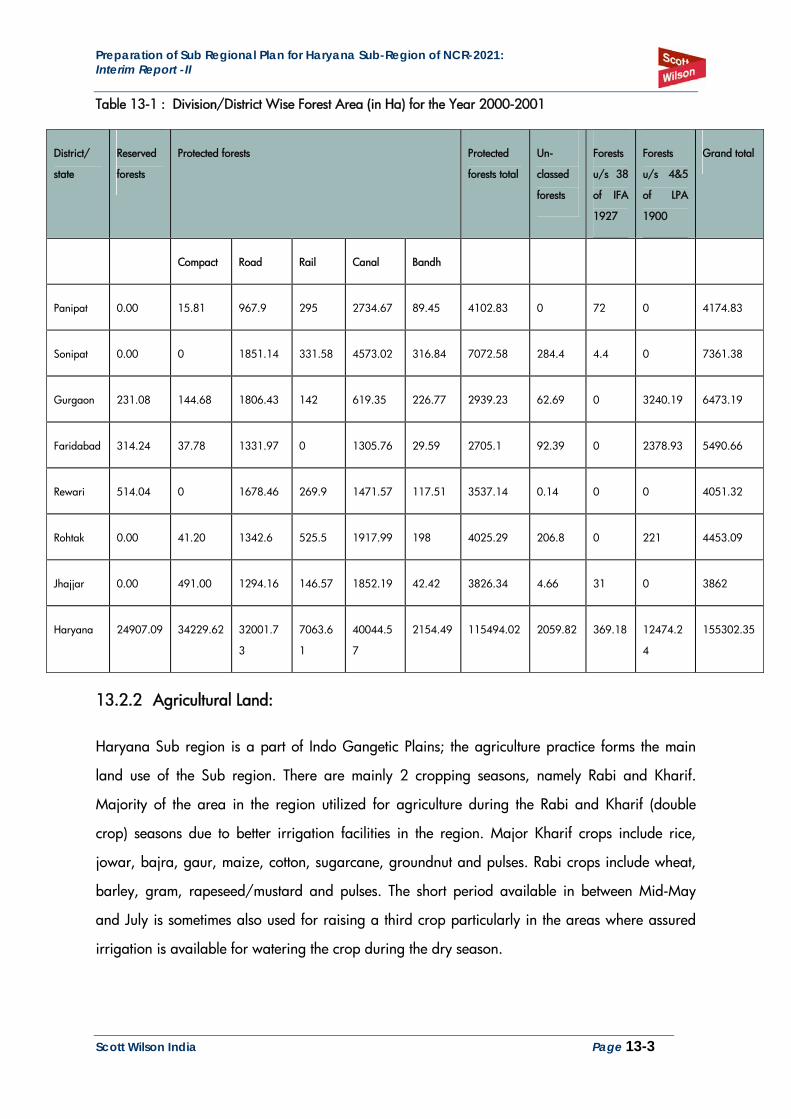
Table 13-1 : Division/District Wise Forest Area (in Ha) for the Year 2000-2001
District/
state
Reserved
forests
Protected forests Protected
forests total
Un-
classed
forests
Forests
u/s 38
of IFA
1927
Forests
u/s 4&5
of LPA
1900
Grand total
Compact Road Rail Canal Bandh
Panipat 0.00 15.81 967.9 295 2734.67 89.45 4102.83 0 72 0 4174.83
Sonipat 0.00 0 1851.14 331.58 4573.02 316.84 7072.58 284.4 4.4 0 7361.38
Gurgaon 231.08 144.68 1806.43 142 619.35 226.77 2939.23 62.69 0 3240.19 6473.19
Faridabad 314.24 37.78 1331.97 0 1305.76 29.59 2705.1 92.39 0 2378.93 5490.66
Rewari 514.04 0 1678.46 269.9 1471.57 117.51 3537.14 0.14 0 0 4051.32
Rohtak 0.00 41.20 1342.6 525.5 1917.99 198 4025.29 206.8 0 221 4453.09
Jhajjar 0.00 491.00 1294.16 146.57 1852.19 42.42 3826.34 4.66 31 0 3862
Haryana 24907.09 34229.62 32001.7
3
7063.6
1
40044.5
7
2154.49 115494.02 2059.82 369.18 12474.2
4
155302.35
13.2.2 Agricultural Land:
Haryana Sub region is a part of Indo Gangetic Plains; the agriculture practice forms the main
land use of the Sub region. There are mainly 2 cropping seasons, namely Rabi and Kharif.
Majority of the area in the region utilized for agriculture during the Rabi and Kharif (double
crop) seasons due to better irrigation facilities in the region. Major Kharif crops include rice,
jowar, bajra, gaur, maize, cotton, sugarcane, groundnut and pulses. Rabi crops include wheat,
barley, gram, rapeseed/mustard and pulses. The short period available in between Mid-May
and July is sometimes also used for raising a third crop particularly in the areas where assured
irrigation is available for watering the crop during the dry season.
Preparation of Sub Regional Plan for Haryana Sub-Region of NCR-2021: Interim Report -II
Scott Wilson India Page 13-4
Haryana Sub-Region being a part of fertile Indo-Gangetic Plains, the agriculture practice forms
the main landuse of the region. There are two main cropping seasons, namely Kharif and Rabi.
Majority of the area is utilized for agriculture during Rabi and Kharif (double crop) season due to
better irrigation facilities in the region; major kharif crops include rice, jowar, bajra, gaur, maize,
cotton, sugarcane, groundnut and pulses. Rabi crops include wheat, barley, gram
rapeseed/mustard and pulses. The short period available between mid-May and July is
sometimes also used for raising a third crop particularly in the areas where assured irrigation is
available for watering the crop during the dry season.
Northern portion of the region is characterized by good agricultural area due to fertile alluvial
soils, marginal to food quality of ground water, network of irrigation, canals, tube wells and
relatively better natural drainage. On the contrary southern part like Gurgaon and Rewari, due to
lack of rainfall, poor irrigation facilities, poor Ground water quality coupled with desertic terrain
with and dunes, result in relatively less cultivation during Kharif season.
Preparation of Sub Regional Plan for Haryana Sub-Region of NCR-2021: Interim Report -II
Scott Wilson India Page 13-5
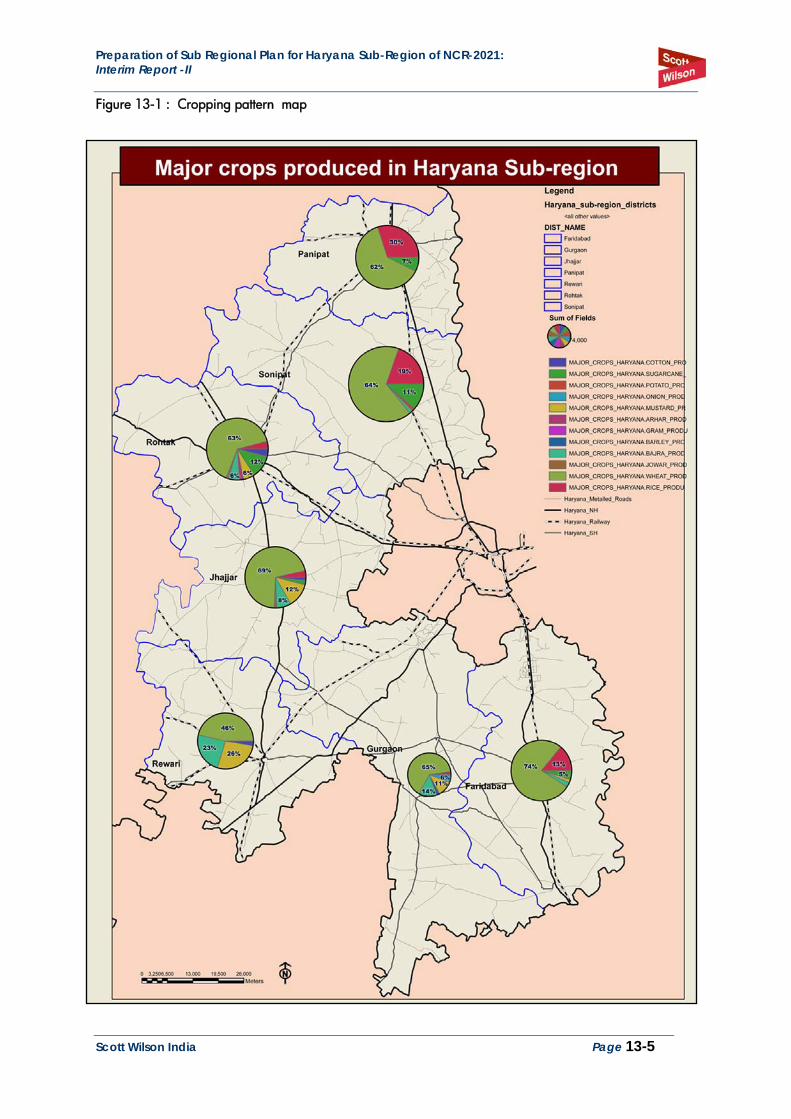
Figure 13-1 : Cropping pattern map
Preparation of Sub Regional Plan for Haryana Sub-Region of NCR-2021: Interim Report -II
Scott Wilson India Page 13-6
In the whole sub-region wheat is the dominant crop. In the district of Panipat, Sonepat and
Faridabad rice is also produced. Rewari is the region where after wheat, mustered and bajara is
produced significantly.
13.2.3 Land utilization
The region is having maximum percentage of net shown area and lack in forest land. Land not
available for cultivation is also in significant percentage. Only in the districts of Sonepat, Panipat ,
Jhajjar , Mewat and Faridabad there are fallow land.
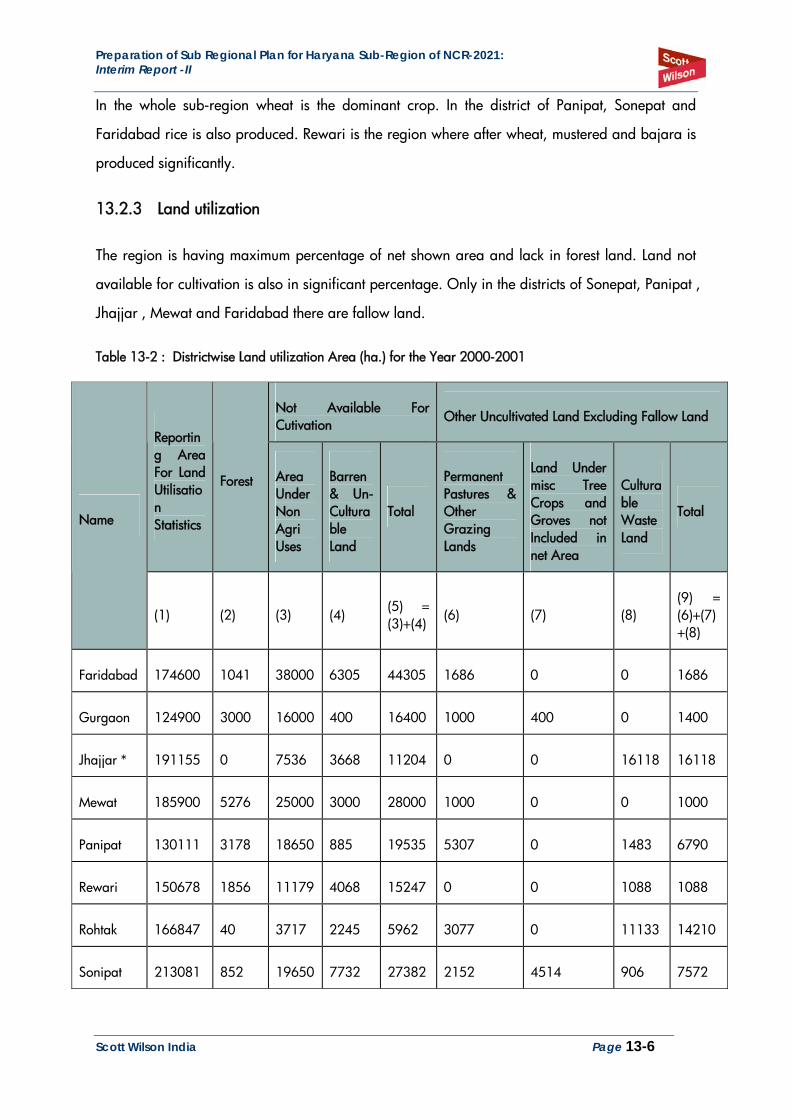
Table 13-2 : Districtwise Land utilization Area (ha.) for the Year 2000-2001
Not Available For Cutivation Other Uncultivated Land Excluding Fallow Land
Reporting Area For Land Utilisation Statistics
Forest Area Under Non Agri Uses
Barren & Un-Culturable Land
Total
Permanent Pastures & Other Grazing Lands
Land Under misc Tree Crops and Groves not Included in net Area
Culturable Waste Land
Total Name
(1) (2) (3) (4) (5) = (3)+(4)
(6) (7) (8) (9) = (6)+(7)+(8)
Faridabad 174600 1041 38000 6305 44305 1686 0 0 1686
Gurgaon 124900 3000 16000 400 16400 1000 400 0 1400
Jhajjar * 191155 0 7536 3668 11204 0 0 16118 16118
Mewat 185900 5276 25000 3000 28000 1000 0 0 1000
Panipat 130111 3178 18650 885 19535 5307 0 1483 6790
Rewari 150678 1856 11179 4068 15247 0 0 1088 1088
Rohtak 166847 40 3717 2245 5962 3077 0 11133 14210
Sonipat 213081 852 19650 7732 27382 2152 4514 906 7572
Preparation of Sub Regional Plan for Haryana Sub-Region of NCR-2021: Interim Report -II
Scott Wilson India Page 13-7
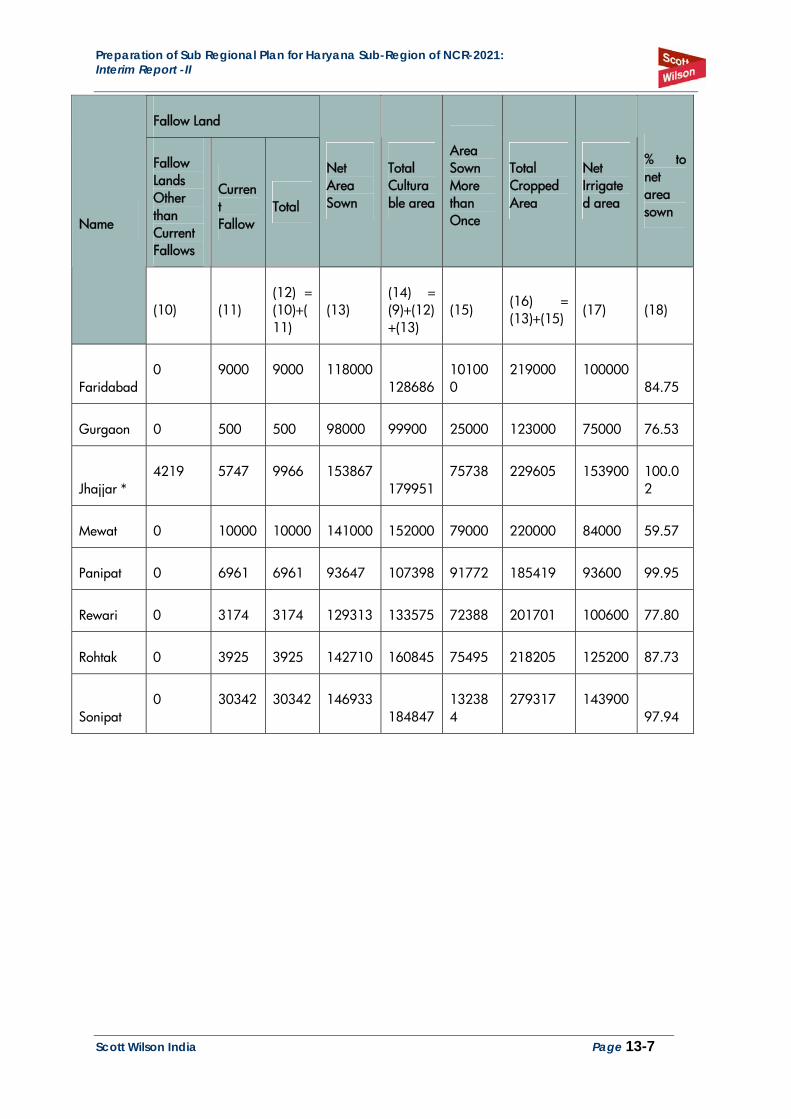
Fallow Land
Fallow Lands Other than Current Fallows
Current Fallow
Total
Net Area Sown
Total Culturable area
Area Sown More than Once
Total Cropped Area
Net Irrigated area
% to net area sown
Name
(10) (11) (12) = (10)+(11)
(13) (14) = (9)+(12)+(13)
(15) (16) = (13)+(15) (17) (18)
Faridabad 0 9000 9000 118000
128686 101000
219000 100000 84.75
Gurgaon 0 500 500 98000 99900 25000 123000 75000 76.53
Jhajjar * 4219 5747 9966 153867
179951 75738 229605 153900 100.0
2
Mewat 0 10000 10000 141000 152000 79000 220000 84000 59.57
Panipat 0 6961 6961 93647 107398 91772 185419 93600 99.95
Rewari 0 3174 3174 129313 133575 72388 201701 100600 77.80
Rohtak 0 3925 3925 142710 160845 75495 218205 125200 87.73
Sonipat 0 30342 30342 146933
184847 132384
279317 143900 97.94
Preparation of Sub Regional Plan for Haryana Sub-Region of NCR-2021: Interim Report -II
Scott Wilson India Page 13-8
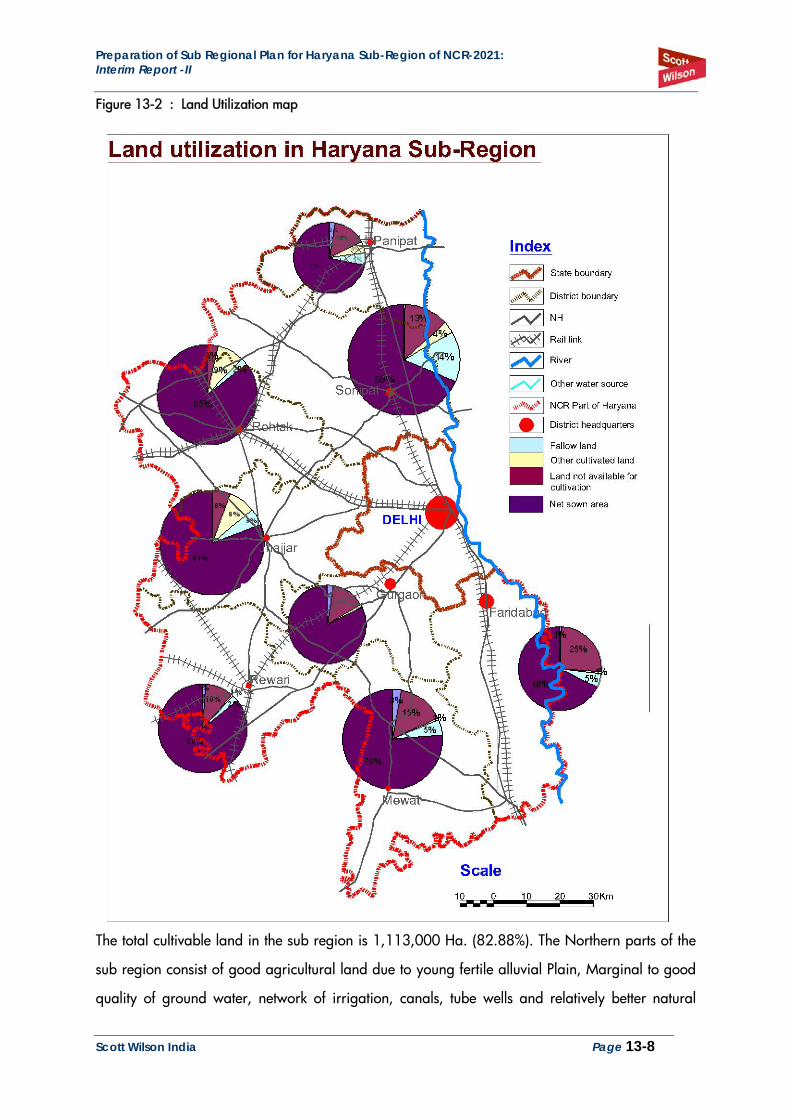
Figure 13-2 : Land Utilization map
The total cultivable land in the sub region is 1,113,000 Ha. (82.88%). The Northern parts of the
sub region consist of good agricultural land due to young fertile alluvial Plain, Marginal to good
quality of ground water, network of irrigation, canals, tube wells and relatively better natural
Preparation of Sub Regional Plan for Haryana Sub-Region of NCR-2021: Interim Report -II
Scott Wilson India Page 13-9
drainage. Whereas on contrary the south west districts of the sub region i.e. Gurgaon and
Rewari , due to lack of rainfall, poor irrigation facilities, poor ground water quality coupled with
desertic terrine with sand dunes, results in relatively less cultivation during Kharif season.
13.2.4 Wastelands:
The major wasteland in the sub region are identified as
a) Gullied/ Ravenous land Shallow
b) Gullied/ Ravenous land Medium
c) Land with Scrubs
d) Land without Scrubs
e) Permanently water logged and Marshy Land
f) Seasonal water logged and Marshy Land
g) Land (Strongly) affected by salinity /Alkalinity
h) Land (Moderately) affected by salinity /Alkalinity
i) Land (Slightly) affected by salinity /Alkalinity
j) Sands (Flood Plain)
k) Sand Dunes (Semi stable to stab. Low<15m)
l) Sand Dunes (Closely spaced inter dune area)
m) Barren Rocky/ Stone Waste/ Sheet Rock Area
The majority of salt affected lands are associated with waterlogged areas. The area under
wasteland in the sub region is 86,993.00 Ha. (6.48%). In Sub region they are spread over the
parts in districts of Panipat, Sonipat, Rohtak, Jhajjar and Gurgaon.
Preparation of Sub Regional Plan for Haryana Sub-Region of NCR-2021: Interim Report -II
Scott Wilson India Page 13-10
13.2.5 Built-up:
The land constituting 3 types of settlement in the state namely high Dense, Medium Dense and
Spare Dense areas. The high dense areas are generally limited to major towns and cities of
Gurgaon, Mewat, Rewari, Faridabad, Panipat, Sonipat, Rohtak and Jhajjar. Medium dense are
generally lies in the proximity of the high dense areas, whereas Spare dense areas include low
density settlements such as villages. The areas such as Bahadurgarh, Gurgaon and Panipat are
emerged as major Residential-industrial towns because of the proximity to Delhi. The Built-up
percentage in the Sub region is 7.01%. within last decades it is observed that the medium dense
settlements grows rapidly within the proximity of the high dense settlements.
13.2.6 Water Bodies:
In Sub region the water bodies include Yamuna River, Lakes and Ponds. Yamuna River originates
from Yamunotri Glacier in higher Himalayan ranges in Gharwal. Numbers of Lakes are also
dappled in the Sub region; some of the famous lakes in the region are Sohna Lake (hot water
Springs), Gurgaon, Kotladhar Lake, Mewat, Jahajgarh Lake, Jhajjar and Badkhal Lake,
Faridabad. There are several numbers of Ponds in the Haryana sub region.
13.2.7 Others:
The other land consists of the lands under Mining use and Industrial affluent discharge lands.
Existing Sub Regional Land Use
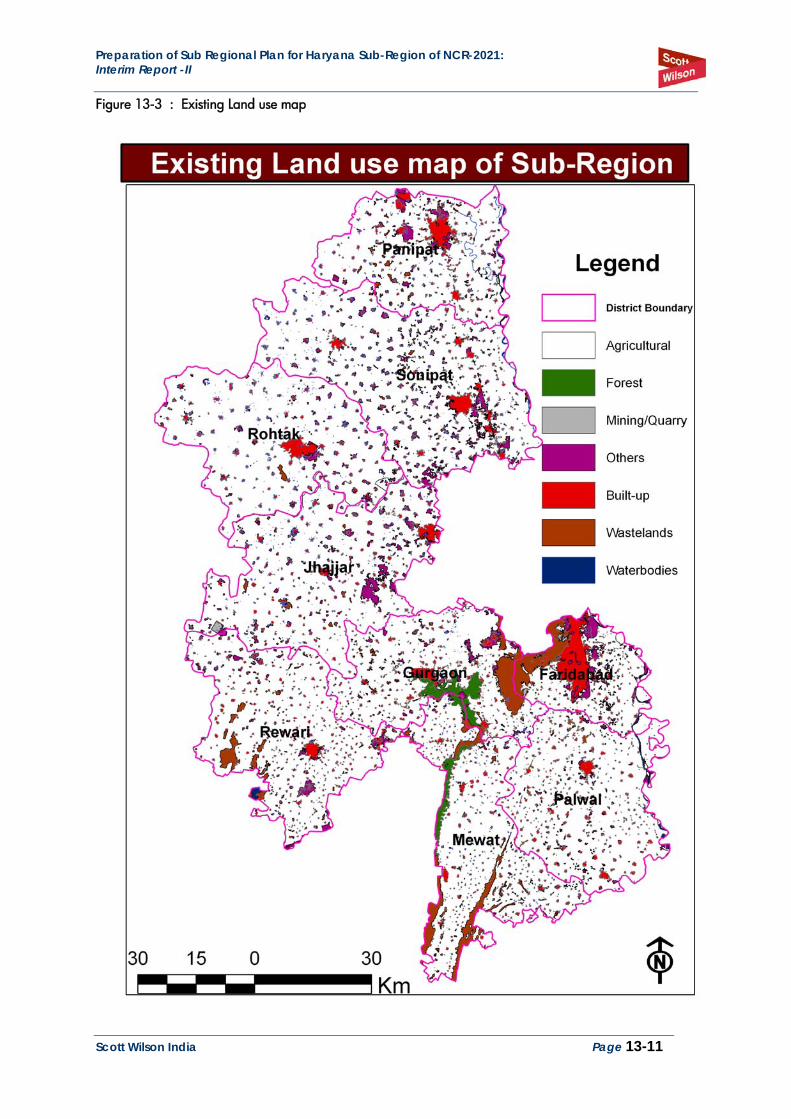
The Existing Land Use for the sub region is prepared by various authenticated sources such as
Statistical Handbook 2006-07, Wasteland atlas, Data from various government departments, GIS,
Survey of India Topo Sheets, etc.
Preparation of Sub Regional Plan for Haryana Sub-Region of NCR-2021: Interim Report -II
Scott Wilson India Page 13-11
Figure 13-3 : Existing Land use map
Preparation of Sub Regional Plan for Haryana Sub-Region of NCR-2021: Interim Report -II
Scott Wilson India Page 13-12
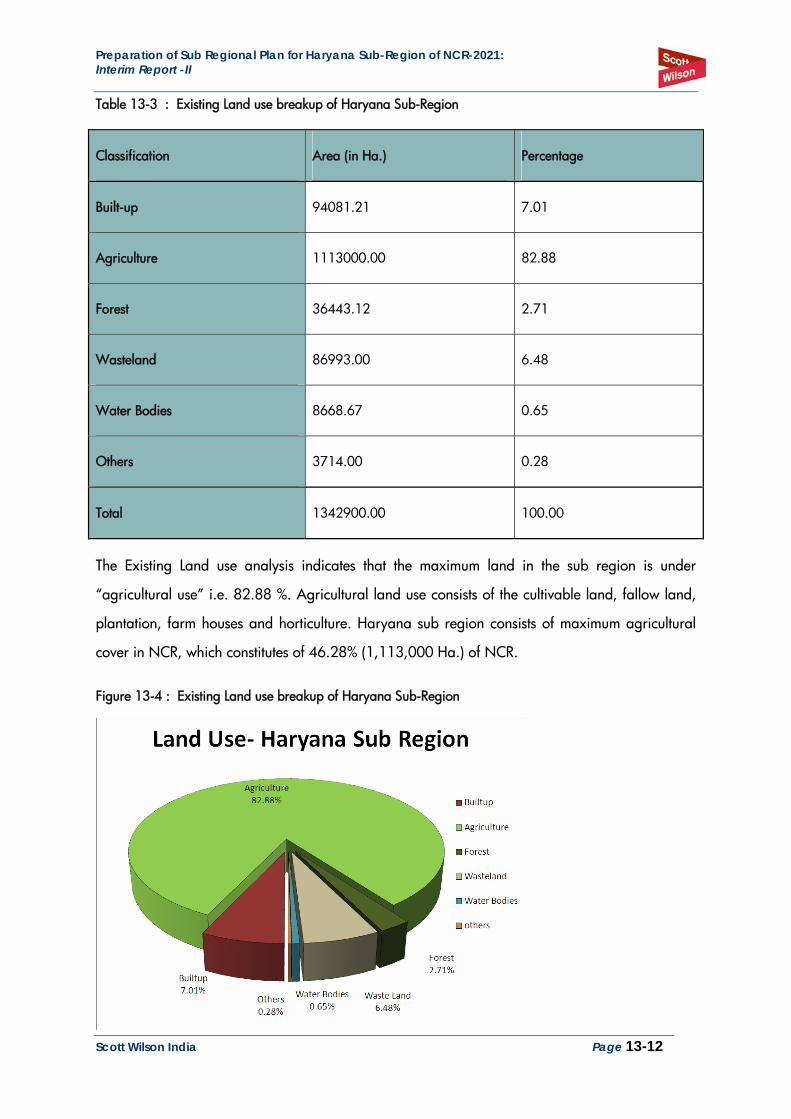
Table 13-3 : Existing Land use breakup of Haryana Sub-Region
Classification Area (in Ha.) Percentage
Built-up 94081.21 7.01
Agriculture 1113000.00 82.88
Forest 36443.12 2.71
Wasteland 86993.00 6.48
Water Bodies 8668.67 0.65
Others 3714.00 0.28
Total 1342900.00 100.00
The Existing Land use analysis indicates that the maximum land in the sub region is under
“agricultural use” i.e. 82.88 %. Agricultural land use consists of the cultivable land, fallow land,
plantation, farm houses and horticulture. Haryana sub region consists of maximum agricultural
cover in NCR, which constitutes of 46.28% (1,113,000 Ha.) of NCR.
Figure 13-4 : Existing Land use breakup of Haryana Sub-Region
Preparation of Sub Regional Plan for Haryana Sub-Region of NCR-2021: Interim Report -II
Scott Wilson India Page 13-13
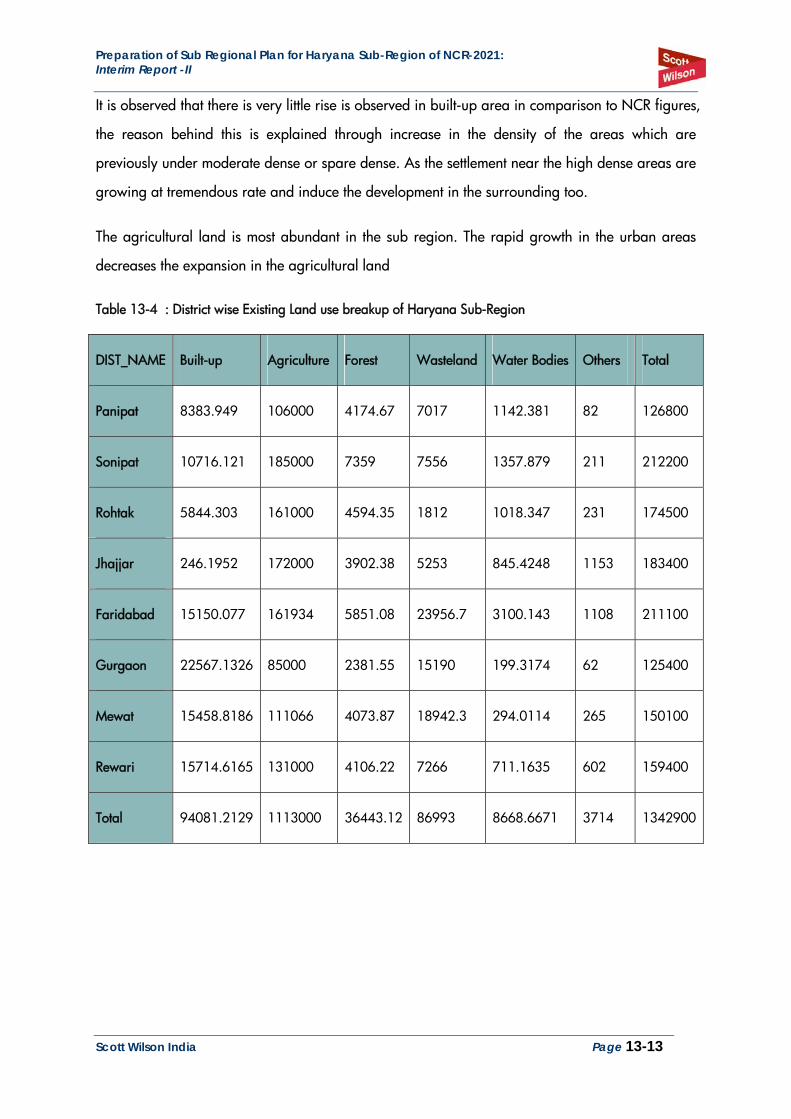
It is observed that there is very little rise is observed in built-up area in comparison to NCR figures,
the reason behind this is explained through increase in the density of the areas which are
previously under moderate dense or spare dense. As the settlement near the high dense areas are
growing at tremendous rate and induce the development in the surrounding too.
The agricultural land is most abundant in the sub region. The rapid growth in the urban areas
decreases the expansion in the agricultural land
Table 13-4 : District wise Existing Land use breakup of Haryana Sub-Region
DIST_NAME Built-up Agriculture Forest Wasteland Water Bodies Others Total
Panipat 8383.949 106000 4174.67 7017 1142.381 82 126800
Sonipat 10716.121 185000 7359 7556 1357.879 211 212200
Rohtak 5844.303 161000 4594.35 1812 1018.347 231 174500
Jhajjar 246.1952 172000 3902.38 5253 845.4248 1153 183400
Faridabad 15150.077 161934 5851.08 23956.7 3100.143 1108 211100
Gurgaon 22567.1326 85000 2381.55 15190 199.3174 62 125400
Mewat 15458.8186 111066 4073.87 18942.3 294.0114 265 150100
Rewari 15714.6165 131000 4106.22 7266 711.1635 602 159400
Total 94081.2129 1113000 36443.12 86993 8668.6671 3714 1342900
Preparation of Sub Regional Plan for Haryana Sub-Region of NCR-2021: Interim Report -II
Scott Wilson India Page 13-14
13.3 District wise Land use distribution
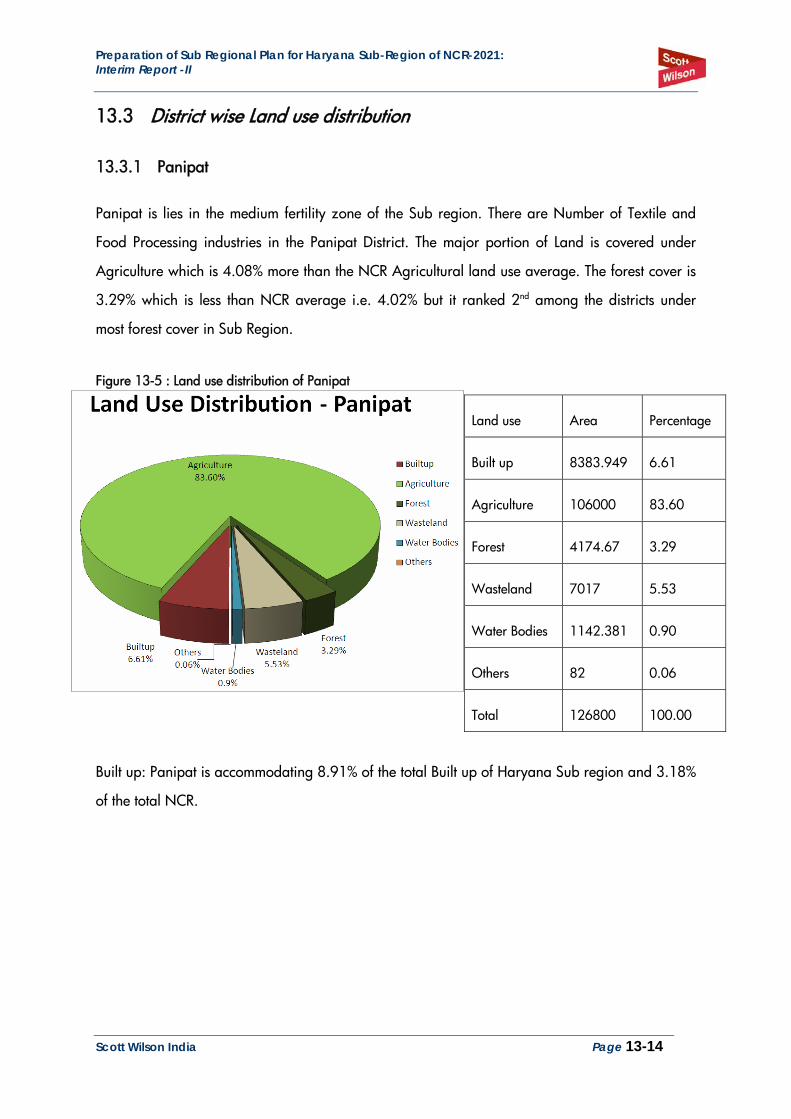
13.3.1 Panipat
Panipat is lies in the medium fertility zone of the Sub region. There are Number of Textile and
Food Processing industries in the Panipat District. The major portion of Land is covered under
Agriculture which is 4.08% more than the NCR Agricultural land use average. The forest cover is
3.29% which is less than NCR average i.e. 4.02% but it ranked 2nd among the districts under
most forest cover in Sub Region.
Figure 13-5 : Land use distribution of Panipat
Built up: Panipat is accommodating 8.91% of the total Built up of Haryana Sub region and 3.18%
of the total NCR.
Land use Area Percentage
Built up 8383.949 6.61
Agriculture 106000 83.60
Forest 4174.67 3.29
Wasteland 7017 5.53
Water Bodies 1142.381 0.90
Others 82 0.06
Total 126800 100.00
Preparation of Sub Regional Plan for Haryana Sub-Region of NCR-2021: Interim Report -II
Scott Wilson India Page 13-15
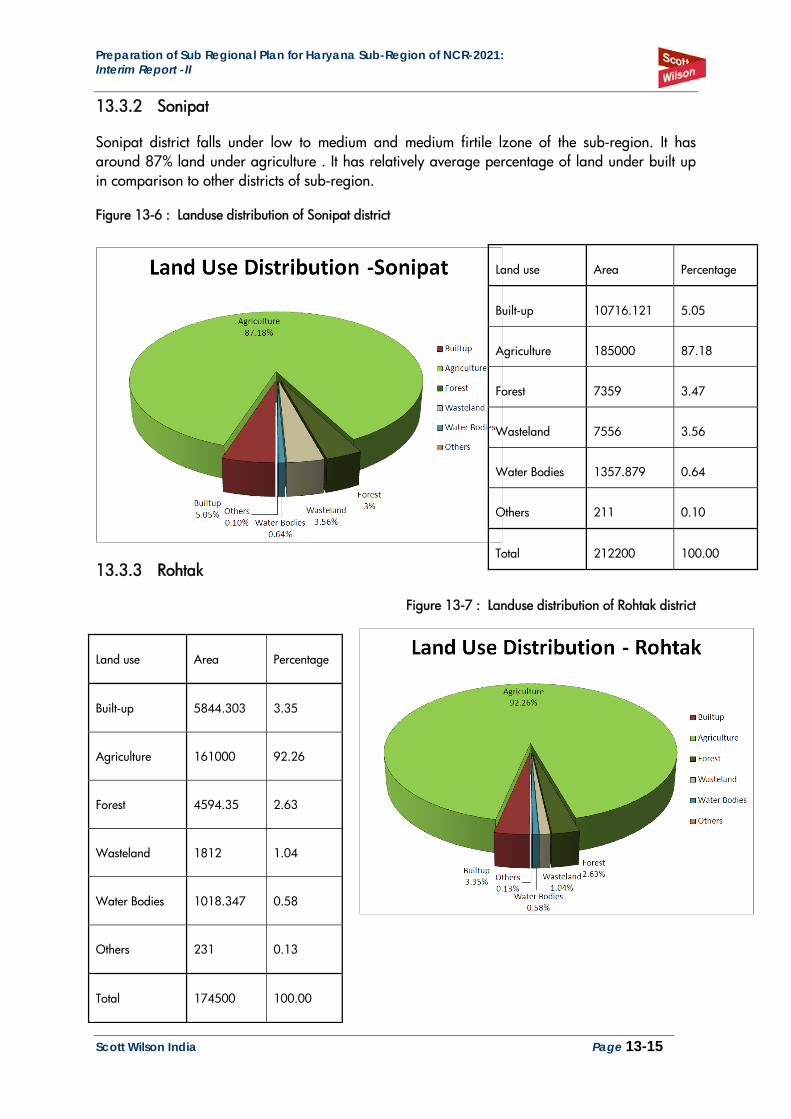
13.3.2 Sonipat
Sonipat district falls under low to medium and medium firtile lzone of the sub-region. It has around 87% land under agriculture . It has relatively average percentage of land under built up in comparison to other districts of sub-region.
Figure 13-6 : Landuse distribution of Sonipat district
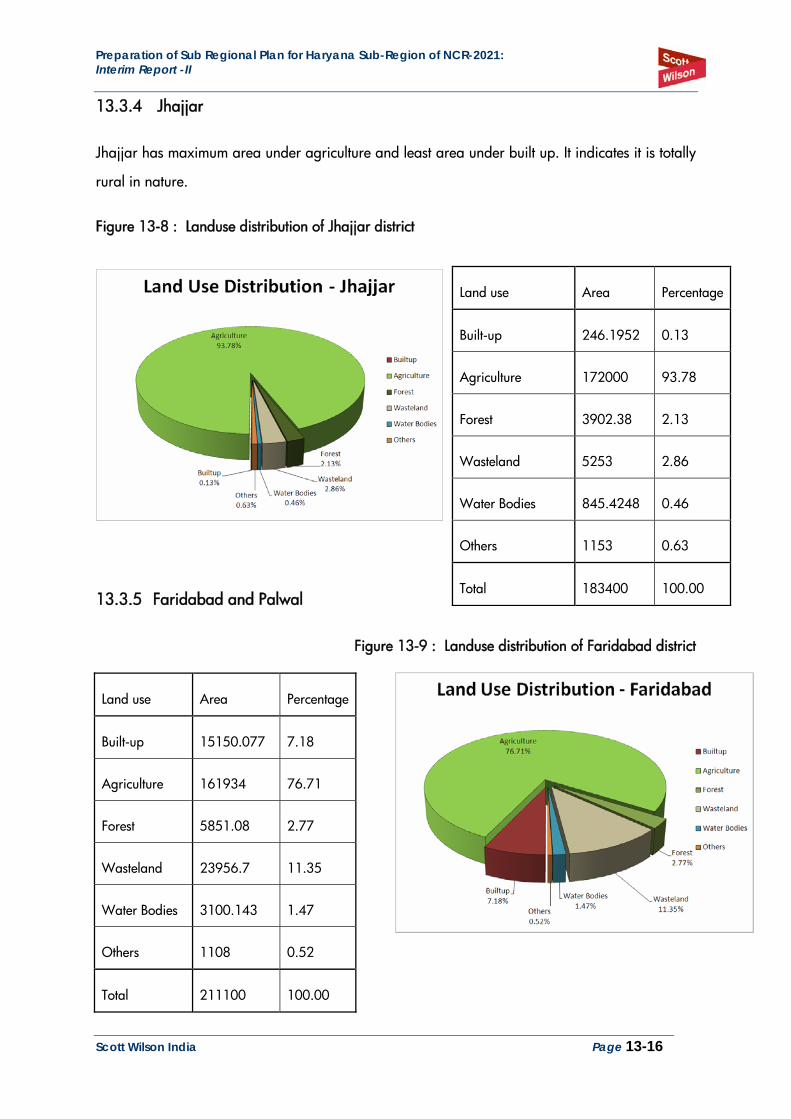
13.3.3 Rohtak
Figure 13-7 : Landuse distribution of Rohtak district
Land use Area Percentage
Built-up 10716.121 5.05
Agriculture 185000 87.18
Forest 7359 3.47
Wasteland 7556 3.56
Water Bodies 1357.879 0.64
Others 211 0.10
Total 212200 100.00
Land use Area Percentage
Built-up 5844.303 3.35
Agriculture 161000 92.26
Forest 4594.35 2.63
Wasteland 1812 1.04
Water Bodies 1018.347 0.58
Others 231 0.13
Total 174500 100.00
Preparation of Sub Regional Plan for Haryana Sub-Region of NCR-2021: Interim Report -II
Scott Wilson India Page 13-16
13.3.4 Jhajjar
Jhajjar has maximum area under agriculture and least area under built up. It indicates it is totally
rural in nature.
Figure 13-8 : Landuse distribution of Jhajjar district
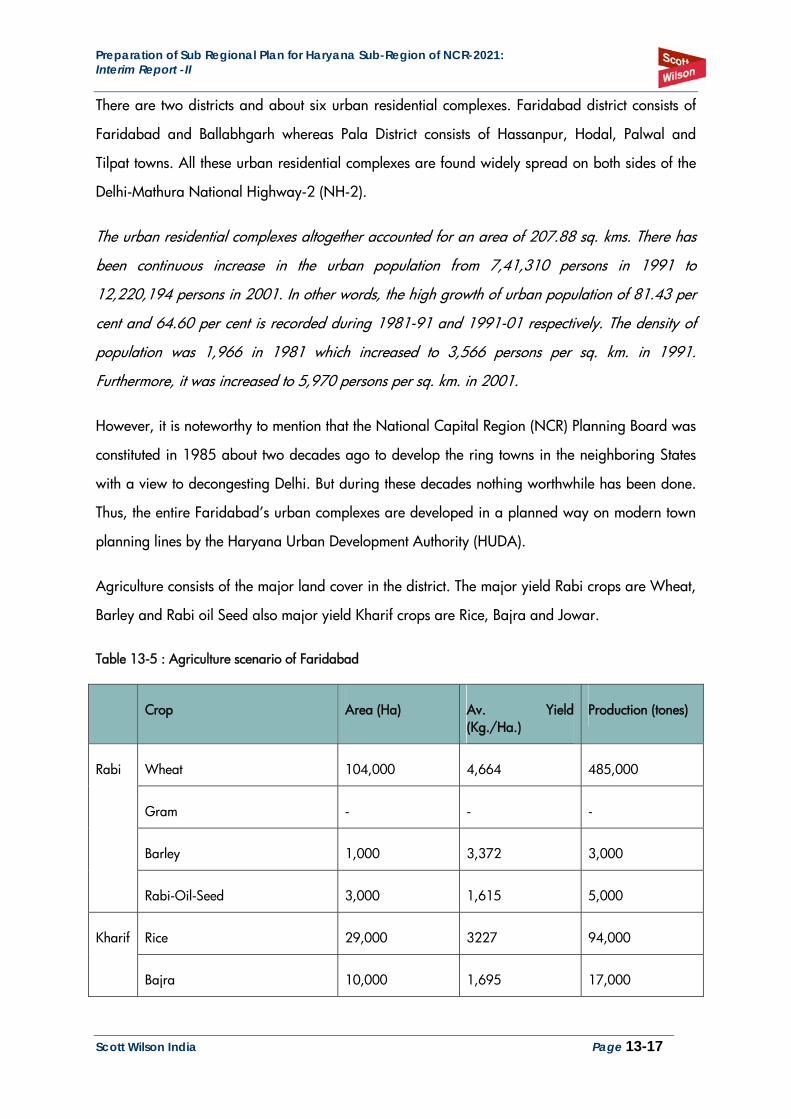
13.3.5 Faridabad and Palwal
Figure 13-9 : Landuse distribution of Faridabad district
Land use Area Percentage
Built-up 15150.077 7.18
Agriculture 161934 76.71
Forest 5851.08 2.77
Wasteland 23956.7 11.35
Water Bodies 3100.143 1.47
Others 1108 0.52
Total 211100 100.00
Land use Area Percentage
Built-up 246.1952 0.13
Agriculture 172000 93.78
Forest 3902.38 2.13
Wasteland 5253 2.86
Water Bodies 845.4248 0.46
Others 1153 0.63
Total 183400 100.00
Preparation of Sub Regional Plan for Haryana Sub-Region of NCR-2021: Interim Report -II
Scott Wilson India Page 13-17
There are two districts and about six urban residential complexes. Faridabad district consists of
Faridabad and Ballabhgarh whereas Pala District consists of Hassanpur, Hodal, Palwal and
Tilpat towns. All these urban residential complexes are found widely spread on both sides of the
Delhi-Mathura National Highway-2 (NH-2).
The urban residential complexes altogether accounted for an area of 207.88 sq. kms. There has
been continuous increase in the urban population from 7,41,310 persons in 1991 to
12,220,194 persons in 2001. In other words, the high growth of urban population of 81.43 per
cent and 64.60 per cent is recorded during 1981-91 and 1991-01 respectively. The density of
population was 1,966 in 1981 which increased to 3,566 persons per sq. km. in 1991.
Furthermore, it was increased to 5,970 persons per sq. km. in 2001.
However, it is noteworthy to mention that the National Capital Region (NCR) Planning Board was
constituted in 1985 about two decades ago to develop the ring towns in the neighboring States
with a view to decongesting Delhi. But during these decades nothing worthwhile has been done.
Thus, the entire Faridabad’s urban complexes are developed in a planned way on modern town
planning lines by the Haryana Urban Development Authority (HUDA).
Agriculture consists of the major land cover in the district. The major yield Rabi crops are Wheat,
Barley and Rabi oil Seed also major yield Kharif crops are Rice, Bajra and Jowar.
Table 13-5 : Agriculture scenario of Faridabad
Crop Area (Ha) Av. Yield (Kg./Ha.)
Production (tones)
Wheat 104,000 4,664 485,000
Gram - - -
Barley 1,000 3,372 3,000
Rabi
Rabi-Oil-Seed 3,000 1,615 5,000
Rice 29,000 3227 94,000 Kharif
Bajra 10,000 1,695 17,000
Preparation of Sub Regional Plan for Haryana Sub-Region of NCR-2021: Interim Report -II
Scott Wilson India Page 13-18
Maize - - -
Jowar 10,000 450 5,000
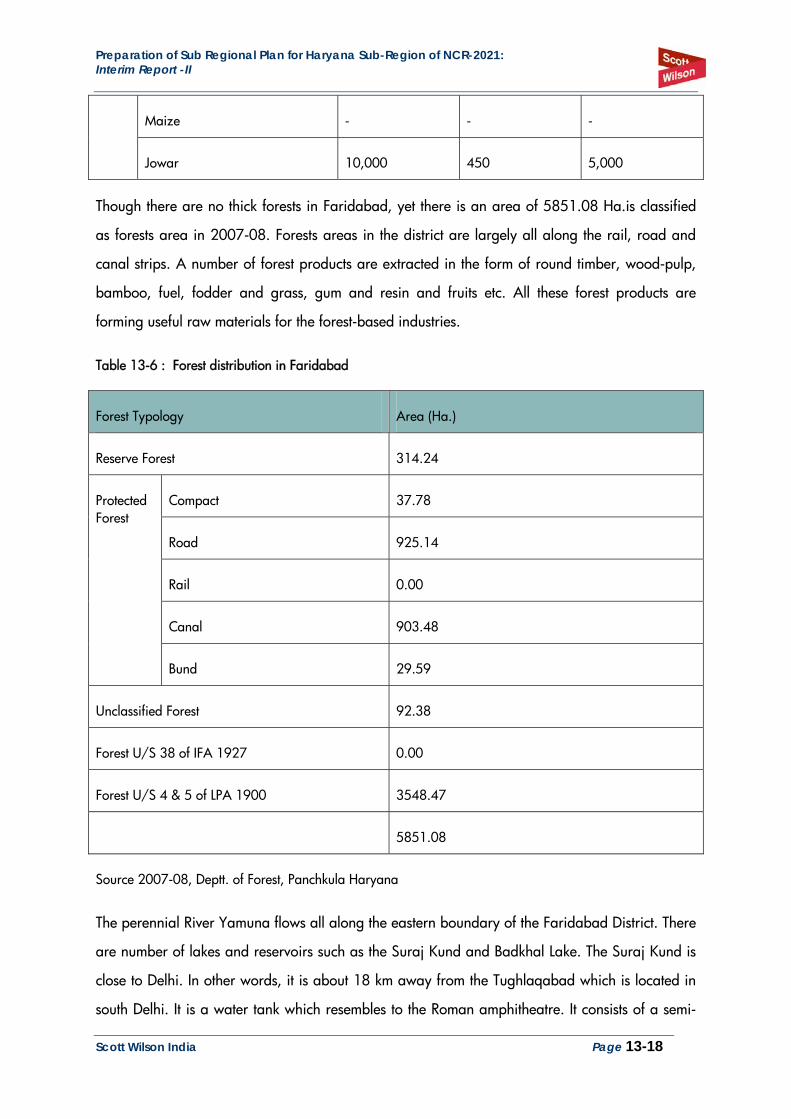
Though there are no thick forests in Faridabad, yet there is an area of 5851.08 Ha.is classified
as forests area in 2007-08. Forests areas in the district are largely all along the rail, road and
canal strips. A number of forest products are extracted in the form of round timber, wood-pulp,
bamboo, fuel, fodder and grass, gum and resin and fruits etc. All these forest products are
forming useful raw materials for the forest-based industries.
Table 13-6 : Forest distribution in Faridabad
Forest Typology Area (Ha.)
Reserve Forest 314.24
Compact 37.78
Road 925.14
Rail 0.00
Canal 903.48
Protected Forest
Bund 29.59
Unclassified Forest 92.38
Forest U/S 38 of IFA 1927 0.00
Forest U/S 4 & 5 of LPA 1900 3548.47
5851.08
Source 2007-08, Deptt. of Forest, Panchkula Haryana
The perennial River Yamuna flows all along the eastern boundary of the Faridabad District. There
are number of lakes and reservoirs such as the Suraj Kund and Badkhal Lake. The Suraj Kund is
close to Delhi. In other words, it is about 18 km away from the Tughlaqabad which is located in
south Delhi. It is a water tank which resembles to the Roman amphitheatre. It consists of a semi-
Preparation of Sub Regional Plan for Haryana Sub-Region of NCR-2021: Interim Report -II
Scott Wilson India Page 13-19
circular stepped stone embankment to impound rain water from the hills. It’s bed is about 130
meters in diameter. Almost touching it is a fresh water pond called Pea Cock lake surrounded by
hillocks.
The Badkhal Lake nestling amidst rocks to the west of Faridabad Old and northwest of Faridabad
township. Badkhal lake is about 32 kms away from Delhi and 3.5 kms. away from Delhi-Mathura
National Highway-2 (NH-2). The rain water harvest is done by joining toes of the two hillocks
and by constructing a check dam which is 644.5 meters long and 6 meters wide. Thus, a
beautiful lake was created on one side of the check dam while the rock remnants of the Aravalli
Range on the other side presented a beautiful picturesque. The rocks and ridges surrounding the
lake provide natural landscape with greenery of trees and shrubs. So, both the Suraj Kund and
Badkhal Lake are connected through a six kilometers inner forest road.
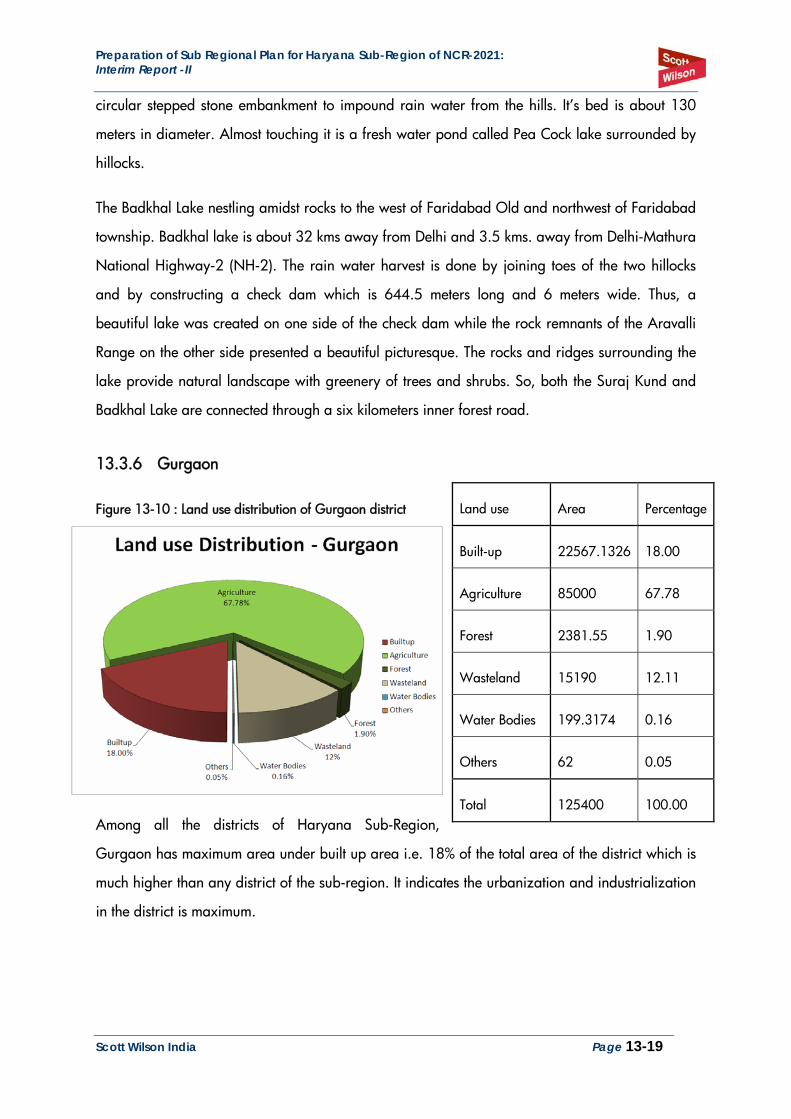
13.3.6 Gurgaon
Figure 13-10 : Land use distribution of Gurgaon district
Among all the districts of Haryana Sub-Region,
Gurgaon has maximum area under built up area i.e. 18% of the total area of the district which is
much higher than any district of the sub-region. It indicates the urbanization and industrialization
in the district is maximum.
Land use Area Percentage
Built-up 22567.1326 18.00
Agriculture 85000 67.78
Forest 2381.55 1.90
Wasteland 15190 12.11
Water Bodies 199.3174 0.16
Others 62 0.05
Total 125400 100.00
Preparation of Sub Regional Plan for Haryana Sub-Region of NCR-2021: Interim Report -II
Scott Wilson India Page 13-20
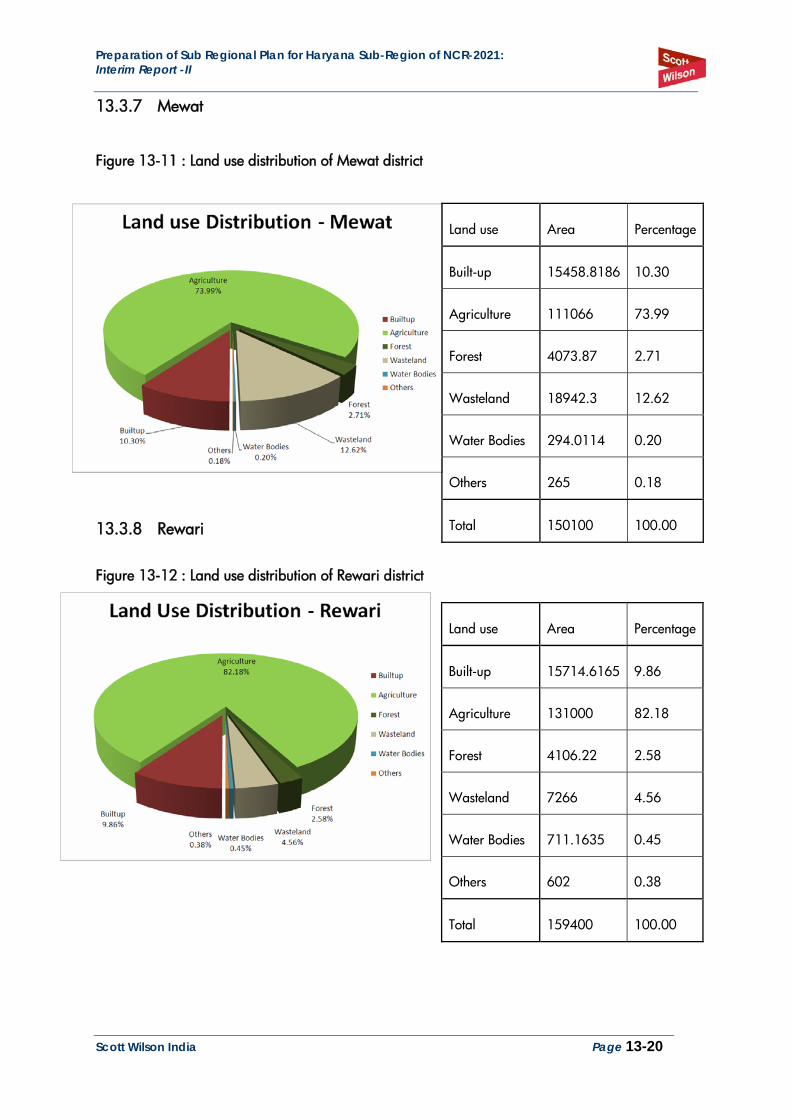
13.3.7 Mewat
Figure 13-11 : Land use distribution of Mewat district
13.3.8 Rewari
Figure 13-12 : Land use distribution of Rewari district
Land use Area Percentage
Built-up 15714.6165 9.86
Agriculture 131000 82.18
Forest 4106.22 2.58
Wasteland 7266 4.56
Water Bodies 711.1635 0.45
Others 602 0.38
Total 159400 100.00
Land use Area Percentage
Built-up 15458.8186 10.30
Agriculture 111066 73.99
Forest 4073.87 2.71
Wasteland 18942.3 12.62
Water Bodies 294.0114 0.20
Others 265 0.18
Total 150100 100.00
Preparation of Sub Regional Plan for Haryana Sub-Region of NCR-2021: Interim Report -II
Scott Wilson India Page 13-21
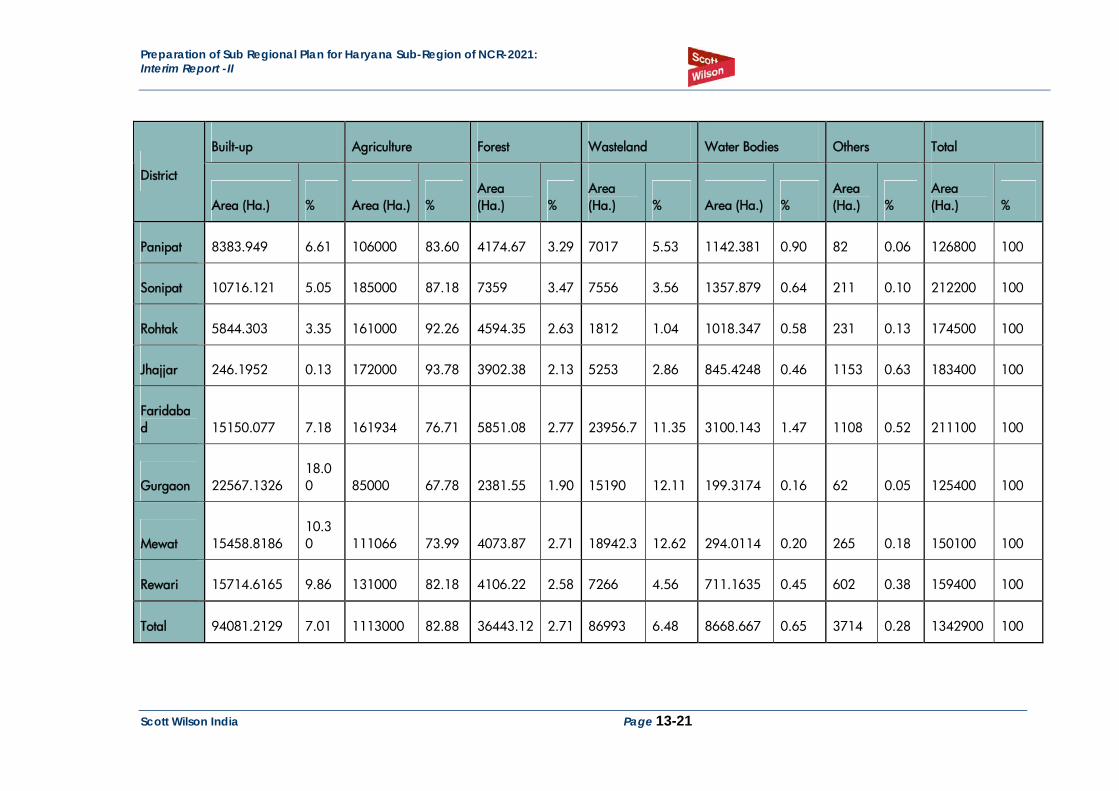
Built-up Agriculture Forest Wasteland Water Bodies Others Total
District
Area (Ha.) % Area (Ha.) % Area (Ha.) %
Area (Ha.) % Area (Ha.) %
Area (Ha.) %
Area (Ha.) %
Panipat 8383.949 6.61 106000 83.60 4174.67 3.29 7017 5.53 1142.381 0.90 82 0.06 126800 100
Sonipat 10716.121 5.05 185000 87.18 7359 3.47 7556 3.56 1357.879 0.64 211 0.10 212200 100
Rohtak 5844.303 3.35 161000 92.26 4594.35 2.63 1812 1.04 1018.347 0.58 231 0.13 174500 100
Jhajjar 246.1952 0.13 172000 93.78 3902.38 2.13 5253 2.86 845.4248 0.46 1153 0.63 183400 100
Faridabad 15150.077 7.18 161934 76.71 5851.08 2.77 23956.7 11.35 3100.143 1.47 1108 0.52 211100 100
Gurgaon 22567.1326 18.00 85000 67.78 2381.55 1.90 15190 12.11 199.3174 0.16 62 0.05 125400 100
Mewat 15458.8186 10.30 111066 73.99 4073.87 2.71 18942.3 12.62 294.0114 0.20 265 0.18 150100 100
Rewari 15714.6165 9.86 131000 82.18 4106.22 2.58 7266 4.56 711.1635 0.45 602 0.38 159400 100
Total 94081.2129 7.01 1113000 82.88 36443.12 2.71 86993 6.48 8668.667 0.65 3714 0.28 1342900 100
Preparation of Sub Regional Plan for Haryana Sub-Region of NCR-2021: Interim Report -II
Scott Wilson India Page 13-22
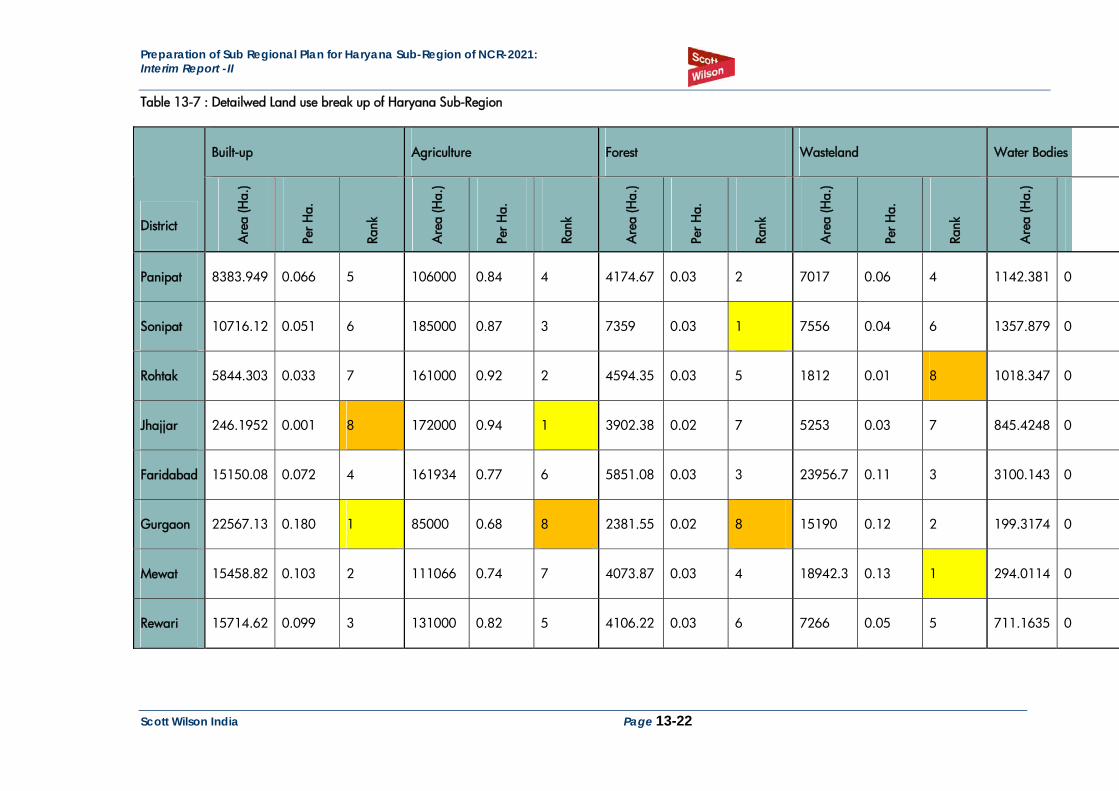
Table 13-7 : Detailwed Land use break up of Haryana Sub-Region
Built-up Agriculture Forest Wasteland Water Bodies
District A
rea
(Ha.
)
Per H
a.
Rank
Are
a (H
a.)
Per H
a.
Rank
Are
a (H
a.)
Per H
a.
Rank
Are
a (H
a.)
Per H
a.
Rank
Are
a (H
a.)
Panipat 8383.949 0.066 5 106000 0.84 4 4174.67 0.03 2 7017 0.06 4 1142.381 0
Sonipat 10716.12 0.051 6 185000 0.87 3 7359 0.03 1 7556 0.04 6 1357.879 0
Rohtak 5844.303 0.033 7 161000 0.92 2 4594.35 0.03 5 1812 0.01 8 1018.347 0
Jhajjar 246.1952 0.001 8 172000 0.94 1 3902.38 0.02 7 5253 0.03 7 845.4248 0
Faridabad 15150.08 0.072 4 161934 0.77 6 5851.08 0.03 3 23956.7 0.11 3 3100.143 0
Gurgaon 22567.13 0.180 1 85000 0.68 8 2381.55 0.02 8 15190 0.12 2 199.3174 0
Mewat 15458.82 0.103 2 111066 0.74 7 4073.87 0.03 4 18942.3 0.13 1 294.0114 0
Rewari 15714.62 0.099 3 131000 0.82 5 4106.22 0.03 6 7266 0.05 5 711.1635 0