Embed Size (px)
Citation preview
Chemical ReactionEngineering
Thomas Rodgers
2013


Contents
List of Figures iii
Nomenclature v
1 Mole Balance for Reactors 11.1 Introduction . . . . . . . . . . . . . . . . . . . . . . . . . . . . . . . . . 3
1.1.1 Definitions of Reaction Rate . . . . . . . . . . . . . . . . . . . . 31.1.2 Reaction Equation or Rate Law . . . . . . . . . . . . . . . . . . 3
1.2 Mole Balance for Reactors . . . . . . . . . . . . . . . . . . . . . . . . . 41.2.1 Mole Balance Applied to Batch Reactors . . . . . . . . . . . . . 51.2.2 Mole Balance Applied to CSTR . . . . . . . . . . . . . . . . . . 71.2.3 Mole Balance Applied to Plug Flow Reactor (PFR) . . . . . . . . 8
1.3 Summary . . . . . . . . . . . . . . . . . . . . . . . . . . . . . . . . . . 111.4 Problems . . . . . . . . . . . . . . . . . . . . . . . . . . . . . . . . . . 13
2 Conversion in Reactors 152.1 Introduction . . . . . . . . . . . . . . . . . . . . . . . . . . . . . . . . . 17
2.1.1 Definition of Conversion . . . . . . . . . . . . . . . . . . . . . . 172.2 Conversion in Batch Reactors . . . . . . . . . . . . . . . . . . . . . . . . 172.3 Conversion in Flow Reactors . . . . . . . . . . . . . . . . . . . . . . . . 19
2.3.1 CSTR Design Equations for Conversion . . . . . . . . . . . . . . 202.3.2 PFR Design Equations for Conversion . . . . . . . . . . . . . . . 21
2.4 Application of the Design Equations for Flow Reactors . . . . . . . . . . 222.4.1 Design Equations for CSTR and PFR and the Levenspiel Plot . . 222.4.2 CSTR . . . . . . . . . . . . . . . . . . . . . . . . . . . . . . . . 222.4.3 PFR . . . . . . . . . . . . . . . . . . . . . . . . . . . . . . . . . 232.4.4 PFR and CSTR Comparison . . . . . . . . . . . . . . . . . . . . 242.4.5 Reactors in Series . . . . . . . . . . . . . . . . . . . . . . . . . . 24
2.5 Summary of Design Equations for Ideal Reactors . . . . . . . . . . . . . 242.6 Problems . . . . . . . . . . . . . . . . . . . . . . . . . . . . . . . . . . 27
3 Rate Laws and Stoichiometry 293.1 Introduction . . . . . . . . . . . . . . . . . . . . . . . . . . . . . . . . . 313.2 Relative Rates of Reaction . . . . . . . . . . . . . . . . . . . . . . . . . 313.3 Stoichiometric tables for conversion . . . . . . . . . . . . . . . . . . . . 32
3.3.1 Change in pressure for a gas phase reaction in a constant volumebatch reactor . . . . . . . . . . . . . . . . . . . . . . . . . . . . 32
i
CONTENTS
3.3.2 Change in volumetric flowrate in a PFR . . . . . . . . . . . . . . 333.4 Reaction Rate Equation or Rate Law . . . . . . . . . . . . . . . . . . . . 343.5 Problems . . . . . . . . . . . . . . . . . . . . . . . . . . . . . . . . . . 37
4 Determination of Rate Law Parameters 394.1 Introduction . . . . . . . . . . . . . . . . . . . . . . . . . . . . . . . . . 414.2 Experimental Determination of Rates . . . . . . . . . . . . . . . . . . . 414.3 Determination of Reaction Orders by Inspection . . . . . . . . . . . . . . 424.4 Differential Methods of Analysis . . . . . . . . . . . . . . . . . . . . . . 42
4.4.1 For Rates Dependent on the Concentration of Only One Species . 424.4.2 For More Complex Reactions (Dependence on CA and CB) . . . 434.4.3 Method of Initial Rates . . . . . . . . . . . . . . . . . . . . . . . 44
4.5 Integral Methods . . . . . . . . . . . . . . . . . . . . . . . . . . . . . . 444.5.1 Zeroth Order Reaction by Integral Method . . . . . . . . . . . . 454.5.2 First Order Irreversible Reaction by Integral Method . . . . . . . 454.5.3 Second Order Reaction by Integral Method . . . . . . . . . . . . 46
4.6 Method of Half-Lives . . . . . . . . . . . . . . . . . . . . . . . . . . . . 494.7 Problems . . . . . . . . . . . . . . . . . . . . . . . . . . . . . . . . . . 51
5 Temperature Dependence of Reaction Rates 535.1 Introduction . . . . . . . . . . . . . . . . . . . . . . . . . . . . . . . . . 555.2 Arrhenius Equation . . . . . . . . . . . . . . . . . . . . . . . . . . . . . 555.3 Example Calculation of the Arrhenius Parameters . . . . . . . . . . . . . 565.4 Problems . . . . . . . . . . . . . . . . . . . . . . . . . . . . . . . . . . 59
6 Multiple Reactions 616.1 Introduction . . . . . . . . . . . . . . . . . . . . . . . . . . . . . . . . . 636.2 Yield and Selectivity . . . . . . . . . . . . . . . . . . . . . . . . . . . . 636.3 Reversible Reactions . . . . . . . . . . . . . . . . . . . . . . . . . . . . 646.4 Parallel Reactions . . . . . . . . . . . . . . . . . . . . . . . . . . . . . . 666.5 Series Reactions . . . . . . . . . . . . . . . . . . . . . . . . . . . . . . . 706.6 Problems . . . . . . . . . . . . . . . . . . . . . . . . . . . . . . . . . . 75
7 Design structure for Isothermal Reactors 777.1 Design structure for Isothermal Reactors . . . . . . . . . . . . . . . . . . 797.2 Problems . . . . . . . . . . . . . . . . . . . . . . . . . . . . . . . . . . 81
ii
List of Figures
1.1 Schematic representation of the design of a reactor volume. . . . . . . . . 51.2 Schematic representation of a batch reactor. . . . . . . . . . . . . . . . . 51.3 Mole-time trajectories for component A and B. . . . . . . . . . . . . . . 71.4 A typical CSTR showing the flow of the reacting material A. . . . . . . . 71.5 Schematic representation of a PFR. . . . . . . . . . . . . . . . . . . . . . 91.6 Mole balance of component j in a differential segment of ∆V . . . . . . . 91.7 Molar flowrate of component A and B as a function of volume in a PFR. . 10
2.1 Levenspiel plot of the data shown in Table 2.1 . . . . . . . . . . . . . . . 232.2 Representation of (a) CSTR and (b) PFR volume calculations . . . . . . . 232.3 Representation of multiple (a) CSTR and (b) PFR volumes . . . . . . . . 24
4.1 Concentration vs time curve. . . . . . . . . . . . . . . . . . . . . . . . . 414.2 Differential rate for a constant volume batch reactor . . . . . . . . . . . . 434.3 Initial concentration vs rate curve. . . . . . . . . . . . . . . . . . . . . . 444.4 Zeroth order irreversible reaction in a constant volume batch reactor . . . 454.5 First order reaction in a constant volume batch reactor . . . . . . . . . . . 464.6 First order reaction in a constant volume batch reactor . . . . . . . . . . . 464.7 Second order reaction in a constant volume batch reactor . . . . . . . . . 474.8 Plot of data taken from a constant volume batch reactor . . . . . . . . . . 50
5.1 Temperature dependence of the rate constant k . . . . . . . . . . . . . . . 555.2 Symbolic reaction showing the activation energy barrier . . . . . . . . . . 565.3 Plot of ln k vs 1/T . . . . . . . . . . . . . . . . . . . . . . . . . . . . . 57
6.1 Plot of ln (1−X/Xe) vs t to determine −k1 (M + 1) / (M +Xe) . . . . 666.2 Plot of − ln (CA/CA0) vs t to determine (k1 + k2) . . . . . . . . . . . . . 676.3 Concentration plot based on Equation 6.4.6 to determine k1/k2 . . . . . . 686.4 Concentration plot for parallel reactions . . . . . . . . . . . . . . . . . . 696.5 Concentration plot for serial reactions . . . . . . . . . . . . . . . . . . . 716.6 Concentration profiles for series reactions . . . . . . . . . . . . . . . . . 726.7 Concentration profiles for parallel reactions . . . . . . . . . . . . . . . . 73
iii

iv
Nomenclature
RomanA Arrhenius pre-exponential factor variesC Concentration mol m−3
Eact Activation energy J mol−1
G Generation mol s−1
K Equilibrium constant variesk Rate constant variesM Ratio of CB0/CA0 −N Moles moln Molar flow rate mol m−3 s−1
P Pressure Pap Partial pressure PaR 8.314 J mol−1 K−1
r Reaction rate mol s−1
S Selectivity −T Temperature Kt Time st1/2 Half-life sV Volume m3
v Volumetric flow rate mol m−3 s−1
X Conversion −Y Yield −y Mole fraction −Greekα Reaction order −β Reaction order −δ Change in moles per mole of A −ε Change in mole fraction per mole of A −τ Residence time sSub-/Super-scripts0 Related to the starte Refers to the equilibriumf Related to the end
v

vi
Chapter 1Mole Balance for Reactors
Contents1.1 Introduction . . . . . . . . . . . . . . . . . . . . . . . . . . . . . . . 3
1.1.1 Definitions of Reaction Rate . . . . . . . . . . . . . . . . . . . 3
1.1.2 Reaction Equation or Rate Law . . . . . . . . . . . . . . . . . 3
1.2 Mole Balance for Reactors . . . . . . . . . . . . . . . . . . . . . . . 4
1.2.1 Mole Balance Applied to Batch Reactors . . . . . . . . . . . . 5
1.2.2 Mole Balance Applied to CSTR . . . . . . . . . . . . . . . . . 7
1.2.3 Mole Balance Applied to Plug Flow Reactor (PFR) . . . . . . . 8
1.3 Summary . . . . . . . . . . . . . . . . . . . . . . . . . . . . . . . . . 11
1.4 Problems . . . . . . . . . . . . . . . . . . . . . . . . . . . . . . . . . 13
1

2
1.1. INTRODUCTION 3
1.1 Introduction
Before describing the reactors, we need to first discuss how to provide mathematical ex-pressions for the rate at which reactions occur using rate laws.
1.1.1 Definitions of Reaction Rate
The reaction rate represents how fast a chemical component is converted into another bya chemical reaction. More specifically, the reaction rate, rj , is the moles of j formed(or appearing) per unit volume per unit time (molj m−3 s−1). The reaction rate is neg-ative when the moles of j are being consumed by the reaction (as occurs for reactantsbefore any product has been formed). The reaction rate is positive when the moles of jincrease with time due to the reaction (as occurs for products before any product has beenformed).
Reaction RateThe reaction rate can be positive or negative for any component of a reaction de-pending on the direction of the equilibrium from the initial compositions.
1.1.2 Reaction Equation or Rate Law
A reaction equation is an algebraic equation that is solely a function of the properties ofthe reacting materials and reaction conditions (e.g. species concentration, temperature,pressure, or type of catalyst) at any point in the system.
Rate LawThe rate equation is independent of the type of reactor (e.g. batch or continuousflow) in which the reaction is carried out.
A −→ products
The reaction rate may be a linear function of concentration, i.e. −rA = kCA or maybe some other algebraic function of concentration, such as −rA = kC2
A or −rA =(k1CA) / (1 + k2CA).
For a given reaction, the concentration dependence of the rate must be determined fromexperimental observation. Typical examples of reaction rates are a first order reactiongiven by,
− rA = kCA (1.1.1)
or a second order reaction,− rA = kC2
A (1.1.2)
where k is called the rate constant, which varies with temperature. The order of thereaction with respect to a component j corresponds to the exponent of concentration jin the rate law. Note that the reaction rate, r, corresponds to a rate for formation. Fora reactant the rate of formation is going to be negative as the reactant is consumed bythe reaction, hence the negative sign in Equations 1.1.1 and 1.1.2. Usually the order of
4 CHAPTER 1. MOLE BALANCE FOR REACTORS
the reaction provides some insight into the molecular mechanism for the reaction. A firstorder reaction corresponds to a uni-molecular process, whereas a second order reactioncorresponds to reaction controlled by collisions between molecules. These rules are onlystrictly true when the reaction is an elementary step. Most reactions are combinations ofelementary steps, which can lead to more complicated rate laws. In addition, the rate lawcan depend on the relative concentrations of the components. For instance, rate laws areindependent of the concentrations of components, which occur at a large excess relativeto another component (i.e. water).
1.2 Mole Balance for Reactors
Ideal reactors normally refer to simplified models of reactors, in which various approxi-mations are made. These approximations allow us to describe the behaviour of the reactorusing simple mathematical expressions. In this section we study three types of ideal re-actors: the batch reactor, the continuously stirred tank reactor (CSTR), and the plug flowreactor (PFR). We show how to apply a mole balance to each of them, which forms thebasis for the reactor design.
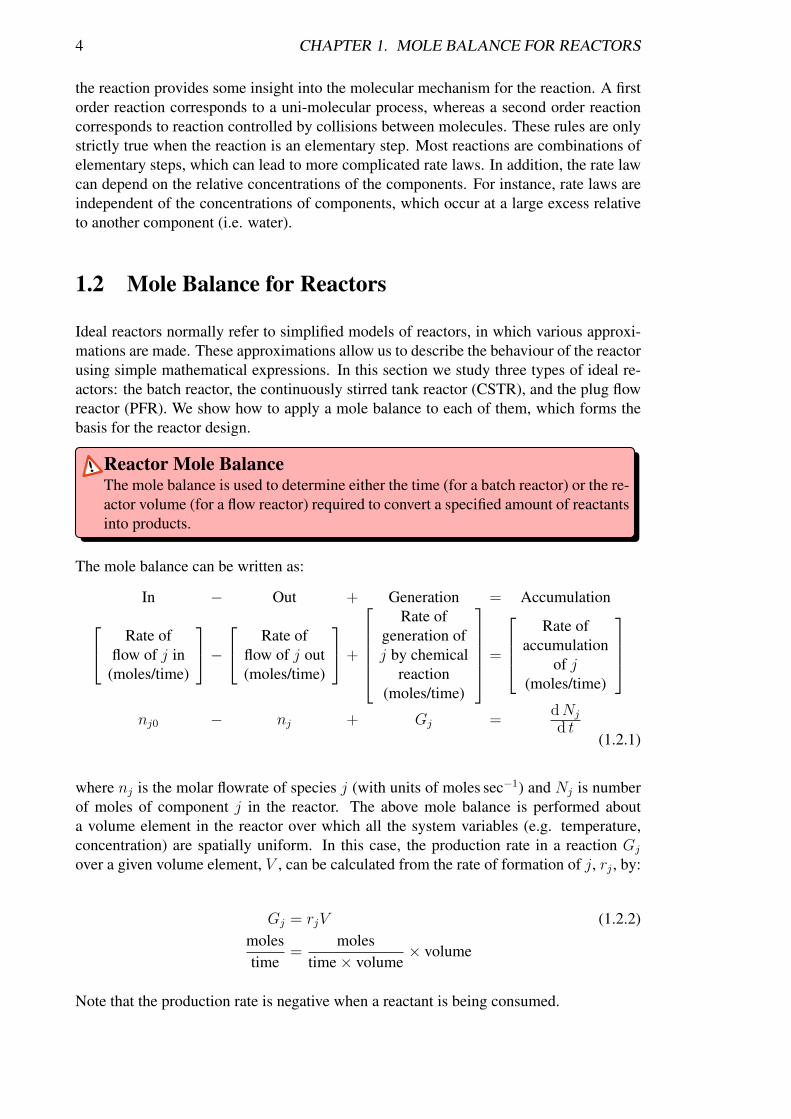
Reactor Mole BalanceThe mole balance is used to determine either the time (for a batch reactor) or the re-actor volume (for a flow reactor) required to convert a specified amount of reactantsinto products.
The mole balance can be written as:
In − Out + Generation = Accumulation Rate offlow of j in
(moles/time)
− Rate of
flow of j out(moles/time)
+
Rate of
generation ofj by chemical
reaction(moles/time)
=
Rate of
accumulationof j
(moles/time)
nj0 − nj + Gj =
dNj
d t(1.2.1)
where nj is the molar flowrate of species j (with units of moles sec−1) and Nj is numberof moles of component j in the reactor. The above mole balance is performed abouta volume element in the reactor over which all the system variables (e.g. temperature,concentration) are spatially uniform. In this case, the production rate in a reaction Gj
over a given volume element, V , can be calculated from the rate of formation of j, rj , by:
Gj = rjV (1.2.2)molestime
=moles
time× volume× volume
Note that the production rate is negative when a reactant is being consumed.
1.2. MOLE BALANCE FOR REACTORS 5
nj0 njV
Figure 1.1: Schematic representation of the design of a reactor volume.
1.2.1 Mole Balance Applied to Batch Reactors
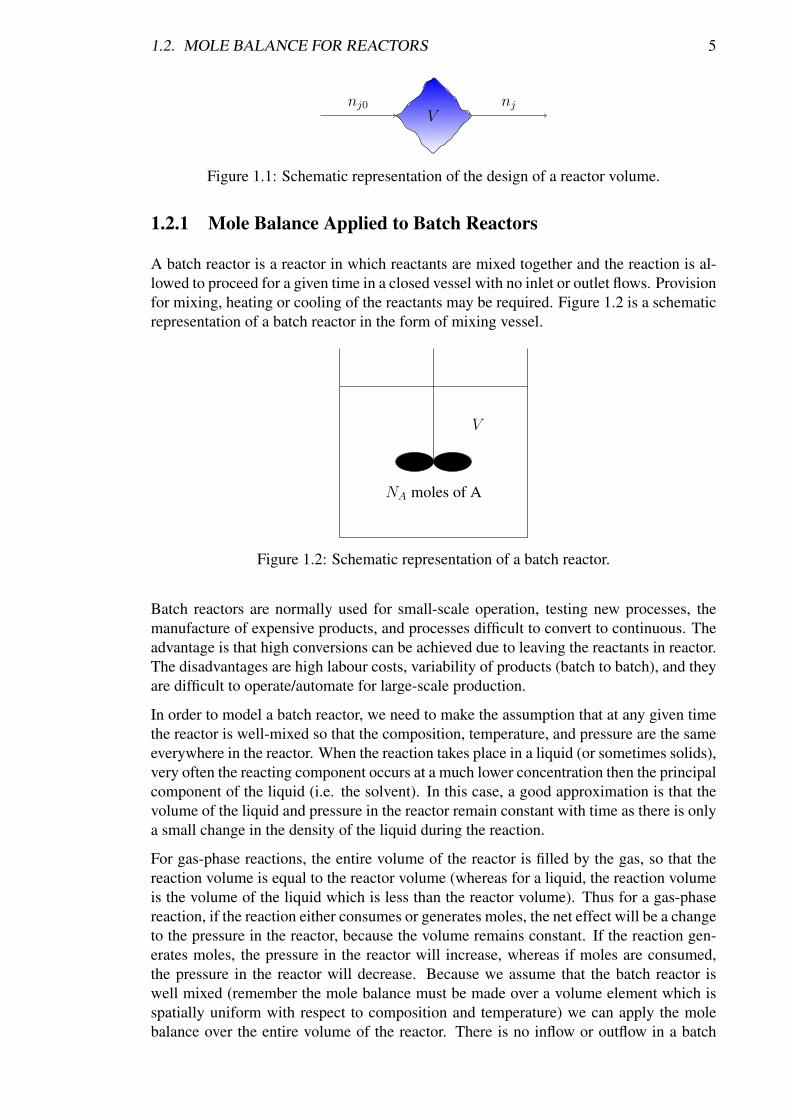
A batch reactor is a reactor in which reactants are mixed together and the reaction is al-lowed to proceed for a given time in a closed vessel with no inlet or outlet flows. Provisionfor mixing, heating or cooling of the reactants may be required. Figure 1.2 is a schematicrepresentation of a batch reactor in the form of mixing vessel.
V
NA moles of A
Figure 1.2: Schematic representation of a batch reactor.
Batch reactors are normally used for small-scale operation, testing new processes, themanufacture of expensive products, and processes difficult to convert to continuous. Theadvantage is that high conversions can be achieved due to leaving the reactants in reactor.The disadvantages are high labour costs, variability of products (batch to batch), and theyare difficult to operate/automate for large-scale production.
In order to model a batch reactor, we need to make the assumption that at any given timethe reactor is well-mixed so that the composition, temperature, and pressure are the sameeverywhere in the reactor. When the reaction takes place in a liquid (or sometimes solids),very often the reacting component occurs at a much lower concentration then the principalcomponent of the liquid (i.e. the solvent). In this case, a good approximation is that thevolume of the liquid and pressure in the reactor remain constant with time as there is onlya small change in the density of the liquid during the reaction.
For gas-phase reactions, the entire volume of the reactor is filled by the gas, so that thereaction volume is equal to the reactor volume (whereas for a liquid, the reaction volumeis the volume of the liquid which is less than the reactor volume). Thus for a gas-phasereaction, if the reaction either consumes or generates moles, the net effect will be a changeto the pressure in the reactor, because the volume remains constant. If the reaction gen-erates moles, the pressure in the reactor will increase, whereas if moles are consumed,the pressure in the reactor will decrease. Because we assume that the batch reactor iswell mixed (remember the mole balance must be made over a volume element which isspatially uniform with respect to composition and temperature) we can apply the molebalance over the entire volume of the reactor. There is no inflow or outflow in a batch
6 CHAPTER 1. MOLE BALANCE FOR REACTORS
reactor, so nj0 = nj = 0. Rearranging Equations 1.1.1 and 1.1.2 then gives us:
rjV =dNj
d t(1.2.3)
Consider the reaction:
A −→ B
Rearranging Equation 1.2.3 for species A,
d t =dNA
rAV(1.2.4)
Integrating with limits NA = NA0 when t = 0 (i.e. the initial condition) and NA = NAf
when t = t1,
t1 =
∫ NAf
NA0
dNA
rAV(1.2.5)
Now we need to substitute in a rate law for the reaction, for example if the rate law isgiven by
−rA = kCA Rate equation for a 1st-order reaction
−rAV = kCAV = k
(NA
V
)V = kNA (1.2.6)
then substituting into Equation 1.2.5 gives
t1 =
∫ NAf
NA0
dNA
−kNA
=
∫ NA0
NAf
dNA
kNA
(1.2.7)
The integration is performed to yield
t1 =1
klnNA0
NAf
(1.2.8)
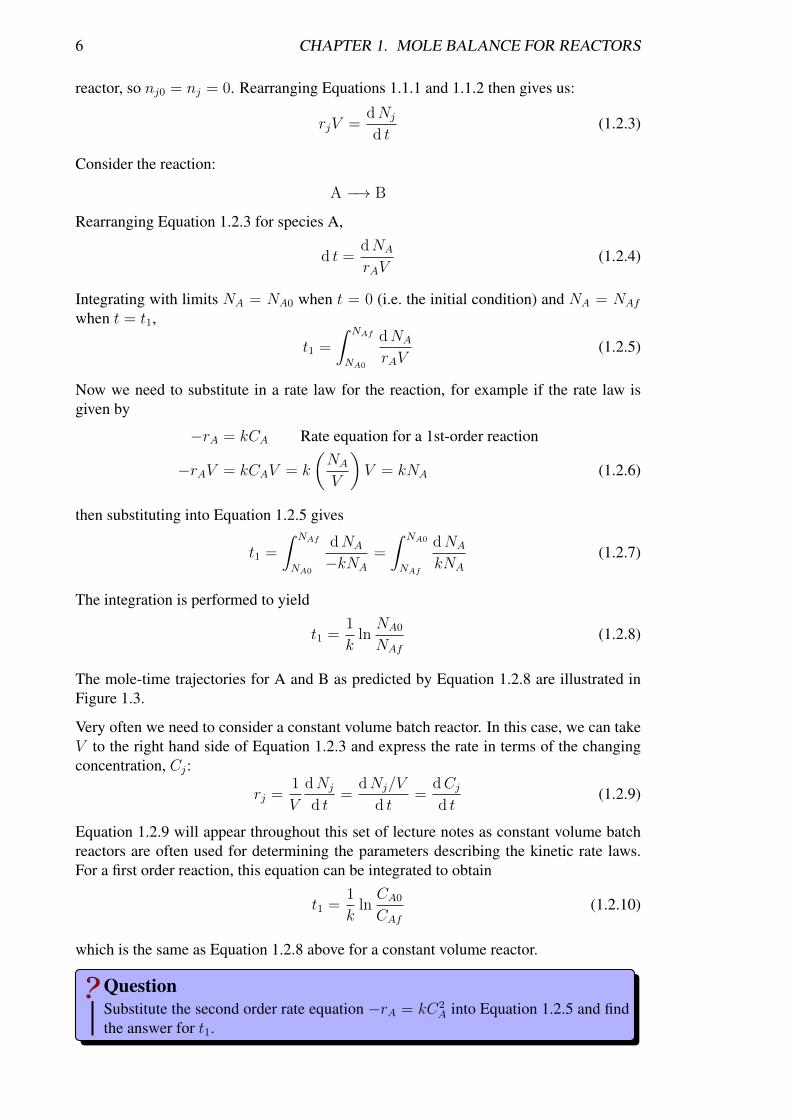
The mole-time trajectories for A and B as predicted by Equation 1.2.8 are illustrated inFigure 1.3.
Very often we need to consider a constant volume batch reactor. In this case, we can takeV to the right hand side of Equation 1.2.3 and express the rate in terms of the changingconcentration, Cj:
rj =1
V
dNj
d t=
dNj/V
d t=
dCjd t
(1.2.9)
Equation 1.2.9 will appear throughout this set of lecture notes as constant volume batchreactors are often used for determining the parameters describing the kinetic rate laws.For a first order reaction, this equation can be integrated to obtain
t1 =1
klnCA0
CAf(1.2.10)
which is the same as Equation 1.2.8 above for a constant volume reactor.
QuestionSubstitute the second order rate equation −rA = kC2
A into Equation 1.2.5 and findthe answer for t1.
1.2. MOLE BALANCE FOR REACTORS 7
NA
t
NA0
(a)
NB
t
(b)
Figure 1.3: Mole-time trajectories for component A and B.
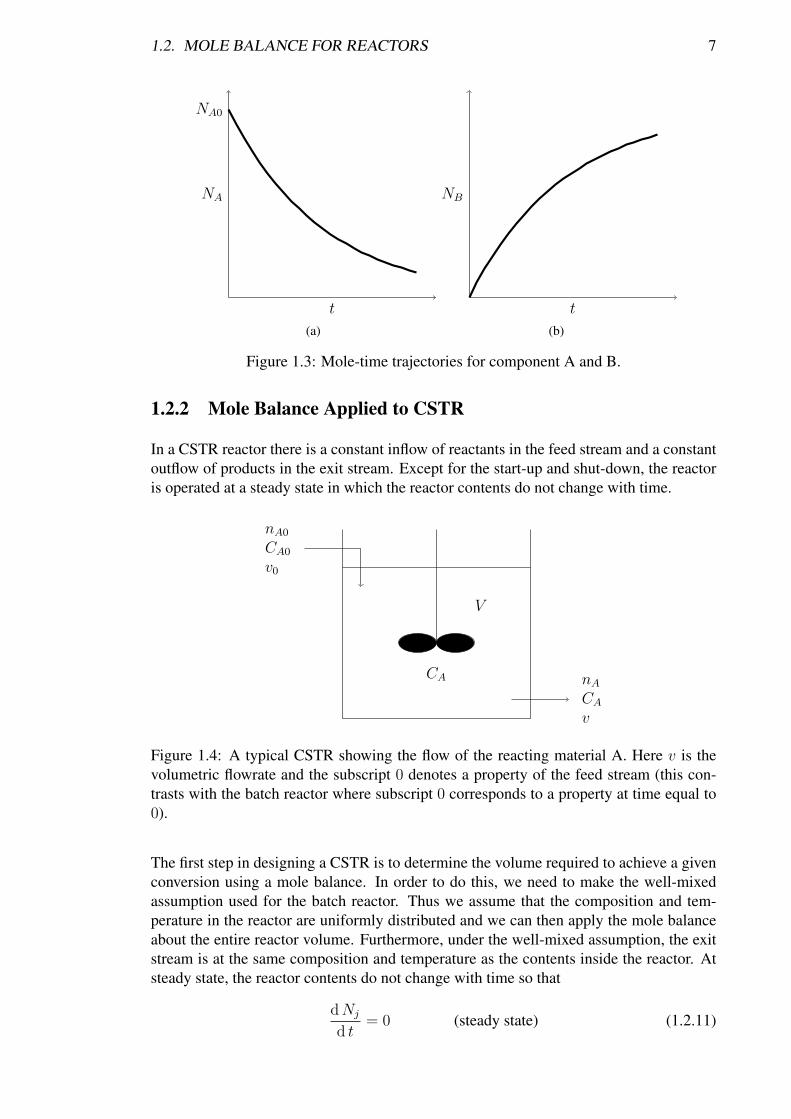
1.2.2 Mole Balance Applied to CSTR
In a CSTR reactor there is a constant inflow of reactants in the feed stream and a constantoutflow of products in the exit stream. Except for the start-up and shut-down, the reactoris operated at a steady state in which the reactor contents do not change with time.
V
CA nACAv
nA0
CA0
v0
Figure 1.4: A typical CSTR showing the flow of the reacting material A. Here v is thevolumetric flowrate and the subscript 0 denotes a property of the feed stream (this con-trasts with the batch reactor where subscript 0 corresponds to a property at time equal to0).
The first step in designing a CSTR is to determine the volume required to achieve a givenconversion using a mole balance. In order to do this, we need to make the well-mixedassumption used for the batch reactor. Thus we assume that the composition and tem-perature in the reactor are uniformly distributed and we can then apply the mole balanceabout the entire reactor volume. Furthermore, under the well-mixed assumption, the exitstream is at the same composition and temperature as the contents inside the reactor. Atsteady state, the reactor contents do not change with time so that
dNj
d t= 0 (steady state) (1.2.11)

8 CHAPTER 1. MOLE BALANCE FOR REACTORS
Plugging Equation 1.2.11 into the mole balance gives
nj0 − nj + rjV = 0 (1.2.12)
and solving for the volume of the reactor, we find
V =nj0 − nj−rj
(1.2.13)
Equation 1.2.13 provides a relation to calculate the reactor volume in terms of the flowrates, nj0 and nj when species j is disappearing at a rate, −rj .
According to the molar flow rate:
nj = Cj × v (1.2.14)
where v is the volumetric flowrate (volume/time). Combining Equations 1.2.13 and 1.2.14gives
V =v0Cj0 − vCj−rj
(1.2.15)
where the subscript 0 corresponds to an inlet flowrate. For a 1st-order reaction A −→ B(−rA = kCA and nA = CAv):
V =v0CA0 − vCA
kCA(1.2.16)
If v0 = v, i.e. the inlet and outlet flowrates are the same, then,
V =v
k
(CA0
CA− 1
)(1.2.17)
QuestionSubstitute the second order rate equation−rA = kC2
A into Equation 1.2.15 and findthe answer for V .
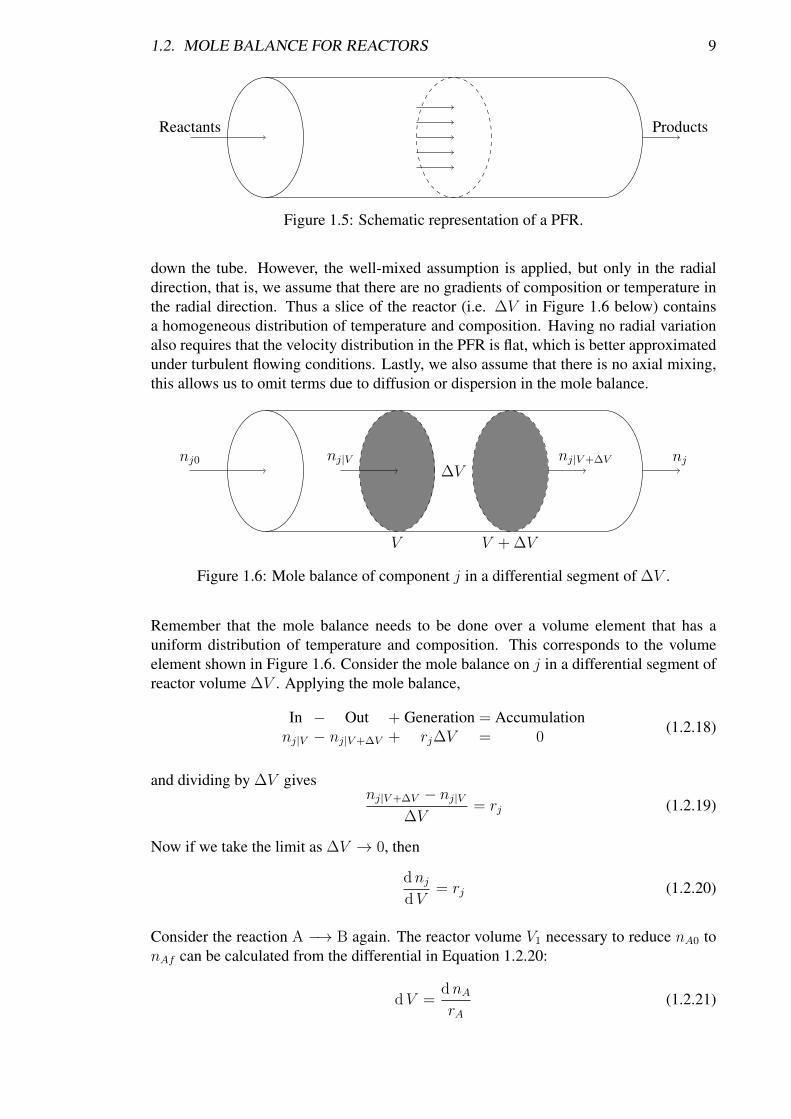
1.2.3 Mole Balance Applied to Plug Flow Reactor (PFR)
PFRs are mainly used for gas phase reactions and may be packed with catalyst. Aschematic representation of a PFR is shown in Figure 1.5. The reactants are continu-ously fed into a cylindrical tube, while the products are continuously withdrawn. Thereaction occurs as the stream flows through the reactor; the amount reacted increases withthe distance down the cylindrical tube. The length needs to be chosen such that the de-sired conversion can be achieved. The PFR is similar to the CSTR in that it is operatedunder steady-state conditions except for the start-up and shut down of the reactor. Theanalysis below is only given for the steady state condition, which is used for sizing thereactor.
In order to model a PFR, a few assumptions need to be made. In contrast to the CSTRor batch reactor, the PFR is not well-mixed as the conversion increases with the distance
1.2. MOLE BALANCE FOR REACTORS 9
Reactants Products
Figure 1.5: Schematic representation of a PFR.
down the tube. However, the well-mixed assumption is applied, but only in the radialdirection, that is, we assume that there are no gradients of composition or temperature inthe radial direction. Thus a slice of the reactor (i.e. ∆V in Figure 1.6 below) containsa homogeneous distribution of temperature and composition. Having no radial variationalso requires that the velocity distribution in the PFR is flat, which is better approximatedunder turbulent flowing conditions. Lastly, we also assume that there is no axial mixing,this allows us to omit terms due to diffusion or dispersion in the mole balance.
∆Vnj|V nj|V+∆Vnj0 nj
V V + ∆V
Figure 1.6: Mole balance of component j in a differential segment of ∆V .
Remember that the mole balance needs to be done over a volume element that has auniform distribution of temperature and composition. This corresponds to the volumeelement shown in Figure 1.6. Consider the mole balance on j in a differential segment ofreactor volume ∆V . Applying the mole balance,
In − Out + Generation = Accumulationnj|V − nj|V+∆V + rj∆V = 0
(1.2.18)
and dividing by ∆V givesnj|V+∆V − nj|V
∆V= rj (1.2.19)
Now if we take the limit as ∆V → 0, then
dnjdV
= rj (1.2.20)
Consider the reaction A −→ B again. The reactor volume V1 necessary to reduce nA0 tonAf can be calculated from the differential in Equation 1.2.20:
dV =dnArA
(1.2.21)
10 CHAPTER 1. MOLE BALANCE FOR REACTORS
Integrating with limits of nA = nA0 when V = 0 (the inlet) and nA = nAf when V = V1
(the outlet) gives,
V1 =
∫ nAf
nA0
dnArA
=
∫ nA0
nAf
dnA−rA
(1.2.22)
For a 1st-order reaction (−rA = kCA and nA = CAv),
V1 =
∫ nA0
nAf
dnAkCA
=v
k
∫ nA0
nAf
dnAnA
(1.2.23)
Therefore, upon integration, we find,
V1 =v
klnnA0
nAf=v
klnCA0
CAf(1.2.24)
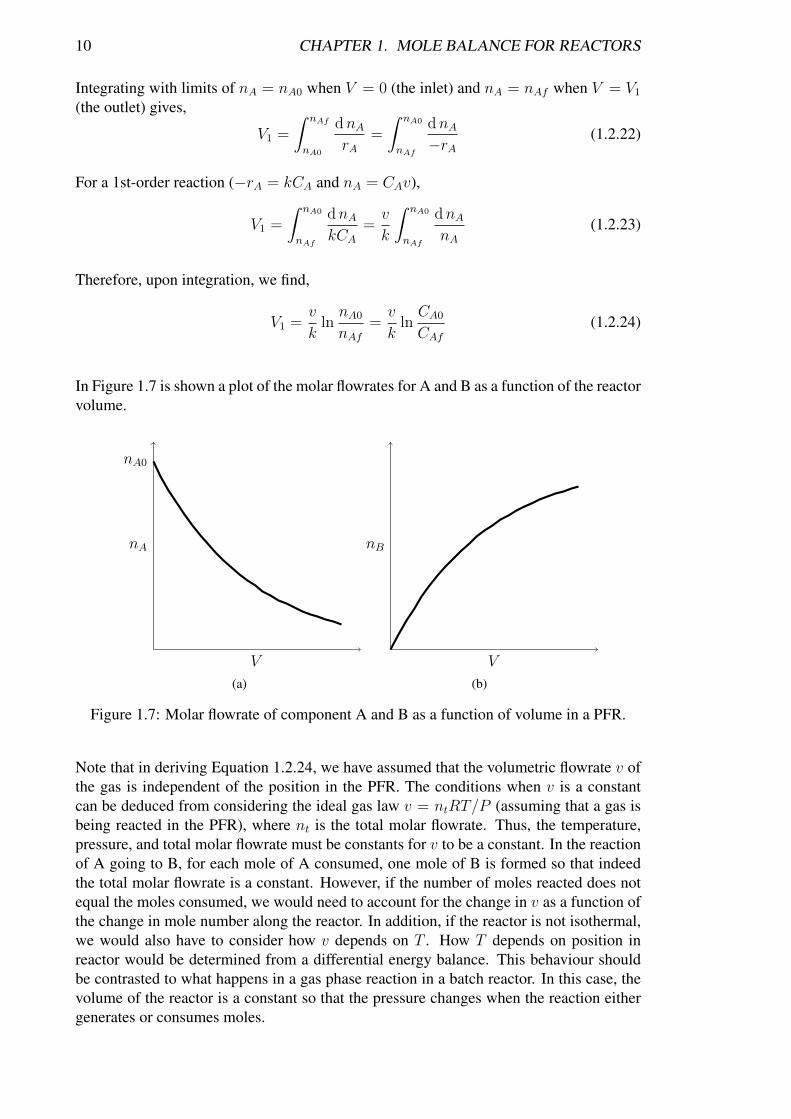
In Figure 1.7 is shown a plot of the molar flowrates for A and B as a function of the reactorvolume.
nA
V
nA0
(a)
nB
V
(b)
Figure 1.7: Molar flowrate of component A and B as a function of volume in a PFR.
Note that in deriving Equation 1.2.24, we have assumed that the volumetric flowrate v ofthe gas is independent of the position in the PFR. The conditions when v is a constantcan be deduced from considering the ideal gas law v = ntRT/P (assuming that a gas isbeing reacted in the PFR), where nt is the total molar flowrate. Thus, the temperature,pressure, and total molar flowrate must be constants for v to be a constant. In the reactionof A going to B, for each mole of A consumed, one mole of B is formed so that indeedthe total molar flowrate is a constant. However, if the number of moles reacted does notequal the moles consumed, we would need to account for the change in v as a function ofthe change in mole number along the reactor. In addition, if the reactor is not isothermal,we would also have to consider how v depends on T . How T depends on position inreactor would be determined from a differential energy balance. This behaviour shouldbe contrasted to what happens in a gas phase reaction in a batch reactor. In this case, thevolume of the reactor is a constant so that the pressure changes when the reaction eithergenerates or consumes moles.
1.3. SUMMARY 11
The pressure profile in a PFR is not related to the gas law (the gas law controls the volu-metric flowrate), but instead the pressure profile in a PFR is determined from the momen-tum balance (i.e. fluid flow). The Ergun Equation is often used to calculate the pressuredrop in a PFR containing catalyst particles in terms of the diameter of the cylinder, thesize of catalyst particles, the viscosity of the medium and the velocity of the gas.
QuestionSubstitute the second order rate equation −rA = kC2
A into Equation 1.2.22 andfind the answer for V1.
Compare the PFR results with that of the batch reactor.
1.3 Summary
The key design equations have been derived for each type of ideal reactor using the as-sumptions involved in the ideal reactor definitions. Additionally, the expressions havebeen derived to determine the time or volume required to achieve a reactant concentrationfor 1st-order reactions.
Reactor Design Equations
Batch: t =
∫ NA0
NAf
dNA
−rAV
CSTR: V =nj0 − nj−rj
PFR: V =
∫ nA0
nAf
dnA−rA

12
1.4. PROBLEMS 13
1.4 Problems
1. Calculate the time to reduce the number of moles by a factor of 10 (NA = NA0/10)in a batch reactor for the reaction
A −→ B
with −rA = kCA, when k = 0.046 min−1.
2. Consider the liquid phase cis-trans isomerisation of 2-butene which can be writtensymbolically as
A −→ B.
The first order (−rA = kCA) reaction is carried out in a tubular reactor in whichthe volumetric flow rate, v, is constant, i.e. v = v0.
(a) Sketch the concentration profile.
(b) Derive an equation relating the reactor volume to the entering and exitingconcentrations of A, the rate constant k, and the volumetric flow rate, v.
(c) Determine the reactor volume necessary to reduce the exiting concentration to10% of the entering concentration when the volumetric flow rate is 10 dm3 min−1
and the specific reaction rate constant k, is 0.23 min−1.
3. Calculate the volume of a CSTR for the conditions used in the above example.Which volume is larger, the PFR or CSTR? Explain why.
4. Calculate the time to reduce the number of moles of A to 1% of its initial value in aconstant volume batch reactor for the reaction and data in question 2.
5. Consider a plug flow reactor operating steady-state and constant temperature. Thefollowing (first-order) reaction (for which there is no volume change) takes placeand the rate constant is 5× 10⁻⁴ s−1:
A −→ products
If the inlet concentration is 0.1 mol dm−3, the reactor volume 0.6 m3 and the volu-metric flow 0.3 dm3 s−1, what is the outlet concentration?
[0.0368 mol dm−3]
6. Liquid A decomposes by first-order kinetics. In a batch reactor 50% of A is con-verted in 5 s. How much longer would it take to reach 75% conversion? Repeat thisproblem for the case when the decomposition follows second-order kinetics.
[5 s, 10 s]

14
Chapter 2Conversion in Reactors
Contents2.1 Introduction . . . . . . . . . . . . . . . . . . . . . . . . . . . . . . . 17
2.1.1 Definition of Conversion . . . . . . . . . . . . . . . . . . . . . 17
2.2 Conversion in Batch Reactors . . . . . . . . . . . . . . . . . . . . . . 17
2.3 Conversion in Flow Reactors . . . . . . . . . . . . . . . . . . . . . . 19
2.3.1 CSTR Design Equations for Conversion . . . . . . . . . . . . . 20
2.3.2 PFR Design Equations for Conversion . . . . . . . . . . . . . . 21
2.4 Application of the Design Equations for Flow Reactors . . . . . . . 22
2.4.1 Design Equations for CSTR and PFR and the Levenspiel Plot . 22
2.4.2 CSTR . . . . . . . . . . . . . . . . . . . . . . . . . . . . . . . 22
2.4.3 PFR . . . . . . . . . . . . . . . . . . . . . . . . . . . . . . . . 23
2.4.4 PFR and CSTR Comparison . . . . . . . . . . . . . . . . . . . 24
2.4.5 Reactors in Series . . . . . . . . . . . . . . . . . . . . . . . . . 24
2.5 Summary of Design Equations for Ideal Reactors . . . . . . . . . . 24
2.6 Problems . . . . . . . . . . . . . . . . . . . . . . . . . . . . . . . . . 27
15

16
2.1. INTRODUCTION 17
2.1 Introduction
The concept of conversion is useful as it provides a direct measure of the extent of reac-tion. Furthermore, when only one reaction is occurring in the reactor, all molar flowratescan be expressed in terms of the conversion, which makes solving the design equationeasier.
2.1.1 Definition of Conversion
Consider the reaction:
aA + bB −→ cC + dD
with lower-case letters the stoichiometric coefficients and upper-case letters the chemicalspecies.
Take species A as the basis of calculation so divide through by the coefficient of A
A +ba
B −→ caC +
da
D
Every quantity is now ‘per mole of A’
We can now ask,
• How can we quantify how far the reaction proceeds to the right?
• How many moles of C (or D) are formed for every mole of A consumed?
To answer these questions it is convenient to use a parameter, conversion. Conversion ofA is defined as:
XA =moles of A reacted
moles of A fed(2.1.1)
Usually we drop the subscript A so X ≡ XA.
Conversion• For irreversible reactions, at the start X = 0 and at the end X = 1, in cases
where all of A is consumed (note that A will only be totally consumed if it isthe limiting reactant in an irreversible reaction)• For reversible reactions, the maximum conversion possible is controlled by
the equilibrium constant; the maximum value is termed the equilibrium con-version Xe
2.2 Conversion in Batch Reactors
We first need to write out all molar flowrates in terms of the conversion of A and theconcentrations of components in the reactor before the reaction has started.[
moles of A reacted(consumed)
]=[
moles of A fed]×[
moles of A reactedmoles of A fed
]= NA0 × X
(2.2.1)
18 CHAPTER 2. CONVERSION IN REACTORS
The number of moles of A that remain in the reactor after time, t, NA is:
moles of Ain reactor
at t
=
moles of Ainitially fedto reactor at
t = 0
− moles of A
consumedby reactor
NA = NA0 − NA0XNA = NA0 (1−X)
(2.2.2)
which can be rearranged to give
X =NA0 −NA
NA0
(2.2.3)
Taking an infinitesimally small change inNA (i.e.NA0−NA → 0), then we can say,
dX = −dNA
NA0
(2.2.4)
When V is constant with time, we have:
X =CA0 − CACA0
so, dX = −dCACA0
(2.2.5)
Equation 2.2.2 can be differentiated with respect to t to give,
dNA
d t=
d
d t[NA0 (1−X)] =
����>
0dNA0
d t−NA0
dX
d t= −NA0
dX
d t(2.2.6)
The design equation for a batch reactor is (Equation 1.2.3),
dNA
d t= rAV (2.2.7)
Combining Equations 2.2.6 and 2.2.7 gives the design equation in terms of conversion:
−NA0dX
d t= rAV (2.2.8)
To determine the time to achieve a specified conversion,X , we must separate the variablesin Equation 2.2.8 and integrate with respect to conversion:
t = NA0
∫ X
0
dX
−rAV(2.2.9)
Equation 2.2.9 is the integral form of the design equation. In order to perform the inte-gration, the rate of formation and the volume need to be expressed as a function of theconversion. As mentioned previously, often the volume is a constant for a batch reactor.Consider the case of a 1st-order rate law, where we showed that (Equation 1.2.6)
− rAV = kNA (2.2.10)
2.3. CONVERSION IN FLOW REACTORS 19
which can be substituted into Equation 2.2.9 to give
t = NA0
∫ X
0
dX
kNA
(2.2.11)
By definition, NA = NA0 (1−X), so that Equation 2.2.11 becomes
t = NA0
∫ X
0
dX
kNA0 (1−X)=
1
k
∫ X
0
dX
1−X(2.2.12)
Integrating Equation 2.2.12 gives,
t =1
k[− ln (1−X)]X0 = −1
kln (1−X) (2.2.13)
which provides a relationship between the time for the reaction needs to reach the speci-fied conversion,X . The only assumptions that have been used in deriving Equation 2.2.13for the reaction of A to B is that the reactor is isothermal. If the reactor is not isothermal,then we would need to consider how k depends on T . In this case, we would need touse an energy balance to derive a relationship between T and X and then express k as afunction of T (X).
QuestionSubstitute the second order rate equation −rAV = kN2
A into Equation 2.2.9 andfind the answer for t.
2.3 Conversion in Flow Reactors
For a flow reactor, the total rate at which species A is reacting within the entire system isnA0X:
nA0X =moles of A fed
time× moles of A reacted
moles of A fed
=moles of A reacted
time(2.3.1)
Molar feed rate of A to the system minus the rate of reaction in the system equals molarflow rate leaving: molar flow rate
at which A is fedto the system
− molar flow rate
at which A isconsumed
=
molar flow rateat which A
leaves
nA0 − nA0X = nA
(2.3.2)
Rearranging Equation 2.3.2 gives
nA = nA0 (1−X) (2.3.3)
20 CHAPTER 2. CONVERSION IN REACTORS
The rate of reaction is known in terms of concentration variables. The molar flowratesare converted to concentrations using the volumetric flowrates. The inlet flowrate is thusgiven by
nA0 = CA0v0 (2.3.4)
For gases CA0 can be calculated from the entering temperature and pressure conditionsusing the ideal gas law:
CA0 =pA0
RT0
=yA0P
RT0
(2.3.5)
where pA0 is the partial pressure of A in the inlet, P0 is the inlet pressure, and yA0 is theinlet mole fraction.
2.3.1 CSTR Design Equations for Conversion
The design equation for CSTR is given by (see Equation 1.2.13)
V =nA0 − nA−rA
(2.3.6)
After substitution of Equation 2.3.3 into Equation 2.3.6, we find
V =nA0X
−rA(2.3.7)
Because the reactor is assumed to be perfectly mixed, the exit composition is the sameas in the reactor so the rate of reaction is evaluated at the exit conditions. For a 1st-orderreaction A −→ B (−rA = kCA and nA0 = CA0v0), we find
V =nA0X
kCA=CA0v0X
kCA(2.3.8)
Often the equation is written in terms of the mean residence time (Holding time or spacetime) defined by
τ =V
v0
(2.3.9)
which is the time necessary to process one volume of reactor fluid at the entrance condi-tions. The mean residence time provides a measure of how long the fluid is in the reactor,which controls the conversion, the larger the residence time, the greater the conversion.Substitution of the space-time definition into Equation 2.3.9 gives
τ =CA0X
kCA(2.3.10)
If the volumetric flowrates of the inlet and outlet streams are equal, according to Equa-tion 2.3.3, we have
CA = CA0 (1−X) (2.3.11)
which can be substituted into Equation 2.3.10 to give an expression for the conversion interms of the space time
X =kτ
1 + kτ(2.3.12)

2.3. CONVERSION IN FLOW REACTORS 21
Equation 2.3.12 provides a rapid way for estimating the conversion in terms of the prod-uct kτ , which is known as the reaction Dahmkohler number. Values of the Damkohlernumber equal to 0.1 give conversions of about 10 percent, whereas values equal to 10give conversions of close to 90 percent.
QuestionSubstitute the second order rate equation −rA = kC2
A into Equation 2.3.7 and findthe relationship for X in terms of the Dahmkohler number, kτ .
2.3.2 PFR Design Equations for Conversion
Starting from the PFR design equation (see Equation 1.2.20):
dnAdV
= rA (2.3.13)
The molar flowrate of A at a given position in a PFR is given by nA = nA0 (1−X)(Equation 2.3.3), where X corresponds to the conversion as a function of position inthe PFR. The latter relation can be derived by doing a mole balance about the entry tothe PFR and any position in the PFR. Upon differentiation, we have dnA = −nA0dX .Substituting this result into the design equation gives
nA0dX
dV= −rA (2.3.14)
The integral form of the design equation is obtained by separating variables and doing thevolume integration from 0 to V in which case the conversion goes from 0 to X:
V = nA0
∫ X
0
dX
−rA(2.3.15)
For a first order reaction we use −rA = kCA as before. Here, we solve the simplestcase where the volumetric flowrate remains constant along the PFR, in which case, CA =CA0 (1−X). Plugging this result into the rate law and Equation 2.3.14 gives
V = nA0
∫ X
0
dX
kCA0 (1−X)(2.3.16)
Taking out the constant terms from the integral gives
V =nA0
kCA0
∫ X
0
dX
1−X(2.3.17)
Integrating and taking nA0 = CA0v0 gives
V = −v0
kln (1−X) (2.3.18)
or from the definition of mean residence time
τ =V
v0
= −1
kln (1−X) (2.3.19)

22 CHAPTER 2. CONVERSION IN REACTORS
QuestionSubstitute the second order rate equation −rA = kC2
A into Equation 2.3.15 andfind the relationship for τ in terms of the conversion, X .
Compare these equations with batch system where this equals t.
2.4 Application of the Design Equations for Flow Reac-tors
The aim of this section is to use the experimentally derived knowledge of the rate ofreaction, −rA, as a function of conversion, X , to size CSTRs and PFRs.
2.4.1 Design Equations for CSTR and PFR and the Levenspiel Plot
As discussed above, the design equations involving conversion for the CSTR and PFR forthe reaction A −→ B are:
CSTR: V =nA0X
−rAPFR: V = nA0
∫ X
0
dX
−rA
It can be seen that the reactor volume varies as 1/− rA.
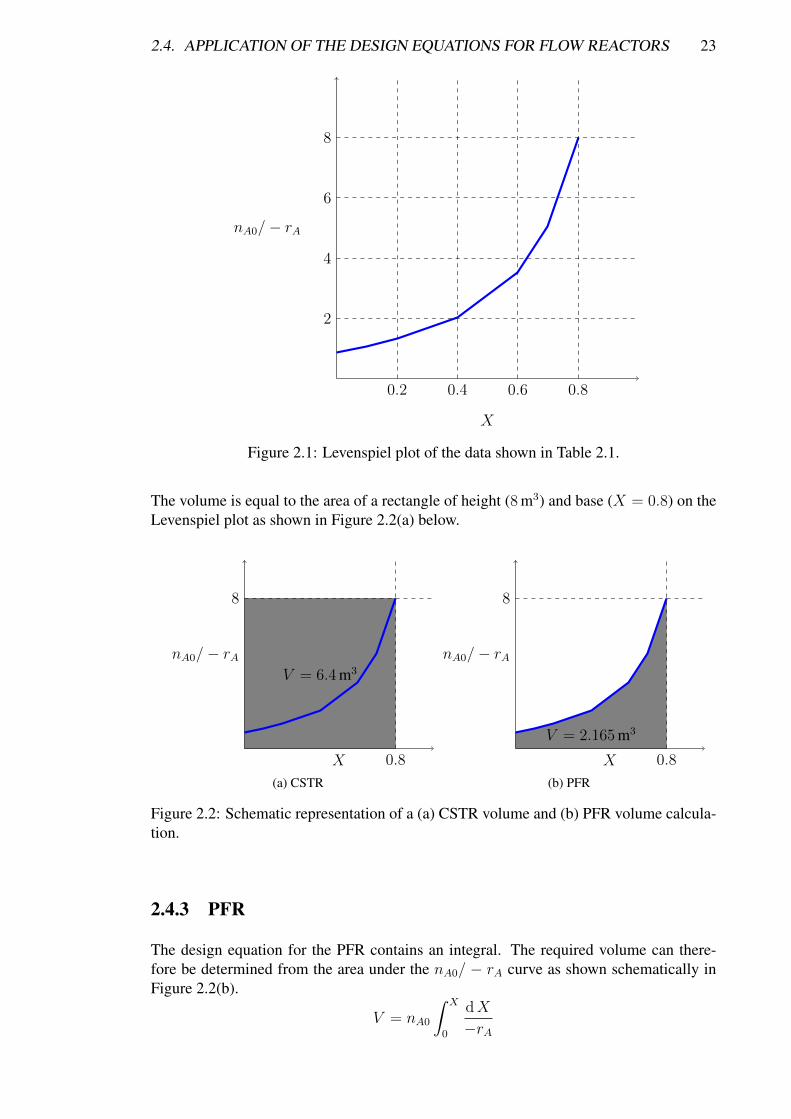
Table 2.1 shows some real data for an isothermal reaction with conditions of T = 500 K,P = 8.2 atm, and nA0 = 0.4 mol s−1. In order to size a reactor from experimental ratedata, we first need to plot nA0/−rA (m3) as a function ofX (this plot is called a Levenspielplot). Figure 2.1 shows the Levenspiel plot for the data given in Table 2.1.
Table 2.1: Real conversion data for isothermal reaction
X −rA (mol m−3 s−1)1
−rA(m3 s mol−1)
nA0
−rA(m3)
0 0.45 2.22 0.890.1 0.37 2.7 1.080.2 0.3 3.33 1.330.4 0.195 5.13 2.050.6 0.113 8.85 3.540.7 0.079 12.7 5.060.8 0.05 20 8
2.4.2 CSTR
How can we calculate the volume, V , of a CSTR to give 80% conversion? From the dataabove when X = 0.8, 1/ − rA = 20 m3 s mol−1. If we substitute these values into theCSTR design equation then we can determine the volume:
V =nA0X
−rA=
nA0
−rA×X = 8
(m3)× 0.8 = 6.4 m3 or 6400 dm3
2.4. APPLICATION OF THE DESIGN EQUATIONS FOR FLOW REACTORS 23
0.2 0.4 0.6 0.8
X
2
4
6
8
nA0/− rA
Figure 2.1: Levenspiel plot of the data shown in Table 2.1.
The volume is equal to the area of a rectangle of height (8 m3) and base (X = 0.8) on theLevenspiel plot as shown in Figure 2.2(a) below.
0.8X
8
nA0/− rAV = 6.4 m3
(a) CSTR
0.8X
8
nA0/− rA
V = 2.165 m3
(b) PFR
Figure 2.2: Schematic representation of a (a) CSTR volume and (b) PFR volume calcula-tion.
2.4.3 PFR
The design equation for the PFR contains an integral. The required volume can there-fore be determined from the area under the nA0/ − rA curve as shown schematically inFigure 2.2(b).
V = nA0
∫ X
0
dX
−rA
24 CHAPTER 2. CONVERSION IN REACTORS
The integration can be performed using the trapezium rule (or Simpson’s rule) with knowndata points. Alternatively one could count/estimate the area on graph paper. For thisexample the volume is V = 2.165 m3 = 2165 dm3.
2.4.4 PFR and CSTR Comparison
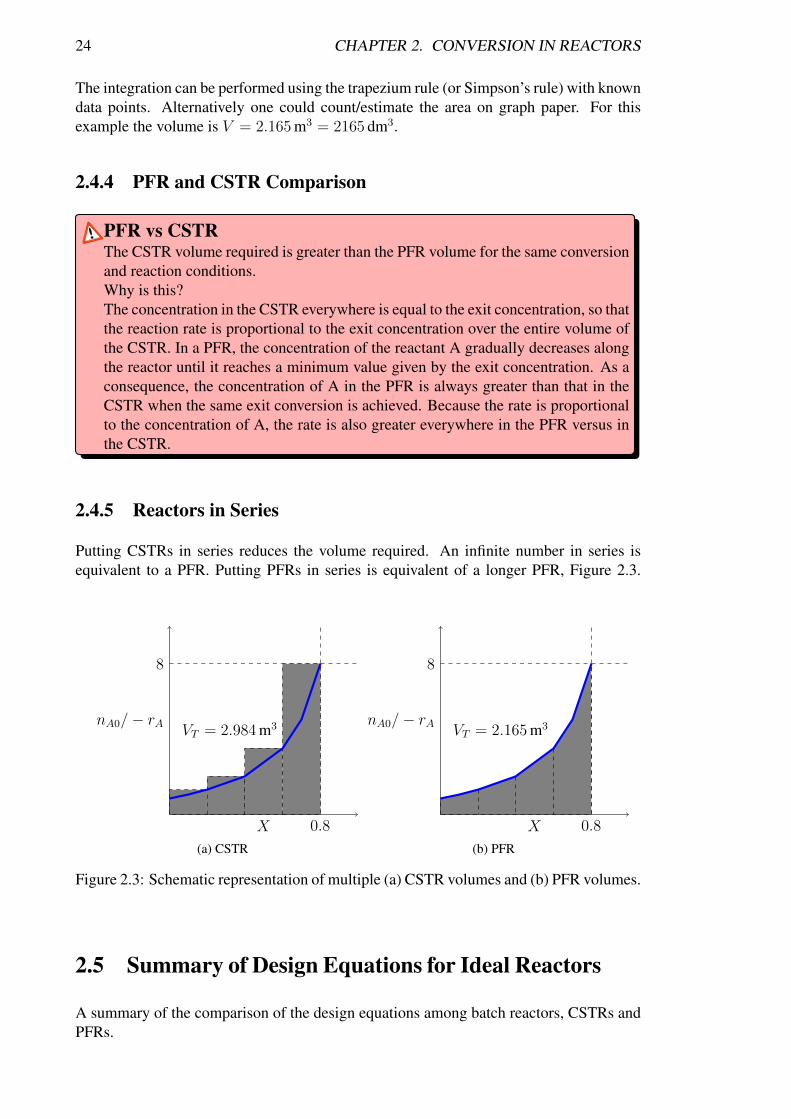
PFR vs CSTRThe CSTR volume required is greater than the PFR volume for the same conversionand reaction conditions.Why is this?The concentration in the CSTR everywhere is equal to the exit concentration, so thatthe reaction rate is proportional to the exit concentration over the entire volume ofthe CSTR. In a PFR, the concentration of the reactant A gradually decreases alongthe reactor until it reaches a minimum value given by the exit concentration. As aconsequence, the concentration of A in the PFR is always greater than that in theCSTR when the same exit conversion is achieved. Because the rate is proportionalto the concentration of A, the rate is also greater everywhere in the PFR versus inthe CSTR.
2.4.5 Reactors in Series
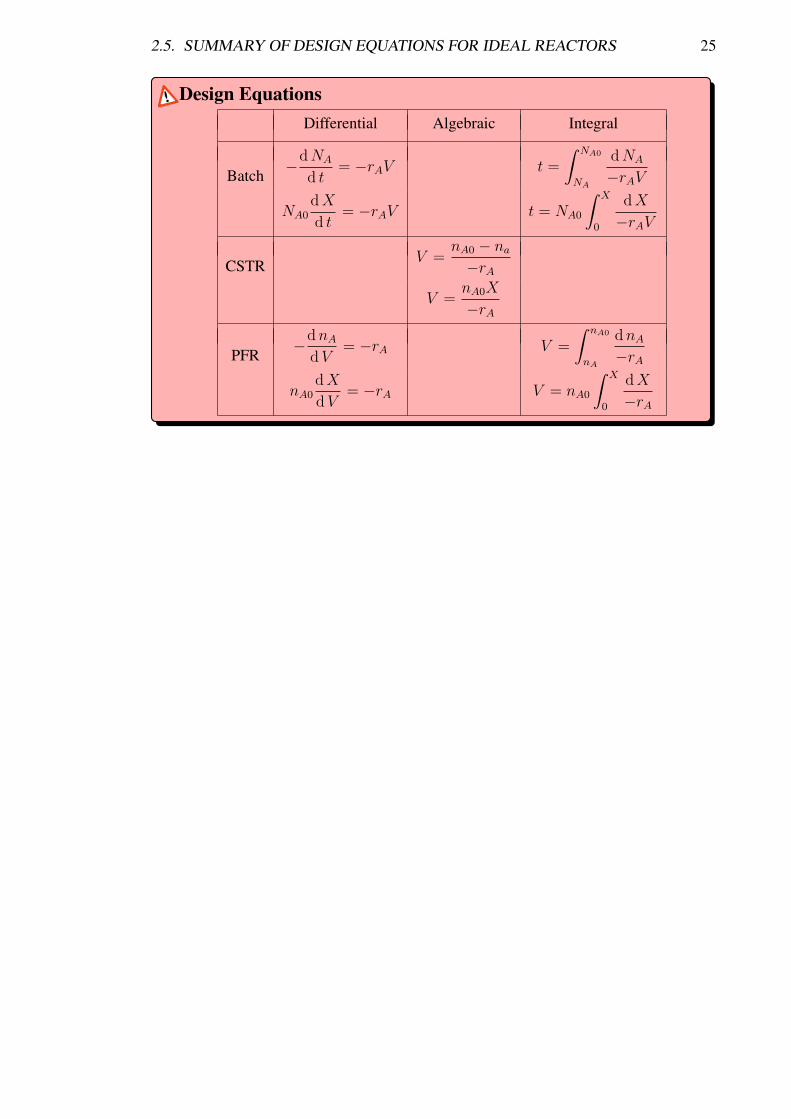
Putting CSTRs in series reduces the volume required. An infinite number in series isequivalent to a PFR. Putting PFRs in series is equivalent of a longer PFR, Figure 2.3.
0.8X
8
nA0/− rAVT = 2.984 m3
(a) CSTR
0.8X
8
nA0/− rAVT = 2.165 m3
(b) PFR
Figure 2.3: Schematic representation of multiple (a) CSTR volumes and (b) PFR volumes.
2.5 Summary of Design Equations for Ideal Reactors
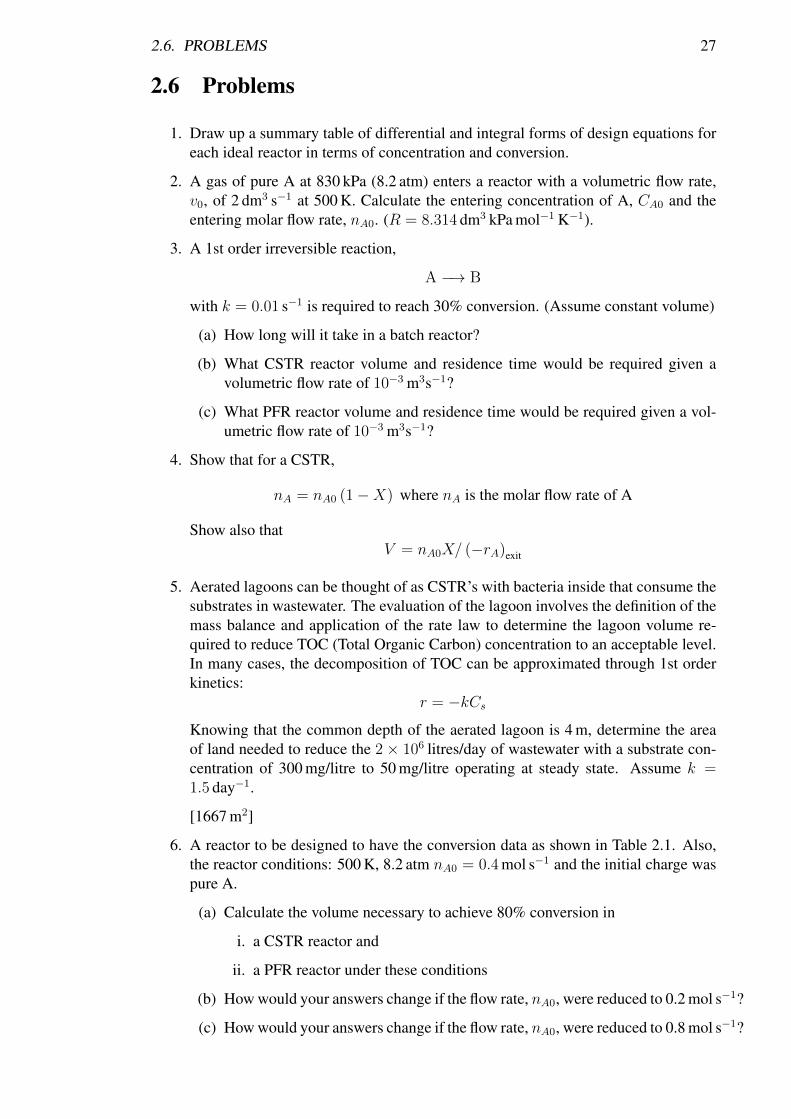
A summary of the comparison of the design equations among batch reactors, CSTRs andPFRs.
2.5. SUMMARY OF DESIGN EQUATIONS FOR IDEAL REACTORS 25
Design EquationsDifferential Algebraic Integral
Batch−dNA
d t= −rAV t =
∫ NA0
NA
dNA
−rAV
NA0dX
d t= −rAV t = NA0
∫ X
0
dX
−rAV
CSTRV =
nA0 − na−rA
V =nA0X
−rA
PFR−dnA
dV= −rA V =
∫ nA0
nA
dnA−rA
nA0dX
dV= −rA V = nA0
∫ X
0
dX
−rA

26
2.6. PROBLEMS 27
2.6 Problems
1. Draw up a summary table of differential and integral forms of design equations foreach ideal reactor in terms of concentration and conversion.
2. A gas of pure A at 830 kPa (8.2 atm) enters a reactor with a volumetric flow rate,v0, of 2 dm3 s−1 at 500 K. Calculate the entering concentration of A, CA0 and theentering molar flow rate, nA0. (R = 8.314 dm3 kPa mol−1 K−1).
3. A 1st order irreversible reaction,
A −→ B
with k = 0.01 s−1 is required to reach 30% conversion. (Assume constant volume)
(a) How long will it take in a batch reactor?
(b) What CSTR reactor volume and residence time would be required given avolumetric flow rate of 10−3 m3s−1?
(c) What PFR reactor volume and residence time would be required given a vol-umetric flow rate of 10−3 m3s−1?
4. Show that for a CSTR,
nA = nA0 (1−X) where nA is the molar flow rate of A
Show also thatV = nA0X/ (−rA)exit
5. Aerated lagoons can be thought of as CSTR’s with bacteria inside that consume thesubstrates in wastewater. The evaluation of the lagoon involves the definition of themass balance and application of the rate law to determine the lagoon volume re-quired to reduce TOC (Total Organic Carbon) concentration to an acceptable level.In many cases, the decomposition of TOC can be approximated through 1st orderkinetics:
r = −kCsKnowing that the common depth of the aerated lagoon is 4 m, determine the areaof land needed to reduce the 2 × 10⁶ litres/day of wastewater with a substrate con-centration of 300 mg/litre to 50 mg/litre operating at steady state. Assume k =1.5 day−1.
[1667 m2]
6. A reactor to be designed to have the conversion data as shown in Table 2.1. Also,the reactor conditions: 500 K, 8.2 atm nA0 = 0.4 mol s−1 and the initial charge waspure A.
(a) Calculate the volume necessary to achieve 80% conversion in
i. a CSTR reactor and
ii. a PFR reactor under these conditions
(b) How would your answers change if the flow rate, nA0, were reduced to 0.2 mol s−1?
(c) How would your answers change if the flow rate, nA0, were reduced to 0.8 mol s−1?
28 CHAPTER 2. CONVERSION IN REACTORS
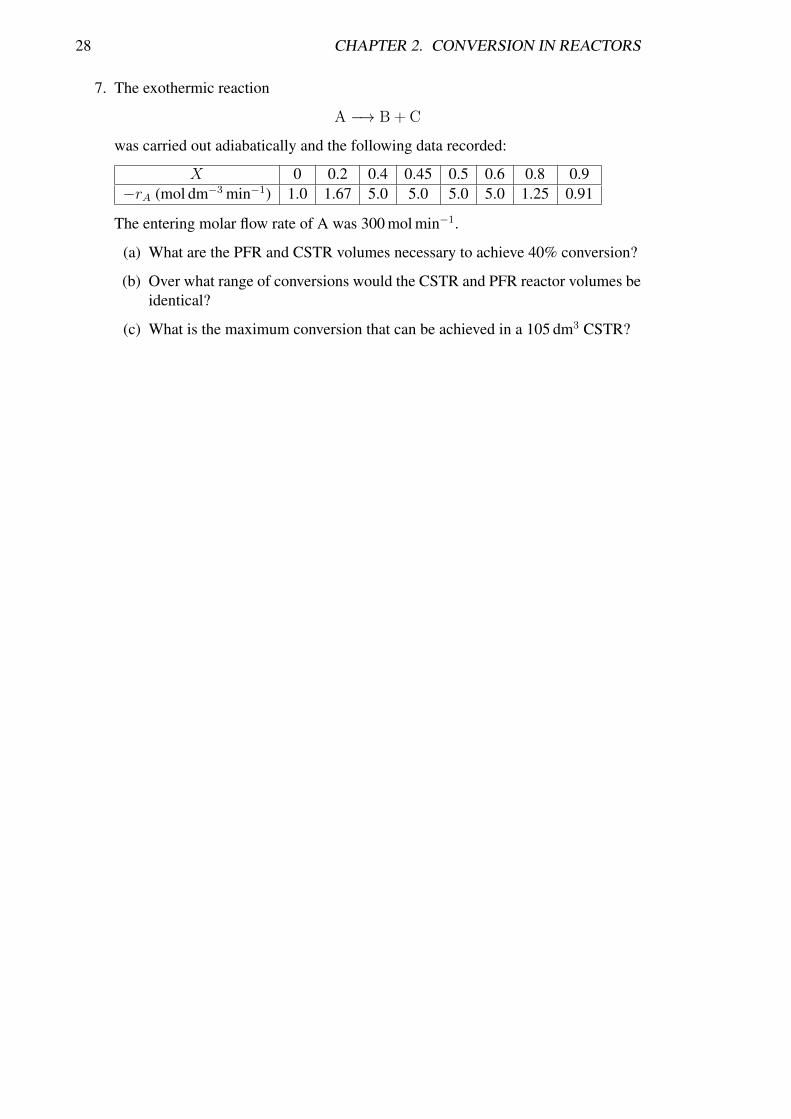
7. The exothermic reaction
A −→ B + C
was carried out adiabatically and the following data recorded:
X 0 0.2 0.4 0.45 0.5 0.6 0.8 0.9−rA (mol dm−3 min−1) 1.0 1.67 5.0 5.0 5.0 5.0 1.25 0.91
The entering molar flow rate of A was 300 mol min−1.
(a) What are the PFR and CSTR volumes necessary to achieve 40% conversion?
(b) Over what range of conversions would the CSTR and PFR reactor volumes beidentical?
(c) What is the maximum conversion that can be achieved in a 105 dm3 CSTR?
Chapter 3Rate Laws and Stoichiometry
Contents3.1 Introduction . . . . . . . . . . . . . . . . . . . . . . . . . . . . . . . 31
3.2 Relative Rates of Reaction . . . . . . . . . . . . . . . . . . . . . . . 31
3.3 Stoichiometric tables for conversion . . . . . . . . . . . . . . . . . . 32
3.3.1 Change in pressure for a gas phase reaction in a constant vol-ume batch reactor . . . . . . . . . . . . . . . . . . . . . . . . . 32
3.3.2 Change in volumetric flowrate in a PFR . . . . . . . . . . . . . 33
3.4 Reaction Rate Equation or Rate Law . . . . . . . . . . . . . . . . . 34
3.5 Problems . . . . . . . . . . . . . . . . . . . . . . . . . . . . . . . . . 37
29

30
3.1. INTRODUCTION 31
3.1 Introduction
In the last Chapter, we have shown the calculation of reactor volume and the time toachieve a given conversion in batch systems. For CSTRs and PFRs, we calculated thevolume required for the reactors to achieve a given conversion. However, it is not so oftenthat we know the relationship between the reaction rate and conversion from experimentalobservation. More likely, designing the reactor requires using an equation for the reactionrate in terms of concentrations (in which case the rate constants are known as a functionof temperature). In order to solve the design equations, each of the concentrations (andvolumes or volumetric flowrates) needs to be expressed as a function of conversion. Herewe show how this can be achieved using stoichiometric tables. A key step in writingthe stoichiometric table is to understand how the rate of formation for any component isrelated to the rate of reaction. In addition, we provide an introduction to different ratelaws and define the reaction order.
3.2 Relative Rates of Reaction
Consider the reaction:
aA + bB −→ cC + dD
or
A +ba
B −→ caC +
da
D
As discussed earlier, we usually express the reaction rate in terms one of the components,i.e. usually the rate of reaction is equal to the rate of formation of A in this case. Thus weneed an expression for the rates of reaction for other components in terms of the rate offormation of A. For instance, every mole of A consumed gives c/a moles of C. Thus therate of formation of C, rC = c/a × Rate of disappearance of A = c/a (−rA). We can thenwrite
Relative Reaction RatesaA + bB −→ cC + dD
−rAa
=−rBb
=rCc
=rDd
(3.2.1)
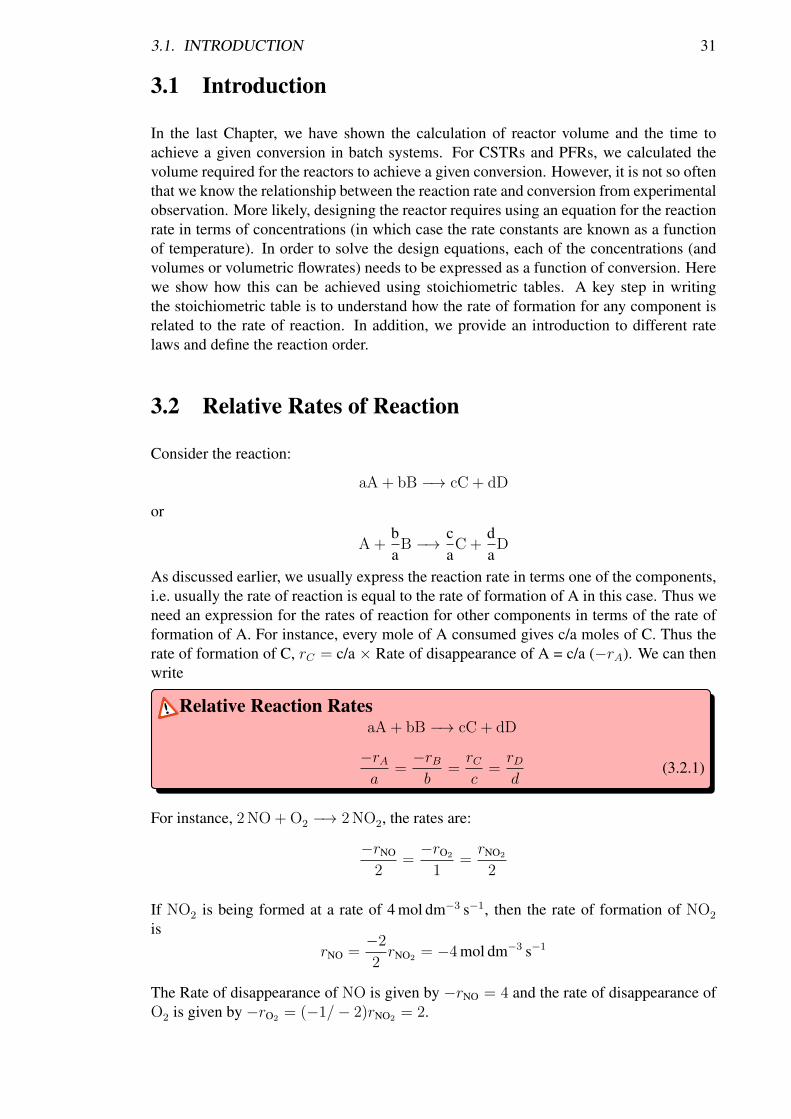
For instance, 2 NO + O2 −→ 2 NO2, the rates are:
−rNO
2=−rO2
1=rNO2
2
If NO2 is being formed at a rate of 4 mol dm−3 s−1, then the rate of formation of NO2
isrNO =
−2
2rNO2 = −4 mol dm−3 s−1
The Rate of disappearance of NO is given by −rNO = 4 and the rate of disappearance ofO2 is given by −rO2 = (−1/− 2)rNO2 = 2.
32 CHAPTER 3. RATE LAWS AND STOICHIOMETRY
3.3 Stoichiometric tables for conversion
If we again consider:
A +ba
B −→ caC +
da
D
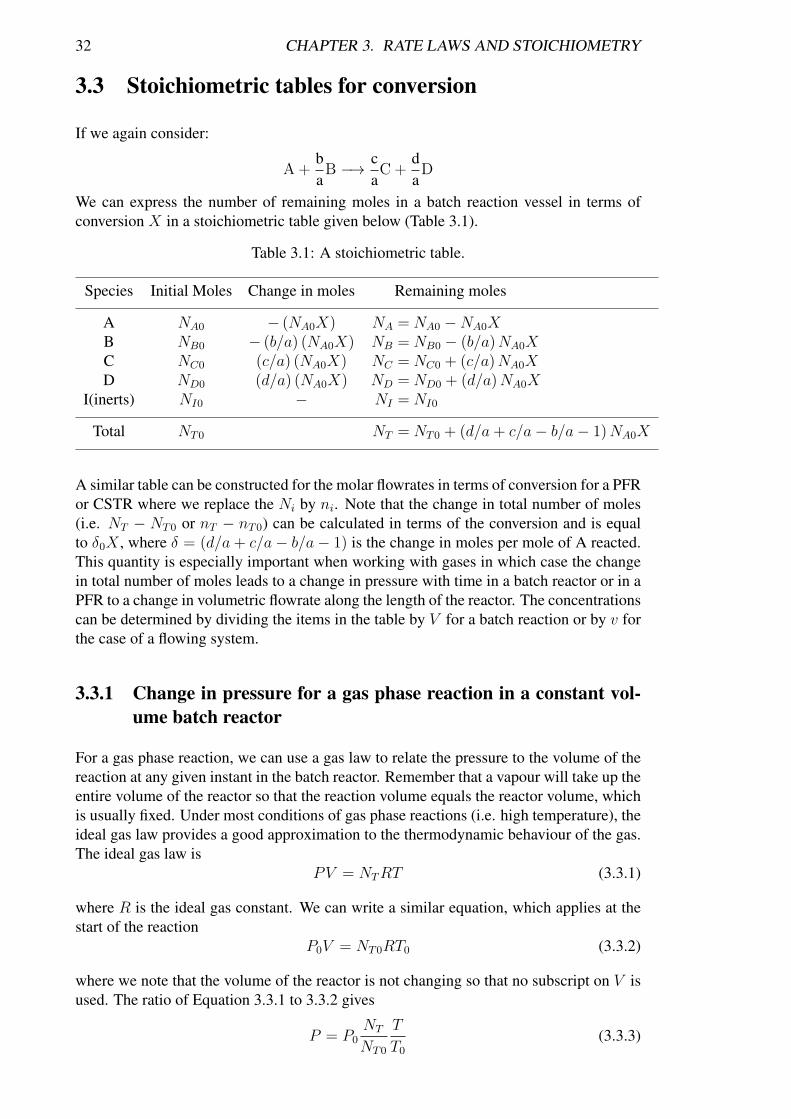
We can express the number of remaining moles in a batch reaction vessel in terms ofconversion X in a stoichiometric table given below (Table 3.1).
Table 3.1: A stoichiometric table.
Species Initial Moles Change in moles Remaining moles
A NA0 − (NA0X) NA = NA0 −NA0XB NB0 − (b/a) (NA0X) NB = NB0 − (b/a)NA0XC NC0 (c/a) (NA0X) NC = NC0 + (c/a)NA0XD ND0 (d/a) (NA0X) ND = ND0 + (d/a)NA0X
I(inerts) NI0 − NI = NI0
Total NT0 NT = NT0 + (d/a+ c/a− b/a− 1)NA0X
A similar table can be constructed for the molar flowrates in terms of conversion for a PFRor CSTR where we replace the Ni by ni. Note that the change in total number of moles(i.e. NT − NT0 or nT − nT0) can be calculated in terms of the conversion and is equalto δ0X , where δ = (d/a+ c/a− b/a− 1) is the change in moles per mole of A reacted.This quantity is especially important when working with gases in which case the changein total number of moles leads to a change in pressure with time in a batch reactor or in aPFR to a change in volumetric flowrate along the length of the reactor. The concentrationscan be determined by dividing the items in the table by V for a batch reaction or by v forthe case of a flowing system.
3.3.1 Change in pressure for a gas phase reaction in a constant vol-ume batch reactor
For a gas phase reaction, we can use a gas law to relate the pressure to the volume of thereaction at any given instant in the batch reactor. Remember that a vapour will take up theentire volume of the reactor so that the reaction volume equals the reactor volume, whichis usually fixed. Under most conditions of gas phase reactions (i.e. high temperature), theideal gas law provides a good approximation to the thermodynamic behaviour of the gas.The ideal gas law is
PV = NTRT (3.3.1)
where R is the ideal gas constant. We can write a similar equation, which applies at thestart of the reaction
P0V = NT0RT0 (3.3.2)
where we note that the volume of the reactor is not changing so that no subscript on V isused. The ratio of Equation 3.3.1 to 3.3.2 gives
P = P0NT
NT0
T
T0
(3.3.3)

3.3. STOICHIOMETRIC TABLES FOR CONVERSION 33
and plugging in the definition of NT from the stoichiometric Table 3.1 gives
P = P0 (1 + yA0δX)T
T0
(3.3.4)
which provides the desired relationship between pressure in the reactor and the conver-sion. In this set of lecture notes we only consider isothermal reactors, nevertheless it isworthwhile to note that Equation 3.3.4 could also be used for calculating how changes intemperature will alter the pressure in the reactor. For instance an energy balance wouldbe used to derive a relationship between T and X in a similar manner that we used thestoichiometric table to arrive at a relationship between NT and X .
3.3.2 Change in volumetric flowrate in a PFR
For a flowing vapour, we can use the ideal gas law to relate the volumetric flowrate tothe total molar flowrate. In this case, we take the time derivative of the ideal gas law togive the relationship between the volumetric and total molar flowrates at a given distancealong the PFR in terms of the pressure and temperature at the same location
Pv = nTRT (3.3.5)
Similarly at the inlet to the PFR we have
P0v = nT0RT0 (3.3.6)
Taking the ratio of Equation 3.3.5 to 3.3.6 gives
v = v0nTnT0
P0
P
T
T0
(3.3.7)
and using the stoichiometric table for replacing nT with an equation in terms ofX gives
v = v0 (1 + yA0δX)P0
P
T
T0
(3.3.8)
As above, Equation 3.3.8 could be used for calculating the volumetric flowrate in terms oftemperature and pressure. In a PFR, the change in pressure would need to be calculatedfrom a momentum balance and the temperature could be calculated in terms of conversionusing an energy balance. In this set of lecture notes we consider only isothermal reactorsand in addition the pressure drop term is usually small. In that case, Equation 3.3.8reduces to
v = v0 (1 + yA0δX) = v0 (1 + εX) (3.3.9)
where we have defined ε = yA0δ . Equation 3.3.9 is especially significant because theconcentrations of the components depend on the volumetric flowrate according to
CA =nAv
(3.3.10)
34 CHAPTER 3. RATE LAWS AND STOICHIOMETRY
Thus, if we plug in the equation for nA from the stoichiometric table, we find that
CA =nA0 − nA0X
v0 (1 + εX)= CA0
1−X1 + εX
(3.3.11)
Thus, the change in concentration of A with increasing conversion is not only due to los-ing moles to the reaction, but also occurs due to changes in volumetric flowrate, which, inturn, are due to changes in the total molar flowrate. This effect is emphasized by consid-ering the concentration of an inert as a function of conversion, which is given by
CI = CI01
1 + εX(3.3.12)
Thus the concentration of an inert will be reduced with increasing conversion if the re-action generates moles, and the concentration of the inert will increase if the reactionconsumes moles. Similarly, you should be able to generate a stoichiometric table forconcentrations, where for a reactant B
CB = CA0
NB0
NA0
− b
aX
1 + εX(3.3.13)
or for a product D
CD = CA0
ND0
NA0
+d
aX
1 + εX(3.3.14)
If a gas phase reaction is occurring, Equations 3.3.11 to 3.3.14 should to be used whensolving the design equation for either a CSTR or a PFR.
QuestionCarry out this analysis to find the equivalent relation as Equation 3.3.14 for CC .
3.4 Reaction Rate Equation or Rate Law
−rA depends on concentration and temperature. This dependence can be written in gen-eral terms as
− rA = k (T )× f (CA, CB, · · · ) (3.4.1)
where k (T ) (the rate constant) is a function of temperature. The rate law must be deter-mined experimentally. The common form of the rate law is:
− rA = kACαAC
βB (3.4.2)
where α is defined as the reaction order with respect to A and β the reaction order withrespect to B. The overall order of the reaction is given by the sum, n = α + β. Forinstance, for the reaction of
2 NO + O2 −→ 2 NO2
3.4. REACTION RATE EQUATION OR RATE LAW 35
the rate law is given by− rNO = kNOC
2NOCO2 (3.4.3)
The overall order for the reaction is equal to 3, whereas the reaction is 2nd order withrespect to NO and 1st order with respect to O2. Note that the exponents α, β are notalways equal to the stoichiometric coefficients except for the case where the reaction is anelementary step as discussed below.
Rate Constant UnitsThe units of k depend on the form of the rate law. We know that the rate musthave units of moles/(volume-time) so that k has units of (concentration)1−n/time.Thus when n is equal to 1, k has units of s−1, for n equal to 2, k has units ofmol−1 dm3 s−1, and when n is equal to 3, k has units of mol−2 dm6 s−1.
An elementary reaction is one that involves only a single step. For instance:
H + Br2 −→ HBr + Br
occurs when one hydronium ion collides and reacts with one bromine molecule. In thiscase the rate of reaction is given by k [H] [Br2]. Because the step involves the collision ofthe two molecules, the rate is proportional to each of the concentrations. A general ruleis thus that for an elementary reaction, the reaction order follows from the stoichiometriccoefficients. However, many reactions are not elementary but instead have a complex,multistep reaction mechanism. In this case the rate of reaction does not often follow fromthe stoichiometric coefficients. For example, for the reaction of
H2 + Br2 −→ 2 HBr
the rate law is given by
− rHBr =k1CH2C
3/2Br2
CHBr + k2CBr2(3.4.4)
This reaction occurs due to a free radical mechanism, which actually corresponds to aseries of elementary reaction steps as illustrated below.
Br2 −→ 2 Br•
Br•+H2 −→ HBr + H•
H•+Br2 −→ HBr + Br•
H•+HBr −→ H2 + Br•
2 Br• −→ Br2
In this case, the rate law and reaction order must be determined experimentally. If a reac-tion has several steps then the slowest elementary reaction step often is the rate-limiting(or rate determining) step.
In some cases, non-elementary reactions have stoichiometric coefficients identical to theorders, for example for the reaction of
2 NO + O2 −→ 2 NO2
the rate is equal to kAC2NOCO2 .

36

3.5. PROBLEMS 37
3.5 Problems
1. The reaction:
2 A + 3 B −→ 5 C
is carried out in a reactor. If at a particular point, the rate of disappearance of A is10 mol dm−3 s−1, What are the rates of B and C?
2. (a) The reaction between A + B is first order in A and second order in B. Give therate expression, and then find the units of k (assume time in minutes)
(b) A reaction between P and Q is 3/2 order in P and order −1 in Q. Give the rateexpression and find the units of k (assume time in minutes).
3. (a) If k = 5.7 × 10⁻⁴ mol−1 dm3 s−1 calculate the rate of reaction which is firstorder in both A and B when [A] = 5.0 × 10⁻² mol dm−3 and [B] = 2.0 ×10⁻² mol dm−3.
(b) If [A] had been 5.0 × 10⁻⁴ mol dm−3 and [B] had been 2.0 × 10⁻³ mol dm−3
what would the rate have been?
(c) What conclusion can you draw from this?
4. Base hydrolyses of amino-acid esters have two contributing reactions:
• OH− reacting with protonated ester, HE +, and
• OH− reacting with unprotonated ester, E.
At 25◦C the rate constant for the protonated ester is 1550 mol−1 dm3 min−1 andthe rate constant for the unprotonated ester is 42 mol−1 dm3 min−1. At pH = 9.30,[OH−] = 2.0 × 10⁻⁵ mol dm−3, and if the total [ester] = 2 × 10⁻² mol dm−3, then[HE +] = 5× 10⁻⁴ mol dm−3, and [E] = 195× 10−4 mol dm−3.
(a) Calculate the contributions to the overall rate from the two reactions.
(b) What conclusions can be drawn?
5. Construct a stoichiometric table for the following batch reaction and derive expres-sions relating the concentrations of the reactants to the conversion.
N2 + 3 H2 ←→ 2 NH3
6. Soap consists of the sodium and potassium salts of various fatty acids such as oleic,stearic, palmitic, lauric, and myristic acids. The saponification for the formation ofsoap from aqueous caustic soda and glyceryl stearate is:
3 NaOH(aq) + (C17H35COO)3C3H5 −→ 3 C17H35COONa + C3H5(OH)3
Letting X represent the conversion of sodium hydroxide (the moles of sodium hy-doxide reacted per mole of sodium hydroxide initially present), set up a stoichio-metric table expressing the concentration of each species in terms of its initial con-centration and the conversion X .
7. Using the information from question 6, if the initial mixture consists solely ofNaOH at a concentration of 10 mol dm−3 and of glyceryl stearate at a concentra-tion of 2 mol dm−3, what is the concentration of glycerine when the conversion ofNaOH is (a) 20% and (b) 90%?

38
Chapter 4Experimental Determination of Rate LawParameters
Contents4.1 Introduction . . . . . . . . . . . . . . . . . . . . . . . . . . . . . . . 41
4.2 Experimental Determination of Rates . . . . . . . . . . . . . . . . . 41
4.3 Determination of Reaction Orders by Inspection . . . . . . . . . . . 42
4.4 Differential Methods of Analysis . . . . . . . . . . . . . . . . . . . . 42
4.4.1 For Rates Dependent on the Concentration of Only One Species 42
4.4.2 For More Complex Reactions (Dependence on CA and CB) . . 43
4.4.3 Method of Initial Rates . . . . . . . . . . . . . . . . . . . . . . 44
4.5 Integral Methods . . . . . . . . . . . . . . . . . . . . . . . . . . . . . 44
4.5.1 Zeroth Order Reaction by Integral Method . . . . . . . . . . . 45
4.5.2 First Order Irreversible Reaction by Integral Method . . . . . . 45
4.5.3 Second Order Reaction by Integral Method . . . . . . . . . . . 46
4.6 Method of Half-Lives . . . . . . . . . . . . . . . . . . . . . . . . . . 49
4.7 Problems . . . . . . . . . . . . . . . . . . . . . . . . . . . . . . . . . 51
39

40
4.1. INTRODUCTION 41
4.1 Introduction
As discussed in the previous chapters, it is essential to determine the reaction rate equationexperimentally. This chapter looks at several approaches to experimentally evaluate ratedata using the differential method, the method of initial rates, integral methods, and bythe method of half-lives. The differential and integral methods only require one reactorrun to determine the rate constants, whereas the methods of initial rates and of half-livesrequire multiple runs to determine the rate constants. In each of these methods, data frombatch reactors are analysed. As mentioned earlier, batch reactors usually occur as constantvolume processes in which case the design equation reduces to the form
rA =dCAd t
(4.1.1)
so that the constants in the rate law can be evaluated from experimental data of howconcentration or reactants (or products) varies with time in batch reactors.
4.2 Experimental Determination of Rates
In some of the methods described below, we will need to obtain experimental measure-ments of the derivative −dCA/d t. There are several ways to do this. In either approach,first concentration data for A must be measured as a function of time in the batch reactor.Once this function is known, the following approaches can be used
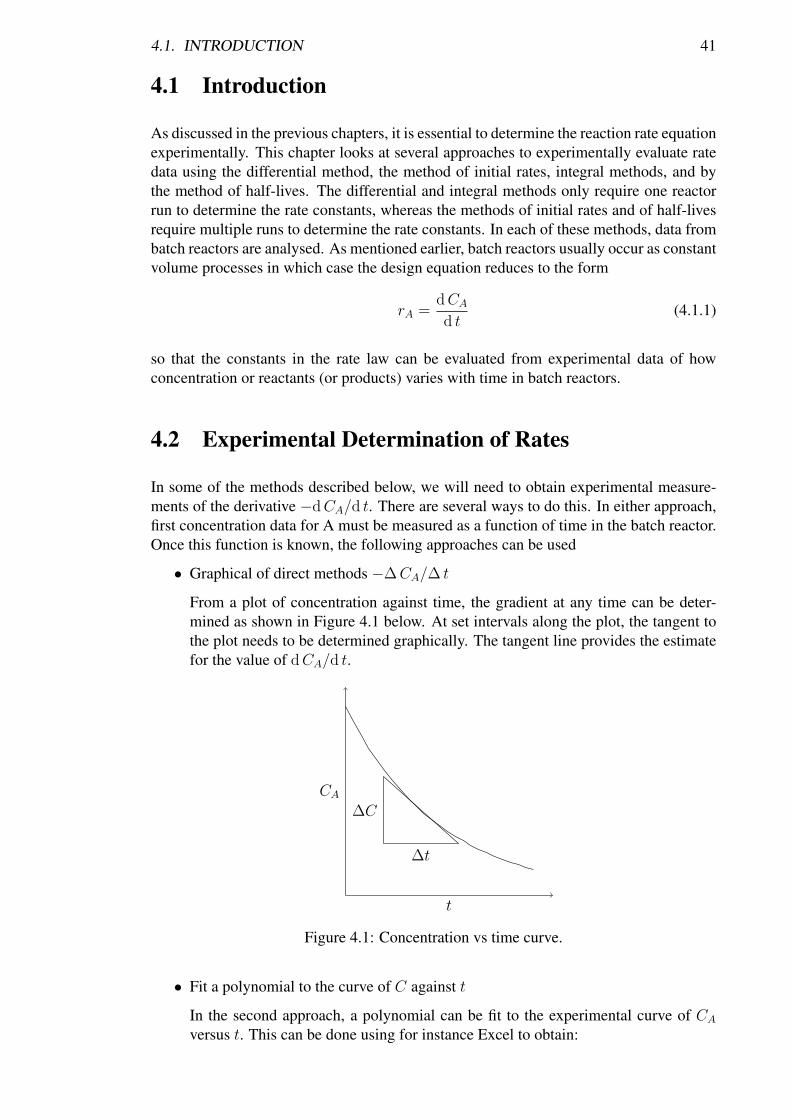
• Graphical of direct methods −∆CA/∆ t
From a plot of concentration against time, the gradient at any time can be deter-mined as shown in Figure 4.1 below. At set intervals along the plot, the tangent tothe plot needs to be determined graphically. The tangent line provides the estimatefor the value of dCA/d t.
CA
t
∆C
∆t
Figure 4.1: Concentration vs time curve.
• Fit a polynomial to the curve of C against t
In the second approach, a polynomial can be fit to the experimental curve of CAversus t. This can be done using for instance Excel to obtain:
42 CHAPTER 4. DETERMINATION OF RATE LAW PARAMETERS
CA = a0 + a1t+ a2t2 + · · ·
Once the equation is known, it can be differentiated.
4.3 Determination of Reaction Orders by Inspection
In some cases the reaction order can be determined by inspection, for instance considerthe experimental data given in Table 4.1 below. In this case the rate doubles when con-centration doubles. This means that the rate is proportional to concentration thus the rateequals k [CA]1. k can be determined from any one of the data points once the reactionorder is known. In Table 4.2, experimental data is given for the case when concentrationdoubles, the rate increases by a factor of 4. In this case, the rate is given by a second orderlaw equal to k [CA]2. In Table 4.3 below, when the concentration changes, the rate staysthe same. This corresponds to a zeroth order reaction in A, where rate is equal to k [CA]0.
Table 4.1: First order reaction.
[CA] 1.0 2.0 4.0 12.0rate 0.05 0.10 0.20 0.60
Table 4.2: Second order reaction.
[CA] 4.0 8.0 16.0 32.0rate 3.0 12.0 48.0 192.0
Table 4.3: Zero order reaction.
[CA] 6.0 12.0 24.0 48.0rate 5.0 4.9 5.1 5.0
4.4 Differential Methods of Analysis
4.4.1 For Rates Dependent on the Concentration of Only One Species
The differential method starts with the design equation for a batch reactor at constantvolume (Equation 1.2.9) combined with the rate equation for an arbitrary order, α. (Re-member that α does not have to be an integer):
− rA = −dCAd t
= kACαA (4.4.1)
4.4. DIFFERENTIAL METHODS OF ANALYSIS 43
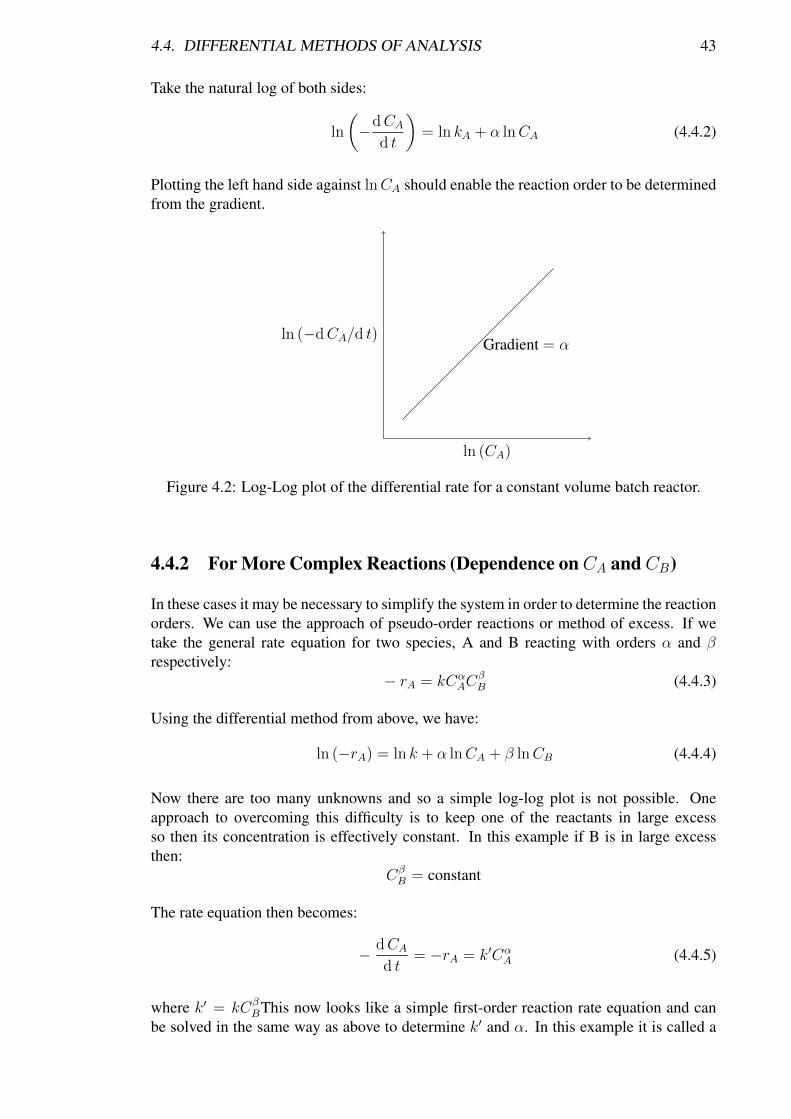
Take the natural log of both sides:
ln
(−dCA
d t
)= ln kA + α lnCA (4.4.2)
Plotting the left hand side against lnCA should enable the reaction order to be determinedfrom the gradient.
ln (−dCA/d t)
ln (CA)
Gradient = α
Figure 4.2: Log-Log plot of the differential rate for a constant volume batch reactor.
4.4.2 For More Complex Reactions (Dependence onCA andCB)
In these cases it may be necessary to simplify the system in order to determine the reactionorders. We can use the approach of pseudo-order reactions or method of excess. If wetake the general rate equation for two species, A and B reacting with orders α and βrespectively:
− rA = kCαAC
βB (4.4.3)
Using the differential method from above, we have:
ln (−rA) = ln k + α lnCA + β lnCB (4.4.4)
Now there are too many unknowns and so a simple log-log plot is not possible. Oneapproach to overcoming this difficulty is to keep one of the reactants in large excessso then its concentration is effectively constant. In this example if B is in large excessthen:
CβB = constant
The rate equation then becomes:
− dCAd t
= −rA = k′CαA (4.4.5)
where k′ = kCβBThis now looks like a simple first-order reaction rate equation and can
be solved in the same way as above to determine k′ and α. In this example it is called a
44 CHAPTER 4. DETERMINATION OF RATE LAW PARAMETERS
pseudo- 1st order reaction and k′ is the pseudo 1st-order rate constant. The value of β canthen be found by repeating with different values of CB, where
ln k′ = ln k + β lnCB (4.4.6)
Thus a plot of ln k′ versus lnCB will yield values for k and β. Alternatively, the sameprocedure can be done when using an excess of A, in which case Cα
A is a constant. In thiscase
− dCAd t
= −rA = k′′CβB (4.4.7)
where k′′ = kCαA.
4.4.3 Method of Initial Rates
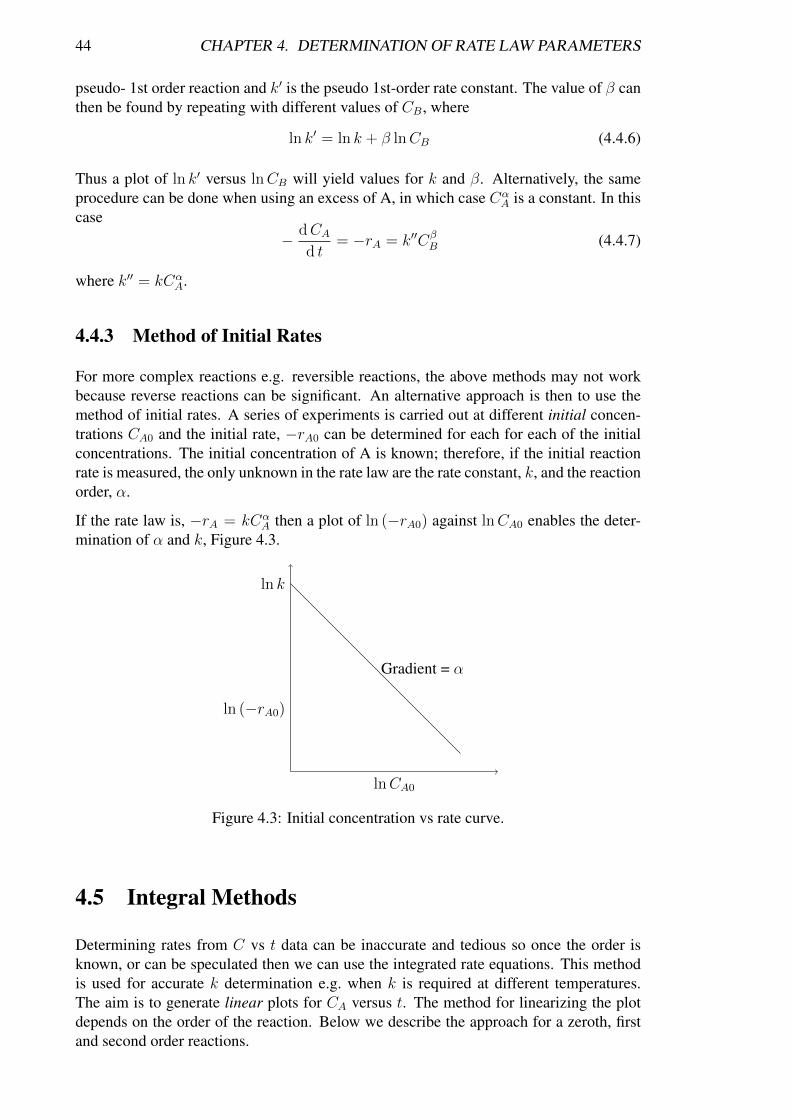
For more complex reactions e.g. reversible reactions, the above methods may not workbecause reverse reactions can be significant. An alternative approach is then to use themethod of initial rates. A series of experiments is carried out at different initial concen-trations CA0 and the initial rate, −rA0 can be determined for each for each of the initialconcentrations. The initial concentration of A is known; therefore, if the initial reactionrate is measured, the only unknown in the rate law are the rate constant, k, and the reactionorder, α.
If the rate law is, −rA = kCαA then a plot of ln (−rA0) against lnCA0 enables the deter-
mination of α and k, Figure 4.3.
ln (−rA0)
lnCA0
Gradient = α
ln k
Figure 4.3: Initial concentration vs rate curve.
4.5 Integral Methods
Determining rates from C vs t data can be inaccurate and tedious so once the order isknown, or can be speculated then we can use the integrated rate equations. This methodis used for accurate k determination e.g. when k is required at different temperatures.The aim is to generate linear plots for CA versus t. The method for linearizing the plotdepends on the order of the reaction. Below we describe the approach for a zeroth, firstand second order reactions.
4.5. INTEGRAL METHODS 45
4.5.1 Zeroth Order Reaction by Integral Method
For a zeroth order constant volume batch reactor, the design equation is given by
dCAd t
= −k (4.5.1)
Integrating with CA = CA0 at t = 0, we obtain:
CA0 − CA = CA0X = kt (4.5.2)
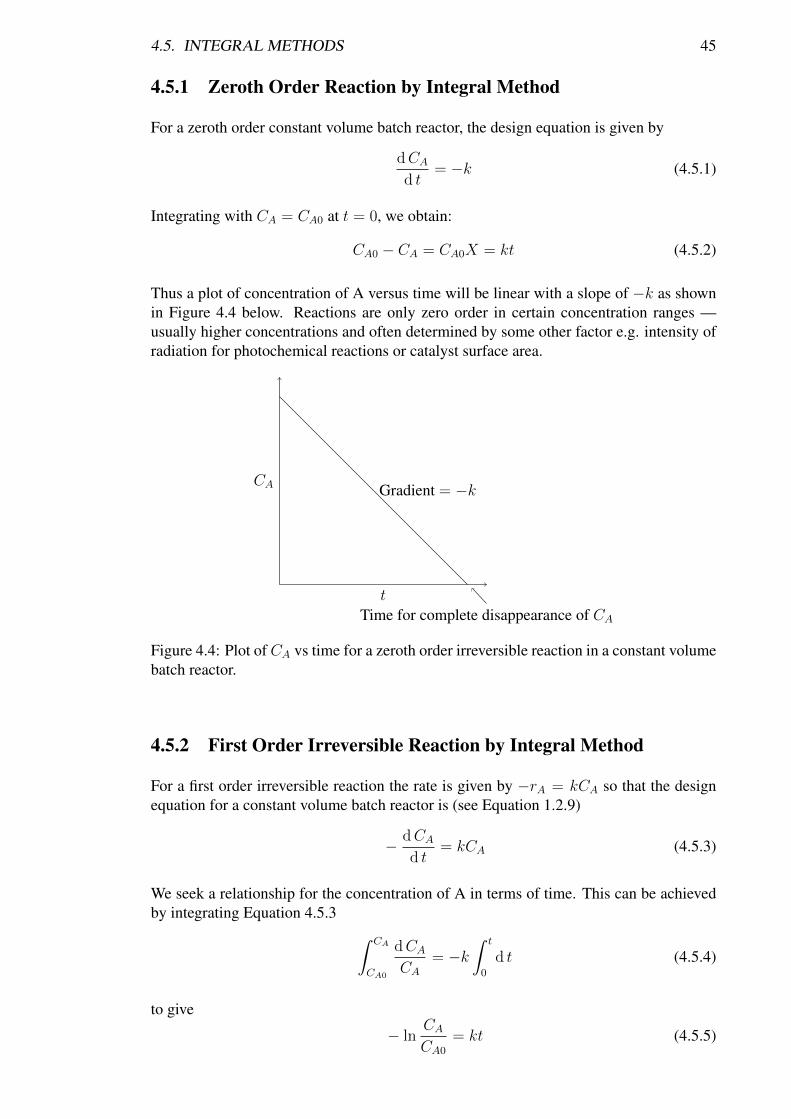
Thus a plot of concentration of A versus time will be linear with a slope of −k as shownin Figure 4.4 below. Reactions are only zero order in certain concentration ranges —usually higher concentrations and often determined by some other factor e.g. intensity ofradiation for photochemical reactions or catalyst surface area.
CA
t
Gradient = −k
Time for complete disappearance of CA
Figure 4.4: Plot of CA vs time for a zeroth order irreversible reaction in a constant volumebatch reactor.
4.5.2 First Order Irreversible Reaction by Integral Method
For a first order irreversible reaction the rate is given by −rA = kCA so that the designequation for a constant volume batch reactor is (see Equation 1.2.9)
− dCAd t
= kCA (4.5.3)
We seek a relationship for the concentration of A in terms of time. This can be achievedby integrating Equation 4.5.3 ∫ CA
CA0
dCACA
= −k∫ t
0
d t (4.5.4)
to give
− lnCACA0
= kt (4.5.5)
46 CHAPTER 4. DETERMINATION OF RATE LAW PARAMETERS
− ln (CA/CA0)
t
Gradient = k
Figure 4.5: Plot of − ln (CA/CA0) vs time for a first order reaction in a constant volumebatch reactor.
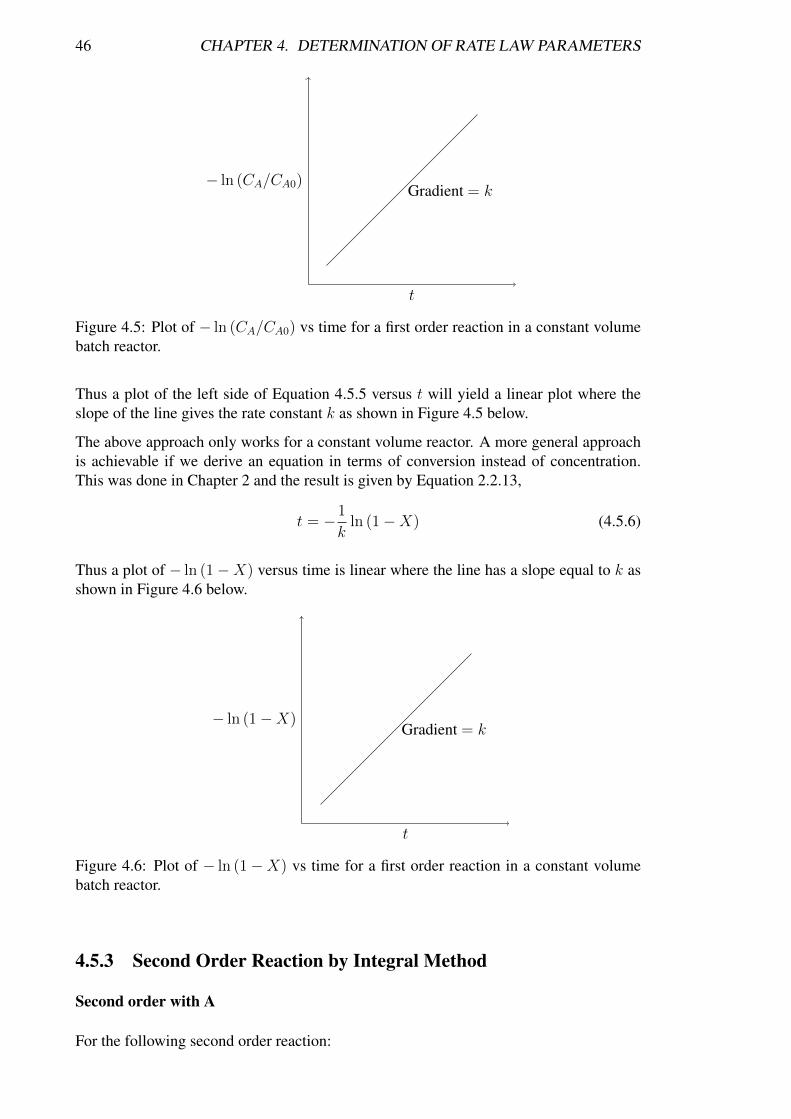
Thus a plot of the left side of Equation 4.5.5 versus t will yield a linear plot where theslope of the line gives the rate constant k as shown in Figure 4.5 below.
The above approach only works for a constant volume reactor. A more general approachis achievable if we derive an equation in terms of conversion instead of concentration.This was done in Chapter 2 and the result is given by Equation 2.2.13,
t = −1
kln (1−X) (4.5.6)
Thus a plot of − ln (1−X) versus time is linear where the line has a slope equal to k asshown in Figure 4.6 below.
− ln (1−X)
t
Gradient = k
Figure 4.6: Plot of − ln (1−X) vs time for a first order reaction in a constant volumebatch reactor.
4.5.3 Second Order Reaction by Integral Method
Second order with A
For the following second order reaction:
4.5. INTEGRAL METHODS 47
A + A −→ products
The design equation for constant volume batch reactor is
− dCAd t
= kC2A (4.5.7)
which can be rearranged and integrated to give∫ CA
CA0
dCAC2A
= − k∫ t
0
d t
1
CA− 1
CA0
= kt (4.5.8)
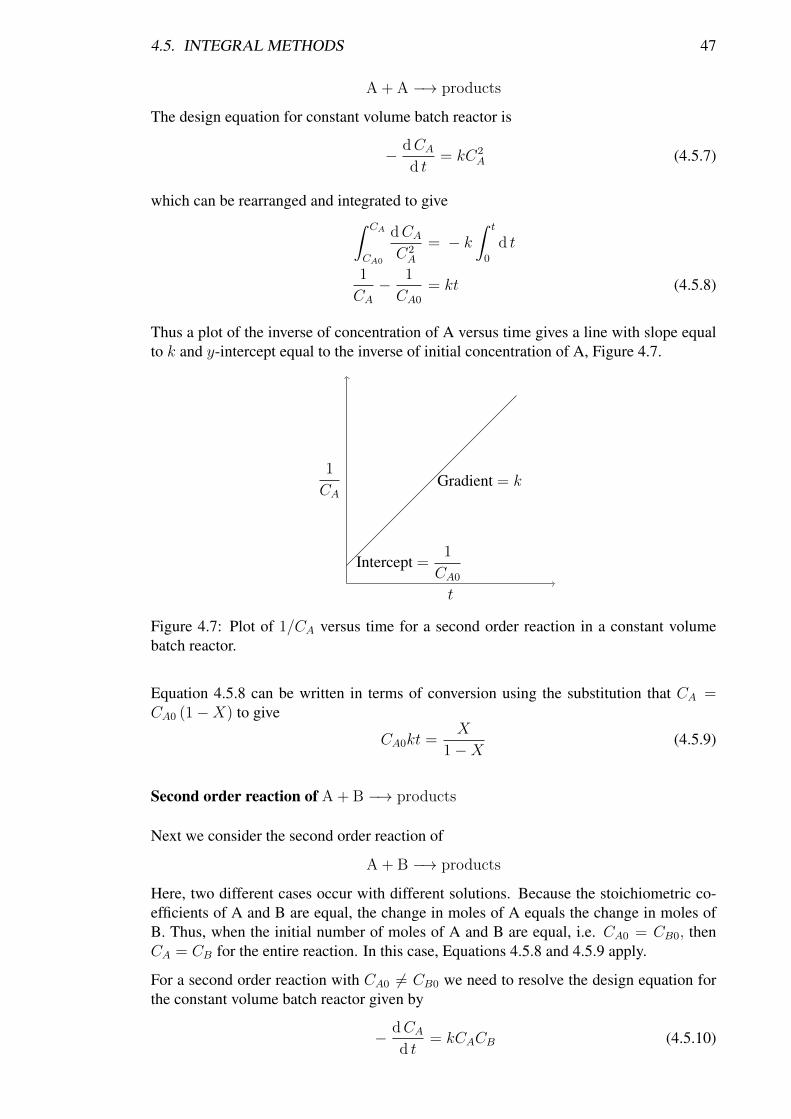
Thus a plot of the inverse of concentration of A versus time gives a line with slope equalto k and y-intercept equal to the inverse of initial concentration of A, Figure 4.7.
1
CA
t
Gradient = k
Intercept =1
CA0
Figure 4.7: Plot of 1/CA versus time for a second order reaction in a constant volumebatch reactor.
Equation 4.5.8 can be written in terms of conversion using the substitution that CA =CA0 (1−X) to give
CA0kt =X
1−X(4.5.9)
Second order reaction of A + B −→ products
Next we consider the second order reaction of
A + B −→ products
Here, two different cases occur with different solutions. Because the stoichiometric co-efficients of A and B are equal, the change in moles of A equals the change in moles ofB. Thus, when the initial number of moles of A and B are equal, i.e. CA0 = CB0, thenCA = CB for the entire reaction. In this case, Equations 4.5.8 and 4.5.9 apply.
For a second order reaction with CA0 6= CB0 we need to resolve the design equation forthe constant volume batch reactor given by
− dCAd t
= kCACB (4.5.10)
48 CHAPTER 4. DETERMINATION OF RATE LAW PARAMETERS
According to the stoichiometric table, we have CA = CA0 (1−X) and CB = CB0 −CA0X and dCA = −CA0dX . Substituting these relations into the design equation wehave
CA0dX
d t= k (CA0 − CA0X) (CB0 − CA0X) (4.5.11)
In order to simplify the equation we make the substitution M = CB0/CA0, then
dX
d t= kCA0 (1−X) (M −X) (4.5.12)
which gives upon rearrangement∫ XA
0
dX
(1−X) (M −X)= kCA0
∫ t
0
d t (4.5.13)
Below we provide the solution to the integration given by Equation 4.5.13 using themethod of partial fractions. The integrand in Equation 4.5.13 needs to be expanded asthe sum of two separate fractions1. Thus, we postulate that we can solve the integrandas
kCA0
∫ t
0
d t =
∫ XA
0
dX
(1−X) (M −X)
=
∫ XA
0
[(1
M − 1
)(1
1−X
)−(
1
M − 1
)(1
M −X
)]dX
=1
M − 1
∫ XA
0
[1
1−X− 1
M −X
]dX
=1
M − 1[− ln (1−X) + ln (M −X)]XA
0
=1
M − 1
[ln
(M −XA
1−XA
)− lnM
]kCA0t =
1
M − 1ln
(M −XA
M (1−XA)
)(4.5.14)
Note that Equation 4.5.14 diverges when M = 1, which corresponds to the case whenCA0 = CB0, which we considered earlier.
Thus, in order to determine k by the integral method we would need to measure theconversion X as a function of time for given values of CA0 and CB0. We could then
1Solving partial fractions,
1
(1−X) (M −X)=
P
1−X+
Q
M −X=
P (M −X) +Q (1−X)
(1−X) (M −X)
Therefore,1 = P (M −X) +Q (1−X)
Thus,
X0 : 1 = PM +Q
X1 : 0 = −P −Q
Simultaneously solving for P and Q gives P = 1/ (M − 1) and Q = −1/ (M − 1).

4.6. METHOD OF HALF-LIVES 49
plot the left hand side of Equation 4.5.14 versus time. The slope of the line equal tokCA0 can be used to determine k. Alternatively, we could construct the plot in termsof concentrations of A and B. In this case, we first back substitute M = CB0/CA0 intoEquation 4.5.14, and then you should show that:
lnCBCA0
CB0CA= (CB0 − CA0) kt (4.5.15)
In this case, in order to determine k, one would measure CA and CB as a function of timeand then plot the left hand side of Equation 4.5.15 versus t.
A key point is that the method to use depends on what is easiest to measure. If con-centrations of A and B are experimentally accessible, Equation 4.5.15 would be used forregressing the rate parameters. Alternatively, if only the conversion could be determinedin terms of the concentration of A, Equation 4.5.14 would be used. For gas phase reac-tions in batch reactors, the pressure in the batch reactor is the experimentally accessiblevariable. In this case, the design equation would need to be rewritten in terms of pressureinstead of conversion and then any of the methods illustrated above could be used fordetermining the rate parameters. This is left as an important exercise for you to do. Forfurther details see Fogler, Chapter 5.
4.6 Method of Half-Lives
In some cases, an experimentally measured property is the half-life, t1/2, which is definedas the time for the concentration of the reactant to fall to half its initial value. Knowledgeof the half life can also be used for calculating the rate parameters. Consider the designequation for the constant volume batch reactor:
− dCAd t
= −rA = kCαA (4.6.1)
(Note for 2 or more reactants, the method of pseudo-order reactions can be used using thesame approach as outlined below). Integrating the design equation with CA = CA0 whent = 0 yields:
t =1
k (α− 1)
(1
Cα−1A
− 1
Cα−1A0
)(4.6.2)
and factoring out a factor of CA0
t =1
kCα−1A0 (α− 1)
[(CA0
CA
)α−1
− 1
](4.6.3)
We then use the definition of half-life, t = t1/2 when CA = 1/2CA0. Substitution of thiscondition into Equation 4.6.3 gives
t1/2 =2α−1 − 1
k (α− 1)
1
Cα−1A0
(4.6.4)
50 CHAPTER 4. DETERMINATION OF RATE LAW PARAMETERS
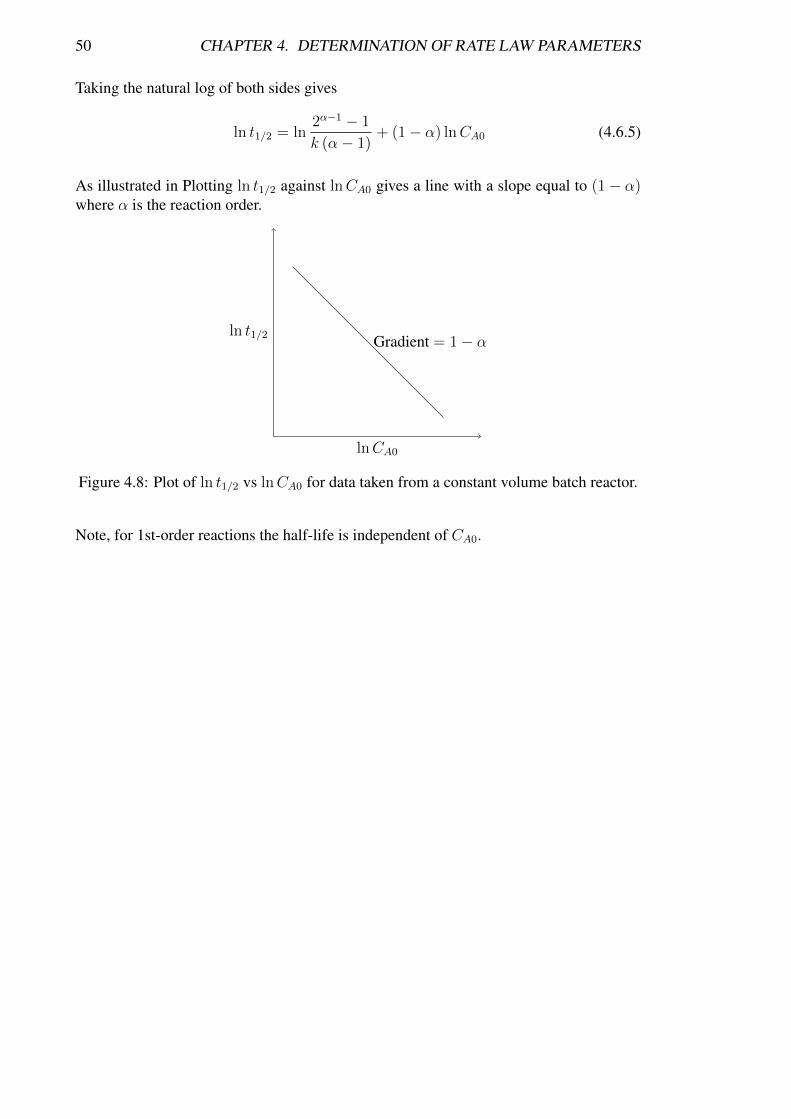
Taking the natural log of both sides gives
ln t1/2 = ln2α−1 − 1
k (α− 1)+ (1− α) lnCA0 (4.6.5)
As illustrated in Plotting ln t1/2 against lnCA0 gives a line with a slope equal to (1− α)where α is the reaction order.
ln t1/2
lnCA0
Gradient = 1− α
Figure 4.8: Plot of ln t1/2 vs lnCA0 for data taken from a constant volume batch reactor.
Note, for 1st-order reactions the half-life is independent of CA0.
4.7. PROBLEMS 51
4.7 Problems
1. The half-life for the (first-order) radioactive decay of 14C is 5730 years. An archae-ological sample contained wood that had only 72% of the 14C found in the livingtrees. What is its age?
[2720 years]
2. The following reaction is irreversible and first-order and can be described by therelation:
A −→ products
From the following concentration/time data, determine the rate constant. What isthe half-life of the reaction?
t/s 0 100 500 1000 2000CA/mol dm−3 0.100 0.0951 0.0779 0.0607 0.0368
[5× 10⁻⁴ s−1; 1386 s]
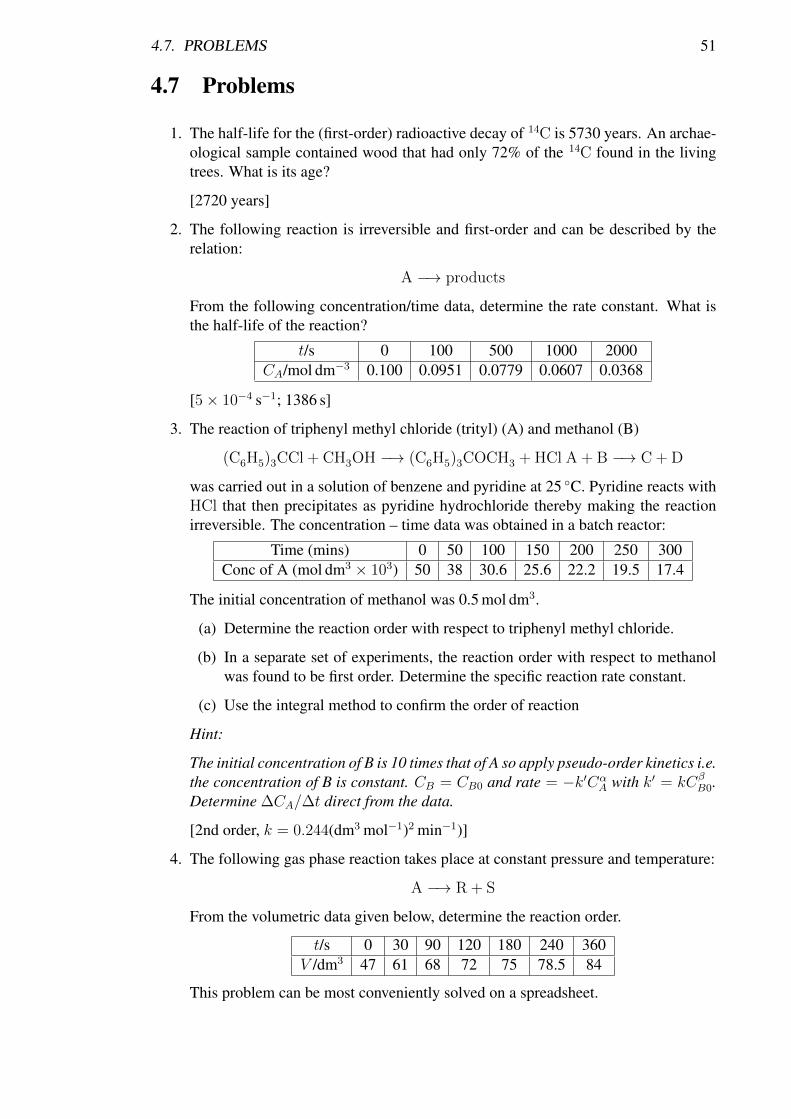
3. The reaction of triphenyl methyl chloride (trityl) (A) and methanol (B)
(C6H5)3CCl + CH3OH −→ (C6H5)3COCH3 + HCl A + B −→ C + D
was carried out in a solution of benzene and pyridine at 25 ◦C. Pyridine reacts withHCl that then precipitates as pyridine hydrochloride thereby making the reactionirreversible. The concentration – time data was obtained in a batch reactor:
Time (mins) 0 50 100 150 200 250 300Conc of A (mol dm3 × 103) 50 38 30.6 25.6 22.2 19.5 17.4
The initial concentration of methanol was 0.5 mol dm3.
(a) Determine the reaction order with respect to triphenyl methyl chloride.
(b) In a separate set of experiments, the reaction order with respect to methanolwas found to be first order. Determine the specific reaction rate constant.
(c) Use the integral method to confirm the order of reaction
Hint:
The initial concentration of B is 10 times that of A so apply pseudo-order kinetics i.e.the concentration of B is constant. CB = CB0 and rate = −k′Cα
A with k′ = kCβB0.
Determine ∆CA/∆t direct from the data.
[2nd order, k = 0.244(dm3 mol−1)2 min−1)]
4. The following gas phase reaction takes place at constant pressure and temperature:
A −→ R + S
From the volumetric data given below, determine the reaction order.
t/s 0 30 90 120 180 240 360V /dm3 47 61 68 72 75 78.5 84
This problem can be most conveniently solved on a spreadsheet.

52
Chapter 5Temperature Dependence of ReactionRates
Contents5.1 Introduction . . . . . . . . . . . . . . . . . . . . . . . . . . . . . . . 55
5.2 Arrhenius Equation . . . . . . . . . . . . . . . . . . . . . . . . . . . 55
5.3 Example Calculation of the Arrhenius Parameters . . . . . . . . . . 56
5.4 Problems . . . . . . . . . . . . . . . . . . . . . . . . . . . . . . . . . 59
53

54
5.1. INTRODUCTION 55
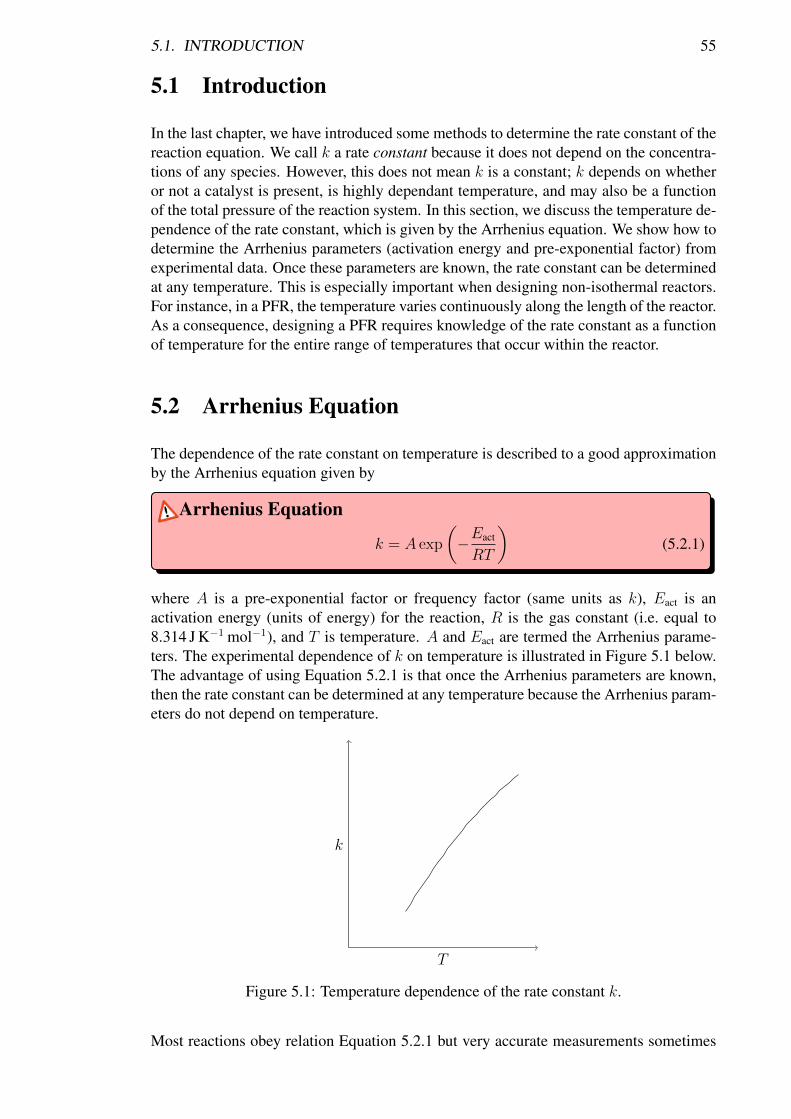
5.1 Introduction
In the last chapter, we have introduced some methods to determine the rate constant of thereaction equation. We call k a rate constant because it does not depend on the concentra-tions of any species. However, this does not mean k is a constant; k depends on whetheror not a catalyst is present, is highly dependant temperature, and may also be a functionof the total pressure of the reaction system. In this section, we discuss the temperature de-pendence of the rate constant, which is given by the Arrhenius equation. We show how todetermine the Arrhenius parameters (activation energy and pre-exponential factor) fromexperimental data. Once these parameters are known, the rate constant can be determinedat any temperature. This is especially important when designing non-isothermal reactors.For instance, in a PFR, the temperature varies continuously along the length of the reactor.As a consequence, designing a PFR requires knowledge of the rate constant as a functionof temperature for the entire range of temperatures that occur within the reactor.
5.2 Arrhenius Equation
The dependence of the rate constant on temperature is described to a good approximationby the Arrhenius equation given by
Arrhenius Equation
k = A exp
(−Eact
RT
)(5.2.1)
where A is a pre-exponential factor or frequency factor (same units as k), Eact is anactivation energy (units of energy) for the reaction, R is the gas constant (i.e. equal to8.314 J K−1 mol−1), and T is temperature. A and Eact are termed the Arrhenius parame-ters. The experimental dependence of k on temperature is illustrated in Figure 5.1 below.The advantage of using Equation 5.2.1 is that once the Arrhenius parameters are known,then the rate constant can be determined at any temperature because the Arrhenius param-eters do not depend on temperature.
k
T
Figure 5.1: Temperature dependence of the rate constant k.
Most reactions obey relation Equation 5.2.1 but very accurate measurements sometimes
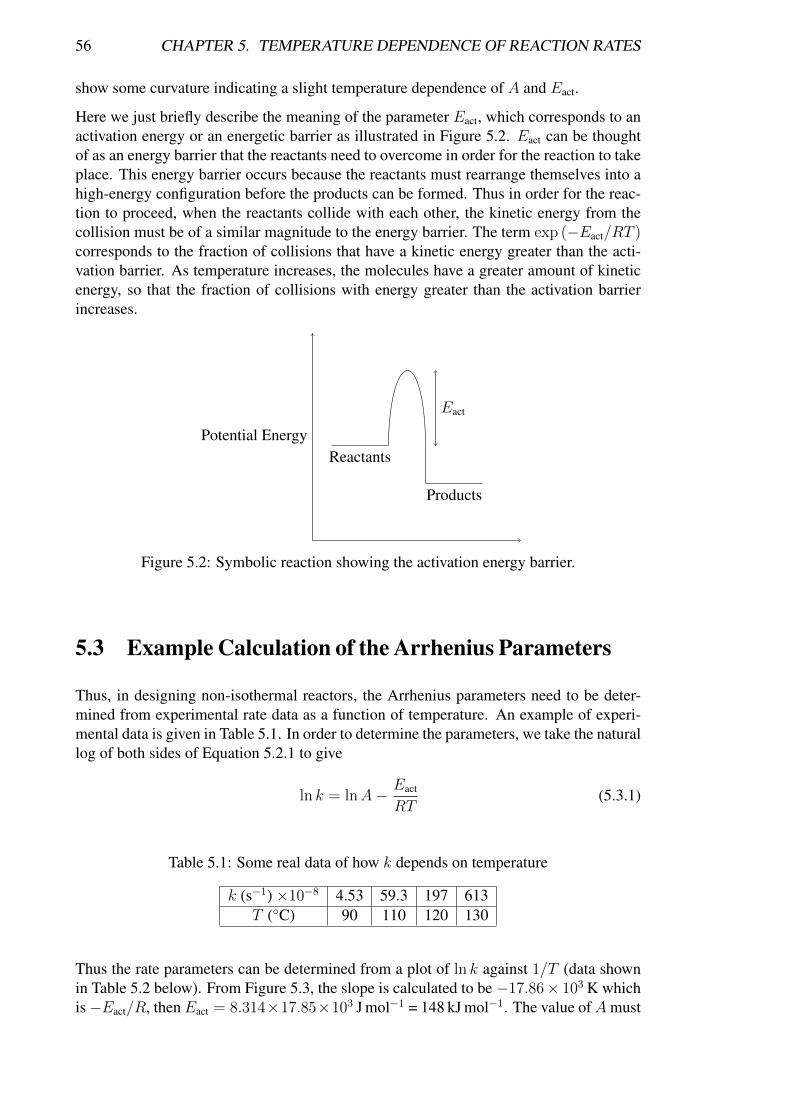
56 CHAPTER 5. TEMPERATURE DEPENDENCE OF REACTION RATES
show some curvature indicating a slight temperature dependence of A and Eact.
Here we just briefly describe the meaning of the parameter Eact, which corresponds to anactivation energy or an energetic barrier as illustrated in Figure 5.2. Eact can be thoughtof as an energy barrier that the reactants need to overcome in order for the reaction to takeplace. This energy barrier occurs because the reactants must rearrange themselves into ahigh-energy configuration before the products can be formed. Thus in order for the reac-tion to proceed, when the reactants collide with each other, the kinetic energy from thecollision must be of a similar magnitude to the energy barrier. The term exp (−Eact/RT )corresponds to the fraction of collisions that have a kinetic energy greater than the acti-vation barrier. As temperature increases, the molecules have a greater amount of kineticenergy, so that the fraction of collisions with energy greater than the activation barrierincreases.
Potential EnergyReactants
Products
Eact
Figure 5.2: Symbolic reaction showing the activation energy barrier.
5.3 Example Calculation of the Arrhenius Parameters
Thus, in designing non-isothermal reactors, the Arrhenius parameters need to be deter-mined from experimental rate data as a function of temperature. An example of experi-mental data is given in Table 5.1. In order to determine the parameters, we take the naturallog of both sides of Equation 5.2.1 to give
ln k = lnA− Eact
RT(5.3.1)
Table 5.1: Some real data of how k depends on temperature
k (s−1) ×10−8 4.53 59.3 197 613T (◦C) 90 110 120 130
Thus the rate parameters can be determined from a plot of ln k against 1/T (data shownin Table 5.2 below). From Figure 5.3, the slope is calculated to be −17.86× 10³ K whichis−Eact/R, thenEact = 8.314×17.85×103 J mol−1 = 148 kJ mol−1. The value ofAmust
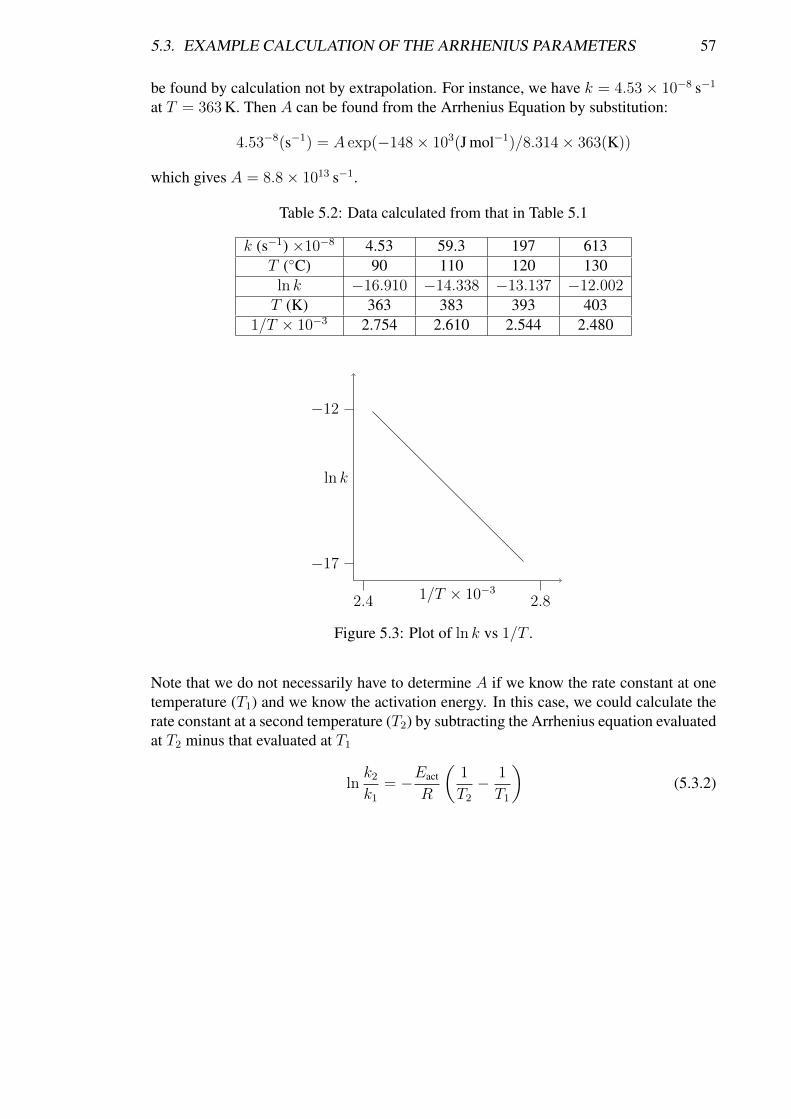
5.3. EXAMPLE CALCULATION OF THE ARRHENIUS PARAMETERS 57
be found by calculation not by extrapolation. For instance, we have k = 4.53× 10⁻⁸ s−1
at T = 363 K. Then A can be found from the Arrhenius Equation by substitution:
4.53−8(s−1) = A exp(−148× 103(J mol−1)/8.314× 363(K))
which gives A = 8.8× 10¹³ s−1.
Table 5.2: Data calculated from that in Table 5.1
k (s−1) ×10−8 4.53 59.3 197 613T (◦C) 90 110 120 130
ln k −16.910 −14.338 −13.137 −12.002T (K) 363 383 393 403
1/T × 10−3 2.754 2.610 2.544 2.480
ln k
1/T × 10−3
−12
−17
2.4 2.8
Figure 5.3: Plot of ln k vs 1/T .
Note that we do not necessarily have to determine A if we know the rate constant at onetemperature (T1) and we know the activation energy. In this case, we could calculate therate constant at a second temperature (T2) by subtracting the Arrhenius equation evaluatedat T2 minus that evaluated at T1
lnk2
k1
= −Eact
R
(1
T2
− 1
T1
)(5.3.2)

58

5.4. PROBLEMS 59
5.4 Problems
1. The rate constant for a particular reaction is 2.80×10⁻³ mol−1 dm3 s−1 at 30 ◦C and1.38−2 mol−1 dm3 s−1 at 50 ◦C. Evaluate the Arrhenius parameters for this reaction.What is the order of reaction? R = 8.314 J K−1 mol−1.
2. Milk is pasteurised if it is heated to 63 ◦C for 30 minutes, but if it is heated to 74 ◦Cit only needs 15 seconds for the same result. Find the activation energy of thissterilisation process. R = 8.314 J K−1 mol−1.
3. A ‘rule of thumb’ in chemical kinetics is that the rate of reaction doubles if the tem-perature increases by 10 K. At around 300 K, what value for the activation energydoes this imply?
[53.6 kJ mol−1]
4. The rate of the second-order decomposition of ethanal (CH3CHO) was measuredover the temperature range 700 to 1000 K and the rate constants are reported below:
T /K 700 730 760 790 810 840 910 1000k/mol−1 dm3 s−1 0.011 0.035 0.105 0.343 0.789 2.17 20.0 145
Find the activation energy and the pre-exponential factor.
[184 kJ mol−1; 5.7× 10¹¹ mol−1 dm3 s−1]

60

Chapter 6Multiple Reactions
Contents6.1 Introduction . . . . . . . . . . . . . . . . . . . . . . . . . . . . . . . 63
6.2 Yield and Selectivity . . . . . . . . . . . . . . . . . . . . . . . . . . . 63
6.3 Reversible Reactions . . . . . . . . . . . . . . . . . . . . . . . . . . . 64
6.4 Parallel Reactions . . . . . . . . . . . . . . . . . . . . . . . . . . . . 66
6.5 Series Reactions . . . . . . . . . . . . . . . . . . . . . . . . . . . . . 70
6.6 Problems . . . . . . . . . . . . . . . . . . . . . . . . . . . . . . . . . 75
61

62
6.1. INTRODUCTION 63
6.1 Introduction
In chemical reactors, it is mostly inevitable that multiple reactions will occur, some de-sired and some not. One of the key tasks of chemical engineers is to design and operatethe reactor such that the unwanted side reactions are minimised in order to achieve amaximum economic success. The discussion in this chapter is concerned with optimizingreversible reactions such as
A −−⇀↽−− R
reactions that occur in series, such as
A −→ R −→ S
and reactions that occur in parallel, such as
A −→ RA −→ S
For each of these reaction sequences, we first show how to calculate the conversion as afunction of time in a constant volume batch reactor from the design equation. After this,we show how to optimize the reactions for the production of a specific product in flowingreactors by introducing the concepts of yield and selectivity.
6.2 Yield and Selectivity
Yield and selectivity are parameters used to characterize the extent of a desired reactionover any unwanted side reactions. The selectivity is defined as the ratio of the rate offormation of the desired product R over the rate of formation of the undesired productS:
SelectivitySRS =
rRrS
(6.2.1)
Note that in the literature, another definition of selectivity can be found in terms of molenumbers or molar flowrates. For a batch reactor, the selectivity is sometimes definedas the ratio of moles of desired product to moles of undesired product remaining at theend of the reaction. For a flowing system, the selectivity is defined as the ratio of molarflowrates of desired to undesired product exiting the reactor. In both cases, the definitionof selectivity reduces to
SRS =CRCS
(6.2.2)
Here we use the overline to designate that the selectivity is taken with respect to molenumbers. No matter what definition is used, the selectivity should be maximized. Theyield of a product R also has two definitions. The first definition is the rate of formationof a product R divided by the rate of consumption of the key reactant A
64 CHAPTER 6. MULTIPLE REACTIONS
YieldYR =
rR−rA
(6.2.3)
Alternatively, the yield can be defined in terms of mole numbers. For a batch reactor, theyield is the number of moles of product formed per mole of key reactant consumed:
YR =NR
NA0 −NA
(6.2.4)
or for a flowing system, the yield is defined in terms of molar flowrates
YR =nR
nA0 − nA(6.2.5)
6.3 Reversible Reactions
As an example of a reversible reaction consider the combination of two benzene moleculesto form one molecule of hydrogen and one of diphenyl:
2 C6H6
k1−⇀↽−k2
C12H10 + H2
In reversible reactions, complete conversion cannot be achieved. All rate laws for re-versible reactions must reduce to the thermodynamic relationship relating the reactingspecies concentrations at equilibrium. At equilibrium the reaction rate is zero for allspecies. Consider the simple reversible reaction of
Ak1−⇀↽−k2
R
The rate equation (assuming an elementary reaction) can be written as:
− rA = k1CA − k2CR (6.3.1)
At equilibrium, the net rate of the reaction is equal to zero, which means the forward rateis equal to the reverse rate
0 = k1CA,e − k2CR,e (6.3.2)
where we use the subscript e to denote that the concentration is at equilibrium. Equa-tion 6.3.2 can be rearranged to give
CR,eCA,e
=k1
k2
= K (6.3.3)
where K is the equilibrium constant.
Equilibrium ConstantThe equilibrium constant K is related to the Gibbs free energy change for the reac-tion and is dependant on the temperature.
We can set up the stoichiometric table for this reaction for a constant volume batch reac-tor:

6.3. REVERSIBLE REACTIONS 65
at t = 1 concentration at tA CA = CA0 CA = CA0 − CA0XR CR = CR0 CR = CR0 + CA0X
where X is conversion with respect to A. These concentrations can be substituted into thedesign equation for the batch reactor rate
− dCAd t
= −rA = CA0dX
d t= k1 (CA0 − CA0X)− k2 (CR0 + CA0X) (6.3.4)
To simpify the equation, we make the substitution M = CR0/CA0 and divide Equa-tion 6.3.4 by CA0 to give
dX
d t= k1 (1−X)− k2 (M +X) (6.3.5)
At equilibrium we have a steady-state, so that we have the following conditions
dCAd t
= 0 anddX
d t= 0
Applying the equilibrium conditions to Equation 6.3.5 gives
k1
k2
=M +Xe
1−Xe
(6.3.6)
whereXe is the conversion at equilibrium. Equation 6.3.6 can be rearranged to give
Xe =K −MK + 1
(6.3.7)
Equation 6.3.7 allows us to calculate the maximum conversion achievable in the reversiblereaction, this is the conversion that occurs at equilibrium. Next we rewrite the designequation in terms of the equilibrium conversion by substituting k2 = k1(1−Xe)/(M+Xe)(from Equation 6.3.6) into Equation 6.3.5 and rearrange to give
dX
d t= k1 (1−X)− k1
1−Xe
M +Xe
(M +X) (6.3.8)
In order to integrate Equation 6.3.8, we can simplify the above equation to give,
dX
d t=
k1
M +Xe
[(1−X) (M +Xe)− (1−Xe) (M +X)]
=k1
M +Xe
[Xe −MX −X +XeM ]
= k1M + 1
M +Xe
(Xe −X) (6.3.9)
Integrating Equation 6.3.9 gives∫ X
0
dX
Xe −X=
∫ t
0
k1M + 1
M +Xe
d t
− ln
(1− X
Xe
)= k1
M + 1
M +Xe
t (6.3.10)
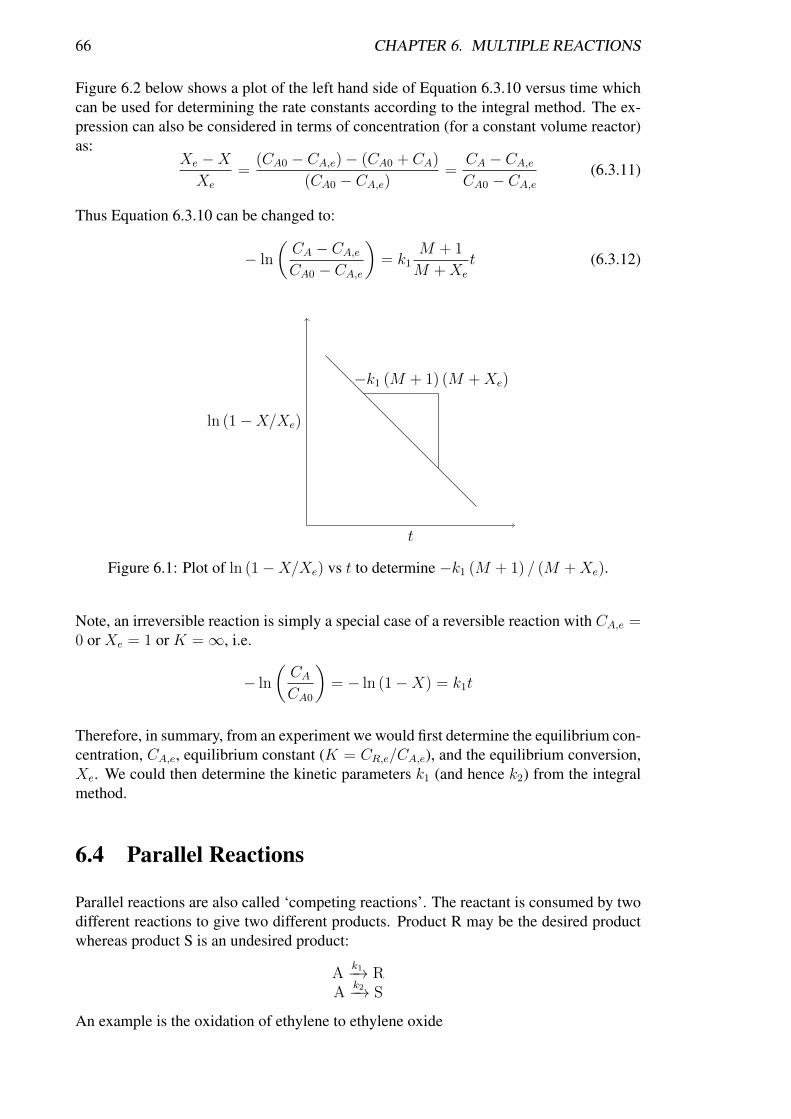
66 CHAPTER 6. MULTIPLE REACTIONS
Figure 6.2 below shows a plot of the left hand side of Equation 6.3.10 versus time whichcan be used for determining the rate constants according to the integral method. The ex-pression can also be considered in terms of concentration (for a constant volume reactor)as:
Xe −XXe
=(CA0 − CA,e)− (CA0 + CA)
(CA0 − CA,e)=
CA − CA,eCA0 − CA,e
(6.3.11)
Thus Equation 6.3.10 can be changed to:
− ln
(CA − CA,eCA0 − CA,e
)= k1
M + 1
M +Xe
t (6.3.12)
ln (1−X/Xe)
t
−k1 (M + 1) (M +Xe)
Figure 6.1: Plot of ln (1−X/Xe) vs t to determine −k1 (M + 1) / (M +Xe).
Note, an irreversible reaction is simply a special case of a reversible reaction with CA,e =0 or Xe = 1 or K =∞, i.e.
− ln
(CACA0
)= − ln (1−X) = k1t
Therefore, in summary, from an experiment we would first determine the equilibrium con-centration, CA,e, equilibrium constant (K = CR,e/CA,e), and the equilibrium conversion,Xe. We could then determine the kinetic parameters k1 (and hence k2) from the integralmethod.
6.4 Parallel Reactions
Parallel reactions are also called ‘competing reactions’. The reactant is consumed by twodifferent reactions to give two different products. Product R may be the desired productwhereas product S is an undesired product:
Ak1−→ R
Ak2−→ S
An example is the oxidation of ethylene to ethylene oxide
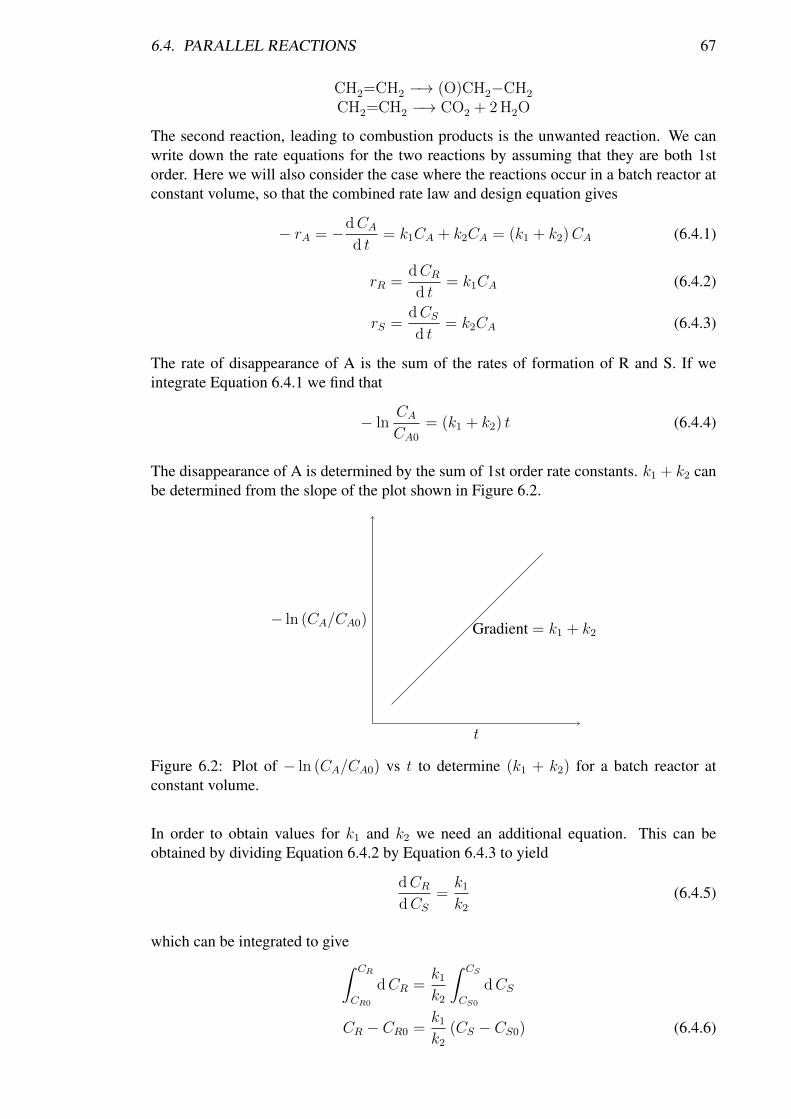
6.4. PARALLEL REACTIONS 67
CH2=CH2 −→ (O)CH2−CH2
CH2=CH2 −→ CO2 + 2 H2O
The second reaction, leading to combustion products is the unwanted reaction. We canwrite down the rate equations for the two reactions by assuming that they are both 1storder. Here we will also consider the case where the reactions occur in a batch reactor atconstant volume, so that the combined rate law and design equation gives
− rA = −dCAd t
= k1CA + k2CA = (k1 + k2)CA (6.4.1)
rR =dCRd t
= k1CA (6.4.2)
rS =dCSd t
= k2CA (6.4.3)
The rate of disappearance of A is the sum of the rates of formation of R and S. If weintegrate Equation 6.4.1 we find that
− lnCACA0
= (k1 + k2) t (6.4.4)
The disappearance of A is determined by the sum of 1st order rate constants. k1 + k2 canbe determined from the slope of the plot shown in Figure 6.2.
− ln (CA/CA0)
t
Gradient = k1 + k2
Figure 6.2: Plot of − ln (CA/CA0) vs t to determine (k1 + k2) for a batch reactor atconstant volume.
In order to obtain values for k1 and k2 we need an additional equation. This can beobtained by dividing Equation 6.4.2 by Equation 6.4.3 to yield
dCRdCS
=k1
k2
(6.4.5)
which can be integrated to give∫ CR
CR0
dCR =k1
k2
∫ CS
CS0
dCS
CR − CR0 =k1
k2
(CS − CS0) (6.4.6)
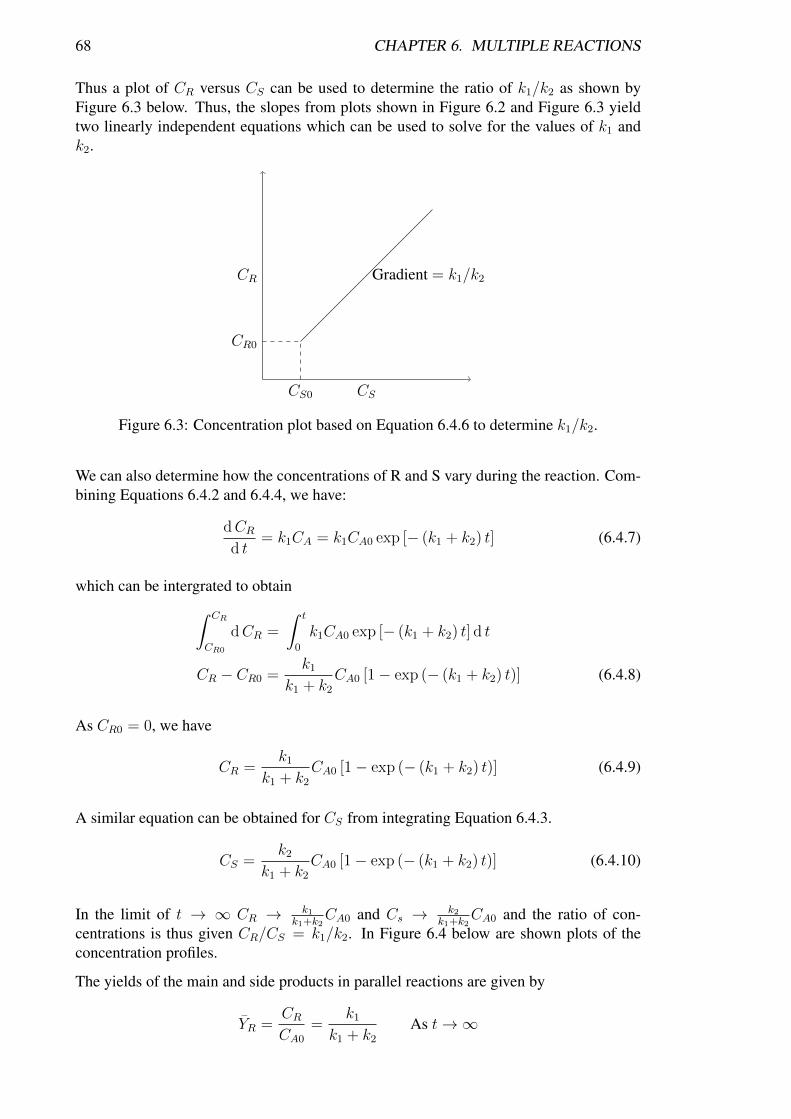
68 CHAPTER 6. MULTIPLE REACTIONS
Thus a plot of CR versus CS can be used to determine the ratio of k1/k2 as shown byFigure 6.3 below. Thus, the slopes from plots shown in Figure 6.2 and Figure 6.3 yieldtwo linearly independent equations which can be used to solve for the values of k1 andk2.
CR
CS
Gradient = k1/k2
CR0
CS0
Figure 6.3: Concentration plot based on Equation 6.4.6 to determine k1/k2.
We can also determine how the concentrations of R and S vary during the reaction. Com-bining Equations 6.4.2 and 6.4.4, we have:
dCRd t
= k1CA = k1CA0 exp [− (k1 + k2) t] (6.4.7)
which can be intergrated to obtain∫ CR
CR0
dCR =
∫ t
0
k1CA0 exp [− (k1 + k2) t] d t
CR − CR0 =k1
k1 + k2
CA0 [1− exp (− (k1 + k2) t)] (6.4.8)
As CR0 = 0, we have
CR =k1
k1 + k2
CA0 [1− exp (− (k1 + k2) t)] (6.4.9)
A similar equation can be obtained for CS from integrating Equation 6.4.3.
CS =k2
k1 + k2
CA0 [1− exp (− (k1 + k2) t)] (6.4.10)
In the limit of t → ∞ CR → k1k1+k2
CA0 and Cs → k2k1+k2
CA0 and the ratio of con-centrations is thus given CR/CS = k1/k2. In Figure 6.4 below are shown plots of theconcentration profiles.
The yields of the main and side products in parallel reactions are given by
YR =CRCA0
=k1
k1 + k2
As t→∞
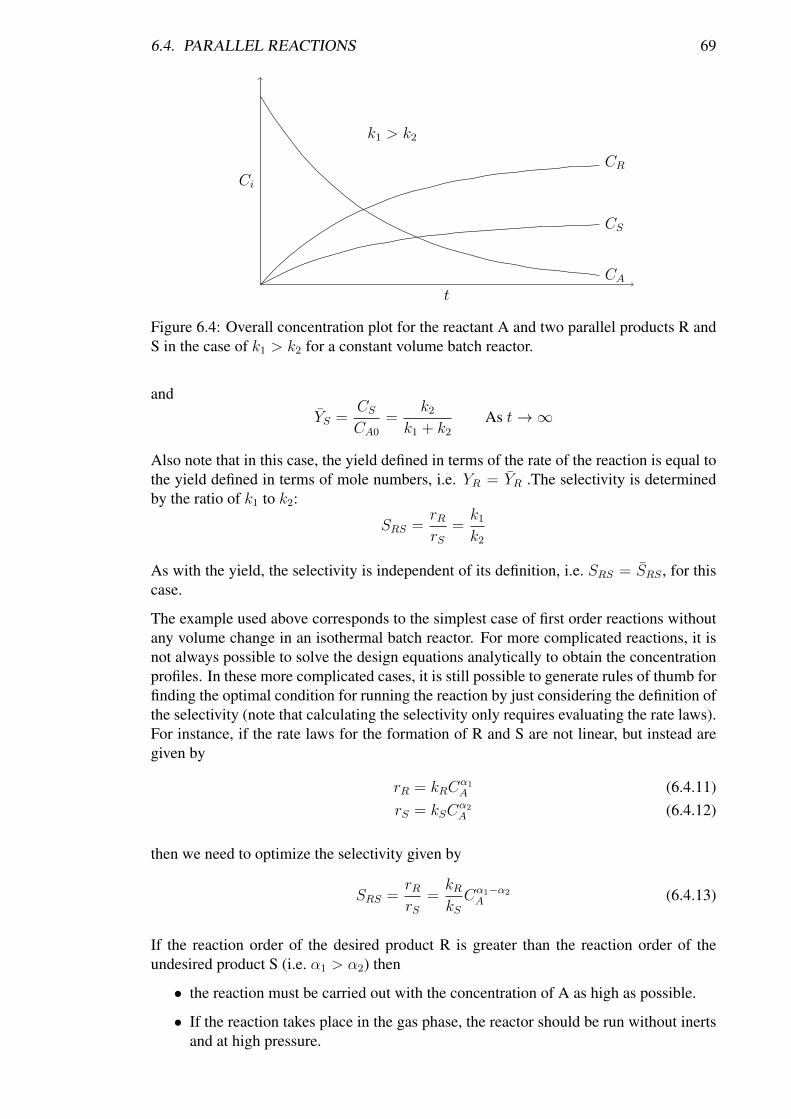
6.4. PARALLEL REACTIONS 69
Ci
t
CA
CR
CS
k1 > k2
Figure 6.4: Overall concentration plot for the reactant A and two parallel products R andS in the case of k1 > k2 for a constant volume batch reactor.
andYS =
CSCA0
=k2
k1 + k2
As t→∞
Also note that in this case, the yield defined in terms of the rate of the reaction is equal tothe yield defined in terms of mole numbers, i.e. YR = YR .The selectivity is determinedby the ratio of k1 to k2:
SRS =rRrS
=k1
k2
As with the yield, the selectivity is independent of its definition, i.e. SRS = SRS , for thiscase.
The example used above corresponds to the simplest case of first order reactions withoutany volume change in an isothermal batch reactor. For more complicated reactions, it isnot always possible to solve the design equations analytically to obtain the concentrationprofiles. In these more complicated cases, it is still possible to generate rules of thumb forfinding the optimal condition for running the reaction by just considering the definition ofthe selectivity (note that calculating the selectivity only requires evaluating the rate laws).For instance, if the rate laws for the formation of R and S are not linear, but instead aregiven by
rR = kRCα1A (6.4.11)
rS = kSCα2A (6.4.12)
then we need to optimize the selectivity given by
SRS =rRrS
=kRkSCα1−α2A (6.4.13)
If the reaction order of the desired product R is greater than the reaction order of theundesired product S (i.e. α1 > α2) then
• the reaction must be carried out with the concentration of A as high as possible.
• If the reaction takes place in the gas phase, the reactor should be run without inertsand at high pressure.

70 CHAPTER 6. MULTIPLE REACTIONS
• For a liquid phase reaction, diluents should be kept to a minimum.
• In addition, a PFR reactor should be used instead of a CSTR, because the concen-tration of the reactant A is on average higher in a PFR than in a CSTR. In a PFR, theconcentration of A is everywhere greater than in a CSTR (except in the exit stream)if the same conversion of A is to be achieved.
If the order of the desired product R is less than that of the undesired product S (i.e.α2 > α1) then
• having a low concentration of A is desirable.
• In this case using a CSTR over a PFR is preferred.
• In addition, the reaction should be run with inerts and at low pressure (for a gasphase reaction) or with diluents in a liquid phase reaction.
We can also optimize the selectivity by manipulating the temperature. In this case, weneed to consider how the selectivity depends on temperature by explicitly accountingfor the temperature dependence of the rate parameters by using the Arrhenius Equation.Thus,
SRS =kRkS
=ARAS
exp
(−ES − ER
RT
)(6.4.14)
where Aj is the pre-exponential factor (or frequency factor) for component j and Ej isthe activation energy for component j. In the case, where ER > ES , kR increases morerapidly with temperature than kS . Thus, the selectivity can be maximised by running athigh temperature. Conversely, for ER < ES , the reaction should be carried out at lowtemperature to maximise selectivity, but not too low that the desired reaction does notproceed.
6.5 Series Reactions
Irreversible, series reactions are another example of multiple reactions:
A −→ R −→ S
There are many examples of this type of reaction chain such as:
1. Reaction of ethylene oxide (EO) with ammonia to form mono-, di- and triethanolamine.
NH3 + (O)CH2−CH2 −→ HOCH2CH2NH2
+ (O)CH2−CH2 −→ (HOCH2CH2)2NH+ (O)CH2−CH2 −→ (HOCH2CH2)3N
2. A chain reaction to produce C6Cl6.
C6H6 + Cl2 −→ C6H5Cl + Cl2 −→ · · · −→ C6Cl6
First we consider Ak1−→ R
k2−→ S and the case where each of the reactions is first order. Asbefore we also consider a constant volume batch reactor in which case we can write thecombined rate law and design equations as
− dCAd t
= −rA = k1CA (6.5.1)

6.5. SERIES REACTIONS 71
dCRd t
= rR = k1CA − k2CR (6.5.2)
dCSd t
= rS = k2CR (6.5.3)
Initially, only molecules of A are in the reactor so that CR0 = CS0 = 0. IntegratingEquation 6.5.1 gives
− lnCACA0
= k1t or CA = CA0 exp (−k1t) (6.5.4)
Substituting Equation 6.5.4 into Equation 6.5.2 gives
dCRd t
+ k2CR = k1CA0 exp (−k1t) (6.5.5)
with the intial conditions: t = 0, CR0 = 0. This equation is a linear (first-order) ordi-nary differential equation, which can be solved using the integrating factor method. Thesolution to the differential equation is given by, 1
CR =k1
k2 − k1
CA0 [exp (−k1t)− exp (−k2t)] (6.5.6)
According to the stoichiometry, we also know that CA0 = CA + CR + CS , then CS =CA0 − CA − CR. A concentration plot based on Equations 6.5.4 and 6.5.6 is shown inFigure 6.5.
Ci
t
CA
CR
CSk1 > k2
Figure 6.5: Overall concentration plot for the reactant A and two products R and S in achain reaction based on a first order rate law in a constant volume batch reactor.
To find the maximum concentration of R, CRmax, we can differentiate Equation 6.5.6 withrespect to time and set the derivative equal to 0, i.e. the maximum occurs at dCR
d t= 0.
From this condition we find that
tmax =ln (k2/k1)
k2 − k1
(6.5.7)
The following Figure 6.6 shows the change of the concentrations of A, R, and S in chainreactions at different rate constants. In Figure the change of the concentrations of A, R,and S in parallel reactions in different rate constants is given.
1You should be able to solve this differential equation as the integrating factor method is covered in theMaths notes
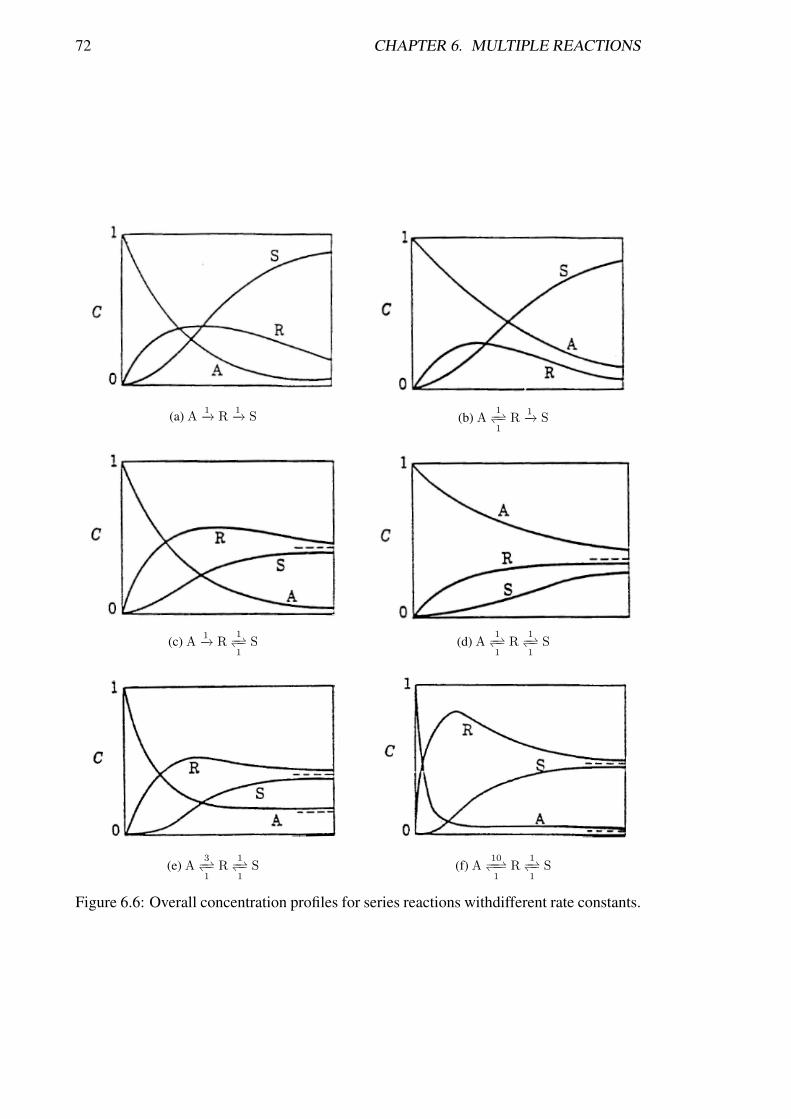
72 CHAPTER 6. MULTIPLE REACTIONS
(a) A 1−→ R1−→ S (b) A
1−⇀↽−1
R1−→ S
(c) A 1−→ R1−⇀↽−1
S (d) A1−⇀↽−1
R1−⇀↽−1
S
(e) A3−⇀↽−1
R1−⇀↽−1
S (f) A10−−⇀↽−−1
R1−⇀↽−1
S
Figure 6.6: Overall concentration profiles for series reactions withdifferent rate constants.
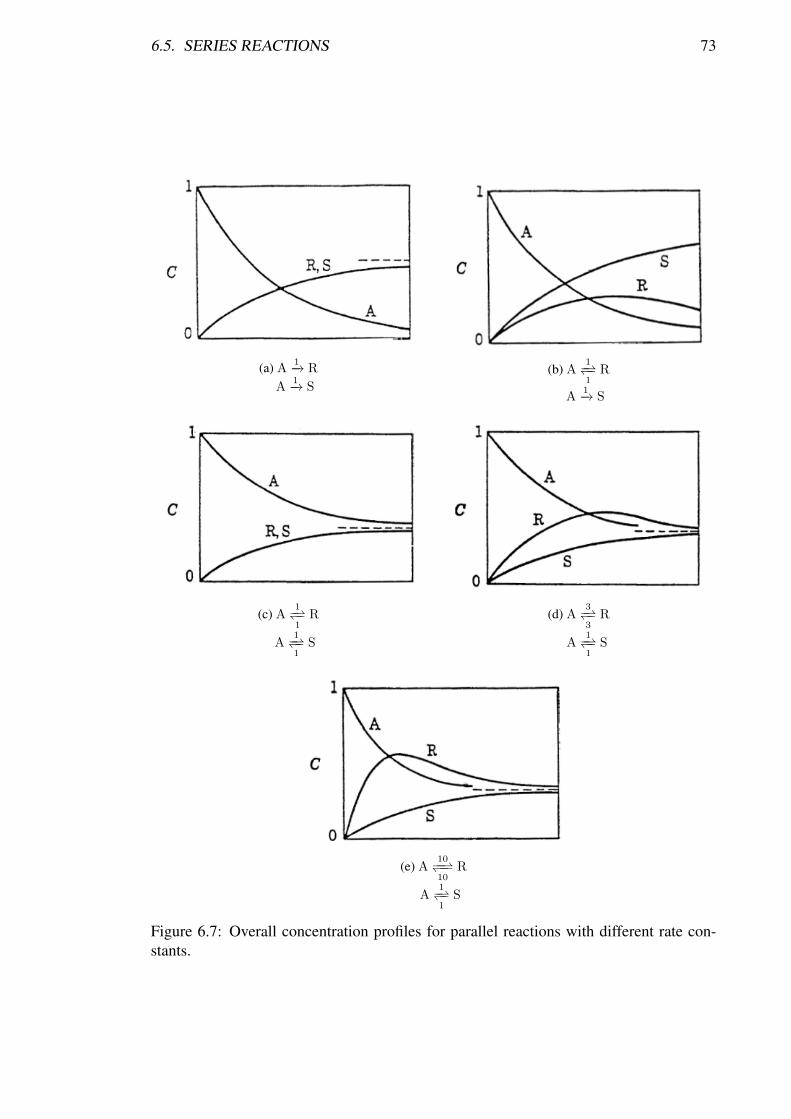
6.5. SERIES REACTIONS 73
(a) A 1−→ R
A1−→ S
(b) A1−⇀↽−1
R
A1−→ S
(c) A1−⇀↽−1
R
A1−⇀↽−1
S
(d) A3−⇀↽−3
R
A1−⇀↽−1
S
(e) A10−−⇀↽−−10
R
A1−⇀↽−1
S
Figure 6.7: Overall concentration profiles for parallel reactions with different rate con-stants.

74
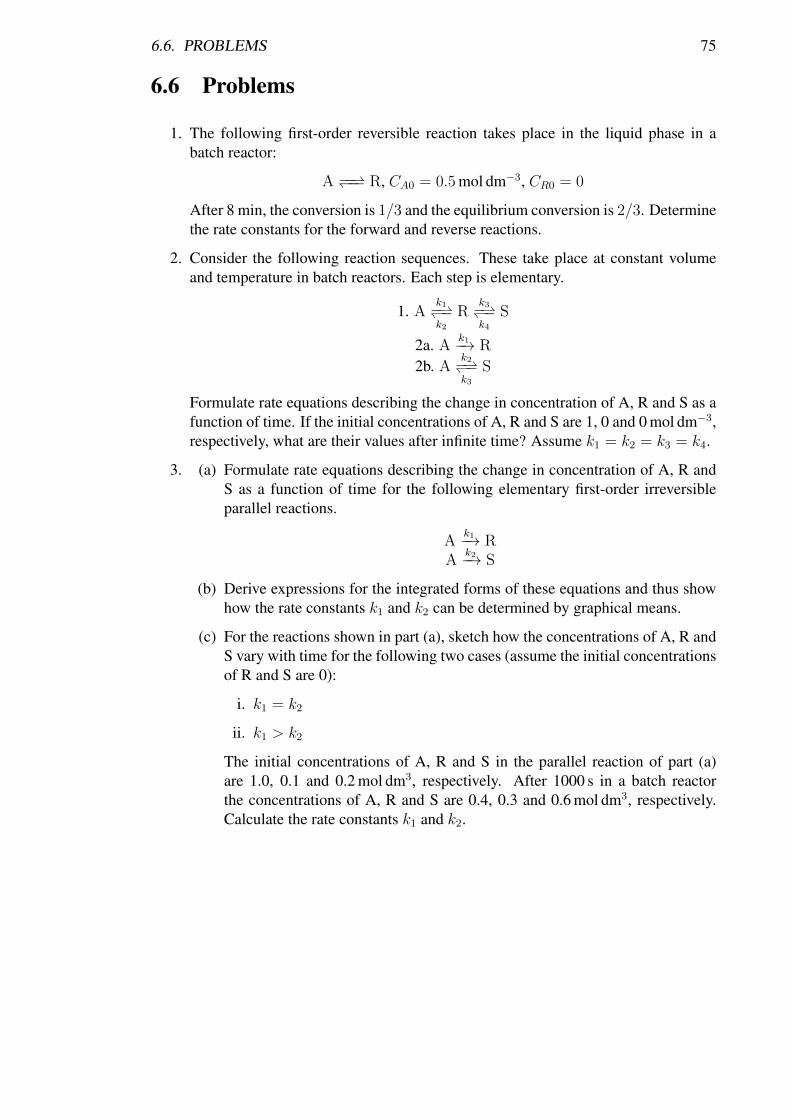
6.6. PROBLEMS 75
6.6 Problems
1. The following first-order reversible reaction takes place in the liquid phase in abatch reactor:
A −−⇀↽−− R, CA0 = 0.5 mol dm−3, CR0 = 0
After 8 min, the conversion is 1/3 and the equilibrium conversion is 2/3. Determinethe rate constants for the forward and reverse reactions.
2. Consider the following reaction sequences. These take place at constant volumeand temperature in batch reactors. Each step is elementary.
1. Ak1−⇀↽−k2
Rk3−⇀↽−k4
S
2a. Ak1−→ R
2b. Ak2−⇀↽−k3
S
Formulate rate equations describing the change in concentration of A, R and S as afunction of time. If the initial concentrations of A, R and S are 1, 0 and 0 mol dm−3,respectively, what are their values after infinite time? Assume k1 = k2 = k3 = k4.
3. (a) Formulate rate equations describing the change in concentration of A, R andS as a function of time for the following elementary first-order irreversibleparallel reactions.
Ak1−→ R
Ak2−→ S
(b) Derive expressions for the integrated forms of these equations and thus showhow the rate constants k1 and k2 can be determined by graphical means.
(c) For the reactions shown in part (a), sketch how the concentrations of A, R andS vary with time for the following two cases (assume the initial concentrationsof R and S are 0):
i. k1 = k2
ii. k1 > k2
The initial concentrations of A, R and S in the parallel reaction of part (a)are 1.0, 0.1 and 0.2 mol dm3, respectively. After 1000 s in a batch reactorthe concentrations of A, R and S are 0.4, 0.3 and 0.6 mol dm3, respectively.Calculate the rate constants k1 and k2.

76
Chapter 7Design structure for IsothermalReactors
Contents7.1 Design structure for Isothermal Reactors . . . . . . . . . . . . . . . 79
7.2 Problems . . . . . . . . . . . . . . . . . . . . . . . . . . . . . . . . . 81
77

78
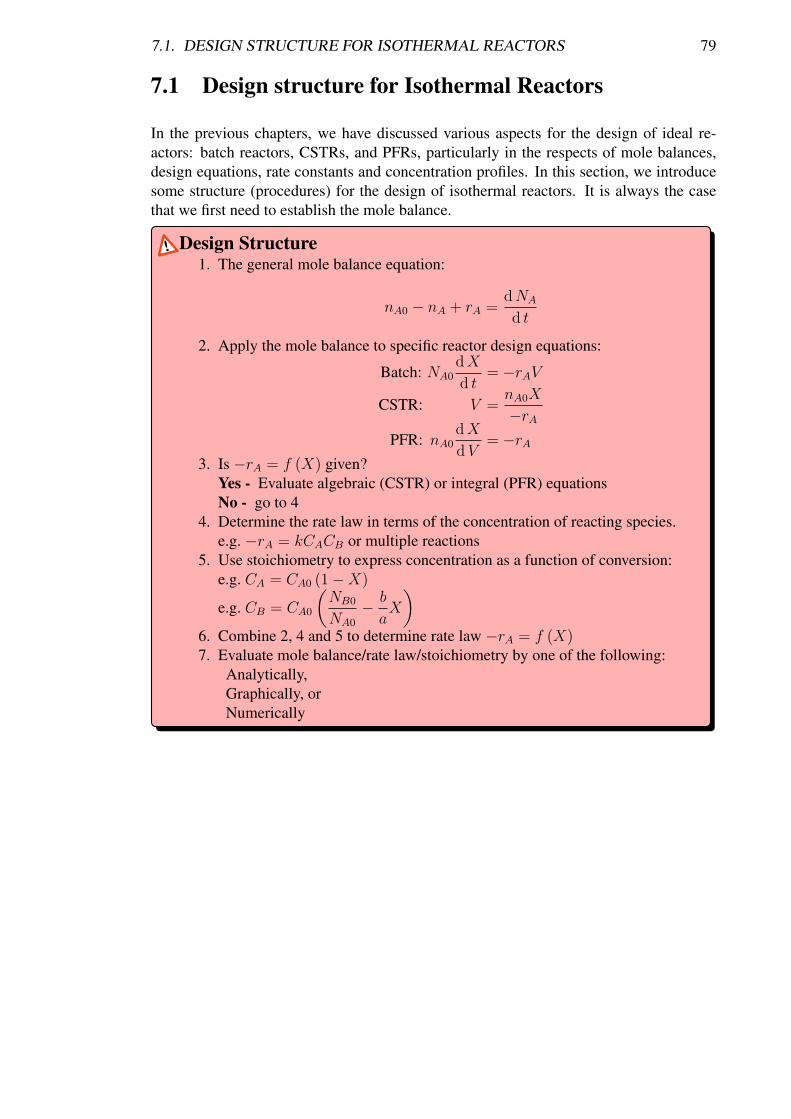
7.1. DESIGN STRUCTURE FOR ISOTHERMAL REACTORS 79
7.1 Design structure for Isothermal Reactors
In the previous chapters, we have discussed various aspects for the design of ideal re-actors: batch reactors, CSTRs, and PFRs, particularly in the respects of mole balances,design equations, rate constants and concentration profiles. In this section, we introducesome structure (procedures) for the design of isothermal reactors. It is always the casethat we first need to establish the mole balance.
Design Structure1. The general mole balance equation:
nA0 − nA + rA =dNA
d t
2. Apply the mole balance to specific reactor design equations:
Batch: NA0dX
d t= −rAV
CSTR: V =nA0X
−rAPFR: nA0
dX
dV= −rA
3. Is −rA = f (X) given?Yes - Evaluate algebraic (CSTR) or integral (PFR) equationsNo - go to 4
4. Determine the rate law in terms of the concentration of reacting species.e.g. −rA = kCACB or multiple reactions
5. Use stoichiometry to express concentration as a function of conversion:e.g. CA = CA0 (1−X)
e.g. CB = CA0
(NB0
NA0
− b
aX
)6. Combine 2, 4 and 5 to determine rate law −rA = f (X)7. Evaluate mole balance/rate law/stoichiometry by one of the following:
Analytically,Graphically, orNumerically

80
7.2. PROBLEMS 81
7.2 Problems
1. The elementary, liquid-phase, irreversible reaction
A + B −→ C
is to be carried out in a flow reactor. Two reactors are available, an 800 dm3 PFRthat can only be operated at 300 K and a 200 dm3 CSTR that can be operated at350 K. The two feed streams to the reactor mix to form a single feed stream that isequimolar in A and B, with a total volumetric flowrate of 10 dm3 min−1. Which ofthe two reactors will give the highest conversion?Additional information:At 300 K, k = 0.07 dm3 mol−1 min−1
E = 85000 J K−1 mol−1
CAI = CBI = 2 mol dm−3
vAI = vBI = 0.5v0 = 5 dm3 min−1
2. It is desired to produce 20 million kg per year of ethylene glycol (EG). The reactoris to be operated isothermally. A 3.5 mol dm−3 solution of ethylene oxide (EO)in water is fed to the reactor together with an equal volumetric solution of watercontaining 0.9 wt% of the catalyst H2SO4. The specific reaction rate constant is0.311 min−1 (1st order in EO). If 80% conversion is to be achieved, determine thenecessary CSTR volume.
3. A 200 dm3 constant volume batch reactor is pressurised to 20 atm with a mixture of75% A and 25% inert. The gas phase reaction is carried out isothermally at 227◦C.
(a) Assuming that the ideal gas law is valid, how many moles of A are in thereactor initially? What is the initial concentration of A?
(b) If the reaction is first order:
−rA = kCA(k = 0.1 min−1
)Calculate the time necessary to consume 99% of A.
(c) If the reaction is second order:
−rA = kC2A
(k = 0.7 dm3 mol−1 min−1
)Calculate the time to consume 80% of A.