Embed Size (px)
Citation preview

Toxic Substances Hydrology Program and Groundwater Resources Program
Lithostratigraphic, Geophysical, and Hydrogeologic Observations From a Boring Drilled to Bedrock in Glacial Sediments Near Nantucket Sound in East Falmouth, Massachusetts
Scientific Investigations Report 2019–5042
U.S. Department of the InteriorU.S. Geological Survey

Cover. Fourth-grade students from the East Falmouth Elementary School in Falmouth, Massachusetts, watch a drill-rig operator drilling on the school’s ball field to collect glacial sediment samples from the Cape Cod aquifer. Photograph by Denis LeBlanc, U.S. Geological Survey.

Lithostratigraphic, Geophysical, and Hydrogeologic Observations From a Boring Drilled to Bedrock in Glacial Sediments Near Nantucket Sound in East Falmouth, Massachusetts
By Robert B. Hull, Carole D. Johnson, Byron D. Stone, Denis R. LeBlanc, Timothy D. McCobb, Stephanie N. Phillips, Katherine L. Pappas, and John W. Lane, Jr.
Toxic Substances Hydrology Program and Groundwater Resources Program Prepared in cooperation with the Cape Cod Commission
Scientific Investigations Report 2019–5042
U.S. Department of the InteriorU.S. Geological Survey

U.S. Department of the InteriorDAVID BERNHARDT, Secretary
U.S. Geological SurveyJames F. Reilly II, Director
U.S. Geological Survey, Reston, Virginia: 2019
For more information on the USGS—the Federal source for science about the Earth, its natural and living resources, natural hazards, and the environment—visit https://www.usgs.gov or call 1–888–ASK–USGS.
For an overview of USGS information products, including maps, imagery, and publications, visit https://store.usgs.gov.
Any use of trade, firm, or product names is for descriptive purposes only and does not imply endorsement by the U.S. Government.
Although this information product, for the most part, is in the public domain, it also may contain copyrighted materials as noted in the text. Permission to reproduce copyrighted items must be secured from the copyright owner.
Suggested citation:Hull, R.B, Johnson, C.D., Stone, B.D., LeBlanc, D.R., McCobb, T.D., Phillips, S.N., Pappas, K.L., and Lane, J.W., 2019, Lithostratigraphic, geophysical, and hydrogeologic observations from a boring drilled to bedrock in glacial sediments near Nantucket sound in East Falmouth, Massachusetts: U.S. Geological Survey Scientific Investigations Report 2019–5042, 27 p., https://doi.org/10.3133/sir20195042.
ISSN 2328-0328 (online)

iii
Acknowledgments
The authors would like to thank the Falmouth School Department and especially Principal Justine Dale and the students, teachers, and parents at the East Falmouth Elementary School for their cooperation and interest during this project. The efforts of the drilling team of Cascade Drilling and Jeffrey Baker of TWS Environmental are gratefully acknowledged. The Massachusetts Army National Guard at Joint Base Cape Cod generously provided indoor working space to process the sediment cores. The Falmouth Water Department provided potable freshwater for the drilling.
The dedicated work of our deceased colleague Jeffrey Grey of the U.S. Geological Survey in drilling pilot wells for this study will long be remembered and appreciated. Eric White of the U.S. Geological Survey, Earth System Processes Division, Hydrogeophysics Branch was instrumental in helping with the borehole and surface geophysical measurements. The authors also thank Aimee Downs and the staff of the U.S. Geological Survey Ohio-Indiana-Kentucky Water Science Center for the grain-size analysis of the sediment samples.


v
ContentsAcknowledgments ........................................................................................................................................iiiAbstract ...........................................................................................................................................................1Introduction.....................................................................................................................................................1
Geographic Setting ...............................................................................................................................3Hydrogeologic Framework and Glacial History ...............................................................................3
Methods of Well Construction, Data Collection, and Analysis ..............................................................7Drilling, Core Collection, and Well Installation ................................................................................7Core Examination and Sediment Analysis ........................................................................................8Geophysical Methods ..........................................................................................................................9
Surface Horizontal-to-Vertical Spectral Ratio Seismics .......................................................9Surface Transient Electromagnetics ........................................................................................9Borehole Electromagnetic Induction .......................................................................................9Borehole Natural Gamma Radiation .......................................................................................10Borehole Nuclear Magnetic Resonance ...............................................................................10
Lithostratigraphic Characterization of the Study Area ..........................................................................11Lithostratigraphic Units From Direct Observation .........................................................................11Implications of Observed Lithostratigraphy for Depositional Models of
Western Cape Cod ................................................................................................................15Hydrogeological Characterization of the Study Area ............................................................................16
Hydraulic Conductivity and Transmissivity From Grain-Size Distribution .................................16Borehole and Surface Geophysical Techniques to Improve Understanding of Local
Hydrogeologic Conditions ....................................................................................................17Surface Horizontal-to-Vertical Spectral Ratio Seismics .....................................................17Surface Transient Electromagnetics ......................................................................................17Borehole Electromagnetic Induction .....................................................................................17Borehole Natural Gamma Radiation .......................................................................................18Borehole Nuclear Magnetic Resonance ...............................................................................18
Implications of Observations From Boring to Bedrock for Understanding Local Hydrogeologic Conditions ....................................................................................................22
Summary........................................................................................................................................................23References Cited..........................................................................................................................................24

vi
Figures
1. Map showing the locations of borings with lithologic observations and boring MA–FSW 750 on Davis Neck in East Falmouth, Massachusetts, relative to the coastal necks on the southern shore of western Cape Cod and the regional water table .....................................................................................................................................2
2. A, Map and schematic cross sections B, B–B′ and C, C–C′ showing major geologic units and locations of selected lithologic borings on western Cape Cod, Massachusetts ..............................................................................................................................4
3. Graphs showing the A, layered-model and B, smooth-model interpretations of the transient electromagnetic soundings, and the borehole electromagnetic induction log, C, natural gamma log, and D, lithostratigraphic units defined by this study for well MA–FSW 750–100 in East Falmouth, Massachusetts ..................................................12
4. Profiles of the borehole interval from 170 to 270 feet below land surface at well MA–FSW 750–0100 in East Falmouth, Massachusetts, showing A, lithologic features based on visual examination of the sediment cores, B, the natural gamma log, and C, photographs of sediment cores ............................................................................14
5. Graph showing unfiltered natural gamma radioactivity versus mode grain size for 81 selected core samples collected from well MA–FSW 750–0100 in East Falmouth, Massachusetts ............................................................................................................................18
6. Profiles showing nuclear magnetic resonance logs from well MA–FSW 750–0100 in East Falmouth, Massachusetts, including A, relaxation time, B, pore-size distribution, and C, total and immobile fractional water content .......................................19
7. Graph showing profiles of hydraulic conductivity estimated from nuclear magnetic resonance logs from well MA–FSW 750–0100 in East Falmouth, Massachusetts, by using the Schlumberger-Doll research and sum of echoes equations and from grain-size distributions of core samples from selected vertical intervals ........................21
8. Graphs showing hydraulic conductivity for well MA–FSW 750–0100 in East Falmouth, Massachusetts, estimated from the nuclear magnetic resonance log by using the A, Schlumberger-Doll Research equation and B, sum of echoes equation versus hydraulic conductivity estimated from grain-size distributions .............................22
Tables
1. Physical characteristics of monitoring well MA–FSW 750–0100 in East Falmouth, Massachusetts ..............................................................................................................................8
2. Lithostratigraphic units identified in boring MA–FSW 750 in East Falmouth, Massachusetts ............................................................................................................................13

vii
Conversion FactorsInternational System of Units to U.S. customary units
Multiply By To obtain
inch (in.) 2.54 centimeter (cm)foot (ft) 0.3048 meter (m)mile (mi) 1.609 kilometer (km)foot per minute (ft/min) 0.3048 meter per minute (m/min)foot per day (ft/d) 0.3048 meter per day (m/d)foot squared per day (ft2/d) 0.09290 meter squared per day (m2/d)
Temperature in degrees Celsius (°C) may be converted to degrees Fahrenheit (°F) as °F = (1.8 × °C) + 32.
DatumVertical coordinate information is referenced to the National Geodetic Vertical Datum of 1929 (NGVD 29), which is referred to as sea level in this report.
Horizontal coordinate information is referenced to the North American Datum of 1927.
Altitude, as used in this report, refers to distance above the vertical datum.


Lithostratigraphic, Geophysical, and Hydrogeologic Observations From a Boring Drilled to Bedrock in Glacial Sediments near Nantucket Sound in East Falmouth, Massachusetts
By Robert B. Hull, Carole D. Johnson, Byron D. Stone, Denis R. LeBlanc, Timothy D. McCobb, Stephanie N. Phillips, Katherine L. Pappas, and John W. Lane, Jr.
AbstractIn spring 2016, a 310-foot-deep boring (named
MA–FSW 750) was drilled by the U.S. Geological Survey near Nantucket Sound in East Falmouth, Massachusetts, to investigate the hydrogeology of the southern coast of western Cape Cod. Few borings that are drilled to bedrock exist in the area, and the study area was selected to fill a gap between comprehensive geologic datasets inland to the north and marine geophysical data from beneath Nantucket Sound to the south. A permanent monitoring well (MA–FSW 750–0100) was installed in the boring upon the completion of the drilling and core collection. Observations from sediment cores and surface and borehole geophysical measurements were used to delineate three zones relevant to understanding ground-water flow at the study location. Shallow sands and gravels (0–107 feet [ft] below land surface [bls]) underlain by silt-rich fine and very fine sand (107–175 ft bls) form a zone of high permeability underlain by a zone of relatively lower permea-bility, referred to as the “shallow high-permeability” and “low-permeability” zones, respectively. A sharp lithological contact separating the shallow high-permeability and low-permeability zones may affect vertical flow of groundwater. Fine to coarse sand with intervals of clay and silt from 175 to 300 ft repre-sent a deep zone of relatively high permeability, referred to as the “deep high-permeability” zone. A compacted, nonsorted unit (identified as basal till) and the bedrock surface were encountered at 300 and 305 ft bls, respectively. Hydraulic conductivity estimates from nuclear magnetic resonance logs and sediment grain-size distribution analyses indicated that the shallow high-permeability zone contributes substantially to the capacity of the aquifer to transmit groundwater at the study location. Results from geophysical surveys indicate a gradual transition from fresh to saline groundwater in the interval from 105 to 160 ft. Freshwater at the study site is present in the saturated unconsolidated sediments only in the 75-ft interval between 30 ft (the water table) and 105 ft bls in the shallow high-permeability zone.
Sediments shallower than 175 ft closely resemble the downward fining post-Wisconsinan age deltaic and lacustrine deposits present in many parts of western Cape Cod; sedi-ments deeper than 175 ft appear to be the product of earlier depositional processes more local to the southern coast of western Cape Cod. This study highlights how high-resolution observations of cored material coupled with a multitool geophysical approach can characterize a single boring to help better understand regional glacial history and hydrogeology.
IntroductionThe unconfined aquifer of western Cape Cod is the sole
source of drinking water for residents and an important source of freshwater for inland streams and ponds and coastal inlets (LeBlanc and others, 1986). Many borings have been drilled to depths of more than 250 feet (ft) into the unconfined aqui-fer in inland areas of western Cape Cod as part of efforts to characterize and remediate groundwater contamination near Joint Base Cape Cod (JBCC; Masterson and others, 1997b; Barbaro and others, 2013, 2014). However, data are sparse on the hydrogeologic structure of the aquifer near southern coastal groundwater-discharge areas, which are vulnerable to problems such as eutrophication of embayments (Howes and others, 2005) and sea-level rise (Walter and others, 2016).
In spring 2016, the U.S. Geological Survey (USGS) drilled a 310-foot-deep boring named MA–FSW 750 (location referred to in this report as “site F750”; fig. 1) near Nan-tucket Sound on the coastal peninsula of Davis Neck in East Falmouth, Massachusetts, to provide additional information on the hydrogeology of the southern coast of western Cape Cod, where few deep borings exist. Prior to drilling, passive seismic and transient electromagnetic (TEM) geophysical surveys were made to estimate the depths to the freshwater/saltwater interface and the top of consolidated bedrock. A permanent 4-inch (in.)-diameter polyvinyl chloride (PVC) well named MA–FSW 750–0100 (F750–0100) was installed

2 Bedrock Boring Lithostratigraphic, Geophysical, and Hydrogeologic Observations in East Falmouth, Massachusetts
Green Pond Bournes Pond
Nantucket Sound
15
2535
45
5
65
55
65
70°20'70°25'70°30'70°35'
41°45'
41°40'
41°35’
Base from U.S. Geological Survey digital data Water-table contours fromWalter and others (2019)
MA–FSW 750
Davis Neck
Gre
en P
ond
Gre
at P
ond
Bour
nes P
ond
MASSACHUSETTS Cape Cod
Study area
EXPLANATION
Water-table contour—Shows altitude of water table. Contour interval is 5 feet. Datum is National Geodetic Vertical Datum of 1929, referred to as sea level in this report
Borings drilled to bedrockBorings not drilled to bedrock
Borehole
EAST FALMOUTH
0 3 6 MILES
0 3 6 KILOMETERS
Figure 1. The locations of borings with lithologic observations and boring MA–FSW 750 on Davis Neck in East Falmouth, Massachusetts, relative to the coastal necks on the southern shore of western Cape Cod and the regional water table; modified from Walter and others (2019).

Introduction 3
in the borehole. Sediment cores collected during well instal-lation provided the opportunity to identify lithostratigraphic characteristics such as sediment structure, grain-size distribu-tion, and hydraulic conductivity and to confirm the hydrogeo-logic features identified with surface geophysical methods. In addition, the permanent well F750–0100 provided access for borehole geophysical surveys by borehole electromagnetic induction (EMI), gamma, and nuclear magnetic resonance (NMR) methods. The borehole logs provided high-resolution, depth-specific measurements to compare with results from the surface geophysical surveys, to supplement the lithostrati-graphic logs, and to improve understanding of the hydrogeol-ogy in the study area.
This report presents lithostratigraphic, geophysical, and hydrogeologic observations from the drilling and logging of well F750–0100. These observations provide new information about the fresh groundwater system near the coast. The report also establishes a baseline for future geophysical studies at site F750 by presenting results from established geophysical techniques alongside observations of cored material. Obser-vations at site F750 are compared with results from existing conceptual models of the area’s hydrogeology and glacial history to better understand the regional depositional history and hydrogeology of this area. This report is supported by two companion data releases: one is for lithostratigraphic and hydraulic data (Hull and Stone, 2019); and the other is for geophysical data (Johnson and others, 2019).
Geographic Setting
Site F750 was drilled on the northern part of Davis Neck in East Falmouth on Cape Cod. Davis Neck is a peninsula that is about 2 miles (mi) long and 0.6 mi wide. The north-to-south-oriented peninsula is bordered (fig. 1) by saltwater embayments to the west (Green Pond) and east (Bournes Pond). The ecological health of both embayments is affected by eutrophication because they receive regional and local groundwater discharge that contains nitrate from septic-system disposal of domestic wastewater (Howes and others, 2005).
Many borings to bedrock on western Cape Cod were drilled during groundwater remediation and monitoring efforts at JBCC; however, site F750 (fig. 1) is one of the few bor-ings drilled to bedrock on the peninsulas of eastern Falmouth (Walter and others, 2019). The site was selected to fill the gap between comprehensive geologic datasets near JBCC to the north and marine geophysical data from beneath Nantucket Sound to the south.
Hydrogeologic Framework and Glacial History
In the shallow, unconfined aquifer of western Cape Cod, groundwater flows from inland recharge areas to discharge areas along the coast. The aquifer is composed of unconsoli-dated glacial deposits (fig. 2) that are the product of complex interactions between glacial erosion, ice-marginal deposition,
and more recent geological processes (Mather and others, 1942; Oldale, 1982; Oldale and Barlow, 1986; Masterson and others, 1997a, b). Most of the sediments underlying the sur-face of Cape Cod are coarse-grained sand and gravel glacial outwash deposited in outwash plains during the retreat of the late Wisconsinan ice sheet 21,000 to 19,000 years ago. The outwash plains of western Cape Cod are glaciofluvial topset beds of large proglacial lake deltas that are underlain by sandy delta foreset beds, fine-grained delta bottomset beds, and lacustrine deposits (Masterson and others, 1997b; Walter and Whealan, 2005).
The most extensive glacial deltaic deposit of western Cape Cod is the Mashpee pitted plain, a delta that originated from the interlobate area between the Buzzards Bay and Sand-wich moraines and was deposited into a proglacial lake that extended into the area of Nantucket Sound (Masterson and others, 1997b). The Mashpee pitted plain is a fining down-ward stratigraphic sequence with three main facies—topset, foreset, and bottomset bed deposits (fig. 2B; Koteff and Pessl, 1981; Masterson and others, 1997b; Walter and Whealan, 2005; Stone and others, 2015). Topset bed sediments in the Mashpee pitted plain are characterized by coarse sand and cobble-boulder gravel at the northern head of the deposit, fin-ing to coarse pebbly sand to the south. The topset sediments were deposited by meltwater streams in high-energy braided-stream environments above the lake surface. Delta foreset and bottomset bed sediments were deposited in the lake. Foreset deposits, which grade from gravelly sand at the north end to fine to coarse sand at the south, were deposited in moderate-energy nearshore environments. Delta bottomset beds, which range from silty, very fine sand to fine sand, were deposited in low-energy offshore prodelta environments 50 to 100 ft below the historical lake water surface. Underlying bottomset beds are finer-grained, silt-rich lacustrine deposits, laid down in lake-bottom plains at depths of 100 to 300 ft below the lake surface. An unconformity at the water level of the histori-cal glacial lake separates the bottom of the delta topset beds from the top of eroded foreset beds. Contacts between delta foreset and bottomset facies are generally gradational. Silty, compacted late-Wisconsinan basal till underlies the deltaic and lacustrine deposits; the till rests on top of eroded, fresh crystal-line basement rock (fig. 2; Masterson and others, 1997a).
The deposits associated with the Mashpee pitted plain generally fine downward, and therefore the water-transmitting properties of these deposits generally decrease with depth; in Cape Cod glacial sediments, the water-transmitting properties are determined by grain size and sorting. Previous investigations have linked hydraulic conductivity to the types of glacial sediment that exist on Cape Cod, as determined by aquifer tests (Masterson and others, 1997a, b; Walter and Whealan, 2005). For example, the hydraulic conductivity of coarse sand and gravel in topset deposits ranges from 200 to 350 feet per day (ft/d). The hydraulic conductivity of fine to medium sand typical of foreset deposits ranges from 70 to 200 ft/d and that of very fine sand and silt typical of bottomset deposits ranges from 30 to 70 ft/d. Silt- and clay-rich

4 Bedrock Boring Lithostratigraphic, Geophysical, and Hydrogeologic Observations in East Falmouth, Massachusetts
Figure 2. A, Map and schematic cross sections B, B–B′ and C, C–C′ showing major geologic units and locations of selected lithologic borings on western Cape Cod, Massachusetts. Geologic map (A) adapted from Masterson and others (1997b, fig. 1).
B
B'B'
CCC–1
Figu
re 2
C
Approximate boundary of coastal plain
deposits
Approximate boundary of coastal plain
deposits
Falmouth Heights ice-contact
deposits
Falmouth Heights ice-contact
deposits
Very coarse-grained Mashpee pitted plain
deposits
Very coarse-grained Mashpee pitted plain
deposits
Mashpee pitted plain
deposits
Mashpee pitted plain
deposits
Nantucket Sound ice-contact
depostis
Nantucket Sound ice-contact
deposits
Great Neck ice-contact
deposits
Great Neck ice-contact
deposits
Other deposits
Other deposits
Other deposits
Other deposits
Sandwich moraine
Sandwich moraine
Buzz
ards
Bay
m
orai
ne
Buzz
ards
Bay
m
orai
ne
Ashumet ValleyAshumet Valley
95MW0104
Limit of seismic data
Limit of seismic data
Lake bottom sediment
Lake bottom sediment
L’Hommedieu ShoalL’Hommedieu Shoal
Basal tillBasal till
MA–FSW 750MA–FSW 750
MA–FSW 341MA–FSW 341
Nantucket Sound
0 3 6 MILES
0 3 6 KILOMETERS
70°20'70°25'70°30'70°35'
41°45'
41°40'
41°35’
EXPLANATION
Line of cross section B–B'
Line of schematic diagramC–C' in figure 2C
Observation well or boring and identifier— MA–FSW 750 is the boring from this report
FSW493
Base from U.S. Geological Survey and Massachusetts Office of Geographic Information digital data, 2017
C'
A
FSW493
FSW479
FSW267
FSW254
SDW006
BHW421
BHW212
BHW231
BHW420
C

Introduction 5
BHW421BHW212
BEN
D IN
SEC
TION
BHW231
BEN
D IN
SEC
TION
BHW420
BEN
D IN
SEC
TION
SDW006
BEN
D IN
SEC
TION
FSW254
BEN
D IN
SEC
TION
FSW267
BEN
D IN
SEC
TION
FSW479
BEN
D IN
SEC
TION
FSW493
BEN
D IN
SEC
TION
BEN
D IN
SEC
TION
FSW341
BEN
D IN
SEC
TION
Nan
tuck
et S
ound
Gre
en P
ond
Gre
at P
ondBE
ND
IN S
ECTI
ONC
ape
Cod
Can
al
Water table
Land surface
New interpretation
Old interpretation
300
400
200
100
SEALEVEL
100
200
300
400
FEET
B B'
NORTH SOUTH
B
Modified from Masterson and others (1997b, fig.5B)
MA–FSW 750
EXPLANATION
Coarse deposit—Consists of deltaic topset and foreset beds
Cretaceous coastal plain deposit
Subsurface ice-marginal deposit
Basal till
Boring or observation well—Red indicates primary well for this study; asterisk indicates that well is projected onto the line of cross section
Hydrogeologic units—Contact between units shown as dashed where inferred; red dotted line shows contact that has been reinterpreted based on results from this study
Fine deposit—Consists of deltaic bottomset beds and lacustrine deposits
Morainal deposit—Gravel, sand, silt, and clay; locally poorly to moderately sorted gravel and sand
Bedrock
Figure 2. A, Map and schematic cross sections B, B–B′ and C, C–C′ showing major geologic units and locations of selected lithologic borings on western Cape Cod, Massachusetts. Geologic map (A) adapted from Masterson and others (1997b, fig. 1).—Continued

6 Bedrock Boring Lithostratigraphic, Geophysical, and Hydrogeologic Observations in East Falmouth, Massachusetts
Modified from Masterson and others (1997b, fig.5B)and Baldwin and others (2016, figs.12 and 13)
SCHEMATIC, NOT TO SCALE
Water table
Land surface
FSW479 FSW493* FSW341*
MA-FSW 750
SECT
ION
B–B
'
New interpretation
Previous interpretation
EXPLANATION
Coarse deposit—Consists of deltaic topset and foreset beds
Cretaceous coastal plain deposit
Subsurface ice-marginal deposit
Basal till
Boring or observation well—Red indicates primary well for this study; asterisk indicates that well is projected onto the line of cross section
Hydrogeologic units—Contact between units shown as dashed where inferred; red dotted line shows contact that has been reinterpreted based on results from this study
Fine deposit—Consists of deltaic bottomset beds and lacustrine deposits
Morainal deposit—Gravel, sand, silt, and clay; locally poorly to moderately sorted gravel and sand
Bedrock
L'Hommedieu ShoalNantucket Sound
Green Pond
C
100
SEALEVEL
100
200
300
400
FEET
NORTH SOUTH
C C'
Figure 2. A, Map and schematic cross sections B, B–B′ and C, C–C′ showing major geologic units and locations of selected lithologic borings on western Cape Cod, Massachusetts. Geologic map (A) adapted from Masterson and others (1997b, fig. 1).—Continued

Methods of Well Construction, Data Collection, and Analysis 7
lake-bottom deposits have hydraulic conductivities that range from 10 to 30 ft/d (Walter and Whealan, 2005). The sandy topset and foreset beds have ratios of horizontal to vertical hydraulic conductivity less than (<) 10:1, whereas the silt- and clay-rich bottomset beds and lacustrine deposits have ratios of up to 100:1 (Moench and others, 2001). The relatively high anisotropy of the fine-grained deposits is related to the influence of low-conductivity clay layers, which impede vertical flow (Masterson and others, 1997a).
The hydraulic properties of the stratigraphic units of the Mashpee pitted plain delta can be visualized as layers of high and low permeability (fig. 2B). The gravel and sand deposits that compose the topset and foreset beds form a zone of rela-tively high permeability for infiltration and groundwater flow. Much of this high-permeability zone lies in the unsaturated zone, which can be more than 100 ft thick in the center of western Cape Cod. The silt- and clay-rich deposits that charac-terize bottomset beds and lacustrine deposits compose a zone of relatively low permeability for groundwater flow.
Previous investigations have demonstrated that some geo-logic features of the southern coastal region near Davis Neck are not deltaic or glaciolacustrine in origin (Oldale and Bar-low, 1986; Stone and DeGiacomo-Cohen, 2009). Ice-contact deposits that predate Mashpee pitted plain deposits (fig. 2) are present at locations west (for example, the Falmouth Heights ice-contact deposits) and east (for example, the Great Neck and Nantucket Sound ice-contact deposits) of the pitted plain outwash (Masterson and others, 1997a; Stone and DiGiacomo-Cohen, 2009; Walter and others, 2016). These coarse-grained sediments were deposited in high-energy, ice-marginal environments, and their lithologic and hydraulic properties most closely resemble those of topset bed deposits (Walter and Whealan, 2005). Pre-Wisconsinan age sediment underlying deep tunnel channels in Nantucket Sound have been identified by seismic refraction (O’Hara and Oldale, 1987) and direct (borehole) observation (Uchupi and Mulligan, 2006). Consid-ered by some to be Cretaceous coastal plain or Illinoian age drift beneath Wisconsinan outwash sediments, these deposits could extend under southern Cape Cod (Mulligan and Uchupi, 2004; Uchupi and Mulligan, 2006) and possibly affect ground-water flow near the coast.
Although the aquifer upgradient of coastal areas on western Cape Cod contains fresh groundwater to bedrock (LeBlanc and others, 1986), in coastal areas, a wedge of deep saline water commonly extends inland beneath the shallow fresh groundwater. The shape, position, and thickness of the transition from fresh to saline groundwater is affected by many factors, including the geometry of the coastline, the presence of streams, aquifer heterogeneity, and the magnitude of fresh groundwater flow (Bear, 1972; Cheng and Ouzar, 1999). The position, shape, and thickness of the transition zone is poorly understood in the study area (Walter and others, 2016). A regional groundwater modeling study by Walter and others (2016) simulating the effects of sea-level rise on the freshwater/saltwater interface indicated that freshwater could be present to bedrock at the study area. In their investigation,
which was not focused on southeastern Falmouth, Walter and others (2016) also showed that the freshwater/saltwater interface dipped steeply upward near the site, and borings drilled on nearby peninsulas showed relatively shallow saline groundwater partway between the landward and seaward ends of the necks.
On western Cape Cod, the bedrock surface ranges in altitude from about 75 ft below the National Geodetic Verti-cal Datum of 1929 (NGVD 29; referred to as sea level in this report), to nearly 500 ft below sea level. The bedrock surface dips downward from northwest to southeast (Oldale and Barlow, 1986; Masterson and others, 1997a; Fairchild and others, 2013). Prior to drilling the boring, the bedrock altitude at site F750 was estimated from a map of the bedrock topog-raphy beneath western Cape Cod (Fairchild and others, 2013) to be about 250 to 275 ft below sea level (280 to 305 ft below land surface).
Methods of Well Construction, Data Collection, and Analysis
Various methods were used to drill the boring, collect the sediment cores, install the permanent well, analyze the sediment cores, and conduct geophysical surveys and measurements. These methods are summarized in the following sections.
Drilling, Core Collection, and Well Installation
A Boart Longyear truck-mounted LS-600 rotosonic drill-ing rig, operated by Cascade Drilling LLC, was used to drill the boring at site F750 and collect continuous core samples to a depth of 310 ft (vertical locations in this report are given in feet below land surface unless otherwise noted). In the roto-sonic drilling method, the drill bit rotates and vibrates at a high frequency (typically greater than [>] 100 Hertz [Hz]), caus-ing sediments outside the casing to fluidize as the core barrel advances. A protective casing larger in diameter (6-in.) than the core barrel is then advanced around the core barrel, and the core barrel is removed to retrieve the core sample (Boart Longyear, 2011). Freshwater supplied by the Falmouth Water Department was used as a drilling fluid to advance the drill string. Bentonite and drilling mud were not used so as not to compromise future geophysical investigations with increased electrical conductivity, decreased fluid saturation, or decreased hydraulic conductivity.
After the boring was drilled to bedrock, 4-in.-diameter PVC well casing was installed to the full depth of the boring. The casing was screened only from 27 to 100 ft. The blank (unscreened) casing below the screened interval was used to prevent saline water present at depth (see discussion below) from entering the well. After the PVC casing was set in place, the protective casing was removed. The annulus between

8 Bedrock Boring Lithostratigraphic, Geophysical, and Hydrogeologic Observations in East Falmouth, Massachusetts
the PVC casing and native aquifer materials was allowed to fill by natural collapse of the aquifer material. Clean sand was used to fill the annulus from the water table to near land surface, and the well was capped with a steel roadbox secured in a small concrete pad. Drilling, core collection, and well installation began on March 21, 2016, and concluded on March 23, 2016. The depth to water measured in the adjacent well MA–FSW 750–0048 is about 28 ft below land surface, which is an altitude of approximately 2 ft above sea level (table 1).
Rotosonic drilling was used to collect sediment cores and install well F750–0100 in part because sonic drilling provides a continuous and relatively undisturbed core sample of higher quality and accuracy than conventional overburden drilling methods such as rotary and auger drilling (Boart Longyear, 2011). Sediment cores 4 in. in diameter were collected in 10-ft lengths in advance of the drill casing. Once brought to the surface, the contents of the 10-ft-long core barrel were extracted into two 5-ft-long, 5.5-in.-diameter flexible plastic bags. Bags were carefully laid out and transported in open plastic rain gutters to minimize disturbance during handling and storage. Cores with mostly sand became disaggregated during unloading. Cores with silt and clay remained aggregated but were locally stretched or bent during drilling and recovery. Core recovery ranged from <40 percent to nearly 100 percent of the 10-ft-long cored intervals, with an average recovery of 75 percent (Hull and Stone, 2019). Core samples were processed offsite several weeks after drilling was completed.
Table 1. Physical characteristics of monitoring well MA–FSW 750–0100 in East Falmouth, Massachusetts.
[Altitude is approximate. Depths are relative to local land surface. Location of well shown on figure 2. USGS, U.S. Geological Survey; NAD 27, North American Datum of 1927; NGVD 29, National Geodetic Vertical Datum of 1929]
Characteristic Data
U.S. Geological Survey site identifier 413430070334202
Longitude, NAD 27 -70°33'42.21"
Latitude, NAD 27 41°34'30.41"
Land surface altitude, in feet relative to NGVD 29
30
Well casing total depth, in feet 310
Borehole diameter, in inches 6
Well screen and casing diameter, in inches 4
Well screen slot size, in inches 0.010
Depth to top of screened interval, in feet 27.5
Depth to bottom of screened interval, in feet 100
Depth to water, in feet 28**Water level measured at adjacent well MA–FSW 750–0048 on
June 16, 2015.
To determine where to set the screened interval of the well, pore-water salinity was tracked during the drilling. Following the collection of each core, deionized water and approximately 100–200 cubic centimeters of sediment were mixed together and allowed to sit for several minutes. Specific conductance measurements made on the slurry started increas-ing at approximately 100 ft, indicating the probable top of the transition zone between freshwater and saltwater.
Core Examination and Sediment Analysis
During core processing, cores were scraped down to a flat surface and then photographed. Digital photographs were taken of 8-in.-long sections of core in a lightbox that evenly distributed indirect fluorescent lighting onto the core. The digital images were assembled to create a photo log shown in detail in Hull and Stone (2019).
Cored material was examined visually to create a lithostratigraphic log of sediment characteristics, including mode and maximum grain-size classified by the phi scale (Wentworth, 1922); the presence of structural features such as beds (>0.4 in. thick) and laminations (<0.4 in. thick); and sediment color according to Munsell soil standards (Munsell Color, 2010). Grain-size observations in this report are discussed in terms of mode (most commonly observed grain size) and are reported to a precision of 0.5 on the phi scale. Estimates of sediment texture characteristics, such as roundness, sphericity (Wadell, 1932, fig. 2), and sorting (Tucker, 2011), and feel assessments of clay and silt content (Thien, 1979) were made for 81 selected sediment samples.
Quantitative assays of grain-size distribution were con-ducted on 26 samples of cored material, with each sample rep-resenting composites of intervals that appeared to be homog-enous. Grain-size analyses were conducted by the USGS Sediment Laboratory in Louisville, Kentucky. The gravel and sand fractions were determined by dry sieving. Silt and clay fractions were determined for samples that appeared to have fine-grained material by using the visual-accumulation-tube and pipette methods (Shreve and Downs, 2005).
The hydraulic conductivity of grain-size samples was estimated using 15 empirically and semi-empirically derived equations included in the HydrogeoSieveXL software (Devlin, 2015). Software defaults for several parameters were used to estimate hydraulic conductivity for the sake of consistency. A software default of 20 degrees Celsius (°C) was used although groundwater temperatures on Cape Cod are closer to 10 °C. For equations that estimate hydraulic conductivity incorporat-ing temperature-dependent variables such as viscosity and density, the use of the higher temperature inflates estimates of hydraulic conductivity. However, the error introduced does not alter the conclusions of this report. Many empirical and semi-empirical equations are designed for specific sedi-ment types, such as uniformly graded sands (Devlin, 2015). Although every grain-size sample from site F750 met the application criteria of at least one of the 15 equations available

Methods of Well Construction, Data Collection, and Analysis 9
in HydrogeoSieveXL, no single equation could be applied to all 26 samples. For this reason, hydraulic conductivity results are reported here as the median result from all 15 equations (Hull and Stone, 2019). Additional limitations of the grain-size method for estimating hydraulic conductivity are discussed in the “Borehole Nuclear Magnetic Resonance” results section in this report. The equations are discussed in greater detail in Vukovic and Soro (1992) and Devlin (2015) and are listed in Hull and Stone (2019).
Geophysical Methods
Geophysical data were collected by using passive seismic and transient electromagnetics surface methods and the elec-tromagnetic induction, natural gamma, and nuclear magnetic resonance borehole methods. The resulting geophysical data, along with a summary of the data collection and processing methods, are available in Johnson and others (2019).
Surface Horizontal-to-Vertical Spectral Ratio Seismics
A passive seismic technique was used to estimate the depth to bedrock. The horizontal-to-vertical spectral ratio (HVSR) seismic method uses a three-component seismometer to measure the vertical and horizontal components of ambient seismic noise. Seismic noise in the range of about 0.1 to 1 Hz is caused by ocean waves, large regional storms, and tectonic sources. A resonance frequency is induced in the uncon-solidated units when there is a substantial contrast (>2:1) in shear-wave acoustic impedance between the overburden and the bedrock. The resonance frequency is determined from the analysis of the spectral ratio of the horizontal and vertical components of the seismic data. The thickness of the over-burden can be related to the resonance frequency. In general, lower resonance frequency relates to thicker sediments, and higher resonance frequency relates to relatively thinner over-burden (Lane and others, 2008).
The HVSR survey data were collected on August 23, 2015. The seismometer was set in the grass on the baseball field at East Falmouth Elementary School approximately 100 ft north of site F750. Data were collected for 20 minutes. The seismic data were processed and analyzed to compute the average spectrums of the two horizontal components and the vertical component, from which the ratio of the horizontal to vertical amplitude spectrums was computed. The plotted horizontal and vertical amplitude spectra were examined to determine the resonance peak and resonance frequency. The methods for collecting and processing the data are briefly described in Johnson and others (2019).
Surface Transient ElectromagneticsA transient electromagnetic (TEM) method was used to
characterize the lithology and salinity of the subsurface. TEM
induction surveys provide resistivity soundings of the subsur-face, which can be related to lithostratigraphy and hydrogeol-ogy. Electrical current is cycled through a wire in a transmitter loop, which in turn produces a static magnetic field. When the current is abruptly terminated, an instantaneous current is induced in the subsurface, and it moves downward and outward as the induced current decays with time. The decay is controlled by the resistivity of the subsurface materials. One or more receivers at the center of the transmitter loop measure the change in the secondary magnetic field as a func-tion of time (dB/dt). Decaying voltage measurements at the receiver are converted to apparent resistivity, which can be inverted to recover the depth-dependent resistivity structure of the subsurface.
On June 5, 2015, TEM data were acquired on the baseball field at East Falmouth Elementary School 100 ft from site F750. Data were collected using an ABEM WalkTEM unit (acquisition software version 1.1.0.112). The technical aspects of the TEM survey are in Johnson and others (2019). The TEM data were processed with ViewTEM version 2.0.2 to generate an average time-series decay curve with the removal of noisy data points. The TEM decay data were inverted without constraint by using both smooth model and layered model approaches to generate resistivity models of the subsurface. These resistivity models can be related to the stratigraphy. The smooth model, which had 20 layers, was effective for identifying the transition from freshwater to saltwater. The layered model, which had five layers, was effective in identifying the contacts associated with the hydrostratigraphic layers, such as the top of the saline zone or the depth to bedrock. The data in Johnson and others (2019) include the raw and processed TEM data and inverted soundings showing resistivity with depth at the survey site.
Borehole Electromagnetic InductionA borehole electromagnetic induction (EMI) log was
collected on April 5, 2016, to identify changes in lithology and water salinity with depth. EMI logs provide a measurement of the bulk electrical conductivity of the formation and fluids sur-rounding the borehole (Williams and others, 1993). EMI logs were collected using a logging rate of 10 to 15 feet per minute (ft/min) with a Century Geophysical Corporation 9510 tool. Measurements of electrical conductivity were reported in millisiemens per meter (mS/m) with a vertical resolution of about 2 ft. The tool is most sensitive to geologic materials about 1 to 1.5 ft from the tool. However, the measurement is also affected to a lesser extent by materials outside of this zone within 5 ft of the tool in all directions. Thus, the full-tool response requires a measurement centered in a unit that is at least 10 ft thick. The measurement is relatively insensitive to the electrical conductivity of the fluids in the borehole for diameters <8 in. and is therefore effective at measuring the electrical conductivity of the formation and the fluids within the formation. The EMI tool was calibrated before log-ging, and the calibration was checked at the end of logging.

10 Bedrock Boring Lithostratigraphic, Geophysical, and Hydrogeologic Observations in East Falmouth, Massachusetts
The data collection and tool calibration are summarized in Johnson and others (2019).
Changes in bulk electrical conductivity are caused by variations in porosity, concentration of dissolved solids of the water in the formation, and metallic mineral content. The EMI log is used to delineate the combined changes in the lithology and the salinity of the water in the formation. In general, clay-rich sediments have higher conductivity than sand and gravel. In well F750–0100, the high EMI conductivity is related to units that contain saline water and more fine sand to clay than coarse sand, whereas units with low EMI conductivity are related to deposits that contain freshwater and coarse sand, which has a lower electrical conductivity than fine sand and clay.
Borehole Natural Gamma Radiation
A borehole natural gamma log was collected on April 5, 2016, in well F750–0100 and used to identify changes in lithostratigraphy and provide verification of the depths to features indicated in the lithostratigraphic logs. Gamma logs can be effective for correcting lithostratigraphic logs for zones with <100-percent recovery in the core samples. Gamma logging measures the naturally occurring gamma radiation of the formation surrounding the borehole. In general, clay emits more gamma radiation than sand and gravel because the weathering byproducts of minerals (potassium feldspar, mica, monazite, and allanite) tend to concentrate potassium, uranium, and thorium by ion absorption and exchange in the clay structures. The vertical resolution of the gamma probe is 1 to 2 ft, and it can sense radiation through PVC and steel casing (Keys, 1990). The natural gamma emissions were measured in counts per second, and the borehole was logged at 10 to 15 ft/min by using a Century Geophysical Corporation multiparameter 8144C probe. The gamma tool is most effective in identifying the contacts between coarse and fine materials. The contacts between units are placed at one half of the amplitude shift of the gamma tool response across the contact.
Borehole Nuclear Magnetic Resonance
A pulsed nuclear magnetic resonance (NMR) borehole tool was used on July 25–26, 2016, to characterize the aquifer surrounding well F750–0100 by using a Javelin JP–238 tool manufactured by Vista Clara, Inc. (Walsh and others, 2013). The NMR tool, which has a diameter of 2.38 in., fit into the 4-in.-diameter well and measured the water content behind the PVC casing and slotted screen at a radial distance of about 5.5 to 6.0 in. from the center of the tool. The tool does not use any nuclear sources but instead uses static magnets and radio frequency fields to cause the resonance of hydrogen protons in the water. The NMR method does not require direct contact with the formation. Instead, the tool causes magnetic reso-nance in the zone surrounding the borehole and measures the
resonance in a thin shell (0.08 in. thick) focused at a radial distance targeted to be beyond the zone disturbed by drilling. Dual-frequency measurements were made at center frequen-cies of approximately 290 and 245 kilohertz, which control the radial focusing of the signal. The vertical resolution of the measurement was 1.6 ft. A total of 182 stationary measure-ments were made at 1.6-ft intervals from the bottom of the well up to the land surface. The data collection and processing methods are briefly listed in Johnson and others (2019).
At each measurement depth, the water molecules align with the static magnets in the tool. A radio frequency field is used to perturb the magnetic field and cause the protons to be tipped into the transverse plane normal to the background field. Following the imposed perturbation, the tool measures the strength of the magnetic field that is produced as protons in the water molecules precess to the background magnetic field (imposed by the magnets). The signal strength decreases exponentially with time in what is called the “T2 decay.” The initial magnetic field strength in the T2 decay is directly pro-portional to the amount of water in the measurement zone. The timing or rate of the T2 decay indicates the pore size distribu-tion, with fast T2 decays related to small pore sizes, and long decay times related to large pore sizes. The echo spacing was 1.5 milliseconds (ms), and two relaxation times (Tr) were used: a full Tr of 5 seconds and burst-mode Tr of 0.8 second. The measurements were stacked 16 times for the full Tr and 96 times for the burst-mode Tr. The duration of the stationary measurements was approximately 3 minutes per measurement or approximately 33 feet per hour.
The NMR data were processed using the manufac-turer’s software (VC_Javelin_Processor version 3.4.3). In postprocessing, the full- and burst-mode measurements were combined for each 1.6-ft depth increment. Each frequency was processed separately and then combined after process-ing. An impulse noise filter was used to despike the noise in the T2-decay data. The data were also adjusted by removing the ambient noise collected with an external reference coil measured concurrently with the subsurface measurement. In addition, results from each frequency were combined, and the resultant T2 decay was fit with a multiexponential decay curve that was inverted to produce a pore-size distribution model. For each depth, the pore-size distribution was shown as a frac-tion of the total water content.
For each depth interval, the total-, mobile-, and immo-bile-water fractions were determined by using empirically derived cutoff values of T2 relaxation times (Straley and others, 1997). The total water content includes the mobile and immobile fractions of water. The mobile fraction, which is the fraction that decays after the 33 ms cutoff, represents the effective porosity. The immobile fraction, which includes the clay and capillary fractions that decay before the 33 ms cutoff, represents bound water. The clay-fraction cutoff was set at a relaxation time of 3 ms. The output from the interpretation program included comma-separated data files for the T2 decay and the water content (total-, mobile-, and immobile-water fractions), which were imported into the composite plots of

Lithostratigraphic Characterization of the Study Area 11
well logs for direct comparison with the gamma, EMI, and lithostratigraphic logs.
Estimates of hydraulic conductivity were made using NMR data and two unit-dependent equations: the Schlum-berger-Doll research (SDR) equation (Kenyon and others, 1988) and the sum of echoes (SOE) equation (Allen and others, 2000). The SDR equation uses the measured values of total porosity (ϕ) and the mean log T2 (MLT2), as follows:
Ksdr = C ɸm MLT2n, (1)
where Ksdr is the SDR hydraulic conductivity in meters
per day (m/d), C is an empirically derived constant that was set
to the default parameter of 8,900, m is an empirically derived constant that is
generally about 1 for unconsolidated sands (Behroozmand and others, 2014), and
n is an empirically derived constant fixed at 2 (Grunewald and others, 2013).
The SOE equation uses the summed amplitudes of the echoes in the T2 decay for each depth interval to compute the SOE hydraulic conductivity (Ksoe), as follows:
Ksoe = C × ∑SE2, (2)
where Ksoe is the SOE hydraulic conductivity in meters
per day (m/d), C is an empirically derived constant set to
4,200, and SE is the measured sum of echoes (Grunewald
and others, 2013).The results for Ksdr and Ksoe were then converted to feet per day.
Lithostratigraphic Characterization of the Study Area
The sediment cores obtained from the deep boring provided detailed information about the lithostratigraphy near the southern coast of western Cape Cod. The cored material extracted from the boring at site F750 is described in this sec-tion of the report, and the observations are compared with the unconsolidated sediments observed elsewhere within Mash-pee pitted plain deposits on western Cape Cod. This section also includes a discussion of the relationship of the deposits observed at site F750 to the depositional history of the south-ern coast of western Cape Cod. All interpretations in this sec-tion are limited by the paucity of nearby lithological data.
Lithostratigraphic Units From Direct Observation
The 310 ft of cored material collected at site F750 is divided into 12 lithostratigraphic units (fig. 3; table 2). Each unit represents a thickness of generally similar sediment with distinct lithostratigraphic properties, such as sediment texture, color, and bedding structure. The graphical representation of the horizontal width of the unit patterns (fig. 3D) is scaled by the most commonly occurring grain size in units of the Wentworth (1922) phi scale. The unit designations help locate the lithostratigraphic observations in conceptual models of the regional hydrogeology and glacial history described in greater detail later in the report. The lithostratigraphy can generally be characterized as a fining downward sequence to 175 ft, below which sediment generally coarsens downward to 300 ft. A nonsorted, silt- and clay-rich layer extends from 300 to 305 ft. The bedrock surface was encountered at 305 ft. Depth values in the following sections were rounded to the nearest whole number for convenience.
• Unit 1 (0–37 ft) and Unit 2 (37–107 ft)—Well-sorted, coarse to very coarse sand with scattered and bedded pebbles and gravels grades to medium to coarse sand. Silt is present in only trace amounts in both units, except in scattered thin (<2 in.) beds. Large (>0.4-in.-diameter) pebbles are common in Unit 1, in places forming beds 4 to 8 in. thick, but they are scattered and less common in Unit 2.
• Units 3 to 7 (107–175 ft)—Finely laminated silt-rich very fine sand and fine sand that contain several promi-nent clay-rich layers. At 107 ft, a nonsorted silt- and clay-rich layer (Unit 3) marks an abrupt lithologic contact between the overlying medium to coarse sand of Unit 2 and the silty very fine sand of Unit 4 (108–147 ft). Within Unit 4, thin (<0.4 in.) interlaminations of silty very fine sand and fine sand are common; interlaminations are horizontal where disturbance from core extraction is minimal. Thin (0.4–4 in.) beds of silt and some clay are also common. A nonsorted silt- and clay-rich layer (Unit 5) from 147 to 148 ft is nearly identical to Unit 3. Unit 6 (148–165 ft) is similar to Unit 4, although the very fine sand contains less silt. The fining downward sequence from Unit 1 to Unit 7 concludes with a silt-rich layer that extends from 165 to 175 ft (Unit 7). Below Unit 7, the sediment gradu-ally coarsens with depth.
• Unit 8 (175–254 ft)—Fine to coarse sand is punctuated by secondary units of very fine sand, silt, and clay. Well-sorted sand is present in banded intervals 5 ft or greater in thickness and is interlayered with 1- to 3-ft-thick deposits of very fine sand, silt, and clay. The very fine sand, silt, and clay features recur cyclically perhaps 10 times (fig. 4A). Contacts between the fine and coarse materials are sharp. In general, this unit coarsens downward; the coarse features become

12 Bedrock Boring Lithostratigraphic, Geophysical, and Hydrogeologic Observations in East Falmouth, Massachusetts
Unit
1. C
oars
e to
ver
y co
arse
san
dw
ith s
catte
red
and
bedd
edpe
bble
s an
d gr
avel
s
Unit
2. C
oars
e sa
nd, g
radi
ng in
to m
ediu
msa
nd in
som
e in
terv
als;
peb
bles
and
grav
els
scat
tere
d an
d le
ssco
mm
on th
an in
Uni
t 1
Unit
3. N
onso
rted
fine
sand
, silt
,gr
anul
es, a
nd c
lay
Unit
4. F
ine
(< 1
cm
) int
erla
min
atio
nsof
silt
y ve
ry fi
ne s
and
and
fine
sand
Unit
5. N
onso
rted
fine
sand
, silt
,gr
anul
es, a
nd c
lay
Unit
6. F
ine
(< 1
cm
) int
erla
min
atio
nsof
ver
y fin
e sa
nd a
nd fi
nesa
nd w
ith s
ome
silt
Unit
7. S
ilty v
ery f
ine
sand
with
inte
rbed
ded
clay
com
pone
nts
Unit
8. C
oars
enin
g do
wnw
ard
fine
to c
oars
e sa
nd, p
unct
uate
d by
sec
onda
ry u
nits
of
very
fine
san
d, s
ilt, a
nd c
lay
Unit
9. F
ine
and
very
fine
san
d in
terb
edde
dw
ith s
ilt a
nd c
lay
Unit
10. C
oars
e to
ver
y coa
rse
sand
with
trac
e pe
bble
s an
d gr
avel
s
Unit
11. C
ompa
ct, n
onso
rted
fine
sand
, silt
, gra
nule
s, a
ndtra
ce c
lay
Unit
12. C
ryst
allin
e be
droc
k
Depth, in feet below land surface
0 10 20 30 40 50 60 70 80 90 100
110
120
130
140
150
160
170
180
190
200
210
220
230
240
250
260
270
280
300
290
310
A.
TEM
laye
red
mod
el
B.
TEM
sm
ooth
mod
el
C.
Nat
ural
gam
ma
log
D.
Lith
ostr
atig
raph
y
Screened intervalDe
scrip
tion
pebb
lesi
ltcl
aysa
nd
vc
fvf
cm
Wel
ldi
agra
m0
Radi
oact
ivit
y, in
co
unts
per
sec
ond
200
100
110
010
11,
000
EMI c
ondu
ctiv
ity,
in m
S/m
EMI c
ondu
ctiv
ity,
in m
S/m
110
010
11,
000
TEM
con
duct
ivit
y, in
mS
/mTE
M c
ondu
ctiv
ity,
in m
S/m
Figu
re 3
. Th
e A,
laye
red-
mod
el a
nd B
, sm
ooth
-mod
el in
terp
reta
tions
of t
he tr
ansi
ent e
lect
rom
agne
tic (T
EM) s
ound
ings
, and
the
bore
hole
ele
ctro
mag
netic
in
duct
ion
(EM
I) lo
g, C
, nat
ural
gam
ma
log,
and
D, l
ithos
tratig
raph
ic u
nits
def
ined
by
this
stu
dy fo
r wel
l MA–
FSW
750
–100
in E
ast F
alm
outh
, Mas
sach
uset
ts.
Stra
tigra
phic
uni
t des
crip
tions
are
bas
ed o
n gr
ain-
size
dia
met
er a
ccor
ding
to th
e ph
i sca
le (W
entw
orth
, 192
2). F
ill p
atte
rn fo
r lith
ostra
tigra
phic
uni
ts is
from
the
Fede
ral G
eogr
aphi
c Da
ta C
omm
ittee
“Di
gita
l Car
togr
aphi
c St
anda
rd fo
r Geo
logi
c M
ap S
ymbo
lizat
ion”
(U.S
. Geo
logi
cal S
urve
y, 2
006)
. mS/
m, m
illis
iem
ens
per m
eter
; vf
, ver
y fin
e; f,
fine
; m, m
ediu
m; c
, coa
rse;
vc,
ver
y co
arse
; <, l
ess
than
; cm
, cen
timet
er.

Lithostratigraphic Characterization of the Study Area 13Ta
ble 2
. Li
thos
tratig
raph
ic u
nits
iden
tifie
d in
bor
ing
MA–
FSW
750
in E
ast F
alm
outh
, Mas
sach
uset
ts.
[Hyd
raul
ic c
ondu
ctiv
ity w
as e
stim
ated
from
gra
in-s
ize
dist
ribut
ions
by
usin
g th
e H
ydro
geoS
ieve
XL
softw
are
(Dev
lin, 2
015)
. Phi
val
ues a
re lo
g 2-mod
e gr
ain
size
, in
mill
imet
ers (
from
Wen
twor
th, 1
922)
; coa
rse
sedi
men
ts h
ave
low
phi
val
ues,
and
fine
sedi
men
ts h
ave
high
phi
val
ues.
Loca
tion
of u
nits
show
n in
figu
re 3
. ft,
foot
; bls
, bel
ow la
nd su
rfac
e; ft
/d, f
oot p
er d
ay; f
t2 /d, f
oot s
quar
ed p
er d
ay; <
, les
s tha
n; c
m, c
enti-
met
er; —
, no
data
]
Uni
t
Dep
th
to to
p of
uni
t (ft
bls
)
Dep
th to
bo
ttom
of
uni
t (ft
bls
)
Des
crip
tion
Dep
ositi
onal
inte
rpre
tatio
n
Mos
t co
mm
only
oc
curr
ing
grai
n si
ze
(phi
)
Num
-be
r of
sam
ples
an
alyz
ed
for g
rain
si
ze
Aver
age
hydr
aulic
co
nduc
-tiv
ity
(ft/d
)
Hyd
raul
ic c
ondu
ctiv
ity
(ft/d
)Tr
ans-
mis
sivi
ty
(ft2 /d
ay)
Min
imum
Max
imum
10
37C
oars
e to
ver
y co
arse
sand
with
scat
tere
d an
d be
dded
peb
bles
and
gra
vels
Del
taic
tops
et b
eds
0.0
232
022
042
02,
200
237
107
Coa
rse
sand
, gra
ding
into
med
ium
sand
in
som
e in
terv
als;
peb
bles
and
gra
vels
scat
-te
red
and
less
com
mon
than
in U
nit 1
Del
taic
fore
set b
eds
0.5
413
017
240
9,10
0
310
710
8N
onso
rted
fine
sand
, silt
, gra
nule
s, an
d cl
ayA
dro
p-cl
ot o
f gla
cial
deb
ris;
cont
act b
etw
een
delta
ic fo
rese
t be
ds a
nd d
elta
ic b
otto
mse
t bed
s
9.0
10.
006
0.00
60.
006
<1
410
814
7Fi
ne (<
1 cm
) int
erla
min
atio
ns o
f silt
y ve
ry
fine
sand
and
fine
sand
Del
taic
bot
tom
set b
ed3.
53
1.8
0.62
04
100
514
714
8N
onso
rted
fine
sand
, silt
, gra
nule
s, an
d cl
ayA
dro
p-cl
ot o
f gla
cial
deb
ris9.
01
0.00
20.
002
0.00
2<1
614
816
5Fi
ne (<
1 cm
) int
erla
min
atio
ns o
f ver
y fin
e sa
nd a
nd fi
ne sa
nd w
ith so
me
silt
Del
taic
bot
tom
set b
eds a
nd
glac
iola
cust
rine
depo
sits
2.0
116
1616
300
716
517
5Si
lty v
ery
fine
sand
with
inte
rbed
ded
clay
co
mpo
nent
sG
laci
olac
ustri
ne d
epos
its4.
01
0.08
20.
082
0.08
2<1
817
525
4C
oars
enin
g do
wnw
ard
fine
to c
oars
e sa
nd,
punc
tuat
ed b
y se
cond
ary
units
of v
ery
fine
sand
, silt
and
cla
y
Pred
elta
ic, d
ista
l lac
ustri
ne fa
n la
ke-b
otto
m d
epos
its1.
57
600.
0015
140
4,70
0
925
426
7Fi
ne a
nd v
ery
fine
sand
inte
rbed
ded
with
si
lt an
d cl
ayLo
cal g
laci
olac
ustri
ne d
epos
it3.
02
0.47
20.
012
0.93
1<1
1026
730
0C
oars
e to
ver
y co
arse
sand
with
trac
e pe
bble
s and
gra
vels
Pre-
delta
ic, c
oars
e-gr
aine
d pr
oxi-
mal
lacu
strin
e fa
n de
posi
ts0.
03
160
100
230
5,30
0
1130
030
5C
ompa
ct, n
onso
rted
fine
sand
, silt
, gr
anul
es, a
nd tr
ace
clay
Wis
cons
inan
bas
al ti
ll9.
01
0.00
40.
004
0.00
4<1
1230
5—
Cry
stal
line
bedr
ock
Cry
stal
line
bedr
ock
——
——
——

14 Bedrock Boring Lithostratigraphic, Geophysical, and Hydrogeologic Observations in East Falmouth, MassachusettsDe
pth,
in fe
et b
elow
land
sur
face
C. Core photographs
0 20015010050
pebblesiltclay sand
vcfvf cm
B. Natural gamma logA. Generalized lithology
Radioactivity, in counts per second
170
180
190
200
210
220
230
240
250
260
270Very fine sand and finer
No core recovered
Figure 4. The borehole interval from 170 to 270 feet below land surface at well MA–FSW 750–0100 in East Falmouth, Massachusetts, showing A, lithologic features based on visual examination of the sediment cores, B, the natural gamma log, and C, photographs of sediment cores. Length of bars showing lithologic features are scaled on the horizontal axis by the most commonly occurring grain size based on the Wentworth (1922) phi scale. Fine-grained lithologic features are highlighted in blue. Gaps where no core was recovered are shown in light brown. vf, very fine; f, fine; m, medium; c, coarse; vc, very coarse.

Lithostratigraphic Characterization of the Study Area 15
coarser and the fine features become less common with depth.
• Unit 9 (254–267 ft) and Unit 10 (267–300 ft)—Fine and very fine sand with interbedded silt and clay layers (Unit 9) abruptly transitions to well-sorted coarse and very coarse sand (Unit 10). Unit 10 is similar in grain size and texture to Unit 1, although it contains fewer pebbles and gravels.
• Unit 11 (300–305 ft) and Unit 12 (>305 ft)—A compacted, nonsorted fine sand, silt, granular pebble, and trace clay layer directly above bedrock. Similar though not compacted silt- and clay-rich layers were encountered at 107 ft (Unit 3) and 147 ft (Unit 5). The bedrock (Unit 12) is a crystalline metaigneous rock that was unweathered where encountered at the bedrock surface.
Implications of Observed Lithostratigraphy for Depositional Models of Western Cape Cod
The unconsolidated sediments within the Mashpee pitted plain deposits on western Cape Cod generally fine downward, as described by the conceptual model of deltaic and lacus-trine deposition presented in Masterson and others (1997a). At site F750, the fining downward sequence in the shallow (<175 ft) deposits likely represents the topset, foreset, and bot-tomset beds characteristic of progradational deltaic deposition. However, the coarse deposits from 175 to 254 ft and 267 to 300 ft are not characteristic of the lacustrine sediments that have been reported beneath the deltaic deposits in some areas on western Cape Cod (Masterson and others, 1997b). The complicated lithostratigraphy at depth is consistent with recent observations (Uchupi and Mulligan, 2006; Stone and DeGia-como-Cohen, 2009) that point to a varied depositional history on the southern coast of western Cape Cod.
The sand and gravel of Unit 1 (table 2) represents the deltaic topset beds deposited by braided streams and are pres-ent elsewhere on western Cape Cod (Masterson and others, 1997a). Unit 2 is identified as dipping deltaic foreset beds (table 2), although the dip of the beds was not preserved dur-ing collection and extraction of the cores. Gravel beds are common in Unit 1, whereas gravel deposits are isolated and uncommon (characteristic of lone dropstones1) in Unit 2. The contact between the two units is distinct at the base of a fluvial bed, as proposed by the model of deltaic deposition for topset and foreset beds of Masterson and others (1997a). The gradual decrease in mode grain-size with depth within and between Units 1 and 2 and the contrast in gravel content are also con-sistent with a deltaic depositional model.
1An oversized clast in laminated sediment that depresses the underlying laminae and may be covered by “draped” laminae. Most dropstones originate through “ice-rafting;” other sources are floating tree roots and kelp holdfasts.
The 56-ft-thick horizontally laminated, silty very fine sand of Units 4 and 6 and silt- and clay-rich sediments of Unit 7 represent irregularly layered bottomset beds and glaciolacustrine facies, respectively. Masterson and others (1997a) proposed that these sediments were deposited in an environment near the glacial lake bottom during a single lacustrine interval related to recession of the last ice mar-gin. Units 3 and 5 are 1-ft-thick discrete, nonsorted silt- and clay-rich deposits that interrupt the laminated glaciolacustrine succession. These two units are similar in their texture to the unit identified as basal till (Unit 11) but are not compacted. These deposits have sharp bounding contacts and could represent temporal disconformities within the laminated succession. Because of their limited thickness, nonrepetitive occurrence, and lack of large disturbances or mixing with adjacent beds, Units 3 and 5 likely were derived from slough-ing of mixed glacial debris (flow till, other sediments) from passing icebergs.
The 79-ft-thick fine to coarse sand of Unit 8 represents conditions near the bottom of the glacial lake where meltwater currents carried a sandy load. Approximately 10 periods of cyclically occurring sand are interrupted by thin beds of very fine sand, silt, and clay (fig. 4) that represent perturbations of the flow that probably derived from ice slopes, ice channels, or tunnels among stagnant ice blocks that sat grounded on the basin floor nearby. Some of these thin beds may be a melange of mixed sediment that cascaded down a nearby ice-contact sediment slope (Uchupi and Mulligan, 2006). The sandy units within Unit 8 coarsen with depth, suggesting increasing proximity with depth to a sediment source. A layer of interbed-ded very fine sand and silt (Unit 9) could be a local lacustrine deposit that accumulated in environments more protected than those that formed the beds of Unit 8.
Uniformly coarse to very coarse sand that is 33 ft thick (Unit 10) sits at the base of the meltwater sediment sec-tion. Similar sand in similar positions beneath bottomset and lacustrine deposits has been observed (fig. 2) at bor-ings east (CCC 1; Cambareri and Eichner, 1998), north-west (95MW0104; Uchupi and Mulligan, 2006), and south (MA–FSW 341; Masterson and others, 1997b) of site F750. A gamma log collected at MA–FSW 341 shows a continuous vertical interval of low gamma intensity at an altitude of 235 to 270 ft below sea level, similar to the gamma-log intensity at approximately 237 to 270 ft below sea level at Unit 10 at site F750.
The coarse sand deposits of Unit 10 (fig. 3) may be related to late Wisconsinan ice-contact deposits (fig. 2) that extend from the surface to the basin bottom in locations to the west (Falmouth Heights ice-contact deposits) and east (Great Neck and Nantucket Sound ice-contact deposits). These deposits have long been interpreted to be local, collapsed, ice-marginal sediments related to the retreating edge of the Cape Cod Bay ice lobe (Oldale and Barlow, 1986). Close inspection reveals that the Great Neck map unit contains multiple small ice-contact morphosequences, with local ice-channel features and with depositional slopes graded to the 10-ft surface of

16 Bedrock Boring Lithostratigraphic, Geophysical, and Hydrogeologic Observations in East Falmouth, Massachusetts
the adjacent Mashpee pitted plain. The ice-contact deposits of Nantucket Sound (fig. 2) are the heads of small deltas in the same glacial lake. An alternative interpretation of these ice-contact deposits is that they represent the remnants of a continuous ridge that dammed a separate proglacial lake beneath the Mashpee pitted plain (Uchupi and Mulligan, 2006; Baldwin and others, 2016). This interpretation, however, is not supported by observations at site F750. Surface expressions of a buried, massive ice-marginal ridge, perhaps 1 kilometer wide from north to south, do not exist on land or in the closest high resolution marine data along the coast. Large kettle holes are not present; no offshore moraines have been discovered (fig. 2C). Similar coarse-grained material at the base of appar-ent glacial sequences under Nantucket Sound has been hypoth-esized to be Cretaceous coastal plain sediment or Illinoian drift (O’Hara and Oldale, 1987; Uchupi and Mulligan, 2006). However, the presence of basal till beneath these coarse-grained deposits, as found in the boreholes on Cape Cod, would not seem to support the argument that these deposits are made up of Cretaceous coastal plain sediment (fig. 2C).
Units 8, 9, and 10 (175–300 ft) define a downward-coarsening sedimentary sequence related to deposition of a fan of coarse sand on the bottom of the lake basin, derived from meltwater flow from the mouth of a tunnel or from cracks in stagnant ice blocks sitting and melting on the lake bot-tom (Rust and Romanelli, 1975; Boothroyd and McCandless, 2003). Lacustrine fans of similar size and position mapped in the Long Island Sound (Stone and others, 2005) and glacial Lake Stellwagen (Stone and others, 2015) basins contain similar sediment types in coarse-grained proximal heads and fine-grained distal tails. The 33 ft of relatively well-sorted sand in Unit 10 may record a few seasons of meltwater flow contained by indistinct boundaries or a single season of sedi-mentation. These coarse-grained deposits were succeeded by the lake-bottom beds of Unit 8, which record at least 10 sandy depositional events. Unit 8 is likely related to sites of ice mar-ginal meltwater sedimentation nearby or strong lake-bottom currents that spread out across the aggrading lake plain. It is likely that many local ice-contact lacustrine fans and toppled deltas exist near the ice-contact deposits of Nantucket Sound, and these coarse basal sequences may underlie large parts of the Mashpee pitted plain.
The compacted layer of nonsorted fine sand, silt, granu-lar pebble, and trace clay deposits above bedrock (Unit 11) is correlated with the late Wisconsinan basal till found in the moraines (Oldale and Barlow, 1986) and similar basal till on bedrock in many deep drill holes (Masterson and others, 1997a) in western Cape Cod. The fresh appearance and sandy and silty matrix of this compacted layer contrasts with the very compacted clayey silt matrix, few pebbles, and weathering features of the older Illinoisan tills found in drumlins in the region (Weddle and others, 1989) and in moraine deposits on Nantucket Island (Oldale and Eskenasy, 1983).
Hydrogeological Characterization of the Study Area
The sediment cores and geophysical data collected at site F750 provided detailed information about the hydro-geologic properties of the aquifer near the southern coast of western Cape Cod. The freshwater/saltwater interface and the thickness and water-transmitting properties of the unconsoli-dated sediment at site F750 are described in this section, and the hydrogeologic characteristics at site F750 are compared with existing conceptual models of the hydrogeology of the southern coast of western Cape Cod.
Hydraulic Conductivity and Transmissivity From Grain-Size Distribution
Grain-size distribution data from cored material were used to estimate the hydraulic conductivity for each lithostrati-graphic unit and identify three major water-transmitting zones in the aquifer (table 2). Grain-size distribution data for each sediment sample are reported in Hull and Stone (2019).
Units 1 and 2 (0–107 ft) compose a zone of relatively high permeability, referred to in this report as the “shallow high-permeability zone.” The grain-size hydraulic conduc-tivity (Kgrain-size) estimates in Units 1 and 2 ranged from 17 to 420 ft/d; of the five samples collected, four had Kgrain-size estimates >100 ft/d. The unsaturated zone above the water table in Unit 1 is about 30 ft thick; therefore, approximately 77 ft of the shallow high-permeability zone has the capacity to transmit water under a hydraulic gradient.
A zone of relatively low permeability is composed of Units 3 to 7 (107–175 ft), referred to in this report as the “low-permeability zone.” Kgrain-size estimates of the silty very fine sand most characteristic of this depth interval range from 0.62 to 4.0 ft/d; overall, Kgrain-size ranges from 0.002 to 16 ft/d. The five orders of magnitude variation in Kgrain-size suggest that thin clay layers (for example, those at 107 and 147 ft) may exert a considerable influence on vertical groundwater flow in this interval.
Units 8 to 10 (175–300 ft) form a deep zone of moder-ate to high permeability, referred to in this report as the “deep high-permeability zone.” Sediment permeability in the deep zone is lower and more variable than in the shallow high-permeability zone. In Unit 8 (175–254 ft), wide variations in lithology are reflected by six orders of magnitude of variation in Kgrain-size, ranging from 0.0015 to 140 ft/d. The coarse sand of Unit 10 (267–300 ft) has an average Kgrain-size of 160 ft/d.
The estimates of Kgrain-size can be used to estimate the contributions of the three zones to total aquifer transmissivity (table 2), which is defined as the product of saturated thickness and hydraulic conductivity (Heath, 1983). The saturated part of the shallow high-permeability zone (30–107 ft) accounts for about half of the water-transmitting capacity of the unconsoli-dated sediments. Horizontal transport of water through the
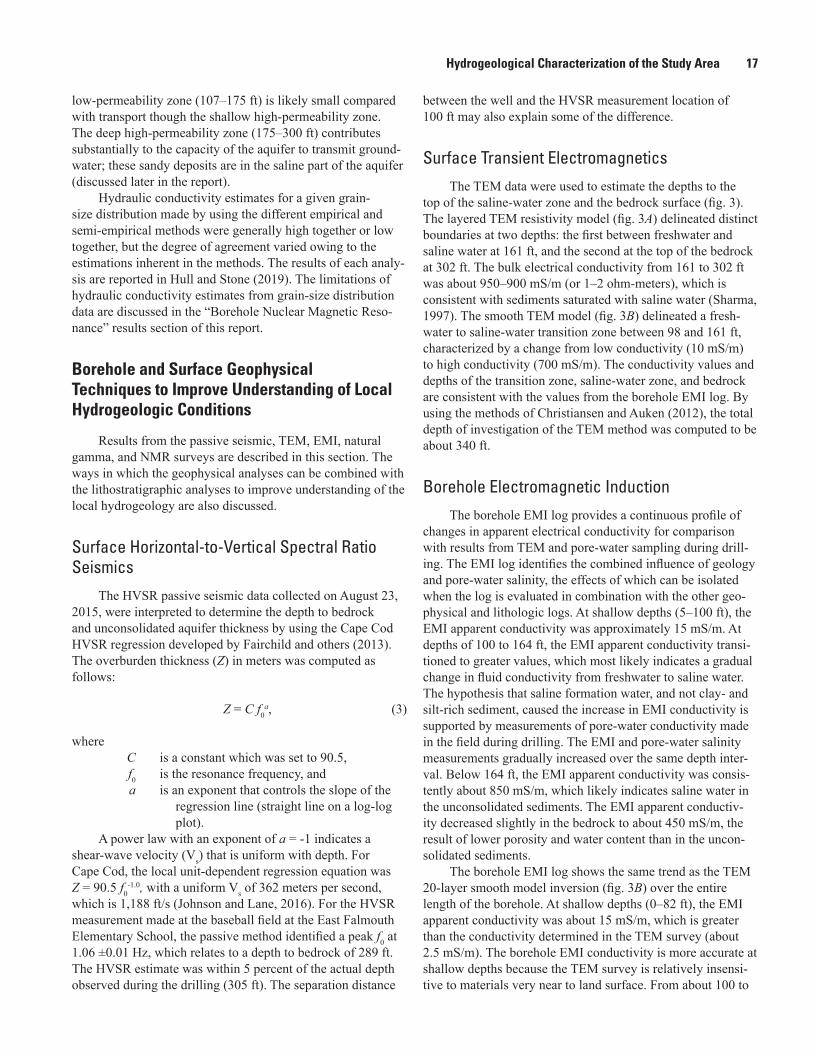
Hydrogeological Characterization of the Study Area 17
low-permeability zone (107–175 ft) is likely small compared with transport though the shallow high-permeability zone. The deep high-permeability zone (175–300 ft) contributes substantially to the capacity of the aquifer to transmit ground-water; these sandy deposits are in the saline part of the aquifer (discussed later in the report).
Hydraulic conductivity estimates for a given grain-size distribution made by using the different empirical and semi-empirical methods were generally high together or low together, but the degree of agreement varied owing to the estimations inherent in the methods. The results of each analy-sis are reported in Hull and Stone (2019). The limitations of hydraulic conductivity estimates from grain-size distribution data are discussed in the “Borehole Nuclear Magnetic Reso-nance” results section of this report.
Borehole and Surface Geophysical Techniques to Improve Understanding of Local Hydrogeologic Conditions
Results from the passive seismic, TEM, EMI, natural gamma, and NMR surveys are described in this section. The ways in which the geophysical analyses can be combined with the lithostratigraphic analyses to improve understanding of the local hydrogeology are also discussed.
Surface Horizontal-to-Vertical Spectral Ratio Seismics
The HVSR passive seismic data collected on August 23, 2015, were interpreted to determine the depth to bedrock and unconsolidated aquifer thickness by using the Cape Cod HVSR regression developed by Fairchild and others (2013). The overburden thickness (Z) in meters was computed as follows:
Z = C f0a, (3)
where C is a constant which was set to 90.5, f0 is the resonance frequency, and a is an exponent that controls the slope of the
regression line (straight line on a log-log plot).
A power law with an exponent of a = -1 indicates a shear-wave velocity (Vs) that is uniform with depth. For Cape Cod, the local unit-dependent regression equation was Z = 90.5 f0
-1.0, with a uniform Vs of 362 meters per second, which is 1,188 ft/s (Johnson and Lane, 2016). For the HVSR measurement made at the baseball field at the East Falmouth Elementary School, the passive method identified a peak f0 at 1.06 ±0.01 Hz, which relates to a depth to bedrock of 289 ft. The HVSR estimate was within 5 percent of the actual depth observed during the drilling (305 ft). The separation distance
between the well and the HVSR measurement location of 100 ft may also explain some of the difference.
Surface Transient Electromagnetics
The TEM data were used to estimate the depths to the top of the saline-water zone and the bedrock surface (fig. 3). The layered TEM resistivity model (fig. 3A) delineated distinct boundaries at two depths: the first between freshwater and saline water at 161 ft, and the second at the top of the bedrock at 302 ft. The bulk electrical conductivity from 161 to 302 ft was about 950–900 mS/m (or 1–2 ohm-meters), which is consistent with sediments saturated with saline water (Sharma, 1997). The smooth TEM model (fig. 3B) delineated a fresh-water to saline-water transition zone between 98 and 161 ft, characterized by a change from low conductivity (10 mS/m) to high conductivity (700 mS/m). The conductivity values and depths of the transition zone, saline-water zone, and bedrock are consistent with the values from the borehole EMI log. By using the methods of Christiansen and Auken (2012), the total depth of investigation of the TEM method was computed to be about 340 ft.
Borehole Electromagnetic Induction
The borehole EMI log provides a continuous profile of changes in apparent electrical conductivity for comparison with results from TEM and pore-water sampling during drill-ing. The EMI log identifies the combined influence of geology and pore-water salinity, the effects of which can be isolated when the log is evaluated in combination with the other geo-physical and lithologic logs. At shallow depths (5–100 ft), the EMI apparent conductivity was approximately 15 mS/m. At depths of 100 to 164 ft, the EMI apparent conductivity transi-tioned to greater values, which most likely indicates a gradual change in fluid conductivity from freshwater to saline water. The hypothesis that saline formation water, and not clay- and silt-rich sediment, caused the increase in EMI conductivity is supported by measurements of pore-water conductivity made in the field during drilling. The EMI and pore-water salinity measurements gradually increased over the same depth inter-val. Below 164 ft, the EMI apparent conductivity was consis-tently about 850 mS/m, which likely indicates saline water in the unconsolidated sediments. The EMI apparent conductiv-ity decreased slightly in the bedrock to about 450 mS/m, the result of lower porosity and water content than in the uncon-solidated sediments.
The borehole EMI log shows the same trend as the TEM 20-layer smooth model inversion (fig. 3B) over the entire length of the borehole. At shallow depths (0–82 ft), the EMI apparent conductivity was about 15 mS/m, which is greater than the conductivity determined in the TEM survey (about 2.5 mS/m). The borehole EMI conductivity is more accurate at shallow depths because the TEM survey is relatively insensi-tive to materials very near to land surface. From about 100 to

18 Bedrock Boring Lithostratigraphic, Geophysical, and Hydrogeologic Observations in East Falmouth, Massachusetts
165 ft, through the transition from fresh to saline groundwa-ter, and in the saline groundwater zone, the EMI and TEM smooth-model layers yield similar conductivity values. The EMI log indicated a decrease in conductivity (corresponding to an increase in resistivity) at 302 ft, which coincides with the top of the bedrock. The TEM models also showed a decrease in conductivity at 302 ft. Both methods accurately identify the depth of the sediment/bedrock interface, but the conductivity values differ in magnitude. The bulk electrical conductivity of the bedrock (about 450 mS/m) is more accurately measured by the EMI log, which has a higher resolution and smaller volume of measurement than the TEM survey.
Borehole Natural Gamma RadiationThe gamma log identifies silt- and clay-rich layers that
can affect vertical transport of groundwater; some of these layers were deformed or missing from the cored material. The borehole gamma log (fig. 3C) shows the counts per second of gamma emissions as a function of depth. Zones with the highest gamma counts are most notable at depths from 105 to 195 ft, at about 220 ft, from 255 to 265 ft, and from 295 to 305 ft; these zones are likely characterized by fine-grained materials. The logs also show zones of mostly lower gamma counts at 5 to 105 ft, 195 to 255 ft, and 265 to 295 ft, which is consistent with core observations of sand deposits with fewer fine-grained sediments. Intermittent gamma spikes from 195 to 255 ft suggest that this is a zone of mixed (fine- and coarse-grained) sediment.
0.00 0.50 1.00 1.50 2.00
0
20
40
60
80
100
120
140
Visually observed mode grain size of sediment, in millimeters
Nat
ural
gam
ma
radi
oact
ivity
, in
coun
ts p
er s
econ
d
Figure 5. Unfiltered natural gamma radioactivity versus mode grain size for 81 selected core samples collected from well MA–FSW 750–0100 in East Falmouth, Massachusetts.
In general, the natural gamma log confirmed the pres-ence and thickness of clay- and silt-rich layers identified by lithostratigraphic observations. An analysis of the logs showed an inverse relation between the visually observed mode grain size and maximum gamma intensity for 81 depth intervals (fig. 5). The vertical clustering of data points is an artifact of the Wentworth (1922) phi scale categories used for the visual grain-size observations. Low gamma counts from land surface to 105 ft (fig. 3) are associated with medium to coarse sand (Units 1 and 2). The sustained high gamma intensity from 105 to 195 ft corresponds to Units 3 to 7 (107–175 ft) and the upper part of Unit 8 (175 to about 200 ft), a zone of interlaminated silty very fine sand and fine sand, and silt- and clay-rich features. The abrupt increase in gamma intensity at 105 ft corresponds with the clay- and silt-rich Unit 3 observed in the cores at 107 ft; the gamma log suggests that several feet of Unit 3 may not have been recovered by coring. From 195 to 295 ft, gamma intensity is generally low, which is consistent with observations of primarily sand (Units 8 and 10) from 175 to 254 ft and 267 to 300 ft. The generally low gamma values are interrupted by several gamma spikes that are strongly associated with one large (Unit 9, 254–267 ft) and several thin (1- to 3-ft-thick) beds of clay, silt, and fine sand. Gamma spikes match closely with observations of fine mate-rial over this depth interval (fig. 4). Gamma results confirm that Unit 11, the compacted, nonsorted fine sand, silt, granular pebble, and trace clay layer starting at 300 ft, extends to bed-rock at 305 ft, although only 0.2 ft of this unit was recovered from the cored interval.
Borehole Nuclear Magnetic ResonanceThe NMR log (fig. 6) provides a continuous profile of
hydraulic properties that otherwise could only be estimated from discrete samples of cored material. The T2 decay is shown as a color amplitude plot (fig. 6A; the x-axis is the relaxation time of the T2 decay in units of log seconds). The amplitude of the water content is shown for each depth as a function of color, with the warm colors (red) indicating high amplitude and cool colors (blue) indicating low amplitude. High amplitudes on the left side of the T2 decay plot indicate water in small pore spaces, such as those in silt and clay. High amplitudes on the right side of the T2 decay plot indicate water in large pore spaces. The pore-size distribution plot (fig. 6B) depicts decay with relaxation time on the x-axis and the volume of the pore sizes as the area under the curve. The total area under the curve reflects the total water content. The part of the distribution to the left of the T2 cutoff (vertical blue line) indicates the immobile fraction of water, and the part of the distribution to the right of the T2 cutoff line indicates the mobile fraction. The total water content and immobile frac-tions of water content are shown as lines in figure 6C.
The NMR results are consistent with the natural gamma radiation and EMI results. The NMR T2-decay log shows the contact between sand and fine material at 105 ft. Above 105 ft, the NMR results are characterized by long relaxation times

Hydrogeological Characterization of the Study Area 19
Amplitude of water content
A. Transverse (T2) decay B. Pore-size distribution C. Water content
T2 c
utof
f
Total water
Immobile water
Fraction of total bulk volumeTime, in log milliseconds (log ms)Time, in log seconds (log s)000 1-1-2 2 3 4 0.2 0.4
0 0.02Water content color intensity
Dept
h, in
feet
bel
ow la
nd s
urfa
ce
20
30
40
50
60
70
80
90
100
110
120
130
140
150
160
170
180
190
200
210
220
230
240
250
260
270
280
290
300
Figure 6. Nuclear magnetic resonance logs from well MA–FSW 750–0100 in East Falmouth, Massachusetts, including A, relaxation time, B, pore-size distribution, and C, total and immobile fractional water content. The nuclear magnetic resonance (NMR) transverse (T2) decay (A) shows water content in color intensity as a function of relaxation time in log seconds [blue indicates low water content and red indicates high (0.02) water content]. The pore-size distribution (B) shows the amplitude of water content as a function of relaxation time in log milliseconds and the T2 cutoff (33 milliseconds) as a dark blue line. All water content less than (relaxation faster than) the T2 cutoff is immobile, and water greater than (longer than) the T2 cutoff is mobile. The total water content (red) and immobile water content (green) as a fraction of the total bulk volume are shown as continuous line plots (C).

20 Bedrock Boring Lithostratigraphic, Geophysical, and Hydrogeologic Observations in East Falmouth, Massachusetts
and high proportions of mobile water. Gamma counts in the same interval are low, indicating coarse-grained sediments as one would expect where the mobile water content is relatively high (fig. 3). In contrast, at depths of 105 to 205 ft, 250 to 265 ft, and 295 to 300 ft, the NMR results are characterized by early time decay in the T2-decay plot and low proportions of mobile water. These same zones are characterized by high gamma counts. The logs also show zones of both low gamma counts and high proportions of mobile water at depths of 205 to 250 ft and 265 to 295 ft where sand was observed in the cores.
NMR results indicate that total porosity, equivalent to the total water content, ranges from 0.19 to 0.42 over the length of the borehole, with an average of 0.33. These porosity values are similar to those reported elsewhere on Cape Cod (LeBlanc, 1984; Garabedian and others, 1991). Hydraulic conductivity estimates for saturated sediments obtained by using the Schlumberger-Doll research (SDR) equation (Ksdr) range from 0.18 to 1,300 ft/d, with an average of 230 ft/d. Hydraulic conductivity estimates obtained by using the sum of echoes (SOE) equation (Ksoe) range from 0.35 to 440 ft/d, with an average of 130 ft/d. Estimates of hydraulic conductivity <20 ft/d were obtained only near bedrock, likely reflecting tightly bound pore water. Hydraulic conductivity estimates in the saturated unconsolidated sediments generally are consistent with local- and aquifer-scale measurements reported for Cape Cod in Masterson and others (1997b), Moench and others (2001), and Walter and Whealan (2005). Estimates of hydraulic conductivity from the unsaturated zone (<30-ft depth) are not discussed because the SOE and SDR methods require some estimate of saturation, which was not made for this report.
Comparison of hydraulic conductivity estimates from the two equations shows that estimates from the SDR equation are more subject to variations caused by noise in the mean log T2 decay value than estimates from the SOE equation. Although the SOE equation is less sensitive to noise, the SDR equation is better able to show small variations in hydraulic conductiv-ity caused by fine materials as reflected in the early-time T2 decay. The estimates from the SOE and SDR methods show similar trends of low and high hydraulic conductivity (fig. 7), although the magnitude of the values at given depths differs by as much as a factor of four.
The vertical trends shown by the estimates of hydraulic conductivity from NMR are similar to those for the Kgrain-size estimates, but with some important differences (fig. 8). Kgrain-size estimates for sediments from above the water table are not shown because the Ksdr and Ksoe methods are only valid for saturated conditions. In addition, the values near bedrock are not shown in the scatterplots because they are affected by the low water content in the clay-rich layer above the bedrock.
The Ksoe and Kgrain-size estimates are consistently lower than the Ksdr estimates for medium to coarse sand. Values for Ksdr exceed 1,000 ft/d in parts of the interval between 73 ft and 103 ft (fig. 7). The Ksoe and Kgrain-size estimates are consistent
with previously reported hydraulic conductivity values for shallow glaciofluvial deposits on western Cape Cod ranging from 150 to 350 ft/d (Masterson and others, 1997b).
The apparent Ksdr and Ksoe estimates are consistently higher than the apparent Kgrain-size estimates in low-permeability sediments. Ksdr and Ksoe estimates of 20 to 80 ft/d correspond to Kgrain-size estimates of <10 ft/d (fig. 8). The Ksoe and Ksdr estimates are consistent with previously reported hydraulic conductivity values of 10 to 70 ft/day for Cape Cod bottomset and glaciolacustrine deposits (Walter and Whealan, 2005).
The low Kgrain-size estimates for fine-grained sediment may result from several factors. For thin, discrete beds of low-permeability material, the NMR method integrates into its measurement the instrument response to adjacent coarse-grained material, which biases the apparent hydraulic conductivity for the feature toward a higher value. However, this explanation may not apply to continuous sequences of silty very fine sand with low permeability (for example, at depths of 107–175 ft), where Kgrain-size estimates are still an order of magnitude lower than estimates of Ksoe and Ksdr. Several factors could cause this discrepancy:
• Equations used to estimate hydraulic conductivity from grain-size distribution were typically developed for moderately graded fine to coarse sand (Vukovic and Soro, 1992; Devlin, 2015). Many methods do not strictly apply to silty very fine sand and fine sand (Devlin, 2015). For example, the simplified Hazen approximation (Freeze and Cherry, 1979) is designed for uniformly graded sand with a 10th percentile grain size larger than very fine sand (0.1 millimeter). Four-teen of the 26 samples analyzed in this study do not meet this criterion.
• Sample-scale heterogeneity, caused by small amounts of fine material in a generally more permeable matrix, bias Kgrain-size estimates to lower values than estimates from methods that sample a larger effective volume of aquifer, such as slug tests (Vienken and Dietrich, 2011), aquifer tests (Masterson and others, 1997a), and NMR logging.
• Sediment samples collected for grain-size distribu-tion analyses preserve none of the fine-scale structure owing to grain shape and orientation, which may result in anisotropic hydraulic conductivity at the small scale of an individual sediment sample, especially in silts and clays. Therefore, the resulting estimates of hydrau-lic conductivity from grain-size distribution may be lower than estimates obtained by methods that test in situ aquifer material, such as slug and aquifer tests (Vienken and Dietrich, 2011) and NMR logging. These methods account most strongly for the horizontal com-ponent of hydraulic conductivity, which is larger than the vertical component of hydraulic conductivity.

Hydrogeological Characterization of the Study Area 21
NMR SOE method
NMR SDR method
Sediment grain-size method
EXPLANATION
Dept
h, in
feet
bel
ow la
nd s
urfa
ce
0
50
100 100
150
200
250
300
0
50
150
200
250
300
0.001 1,0001001010.10.01Hydraulic conductivity, in feet per day
Figure 7. Profiles of hydraulic conductivity estimated from nuclear magnetic resonance (NMR) logs from well MA–FSW 750–0100 in East Falmouth, Massachusetts, by using the Schlumberger-Doll research (SDR) and sum of echoes (SOE) equations and from grain-size distributions of core samples from selected vertical intervals. The thickness of the horizontal blue bars indicates depth interval over which sediment samples for grain-size analysis were composited. NMR profiles are smoothed results obtained by vertically averaging the hydraulic conductivity data for each measurement depth with the data from the measurements above and below each depth.
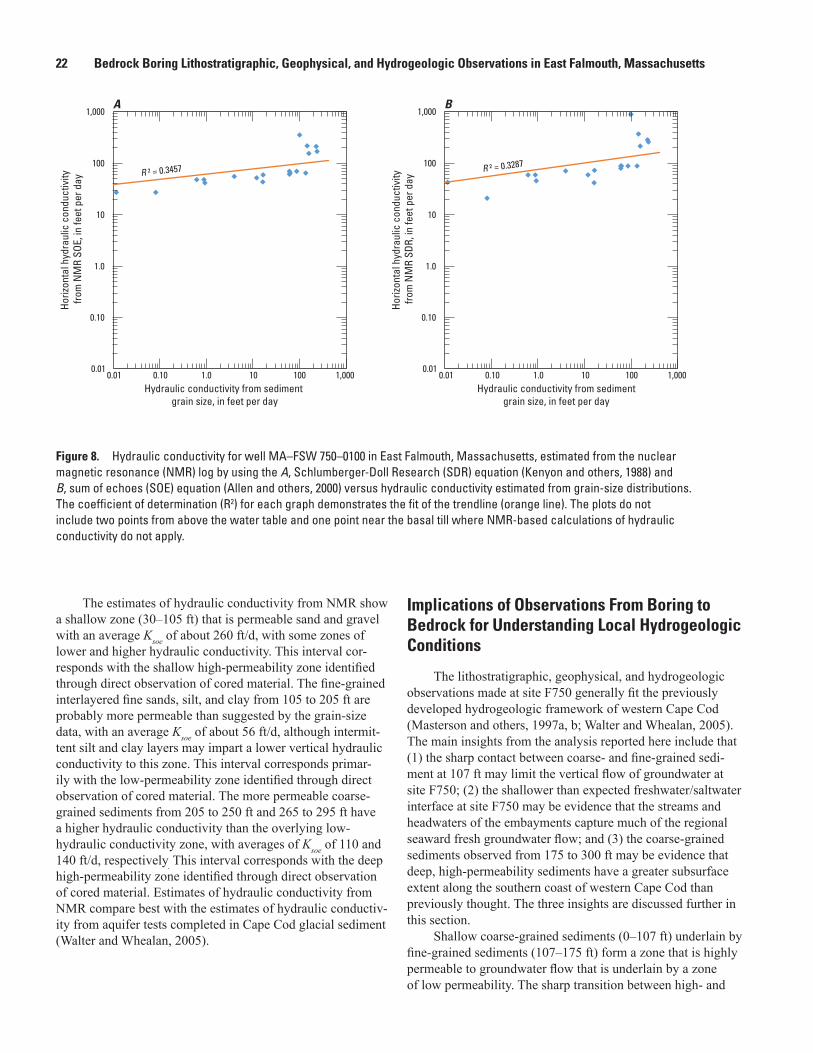
22 Bedrock Boring Lithostratigraphic, Geophysical, and Hydrogeologic Observations in East Falmouth, Massachusetts
Hydraulic conductivity from sedimentgrain size, in feet per day
Horiz
onta
l hyd
raul
ic c
ondu
ctiv
ity
from
NM
R SD
R, in
feet
per
day
B
Hydraulic conductivity from sediment grain size, in feet per day
A
0.10
1.0
10
100
1,000
Horiz
onta
l hyd
raul
ic c
ondu
ctiv
ity
from
NM
R SO
E, in
feet
per
day
1,000100101.00.100.01 1,000100101.00.100.010.01
0.10
1.0
10
100
1,000
0.01
R ² = 0.3457 R ² = 0.3287
Figure 8. Hydraulic conductivity for well MA–FSW 750–0100 in East Falmouth, Massachusetts, estimated from the nuclear magnetic resonance (NMR) log by using the A, Schlumberger-Doll Research (SDR) equation (Kenyon and others, 1988) and B, sum of echoes (SOE) equation (Allen and others, 2000) versus hydraulic conductivity estimated from grain-size distributions. The coefficient of determination (R2) for each graph demonstrates the fit of the trendline (orange line). The plots do not include two points from above the water table and one point near the basal till where NMR-based calculations of hydraulic conductivity do not apply.
The estimates of hydraulic conductivity from NMR show a shallow zone (30–105 ft) that is permeable sand and gravel with an average Ksoe of about 260 ft/d, with some zones of lower and higher hydraulic conductivity. This interval cor-responds with the shallow high-permeability zone identified through direct observation of cored material. The fine-grained interlayered fine sands, silt, and clay from 105 to 205 ft are probably more permeable than suggested by the grain-size data, with an average Ksoe of about 56 ft/d, although intermit-tent silt and clay layers may impart a lower vertical hydraulic conductivity to this zone. This interval corresponds primar-ily with the low-permeability zone identified through direct observation of cored material. The more permeable coarse-grained sediments from 205 to 250 ft and 265 to 295 ft have a higher hydraulic conductivity than the overlying low-hydraulic conductivity zone, with averages of Ksoe of 110 and 140 ft/d, respectively. This interval corresponds with the deep high-permeability zone identified through direct observation of cored material. Estimates of hydraulic conductivity from NMR compare best with the estimates of hydraulic conductiv-ity from aquifer tests completed in Cape Cod glacial sediment (Walter and Whealan, 2005).
Implications of Observations From Boring to Bedrock for Understanding Local Hydrogeologic Conditions
The lithostratigraphic, geophysical, and hydrogeologic observations made at site F750 generally fit the previously developed hydrogeologic framework of western Cape Cod (Masterson and others, 1997a, b; Walter and Whealan, 2005). The main insights from the analysis reported here include that (1) the sharp contact between coarse- and fine-grained sedi-ment at 107 ft may limit the vertical flow of groundwater at site F750; (2) the shallower than expected freshwater/saltwater interface at site F750 may be evidence that the streams and headwaters of the embayments capture much of the regional seaward fresh groundwater flow; and (3) the coarse-grained sediments observed from 175 to 300 ft may be evidence that deep, high-permeability sediments have a greater subsurface extent along the southern coast of western Cape Cod than previously thought. The three insights are discussed further in this section.
Shallow coarse-grained sediments (0–107 ft) underlain by fine-grained sediments (107–175 ft) form a zone that is highly permeable to groundwater flow that is underlain by a zone of low permeability. The sharp transition between high- and
Summary 23
low-permeability sediment observed at 107 ft likely impedes vertical flow of water between the two zones. In the Ashumet Valley to the north (fig. 2), a similar sharp transition between more and less permeable sediments limits deep groundwater flow into the less permeable sediments (Masterson and oth-ers, 1997b) and acts as a stratigraphic control on contaminant transport (Masterson and others, 1997b; Mulligan and Uchupi, 2003). This transition likely extends from the area near the Ashumet Valley to the southern coast of western Cape Cod.
The thin clay-rich layer (Unit 3) between the high-per-meability zone (Units 1 and 2) and the low-permeability zone (Units 4 to 7) may further impede vertical flow between the two zones. The clay-rich layer resembles deposits observed at similar altitudes to the north and west of site F750 (Masterson and others, 1997b; Uchupi and Mulligan, 2006). The lateral extent and continuity of the thin clay-rich layer are unknown.
The clay-rich layer at 107 ft marks the top of a thick transition from fresh to saline groundwater. The regional groundwater model of Walter and others (2016) indicated that freshwater could be present to bedrock at this location. EMI and TEM logs show that bulk electrical conductivity gradu-ally increases over the interval from approximately 105 to 160 ft. Although the increased presence of silt and clay below 107 ft may contribute to the increase in electrical conductiv-ity, the increase is probably caused mostly by an increase in pore-water salinity. Fresh groundwater at site F750 is therefore limited to approximately 75 ft of saturated coarse-grained material (the unsaturated zone is approximately 30 ft thick).
The relatively shallow depth to the freshwater/saltwater interface and the large thickness of the transition zone may be due to aquifer heterogeneity (fig. 3) and the location of the site at the landward ends of the coastal saltwater embay-ments near outlets of small streams (figs. 1 and 2). Much of the regional groundwater flow from inland areas to the coast may discharge to the inland ends of the saltwater embay-ment and small streams that drain into the embayments. The remaining fresh groundwater may flow toward the coast in the upper permeable zone (0 to 107 ft), which accounts for more than half of the transmissivity of the unconsolidated sediments (table 2). The low-permeability layer at 107 ft and the under-lying fine-grained sediments may increase the focusing of freshwater flow in the upper unit. These factors could result in a freshwater/saltwater interface that rises steeply upward near the inland ends of the coastal embayments. The apparent dis-crepancy between the simulated and observed depths to saline groundwater could be attributed to applying a regional-scale modeling analysis to a locally complex condition because the predicted position of the interface is sensitive to small changes in simulated aquifer characteristics and the groundwater/surface-water boundary at the coast.
The thick transition zone between fresh and saline groundwater could also be caused in part by aquifer heteroge-neity. Hydraulic conductivity varies by four to five orders of magnitude in the low-permeability zone (table 2), which likely results in the high anisotropy of the bulk hydraulic conduc-tivity of the aquifer. Thick freshwater/saltwater interfaces
reported in Abarca Cameo (2006), Abdoulhalik and Ahmed (2017), and Houben and others (2017) have been attributed to aquifer heterogeneity. The interbedded zones of silty very fine sand and fine sand below a depth of 107 ft, combined with the possible diversion of most freshwater flow through the upper permeable zone and small streams that receive ground-water discharge in the area, could result in a thick transition zone; however, further exploration of this hypothesis by using groundwater models was beyond the scope of this study.
The fine to coarse sand from 175 to 300 ft forms a deep moderate- to high-permeability zone. The coarse sand at depth contains saline water and is separated from shallow freshwater by the low-permeability zone from 107 to 175 ft. Similar deposits have been observed in the subsurface to the east, south, and north of the F750 study site (Cambareri and Eichner, 1998; Uchupi and Mulligan, 2006) and at the surface as the Falmouth Heights and Nantucket Sound ice-contact deposits (fig. 2). If these coarse-grained units are stratigraphically related, they could represent a large feature that affects the movement of fresh and saline groundwater near the coast. However, if no stratigraphic connection exists between these coarse-grained deposits, the effect of the deep moderate- to high-permeability zone at site F750 on fresh groundwater flow near the southern coast of Cape Cod may not be substantial. Regional models have shown that coarse-grained features in the subsurface in the regions of the Falmouth Heights and Nantucket Sound ice-contact deposits influence groundwater flow near the coast (Masterson and others, 1997b; Walter and Whealan, 2005; Walter and others, 2016); future modeling efforts should benefit from considering that the subsurface extent of these deposits may be greater than previously thought.
The inferences about local hydrogeologic conditions made from the sediment coring and geophysical logging at site F750 are limited by the lack of similarly detailed study of the geology elsewhere on the southern coast of western Cape Cod. This uncertainty could be reduced by drilling additional deep borings near the coast.
SummaryIn spring 2016, a boring was drilled to bedrock at
site MA–FSW 750 (referred to as “site F750”) on the coastal peninsula of Davis Neck in East Falmouth, Massachusetts, to increase understanding of the hydrogeology of the southern coast of western Cape Cod, where few similar deep borings exist. Detailed lithostratigraphic, geophysical, and hydrogeo-logic observations were made during drilling of the boring and subsequent testing in and near the 310-foot (ft)-deep well installed in the boring (well F750–0100). Observations from sediment cores and surface and borehole geophysical measurements were used to delineate three zones relevant to understanding groundwater flow and glacial history at the study location.
24 Bedrock Boring Lithostratigraphic, Geophysical, and Hydrogeologic Observations in East Falmouth, Massachusetts
Shallow sands and gravels (0–107 ft) form a zone of relatively highly permeable material conducive to groundwa-ter flow. This shallow high-permeability zone is interpreted to be deltaic topset and foreset beds also present elsewhere on western Cape Cod. Electromagnetic induction and transient electromagnetic geophysical logs show that the groundwater in this part of the aquifer is fresh, whereas groundwater in underlying parts of the aquifer is brackish or saline. Taking into consideration that the unsaturated zone at site F750 is about 30 ft thick, approximately 75 ft of this shallow mate-rial accounts for most of the water-transmitting capacity and nearly all the freshwater in the unconsolidated sediments.
Silt-rich fine and very fine sand below the shallow sand and gravel layer, at 107 to 175 ft, forms a low-permeability zone. A thin (1-ft-thick) silt- and clay-rich layer separates the more and less permeable zones at site F750. If areally extensive, this layer could limit vertical flow of groundwa-ter between the more and less permeable zones and impart a higher bulk anisotropy to this part of the Cape Cod aquifer than previously thought. The clay-rich layer at 107 ft also marks the top of an unexpectedly shallow and thick transition zone from fresh to saline groundwater between approximately 105 and 160 ft. These deposits are interpreted to be deltaic bottomset beds and lake-bottom sediments also present else-where on western Cape Cod.
Fine to coarse sand from 175 to 300 ft forms a deep zone of moderate to high permeability conducive to groundwater flow. This deep high-permeability zone is located well below the water table and the shallow freshwater, so its influence on the flow of fresh groundwater near the coast may be small. These deposits are interpreted to predate deposition of deltaic and lacustrine sediments across Cape Cod and are interpreted to represent lacustrine fan sediments that may be related to nearby ice-contact deposits. A compacted, nonsorted fine sand, silt, granular pebble, and trace clay layer interpreted as Wisconsinan basal till was encountered at 300 ft, and the top of competent, crystalline basement was encountered at 305 ft.
Shallow sediments (shallower than 175 ft) closely resemble the downward fining post-Wisconsinan deltaic and lacustrine deposits found in many parts of western Cape Cod; deep coarse sediments (at depths below 175 ft) appear to be the product of earlier depositional processes local to the southern coast of western Cape Cod. This report adds to growing evidence that the depositional environments and lithostratigraphy of the southern coast of western Cape Cod are more complicated than those of inland settings on western Cape Cod. All current interpretations are accompanied by uncertainty because of the paucity of lithological and hydro-geological observations nearby. This uncertainty could be reduced by drilling additional deep borings near the coast. This study highlights how integrating high-resolution observa-tions of cored material with a multitool geophysical approach can characterize a single boring to improve understanding of regional glacial history and hydrogeology.
References Cited
Abarca Cameo, E., 2006, Seawater intrusion in complex geological environments: Catalonia, Spain, Polytechnic University of Catalonia, Ph.D. dissertation, [variously paged]. [Also available at https://upcommons.upc.edu/handle/2117/93555.]
Abdoulhalik, A., and Ahmed, A.A., 2017, How does layered heterogeneity affect the ability of subsurface dams to clean up coastal aquifers contaminated with seawater intrusion?: Journal of Hydrology, v. 553, p. 708–721. [Also available at https://doi.org/10.1016/j.jhydrol.2017.08.044.]
Allen, D., Flaum, C., Ramakrishnan, T.S., Bedford, J., Casteli-jns, K., Fairhurst, D., Gubelin, G., Heaton, N., Minh, C.C., Norville, M.A., Seim, M.R., Pritchard, T., and Ramamoor-thy, R., 2000, Trends in NMR logging: Oilfield Review, v. 12, no. 3, OIREE70923–1730, 19 p., accessed July 3, 2018, at https://www.slb.com/~/media/Files/resources/oilfield_review/ors00/aut00/p2_19.pdf.
Baldwin, W.E., Foster, D.S., Pendleton, E.A., Barnhardt, W.A., Schwab, W.C., Andrews, B.D., and Ackerman, S.D., 2016, Shallow geology, sea-floor texture, and physiographic zones of Vineyard and western Nantucket Sounds, Massa-chusetts: U.S. Geological Survey Open-File Report 2016–1119, accessed June 12, 2018, at https://doi.org/10.3133/ofr20161119.
Barbaro, J.R., Masterson, J.P., and LeBlanc, D.R., 2014, Science for the stewardship of the groundwater resources of Cape Cod, Massachusetts: U.S. Geologi-cal Survey Fact Sheet 2014–3067, 6 p. [Also available at https://doi.org/10.3133/fs20143067.]
Barbaro, J.R., Walter, D.A., and LeBlanc, D.R., 2013, Transport of nitrogen in a treated-wastewater plume to coastal discharge areas, Ashumet Valley, Cape Cod, Massachusetts: U.S. Geological Survey Scientific Inves-tigations Report 2013–5061, 37 p. [Also available at https://pubs.er.usgs.gov/publication/sir20135061.]
Bear, J., 1972, Dynamics of fluids in porous media: New York, American Elsevier Publishing Company Inc., p. 556–575.
Behroozmand, A.A., Keating, K., and Auken, E., 2014, A review of the principles and applications of the NMR technique for near-surface characterization: Surveys in Geophysics, v. 36, no. 1, p. 27–85. [Also available at https://doi.org/10.1007/s10712-014-9304-0.]
Boart Longyear, 2011, LS600 sonic drill product overview: Boart Longyear, 16 p., accessed October 10, 2017, at http://app.boartlongyear.com/brochures/LS600_Brochure_English_Sept_2012(App_Ready).pdf.
References Cited 25
Boothroyd, J.C., and McCandless, S.J., 2003, Quaternary geology of the East Greenwich and parts of the Bristol and Crompton quadrangles, RI: Rhode Island Geological Survey Open File Map 2003–01, 1:24,000.
Cambareri, T.C., and Eichner, E.M., 1998, Watershed delinea-tion and ground water discharge to a coastal embayment: Ground Water, v. 36, no. 4, p. 626–634. [Also available at https://doi.org/10.1111/j.1745-6584.1998.tb02837.x.]
Cheng, A.H.D., and Ouazar, D., 1999, Analytical solutions, in Bear, J., Cheng, A.H.D., Sorek, S., Ouazar, D., and Her-rera, I., eds., Seawater intrusion in coastal aquifers—Con-cepts, methods, and practices: The Netherlands, Springer, Theory and Applications of Transport in Porous Media, v. 14, p. 163–191.
Christiansen, A.V., and Auken, E., 2012, A global measure for depth of investigation: Geophysics, v. 77, no. 4, p. WB171–WB177. [Also available at https://doi.org/10.1190/geo2011-0393.1.]
Devlin, J.F., 2015, HydrogeoSieveXL—An Excel-based tool to estimate hydraulic conductivity from grain-size analysis: Hydrogeology Journal, v. 23, no. 4, p. 837–844. [Also avail-able at https://doi.org/10.1007/s10040-015-1255-0.]
Fairchild, G.M., Lane, J.W., Jr., Voytek, E.B., and LeBlanc, D.R., 2013, Bedrock topography of western Cape Cod, Massachusetts, based on bedrock altitudes from geologic borings and analysis of ambient seismic noise by the horizontal-to-vertical spectral-ratio method: U.S. Geologi-cal Survey Scientific Investigations Map 3233, 1 sheet, 17-p. pamphlet. [Also available at https://pubs.er.usgs.gov/publication/sim3233.]
Freeze, R.A., and Cherry, J.A., 1979, Groundwater: Engle-wood Cliffs, N.J., Prentice-Hall, 588 p.
Garabedian, S.P., LeBlanc, D.R., Gelhar, L.W., and Celia, M.A., 1991, Large scale natural gradient tracer test in sand and gravel, Cape Cod, Massachusetts—2. Analysis of spatial moments for a nonreactive tracer: Water Resources Research, v. 27, no. 5, p. 911–924. [Also available at https://doi.org/10.1029/91WR00242.]
Grunewald, E., Walsh, D., Knight, R., Dlubac, K., Parsekian, A., Butler, J.J., Jr., Knobbe, S., Reboulet, E., and Barrows, M., III, 2013, Integration of surface and logging NMR data to map hydraulic conductivity: Australia, Society of Exploration Geophysicists and Petroleum Exploration Society of Australia, International Geophysical Conference and Exhibition, 23d, Melbourne, Australia, August 11–14, 2013, extended abstracts, 4 p. [Also available at https://doi.org/10.1071/ASEG2013ab205.]
Heath, R.C., 1983, Basic ground-water hydrology: U.S. Geo-logical Survey Water-Supply Paper 2220, 86 p. [Also avail-able at https://pubs.er.usgs.gov/publication/wsp2220.]
Houben, G., Stoeckl, L., Mariner, K.E., and Choudhury, A.S., 2017, The influence of heterogeneity on coastal ground-water flow—Physical and numerical modeling of fringing reefs, dykes and structured conductivity fields: Advances in Water Resources, v. 113, p. 155–166. [Also available at https://doi.org/10.1016/j.advwatres.2017.11.024.]
Howes, B., Samimy, R., Schlezinger, D., Ramsey, J., Kelly, S., and Eichner, E., 2005, Linked watershed-embayment model to determine critical nitrogen loading thresholds for Great/Perch Pond, Green Pond and Bournes Pond, Falmouth, Massachusetts: Boston, Massachusetts Department of Environmental Protection Massachusetts Estuaries Proj-ect, 205 p. [Also available at https://www.mass.gov/files/documents/2016/08/xs/mep-ggb-uc.pdf.]
Hull, R.B., and Stone, B.D., 2019, Observations of lithostratigraphy and hydrogeology from a deep boring in glacial sediments near Nantucket Sound, East Falmouth, Massachusetts: U.S. Geological Survey data release, https://doi.org/10.5066/F7W66JPM.
Johnson, C.D., and Lane, J.W., Jr., 2016, Statistical com-parison of methods for estimating sediment thickness from horizontal-to-vertical spectral ratio (HVSR) seismic methods—An example from Tylerville, Connecticut, USA: Symposium on the Application of Geophysics to Engineer-ing and Environmental Problems, March 20–24, 2016, Denver, Colorado, Proceedings, p. 317–323. [Also available at https://doi.org/10.4133/SAGEEP.29-057.]
Johnson, C.D., White, E.A., Phillips, S.N., Pappas, K.L., Hull, R.B., LeBlanc, D.R., and Lane, J.W., 2019, Transient electromagnetics, passive seismic, and borehole electromag-netics, gamma, and nuclear magnetic resonance methods to characterize an unconsolidated aquifer on Cape Cod, Massachusetts: U.S. Geological Survey data release, https://doi.org/10.5066/F7P26X0Z.
Kenyon, W.E., Day, P.I., Straley, C., and Willemsen, J.F., 1988, A three-part study of NMR longitudinal relax-ation properties of water-saturated sandstones: Society of Petroleum Engineers Formation Evaluation, v. 3, no. 3, SPE–15643–PA, 15 p., accessed July 3, 2018, at https://doi.org/10.2118/15643-PA.
Keys, W.S., 1990, Borehole geophysics applied to ground-water investigations: U.S. Geological Survey Techniques of Water-Resources Investigation, book 2, chap. E2, 150 p. [Also available at https://pubs.er.usgs.gov/publication/twri02E2.]
Koteff, C., and Pessl, F., Jr., 1981, Systematic ice retreat in New England: U.S. Geological Survey Professional Paper 1179, 20 p. [Also available at http://pubs.er.usgs.gov/publication/pp1179.]

26 Bedrock Boring Lithostratigraphic, Geophysical, and Hydrogeologic Observations in East Falmouth, Massachusetts
Lane, J.W., Jr., White, E.A., Steele, G.V., and Cannia, J.C., 2008, Estimation of bedrock depth using the horizontal-to-vertical (H/V) ambient-noise seismic method: Sympo-sium on the Application of Geophysics to Engineering and Environmental Problems, April 6–10, 2008, Philadelphia, Pennsylvania, Proceedings, p. 490–502. [Also available at https://doi.org/10.4133/1.2963289.]
LeBlanc, D.R., 1984, Sewage plume in a sand and gravel aquifer, Cape Cod, Massachusetts: U.S. Geological Survey Water-Supply Paper 2218, 28 p. [Also available at https://pubs.er.usgs.gov/publication/wsp2218.]
LeBlanc, D.R., Guswa, J.H., Frimpter, M.H., and Londquist, C.J., 1986, Ground-water resources of Cape Cod, Mas-sachusetts: U.S. Geological Survey Hydrologic Inves-tigations Atlas 692, 4 pls., 1:48,000. [Also available at https://pubs.er.usgs.gov/publication/ha692.]
Masterson, J.P., Stone, B.D., Walter, D.A., and Savoie, J.G., 1997a, Hydrogeologic framework of western Cape Cod, Massachusetts: U.S. Geological Survey Hydro-logic Investigations Atlas 741, 1 pl. [Also available at https://pubs.er.usgs.gov/publication/ha741.]
Masterson, J.P., Walter, D.A., and Savoie, J.G., 1997b, Use of particle tracking to improve numerical model calibra-tion and to analyze ground-water flow and contaminant migration, Massachusetts Military Reservation, west-ern Cape Cod, Massachusetts: U.S. Geological Sur-vey Water-Supply Paper 2482, 50 p. [Also available at https://pubs.er.usgs.gov/publication/wsp2482.]
Mather, K.F., Goldthwait, R.P., and Thiesmeyer, L.R., 1942, Pleistocene geology of western Cape Cod, Massachu-setts: Geological Society of America Bulletin, v. 53, no. 8, p. 1127–1174. [Also available at https://doi.org/10.1130/GSAB-53-1127.]
Moench, A.F., Garabedian, S.P., and LeBlanc, D.R., 2001, Estimation of hydraulic parameters from an unconfined aquifer test conducted in a glacial outwash deposit, Cape Cod, Massachusetts: U.S. Geological Survey Professional Paper 1629, 69 p. [Also available at https://pubs.er.usgs.gov/publication/pp1629.]
Mulligan, A.E., and Uchupi, E., 2003, New interpreta-tion of glacial history of Cape Cod may have impor-tant implications for groundwater contaminant transport: Eos, Transactions, American Geophysical Union, v. 84, no. 19, p. 177–183. [Also available at https://doi.org/10.1029/2003EO190001.]
Mulligan, A.E., and Uchupi, E., 2004, Wisconsinan glacial lake sediments in the subsurface of Cape Cod, Massachu-setts: Northeastern Geology and Environmental Sciences, v. 26, p. 188–201.
Munsell Color, 2010, Munsell soil color charts: Grand Rapids, Mich., Munsell Color, [n.p.].
O’Hara, C.J., and Oldale, R.N., 1987, Maps showing geol-ogy, shallow structure, and bedforms of Nantucket Sound, Massachusetts: U.S. Geological Survey Miscellaneous Field Studies Map 1911, 4 sheets. [Also available at https://pubs.er.usgs.gov/publication/mf1911.]
Oldale, R.N., 1982, Pleistocene stratigraphy of Nantucket, Martha’s Vineyard, the Elizabeth Islands, and Cape Cod, Massachusetts, in Larson, G.J., and Stone, B.D., eds., Late Wisconsinan glaciation of New England: Dubuque, Iowa, Kendall/Hunt Publishing Co., p. 1–34.
Oldale, R.N., and Barlow, R.A., 1986, Geologic map of Cape Cod and the Islands, Massachusetts: U.S. Geological Sur-vey Miscellaneous Investigations Series Map I–1763, scale 1:100,000, 1 pl. [Also available at https://pubs.er.usgs.gov/publication/i1763.]
Oldale, R.N., and Eskenasy, D.M., 1983, Regional significance of pre-Wisconsinan till from Nantucket Island, Massachu-setts: Quaternary Research, v. 19, no. 3, p. 302–311. [Also available at https://doi.org/10.1016/0033-5894(83)90037-6.]
Rust, B.R., and Romanelli, R., 1975, Late Quaternary sub-aqueous outwash deposits near Ottawa, Canada, in Jopling, A.V., and Walker, B.C., eds., Glaciofluvial and glaciola-custrine sedimentation: Society for Sedimentary Geology Special Publication, v. 23, p. 177–192. [Also available at https://doi.org/10.2110/pec.75.23.0177.]
Sharma, P.V., 1997, Electromagnetic surveys, chap. 7 of Environmental and engineering geophysics: Cam-bridge University Press, p. 265–308. [Also available at https://doi.org/10.1017/CBO9781139171168.008.]
Shreve, E.A., and Downs, A.C., 2005, Quality-assurance plan for the analysis of fluvial sediment by the U.S. Geological Survey Kentucky Water Science Center Sediment Labora-tory: U.S. Geological Survey Open-File Report 2005–1230, 28 p. [Also available at https://pubs.er.usgs.gov/publication/ofr20051230.]
Stone, B.D., and DiGiacomo-Cohen, M.L., 2009, Surfi-cial geologic map of the Pocasset-Provincetown-Cutty-hunk-Nantucket 24-quadrangle area of Cape Cod and Islands, southeast Massachusetts: U.S. Geological Sur-vey Open-File Report 2006–1260–E. [Also available at https://pubs.er.usgs.gov/publication/ofr20061260E.]

References Cited 27
Stone, J.R., Lewis, R.S., and Stone, B.D., 2015, Integration of onshore-offshore glacial geology in Massachusetts Bay using high-resolution seismic reflection profiles—New insights into glacial lakes, synglacial marine incursion, and south channel ice lobe in the Gulf of Maine [abs.], in North-eastern Section of Geological Society of America, 50th annual meeting, Bretton Woods, N.H., March 23–25, 2015: Geological Society of America Abstracts with Programs, v. 47, no. 3, p. 44. [Also available at https://gsa.confex.com/gsa/2015NE/webprogram/Paper251845.html.]
Stone, J.R., Schafer, J.P., London, E.H., DiGiacomo-Cohen, M.L., Lewis, R.S., and Thompson, W.B., 2005, Quater-nary geologic map of Connecticut and Long Island Sound basin: U.S. Geological Survey Scientific Investigations Map 2784, scale 1:125,000, 2 sheets. [Also available at https://pubs.er.usgs.gov/publication/sim2784.]
Straley, C., Rossini, D., Vinegar, H., Tutunjian, P., and Mor-riss, C., 1997, Core analysis by low–field NMR: The Log Analyst, v. 38, no. 2, p. 84–94.
Thien, S.J., 1979, A flow diagram for teaching texture by feel analysis: Journal of Agronomic Education, v. 8, p. 54–55.
Tucker, M.E., 2011, Sedimentary rocks in the field—A practi-cal guide (4th ed.): Chichester, United Kingdom, John Wiley & Sons, The Geological Field Guide Series, 288 p.
U.S. Geological Survey, 2006, FGDC digital cartographic standard for geologic map symbolization (postscript imple-mentation): U.S. Geological Survey Techniques and Meth-ods, book 11, chap. A2, [variously paged], accessed June 20, 2018, at https://pubs.er.usgs.gov/publication/tm11A2.
Uchupi, E., and Mulligan, A.E., 2006, Late Pleistocene stratig-raphy of upper Cape Cod and Nantucket Sound, Massachu-setts: Marine Geology, v. 227, nos. 1–2, p. 93–118. [Also available at https://doi.org/10.1016/j.margeo.2005.11.012.]
Vienken, T., and Dietrich, P., 2011, Field evaluation of meth-ods for determining hydraulic conductivity from grain size data: Journal of Hydrology, v. 400, nos. 1–2, p. 58–71. [Also available at https://doi.org/10.1016/j.jhydrol.2011.01.022.]
Vukovic, M., and Soro, A., 1992, Determination of hydraulic conductivity of porous media from gain-size distribution: Littleton, Colo., Water Resources Publications, 196 p.
Wadell, H., 1932, Volume, shape, and roundness of rock particles: The Journal of Geology, v. 40, no. 5, p. 443–451. [Also available at https://www.jstor.org/stable/30058012.]
Walsh, D., Turner, P., Grunewald, E., Zhang, H., Butler, J.J., Jr., Reboulet, E., Knobbe, S., Christy, T., Lane, J.W., Jr., Johnson, C.D., Munday, T., and Fitzpatrick, A., 2013, A small-diameter NMR logging tool for groundwater investi-gations: Groundwater, v. 51, no. 6, p. 914–926. [Also avail-able at https://doi.org/10.1111/gwat.12024.]
Walter, D.A., and Whealan, A.T., 2005, Simulated water sources and effects of pumping to wells and surface waters, Sagamore and Monomoy flow lenses, Cape Cod, Massachusetts: U.S. Geological Survey Scientific Inves-tigations Report 2004–5181, 85 p. [Also available at https://pubs.er.usgs.gov/publication/sir20045181.]
Walter, D.A., McCobb, T.D., and Fienen, M.N., 2019, Use of a numerical model to simulate the hydrologic system and transport of contaminants near Joint Base Cape Cod, western Cape Cod, Massachusetts: U.S. Geological Survey Scientific Investigations Report 2018–5139, 98 p., https://doi.org/10.3133/sir20185139.
Walter, D.A., McCobb, T.D., Masterson, J.P., and Fienen, M.N., 2016, Potential effects of sea-level rise on the depth to saturated sediments of the Sagamore and Mono-moy flow lenses on Cape Cod, Massachusetts (ver. 1.1, October 18, 2016): U.S. Geological Survey Scientific Investigations Report 2016–5058, 55 p. [Also available at https://doi.org/10.3133/sir20165058.]
Weddle, T.K., Stone, B.D., Thompson, W.B., Retelle, M.J., Caldwell, D.W., and Clinch, J.M., 1989, Illinoian and late Wisconsinan tills in eastern New England—A transect from northeastern Massachusetts to west-central Maine, trip A–2, in Berry, A.W., Jr., ed., New England Intercollegiate Geological Conference, 81st annual meeting, Farmington, Maine, October 13–15, 1989, Guidebook for field trips in southern and west-central Maine: Farmington, Maine, Uni-versity of Maine, p. 25–85.
Wentworth, C.K., 1922, A scale of grade and class terms for clastic sediments: The Journal of Geol-ogy, v. 30, no. 5, p. 377–392. [Also available at https://doi.org/10.1086/622910.]
Williams, J.H., Lapham, W.W., and Barringer, T.H., 1993, Application of electromagnetic logging to con-tamination investigations in glacial sand and gravel aquifers: Ground Water Monitoring and Reme-diation, v. 13, no. 3, p. 129–138. [Also available at https://doi.org/10.1111/j.1745-6592.1993.tb00082.x.]


For more information about this report, contact:Director, New England Water Science CenterU.S. Geological Survey 331 Commerce Road, Suite 2 Pembroke, NH [email protected] visit our website athttps://newengland.water.usgs.gov
Publishing support provided by the Pembroke and Madison Publishing Service Centers

Hull and others—B
edrock Boring Lithostratigraphic, G
eophysical, and Hydrogeologic O
bservations in East Falmouth, M
assachusetts—SIR 2019–5042
ISSN 2328-0328 (online)https://doi.org/10.3133/sir20195042