Embed Size (px)
Citation preview

1
Misys reports 34% adjusted basic earnings per share growth for the year to 31 May 2010
27 July 2010; Misys plc (FTSE: MSY.L), the global application software and services company serving the healthcare and financial services markets, announces its results for the year ended 31 May 2010.
Group Highlights • Adjusted basic earnings per share up 34% to 13.1p • Adjusted operating profit £148m, up 26% (10% on a pro-forma constant currency basis) • Order intake up 27% (14% on a pro-forma constant currency basis) • Reported revenue of £782m, up 13% • Revenue growth (pro-forma constant currency) of 3%, accelerating from -1% in the 1st half to 7% in the 2nd; • Net debt reduced to zero at 31 May 2010 from £129m at 31 May 2009 due to strong cash conversion • Realising shareholder value through disposal of majority stake in Allscripts, expected to generate
approximately $1 billion of proceeds for return to shareholders Divisional Highlights Comparisons stated on a pro-forma constant currency basis. • Allscripts revenue growth of 8% for the full year, accelerating from 2% in the first half to 13% in the second
half • After separation from Allscripts, Misys will be a pure play financial services software company • Treasury & Capital Markets revenue growth of 9%, accelerating from 1% in the first half to 17% in the second
half • Banking revenues weak; Misys new solutions begin to enter the market and business well positioned for re-
engineering of financial services sector • Management’s medium-term targets after the Proposed Sale are unchanged. For the two years to 31 May
2012, these are revenue growth rates (at constant currency) of 5 to 8% and adjusted operating margins between 17% and 20%.
Chief Executive Mike Lawrie comments ‘We have been working hard over recent years to transform Misys. The Company started to execute against its five year turnaround plan in 2007. We have substantially invested in developing and launching new leading-edge solutions and services to better meet the evolving needs of our customers. We have made significant progress in all our objectives: customer satisfaction continues to improve; our revenues have almost doubled; operating profit has significantly grown; and our net debt has been reduced to zero. These actions have now positioned us for leadership. The merger of our healthcare business with Allscripts in 2008 created the leader in US physician office healthcare IT and was extraordinarily successful. Now the proposed merger between Allscripts and Eclipsys will create a leader in end to end solutions across all healthcare settings. As we sell our controlling stake to enable the merger, Misys shareholders will receive an unprecedented return of capital expected to be approximately $1billion. We have invested in our people, solutions, processes and partnerships and we continue to innovate. We now have an opportunity to create a leader in Financial Services. Our new solutions portfolio is well placed to help financial institutions as the industry prepares for growth once more. We have the right team in place, world class partnerships and improved customer satisfaction, allow us the right to address new solutions to our customers. We have an opportunity to participate in the fundamental re-engineering of the global financial services sector. Our future looks very exciting.’
2
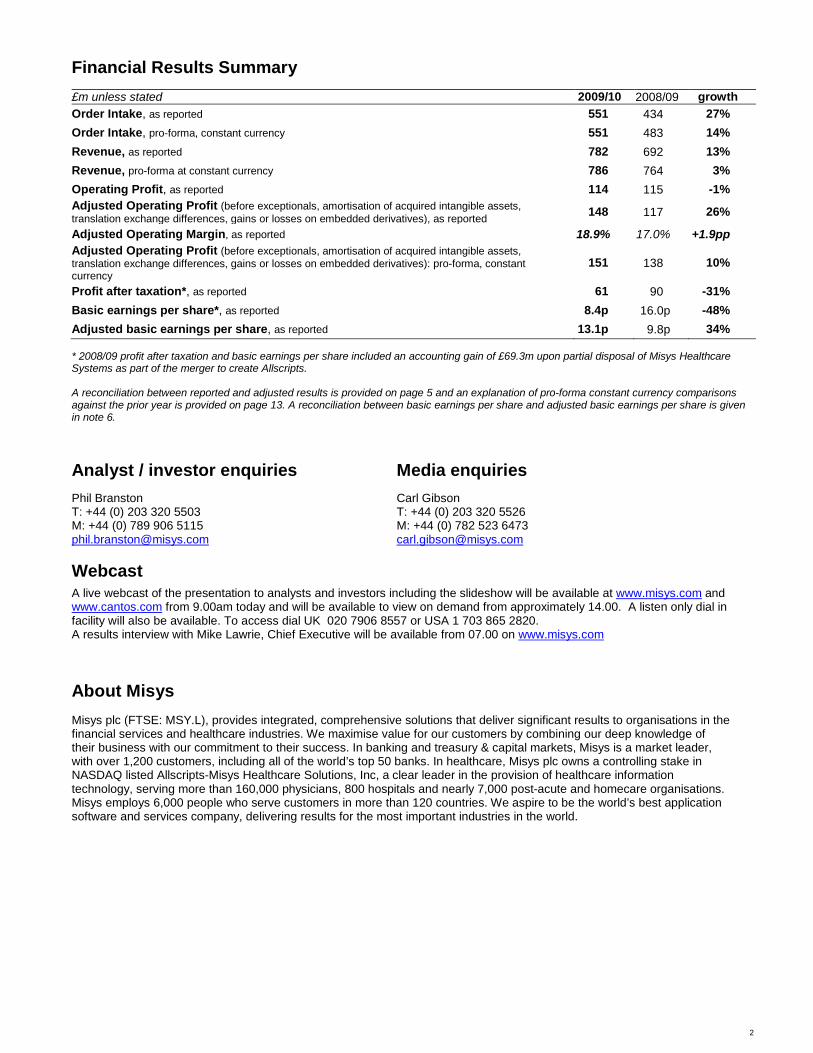
Financial Results Summary £m unless stated 2009/10 2008/09 growth Order Intake, as reported 551 434 27% Order Intake, pro-forma, constant currency 551 483 14% Revenue, as reported 782 692 13% Revenue, pro-forma at constant currency 786 764 3% Operating Profit, as reported 114 115 -1% Adjusted Operating Profit (before exceptionals, amortisation of acquired intangible assets, translation exchange differences, gains or losses on embedded derivatives), as reported 148 117 26%
Adjusted Operating Margin, as reported 18.9% 17.0% +1.9pp Adjusted Operating Profit (before exceptionals, amortisation of acquired intangible assets, translation exchange differences, gains or losses on embedded derivatives): pro-forma, constant currency
151 138 10%
Profit after taxation*, as reported 61 90 -31% Basic earnings per share*, as reported 8.4p 16.0p -48% Adjusted basic earnings per share, as reported 13.1p 9.8p 34% * 2008/09 profit after taxation and basic earnings per share included an accounting gain of £69.3m upon partial disposal of Misys Healthcare Systems as part of the merger to create Allscripts. A reconciliation between reported and adjusted results is provided on page 5 and an explanation of pro-forma constant currency comparisons against the prior year is provided on page 13. A reconciliation between basic earnings per share and adjusted basic earnings per share is given in note 6.
Analyst / investor enquiries Media enquiries Phil Branston T: +44 (0) 203 320 5503 M: +44 (0) 789 906 5115 [email protected]
Carl Gibson T: +44 (0) 203 320 5526 M: +44 (0) 782 523 6473 [email protected]
Webcast
A live webcast of the presentation to analysts and investors including the slideshow will be available at www.misys.com and www.cantos.com from 9.00am today and will be available to view on demand from approximately 14.00. A listen only dial in facility will also be available. To access dial UK 020 7906 8557 or USA 1 703 865 2820. A results interview with Mike Lawrie, Chief Executive will be available from 07.00 on www.misys.com About Misys Misys plc (FTSE: MSY.L), provides integrated, comprehensive solutions that deliver significant results to organisations in the financial services and healthcare industries. We maximise value for our customers by combining our deep knowledge of their business with our commitment to their success. In banking and treasury & capital markets, Misys is a market leader, with over 1,200 customers, including all of the world’s top 50 banks. In healthcare, Misys plc owns a controlling stake in NASDAQ listed Allscripts-Misys Healthcare Solutions, Inc, a clear leader in the provision of healthcare information technology, serving more than 160,000 physicians, 800 hospitals and nearly 7,000 post-acute and homecare organisations. Misys employs 6,000 people who serve customers in more than 120 countries. We aspire to be the world’s best application software and services company, delivering results for the most important industries in the world.

3
Chief Executive’s Review We have been working hard over recent years to transform Misys. The Company started to execute against its five year turnaround plan in 2007. We have invested in developing and launching new leading-edge solutions and services to better meet the evolving needs of our customers. We have made significant progress in all our objectives: customer satisfaction continues to improve; our revenues have almost doubled; operating profit has significantly grown; and our net debt has been reduced to zero. These actions have now positioned us for leadership. Leadership in US Healthcare IT In 2008, we merged our healthcare business with Allscripts. We created the leader in the US physician office healthcare IT market with one in three physicians using Allscripts solutions. The US stimulus package, which encourages physicians to adopt Electronic Health Records, presented us with a tremendous opportunity. We have seen strong demand for our EHR solutions with our customers seeking to improve the health of their patients and their bottom line.
The success of the merger has created an opportunity for Allscripts to continue its leadership role by merging Allscripts and Eclipsys. Allscripts is the clear leader in software for physicians’ practices and Eclipsys is a leader in hospitals. This merger will create a leader in end to end solutions across all healthcare settings and will be uniquely positioned to help clients benefit from the $30 billion in US government funding for Electronic Health Records. To enable Allscripts to exploit this opportunity and to crystallise the significant increase in the Allscripts share price, Misys will sell the majority of its controlling stake in Allscripts. Misys shareholders will, upon successful completion of a tender offer, receive an unprecedented return of capital, expected to be approximately $1 billion. Leadership in Financial Services We have the same opportunity now to create a leadership position in Financial Services. Post financial crisis we are seeing fundamental changes in the financial services sector, with increased regulation, stricter transparency requirements and the need to bring financial products to the market more quickly. These changes require financial institutions to rethink their business models and how they respond to the markets that they serve. At the same time, we have invested in new solutions and services, so that we are better positioned to help our customers meet these challenges and to become a trusted and valued partner. Capital markets are starting to improve and we are seeing early signs that this sector is moving back into growth. Last year, our Treasury & Capital Markets business saw improvements in demand particularly for solutions that enable financial institutions to enhance risk management and straight-through processing. We continued to invest in new solutions including Summit Invest, bilateral lending and our risk solutions. We attracted 28 new customer wins, displacing competitors as customers consolidate, and we increased our market share.
Our Banking business has been affected by subdued technology spending as banks rebuild their balance sheets. We have continued to invest in new solutions such as Misys Mobile, Business Intelligence Trade and Misys BankFusion. Our ground breaking BankFusion operating system will fundamentally change how banks use IT as our operating system allows banks to run operations and respond to customers in a more flexible and agile manner. The reaction to BankFusion has been extremely positive with 13 customers, including both existing and new customers, choosing to adopt BankFusion so far.
Our new solutions and services position us very well in order to capitalise on the opportunity when the Banking sector returns to growth once again. Investing for the future We have invested in our people, solutions, processes and partnerships and we continue to innovate. We have attracted world class leaders to our team to pursue our leadership position in financial services. We announced Al-Noor Ramji as the Head of our Banking business. He is a renowned technology leader and joined us from BT. Stephen Wilson joined us a year ago from IBM and has been appointed as Chief Financial Officer. We also welcomed Harry Keegan as Head of our sales organisation and Robin Crewe as our new Chief Technology Officer.
We have developed world class processes which work across everything that we do, from the way we support our customers to the way we manage product development.
We have announced new partnerships and extended existing partnerships with industry leaders such as HCL, IBM and Microsoft to help us distribute, deliver and develop our solutions around the globe. Leader in Innovation Open Source Solutions is a new business that we launched to help innovate within Misys and also to find new ways to address challenges in healthcare and carbon markets. This year, we are starting to see this innovation translate into material benefit for Misys both with initial revenues, shared technical innovation and thought leadership.

4
Future leadership We are fit, winning more and ready to pursue leadership. We have created a leader in US healthcare technology. Now we have an opportunity to participate in the fundamental re-engineering of the global financial services sector. Our future looks very exciting.
I want to thank our customers, investors, partners and employees for being part of our turnaround journey, and for supporting the immense changes that we have introduced. Our strong results and actions will allow us to earn the trust of our customers, partners and shareholders.

5
Financial Review We are pleased to report a strong financial performance in the year to 31 May 2010. Across all financial metrics, our business delivered impressive progress highlighted by the 34% growth in adjusted basic earnings per share. Revenue of £785.5m was 3% above last year on a pro-forma constant currency basis, accelerating as expected to 7% growth in the second half after a 1% decline in the first half. The increased momentum was due to improved first half orders in Allscripts flowing into revenue and to strong licence deal flow in TCM, whilst revenues declined in Banking. Recurring revenues from maintenance, ASP subscriptions and transaction processing constituted 59% of revenues and contributed the greatest revenue increases. Order intake (which excludes maintenance fees) was £551.1m, up 14% on a pro-forma constant currency basis on the prior year due to continuing customer wins in TCM and to rising adoption of Allscripts Electronic Health Records systems, offset by weak orders in Banking. Professional Services orders were particularly strong, reflecting implementation pipelines built up as a result of strong licence sales by Allscripts and TCM. Adjusted operating profit was £148.1m. On a pro-forma constant currency basis, growth on last year was 10% and the adjusted operating margin was 1.3 percentage points higher as revenues rose and overheads continued to be tightly controlled. The Group continues to sustain high levels of investment in new products and system implementation capabilities for customers. Group operating results The information in this section is presented on an ‘adjusted’ basis, excluding exceptionals and other items. Comparisons to prior year are on a pro-forma constant currency basis (see definitions page below). These measures provide more comparable and representative information on the trading activities of the Group than the ‘as reported’ measures. Operating results for the year ended 31 May 2010 £m 2009/10 2008/09 % growth Revenue
Allscripts 443 412 8 Treasury & Capital Markets 180 164 9 Banking 162 188 (14) Open Source 1 - - Financial Services 343 352 (3) Revenue: pro-forma, at constant exchange rates 786 764 3 Retranslation at current exchange rates and pro-forma adjustment to acquired business (4) (72) Revenue 782 692 13
Operating profit Allscripts 88 85 3 Treasury & Capital Markets 42 33 26 Banking 32 34 (6) Corporate & other (11) (14) 27 Financial Services 63 53 19 Adjusted operating profit: pro-forma, at constant exchange rates 151 138 10 Retranslation at current exchange rates and pro-forma adjustment to acquired business (3) (21) Adjusted operating profit 148 117 26 Amortisation of acquired intangible assets, (losses) gains on embedded derivatives, translation exchange differences from reserves
(17) (10)
Exceptional credits 5 69 Exceptional charges (22) (61) Total exceptional items (17) 8 Operating profit 114 115 (1)
6
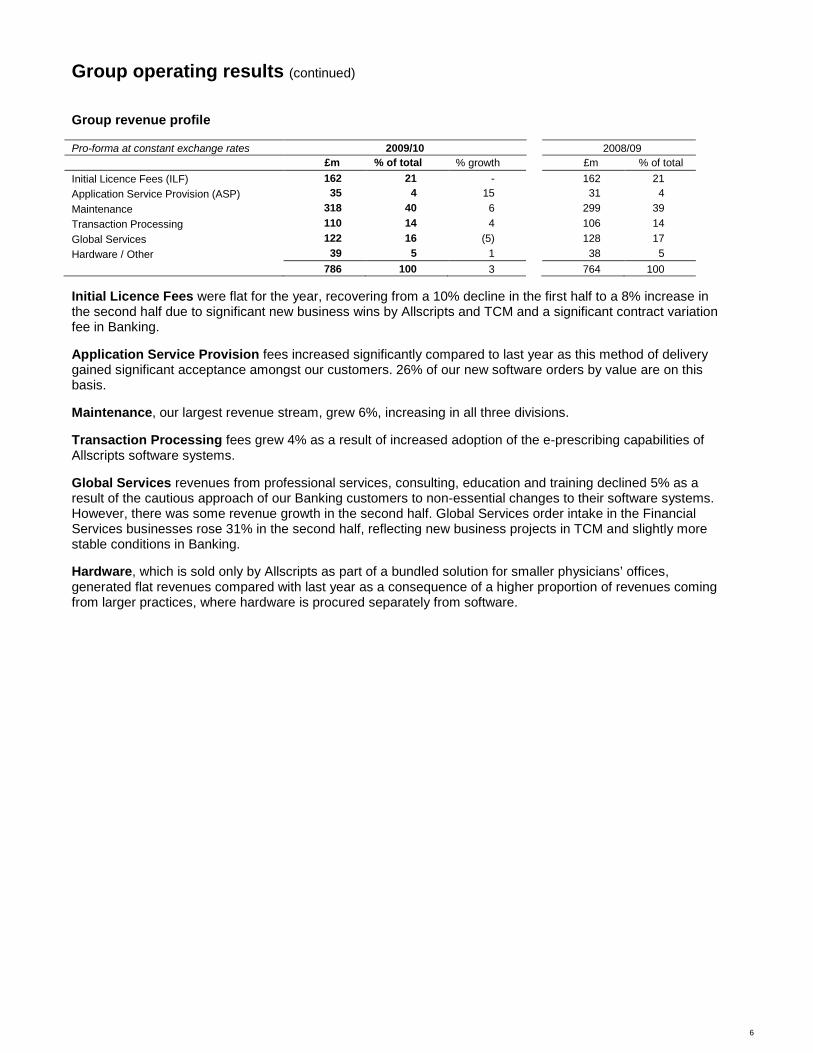
Group operating results (continued) Group revenue profile Pro-forma at constant exchange rates 2009/10 2008/09 £m % of total % growth £m % of total Initial Licence Fees (ILF) 162 21 - 162 21 Application Service Provision (ASP) 35 4 15 31 4 Maintenance 318 40 6 299 39 Transaction Processing 110 14 4 106 14 Global Services 122 16 (5) 128 17 Hardware / Other 39 5 1 38 5 786 100 3 764 100 Initial Licence Fees were flat for the year, recovering from a 10% decline in the first half to a 8% increase in the second half due to significant new business wins by Allscripts and TCM and a significant contract variation fee in Banking. Application Service Provision fees increased significantly compared to last year as this method of delivery gained significant acceptance amongst our customers. 26% of our new software orders by value are on this basis. Maintenance, our largest revenue stream, grew 6%, increasing in all three divisions. Transaction Processing fees grew 4% as a result of increased adoption of the e-prescribing capabilities of Allscripts software systems. Global Services revenues from professional services, consulting, education and training declined 5% as a result of the cautious approach of our Banking customers to non-essential changes to their software systems. However, there was some revenue growth in the second half. Global Services order intake in the Financial Services businesses rose 31% in the second half, reflecting new business projects in TCM and slightly more stable conditions in Banking. Hardware, which is sold only by Allscripts as part of a bundled solution for smaller physicians’ offices, generated flat revenues compared with last year as a consequence of a higher proportion of revenues coming from larger practices, where hardware is procured separately from software.
7
Divisional review The information in this section is presented on an adjusted basis, with comparisons to prior year on a pro-forma constant currency basis unless stated otherwise (see definitions below). A reconciliation to reported numbers is given in the Group Operating Results in the table above.
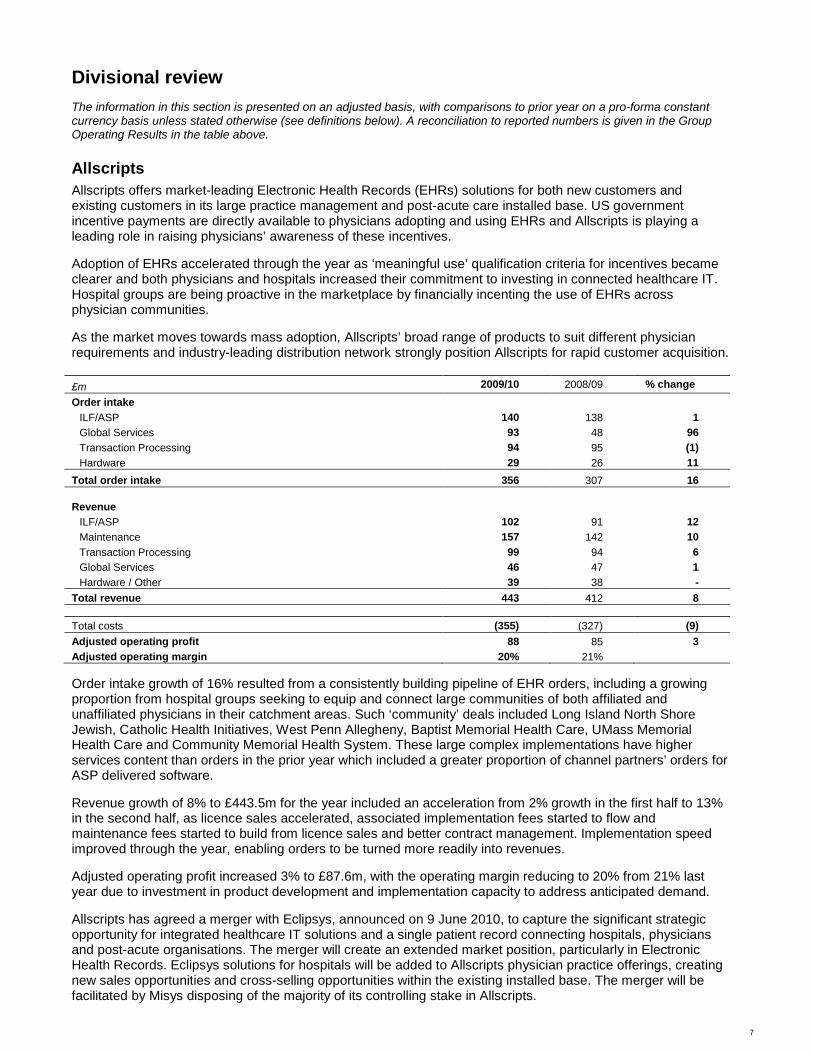
Allscripts Allscripts offers market-leading Electronic Health Records (EHRs) solutions for both new customers and existing customers in its large practice management and post-acute care installed base. US government incentive payments are directly available to physicians adopting and using EHRs and Allscripts is playing a leading role in raising physicians’ awareness of these incentives. Adoption of EHRs accelerated through the year as ‘meaningful use’ qualification criteria for incentives became clearer and both physicians and hospitals increased their commitment to investing in connected healthcare IT. Hospital groups are being proactive in the marketplace by financially incenting the use of EHRs across physician communities. As the market moves towards mass adoption, Allscripts’ broad range of products to suit different physician requirements and industry-leading distribution network strongly position Allscripts for rapid customer acquisition. £m 2009/10 2008/09 % change Order intake
ILF/ASP 140 138 1 Global Services 93 48 96 Transaction Processing 94 95 (1) Hardware 29 26 11
Total order intake 356 307 16
Revenue ILF/ASP 102 91 12 Maintenance 157 142 10 Transaction Processing 99 94 6 Global Services 46 47 1 Hardware / Other 39 38 -
Total revenue 443 412 8
Total costs (355) (327) (9) Adjusted operating profit 88 85 3 Adjusted operating margin 20% 21% Order intake growth of 16% resulted from a consistently building pipeline of EHR orders, including a growing proportion from hospital groups seeking to equip and connect large communities of both affiliated and unaffiliated physicians in their catchment areas. Such ‘community’ deals included Long Island North Shore Jewish, Catholic Health Initiatives, West Penn Allegheny, Baptist Memorial Health Care, UMass Memorial Health Care and Community Memorial Health System. These large complex implementations have higher services content than orders in the prior year which included a greater proportion of channel partners’ orders for ASP delivered software. Revenue growth of 8% to £443.5m for the year included an acceleration from 2% growth in the first half to 13% in the second half, as licence sales accelerated, associated implementation fees started to flow and maintenance fees started to build from licence sales and better contract management. Implementation speed improved through the year, enabling orders to be turned more readily into revenues. Adjusted operating profit increased 3% to £87.6m, with the operating margin reducing to 20% from 21% last year due to investment in product development and implementation capacity to address anticipated demand. Allscripts has agreed a merger with Eclipsys, announced on 9 June 2010, to capture the significant strategic opportunity for integrated healthcare IT solutions and a single patient record connecting hospitals, physicians and post-acute organisations. The merger will create an extended market position, particularly in Electronic Health Records. Eclipsys solutions for hospitals will be added to Allscripts physician practice offerings, creating new sales opportunities and cross-selling opportunities within the existing installed base. The merger will be facilitated by Misys disposing of the majority of its controlling stake in Allscripts.
8
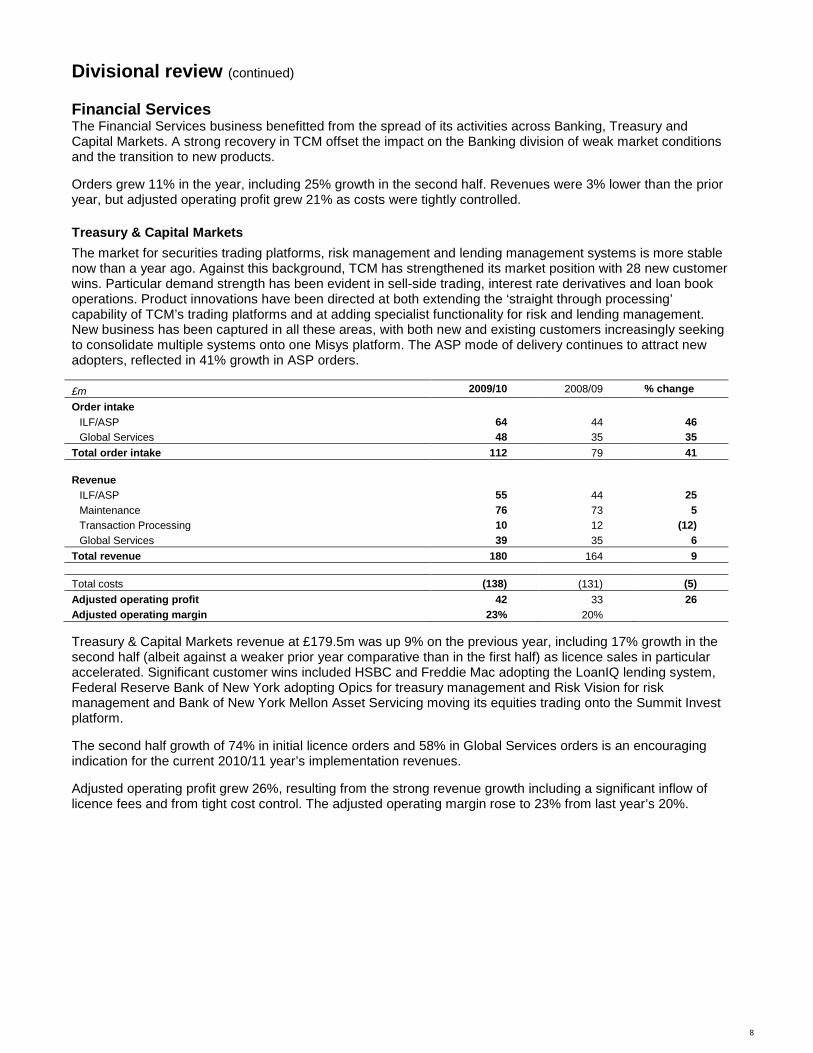
Divisional review (continued) Financial Services The Financial Services business benefitted from the spread of its activities across Banking, Treasury and Capital Markets. A strong recovery in TCM offset the impact on the Banking division of weak market conditions and the transition to new products. Orders grew 11% in the year, including 25% growth in the second half. Revenues were 3% lower than the prior year, but adjusted operating profit grew 21% as costs were tightly controlled.
Treasury & Capital Markets The market for securities trading platforms, risk management and lending management systems is more stable now than a year ago. Against this background, TCM has strengthened its market position with 28 new customer wins. Particular demand strength has been evident in sell-side trading, interest rate derivatives and loan book operations. Product innovations have been directed at both extending the ‘straight through processing’ capability of TCM’s trading platforms and at adding specialist functionality for risk and lending management. New business has been captured in all these areas, with both new and existing customers increasingly seeking to consolidate multiple systems onto one Misys platform. The ASP mode of delivery continues to attract new adopters, reflected in 41% growth in ASP orders. £m 2009/10 2008/09 % change Order intake
ILF/ASP 64 44 46 Global Services 48 35 35
Total order intake 112 79 41
Revenue ILF/ASP 55 44 25 Maintenance 76 73 5 Transaction Processing 10 12 (12) Global Services 39 35 6
Total revenue 180 164 9
Total costs (138) (131) (5) Adjusted operating profit 42 33 26 Adjusted operating margin 23% 20% Treasury & Capital Markets revenue at £179.5m was up 9% on the previous year, including 17% growth in the second half (albeit against a weaker prior year comparative than in the first half) as licence sales in particular accelerated. Significant customer wins included HSBC and Freddie Mac adopting the LoanIQ lending system, Federal Reserve Bank of New York adopting Opics for treasury management and Risk Vision for risk management and Bank of New York Mellon Asset Servicing moving its equities trading onto the Summit Invest platform. The second half growth of 74% in initial licence orders and 58% in Global Services orders is an encouraging indication for the current 2010/11 year’s implementation revenues. Adjusted operating profit grew 26%, resulting from the strong revenue growth including a significant inflow of licence fees and from tight cost control. The adjusted operating margin rose to 23% from last year’s 20%.

9
Divisional review (continued) Financial Services (continued) Banking In Banking, IT spending remained subdued and the buying behaviour of our existing and prospective customers did not materially change between the first and second halves of the year. Concerns over European government debt that emerged in the final quarter of the year have not so far affected the decision-making of our prospective buyers. Whilst opportunities for new sales of traditional core banking systems have been limited, BankFusion and other new and enhanced products such as Mobile Banking, Payments and Business Intelligence offer a radically new solution to banks’ need to be more efficient and competitive. New application functionality can be deployed progressively on the BankFusion platform in a very flexible way. From the licence and services fee streams that result, we expect to return the Banking business to growth. £m 2009/10 2008/09 % change Order intake
ILF/ASP 43 50 (15) Global Services 40 47 (14)
Total order intake 83 97 (15)
Revenue ILF 40 58 (30) Maintenance 85 84 1 Global Services 37 46 (21)
Total revenue 162 188 (14)
Total costs (130) (154) 16 Adjusted operating profit 32 34 (6) Adjusted operating margin 20% 18% Banking revenues declined 14% to £161.7m. The rate of decline was consistent throughout the year despite a more challenging prior year comparison in the second half compared with the first half. Maintenance revenues grew by 1%. Orders declined 15%, with the second half decline of 8% not as marked as in the first half, as new products started to be sold. BankFusion momentum continued to build with a further nine orders in the second half in addition to the two received in the first half. Key among these were the first new competitive customer win with Actinver in Mexico and a multi-region system for Investec as it renovates its existing Equation retail banking system. These orders have yet to feed through into material revenues, but BankFusion revenues are expected to begin to be significant in the second half of 2010/11. We expect BankFusion, Payments, Trade Services, Mobile Banking and Business Intelligence to lead a recovery of the business, starting in this 2010/11 year and building over time. Adjusted operating profit declined 6% to £32.3m, with the revenue decline significantly offset by focussed reductions in overheads in variable compensation, overheads and administration costs. The adjusted operating margin increased by 2 percentage points to 20%.

10
Divisional review (continued) Open Source Solutions In the open source market, we are opening up opportunities in healthcare information systems and in carbon trading. Our open source business is developing platforms and partnerships to build a service-based business around these opportunities. Misys Open Source Solutions (‘MOSS’) revenues, the first of which were generated during the year, come from services and support contracts as well as subscriptions to value-added software components. During the year, MOSS installed its first healthcare information exchange, enabling sharing of health records across communities, for Hartford Hospital. A significant pipeline of other healthcare information exchange opportunities has also been developed. In its carbon trading business, MOSS is offering corporations software solutions to measure, reduce and trade their emissions. In partnership with The Climate Registry, MOSS has developed a system for emissions reporting and has a number of US states in its sales pipeline. Open Source is considered an operating segment and is included within the ‘Corporate & other’ category in the tables above as it is not a reportable segment as required to be disclosed under IFRS 8. Global Services Our Global Services business is extending the services and support we offer to customers, through initiatives such as premium support, our Global Development Centre of Excellence in Bangalore, and the READY and Upgrade Enablement Centre services that accelerate the implementation of Electronic Health Records systems. Global Services order intake (professional services, consulting, education and training) increased 40% in the year to £181.6m, led by strong increases in Allscripts. Orders in the Financial Services businesses rose 30% in the second half, reflecting new projects in TCM including some large trading platform extensions for existing customers. Demand for Global Services in Banking was less constrained during the second half, during which orders grew 4%. Revenues grew 4% on prior year in the second half as orders picked up, particularly at Allscripts and TCM, but declined 5% for the year as a whole as a result of declines in Banking.
Global Services is considered as a horizontal function, which is included and managed within each of the defined operating segments.
Corporate The net charge (excluding exceptional items) for the period was £10.7m against £14.6m in the prior year principally due to the effectiveness of cost reduction measures and certain one-off credits.

11
Profit and Loss Unless otherwise stated, the information in this section is presented on an ‘as reported’ basis. Operating results from for the year ended 31 May 2010 £m 2009/10 2008/09 % growth
Revenue 782 692 13
Operating profit before exceptional items 131 107 22 Exceptional credits 5 69 Exceptional charges (22) (61) Total exceptional items (17) 8 Operating profit 114 115 (1)
Net finance costs (10) (21) Profit before taxation 104 94 Taxation (43) (4) Profit after taxation 61 90 Minority interest (17) (8) Profit after taxation attributable to Misys shareholders 44 82 (46) Number of shares in issue (millions) 529.4 511.1 Earnings per share (basic): reported 8.4p 16.0p (48) Earnings per share (basic): adjusted 13.1p 9.8p 34 Reported Group and divisional operating results £m Revenue Operating Profit 2009/10 2008/09 2009/10 2008/09 Allscripts 440 348 61 94 Treasury & Capital Markets 179 161 42 33 Banking 162 183 31 37 Corporate & other 1 - (20) (49) Financial Services 342 344 53 21 Group 782 692 114 115 Revenue increased by 13% due to a combination of underlying growth at Allscripts and TCM, exchange rate movements and the inclusion of Allscripts for only part of the period in the prior year ‘as reported’ results. Operating profit before exceptional items increased by 22% as a result of increased revenue, improved efficiency and cost control. Exceptional charges of £21.7m (2008/09: £61.4m) include turnaround and restructuring programme charges, costs of the Misys Healthcare-Allscripts merger (both of which were sharply reduced from last year) and a new charge of £9.6m associated with the proposed Allscripts share sale. Exceptional credits of £5.2m arose from a VAT refund and the sale of a legal claim. Last year’s exceptional credit of £69.3m arose from the gain on the partial disposal of Misys Healthcare as part of the merger with Allscripts and is reported in the Allscripts line in the table above. Profit before taxation Profit before taxation at £104.6m reflects improved operating profits and lower net finance charges. The net finance charge at £9.7m was £11.5m lower than last year. This reflects a significant pay-down of debt and the renegotiation in May 2009 of the terms of the debt financing first established in connection with the Misys Healthcare-Allscripts merger and an exceptional credit of £1.4m (2008/09: £2.1m exceptional charge). Taxation The tax charge is £43.2m (including a credit on exceptional items and exceptional tax charge netting to a £6.2m charge) compared with a credit in the prior year of £4.6m (after tax on exceptional items and an exceptional tax charge netting to £24.4m). The underlying effective tax rate at 32% based on adjusted profit before taxation was 2% lower than last year’s rate, principally due to a lower tax rate at Allscripts. The Financial Services business had an effective tax rate of 25% which was lower than the Group due to the reduced impact of the relatively higher US taxation rates.

12
Financial review (continued) Earnings per share (EPS) Basic earnings per share (EPS) of 8.4p has decreased by 7.6p compared to the previous year. The prior year’s basic EPS of 16.0p included a profit on the sale of Misys Healthcare Systems as part of the Allscripts merger. Adjusted EPS excludes exceptional items, gains and losses on embedded derivatives, amortisation of acquired intangible assets and translation exchange differences recycled from reserves. In the opinion of the Directors, adjusted basic EPS provides more comparable and representative information on the continuing trading activities of the Group. On an adjusted basis, basic earnings per share rose 34% to 13.1p due to underlying operating profit growth, lower financing costs and a reduced effective tax rate. Balance sheet and cash flow Capital expenditure, research & development Operating expenditure on research and development of £103.9m increased by £3.5m in the period due principally to the Allscripts acquisition. As our product development has become more efficient, we are able to devote a higher proportion of expenditure to developing new products as opposed to maintaining existing products. Spending on development of key new products to address new market opportunities, principally BankFusion, MyWay (the Allscripts ASP EHR solution) and an ASP version of Summit (a key Treasury & Capital Markets solution) resulted in £31.8m of capitalised software development (2008/09: £28.4m). Amortisation of developed software in the period was £11.9m (2008/09: £5.9m). 2009/10 2008/09
£m Allscripts Banking TCM Open
Source Total Allscripts Banking TCM Open
Source Total Research & development expenditure (including capitalised expenditure)
42 33 28 1 104 34 37 28 1 100
Capitalisation of developed software 13 12 7 - 32 11 11 6 - 28
Amortisation of developed software (3) (5) (4) - (12) (1) (3) (2) - (6)
Net capitalisation 10 7 3 - 20 10 8 4 - 22
Total capital expenditure and investment was £46.7m (2008/09: £57.8m), the balance after software development being £14.9m (2008/09: £29.4m), principally reflecting investments in our computer and systems infrastructure. Cash flow and net debt Net cash flow generated from operations was substantially improved to £168.7m (2008/09: £100.4m). Net debt was eliminated, with a net cash balance of £0.9m compared with net debt of £128.9m at the start of the year. The principal factors were net cash inflow from operations, offset by capital expenditure. The net debt position is made up of net cash of £97.1m in Allscripts and net debt of £96.2m in Financial Services. After completion of the proposed disposal of Misys shares in Allscripts, it is intended that £75m of the proceeds will be used to pay down Misys net debt. Trade receivables increased by 24% since the start of the year to £177.5m, reflecting the acceleration of licence revenues in the final quarter of the year and exchange rate movements. Days’ sales outstanding including accrued income increased to 93 days from 78 days at the end of last year principally due to increased trade receivables at Allscripts and seasonally higher accrued income in Financial Services. The Group continues to focus on cash collection in light of increased revenues. Deferred income increased by 23% since the start of the year to £173.1m, driven principally by growth in maintenance fees and also by initial licence payments prior to software delivery.

13
Disposal of Majority of Controlling Stake in Allscripts On 9 June 2010, Misys announced that it intended to dispose of the majority of its controlling stake in Allscripts and that Allscripts would merge with Eclipsys. The transactions involved a market placing by Misys of between 36 and 40 million Allscripts shares, a buyback by Allscripts of approximately 24.4 million shares for an aggregate consideration of $577.4m which includes a premium of $117.4m and a potential additional buyback of a further 5.3 million shares for an aggregate consideration of $101.6m contingent on successful completion of the Allscripts-Eclipsys merger. Total potential proceeds were illustrated in the announcement at $1,354 million at an average price of $19.99 per share, with a retained holding illustrated of 12.1 million shares. To further optimise proceeds for shareholders from its holding in Allscripts, Misys agreed on 26 July that it would reduce the minimum size of the placing to 25 million shares following positive votes by Allscripts’ and Eclipsys’ shareholders on the merger. Illustrative potential proceeds at this minimum placing size and at the minimum placing price of $16.50 per share would be $1,077 million at an average price of $19.69 per share. The maximum retained holding in this instance would be 25.1 million shares. Shareholder votes to approve the transactions are expected to take place in August 2010. Misys also announced that upon successful completion of the disposal transaction it intends to return the majority of the proceeds to its shareholders through a tender offer, subject to shareholder approval. Up to £75 million will be retained to reduce net debt in the Group. Based on advice received Misys expects the transactions to be tax free and it is seeking an Inland Revenue Service private letter ruling (PLR) to confirm this. The tender offer will not commence until this is confirmed. It is anticipated that the tender offer will be completed before the end of this calendar year. To protect the proceeds of the transaction from fluctuations in the US$:£ exchange rate, foreign exchange option contracts were taken out giving the Company the ability to sell US Dollars for Sterling at an exchange rate of approximately £1=$1.50. On completion of the transactions, the remaining investment in Allscripts will be accounted for as a financial asset and carried at fair value. Notes Adjusted operating results Adjusted results are stated before exceptional items, gains and losses on embedded derivatives, amortisation of acquired intangible assets and translation exchange differences recycled from reserves. Other non-exceptional items excluded from adjusted results are gains on embedded derivatives in Banking of £1.4m (2009: £4.2m gain) and in Treasury & Capital Markets of £0.1m (2009: £0.6m gain), amortisation of acquired intangible assets in Banking of £1.0m (2009: £1.1m) and in Allscripts of £15.8m (2009: £11.3m) and loss on translation exchange differences recycled from reserves in Corporate of £2.0m (2008: £3.3m). Pro-forma constant currency results In pro-forma constant currency results, current year revenues are adjusted by the addition of £3.2m in respect of deferred revenue balances written down upon acquisition of Allscripts Healthcare Solutions (2008/09: £4.7m) included within the overall pre-acquisition adjustment referred to above. Current and prior year operating profit are adjusted by the same amounts. The prior year adjustment to revenues of £71.8m comprises £16.3m to retranslate revenues at average exchange rates for 2009/10 and £55.5m to add Allscripts Healthcare Solutions revenues for the prior year pre-acquisition period from 1 June 2008 to 10 October 2008. Since the Allscripts Healthcare Solutions financial year end differed from the Misys financial year end, pro-forma results from 1 June 2008 to 10 October 2008 are based on Allscripts Healthcare Solutions results for the quarter from July to September 2008, combined with previously reported results of Misys Healthcare Systems, adjusted to exclude significant businesses disposed of during the period. The retranslation adjustment comprises increases of £8.2m to Allscripts, £4.9m to Banking and £3.2m to Treasury & Capital Markets. The most significant impact is from the movement in the US dollar and the Euro against Sterling, where average exchange rates in 2009/10 were US$1.59 and €1.13 compared to US$1.65 and €1.18 in 2008/09. The pro-forma operating profit adjustment of £20.1m for 2008/09 comprises £17.5m relating to Allscripts Healthcare Solutions for the pre-acquisition period and £2.6m to retranslate at average exchange rates for 2009/10 (Allscripts: £1.9m increase; Banking: £1.2m decrease; TCM: £2.8m decrease; Corporate: £4.7m increase).

14
STATEMENT OF DIRECTORS’ RESPONSIBILITIES The 2010 Annual Report, which will be issued on 29 July 2010, contains a responsibility statement in compliance with DTR 4.1.12. This states that on 26 July 2010, the date of approval of the Annual Report, the Directors confirm that to the best of their knowledge:
o the Group financial statements, which have been prepared in accordance with IFRSs as adopted by the EU, give a true and fair view of the assets, liabilities, financial position and profit of the Group; and
o the Business review contained in the Annual Report includes a fair review of the development and performance of the business and the position of the Group, together with a description of the principal risks and uncertainties that it faces.
15
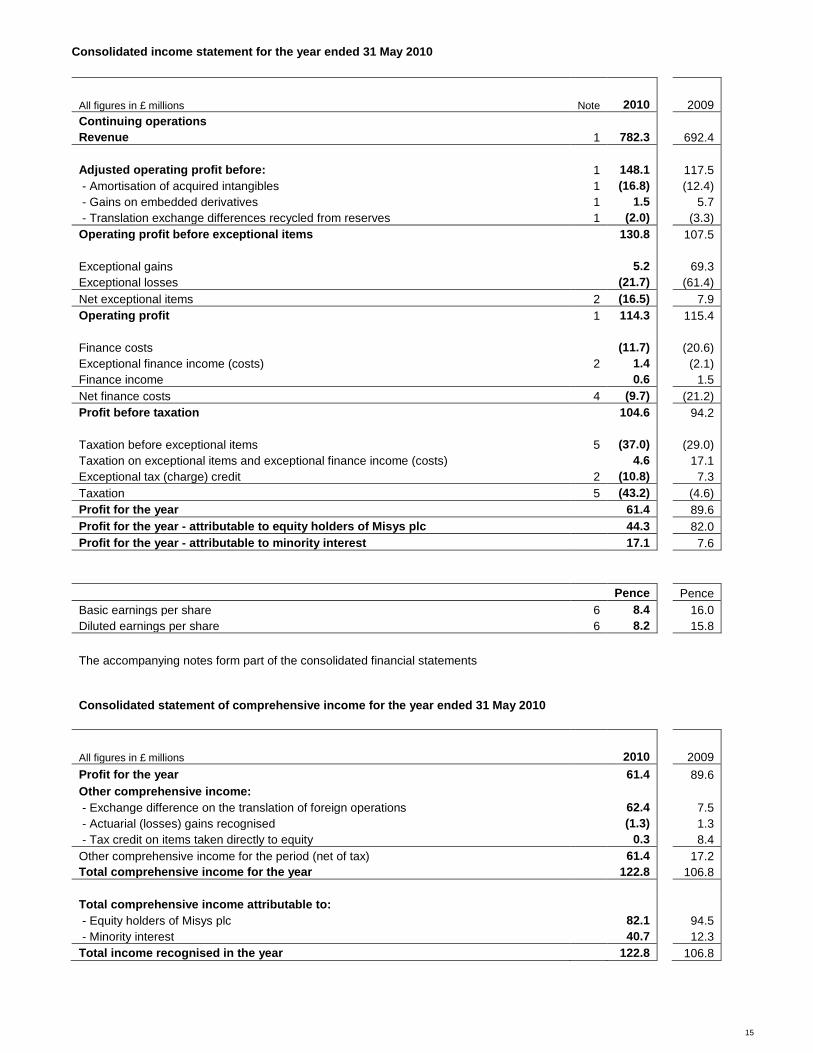
Consolidated income statement for the year ended 31 May 2010 All figures in £ millions Note 2010 2009 Continuing operations Revenue 1 782.3 692.4 Adjusted operating profit before: 1 148.1 117.5 - Amortisation of acquired intangibles 1 (16.8) (12.4) - Gains on embedded derivatives 1 1.5 5.7 - Translation exchange differences recycled from reserves 1 (2.0) (3.3) Operating profit before exceptional items 130.8 107.5 Exceptional gains 5.2 69.3 Exceptional losses (21.7) (61.4) Net exceptional items 2 (16.5) 7.9 Operating profit 1 114.3 115.4 Finance costs (11.7) (20.6) Exceptional finance income (costs) 2 1.4 (2.1) Finance income 0.6 1.5 Net finance costs 4 (9.7) (21.2) Profit before taxation 104.6 94.2 Taxation before exceptional items 5 (37.0) (29.0) Taxation on exceptional items and exceptional finance income (costs) 4.6 17.1 Exceptional tax (charge) credit 2 (10.8) 7.3 Taxation 5 (43.2) (4.6) Profit for the year 61.4 89.6 Profit for the year - attributable to equity holders of Misys plc 44.3 82.0 Profit for the year - attributable to minority interest 17.1 7.6 Pence Pence Basic earnings per share 6 8.4 16.0 Diluted earnings per share 6 8.2 15.8 The accompanying notes form part of the consolidated financial statements Consolidated statement of comprehensive income for the year ended 31 May 2010 All figures in £ millions 2010 2009 Profit for the year 61.4 89.6 Other comprehensive income: - Exchange difference on the translation of foreign operations 62.4 7.5 - Actuarial (losses) gains recognised (1.3) 1.3 - Tax credit on items taken directly to equity 0.3 8.4 Other comprehensive income for the period (net of tax) 61.4 17.2 Total comprehensive income for the year 122.8 106.8 Total comprehensive income attributable to: - Equity holders of Misys plc 82.1 94.5 - Minority interest 40.7 12.3 Total income recognised in the year 122.8 106.8

16
Consolidated statement of cash flows for the year ended 31 May 2010 All figures in £ millions 2010 2009 Operating activities Net cash flow generated from operations 168.7 100.4 Net interest paid (10.6) (9.8) Net taxation paid (6.3) (10.0) Net cash flow from operating activities 151.8 80.6 Investing activities Acquisitions and disposals of businesses (2.9) (150.5) Expenditure on developed software (31.8) (28.4) Other capital expenditure and financial investment (10.9) (22.2) Net cash flow from investing activities (45.6) (201.1) Net cash flow from financing activities (66.2) 167.4 Increase in cash and cash equivalents in the year 40.0 46.9 Net cash and cash equivalents at the start of the year 63.1 27.1 Differences on exchange 11.8 (10.9) Net cash and cash equivalents at the end of the year 114.9 63.1 All figures in £ millions 2010 2009 Continuing operations Profit after taxation 61.4 89.6 Net finance costs 9.7 21.2 Taxation charge 43.2 4.6 Amortisation and impairment charge of other intangible assets 31.4 34.2 Depreciation and impairment charge of property, plant and equipment 9.3 8.7 Share-based payment charge 18.3 11.9 Differences between pension charge and cash contributions 1.2 1.0 Net profit on disposal of businesses - (68.2) (Increase) decrease in inventories (0.3) 0.2 Increase in trade and other receivables (38.7) (0.3) Increase (decrease) in payables and provisions 13.0 (18.9) Increase in deferred income 21.9 15.2 Other non-cash movements (1.7) 1.2 Net cash flow generated from continuing operations 168.7 100.4

17
Consolidated balance sheet as at 31 May 2010 All figures in £ millions Note 2010 2009* Non current assets Goodwill* 13 315.5 289.8 Other intangible assets 14 224.4 202.1 Property, plant and equipment 15 30.8 29.0 Investments 7.1 6.1 Trade and other receivables 16 1.6 5.8 Derivative financial instruments 4.9 3.8 Deferred tax assets 19.5 28.5 603.8 565.1 Current assets Inventories 2.1 1.6 Trade and other receivables 16 285.7 222.1 Derivative financial instruments 1.1 1.7 Current tax asset 5.0 6.5 Cash and cash equivalents 120.3 63.1 414.2 295.0 Current liabilities Trade and other payables* (142.9) (129.7) Loans and overdrafts 17 (46.3) (2.4) Derivative financial instruments (0.7) (1.4) Current tax liabilities* (31.2) (22.3) Provisions 18 (7.7) (6.7) Deferred income (166.5) (138.6) (395.3) (301.1) Net current assets (liabilities) 18.9 (6.1) Total assets less current liabilities 622.7 559.0 Non current liabilities Trade and other payables (5.9) (3.7) Loans and overdrafts 17 (73.1) (189.3) Derivative financial instruments (2.0) (2.1) Deferred tax liabilities* (11.1) (4.9) Provisions 18 (18.0) (19.1) Deferred income (6.6) (2.4) Retirement benefit obligations (4.3) (1.7) (121.0) (223.2) Net assets 501.7 335.8 Equity Share capital 5.9 5.9 Share premium account 151.9 151.9 Capital redemption reserve 0.3 0.3 Other reserves 193.8 85.2 Equity shareholders' funds 351.9 243.3 Minority interest* 149.8 92.5 Total equity 501.7 335.8
* As required under IFRS 3, Misys has reassessed and finalised the provisional allocation of the Allscripts purchase price within the allowed 12 month period since the acquisition date and has restated the opening balances accordingly (see note 13). Approved by the board Mike Lawrie 26 July 2010

18
Consolidated statement of changes in equity for the year ended 31 May 2010
All figures in £ millions Share
capital Share
premium
Capital redemption
reserve Other
reserves
Attributable to the owners of the parent
Minority interest
Total equity
At 1 June 2009 5.9 151.9 0.3 85.2 243.3 92.5 335.8 Total comprehensive income for the year - - - 82.1 82.1 40.7 122.8 Transactions with owners Share options settled from own shares - - - 2.9 2.9 - 2.9 Exercise of Allscripts share options - - - - - 0.8 0.8 Conversion of Allscripts 3.5% senior convertible debentures - - - 3.5 3.5 5.7 9.2 Share-based payments - - - 12.9 12.9 5.4 18.3 Deferred tax on share-based payments - - - 7.2 7.2 4.7 11.9 At 31 May 2010 5.9 151.9 0.3 193.8 351.9 149.8 501.7 for the year ended 31 May 2009
All figures in £ millions Share capital
Share premium
Capital redemption
reserve Other
reserves
Attributable to the owners of
the parent Minority interest*
Total equity*
At 1 June 2008 5.5 67.3 0.3 5.2 78.3 - 78.3
Total comprehensive income for the year - - - 94.5 94.5 12.3 106.8 Transactions with owners
Shares issued in the year (net of expenses) 0.4 84.6 - - 85.0 - 85.0 Dividends paid - - - (23.9) (23.9) - (23.9) Exercise of Allscripts share options - - - - - 3.8 3.8 Buyback of Allscripts shares - - - - - (15.2) (15.2) Acquisitions 1 - - - - - 90.3 90.3 Share-based payments - - - 9.9 9.9 2.3 12.2 Deferred tax on share-based payments - - - (0.5) (0.5) (1.0) (1.5) At 31 May 2009* 5.9 151.9 0.3 85.2 243.3 92.5 335.8
'1 Minority interest related acquisitions reserves include £67.9m for Allscripts and £22.4m for Misys Healthcare Systems. On 18 March 2008, Misys launched a conditional placing of 42,857,143 new ordinary shares, with a nominal value of 1 penny per share (the Placing Shares) at a price of 175 pence per Placing Share. During the year ended 31 May 2009, all of the Placing Shares were acquired by ValueAct Capital (acting through its general partner VA Partners I, LLC) pursuant to the underwriting commitment provided by it at the time of the placing. Proceeds of the issue generated share premium of £84.6m net of issue expenses of £3.0m. * As required under IFRS 3, Misys has reassessed and finalised the provisional allocation of the Allscripts purchase price within the allowed 12 month period since the acquisition date and has restated the opening balances accordingly (see note 13).

19
Accounting policies Basis of preparation
The financial information which comprises the consolidated income statement, consolidated statement of comprehensive income, consolidated statement of cash flows, consolidated balance sheet, consolidated statement of changes in equity and related notes do not constitute full accounts within the meaning of s435(1) and (2) of the Companies Act 2006. The auditors have reported on the Group's statutory accounts for each of the years 2009/10 and 2008/09, which do not contain statements under s498 (2) or (3) of the Companies Act 2006 and which are unqualified. The statutory accounts for 2008/09 have been delivered to the Registrar of Companies and the statutory accounts for 2009/10 will be filed with the Registrar in due course. The consolidated financial statements have been prepared in accordance with International Financial Reporting Standards (IFRS) as adopted by the European Union, IFRIC interpretations and with those parts of the Companies Act 2006 applicable to companies reporting under IFRS. The Group’s statutory financial statements are presented in Sterling and they are rounded to the nearest hundred thousand. The consolidated financial statements have been prepared under the historical cost convention, as modified by the use of valuations for certain financial instruments, share-based payments and retirement benefits. The accounting policies adopted are consistent with those of the annual financial statements for the year ended 31 May 2009, as described in those annual financial statements, except for the more significant changes noted below: IFRS 8 'Operating segments' was issued in November 2006. It replaces IAS 14 'Segmental reporting' and requires operating segments to be disclosed on the same basis as that used for internal reporting. It has been implemented by the Group from 1 June 2009 and has had no impact on the results or net assets of the Group, but has resulted in revised disclosures. See Note 1 for further details. IAS 1 (Revised) ‘Presentation of financial statements’ is effective for the year ended 31 May 2010. The standard requires a change in the format and presentation of the Group’s primary statements, but has had no impact on reported profits or equity.
Other than those disclosed in this preliminary announcement, no significant events impacting the Group have occurred between 31 May 2010 and 26 July 2010 when the financial information was approved for issue.

20
1. Segmental analysis Operating segments are reported in a manner consistent with the internal reporting to the Chief Operating Decision Maker ('CODM'). The CODM has been identified as the Misys Operations Team, comprising the Group Chief Executive, Chief Financial Officer and all Executive Vice Presidents. The Misys Operations Team is responsible for resources allocation and assessing the performance of the operating segments. The operating segments are defined by distinctly separate product offerings or markets. The operating segments consist of Allscripts, Banking, Treasury & Capital Markets (TCM) and Open Source. The 'Corporate and others' category includes Open Source and corporate costs as these operations are not reportable segments as required to be disclosed under IFRS 8. Corporate was previously known as Central Services. Global Services is considered as a horizontal function with performance assessed by the CODM in each of the defined operating segments. Certain costs within the 'Corporate & others' segment are allocated to the other reportable segments based on revenue. Costs allocated to Allscripts are based on a shared service agreement between the Group and Allscripts. Revenue, operating profit (loss) by business
Banking TCM Allscripts Corporate & others
2010 All figures in £ millions Total Revenue 161.7 179.5 440.4 0.7 782.3 Adjusted operating profit 32.3 42.0 84.5 (10.7) 148.1 Amortisation of acquired intangibles (1.0) - (15.8) - (16.8) Gains on embedded derivatives 1.4 0.1 - - 1.5 Translation exchange differences recycled from reserves - - - (2.0) (2.0) Operating profit (loss) before exceptional items 32.7 42.1 68.7 (12.7) 130.8 Exceptional items (1.4) - (8.1) (7.0) (16.5) Operating profit 31.3 42.1 60.6 (19.7) 114.3 Exceptional finance income 1.4 Net finance costs (11.1) Profit before taxation 104.6 Taxation before exceptional items (37.0) Taxation on exceptional items and exceptional finance income 4.6 Exceptional tax charge (10.8) Taxation (43.2) Profit for the year 61.4 Banking TCM Allscripts* Corporate &
others 2009
All figures in £ millions Total Revenue 183.0 161.1 348.3 - 692.4 Adjusted operating profit 35.4 35.9 65.4 (19.2) 117.5 Amortisation of acquired intangibles (1.1) - (11.3) - (12.4) Gains on embedded derivatives 4.2 0.6 - 0.9 5.7 Translation exchange differences recycled from reserves - - - (3.3) (3.3) Operating profit (loss) before exceptional items 38.5 36.5 54.1 (21.6) 107.5 Exceptional items (1.6) (3.3) 40.4 (27.6) 7.9 Operating profit 36.9 33.2 94.5 (49.2) 115.4 Exceptional finance costs (2.1) Net finance costs (19.1) Profit before taxation 94.2 Taxation before exceptional items (29.0) Taxation on exceptional items and exceptional finance cost 17.1 Exceptional tax credit 7.3 Taxation (4.6) Profit for the year 89.6
* Allscripts comparatives include results for Allscripts Healthcare Solutions since acquisition on 10 October 2008. All revenue is derived from external customers. Revenue from no individual customer exceeded 10% of total Group revenue in the current or prior year.

21
The Corporate & others charge has decreased from £21.6m to £12.7m due principally to procurement and efficiency savings introduced during 2009. In addition, costs in relation to translation exchange differences recycled from reserves have decreased by £1.3m. Revenue The table below gives a list of the revenue streams by segment.
Banking TCM Allscripts Corporate & others
2010 Banking TCM Allscripts 2009
All figures in £ millions Total Total Initial licence fees 40.3 51.3 69.6 - 161.2 57.4 40.2 45.5 143.1 ASP revenue 0.2 3.5 31.6 - 35.3 0.1 3.3 19.1 22.5 Maintenance 84.7 76.3 156.2 - 317.2 81.4 71.1 123.2 275.7 Transaction processing - 10.2 99.4 - 109.6 - 11.3 88.3 99.6 Global services 36.5 38.2 44.8 0.7 120.2 44.1 35.2 32.6 111.9 Hardware - - 27.8 - 27.8 - - 20.0 20.0 Other revenue - - 11.0 - 11.0 - - 19.6 19.6 161.7 179.5 440.4 0.7 782.3 183.0 161.1 348.3 692.4
There was no revenue for Corporate & others in 2009. For further details of the products and services, refer to the accounting policies and financial review sections. During the year, Misys signed a contract with a customer to vary the terms of an existing contract and to grant the customer flexibility over the future use of its software. The consideration included a variation fee of £6.0m which has been classified as ILF revenue. As this is a variation fee, there will be no incremental maintenance fees chargeable going forward. Other segmental information
Banking TCM Allscripts Corporate & others
2010
All figures in £ millions Total
Net assets (liabilities) Assets 118.1 137.3 711.3 51.3 1,018.0 Liabilities (103.0) (87.3) (156.9) (169.1) (516.3) 15.1 50.0 554.4 (117.8) 501.7 Capital investment Goodwill & acquired intangibles - - - - - Developed software 11.6 6.5 13.4 0.3 31.8 Other 1.7 1.1 10.5 1.6 14.9 13.3 7.6 23.9 1.9 46.7 Depreciation, amortisation, impairment and de-recognition Acquired intangibles 1.0 - 14.8 - 15.8 Developed software 5.0 3.9 3.0 - 11.9 Other 3.2 2.6 7.0 0.8 13.6 9.2 6.5 24.8 0.8 41.3 Share based payment charge 1.0 1.0 13.7 4.0 19.7 Employees (average number) 1,525 1,029 2,412 1,164 6,130

22
Banking TCM Allscripts Corporate & others
2009 All figures in £ millions Total Net assets (liabilities) Assets* 115.0 99.9 573.6 71.6 860.1 Liabilities* (88.7) (74.7) (147.3) (213.6) (524.3) 26.3 25.2 426.3 (142.0) 335.8 Capital investment Goodwill & acquired intangibles - - 343.6 - 343.6 Developed software 10.9 6.7 10.8 - 28.4 Other 1.7 1.6 24.1 13.8 41.2 12.6 8.3 378.5 13.8 413.2 Depreciation, amortisation, impairment and de-recognition Acquired intangibles 1.1 - 10.7 - 11.8 Developed software 2.9 2.2 8.5 - 13.6 Other 1.9 1.3 11.7 9.4 24.3 5.9 3.5 30.9 9.4 49.7 Share based payment charge 1.2 1.1 6.0 3.3 11.6 Employees (average number) 1,375 1,044 2,021 971 5,411
Amortisation of other intangibles for 2010 within Allscripts includes £1.0m of amortisation relating to the acquisition of a perpetual licence for healthcare software which is being amortised over seven years and which is part of the adjusting item 'amortisation of acquired intangibles'. Capital investment comprises expenditure on investments, goodwill, other intangible assets and property, plant and equipment. Banking and TCM assets consist primarily of goodwill, other intangible assets, property, plant and equipment and trade and other receivables and exclude cash balances, corporation tax recoverable and deferred tax assets which are included within Corporate as these are managed centrally. Allscripts' assets include all of the above items, including cash and taxation assets, as it is a separate listed entity. Banking and TCM liabilities consist primarily of trade and other payables and provisions and exclude bank overdrafts, loans, corporation tax payable, deferred tax liabilities and retirement benefit obligations, which are included within Corporate & others as these are managed centrally. Allscripts' liabilities include all of the above items including overdrafts, taxation liabilities and retirement benefit obligations as it is a separate listed entity. No impairment charge has been recognised in the current financial year. In 2009, an impairment charge of £6.4m was recognised in relation to an investment in iMedica Corp being surrendered. The £6.4m impairment was attributable to the Allscripts operating segment. Misys plc is domiciled in the UK. The total revenue from external customers in the UK and United States of America is included in the table below. The total revenue from external customers from other countries is shown under the regional headings below.
All figures in £ millions
United Kingdom
Rest of Europe
Asia Pacific
United States of America
Middle East and
Africa
Other 2010 Total
Revenue by destination 47.7 131.8 50.1 500.0 46.5 6.2 782.3 Assets by location of operations 90.5 63.2 28.1 804.1 24.3 7.8 1,018.0 Non-current assets by location of operations 36.5 39.2 1.7 499.4 0.4 2.2 579.4 Capital investment by location of operations 7.2 6.5 0.6 31.4 - 1.0 46.7 Employees by location of operations (average number) 402 543 2,077 2,902 111 95 6,130
All figures in £ millions
United Kingdom
Rest of Europe
Asia Pacific
United States of America
Middle East and
Africa
Other 2009 Total
Revenue by destination 39.3 131.9 49.5 409.3 51.1 11.3 692.4 Assets by location of operations* 95.0 69.1 26.8 642.0 22.2 5.0 860.1 Non-current assets by location of operations 35.3 38.0 1.8 453.4 1.3 3.0 532.8 Capital investment by location of operations 17.3 7.5 0.6 386.7 - 1.1 413.2 Employees by location of operations (average number) 485 532 1,718 2,468 98 110 5,411
* As required under IFRS 3, Misys has reassessed and finalised the provisional allocation of the Allscripts purchase price within the allowed 12 month period since the acquisition date and has restated the opening balances accordingly (see note 13).

23
2. Exceptional items
All figures in £ millions 2010 2009 Restructuring activities and turnaround programme (A) (8.7) (27.5) Merger of Misys Healthcare Systems with Allscripts Healthcare Solutions (B) (3.1) (26.9) Costs on proposed disposal of Allscripts (C) (9.6) - Receipt from sale of legal claim (D) 3.9 - Exceptional refund of VAT (E) 1.3 - Currency swap - (4.7) Impairment of investment - (1.2) Loss on disposal of Medication Services Group (0.3) (1.1) Profit on disposal of businesses - 69.3 Exceptional items (16.5) 7.9 Exceptional finance income (costs) (F) 1.4 (2.1) Tax credit on exceptional items and exceptional finance income (costs) 4.6 17.1 Exceptional tax (charge) credit (G) (10.8) 7.3 Total exceptional items after taxation (21.3) 30.2
(A) Restructuring activities and turnaround programme A total charge of £8.7m (2009: £27.5m) has been recognised as an exceptional item in relation to costs incurred in the Group-wide restructuring and turnaround programme. In the current year, these costs primarily relate to: • property costs £5.3m (2009: £13.7m) being a provision for onerous leases where in the current economic climate it has
proved difficult to sublet vacant office space and costs associated with the closure of offices. This charge includes a £2.3m gain on the surrender of a property lease;
• severance costs £3.4m (2009: £5.8m); • the derecognition of intangible assets £nil (2009: £5.8m); and • the creation of a customer support service centre £nil (2009: £1.9m). These costs are analysed by business as follows:
All figures in £ millions 2010 2009 Banking 1.4 1.6 TCM - 3.3 Allscripts - 0.2 Corporate 7.3 22.4 8.7 27.5
There was a related cash outflow of £4.6m in the current year (2009: £15.4m). (B) Merger of Misys Healthcare Systems with Allscripts Healthcare Solutions A charge of £3.1m (2009: £26.9m) has been recognised in relation to costs incurred in the merger of the Misys Healthcare Systems business with Allscripts Healthcare Solutions to create Allscripts-Misys Healthcare Solutions, Inc. (“Allscripts”) on 10 October 2008. These costs include a write-down in Allscripts of investments and intangible assets relating to that part of the business addressing smaller physician practices £nil (2009: £16.0m), integration costs £3.1m (2009: £8.6m) (including severance and consultancy costs) and onerous property costs £nil (2009: £2.3m). There is a related cash outflow of £3.3m (2009: £7.5m). (C) Costs on proposed disposal of Allscripts On 9 June 2010, it was announced that the Group would dispose of its majority holding in Allscripts. Costs incurred up to 31 May 2010 totalled £9.6m relating to consultancy, legal and tax fees (Corporate £4.9m and Allscripts £4.7m). Further details of the transaction are given in note 21 (cash outflow: £3.8m). (D) Receipt from sale of legal claim On 27 May 2010, an offer of $6m from a third party was accepted to sell an outstanding claim against Lehman Brothers arising from its administration in 2009. The original claim by Misys arose as a result of the failure to complete funding for the Allscripts acquisition. This cash was received before 31 May 2010. (E) Exceptional refund of VAT Agreement was reached with HMRC relating to the repayment of VAT incurred between years 1988 to 1995 relating to acquisition costs. A total of £2.7m including interest (see F) was received in June 2010. (F) Exceptional finance costs

24
A credit of £1.4m has arisen as a result of supplemental interest on the refund of VAT (see E above). Last year £2.1m was charged being the unamortised balance of the transaction costs relating to the original $340m revolving credit and bridge facilities in connection with the Allscripts acquisition. (G) Taxation The exceptional tax charge of £10.8m (2009: credit £7.3m) relates to the loss of future tax benefits following the restructuring of the US operations in anticipation of the proposed disposal of the Group's stake in Allscripts, recognised as a £2.7m charge (2009: credit £2.6m) within current taxation and a £8.1m charge (2009: credit £4.7m) within deferred taxation.
3. Operating Costs
2010
2009 All figures in £ millions Cost of sales 426.2 390.6 Sales and marketing costs 79.1 69.1 Administrative and other operating charges 146.2 125.2 Exceptional items (note 2) 16.5 (7.9) 668.0 577.0 Included within operating costs are the following items by nature:
2010
2009 All figures in £ millions Research and development expenditure 103.9 100.4 Capitalisation of developed software (31.8) (28.3) 72.1 72.1 Amortisation of developed software 11.9 5.9 Amortisation of other intangible assets 19.5 13.9 Impairment and derecognition of intangible assets - 14.4 Impairment and depreciation of property, plant and equipment 9.3 8.7 Gain on disposal of property, plant and equipment - (0.1) Foreign exchange differences 1.9 (2.0) Cost of inventory recognised as an expense 27.0 17.8 Operating lease costs - land and buildings 20.4 20.4 - plant and equipment 0.9 0.4
During the year, the Group obtained the following services from the Company's auditor and its associates:
2010
2009 All figures in £ millions
Fees payable to PwC LLP for the audit of the consolidated financial statements 0.6 0.9 Statutory audit fees payable to associate members of PwC LLP 0.9 1.2
Other fees in respect of assurance services required by legislation and regulation 1.6 1.9 3.1 4.0 Tax services 2.4 0.6 Other services 0.6 0.7 6.1 5.3
Tax fees include £1.7m relating to the proposed disposal of Allscripts (note 21). The statutory audit fees for 2010 include £0.2m additional fees in relation to the 2009 financial year.

25
4. Net finance costs.
2010
2009 All figures in £ millions
Bank loans and overdraft interest payable (6.7) (11.9) Amortisation of financing facility costs (2.0) (6.3) Other interest payable (1.3) (1.8) Expected return on pension scheme assets 2.4 2.7 Interest cost on pension scheme liabilities (2.4) (2.6) Financing fair value re-measurement loss on forward currency exchange contracts (0.4) - Unwinding of discount on provisions (1.3) (0.7) Finance costs (11.7) (20.6) Exceptional finance income/(cost) (note 2) 1.4 (2.1) Interest receivable 0.6 1.5 Net finance costs (9.7) (21.2)
An element of the Group’s derivatives is ineligible for hedge accounting under IFRS. Gains or losses on these derivatives arising from market movements are credited or charged to financing fair value re-measurements within finance income and finance expense in the Group income statement. These gains or losses are not regarded as part of operating profit as they relate to financing activities of the Group. In the prior year, bank loans and overdraft interest payable included £7.4m payable on the loan from the majority shareholder, ValueAct. Though not a bank, the interest was reported in this category to maintain comparability year on year, since ValueAct provided interim financing for the merger with Allscripts Healthcare Solutions following the onset of Lehman Brothers' administration shortly before the date of that transaction. A credit of £1.4m has arisen as a result of supplemental interest on the refund of a VAT claim (see note 2). Last year, the amortisation of issue costs included an amount of £2.1m being the write-off of the balance of the transaction costs of the original $340m revolving credit and bridge facilities at the date of re-financing in May 2009. These items have been treated as exceptional. 5. Taxation.
All figures in £ millions 2010 2009 Current taxation UK corporation tax at 28% (2009: 28%) 0.2 0.8 UK prior year items 0.3 (3.9) Overseas taxation 18.3 1.5 Overseas prior year items (6.0) 1.0 Irrecoverable withholding taxes 2.1 3.6 Current taxation (including tax relating to exceptional items) 14.9 3.0
Deferred taxation 28.3 1.6 Tax expense (credit) - continuing operations 43.2 4.6
Included within current taxation are credits of £5.0m (2009: £16.5m) in respect of tax on exceptional items, a charge of £0.4m (2009: credit £0.6m) in respect of tax on exceptional interest and a charge of £10.8m (2009: credit £7.3m) in respect of exceptional tax items.

26
The taxation charge for the current year based on profit before taxation is higher (2009: lower) than the standard rate of UK corporation tax for the following reasons:
2010
2009 All figures in £ millions
Profit on ordinary activities before taxation 104.6 94.2 Tax on profit on ordinary activities at the standard rate of UK tax of 28% (2009: 28%) 29.3 26.4 Effects of: Permanent differences (primarily exemption on disposal of businesses in the prior year) 5.0 (19.0) Profits arising overseas which are subject to rates of tax other than the UK standard rate 11.6 (1.1) Effects of temporary differences on which deferred tax is not recognised 2.1 5.5 Adjustments to UK taxation charge in respect of prior periods 0.3 (3.9) Impact of changes in tax rates (0.7) (1.9) Adjustments to overseas taxation charge in respect of prior periods (6.0) 1.0 Irrecoverable withholding tax 2.1 3.6 Deferred tax effect of prior periods (0.5) (6.0) Total tax charge 43.2 4.6
As a UK reporting entity, Misys plc is UK tax resident and therefore the applicable rate for the reconciliation is considered to be the weighted standard rate of UK corporation tax applying over the year ended 31 May 2010 of 28% (2009: 28%). There is no income tax expense or tax credit in the income statement relating to the components of other comprehensive income. 6. Earnings per share Basic earnings per share (EPS) have been calculated by dividing profit attributable to equity shareholders by the weighted average number of shares in issue during the year, excluding shares purchased by the Group and held as MEST, ESOP or treasury shares. Adjusted basic and adjusted diluted EPS are presented to provide more comparable and representative information on continuing operations. Accordingly, the adjusted basic and adjusted diluted EPS figures exclude exceptional items, gains and losses on embedded derivatives, amortisation of acquired intangibles and translation exchange differences recycled from reserves. All figures in £ millions 2010 2009 Profit for the year 61.4 89.6 Minority interest (17.1) (7.6) Profit attributable to shareholders 44.3 82.0 Exceptional items after taxation (note 2) 21.3 (30.2) Gains on embedded derivatives (after tax) (1.0) (5.7) Amortisation of acquired intangibles (after tax) 10.7 7.7 Translation exchange differences recycled from reserves (after tax) 0.7 3.3 Adjusted profit items attributable to minority interest (6.8) (7.0) Adjusted profit attributable to shareholders 69.2 50.1 pence pence Basic earnings per share 8.4 16.0 Diluted earnings per share 8.2 15.8 Adjusted basic earnings per share 13.1 9.8 Adjusted diluted earnings per share 12.8 9.7
The weighted average number of basic and diluted shares in issue during the period were 529.4m and 537.4m respectively (2009: 511.1m and 514.7m). Diluted EPS includes the dilutive effect of outstanding share options.

27
7. Net interest paid All figures in £ millions 2010 2009 Interest received 0.4 1.4 Bank loans and overdraft interest paid (11.0) (11.2) Net cash flow from interest paid (10.6) (9.8)
8. Acquisitions and disposals of businesses All figures in £ millions 2010 2009 Cash consideration paid in respect of current year acquisitions (including expenses) - (198.9) Cash consideration paid in respect of prior year acquisitions (2.4) (0.4) Cash consideration received in respect of current year disposals (net of expenses) - 3.4 Cash consideration paid in respect of prior year disposals (0.5) - Cash at bank and in hand acquired - 45.4 Net cash flow from acquisitions and disposals (2.9) (150.5)
9. Other capital expenditure and financial investment All figures in £ millions 2010 2009 Purchase of third party software (3.8) (15.0) Purchase of property, plant and equipment (8.2) (11.8) Purchase of investments (1.3) (2.4) Sale of property, plant and equipment 0.4 5.0 Sale of investments 2.0 2.0 Net cash flow from other capital expenditure and financial investment (10.9) (22.2)
10. Financing activities All figures in £ millions 2010 2009 Dividends paid - (23.9) (Decrease) increase in borrowings (68.9) 118.2 Capital element of finance leases (0.9) (0.5) Payments for the purchase of own shares1 - (15.2) Share options exercised 3.6 3.8 Shares issued - 85.0 Net cash flow from financing activities (66.2) 167.4
1 2009 includes Allscripts buyback of own shares. 11. Movement in borrowings All figures in £ millions 2010 2009 Repayment of bank loans (99.8) (201.7) Receipt of bank loans 58.1 350.0 Capitalised fees in respect of bank loans (0.2) (7.8) Receipt of other loans 0.1 112.0 Repayment of other loans (27.1) (129.1) Capitalised fees in respect of other loans - (5.2) (Decrease) increase in borrowings (68.9) 118.2

28
12. Analysis of net funds (debt)
All figures in £ millions
At 1 June 2009
Cash flow
Non cash movements
Differences on
exchange
At 31 May
2010 Cash 63.1 45.4 - 11.8 120.3 Bank overdraft - (5.4) - - (5.4) 63.1 40.0 - 11.8 114.9 Bank loans (note 17) (178.5) 68.7 (2.0) (0.5) (112.3) Debentures (note 17) (12.2) - 12.2 - - Interest bearing considerations (0.3) 0.3 - - - Finance leases (1.0) 0.9 (1.5) (0.1) (1.7) Net (debt) funds (128.9) 109.9 8.7 11.2 0.9
Included in the above amounts are Allscripts cash balances of £98.7m (2009: £44.0m) and other cash balances of £4.3m (2009: £0.3m) not available for the general use of the Group. The Allscripts cash balances are restricted due to the sizeable minority interest. 13. Goodwill All figures in £ millions 2010 2009* Adjusted opening cost and net book value 289.8 64.9 Differences on exchange 29.1 21.9 Acquisitions - 204.7 Adjustment to goodwill 1 (3.4) (1.7) Cost and net book value at 31 May 315.5 289.8
1 Goodwill was adjusted by £3.4m to reflect the conversion of Allscripts’ 3.5% senior convertible debentures to equity (see note 17). The adjustment in 2009 relates to finalising the purchase price allocation under IFRS3. Significant cash generating units Goodwill relating to the Banking £19.9m (2009: £22.6m), TCM £39.0m (2009: £33.3m) and Allscripts £260.0m (2009: £235.6m) groups of cash generating units (CGUs) are considered significant in comparison to the total carrying amount of goodwill assets at 31 May 2010. The recoverable amounts of the Banking and TCM CGUs were determined based on value-in-use calculations and no impairment was identified during the year. The recoverable amount of Allscripts CGU was determined using a ’fair value less costs to sell’ calculation and no impairment was identified during the year. Where the recoverable amount of a CGU is determined based on value-in-use calculations, these calculations use pre-tax cash flows for each CGU based on approved budgets and management forecasts which are consistent with the recent financial performance of the relevant CGU. For all of the value-in-use calculations, it was not necessary to look at cash flows beyond five years as cash flows within this time horizon were significantly in excess of the carrying amounts of the CGUs and hence no terminal value was assigned. Direct and indirect costs and corporate overheads have been calculated using the same percentage of revenue as for the recent budget which incorporates planned margin improvement. Management determined budgeted operating margins based on past performance and its expectations of market development as outlined in the business review section. Sensitivity analyses have been performed around the base case assumptions with the conclusion that no reasonably possible changes in key assumptions would cause the recoverable amount to be less than the carrying amount. For Banking value-in-use calculations, the first three years' cash flows were based on budget and management forecasts and thereafter growth rates as reflected in the table below were used. For TCM value-in-use calculations, the first three years were based on budget and management forecasts and thereafter growth rates based on current and expected future performance as reflected in the table below. The following assumptions have been used in order to determine recoverable amounts based on value-in-use calculations:
CGU
Growth rates for cash flows 1 – 3 years
Growth rates for cash flows 4 – 5 years
Pre-tax discount rate
Banking 0% - 12% 3% 10.4% TCM 7% - 10% 8% - 10% 12.1%

29
The Allscripts impairment review compared the Misys share of the market capitalisation of Allscripts as at 31 May 2010 less estimated disposal costs against the net book value of the CGU. No reasonable movement in the share price would result in an impairment of goodwill. The proposed disposal of Allscripts is described in more detail in note 21. Acquisition of Allscripts Healthcare Solutions, Inc. * On 10 October 2008, the Group acquired 56.8% of the issued share capital of Allscripts-Misys Healthcare Solutions, Inc. for a cash consideration, including expenses, both paid and accrued, of £200.8m ($330m plus related expenses). As part of the acquisition, 100% ownership of Misys Healthcare Systems was transferred to Allscripts. An analysis of the net assets acquired is shown below:
All figures in £ millions
Book value Fair value adjustment
Final fair value at 31 May 2010
Provisional fair value at
31 May 2009*
Intangible assets 70.3 69.2 139.5 139.5 Property, plant and equipment 13.0 (1.8) 11.2 11.2 Deferred tax liabilities 23.4 (24.9) (1.5) (3.0) Cash 45.4 - 45.4 45.4 Other assets 68.9 (0.3) 68.6 68.6 Other liabilities (113.6) 7.6 (106.0) (107.5) Net assets acquired 107.4 49.8 157.2 154.2 Minority interest (67.9) (66.6) Misys shareholders' interest 89.3 87.6 Goodwill 202.9 204.7 Total consideration 292.2 292.3
Total consideration of £292.2m includes the cash consideration of £200.8m (including directly attributable expenses of £7.1m) and the fair value attributed to the 43.2% net disposal of Misys Healthcare of £91.4m. The original fair value adjustments contained provisional amounts which have now been finalised. The goodwill arising on the acquisition of Allscripts Healthcare Solutions is principally attributable to the anticipated profitability achieved through perceived cost and revenue synergies. The fair value adjustments are based on an independent valuation at the time of acquisition and primarily relate to identified intangible assets (technology, relationships and brand name), deferred revenue and related deferred tax. * In accordance with IFRS 3, the fair value of the identifiable assets, liabilities and contingent liabilities was determined provisionally as at 10 October 2008. Given the complexity of the acquisition, additional information was obtained as part of the process of finalising the purchase price allocation during the 12 month period allowed under IFRS 3. This resulted in certain aspects of the purchase price allocation being revisited to reflect finalisation of the allocation process. The table above shows the fair values for the prior periods at the reported amounts. These have been restated in the relevant balance sheets.

30
14. Other intangible assets
All figures in £ millions Complete
technology Customer
relationships
Trade names
and brands
Total acquired
intangibles Developed
software
Third party
software Total Cost At 1 June 2009 73.3 66.4 32.5 172.2 76.1 27.6 275.9 Differences on exchange 5.8 7.3 3.7 16.8 5.5 2.0 24.3 De-recognised - - - - (17.5) - (17.5) Disposals - - - - - (0.8) (0.8) Additions - - - - 31.8 3.8 35.6 At 31 May 2010 79.1 73.7 36.2 189.0 95.9 32.6 317.5 Amortisation and impairment At 1 June 2009 (22.3) (5.8) (1.3) (29.4) (31.4) (13.0) (73.8) Differences on exchange (1.0) (1.2) (0.3) (2.5) (2.6) (1.0) (6.1) Charge for the year (7.8) (6.3) (1.7) (15.8) (11.9) (3.7) (31.4) De-recognised - - - - 17.5 - 17.5 Disposals - - - - - 0.7 0.7 At 31 May 2010 (31.1) (13.3) (3.3) (47.7) (28.4) (17.0) (93.1) Net book value At 31 May 2010 48.0 60.4 32.9 141.3 67.5 15.6 224.4
£17.5m developed software de-recognised in the year relates to software which has been assessed as having no further commercial value. This asset was fully written down.
All figures in £ millions Complete
technology Customer
relationships
Trade names
and brands
Total acquired
intangibles Developed
software
Third party
software Total Cost At 1 June 2008 20.1 4.0 0.3 24.4 49.1 16.0 89.5 Differences on exchange 5.3 3.9 1.7 10.9 6.3 1.8 19.0 On acquisition of subsidiary undertakings 49.9 58.5 30.5 138.9 - 0.6 139.5 De-recognised - - - - - (5.8) (5.8) Disposals (2.0) - - (2.0) (7.7) - (9.7) Additions - - - - 28.4 15.0 43.4 At 31 May 2009 73.3 66.4 32.5 172.2 76.1 27.6 275.9 Amortisation and impairment At 1 June 2008 (14.9) (1.3) (0.2) (16.4) (21.9) (8.6) (46.9) Differences on exchange (1.5) - 0.1 (1.4) (3.5) (1.4) (6.3) Charge for the year (6.1) (4.5) (1.2) (11.8) (5.9) (2.1) (19.8) Disposals 0.2 - - 0.2 7.6 - 7.8 Impairment - - - - (7.7) (0.9) (8.6) At 31 May 2009 (22.3) (5.8) (1.3) (29.4) (31.4) (13.0) (73.8) Net book value At 31 May 2009 51.0 60.6 31.2 142.8 44.7 14.6 202.1
Trade names and brands relate principally to the ‘Allscripts’ brand which is being amortised over 20 years from the date of acquisition on 10 October 2008. The fair value of the intangible assets acquired during last year was based on an independent valuation at the time of acquisition.

31
15. Property, plant and equipment
All figures in £ millions Freehold
properties Leasehold properties
Computer and other
equipment Total Cost At 1 June 2009 1.5 16.9 47.8 66.2 Differences on exchange - 1.1 4.9 6.0 Additions - 0.6 9.2 9.8 Disposals (1.5) (0.4) (6.0) (7.9) At 31 May 2010 - 18.2 55.9 74.1 Depreciation At 1 June 2009 (0.8) (5.0) (31.4) (37.2) Differences on exchange - (0.6) (3.4) (4.0) Charge for the period - (1.5) (7.8) (9.3) Disposals 0.8 0.4 6.0 7.2 At 31 May 2010 - (6.7) (36.6) (43.3) Net book value At 31 May 2010 - 11.5 19.3 30.8
All figures in £ millions Freehold
properties Leasehold properties
Computer and other
equipment Total Cost At 1 June 2008 1.7 11.3 36.9 49.9 Differences on exchange 0.1 1.5 5.4 7.0 On acquisition of subsidiary undertakings 4.3 0.5 6.4 11.2 Additions - 4.3 7.4 11.7 Disposals (4.6) (0.7) (8.3) (13.6) At 31 May 2009 1.5 16.9 47.8 66.2 Depreciation At 1 June 2008 (0.5) (3.5) (28.3) (32.3) Differences on exchange - (0.4) (3.9) (4.3) Charge for the year (0.4) (1.6) (6.7) (8.7) Disposals 0.1 0.5 7.5 8.1 At 31 May 2009 (0.8) (5.0) (31.4) (37.2) Net book value At 31 May 2009 0.7 11.9 16.4 29.0 Included in the above analysis is plant and equipment acquired under finance leases with a net book value of £1.6m (2009: £0.9m) after accumulated depreciation of £3.8m (2009: £2.7m). The net book value of leasehold properties comprises long leasehold £nil (2009: £nil) and short leasehold £11.5m (2009: £11.9m).

32
16. Trade and other receivables All figures in £ millions 2010 2009 Trade receivables 177.5 142.9 Less: provision for impairment of receivables (8.0) (7.4) 169.5 135.5 Other receivables 20.4 13.1 Prepayments 27.6 20.2 Accrued income 68.2 53.3 Current trade and other receivables 285.7 222.1 Other receivables 0.8 2.3 Prepayments 0.6 1.7 Accrued income 0.2 1.8 Non-current trade and other receivables 1.6 5.8 Total trade and other receivables 287.3 227.9
The quality of trade receivables can be assessed by reference to the historical default rate of £5.0m (2009: £6.2m) for the preceding 365 days at 3.7% of the opening net trade receivables balance (2009: 7.5%). The carrying value of trade receivables that would otherwise be past due or impaired but whose terms were renegotiated were £nil (2009: £0.2m). The amount of provision against receivables as at 31 May 2010 was £8.0m (2009: £7.4m). The individually impaired receivables relate to receivables over 365 days, customers in financial difficulty, customer acceptance issues and cancelled contracts. As at 31 May 2010, trade receivables of £91.0m (2009: £67.6m) were past due but not impaired. In the table below, these comprise the debtors over 30 days, which relate to a number of independent customers for whom there is no recent history of default. The ageing analysis of net trade receivables is as follows: All figures in £ millions 2010 2009 0-30 days 78.5 67.9 30-60 days 26.7 22.4 60-90 days 16.2 14.8 90-120 days 16.2 7.1 Over 120 days 31.9 23.3 169.5 135.5
The maximum exposure to credit risk at the reporting date is the fair value of each class of receivable mentioned above. The Group does not hold any collateral as security.
Movements in the Group’s provision for impairment of trade receivables are as follows: All figures in £ millions 2010 2009 At 1 June (7.4) (8.3) Provision for impairment of receivables (7.2) (6.8) Receivables written off during the year as uncollectible 5.0 7.9 Unused amounts reversed 2.2 3.4 Foreign exchange and other (0.6) (3.6) At 31 May (8.0) (7.4)
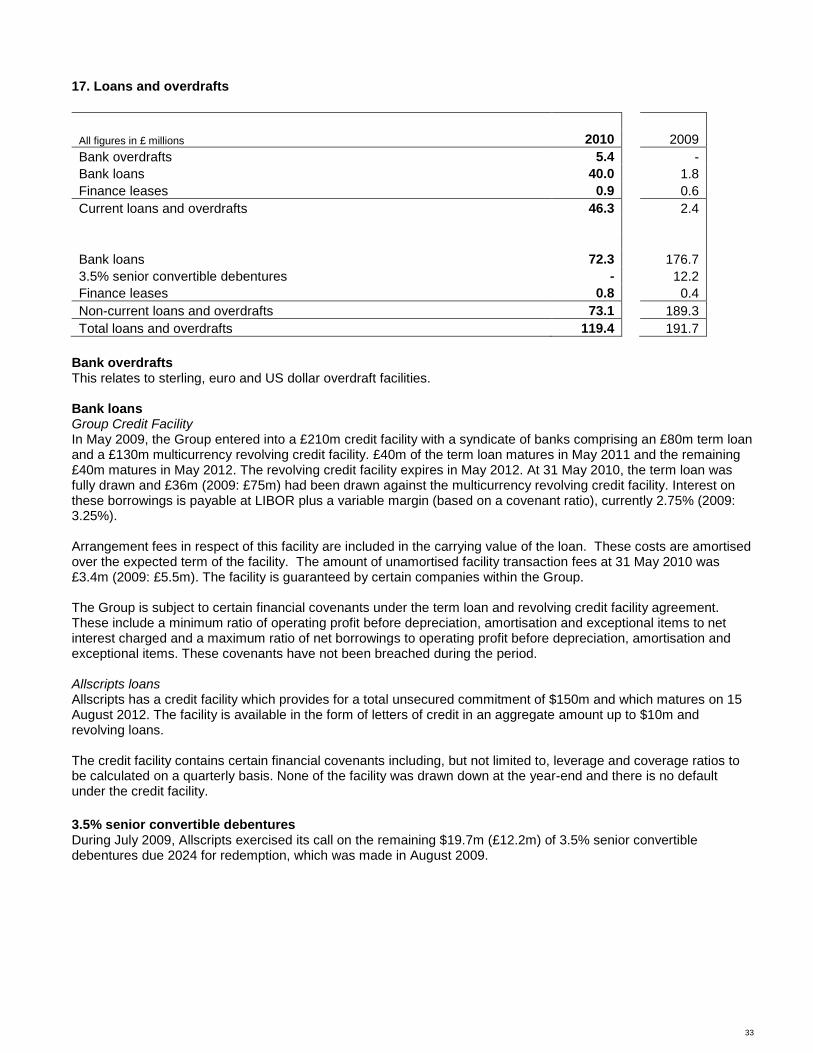
33
17. Loans and overdrafts All figures in £ millions 2010 2009 Bank overdrafts 5.4 - Bank loans 40.0 1.8 Finance leases 0.9 0.6 Current loans and overdrafts 46.3 2.4 Bank loans 72.3 176.7 3.5% senior convertible debentures - 12.2 Finance leases 0.8 0.4 Non-current loans and overdrafts 73.1 189.3 Total loans and overdrafts 119.4 191.7
Bank overdrafts This relates to sterling, euro and US dollar overdraft facilities. Bank loans Group Credit Facility In May 2009, the Group entered into a £210m credit facility with a syndicate of banks comprising an £80m term loan and a £130m multicurrency revolving credit facility. £40m of the term loan matures in May 2011 and the remaining £40m matures in May 2012. The revolving credit facility expires in May 2012. At 31 May 2010, the term loan was fully drawn and £36m (2009: £75m) had been drawn against the multicurrency revolving credit facility. Interest on these borrowings is payable at LIBOR plus a variable margin (based on a covenant ratio), currently 2.75% (2009: 3.25%). Arrangement fees in respect of this facility are included in the carrying value of the loan. These costs are amortised over the expected term of the facility. The amount of unamortised facility transaction fees at 31 May 2010 was £3.4m (2009: £5.5m). The facility is guaranteed by certain companies within the Group. The Group is subject to certain financial covenants under the term loan and revolving credit facility agreement. These include a minimum ratio of operating profit before depreciation, amortisation and exceptional items to net interest charged and a maximum ratio of net borrowings to operating profit before depreciation, amortisation and exceptional items. These covenants have not been breached during the period. Allscripts loans Allscripts has a credit facility which provides for a total unsecured commitment of $150m and which matures on 15 August 2012. The facility is available in the form of letters of credit in an aggregate amount up to $10m and revolving loans. The credit facility contains certain financial covenants including, but not limited to, leverage and coverage ratios to be calculated on a quarterly basis. None of the facility was drawn down at the year-end and there is no default under the credit facility. 3.5% senior convertible debentures During July 2009, Allscripts exercised its call on the remaining $19.7m (£12.2m) of 3.5% senior convertible debentures due 2024 for redemption, which was made in August 2009.
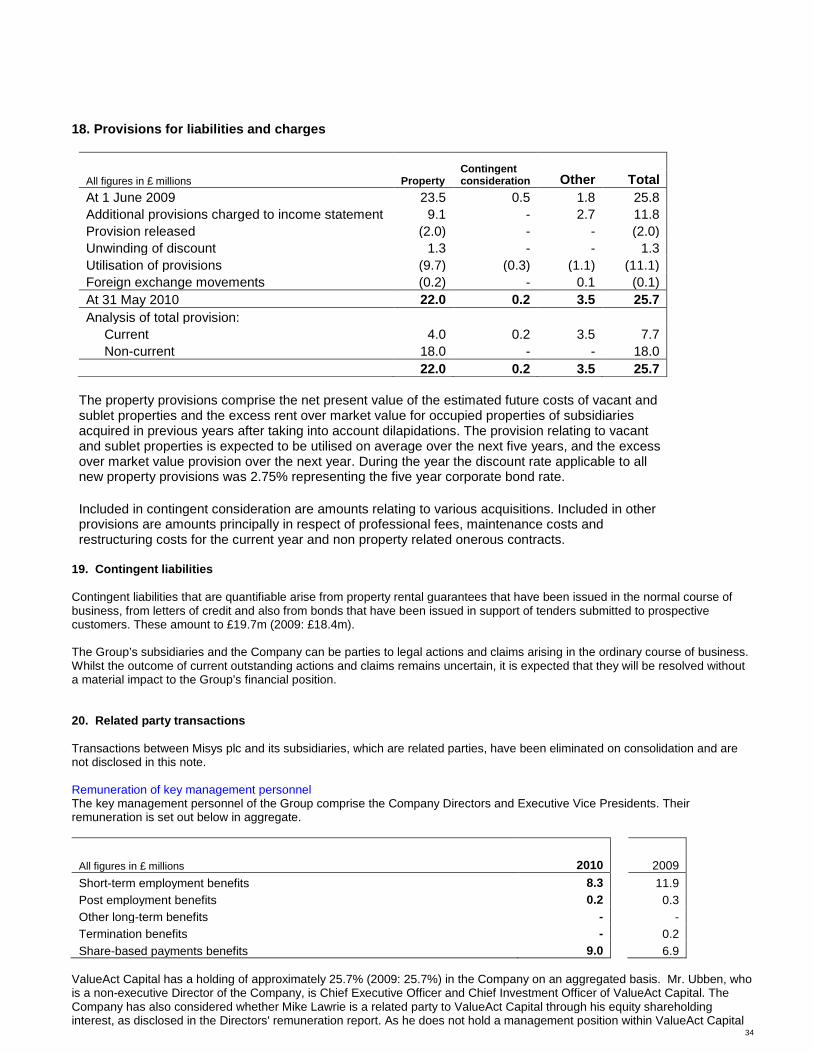
34
18. Provisions for liabilities and charges Contingent
consideration
All figures in £ millions Property Other Total At 1 June 2009 23.5 0.5 1.8 25.8 Additional provisions charged to income statement 9.1 - 2.7 11.8 Provision released (2.0) - - (2.0) Unwinding of discount 1.3 - - 1.3 Utilisation of provisions (9.7) (0.3) (1.1) (11.1) Foreign exchange movements (0.2) - 0.1 (0.1) At 31 May 2010 22.0 0.2 3.5 25.7 Analysis of total provision: Current 4.0 0.2 3.5 7.7 Non-current 18.0 - - 18.0 22.0 0.2 3.5 25.7
The property provisions comprise the net present value of the estimated future costs of vacant and sublet properties and the excess rent over market value for occupied properties of subsidiaries acquired in previous years after taking into account dilapidations. The provision relating to vacant and sublet properties is expected to be utilised on average over the next five years, and the excess over market value provision over the next year. During the year the discount rate applicable to all new property provisions was 2.75% representing the five year corporate bond rate. Included in contingent consideration are amounts relating to various acquisitions. Included in other provisions are amounts principally in respect of professional fees, maintenance costs and restructuring costs for the current year and non property related onerous contracts.
19. Contingent liabilities Contingent liabilities that are quantifiable arise from property rental guarantees that have been issued in the normal course of business, from letters of credit and also from bonds that have been issued in support of tenders submitted to prospective customers. These amount to £19.7m (2009: £18.4m). The Group’s subsidiaries and the Company can be parties to legal actions and claims arising in the ordinary course of business. Whilst the outcome of current outstanding actions and claims remains uncertain, it is expected that they will be resolved without a material impact to the Group’s financial position. 20. Related party transactions Transactions between Misys plc and its subsidiaries, which are related parties, have been eliminated on consolidation and are not disclosed in this note. Remuneration of key management personnel The key management personnel of the Group comprise the Company Directors and Executive Vice Presidents. Their remuneration is set out below in aggregate. All figures in £ millions 2010 2009 Short-term employment benefits 8.3 11.9 Post employment benefits 0.2 0.3 Other long-term benefits - - Termination benefits - 0.2 Share-based payments benefits 9.0 6.9
ValueAct Capital has a holding of approximately 25.7% (2009: 25.7%) in the Company on an aggregated basis. Mr. Ubben, who is a non-executive Director of the Company, is Chief Executive Officer and Chief Investment Officer of ValueAct Capital. The Company has also considered whether Mike Lawrie is a related party to ValueAct Capital through his equity shareholding interest, as disclosed in the Directors' remuneration report. As he does not hold a management position within ValueAct Capital

35
nor does his equity shareholding give the right to significant influence over ValueAct Capital, it has been concluded that he is not a related party to ValueAct Capital as defined by IAS 24 ’Related party disclosure’. There were no related party transactions with ValueAct during the period. Last year, a placing and underwriting agreement was entered into on 17 March 2008 between the Company, ValueAct Capital Master Fund, L.P. acting through its general partner, VA Partners I, LLC (‘ValueAct’) and JP Morgan Cazenove Limited. On 10 October 2008 in connection with the Allscripts merger, ValueAct Capital Master Fund L.P. (acting through “ValueAct”) acquired all of the Placing Shares pursuant to the underwriting commitment provided by it at the time of the Placing. Upon acquisition of the Placing Shares, the percentage of the issued voting share capital of the Company controlled by affiliates within ValueAct’s group increased to approximately 25.7 per cent. On 29 September 2008, the Company entered into a US $190.0m bridge facility with a subsidiary of ValueAct Capital. This facility was refinanced with the term loan and multicurrency revolving credit facility in May 2009 (see note 17). 21. Events after the reporting period Proposed disposal of Allscripts On 9 June 2010, Misys announced its intention to dispose of its majority stake in Allscripts and to return substantially all of the proceeds to Misys shareholders subject to shareholders approval. Misys will realise value through the placing of shares and the buyback of shares by Allscripts. On 26 July 2010, Misys agreed that it would reduce the minimum size of the placing from 36 million to 25 million shares following positive votes by Allscripts and Eclipsys shareholders on the merger. Illustrative proceeds at this minimum placing size and at the minimum placing price of US $16.50 per share would be US $1,077m. The maximum retained holding in this instance would be 25.1 million shares. The proceeds from the sale of Allscripts shares, after transaction fees and debt pay-down, will be returned to Misys shareholders through a proposed tender offer for these shares. The transaction is currently forecast to complete before December 2010. The proposed disposal is conditional amongst other things upon the approval of a simple majority of shareholders and a minimum price for the placing of shares of US $16.50. A circular will be published shortly to provide details of the background and reasons for the proposed disposal. IFRS 5 requires that a disposal transaction which has not completed but which is highly probable at the balance sheet date should be disclosed as an asset held for sale and presented as a discontinued operation if the business sold is significant. At 31 May, the overall transaction was in the process of negotiations between the parties and the Directors do not believe that the sale met the conditions to be classified as held for sale under IFRS 5 at that date. Misys has thus treated Allscripts as a continuing operation and has taken all transaction costs incurred to 31 May 2010 to the exceptional item line of the consolidated income statement. Purchase of $ put option As a consequence of the proposed disposal of Allscripts (described above), a foreign exchange option contract was taken out in June 2010 to protect the proceeds from fluctuations in the US$:£ exchange rate. The foreign exchange option gives Misys the ability to sell US dollars for sterling at an option price of approximately £1 to US $1.50. UK corporation tax rate change A number of changes to the UK corporation tax system were announced in the June 2010 Budget Statement. The Finance (No 2) Act 2010 was enacted in July 2010 and reduces the main rate of corporation tax from 28% to 27% from 1 April 2011. Further reductions are proposed to be enacted separately each year with the aim of reducing the rate by 1% per annum to 24% by 1 April 2014. The changes have not been substantively enacted at the balance sheet date and, therefore, are not included in the financial statements. We estimate that the reduction in the corporation tax rate from 28% to 27% will not have a material impact on the Group’s results.

36
Principal risks and uncertainties Effectively managing our risks is a key element in meeting our business objectives and our customers’ expectations. Taking risks is an inherent part of entrepreneurial activity and the assessment of risk is part of our culture. Specifically, we give careful consideration to the key risks in our business and how we can best mitigate those risks to meet our business objectives. Misys’ risk management programme therefore seeks to support the successful running of the business by identifying and managing risks to an acceptable level and delivering assurance. The risk management process An overview of our risk management process is shown opposite. This process, which is continuous and systematic, involves identifying, prioritising and allocating ownership for risks and developing and implementing appropriate mitigation plans to address those risks. Providing assurance as to the implementation of risk mitigation plans and the ongoing monitoring of risks also represent critical elements of the Group’s risk management programme. More detail of our processes for risk identification and management is shown in the Directors and governance reports. We classify our risks into four areas: - strategic - operational - financial - compliance We provide a summary of the risks that we currently see as important to our business on the following pages. Risk description
Potential impact
How we mitigate
Strategic risks Business environment and market risks As an international company, we operate across the globe and difficult or unexpected economic conditions in the markets we serve may affect the financial position of our customers and their willingness to commit expenditure. Other developments in the markets we serve may also impact the Group. The financial services sector is currently subject to regulatory review which could increase taxes on, or curtail, certain of the activities of our customers leading them to reduce expenditure. Our Healthcare business is benefiting from the Healthcare Stimulus programme in the US, however, we must ensure that we comply with the requirements for ‘meaningful use’ as defined by the US Department of Health and Human Services across our healthcare product portfolio. In addition, we operate in highly competitive markets that are characterised by changing technology, industry standards and customer needs and by commercial pressures from customers.
Failure to adapt to economic and market conditions and/or to compete effectively in the markets in which we operate could lead to a deterioration in our financial results.
The Group has a large installed base and over 50% of Group revenues are recurring. We are geographically diversified with customers in 120 countries which reduces our reliance on the success of any one economy or location. We continue to monitor current and emerging market developments carefully. Allscripts currently has a number of programmes in place to ensure compliance with the ‘meaningful use’ requirements.
Allscripts-Misys proposed disposal risks We have recently announced our intention to dispose of the majority of our stake in Allscripts-Misys and realise substantial value for our shareholders. Under this proposal we will exit our controlling interest in Allscripts-Misys and will retain a non-controlling stake in the newly merged Allscripts-Eclipsys entity.
Failure to complete the proposed disposal may negatively impact on the credibility of the Group’s strategy and our relationship with shareholders and other key stakeholders.
There is continual and ongoing dialogue with investors and other key stakeholders including employees and customers to explain the proposed transaction and the associated strategy. Initial market reaction to the proposed disposal is considered to be positive. We also have a number of leading advisors assisting us with the proposed transaction and their support has included advice regarding

37
The proposed disposal will not proceed if specified conditions are not satisfied including shareholder and regulatory approval.
regulatory approvals, market risks and other relevant conditions. In addition, to achieve certainty on the tax treatment of the Allscripts divestiture we are seeking an IRS Private Letter Ruling.
Business strategy risks The continued roll out of our next generation BankFusion technology, the development of new solutions and the enhancement of existing solutions for our Banking and Treasury & Capital Markets businesses are critical to the leadership phase of our turnaround programme. The changes required to implement the final stage of this programme will, however, take time and will require high quality leadership.
Our market share, revenues and profits may be adversely impacted if we are not able to deploy our BankFusion technology and other new solutions and enhancements quickly enough or if they fail to receive market acceptance and achieve lower customer adoption levels than expected.
Group strategy is reviewed and agreed with the Board and there is ongoing monitoring of the strategy to ensure that it remains relevant. Good progress is being made on the development and market acceptance of new solutions in each of the Misys businesses.
Partnerships, collaborations, strategic alliances, acquisitions and disposals The Group will continue to seek opportunities to complement its existing product and services portfolio or streamline its operations. We could fail to identify appropriate partners and technology suppliers or fail to agree suitable commercial terms. Acquiring or disposing of companies also gives rise to execution risks in identifying, valuing and integrating or separating businesses.
Failure to effectively conduct and manage these activities may mean that the related business objectives are not met which could adversely impact shareholder value and the Group’s reputation.
These activities are reviewed as part of the Group’s strategic planning process. A Deal Committee comprised of senior management with significant M&A experience has been established to review acquisition and disposal opportunities which are also subject to review by the Group’s Board of Directors. The Group has well defined M&A and partner processes which cover important areas such as effective due diligence and integration of M&A targets and management of relations with partners. We also have comprehensive contracts with our suppliers and contract management processes in place to ensure compliance with contractual terms and conditions.
Operational risks
People risks The Group relies heavily on recruiting and retaining talented employees with a range of skills to meet its objectives. The market for technology, and related management and leadership skills, is very competitive and it remains a challenge to attract, retain and develop employees. In addition, as the Group expands its operations in emerging markets the supply of people with the required skills in specific geographic regions may be limited.
Failure to attract staff with the required technical, management and leadership skills, to retain key employees and/or to provide for effective succession planning for critical positions may materially and adversely affect the Group’s financial results.
We continuously assess our human resource requirements and talent management is a key priority for the Group. External benchmarking of compensation and benefits packages is conducted across markets to ensure that Misys remains competitive. Employees are provided with training and development and are appraised regularly. Regular succession planning is also in place across the Group.
Product development risks Product development requires effective management to identify customer and market requirements which will drive business growth. New and enhanced products and services need to be released within agreed timeframes, product lifecycles require effective management and product quality must be assured to provide for continuing customer satisfaction.
If product development risks are not effectively managed we may miss out on market opportunities and/or lose our reputation with customers. This could adversely impact the Group’s financial position.
We have regular dialogue with our customers through Customer Advisory Boards and Product / Regional User Groups and we monitor industry trends to identify emerging customer needs. Product development considerations form a key element of our strategic planning process and are carefully planned with roadmaps developed for our products. Well defined governance processes have been established to

38
The effectiveness of product development processes is particularly important to our Banking business where we are developing a new suite of products based on our innovative BankFusion technology.
provide effective, portfolio based evaluations of product development opportunities and the product development function follows best practice. There is also significant and ongoing Executive and Senior Management focus on the development of the BankFusion technology and related products.
Contract implementation and service level risks The process of introducing business critical systems, which may have long implementation schedules, can be disruptive to our customers in the short term and the implementation may be subject to project management by the client or by others, introducing an element of risk. This risk continues after the implementation period under our service level agreements with customers.
Unsuccessful customer implementation projects could result in claims from customers, harm to our reputation and a loss of future revenues.
Our customers increasingly undertake modular project approaches to their IT environments which can reduce the risk. Our implementation and services teams consist of highly skilled and experienced staff and our projects are subject to ongoing risk management as a part of our project management methodology. In addition, we partner only with reputable and well regarded third parties in relation to implementation services and we provide relevant training and support for these third parties on our products and services.
Business continuity risks As an international company we have operations around the globe and these are vulnerable to damage or interruption from floods, fires, power loss, telecommunications failures, flu pandemic, political or social instability and similar events. This risk is potentially increased due to the fact that many of our key sites are in emerging markets with, for example, key research and development and customer support operations being based in India and the Philippines.
A lack of effective business continuity procedures could adversely impact our operations and thereby reduce our revenue and profits. In addition, future revenues and profits could be harmed if customers believe that our operations are not appropriately managed from a business continuity standpoint.
Business continuity, disaster recovery and pandemic response plans are in place and these are overseen by a dedicated Business continuity team. These Plans are reviewed annually and an Incident Management Team has been appointed at each key location and each team is aware of their responsibilities with respect to Business continuity. Employees are kept informed of business continuity initiatives via a dedicated section of the Company’s intranet site. Further work will be conducted next year to increase the speed and testing of our self-recovery capability and reduce our dependency upon third-party providers.
IT risks We rely on systems and networks in order to run our business operations. We must therefore maintain a sound IT infrastructure to support our business and to protect our information assets. A particular area of risk relates to attacks by IT viruses and we also need to ensure that our online trading activity is adequately protected.
Failure to manage our IT infrastructure effectively could result in critical business information becoming damaged or unavailable. A malicious attack on our systems or network could damage the data we hold. Misappropriation of customer data held may result in claims for damages and impair our reputation.
We continue to review our systems, our security processes and our network infrastructure to ensure that any risks are kept to an acceptable level. Third-party provided systems and IT networks are subject to appropriate security, availability and performance capability reviews prior to use. As part of our continuous improvement initiatives in this area, further work will be conducted next year with the introduction of enhanced Information Security policies.
Intellectual property risks We own substantial intellectual property rights (IPR), which may be infringed through the sale of illegal or unauthorised copies of our software. There is also a risk that we could inadvertently infringe the IPR of a third party as there may be patents relevant to our product line that are unknown to us.
Infringement of our IPR could cause loss of revenue, adversely affect business operations and/or damage our trademarks. Claims against us for infringement of others IPR may mean we need to re-design the product, take a licence on the infringing IP or even cease to sell that
We generally protect our proprietary application software products and services by licensing rights to use the application (rather than selling or licensing the computer source code) and by copyright law. We have also established a cross functional IP Council and a number of related policies and procedures are in place to manage and control IP risks including those related to the secure
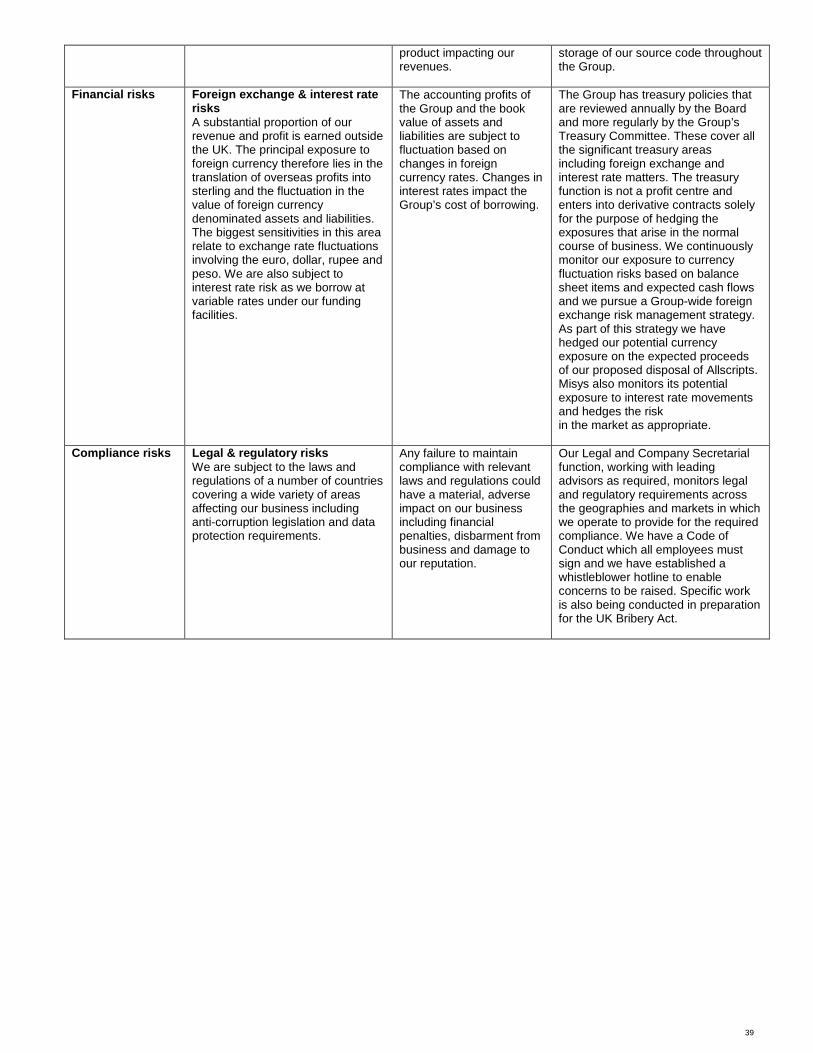
39
product impacting our revenues.
storage of our source code throughout the Group.
Financial risks
Foreign exchange & interest rate risks A substantial proportion of our revenue and profit is earned outside the UK. The principal exposure to foreign currency therefore lies in the translation of overseas profits into sterling and the fluctuation in the value of foreign currency denominated assets and liabilities. The biggest sensitivities in this area relate to exchange rate fluctuations involving the euro, dollar, rupee and peso. We are also subject to interest rate risk as we borrow at variable rates under our funding facilities.
The accounting profits of the Group and the book value of assets and liabilities are subject to fluctuation based on changes in foreign currency rates. Changes in interest rates impact the Group’s cost of borrowing.
The Group has treasury policies that are reviewed annually by the Board and more regularly by the Group’s Treasury Committee. These cover all the significant treasury areas including foreign exchange and interest rate matters. The treasury function is not a profit centre and enters into derivative contracts solely for the purpose of hedging the exposures that arise in the normal course of business. We continuously monitor our exposure to currency fluctuation risks based on balance sheet items and expected cash flows and we pursue a Group-wide foreign exchange risk management strategy. As part of this strategy we have hedged our potential currency exposure on the expected proceeds of our proposed disposal of Allscripts. Misys also monitors its potential exposure to interest rate movements and hedges the risk in the market as appropriate.
Compliance risks
Legal & regulatory risks We are subject to the laws and regulations of a number of countries covering a wide variety of areas affecting our business including anti-corruption legislation and data protection requirements.
Any failure to maintain compliance with relevant laws and regulations could have a material, adverse impact on our business including financial penalties, disbarment from business and damage to our reputation.
Our Legal and Company Secretarial function, working with leading advisors as required, monitors legal and regulatory requirements across the geographies and markets in which we operate to provide for the required compliance. We have a Code of Conduct which all employees must sign and we have established a whistleblower hotline to enable concerns to be raised. Specific work is also being conducted in preparation for the UK Bribery Act.