Embed Size (px)
DESCRIPTION
ECFA 與兩岸經貿關係展望. 林祖嘉 行政院大陸委員會副主任委員 [email protected] 2012.12.23. 1. 報告大綱. 壹。前言 貮。兩岸貿易與投資關係 參。兩岸經貿與台灣經濟發展 肆。東亞經濟整合現況 伍。 ECFA 對台灣經濟的影響 陸。後 ECFA 時代兩岸經貿關係與挑戰 柒。結語. 一。台灣經濟發展的特色 : 高經濟成長、低失業率、低通膨 小型開放經濟體系:對外貿易依存度 140.16% (2010) 從勞力密集型到技術密集型 東亞經濟整合的壓力 (2000 以來 ). 壹。前言. 3. - PowerPoint PPT Presentation
Citation preview
2
報告大綱
壹。前言貮。兩岸貿易與投資關係參。兩岸經貿與台灣經濟發展肆。東亞經濟整合現況伍。 ECFA對台灣經濟的影響陸。後 ECFA時代兩岸經貿關係與挑戰
柒。結語

33
壹。前言
一。台灣經濟發展的特色 :
• 高經濟成長、低失業率、低通膨 • 小型開放經濟體系:對外貿易依存度 140.16% (2010)• 從勞力密集型到技術密集型• 東亞經濟整合的壓力 (2000以來 )
4
二。兩岸經貿關係的重要性 :
• 改革開放 (1979)
• 台灣最大的貿易夥伴
• 台灣最大的順差來源
• 台灣最主要的對外投資地區
5
三。幾個主要的問題 :• 為什麼兩岸貿易會成長這麼快?為什麼會有這麼多的台商赴大陸
投資?
• 兩岸經貿對於台灣經濟成長、就業及產業結構有何影響?
• 東亞經濟整合現況如何?為什麼 ECFA如此重要?
• 後 ECFA時代,兩岸經貿關係展望與挑戰為何?
6
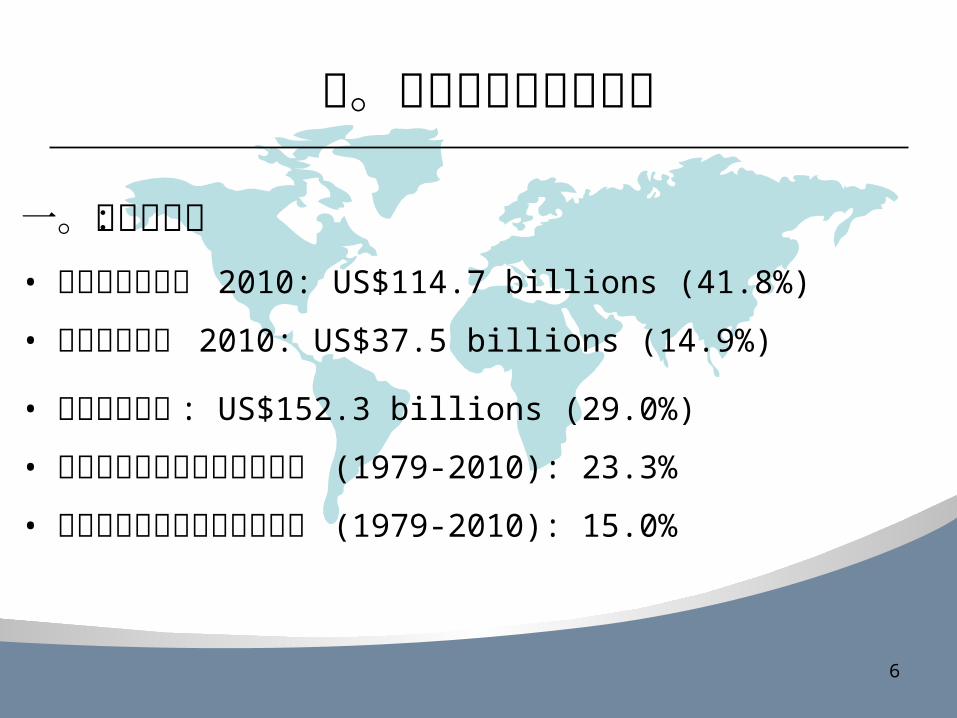
貮。兩岸貿易與投資關係
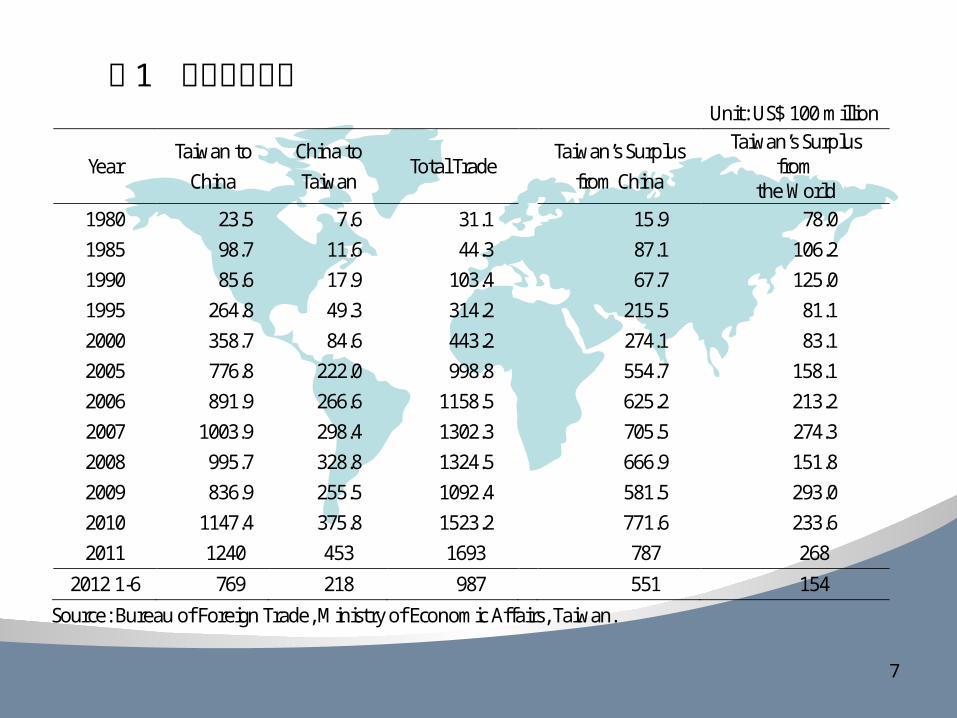
一。兩岸貿易:• 台灣對大陸出口 2010: US$114.7 billions (41.8%)
• 台灣自大進口 2010: US$37.5 billions (14.9%)
• 兩岸貿易總額 : US$152.3 billions (29.0%)
• 台灣對大陸出口平均年成長率 (1979-2010): 23.3%
• 台灣自大陸進口平均年成長率 (1979-2010): 15.0%
7
Unit: US$ 100 million
Year Taiwan to
China China to Taiwan
Total Trade Taiwan’s Surplus
from China
Taiwan’s Surplus from
the World 1980 23.5 7.6 31.1 15.9 78.0 1985 98.7 11.6 44.3 87.1 106.2 1990 85.6 17.9 103.4 67.7 125.0 1995 264.8 49.3 314.2 215.5 81.1 2000 358.7 84.6 443.2 274.1 83.1 2005 776.8 222.0 998.8 554.7 158.1 2006 891.9 266.6 1158.5 625.2 213.2 2007 1003.9 298.4 1302.3 705.5 274.3 2008 995.7 328.8 1324.5 666.9 151.8 2009 836.9 255.5 1092.4 581.5 293.0 2010 1147.4 375.8 1523.2 771.6 233.6 2011 1240 453 1693 787 268
2012 1-6 769 218 987 551 154
Source: Bureau of Foreign Trade, Ministry of Economic Affairs, Taiwan.
表 1 兩岸貿易統計

8
Unit: %
Taiwan China Export
Share Import Share
Total Trade Share
Export Share
Import Share
Total Trade Share
1980 1.19 0.39 0.79 0.42 1.17 0.82 1985 3.21 0.58 2.17 0.42 2.34 1.58 1990 6.54 1.40 4.23 1.23 8.24 4.47 1995 23.7 4.8 14.6 3.31 14.71 8.02 2000 24.0 6.0 15.2 3.37 11.11 6.59 2005 39.1 12.2 26.2 2.91 8.53 5.37 2006 39.8 13.2 27.2 2.75 8.00 5.00 2007 40.7 13.6 28.0 2.30 7.77 4.71 2008 39.1 13.7 26.8 2.20 6.53 4.11 2009 41.1 14.7 28.9 2.04 6.17 3.92 2010 41.8 14.9 29.0 2.19 6.09 3.97
2011 40.24 16.09 28.71 2.16 5.88 3.65
2012 1-6 39.15 15.77 27.94 2.04 5.63 3.54 Source: See Table 2.
表 2 兩岸貿易依存度
9
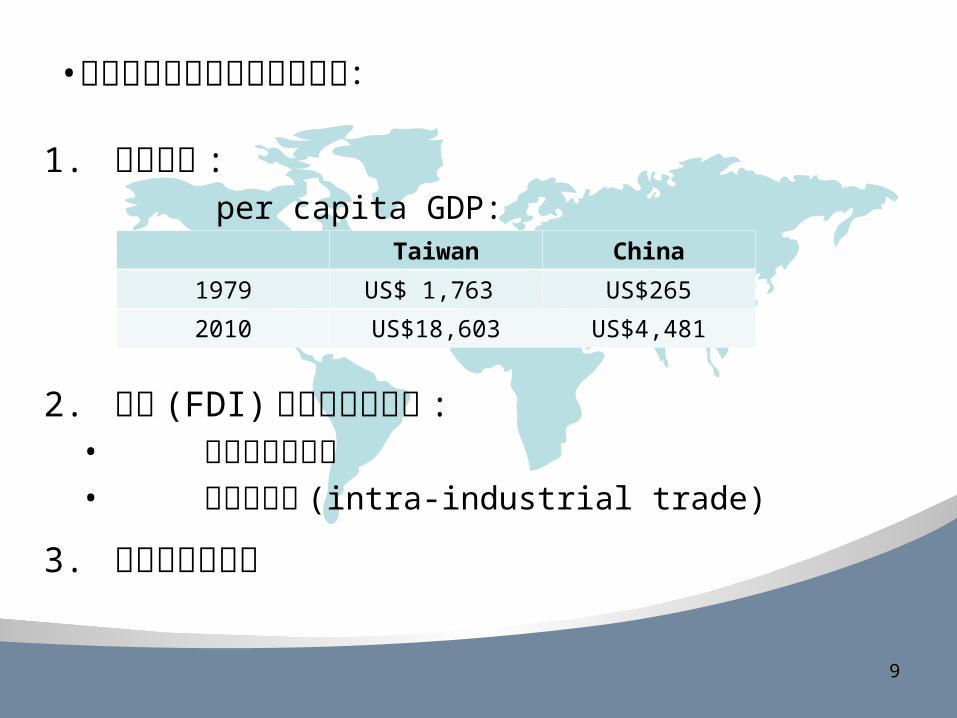
•兩岸貿易快速成長的主要理由:
1. 比較利益 : per capita GDP:
2. 投資 (FDI)的貿易擴張效果 :• 原物科與中間材• 產業內貿易 (intra-industrial trade)
3. 文化與習俗相同
Taiwan China
1979 US$ 1,763 US$265
2010 US$18,603 US$4,481
10
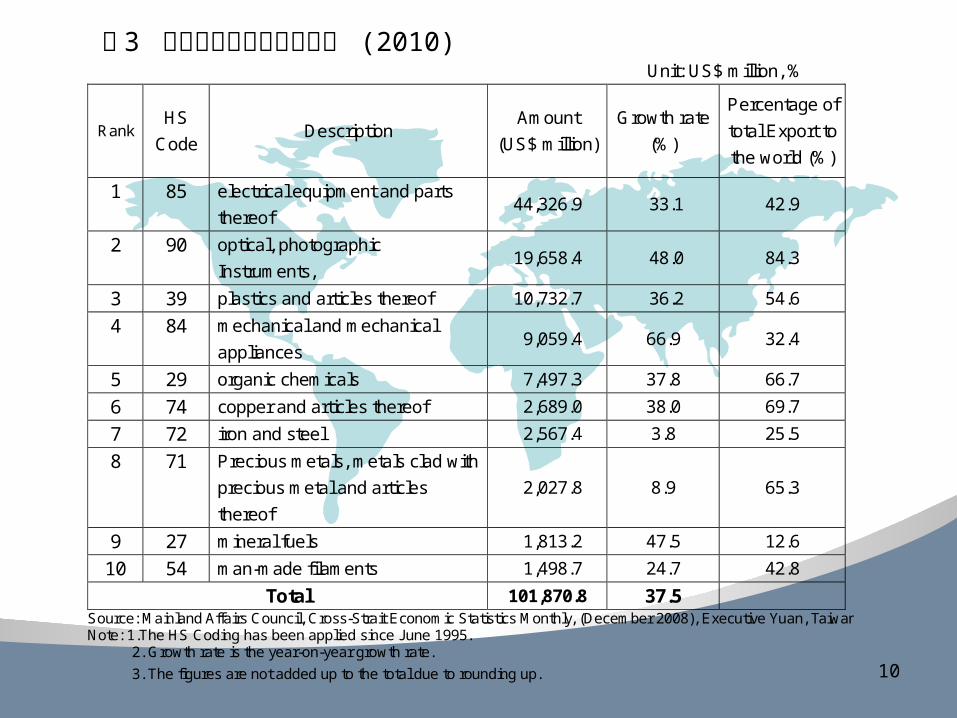
Unit: US$ million, %
Rank HS
Code Description
Amount
(US$ million)
Growth rate
(%)
Percentage of
total Export to
the world (%)
1 85 electrical equipment and parts
thereof 44,326.9 33.1 42.9
2 90 optical, photographic
Instruments, 19,658.4 48.0 84.3
3 39 plastics and articles thereof 10,732.7 36.2 54.6
4 84 mechanical and mechanical
appliances 9,059.4 66.9 32.4
5 29 organic chemicals 7,497.3 37.8 66.7
6 74 copper and articles thereof 2,689.0 38.0 69.7
7 72 iron and steel 2,567.4 3.8 25.5
8 71 Precious metals, metals clad with
precious metal and articles
thereof
2,027.8 8.9 65.3
9 27 mineral fuels 1,813.2 47.5 12.6
10 54 man-made filaments 1,498.7 24.7 42.8
Total 101,870.8 37.5 Source: Mainland Affairs Council, Cross-Strait Economic Statistics Monthly, (December 2008), Executive Yuan, Taiwan. Note: 1.The HS Coding has been applied since June 1995. 2. Growth rate is the year-on-year growth rate.
3. The figures are not added up to the total due to rounding up.
表 3 台灣對大陸主要出口產品 (2010)

11
表 4 台灣自大陸主要進口產品 (2010) Unit: US$ million, %
Rank HS
Code Description
Amount
(US$
million)
Growth rate
(%)
Percentage of
total Export to
the world (%)
1 85 electrical equipment and parts
thereof 14,862.8 54.0 27.1
2 84 mechanical and mechanical
appliances 5,161.6 30.9 16.3
3 90 optical, photographic,
instruments 2,041.3 48.6 19.6
4 71 Precious metals, metals clad
with precious metal and articles
thereof
1,605.0 33.1 34.1
5 38 Miscellaneous chemical
products 1,486.1 41.5 19.8
6 72 iron and steel 1,366.8 206.5 12.2
7 29 organic chemicals 1,238.3 57.0 11.6
8 39 plastics and articles thereof 806.5 47.0 11.0
9 27 mineral fuels, mineral oils and
products of their distillation 774.6 39.1 1.5
10 87 Vehicles, parts and accessories
thereof 681.8 32.1 14.4
Total 30,024.8 49.5 Source: See Table 4. Note: 1. Growth rate is the year-on-year growth rate. 2. The figures are not added up to the total due to rounding up.
12
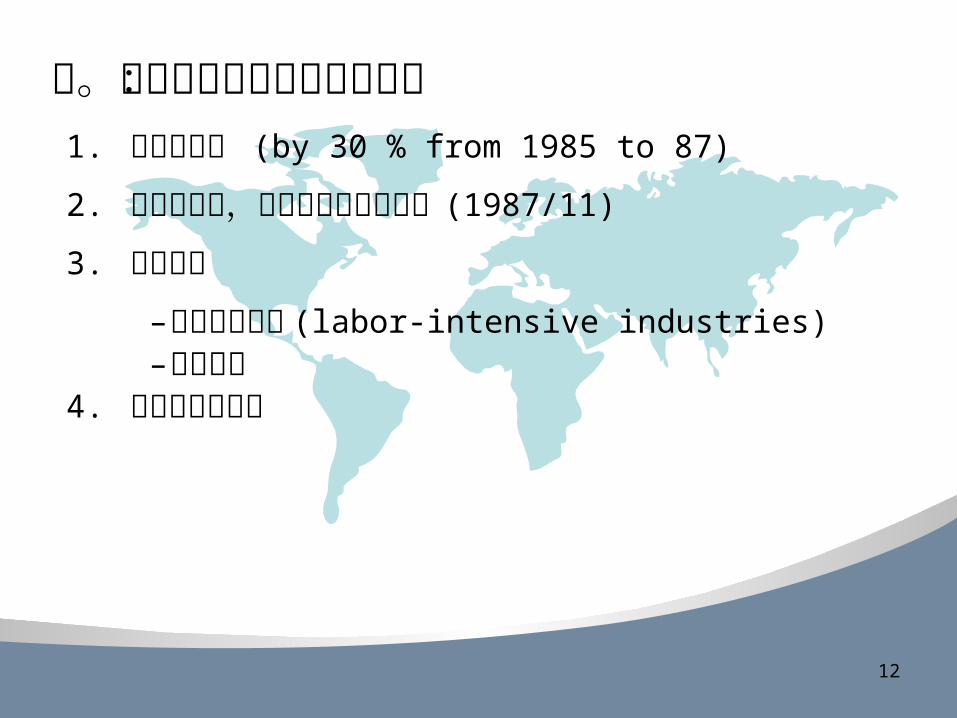
二。台商對大陸投資主要理由:1. 新台幣升值 (by 30 % from 1985 to 87)
2. 取消戒嚴法,開放人民赴大陸探親 (1987/11)
3. 比較利益
–勞力密集產業 (labor-intensive industries)–中小企業
4. 文化與習俗相同
13
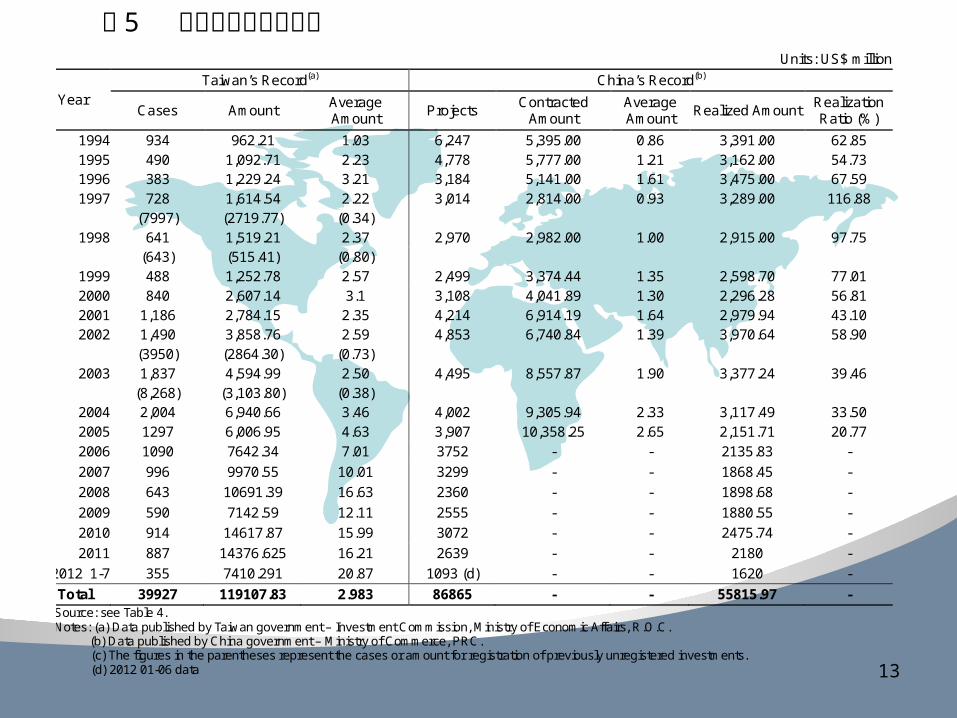
表 5 台商赴大陸投資狀況Units: US$ million
Year Taiwan’s Record(a) China’s Record(b)
Cases Amount Average Amount
Projects Contracted
Amount Average Amount
Realized Amount Realization Ratio (%)
1994 934 962.21 1.03 6,247 5,395.00 0.86 3,391.00 62.85 1995 490 1,092.71 2.23 4,778 5,777.00 1.21 3,162.00 54.73 1996 383 1,229.24 3.21 3,184 5,141.00 1.61 3,475.00 67.59 1997 728 1,614.54 2.22 3,014 2,814.00 0.93 3,289.00 116.88
(7997) (2719.77) (0.34) 1998 641 1,519.21 2.37 2,970 2,982.00 1.00 2,915.00 97.75
(643) (515.41) (0.80) 1999 488 1,252.78 2.57 2,499 3,374.44 1.35 2,598.70 77.01 2000 840 2,607.14 3.1 3,108 4,041.89 1.30 2,296.28 56.81 2001 1,186 2,784.15 2.35 4,214 6,914.19 1.64 2,979.94 43.10 2002 1,490 3,858.76 2.59 4,853 6,740.84 1.39 3,970.64 58.90
(3950) (2864.30) (0.73) 2003 1,837 4,594.99 2.50 4,495 8,557.87 1.90 3,377.24 39.46
(8,268) (3,103.80) (0.38) 2004 2,004 6,940.66 3.46 4,002 9,305.94 2.33 3,117.49 33.50 2005 1297 6,006.95 4.63 3,907 10,358.25 2.65 2,151.71 20.77
2006 1090 7642.34 7.01 3752 - - 2135.83 -
2007 996 9970.55 10.01 3299 - - 1868.45 -
2008 643 10691.39 16.63 2360 - - 1898.68 -
2009 590 7142.59 12.11 2555 - - 1880.55 -
2010 914 14617.87 15.99 3072 - - 2475.74 -
2011 887 14376.625 16.21 2639 - - 2180 -
2012 1-7 355 7410.291 20.87 1093 (d) - - 1620 -
Total 39927 119107.83 2.983 86865 - - 55815.97 - Source: see Table 4. Notes: (a) Data published by Taiwan government – Investment Commission, Ministry of Economic Affairs, R.O.C.
(b) Data published by China government – Ministry of Commerce, PRC. (c) The figures in the parentheses represent the cases or amount for registration of previously unregistered investments. (d) 2012 01-06 data
14
參。兩岸經貿與台灣經濟發展
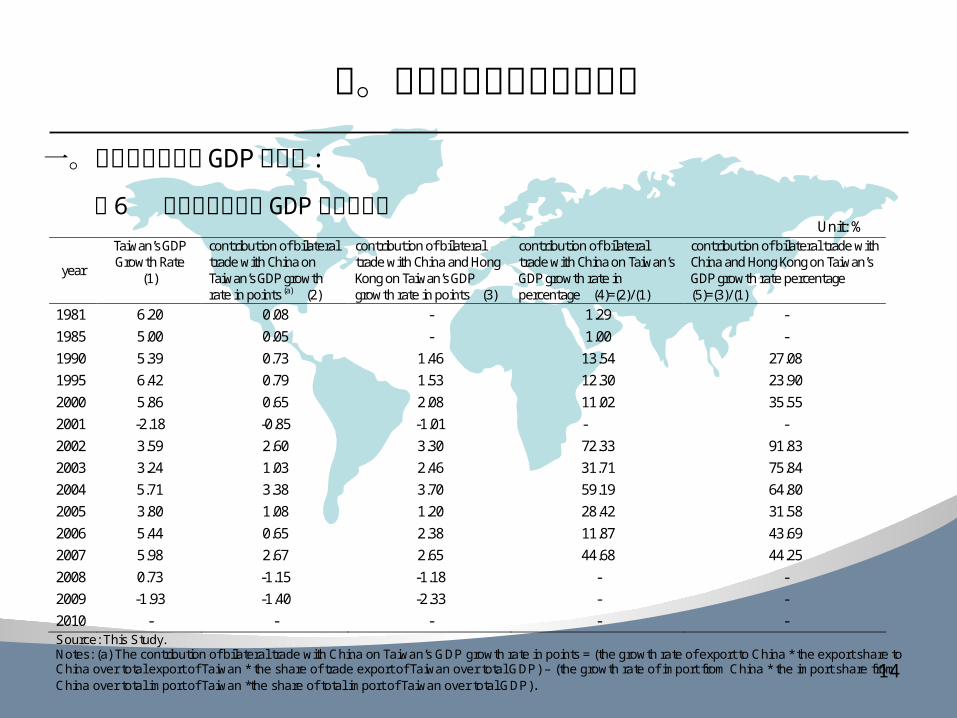
一。兩岸經貿對台灣 GDP的影響 :
表 6 兩岸經貿對台灣 GDP成長的貢獻 Unit: %
year
Taiwan’s GDP Growth Rate
(1)
contribution of bilateral trade with China on Taiwan’s GDP growth rate in points (a) (2)
contribution of bilateral trade with China and Hong Kong on Taiwan’s GDP growth rate in points (3)
contribution of bilateral trade with China on Taiwan’s GDP growth rate in percentage (4)=(2)/(1)
contribution of bilateral trade with China and Hong Kong on Taiwan’s GDP growth rate percentage (5)=(3)/(1)
1981 6.20 0.08 - 1.29 - 1985 5.00 0.05 - 1.00 - 1990 5.39 0.73 1.46 13.54 27.08 1995 6.42 0.79 1.53 12.30 23.90 2000 5.86 0.65 2.08 11.02 35.55 2001 -2.18 -0.85 -1.01 - - 2002 3.59 2.60 3.30 72.33 91.83 2003 3.24 1.03 2.46 31.71 75.84 2004 5.71 3.38 3.70 59.19 64.80 2005 3.80 1.08 1.20 28.42 31.58 2006 5.44 0.65 2.38 11.87 43.69 2007 5.98 2.67 2.65 44.68 44.25 2008 0.73 -1.15 -1.18 - - 2009 -1.93 -1.40 -2.33 - - 2010 - - - - - Source: This Study. Notes: (a) The contribution of bilateral trade with China on Taiwan’s GDP growth rate in points = (the growth rate of export to China * the export share to China over total export of Taiwan * the share of trade export of Taiwan over total GDP) – (the growth rate of import from China * the import share from China over total import of Taiwan *the share of total import of Taiwan over total GDP).

15
二。兩岸經貿對於台灣失業率的影響
Year GDP Per Capita (US$)
GDP Growth Rate (%)
Average GDP Growth Rate
(10 year,%)
Unemployment
Rate (%)
CPI Growth Rate (%)
Average CPI Growth
Rate(%)
Gini coefficient
Foreign reserve
(billion US$) 1970 393 11.4 9.4 1.70 3.60 3.4 0.294 ― 1975 978 4.9 ― 2.40 5.20 ― 0.312 ― 1980 2,385 7.8 9.8 1.23 19.00 10.4 0.277 ― 1985 3,290 13.5 ― 2.91 -0.20 ― 0.290 225.6 1990 8,124 3.8 7.7 1.67 4.10 3.1 0.312 724.4 1995 12,918 6.38 ― 1.79 3.70 ― 0.317 903.1 2000 14,704 5.80 6.2 2.99 1.30 2.6 0.326 1067.4 2001 13,147 -1.65 ― 4.57 -0.01 ― 0.350 1222.1 2002 13,404 5.26 ― 5.17 -0.20 ― 0.345 1616.6 2003 13,773 3.67 ― 4.99 -0.28 ― 0.343 2066.3 2004 15,021 6.19 ― 4.44 1.62 ― 0.338 2417.4 2005 16,051 4.70 ― 4.13 2.30 ― 0.340 2532.9 2006 16,491 5.44 ― 3.91 0.60 ― 0.339 2661.5 2007 17,154 5.98 ― 3.91 1.80 ― 0.340 2703.0 2008 17,154 0.73 ― 4.14 3.53 ― 0.341 2917.1 2009 16,353 -1.93 ― 5.85 -0.87 ― 0.345 3482.0 2010 18,603 10.82 3.85 5.21 0.96 0.94 0.342 3820.0 2011 20,122 4.03 ― 4.39 1.42 ― ― 3879.68 Source: Directorate-General of Budget, Accounting and Statistics, Statistic Abstract of National Income, Executive Yuan, Taiwan.
表 7 台灣主要經濟指標

16
三。兩岸經貿對於台灣三級產業結構的影響
Source: Directorate-General of Budget, Accounting and Statistics,
Statistic Abstract of National Income, 2009, Executive Yuan, Taiwan.
圖 1 台灣的三級產業結構

17
Source: Council for Economic Planning and Development, Taiwan statistical Data Book, 2009, Executive Yuan, Taiwan.
圖 2 台灣的出口結構:依要勞力密集度區分
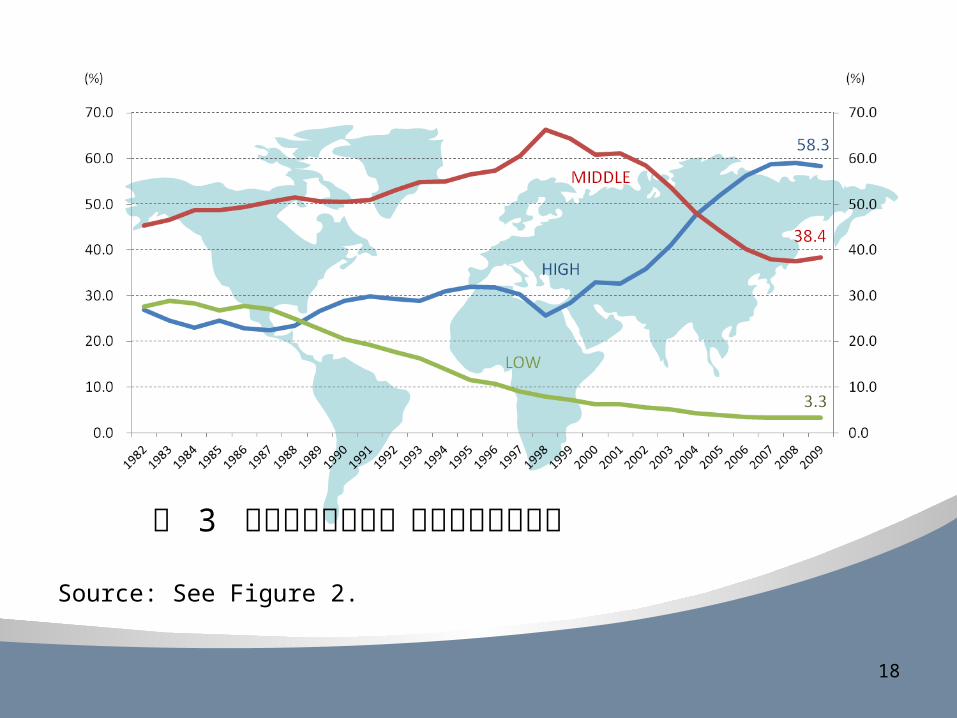
18
Source: See Figure 2.
圖 3 台灣的出口結構:依資本密集度區分
19
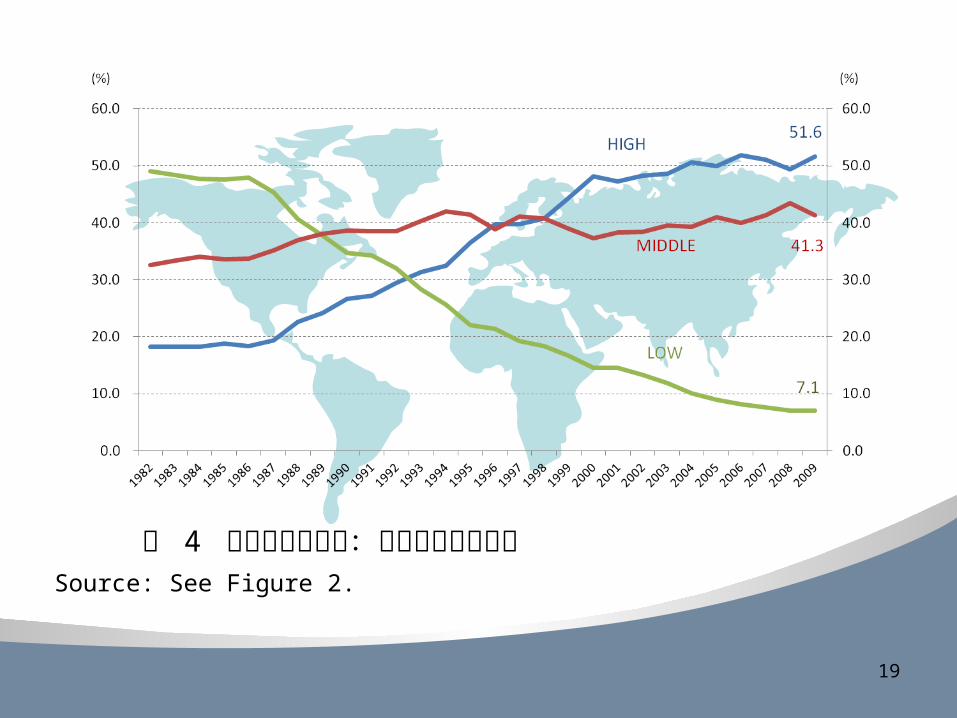
Source: See Figure 2.
圖 4 台灣的出口結構:依技術密集度區分
20
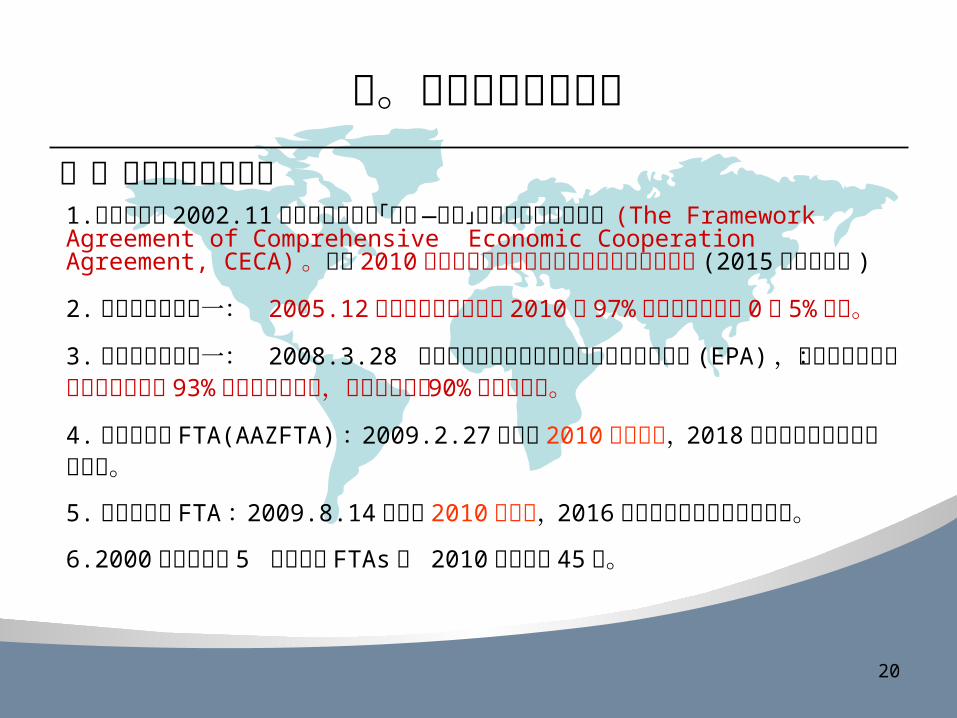
肆。東亞經濟整合現況
一。東亞經濟整合現況1.中國與東協 2002.11於金邊正式簽署「東協—中國」綜合性經濟合作協定(The Framework Agreement of Comprehensive Economic Cooperation Agreement, CECA)。預計 2010年東協初始六國與中國全面完成貿易自由化 (2015年東協十國 )
2.韓國與東協十加一: 2005.12簽署架構性協議,到 2010年 97%的商品關稅降到 0 或 5%以下。
3.日本與東協十加一: 2008.3.28 日本內閣會議通過與東協簽署經濟合作協定 (EPA),預計秋天生效:十年內日本取消 93%東協產品的關稅,東協取消日本 90%產品的關稅。
4.東協與澳紐 FTA(AAZFTA): 2009.2.27簽署, 2010正式生效, 2018年完成自由貿易區全面降稅。
5.東協與印度 FTA: 2009.8.14簽署, 2010年生效, 2016年完成自由貿易區全面降稅。
6.2000年東亞共有 5 個生效的 FTAs, 2010年增加到 45個。
21
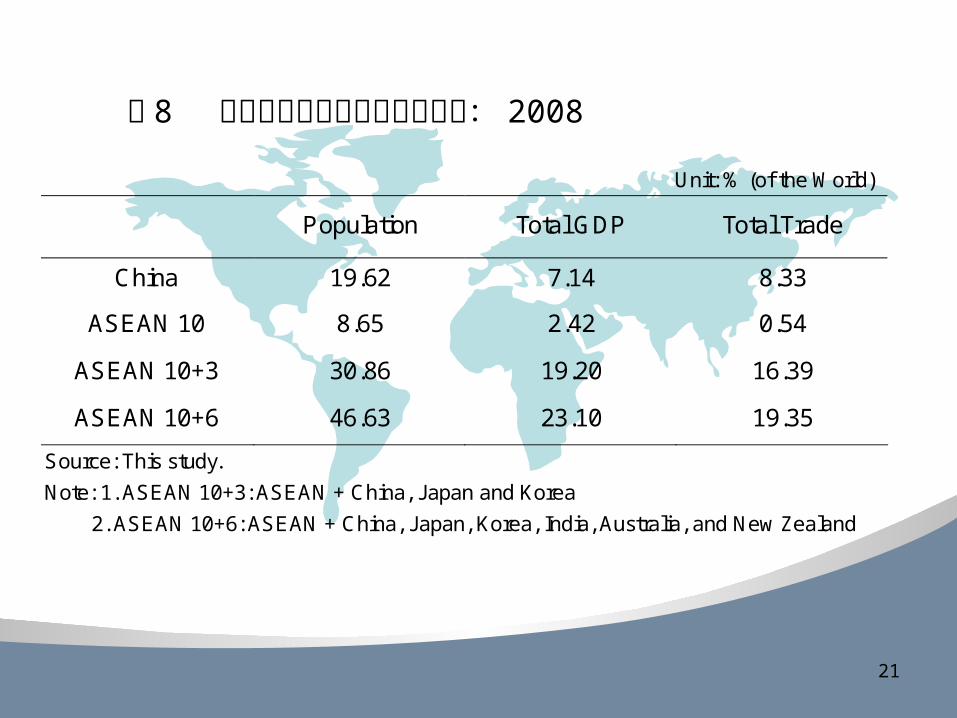
Unit: % (of the World)
Population Total GDP Total Trade
China 19.62 7.14 8.33
ASEAN 10 8.65 2.42 0.54
ASEAN 10+3 30.86 19.20 16.39
ASEAN 10+6 46.63 23.10 19.35
Source: This study.
Note: 1. ASEAN 10+3: ASEAN + China, Japan and Korea
2. ASEAN 10+6: ASEAN + China, Japan, Korea, India, Australia, and New Zealand
表 8 東亞經濟整合的主要經濟指標: 2008

22
Unit: US$ billion, %
Taiwan’s Export to Taiwan’s Total Trade With
Taiwan’s Total FDI to
China 99.5 (39.0%) 132.5 (26.7%) 10.7(70.5%)
ASEAN 10 38.3 (15.0%) 64.0 (12.9%) 1.4 (9.1%)
ASEAN 10+3 164.2 (64.2%) 282.4 (56.9%) 12.4(81.5%)
ASEAN 10+6 170.7 (66.8%) 299.5 (60.4%) 12.4(81.7%)
Source: This study.
Note: 1. ASEAN 10+3: ASEAN + China, Japan and Korea
2. ASEAN 10+6: ASEAN + China, Japan, Korea, India, Australia and New Zealand
表 9 台灣與東協十加六的經貿關係: 2008
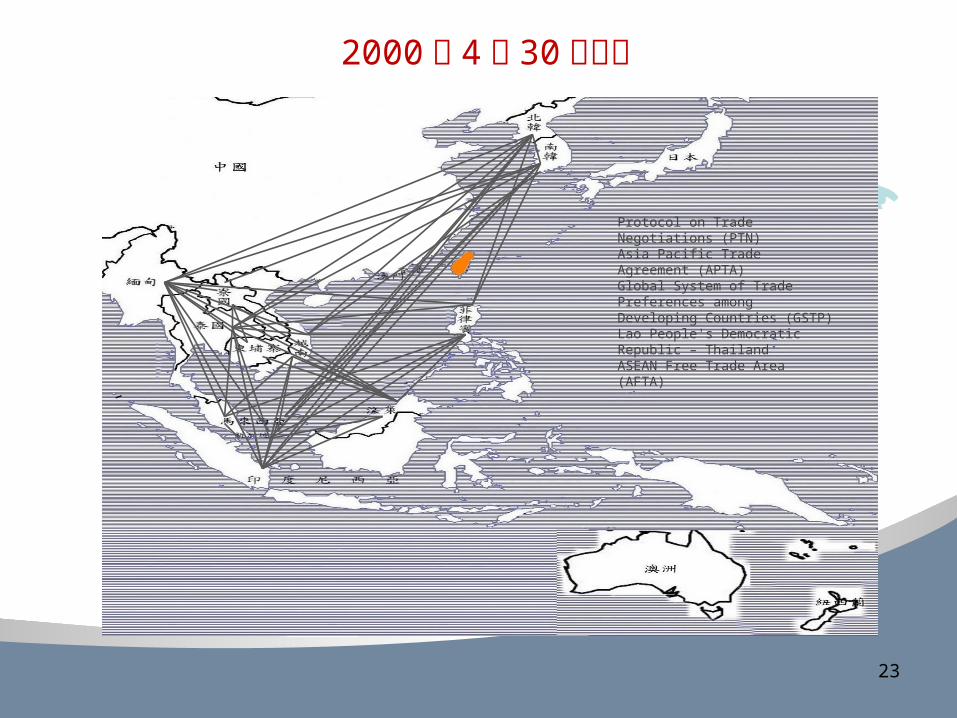
2000 年 4 月 30日之前
Protocol on Trade Negotiations (PTN)Asia Pacific Trade Agreement (APTA)Global System of Trade Preferences among Developing Countries (GSTP)Lao People's Democratic Republic – ThailandASEAN Free Trade Area (AFTA)
23
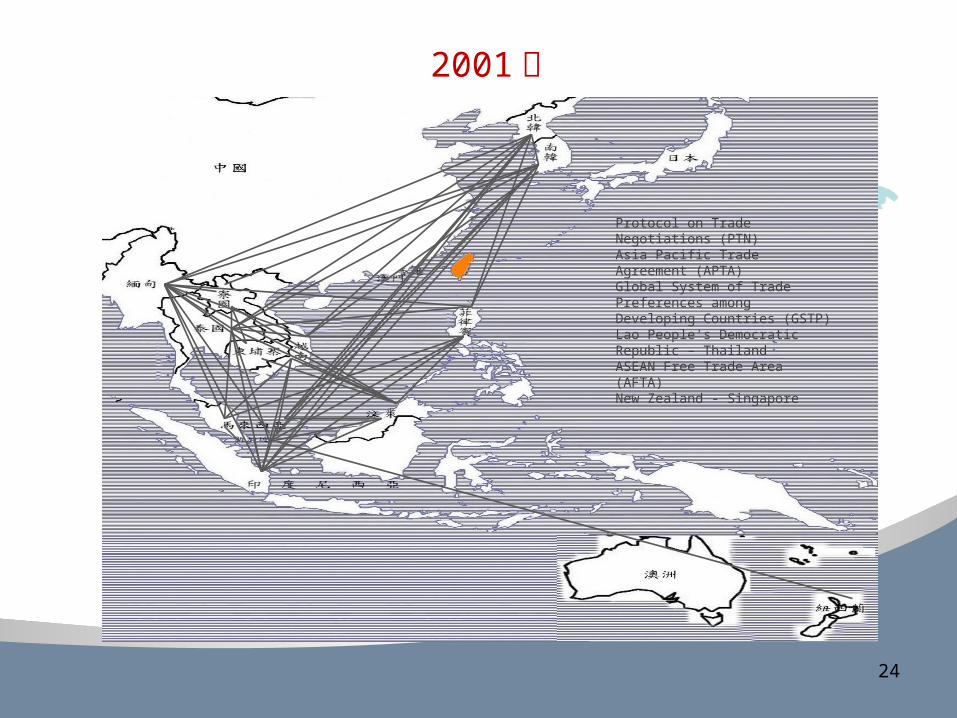
Protocol on Trade Negotiations (PTN)Asia Pacific Trade Agreement (APTA)Global System of Trade Preferences among Developing Countries (GSTP)Lao People's Democratic Republic – ThailandASEAN Free Trade Area (AFTA)New Zealand - Singapore
2001年
24
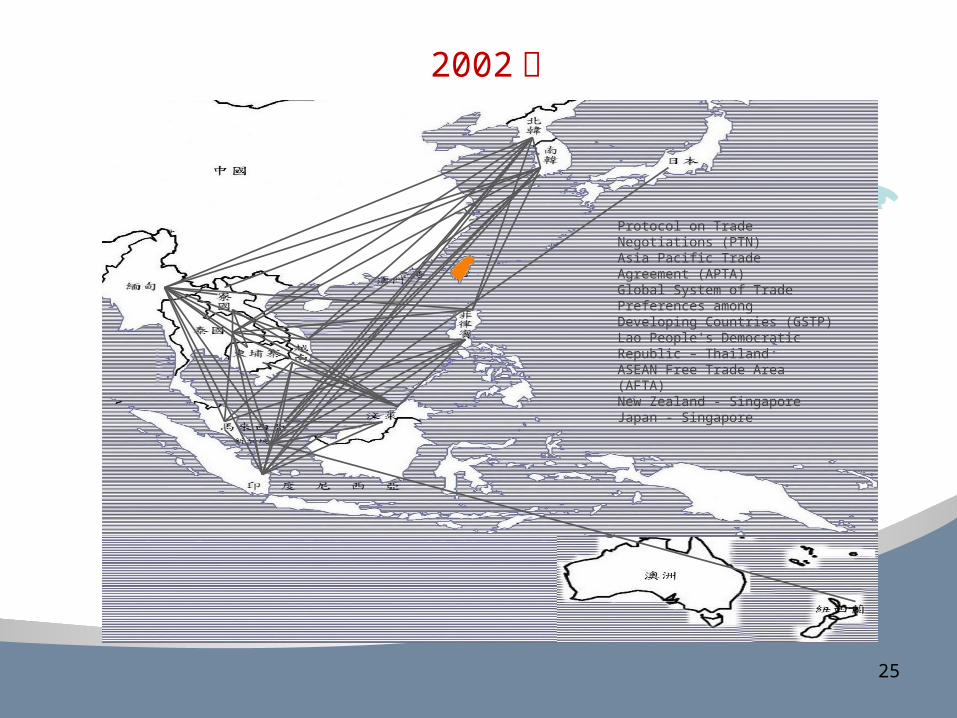
2002年
Protocol on Trade Negotiations (PTN)Asia Pacific Trade Agreement (APTA)Global System of Trade Preferences among Developing Countries (GSTP)Lao People's Democratic Republic – ThailandASEAN Free Trade Area (AFTA)New Zealand - SingaporeJapan - Singapore
25
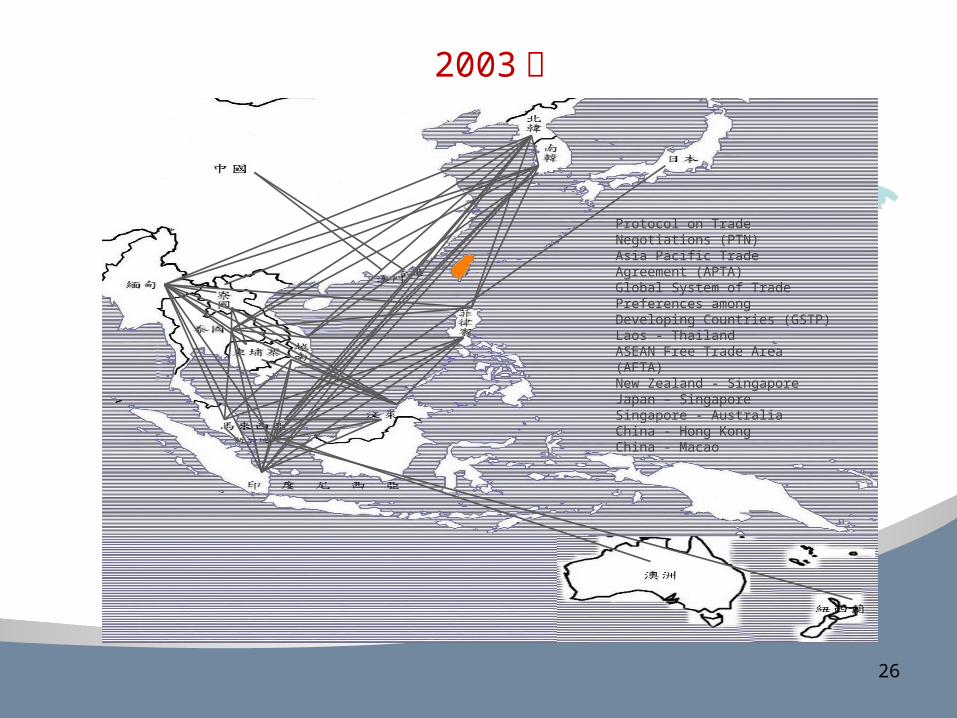
2003年
Protocol on Trade Negotiations (PTN)Asia Pacific Trade Agreement (APTA)Global System of Trade Preferences among Developing Countries (GSTP)Laos - ThailandASEAN Free Trade Area (AFTA)New Zealand - SingaporeJapan – SingaporeSingapore - AustraliaChina - Hong KongChina - Macao
26
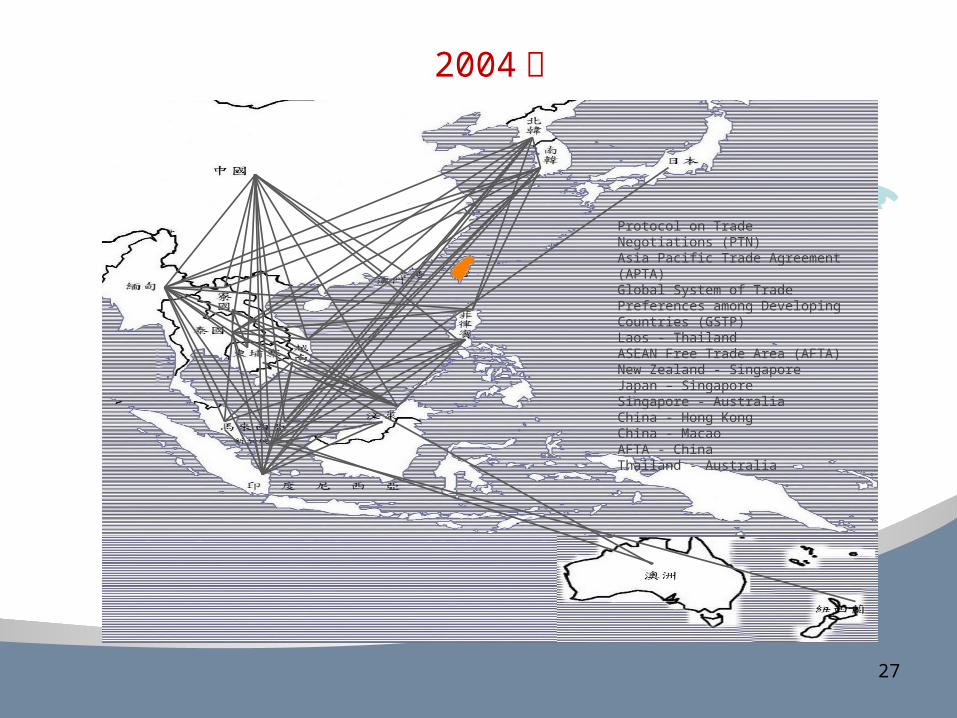
2004年
Protocol on Trade Negotiations (PTN)Asia Pacific Trade Agreement (APTA)Global System of Trade Preferences among Developing Countries (GSTP)Laos - ThailandASEAN Free Trade Area (AFTA)New Zealand - SingaporeJapan – SingaporeSingapore - AustraliaChina - Hong KongChina - MacaoAFTA - ChinaThailand - Australia
27
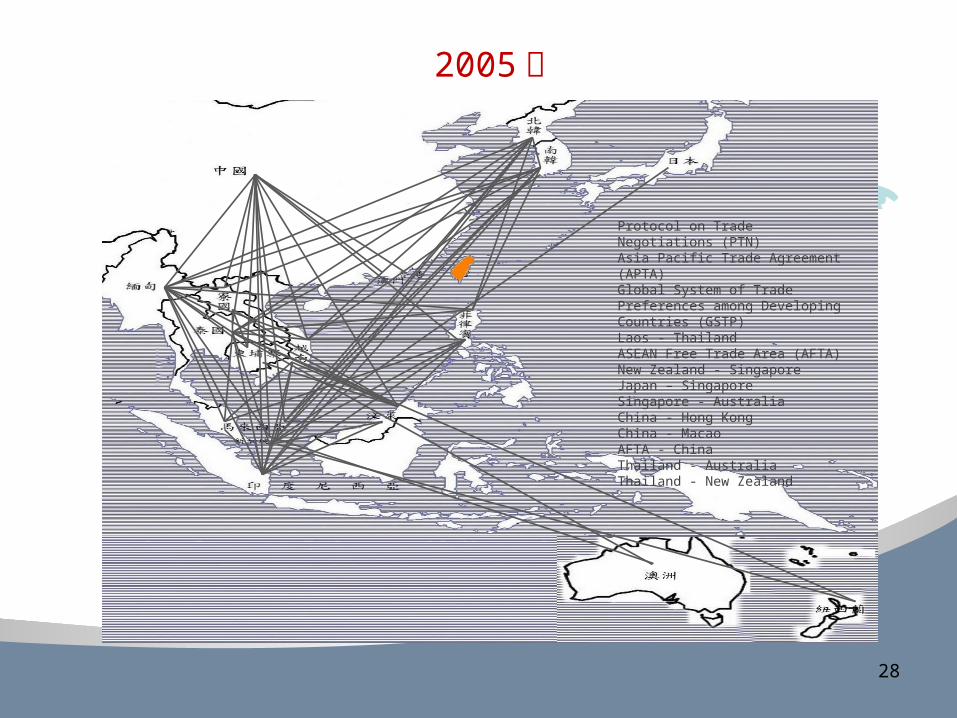
2005年
Protocol on Trade Negotiations (PTN)Asia Pacific Trade Agreement (APTA)Global System of Trade Preferences among Developing Countries (GSTP)Laos - ThailandASEAN Free Trade Area (AFTA)New Zealand - SingaporeJapan – SingaporeSingapore - AustraliaChina - Hong KongChina - MacaoAFTA - ChinaThailand - AustraliaThailand - New Zealand
28

2006年
Protocol on Trade Negotiations (PTN)Asia Pacific Trade Agreement (APTA)Global System of Trade Preferences among Developing Countries (GSTP)Laos - ThailandASEAN Free Trade Area (AFTA)New Zealand - SingaporeJapan – SingaporeSingapore - AustraliaChina - Hong KongChina - MacaoAFTA - ChinaThailand - AustraliaThailand - New ZealandKorea - SingaporeJapan - Malaysia
29
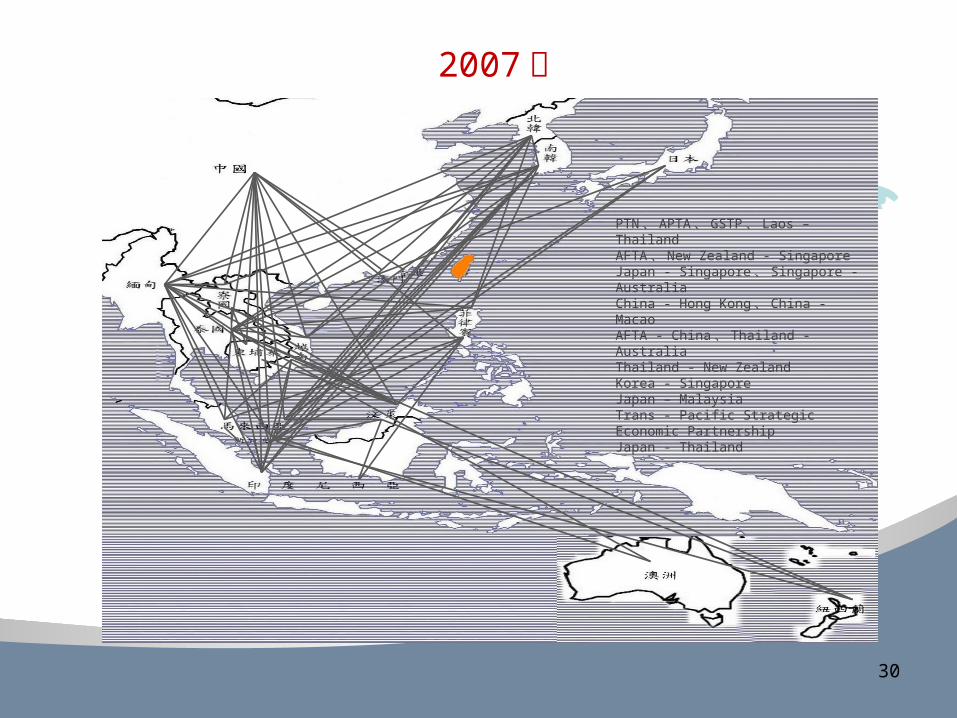
2007年
PTN 、 APTA 、 GSTP 、 Laos – ThailandAFTA 、 New Zealand - SingaporeJapan - Singapore 、 Singapore - AustraliaChina - Hong Kong 、 China - MacaoAFTA - China 、 Thailand - AustraliaThailand - New ZealandKorea - SingaporeJapan – MalaysiaTrans - Pacific Strategic Economic PartnershipJapan - Thailand
30

2008年
PTN 、 APTA 、 GSTP 、 Laos – ThailandAFTA 、 New Zealand - SingaporeJapan - Singapore 、 Singapore - AustraliaChina - Hong Kong 、 China - MacaoAFTA - China 、 Thailand - AustraliaThailand - New ZealandKorea - Singapore 、 Japan – MalaysiaTrans-Pacific Strategic Economic Partnership 、 Japan - ThailandAFTA - China(S)Japan - IndonesiaBrunei Darussalam - JapanJapan - Philippines
31
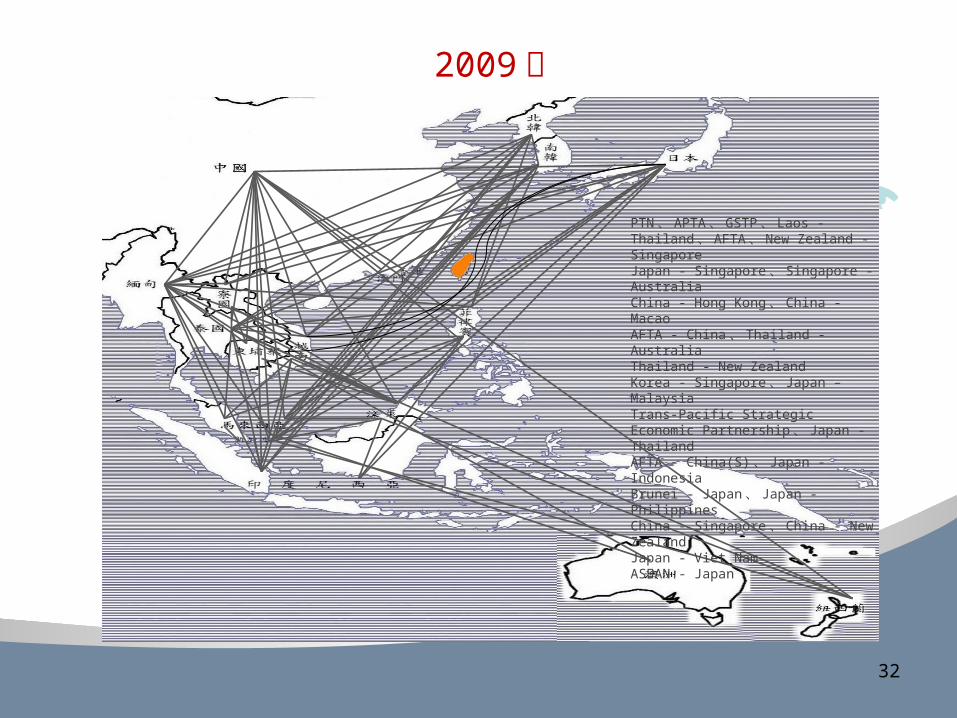
2009年
PTN 、 APTA 、 GSTP 、 Laos - Thailand 、AFTA 、 New Zealand - SingaporeJapan - Singapore 、 Singapore - AustraliaChina - Hong Kong 、 China - MacaoAFTA - China 、 Thailand - AustraliaThailand - New ZealandKorea - Singapore 、 Japan – MalaysiaTrans-Pacific Strategic Economic Partnership 、 Japan - ThailandAFTA - China(S) 、 Japan - IndonesiaBrunei - Japan 、 Japan - PhilippinesChina - Singapore 、 China - New ZealandJapan - Viet NamASEAN - Japan
32
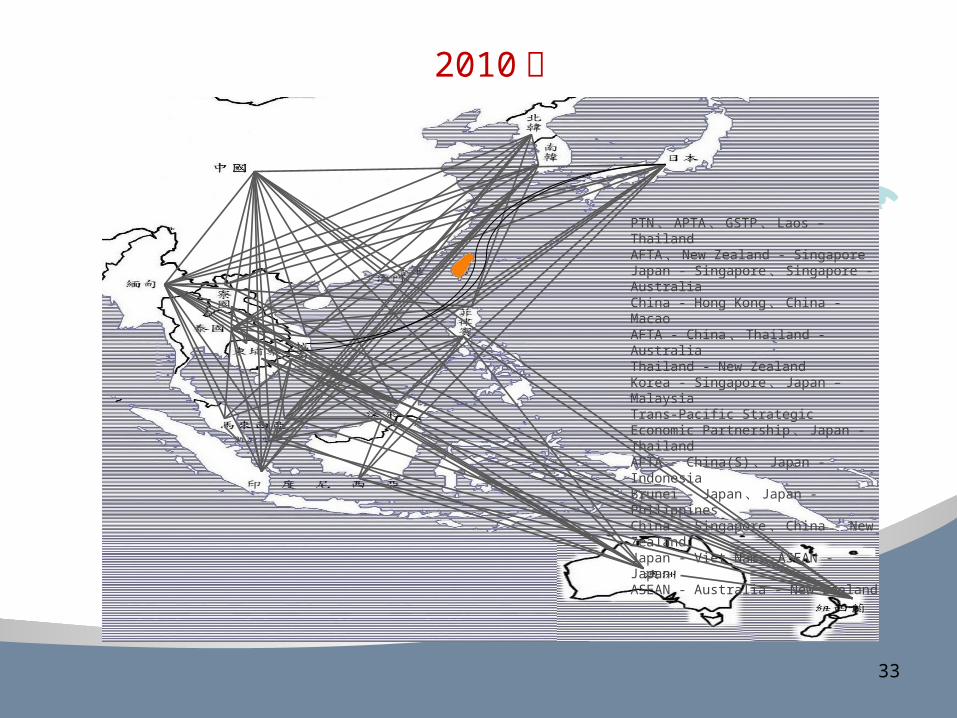
2010年
PTN 、 APTA 、 GSTP 、 Laos – ThailandAFTA 、 New Zealand - SingaporeJapan - Singapore 、 Singapore - AustraliaChina - Hong Kong 、 China - MacaoAFTA - China 、 Thailand - AustraliaThailand - New ZealandKorea - Singapore 、 Japan – MalaysiaTrans-Pacific Strategic Economic Partnership 、 Japan - ThailandAFTA - China(S) 、 Japan - IndonesiaBrunei - Japan 、 Japan - PhilippinesChina - Singapore 、 China - New ZealandJapan - Viet Nam 、 ASEAN - JapanASEAN - Australia - New Zealand
33
34
二。台灣目前與其他國家簽署 FTAs情況
( 一 ) 個別國家的 FTAs: (1)2010/8 ,台灣與新加坡 (ASTEP)。(2)2011年,台灣與紐西蘭 (ECA)。(3)2011/11, 台日投資保障協議 (BIA)。(4)2012/7,立法院通過開放美牛進口,最高 10ppb的萊克多巴胺( 瘦肉精 ) ,台美重啟 TIFA協商。(5)香港、菲律賓、印尼、印度都表達有意願與我國洽簽 FTA。(6)2011/5,歐洲議會通過建議案,建議歐盟執委會與我國洽簽 FTA。(7)預計 8 年內加入 TPP。
35
( 二 ) 區域經濟 FTAs:1 。跨太平洋經濟戰略夥伴協議 (TPP) (1)原始會員國: 2005年由紐西蘭、新加坡、智利、汶萊等四國成立。(2)參與談判國家:紐西蘭、新加坡、智利、汶萊、澳洲、秘魯、越南、 馬來西亞、美國等九國。(3)日本在 2011年 11月 APEC領袖會議中,正式宣佈加入 TPP談判,加拿大總理亦同時表達有意加入 TPP談判的意願。這十一個國家的 GDP佔全球 GDP的 35.6%。(4)亞太自由貿易區 (FTAAP): 2006年美國建議接把 APEC變更為FTAAP。
2 。亞太區域經濟夥伴協議 (RCEP, Regional Comprehensive Economic Partnership) (1)東協十加六(2)其他國家與地區
伍。 ECFA對台灣經濟的影響
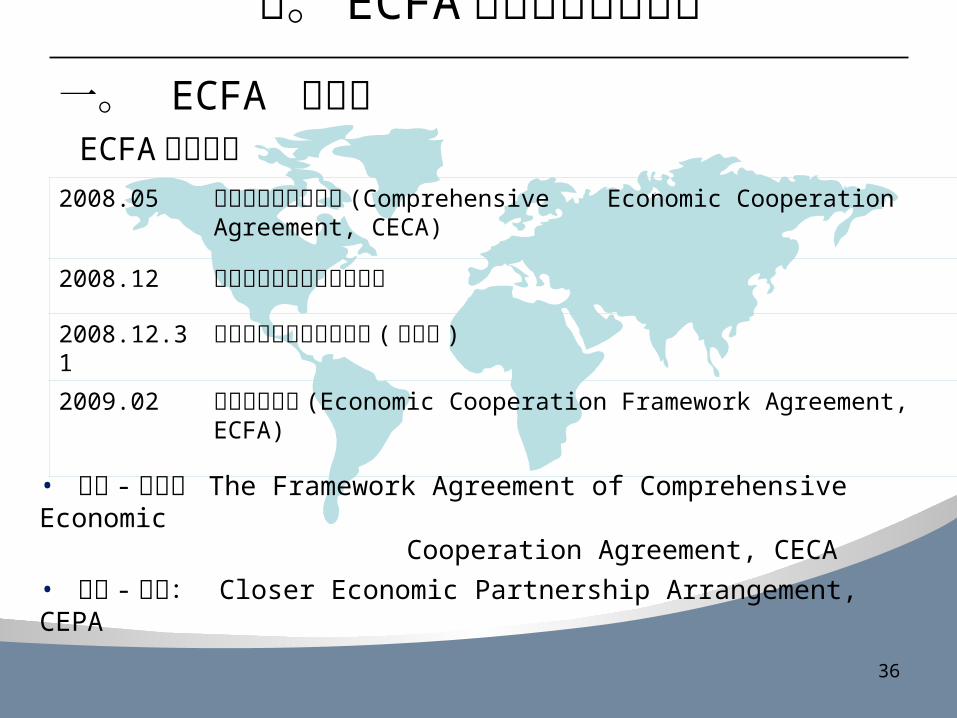
一。 ECFA 的進程 ECFA名稱由來
36
2008.05 綜合性經濟合作協議 (Comprehensive Economic Cooperation Agreement, CECA)
2008.12 第四屆兩岸經貿與文化論壇
2008.12.31 胡錦濤對台灣同胞的講話 (胡六條 )
2009.02 兩岸經濟協議 (Economic Cooperation Framework Agreement, ECFA)
• 中國 - 東協: The Framework Agreement of Comprehensive Economic Cooperation Agreement, CECA
• 中國 - 香港: Closer Economic Partnership Arrangement, CEPA
二。早收清單的內容與效
1.大陸對台灣開放的項目、金額與影響
(1)ECFA的早收清單中,台灣有 539項產品享有進入大陸免稅的優惠,金額為 138億美元,佔台灣對大陸出口的 16.1%。
(2)台灣省下 9.1億美元的關稅支出;而大陸可以節省 1.1億美元的關稅。兩相比較之下,台灣可以立即省下 8 億美元的稅。
(3)據經濟部估計,在這 539項產品免關稅以後,台灣的產值會增加 200億台幣,台灣的 GDP上升 0.4%,同時可以增加 6 萬個就業就機會。
(4)早收清單項目降稅時程預計自 2011/1月開始分三年降稅至 0 。
37
2. 台灣對大陸方面的開放項目與金額(1) 大陸有 267項產品享有免稅來台的優惠,金額為 28億美元,佔
大陸對台灣出口的 10.5% 。
(2) 大陸可因此省下 1.1億美元的關稅支出。
(3) 大陸開放的商品項目、金額與比例都比台灣多,符合讓利原則。
38
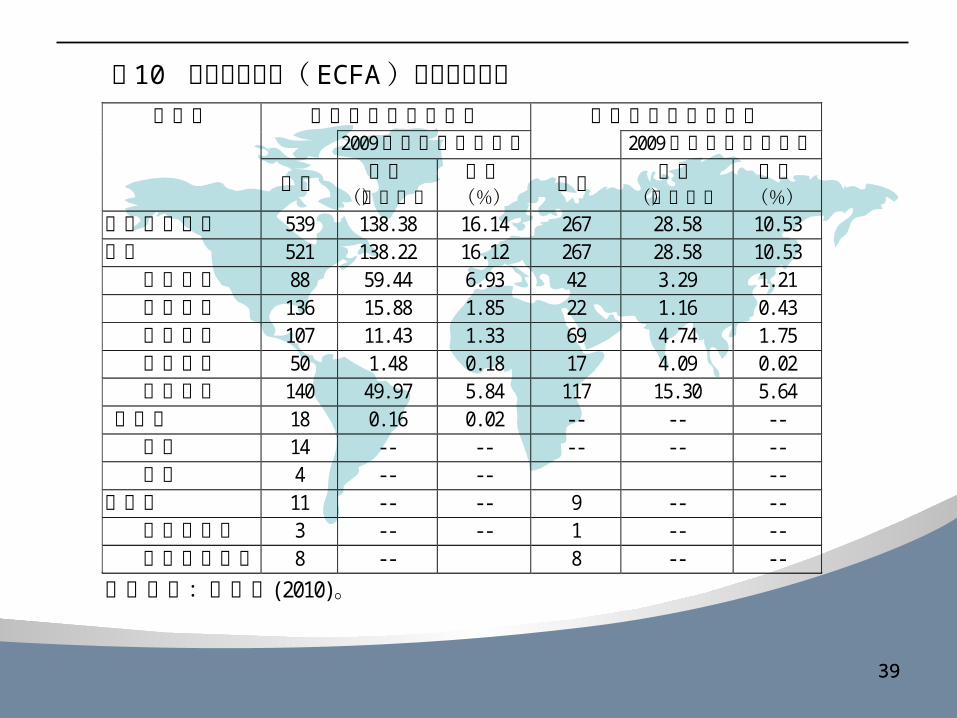
3939
產業別 大陸對台灣開放項目 台灣對大陸開放項目 2009年大陸自台灣進口 2009年台灣自大陸進口
項數 金額 (億美元)
比重 (%)
項數 金額 (億美元)
比重 (%)
工業與農漁業 539 138.38 16.14 267 28.58 10.53 工業 521 138.22 16.12 267 28.58 10.53 石化產業 88 59.44 6.93 42 3.29 1.21 紡織產業 136 15.88 1.85 22 1.16 0.43 機械產業 107 11.43 1.33 69 4.74 1.75 運輸工具 50 1.48 0.18 17 4.09 0.02 其他產業 140 49.97 5.84 117 15.30 5.64
農漁業 18 0.16 0.02 -- -- -- 農業 14 -- -- -- -- -- 漁業 4 -- -- --
服務業 11 -- -- 9 -- -- 金融服務業 3 -- -- 1 -- -- 非金融服務業 8 -- 8 -- --
資料來源:施顏祥(2010)。
表 10 兩岸經濟協議( ECFA)早收清單業別
4040
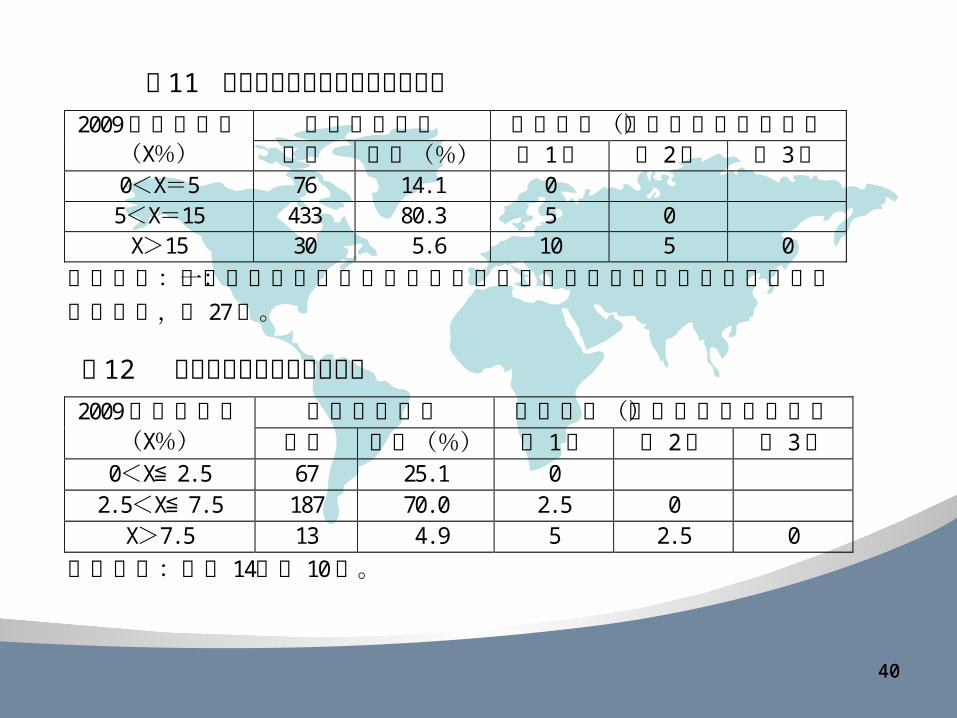
2009年進口稅率 (X%)
早期收穫產品 協議稅率(早期收穫計畫實施) 項數 比重(%) 第 1年 第 2年 第 3年
0<X=5 76 14.1 0 5<X=15 433 80.3 5 0 X>15 30 5.6 10 5 0
資料來源:海峽兩岸經濟合作架構協議附件一:貨品貿易早期收穫產品清單及 降稅安排,第 27頁。
表 11 中國大陸早期收穫產品降稅安排
2009年進口稅率 (X%)
早期收穫產品 協議稅率(早期收穫計畫實施) 項數 比重(%) 第 1年 第 2年 第 3年
0<X≦ 2.5 67 25.1 0 2.5<X≦ 7.5 187 70.0 2.5 0
X>7.5 13 4.9 5 2.5 0 資料來源:同表 14,第 10頁。
表 12 台灣早期收穫產品降稅安排
4141
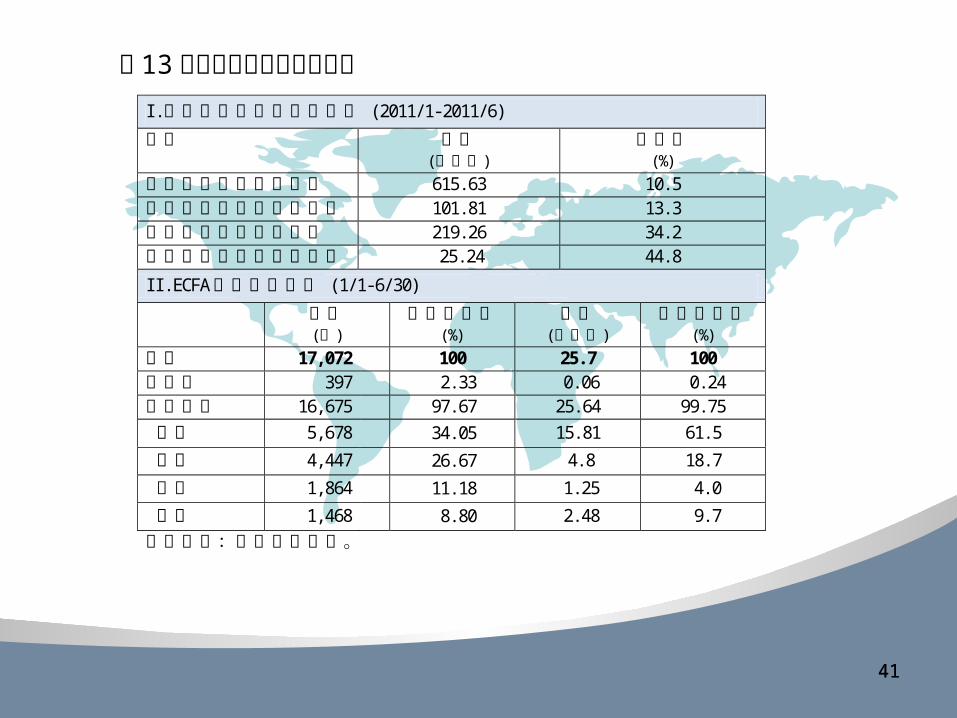
I.對進出口貿易之影響效果 (2011/1-2011/6)
項目 金額 (億美元)
成長率 (%)
台灣出口到大陸總金額 615.63 10.5 早期收穫清單內貨品出口 101.81 13.3 台灣自大陸進口總金額 219.26 34.2 早期收穫清單內貨品進口 25.24 44.8
II.ECFA原產地證明書 (1/1-6/30)
件數 (件)
件數百分比(%)
金額 (億美元)
金額百分比(%)
總計 17,072 100 25.7 100 農產品 397 2.33 0.06 0.24 工業產品 16,675 97.67 25.64 99.75
石化 5,678 34.05 15.81 61.5
機械 4,447 26.67 4.8 18.7
紡織 1,864 11.18 1.25 4.0
金屬 1,468 8.80 2.48 9.7 資料來源:經濟部國貿局。
表 13早收清單之實際效果評估

陸。後 ECFA時代兩岸經貿關係與挑戰
一。 ECFA的後續協議:
• 兩岸經濟合作委員會 ( 定位:官方、任務性、事務性 )
• 商品貿易協議 ( 共 10500項產品 )(2013/12)
• 服務業貿易協議 ( 金融、物流、文創、… )(2012/12)
• 投資協議 ( 投資保障協議,投資促進… )
• 經濟合作協議 ( 貨幣清算協議、租稅協議、 智財權保障協議… )
42
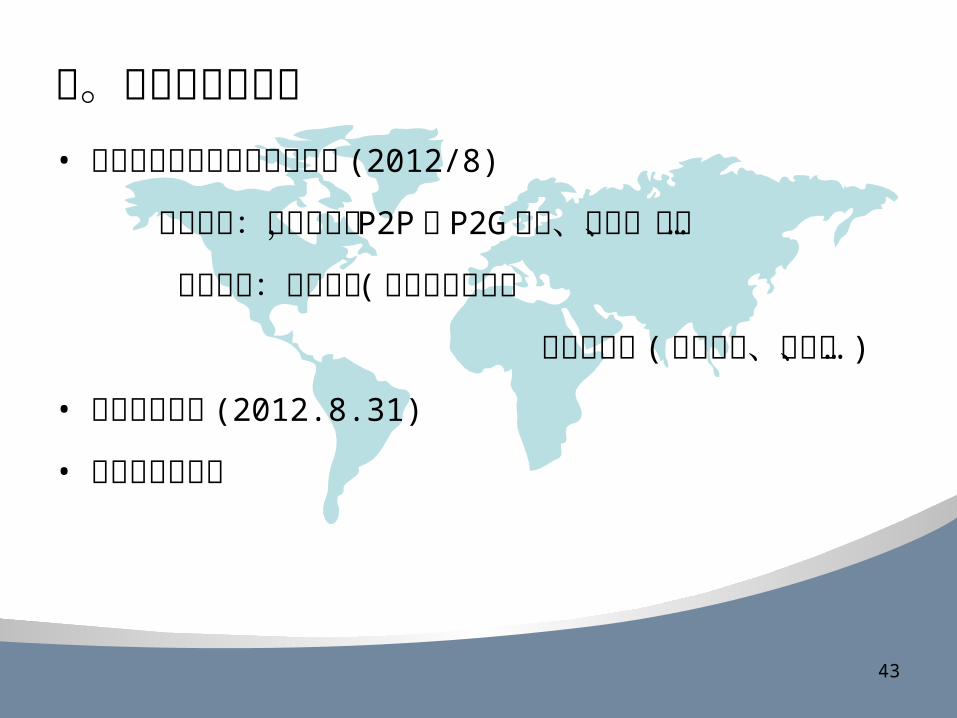
二。第八次江陳會談• 兩岸投資保障與投資促進協議 (2012/8)
投資保障:人身安全, P2P與 P2G仲裁、調處、協商…
投資促進:投資擴張 ( 投資項目與規模
投資便捷化 (停留時間、簽証、… )
• 貨幣清算協議 (2012.8.31)
• 兩岸互設辦事處
43
三。開放陸資來台的新規定
44
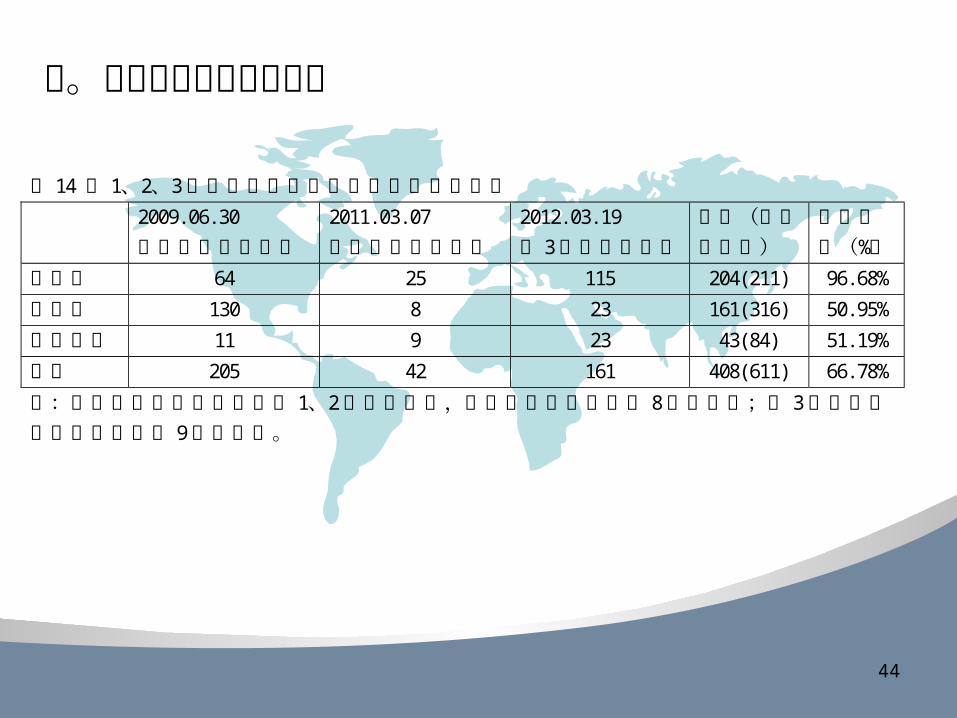
表 14 第 1、2、3階段開放陸資來台投資業別項數統計
2009.06.30
第一階段開放項數
2011.03.07
第二階段開放項數
2012.03.19
第 3階段開放項數
合計(分類總項數)
開放比例(%)
製造業 64 25 115 204(211) 96.68%
服務業 130 8 23 161(316) 50.95%
公共建設 11 9 23 43(84) 51.19%
合計 205 42 161 408(611) 66.78%
註:製造業及服務業項數於第 1、2階段發布時,係採行業標準分類第 8次修訂版;第 3階段則改採行標準分類第 9次修訂版。
• 目前陸資來台情況 (2009/6-2012/8) 1 。投資項目共 294件,金額合計 3.11億美元。 2 。主要投資項目為電腦、電子、光學、批發零售、資訊與軟體服務業。
3 。陸方投資與經理人員共 418人,創造台灣就業 5126人。
• 第四波開放陸資:研議中 1 。開放項目與比例的檢討。 2 。相關的配套措施
45

四。兩岸經貿未來的機會
1.十二五規畫與兩岸產業合作的機會
46
全名 中華人民共和國國民經濟和社會發展第十二個五年規劃綱要
實施時間 2011至 2016年
期程 1.2010年 10月的中共十七屆五中全會上討論建議稿
2.2011年 3月份的全國兩會上審議通過付諸實施
主軸 穩增長、調結構、促消費
四大方向 一、擴大內需
二、產業轉型及升級
三、人力資本質量提升
四、節能減排
產業政策 七大戰略性新興產業:節能環保、新一代信息技術、生物、
高端裝備製造、新能源、新材料與新能源汽車。 資料來源:本研究整理。
表 15「十二五」規劃可能內容概要
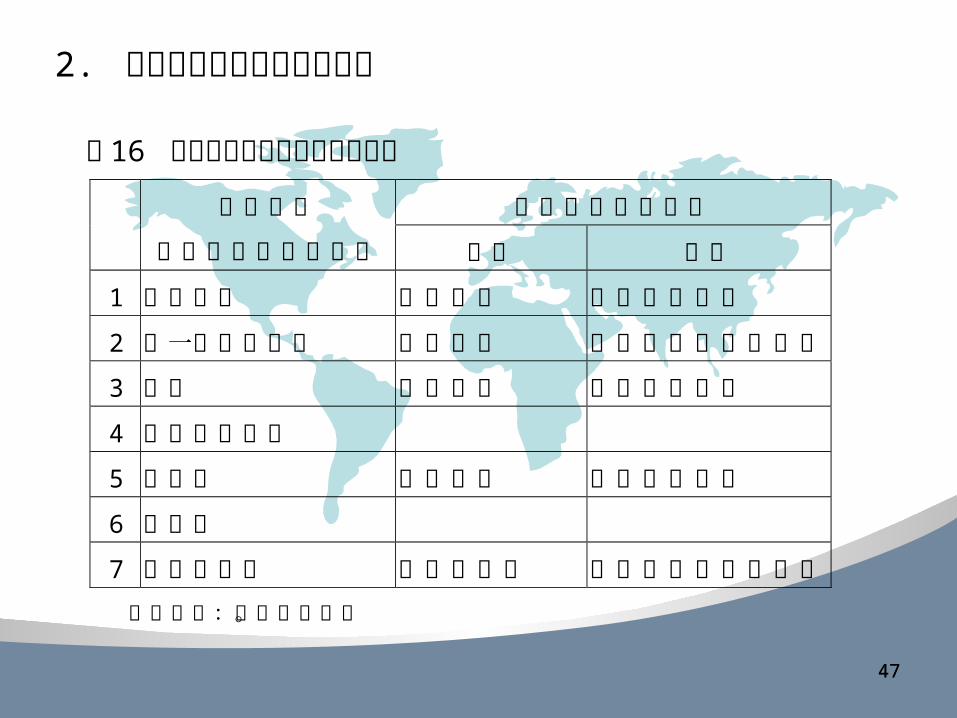
2. 兩岸新興產業的比較與機會
47
中國大陸
七大戰略性新興產業
與台灣對應的政策
名稱 分類
1 節能環保 綠色能源 六大新興產業
2 新一代信息技術 雲端運算 四大新興智慧型產業
3 生物 生物科技 六大新興產業
4 高端裝備製造
5 新能源 綠色能源 六大新興產業
6 新材料
7 新能源汽車 智慧電動車 四大新興智慧型產業
資料來源:本研究整理。
表 16 兩岸推動中的新興產業對照表
47
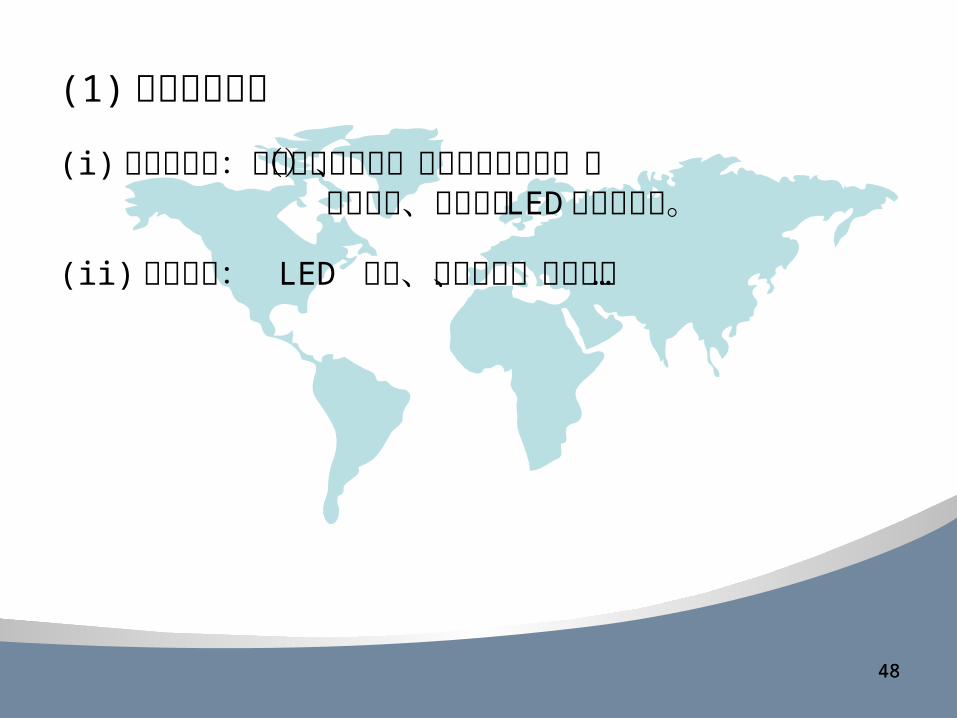
(1)新興能源產業
(i)新能源產業:諸如太陽能發電(太陽能光伏發電)、 風力發電、電動車及 LED等新興產業。
(ii)搭橋專案: LED 照明、精準物流、城市通信…
4848

(2)服務業(i) 2010 中國大陸成為全球第二大經濟體
(ii) 從「世界工廠」轉變成為「世界市場」
(iii) 服務業比例仍偏低
(iv) 金融業的機會: ECFA
海西經濟區 區域性或城市金融機構
4949
(3)相互承認專利或審查結果 (i) 技術合作
(ii) 專利合作
(iii) 共建規格標準
(4)文化創意產業 (i) 語言與文化
(ii) 網路與科技
(iii) 資金與市場
5050
五。兩岸經貿關係的挑戰1.ECFA的後續協議:
貨品貿易協議、服務業貿易協議、投資協議、經濟合作協議
2.陸資來台:國際仲裁、投資促進、爭端解決
3.台灣的國際經貿空間:雙邊 FTA,多邊協議
4.兩岸搭橋專案
5.大陸內陸市場的開放問題
6.大陸服務業開放的問題
51
5252
1. 兩岸經貿對於台灣的經濟成長、貿易、投資、就業與產業結構都有明顯的影響。
2. 東亞經濟整合對於台灣產生很大的壓力, ECFA是台灣參與東亞經濟整合的策略性做法。
3. ECFA開啟台灣黃金十年, ECFA「讓台灣走向世界,讓世界走進台灣」。
4. 後 ECFA時代,台灣黃金十年與大陸十二五規畫讓兩岸產生各多的合作機會。 但是,也同樣將面臨更多的挑戰。
5. 現階段兩岸政策的三大目標: (1)擴大並深化兩岸交流 (2)兩岸兩會互設辦事處 (3)全面修訂兩岸人民關係條例
柒。結語

5353
報告結束敬請指教