Embed Size (px)
Citation preview

© Nuffield Foundation 2012
© Rudolf Stricker
Nuffield Free-Standing Mathematics Activity
Can they tell the difference?
low caloriealternative
ginger ale
© Nuffield Foundation 2010
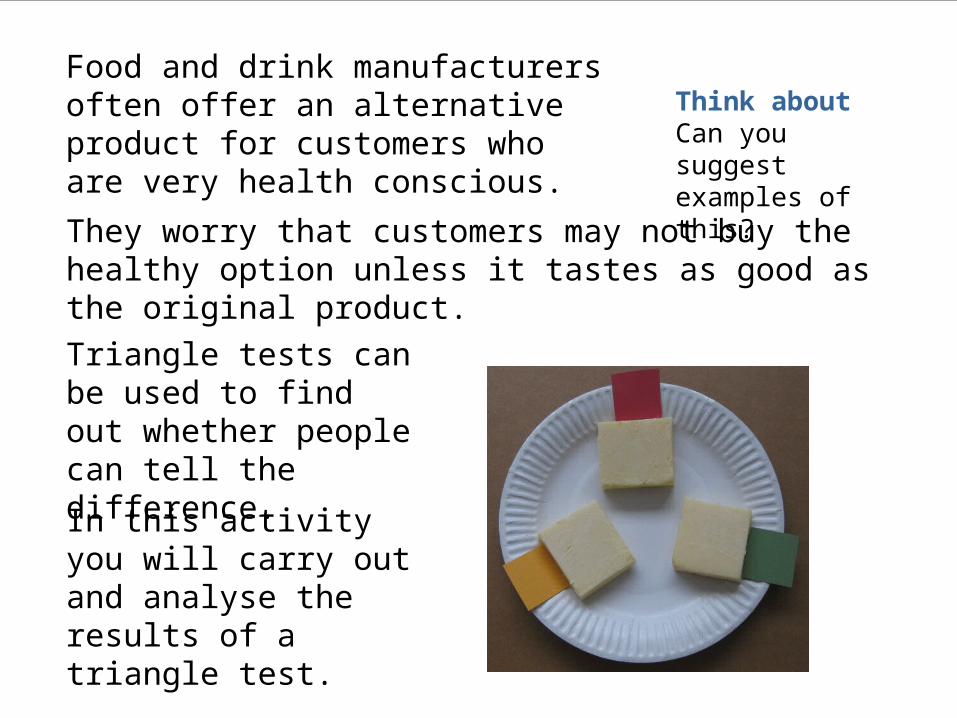
Food and drink manufacturers often offer an alternative product for customers who are very health conscious.
Think aboutCan you suggest examples of this?
They worry that customers may not buy the healthy option unless it tastes as good as the original product.
Triangle tests can be used to find out whether people can tell the difference.
In this activity you will carry out and analyse the results of a triangle test.
© Nuffield Foundation 2010
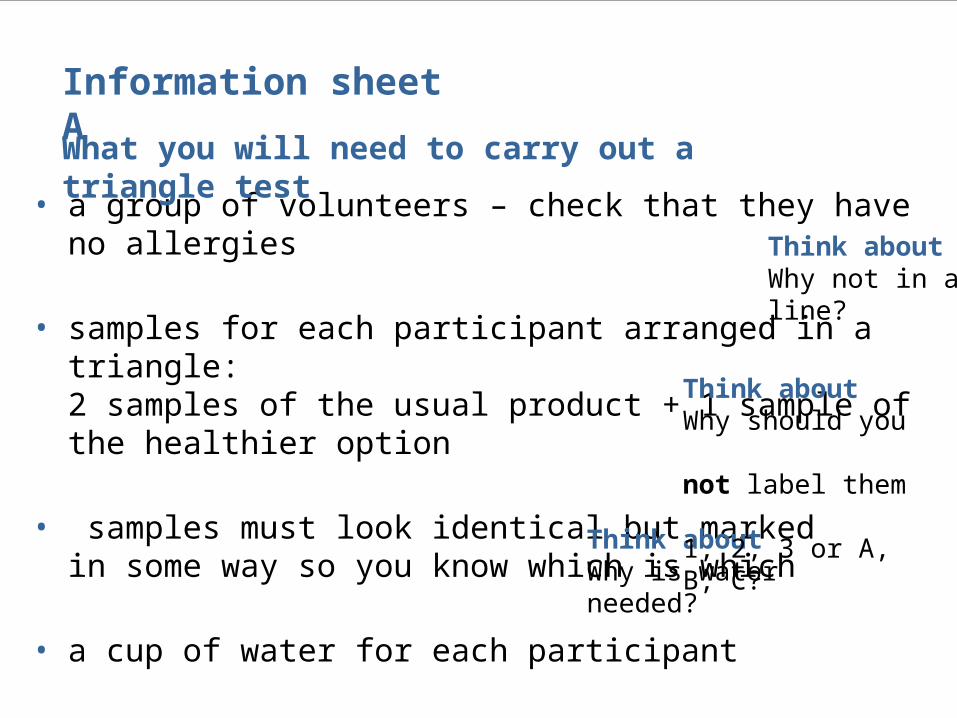
• a group of volunteers – check that they have no allergies
• samples for each participant arranged in a triangle: 2 samples of the usual product + 1 sample of the healthier option
• samples must look identical but marked in some way so you know which is which
• a cup of water for each participant
• a pen and instruction sheet for each volunteer
Think aboutWhy is water needed?
Information sheet A
What you will need to carry out a triangle test
Think aboutWhy not in a line?
Think aboutWhy should you not label them 1, 2, 3 or A, B, C?
© Nuffield Foundation 2010
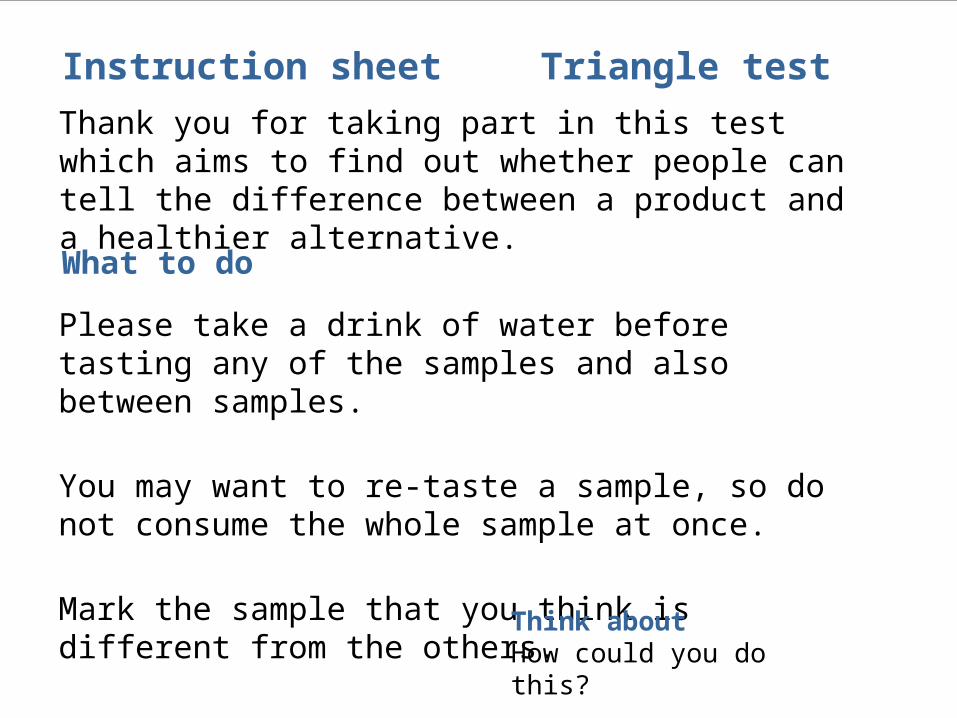
Instruction sheet Triangle test
Thank you for taking part in this test which aims to find out whether people can tell the difference between a product and a healthier alternative.
Please take a drink of water before tasting any of the samples and also between samples.
You may want to re-taste a sample, so do not consume the whole sample at once.
Mark the sample that you think is different from the others.
What to do
Think aboutHow could you do this?
© Nuffield Foundation 2010
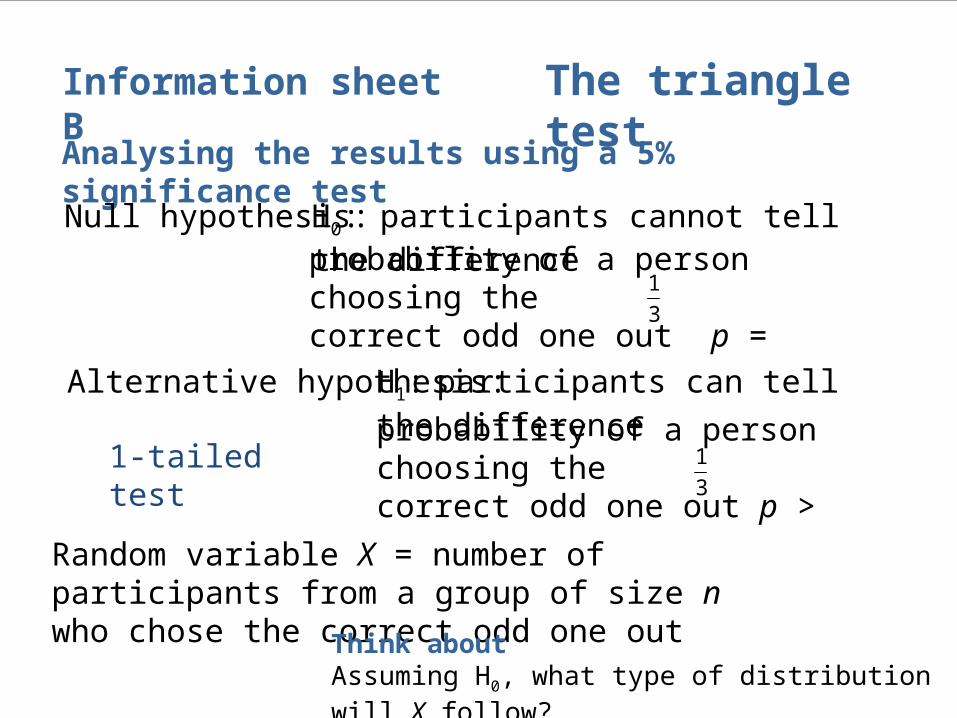
The triangle testInformation sheet B
Analysing the results using a 5% significance test
Null hypothesis: H0: participants cannot tell the difference
H1: participants can tell the differenceAlternative hypothesis:
1-tailed test
probability of a person choosing the correct odd one out p =
3
1
probability of a person choosing the correct odd one out p >
3
1
Random variable X = number of participants from a group of size n who chose the correct odd one out
Think aboutAssuming H0, what type of distribution will X follow?

© Nuffield Foundation 2010
The triangle test
rnr
r
nrnqrpr
nrXP
3
2
3
1)(
Information sheet B
Analysing the results using a 5% significance test
Compare the total probability of the test result or better with 0.05
Think aboutWhat assumptions are being made ?
Under H0, X is Binomial with size n = the number in the group, p = and q = 3
1
3
2
If the total probability is less than 0.05, the test result is significant.In this case, reject the null hypothesis and accept the alternative.
Use this to find the probability of the test result, or better.
© Nuffield Foundation 2010
The triangle test
P(12)P(11)P(10)P(9)P(8))8(P X
Information sheet B
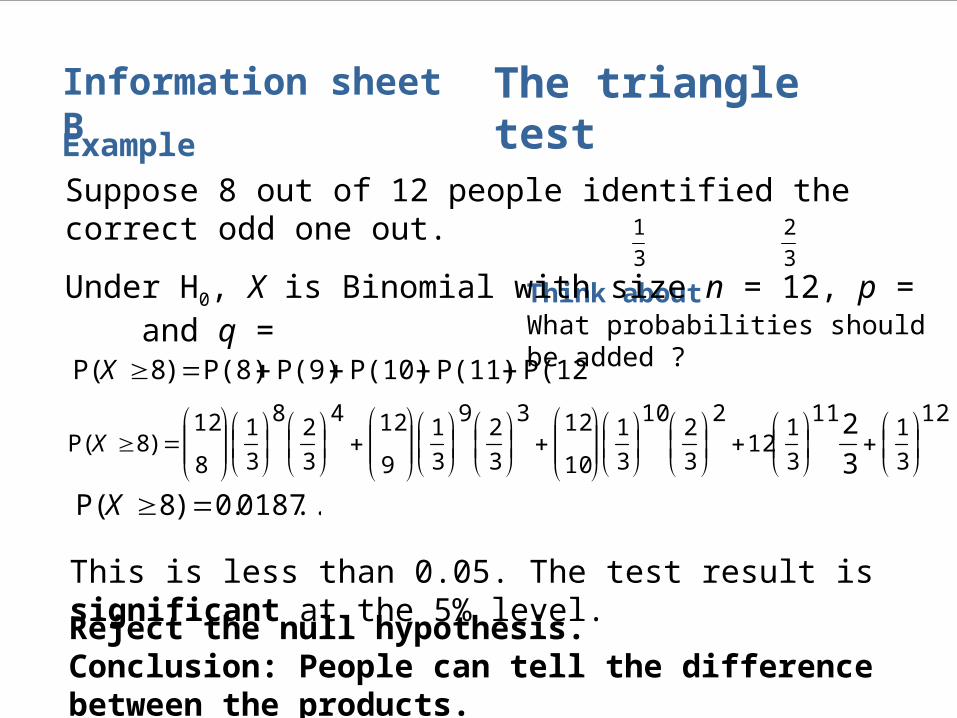
Example
Think aboutWhat probabilities should be added ?
Suppose 8 out of 12 people identified the correct odd one out.
Under H0, X is Binomial with size n = 12, p = and q = 3
1
3
2
This is less than 0.05. The test result is significant at the 5% level.
Reject the null hypothesis.Conclusion: People can tell the difference between the products.
12
3
111
3
112
2
3
210
3
1
10
123
3
29
3
1
9
124
3
28
3
1
8
12)8(P
3
2
X
...0187.0)8(P X
Reflect on your work
• Why do food companies use triangle tests?
• Describe what you need to provide and how you should carry out a triangle test.
• Did you have any problems in carrying out your triangle test?If so, how did you overcome them?
• List the steps in the hypothesis test that you used to analyse your results of your triangle test. What did you conclude?
• How would a 1% significance test differ from the 5% test?Would the result have been the same?
• What limitations does a triangle test have?Can you think of any ways to improve it?
© Nuffield Foundation 2012