Embed Size (px)
Citation preview
~ On-Line Monitoring: A Thtorial Beth A. Schroeder State University of New York, Binghamton
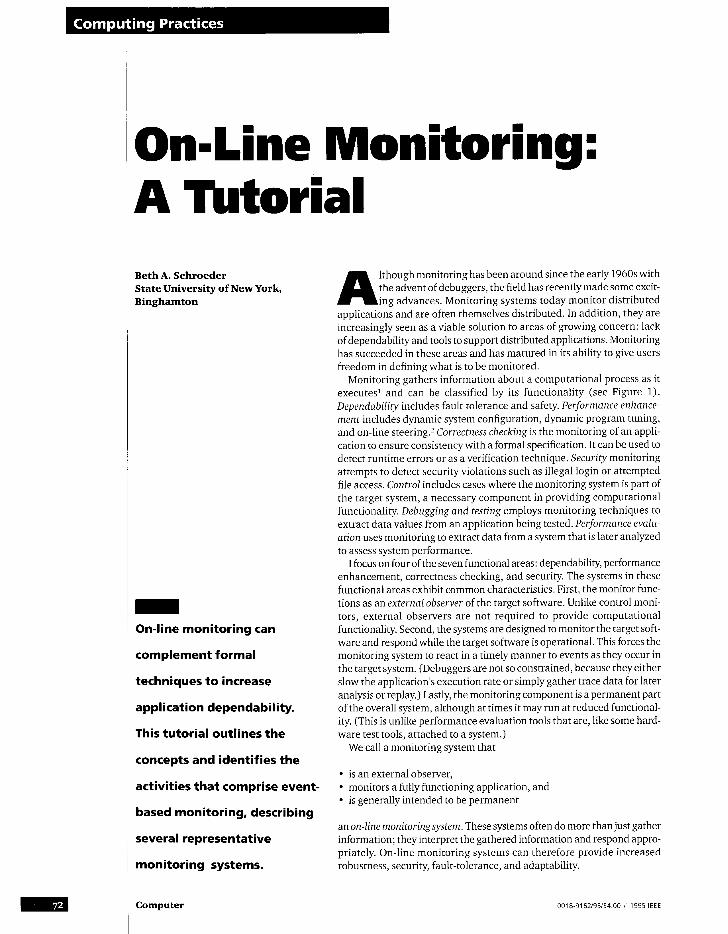
On-line monitoring can
complement formal
techniques to increase
application dependability.
This tutorial outlines the
concepts and identifies the
activities that comprise event-
based monitoring, describing
several representative
monitoring systems.
Computer
lthough monitoring has been around since the early 1960s with the advent of debuggers, the field has recently made some excit- ing advances. Monitoring systems today monitor distributed
applications and are often themselves distributed. In addition, they are increasingly seen as a viable solution to areas of growing concern: lack of dependability and tools to support distributed applications. Monitoring has succeeded in these areas and has matured in its ability to give users freedom in defining what is to be monitored.
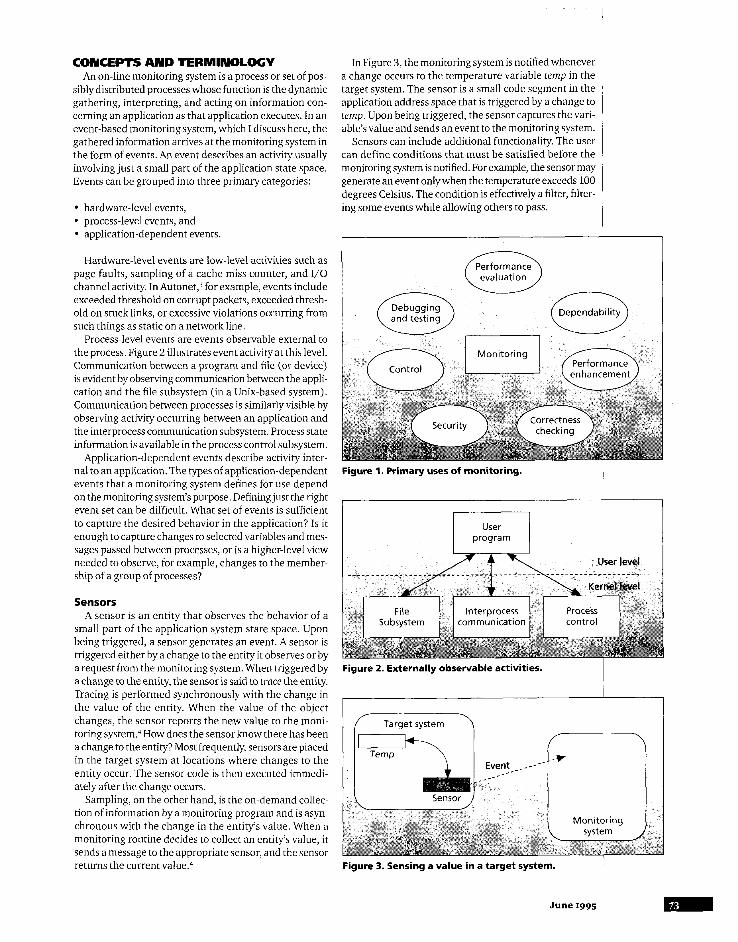
Monitoring gathers information about a computational process as it executes’ and can be classified by its functionality (see Figure 1). Dependability includes fault tolerance and safety. Performance enhance- ment includes dynamic system configuration, dynamic program tuning, and on-line steering.* Correctness checking is the monitoring of an appli- cation to ensure consistency with a formal specification. It can be used to detect runtime errors or as a verification technique. Security monitoring attempts to detect security violations such as illegal login or attempted file access. Control includes cases where the monitoring system is part of the target system, a necessary component in providing computational functionality. Debugging and testing employs monitoring techniques to extract data values from an application being tested. Performance evalu- ation uses monitoring to extract data from a system that is later analyzed to assess system performance.
I focus on four of the seven functional areas: dependability, performance enhancement, correctness checking, and security. The systems in these functional areas exhibit common characteristics. First, the monitor func- tions as an external observer of the target software. Unlike control moni- tors, external observers are not required to provide computational functionality. Second, the systems are designed to monitor the target soft- ware and respond while the target software is operational. This forces the monitoring system to react in a timely manner to events as they occur in the target system. (Debuggers are not so constrained, because they either slow the application’s execution rate or simply gather trace data for later analysis or replay.) Lastly, the monitoring component is a permanent part of the overall system, although at times it may run at reduced functional- ity. (This is unlike performance evaluation tools that are, like some hard- ware test tools, attached to a system.)
We call a monitoring system that
l is an external observer, l monitors a fully functioning application, and l is generally intended to be permanent
an on-line monitoringsystem. These systems often do more than just gather information; they interpret the gathered information and respond appro- priately. On-line monitoring systems can therefore provide increased robustness, security, fault-tolerance, and adaptability.
0018.9162/95/14.00 i 1995lEEE
CONCEPTS AND TERMINOLOGY An on-line monitoring system is a process or set of pos-
siblydistributed processes whose function is the dynamic gathering, interpreting, and acting on information con- cerning an application as that application executes. In an event-based monitoring system, which I discuss here, the gathered information arrives at the monitoring system in the form of events. An event describes an activity usually involving just a small part of the application state space. Events can be grouped into three primary categories:
l hardware-level events, l process-level events, and l application-dependent events.
Hardware-level events are low-level activities such as page faults, sampling of a cache miss counter, and I/O channel activity. In Autonet, for example, events include exceeded threshold on corrupt packets, exceeded thresh- old on stuck links, or excessive violations occurring from such things as static on a network line.
Process-level events are events observable external to the process. Figure 2 illustrates event activity at this level. Communication between a program and file (or device) is evident by observing communication between the appli- cation and the file subsystem (in a Unix-based system). Communication between processes is similarly visible by observing activity occurring between an application and the interprocess communication subsystem, Process state information is available in the process control subsystem.
Application-dependent events describe activity inter- nal to an application. The types of application-dependent events that a monitoring system defines for use depend on the monitoring system’s purpose. Definingjust the right event set can be difficult. What set of events is sufficient to capture the desired behavior in the application? Is it enough to capture changes to selected variables and mes- sages passed between processes, or is a higher-level view needed to observe, for example, changes to the member- ship of a group of processes?
Sensors A sensor is an entity that observes the behavior of a
small part of the application system state space. Upon being triggered, a sensor generates an event. A sensor is triggered either by a change to the entity it observes or by a request from the monitoring system. When triggered by a change to the entity, the sensor is said to trace the entity. Tracing is performed synchronously with the change in the value of the entity. When the value of the object changes, the sensor reports the new value to the moni- toring system.4 How does the sensor know there has been a change to the entity? Most frequently, sensors are placed in the target system at locations where changes to the entity occur. The sensor code is then executed immedi- ately after the change occurs.
Sampling, on the other hand, is the on-demand collec- tion of information by a monitoring program and is asyn chronous with the change in the entity’s value. When a monitoring routine decides to collect an entity’s value, it sends a message to the appropriate sensor, and the sensor returns the current value.4
In Figure 3, the monitoring system is notified whenever a change occurs to the temperature variable temp in the target system. The sensor is a small code segment in the application address space that is triggered by a change to temp. Upon being triggered, the sensor captures the vari- able’s value and sends an event to the monitoring system.
Sensors can include additional functionality. The user can define conditions that must be satisfied before the monitoring system is notified. For example, the sensor may generate an event onlywhen the temperature exceeds 100 degrees Celsius. The condition is effectively a filter, filter- ing some events while allowing others to pass.
Figure 1. Primary uses of monitoring.
User program
Figure 2. Externally observable activities.
Figure 3. Sensing a value in a target system. I
June 1995
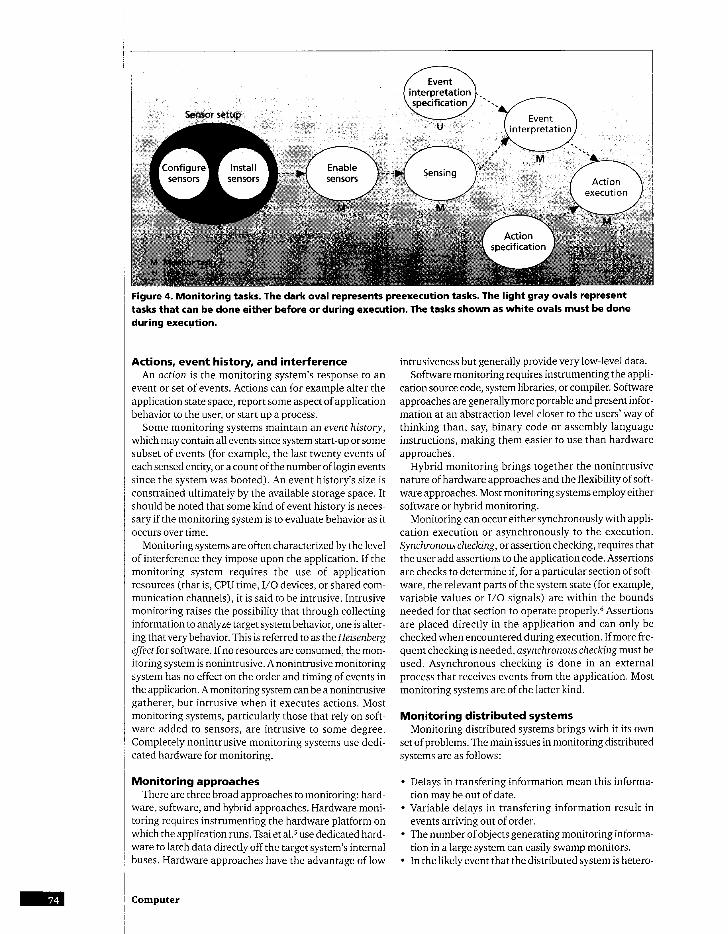
Figure 4. Monitoring tasks. The dark oval represents preexecution tasks. The light gray ovals represent tasks that can be done either before or during execution. The tasks shown as white ovals must be done during execution.
Actions, event history, and interference An action is the monitoring system’s response to an
event or set of events. Actions can for example alter the application state space, report some aspect of application behavior to the user, or start up a process.
Some monitoring systems maintain an event history, which may contain all events since system start-up or some subset of events (for example, the last twenty events of each sensed entity, or a count of the number of login events since the system was booted). An event history’s size is constrained ultimately by the available storage space. It should be noted that some kind of event history is neces- sary if the monitoring system is to evaluate behavior as it occurs over time.
Monitoring systems are often characterized by the level of interference they impose upon the application. If the monitoring system requires the use of application resources (that is, CPU time, I/O devices, or shared com- munication channels), it is said to be intrusive. Intrusive monitoring raises the possibility that through collecting information to analyze target system behavior, one is alter- ing that very behavior. This is referred to as the Heisenberg effect for software. If no resources are consumed, the mon- itoring system is nonintrusive. A nonintrusive monitoring system has no effect on the order and timing of events in the application. A monitoring system can be a nonintrusive gatherer, but intrusive when it executes actions. Most monitoring systems, particularly those that rely on soft- ware added to sensors, are intrusive to some degree. Completely nonintrusive monitoring systems use dedi- cated hardware for monitoring.
Monitoring approaches There are three broad approaches to monitoring: hard-
ware, software, and hybrid approaches. Hardware moni- toring requires instrumenting the hardware platform on which the application runs. Tsai et al.5 use dedicated hard- ware to latch data directly off the target system’s internal buses. Hardware approaches have the advantage of low
Computer
intrusiveness but generally provide very low-level data. Software monitoring requires instrumenting the appli-
cation source code, system libraries, or compiler. Software approaches are generally more portable and present infor- mation at an abstraction level closer to the users’ way of thinking than, say, binary code or assembly language instructions, making them easier to use than hardware approaches.
Hybrid monitoring brings together the nonintrusive nature of hardware approaches and the flexibility of soft- ware approaches. Most monitoring systems employ either software or hybrid monitoring.
Monitoring can occur either synchronously with appli- cation execution or asynchronously to the execution. Synchronous checking, or assertion checking, requires that the user add assertions to the application code. Assertions are checks to determine if, for a particular section of soft- ware, the relevant parts of the system state (for example, variable values or I/O signals) are within the bounds needed for that section to operate properly.6 Assertions are placed directly in the application and can only be checked when encountered during execution. If more fre- quent checking is needed, asynchronous checking must be used. Asynchronous checking is done in an external process that receives events from the application. Most monitoring systems are of the latter kind.
Monitoring distributed systems Monitoring distributed systems brings with it its own
set of problems. The main issues in monitoring distributed systems are as follows:
l Delays in transfering information mean this informa- tion may be out of date.
l Variable delays in transfering information result in events arriving out of order.
l The number of objects generating monitoring informa- tion in a large system can easily swamp monitors.
l In the likely event that the distributed system is hetero-
geneous, a canonical form is needed to encode messages passed between heterogeneous machines.
MONITORING SYSTEM ACTIVITIES Many activities, as derived from Snodgrass,’ go into
making monitoring work. These activities are character- ized by two traits.
l Is the task performed by the user or by the monitoring system, and
l Is the task performed before execution, during execu- tion, or both?
In Figure 4, preexecution tasks are shown as the dark- est ovals (for example, Sensor setup). The light gray ovals represent tasks that can be done either before or during execution. The tasks shown as white ovals must be done during execution. It is desirable to provide as much flexi- bility as possible by delaying user tasks until later stages. This lets the user make adjustments as needed without recompiling the entire monitoring system and application. In some systems, activities are omitted or combined.
Sensor setup Sensor setup usually precedes application execution.
Sensor setup performed during execution is difficult in software-based, application-level monitoring systems because sensors are generally implemented as embedded code in the application data space. Sensor configuration involves deciding what information each sensor will record and where the sensor will be located, and it can be done by the monitoring system. Sensor installation, on the other hand, involves placing the coded sensors at the cor- rect locations and is generally done by the user. Automated sensor installation requires the use of dependency analy- sis like that used in parallel compilers.7
An enabled sensor is ready to collect information. Some sensors are permanently enabled (that is, permanently on), whereas others can be individually or collectively enabled or disabled either automatically or at the user’s direction.’ Sensor enabling is generally performed by the monitoring system.
Sensing is the runtime activity of collecting information about the application. When a sensed event occurs in an application, it must be conveyed to the monitor. The event is either conveyed immediately or can be delayed if the cost of conveying individual events is too high. How events are conveyed depends on the system architecture. In a sin- gle-processor or shared-memory system, an event can be written to a shared-memory location and the monitor noti- fied by signal or interrupt. In a message-based environ- ment, events are sent by message.
Event interpretation Event interpretation is the heart of the monitoring sys-
tem, where the monitoring system interprets the gathered information. What does the monitoring system need to allow it to make sense of the information? Hardware-level and process-level monitoring systems have relatively sim- ple event interpretation components. For these systems, the event set is usually fixed and known in advance, so the
event interpretation specification can contain a specific response for each event type.
Application-dependent monitoring is more difficult. If a user is looking for error conditions or other violations, the system needs an event interpretation specification that contains either a complete description of correct behav- ior or a description of each error condition. In the former case, an incoming event is compared to the monitoring system’s notion of what should be happening to see if the event is consistent with that notion. IDES8 and Sankar and Manda19 use this approach.
Where each error condition is described individually, an event arriving at the monitoring system is compared to the set of descriptions. A match indicates an error has occurred. Leveson6 uses this approach in her synchronous monitoring scheme. The description need not necessarily be of an error condition. ISSOS and Metal0 both provide a language and data model (entity-relationship data model) for describing arbitrary complex scenarios. Incoming events are directed to the appropriate behavior description. A match occurs when the events satisfy the description.
Action specification and execution An action specification is a description supplied by the
user of the action to be taken when significant behavior occurs. On recognizing a behavior, the monitoring system executes an appropriate action. Although most monitors perform some action, often the action does not alter the application’s state. In some concurrent debuggers, for example, the monitoring system during execution pas- sively accepts events, storing them in a repository. On pro- gram completion, the monitoring system invokes a program to analyze the events in the repository and for- mat them for graphical display.
A SAMPLING OF MONITORING SYSTEMS
I have selected one representative sample from each of the functional areas that comprise on-line monitoring. Huang and Kintala’s components enhance the depend- ability of an application; IDES monitors security viola- tions; Sankar and Mandal’s methodology provides correctness checking; and the Falcon system provides a mechanism for on-line steering of computationally intense parallel applications. With each sample I focus on the fol- lowing key questions:
l Events. What are the events? l Sensing. How is the event data gathered? l Event interpretation. How does the monitoring system
interpret events? l Action execution. What response does the monitoring
system make?
The samples amply demonstrate that there are varied and interesting ways to address each question. At the end of each sample I briefly discuss the potential advantages
~ ~
and/or disadvantages of the approach. See Table 1 for a , summary of characteristics. I
Huang and Kintala Huang and Kintala” have developed a set of software
June1995
, r-
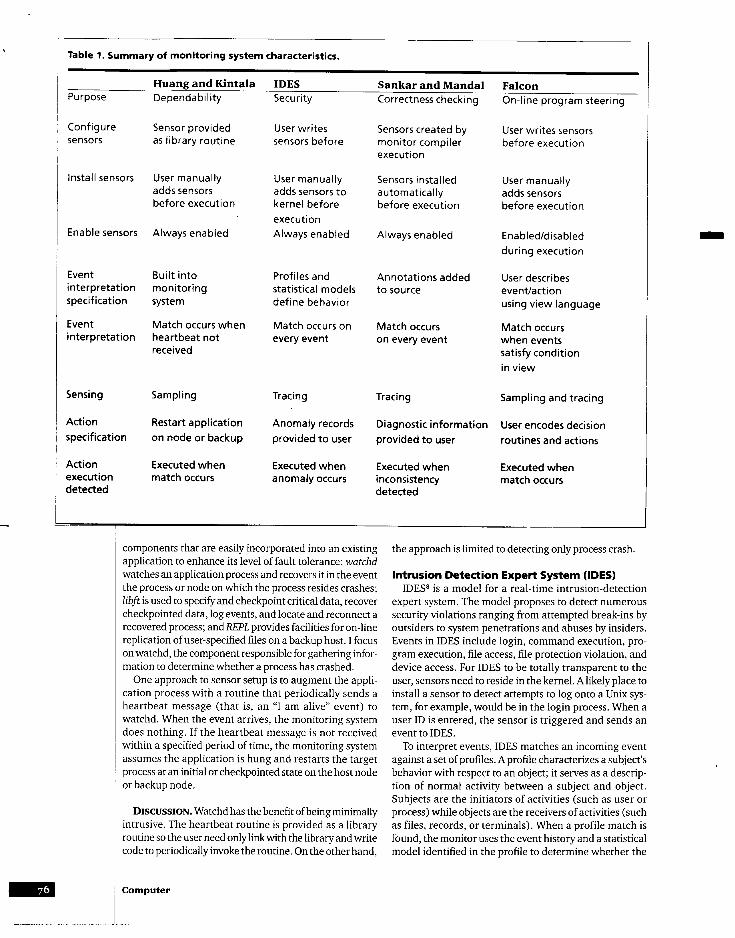
Table 1. Summary of monitoring system characteristics.
Purpose
Configure sensors
Huang and Kintala IDES Sankar and Mandal Falcon Dependability Security Correctness checking On-line program steering
Sensor provided User writes Sensors created by User writes sensors as library routine sensors before monitor compiler before execution
execution
Install sensors User manually User manually Sensors installed adds sensors
User manually adds sensors to automatically adds sensors
before execution kernel before before execution before execution execution
Enable sensors Always enabled Always enabled Always enabled Enabled/disabled during execution
Event Built into Profiles and Annotations added User describes interpretation monitoring statistical models to source event/action specification system define behavior using view language
Event Match occurs when Match occurs on Match occurs Match occurs interpretation heartbeat not every event on every event when events
received satisfy condition in view
Sensing
Action specification
Action execution detected
Sampling Tracing
Restart application Anomaly records on node or backup provided to user
Executed when Executed when match occurs anomaly occurs
Tracing Sampling and tracing
Diagnostic information User encodes decision provided to user routines and actions
Executed when Executed when inconsistency match occurs detected
components that are easily incorporated into an existing application to enhance its level of fault tolerance: watchd watches an application process and recovers it in the event the process or node on which the process resides crashes; libft is used to specify and checkpoint critical data, recover checkpointed data, log events, and locate and reconnect a recovered process; and REPL provides facilities for on-line replication of user-specified files on a backup host. I focus on watchd, the component responsible for gathering infor- mation to determine whether a process has crashed.
One approach to sensor setup is to augment the appli- cation process with a routine that periodically sends a heartbeat message (that is, an “I am alive” event) to watchd. When the event arrives, the monitoring system does nothing. If the heartbeat message is not received within a specified period of time, the monitoring system assumes the application is hung and restarts the target process at an initial or checkpointed state on the host node or backup node.
DISCUSSION. Watchd has the benefit of being minimally intrusive. The heartbeat routine is provided as a library routine so the user need onlylinkwith the library and write code to periodically invoke the routine. On the other hand,
the approach is limited to detecting only process crash.
Intrusion Detection Expert System (IDES) IDES8 is a model for a real-time intrusion-detection
expert system. The model proposes to detect numerous security violations ranging from attempted break-ins by outsiders to system penetrations and abuses by insiders. Events in IDES include login, command execution, pro- gram execution, file access, file protection violation, and device access. For IDES to be totally transparent to the user, sensors need to reside in the kernel. A likely place to install a sensor to detect attempts to log onto a Unix sys- tem, for example, would be in the login process. When a user ID is entered, the sensor is triggered and sends an event to IDES.
To interpret events, IDES matches an incoming event against a set of profiles. A profile characterizes a subject’s behavior with respect to an object; it serves as a descrip- tion of normal activity between a subject and object. Subjects are the initiators of activities (such as user or process) while objects are the receivers of activities (such as files, records, or terminals). When a profile match is found, the monitor uses the event history and a statistical model identified in the profile to determine whether the
Computer
current event is consistent with the normal behavior described by the profile. If the event is normal, it updates the profile. Otherwise, it is stored as an anomaly and reported to the operator.
The knowledge possessed by the monitoring system is of two kinds. The first kind is a set of activity rules that are applicable independent of the application being moni- tored; activity rules specify the action to be taken when a condition is satisfied. For example, when a match occurs between an event and a profile, the action taken is to update the profile and check for anomalous behavior. The second kind is the set of profiles, statistical metrics, and statistical models that are unique to an application and must be supplied by the user.
DISCUSSION. Adding a new object would, in the worst case, involve adding a sensor to the kernel, adjusting pro- files to include the allowable actions on the new object, and installing a new statistical model for evaluating the reasonableness of an action taken against the object. It is conceivable to update the profiles and statistical models on-line. Adding a new sensor to the kernel would neces- sitate rebooting the system, at a minimum.
Sankar and Mandal Sankar and Manda19 have developed a methodology to
continuously monitor an executing Ada program for spec- ification consistency. The user annotates an Ada program with constructs from Anna, a formal specification lan- guage. Annotations are predicates (that is, Boolean-val- ued expressions) that express constraints on Ada language constructs such as data objects, types, subtypes, subpro- grams, and exceptions. The annotation below constrains all values of type EVEN to be even numbers. EVEN-CON- STRAINT is the annotation name.
type EVEN is new INTEGER; - 1 < < EVEN-CONSTRAINT > > - lwhereX:EVEN=>Xmod2=0;
Sensing is achieved indirectly by adding annotations to the target system. By annotating the code, the user is at the same time selecting the sensor locations. The compiler transforms the annotations into checking functions, each function as a separate task. In place of the transformed annotation, the compiler inserts a call to the checking function. The call statement then is a sensor, and the checking function task becomes a monitor. An event occurs when the call statement is executed.
Since each annotation is transformed into its own mon- itor, the monitor code is usually quite simple. In EVEN-CON- STRAINT above, the monitor checks that the parameter is even and returns the value if the condition is true or raises an exception otherwise. If an inconsistency occurs, diag- nostic information is provided.
DISCUSSION. Because of its synchronous checking approach, sensors can be installed automatically by the compiler. However, adding another annotation requires recompiling the application software. Also, because a sep- arate checking task is created for every annotation, a poten- tially large number of monitors can exist for an application.
Falcon Falconi is a set of tools that support on-line steering of
parallel and distributed applications. The approach offers a way of providing interactivity to high-perfor- mance applications that separates the interactive com- ponent from the computationally intensive component and provides a dynamic link between the two. The inter- active, or steering, component monitors the application, displays the information to the end user or submits it to a steering agent, accepts steering commands from the user, and enacts changes that affect the application’s exe- cution.
Events are user defined, involving application-specific data. As an example, an event can be generated when a thread has attempted to obtain a mutex lock and another generated when the thread has succeeded in obtaining the lock. The user defines the sensors using a sensor specifi- cation language and manually inserts them in the target program. Sensors forward events to a local monitor resi- dent on the target program’s processor, which collects the events and can apply filters to reduce the monitoring over- head or analysis tools to produce higher level information.
To interpret events, the gathered events (once filtered and analyzed) are matched against event/action records stored in a repository. When the condition in the event/action record is satisfied, a match occurs and the associated action is executed. The action might be to perform some actual steering action on the application, note the occurrence of some monitoring event for future reference, or simply for- ward the event for display or further processing.
DISCUSSION. Falcon is the most general of the moni- tors discussed. It supports sampled sensors, traced sen- sors, and traced sensors with filtering and computing capabilities. Sensors can be enabled and disabled. The monitoring system can be configured to meet the needs of the application. On-line steering is done either interac- tively by directly involving the user or by means of user- developed algorithms. Sensors, however, must be defined before execution begins and must be installed manually by the user.
ON-LINE MONITORING IS INCREASINGLY SEEN AS A VIABLE means of increasing application dependability. Formal methods, often regarded as a way of guaranteeing a cer- tain level of dependability, are not without shortcomings. More importantly, they are difficult to apply comprehen- sively to large development projects. Design assumptions made by formal techniques to deal with unpredictability of the external environment or to simplify a problem can be violated at runtime. In some cases, it may simply be unfeasible to formally verify some properties.
On-line monitoring can be used to complement formal techniques to increase the overall dependability of an application. In addition, monitoring distributed and par- allel systems during execution can provide information that can be used to reconfigure the system, tune the appli- cation, steer its outcome, or provide visualization of behav- ior. With monitoring systems today being more general (less target architecture and application specific), they are promising tools for wider use in the future. I
June 1995
Acknowledgments I thank Sudhir Aggarwal, State University of New York,
Binghamton, for his time and suggestions given gener- ously throughout the development of this article. I also thank Chandra Kintala, AT&T Bell Laboratories, and Karsten Schwan, Georgia Tech, for reviewing parts of the manuscript.
References 1. R. Snodgrass, “A Relational Approach to Monitoring Com-
plex Systems,“ACM Trans. Computer Systems, Vol. 6, No. 2, May 1988, pp. 156-196.
2. W. Gu, J. Vettrr, and K. Schwan, “AnAnnotated Bibliography of Interactive Program Steering,” SIGPlan Notices, Vol. 29, No. 9, Sept. 1994, pp. 140-148.
3. S. Mullender, ed., Distributed Systems, 2nd ed., ACM Press, New York, 1993, pp. 283-312.
4. M. Kaelbling and D. Ogle, “Minimizing Monitoring Costs: Choosing Between Tracing and Sampling,” Proc. 23rd Int’l Conf. SystemSciences, IEEE CS Press, Los Alamitos, Calif. Jan. 1990, pp. 314-320.
5. J.J.P. Tsai et al., “ANoninterference Monitoring and ReplayMech- anism for Real-Time Software Testing and Debugging,” IEEE Trans. SofrwareEng., Vol. 16, No. 8, Aug. 1990, pp. 897-916.
6. N. Leveson and T. Shimeall, “Safety Assertions for Process- Control Systems,“Proc. 13thlnt’l. Symp. Fault-Tolerant Com- puting, IEEE CS Press, Los Alamitos, Calif., Order No. 477 (microfiche only), 1983, pp. 236-240.
Dependent Dynamic Monitoring of Distributed and Parallel Systems,“IEEE Trans. Parallel andDistributed Systems, Vol. 4, No. 7, July 1993, pp. 762-778.
8. D.E. Denning, “An Intrusion-Detection Model,” IEEE Trans. Software Eng., Vol. 13, No. 2, Feb. 1987, pp. 222-232.
9. S. Sankar and M. Mandal, “Concurrent Runtime Monitoring of Formally Specified Programs,” Computer, Vol. 26, No. 3, Mar. 1993, pp. 32-41.
10. K. Marzullo et al., “Tools for Distributed Application Man- agement,” Computer, Vol. 24, No. 8, Aug. 1991, pp. 42-51.
11. Y. Huang and C. Kintala, “Software-Implemented Fault Tol- erance: Technologies and Experience,“Proc. 23rdInt’lSymp. on Fault-Tolerant Computing, IEEE CS Press, Los Alamitos, Calif., Order No. 3680-02T, 1993, pp. 2-9.
12. W. Gu et al., “Falcon: On-line Monitoring and Steering of Large-Scale Parallel Programs,“Tech. Report GIT-CC-94-21, College of Computing, Georgia Institute of Technology, Atlanta, Ga., 1994.
BethA. Schroeder is a PhD candidate in computer sci- ence at State University of New York at Binghamton. Cur- rent research interests include on-line monitoring, distributed real-time systems, and safety-critical systems. She received an MS in computer sciencefrom Temple Uni- versity in 1991, an MBAfrom the University of La Verne in 1986, and a BSc in computer sciencefrom the University of Southern Mississippi in 1984.
Readers can contact the author via e-mail at beths@cc. ~ 7. D.M. Ogle, K. Schwan, and R. Snodgrass, “Application- gatech.edu
Object-Oriented Application
Frameworks edited by Ted G. Lewis
One of the next major steps in object-oriented design and pro- gramming is framework design and programming. This book addresses the anticipated surge of
interest in what has previously been a little-understood technology and helps the reader understand the subtleties of this new technology. The first part is an introduction to the underlying principles of object- oriented design. The second is a comparative survey of frameworks for personal computers and UNIX workstations. The last part is an illustration of the uses of frameworks. 352 p39g. .Qril 1995. Softcover. ISBN O-13-213984-7.
Catalog # RSOOO25 - $44.00 Makers / $50.00 List
Now Available on IEEE Computer Society On-Line
l This month in Computer: Article Summaries, Binary Critic, Hot Topics, Letters to the Editor, Software Chal- lenges, and Table of Contents (a new option off the main menu)
*Abstracts and tables of contents of Computer Society publications (weeks before publication)
l Conference calendar l Calls for papers l Career opportunities l Volunteer directory l General membership and subscription information *Author guidelines and copyright forms l Computer Society Press Catalog l Staff contact list l Senior/staff manager list l 1994 IEEE fellows
The server is available with a gopher client at info.com- puter.org or a WWW client at http://www. computer.org. For more detailed information, send questions on e-mail to on-line.access@ computer.org.