Embed Size (px)
Citation preview

© Paul J. Lewi, 2006
Version of February 11, 2006
Speaking of Graphics
Chapter 5
Florence Nightingale and Polar Area Diagrams
- 1 -

5.1 Life and work of Nightingale
Figure 5.1. Florence Nightingale portrayed in her early years. (GLC Photo Library).
Florence Nightingale was born in Florence (Italy) in 1820 from a wealthy
family. From early childhood she was bored and frustrated by the
mindless life that was reserved to women of the affluent upper classes in
Victorian times, in shrill contrast to that of the working classes. At the age
of 17 she received a 'call' to devote her entire life to the service of other
people. Later, at the age of 24, she assigned herself the mission to
improve the sanitary conditions in the hospitals. Figure 5.1 shows Florence
in those early years. Initially, her plan to occupy herself with nursing met
with strong opposition of her surroundings. In the Victorian era, nurses
- 2 -

were not trained; they often led a promiscuous life and were treated as
household rather than as belonging to a medical profession.
Notwithstanding these obstacles and with the eventual support of her
father, Florence managed to get some practical training at the
deaconess's hospital of Kaiserswerth in Germany. In the mean time, she
had made acquaintance with Sidney Herbert who later became the
Secretary of War and her lifelong friend and supporter.
Florence Nightingale is generally acknowledged as the founder of the first
training school for nurses. She is also known as 'the lady with the lamp',
an image which has been reinforced by the American poet Henry
Longfellow. He described Florence Nightingale making her way through
six miles of foul-smelling corridors filled with wounded soldiers at the
British army hospital during the Crimean war in 1855. This important
episode in her life and the ‘sanitary reform’ of hospitals that she
subsequently imposed is described in detail in the following chapter.
Florence Nightingale is less well known, however, as the strong and
determined Victorian woman, who from childhood was almost obsessed by
the idea that she should devote her life to the improvement of the living
conditions of poor and needy people, especially those that lay dying in
hospitals from diseases that could be prevented [1]. She dedicated her
entire life to this self-assigned mission. The method she employed was
based on careful observation of the prevailing conditions, on meticulous
drafting of proposals for reform and on skilful organization and
administration.
- 3 -

She can also be rightly considered as one of the pioneers of medical
statistics [2]. Florence Nightingale embraced the ideas of her
contemporary Adolphe Quetelet, the Belgian statistician and founder of
social statistics [3]. She went even further than Quetelet, insisting that
statistics should be used and understood by politicians and officials as a
rational means for decision making. To this effect she designed original
diagrams which illustrated in a dramatic way the needless sacrifice of
human lives and the simple means to prevent it. These diagrams were
published as part of the many reports and proposals that she prepared on
various issues including health care, education, child labor, work houses
and crime.
Florence Nightingale also coined the name of 'applied statistics' which she
introduced into the curriculum of higher education, by exerting her
influence on Francis Galton and Karl Pearson [4]. She pleaded 'for some
teaching how to use statistics in order to legislate for and to administrate
our national life with more precision and experience'. Her objective was
realized shortly after her death when in 1911 Karl Pearson was nominated
as Galton professor of Eugenics in London, where he founded the first
department of applied statistics [5]. The legacy of Florence Nightingale to
the field of statistical diagrams deserves to be discussed in detail. It
exemplifies the use of diagrams as objects of thought and imagination and
as an instrument of the mind. Her significance for future generations
derives also from the dramatic circumstances in which the diagrams were
designed and from the revolutionary effects they have produced.
- 4 -

Florence Nightingale died peacefully at the age of 90 years. Six sergeants
carried her coffin to the grave. The inscription on it reads: F.N. born 1820,
died 1910.
- 5 -

5.2 The Sanitary reform during the Crimean war (1854-1856)
In 1853, at the age of 33, she realized her ambition, finding herself at the
head of a nursing home for ailing ladies in London. In this position,
Florence was able to prove her enormous energy, as well as her talent for
organization and sense for detail. One year later, Great Britain, together
with France and Turkey, declared war on Russia. In September 1854, the
first British troops disembarked on the Crimean peninsula. The conditions
under which the soldiers had to engage in battle were utterly appalling.
Medical supplies, kitchens, shelters and horses were left behind in
Bulgaria for lack of sufficient place on board of the ships that crossed the
Black Sea. Even more disastrous was the organization of the medical
service in Turkey, where the wounded were shipped back to. A large
complex of army barracks at Scutari near Constantinopel consisted of six
miles of filthy corridors and was transformed hastily into a British war
hospital. There were no operating rooms, no kitchens or laundries, and
even the most basic facilities were lacking. Furthermore, there were not
enough doctors and no nurses at all. Most of all, the army bureaucracy
prevented the distribution of supplies of medicines, food, clothing and bed
sheets, which had first to go through a cumbersome process of
registration and inspection. The combination of all these failures soon
resulted in the outbreak of typhus and cholera in the hospital. As a result,
the number of soldiers at Scutari that died from infections and lack of
adequate care was more than six times greater than the death toll from
wounds inflicted on the battle fields. When this news spread in Great
- 6 -

Britain, Florence Nightingale immediately raised to the occasion. Upon the
request of her friend Sidney Herbert, the Secretary of War, she was
commissioned by the British government to depart with 38 voluntary
nurses to the hospital barracks at Scutari. There she arrived in October
1854, but had to wait until March 1855 before the army officers would
allow her and her companions on the wards. In fact, she had to wait until
the military administration of the hospital had broken down completely
under the steady inflow of wounded soldiers. Meanwhile, Nightingale had
managed to organize an independent service and supply system with
private funds and with donations collected by The Times.
- 7 -

5.3 The statistical records of the Sanitary Reform
Florence Nightingale kept meticulous records of the death toll at the
hospital. In the months before she took over from the military, the death
rate at the hospital varied between 32 and 42 percent on an annual basis.
(These figures were obtained by extrapolation of the monthly mortality
values to yearly values.) In January 1855, from the 3,168 soldiers that
died, she counted 2,761 deaths due to preventable or 'mitigable' causes,
mostly cholera, typhus and malnutrition. Only 83 died during that month
from wounds, and 324 lives were lost to other causes. Five months after
the commencement of her sanitary reform, however, the mortality had
reached a level of 2 percent on an annual basis, which was comparable to
that of the army hospitals in and around London. Florence Nightingale
recorded that the overall mortality of the British army fighting in the East
was about two thirds of that in the army back home! [6]. This was the
result of the relentless and innovative efforts of Florence Nightingale and
her team, despite the disapproval and opposition of the military
administration who remembered her best as 'the lady with the hammer'. In
April 1856, the war in the Crimea came to an end and Florence returned to
England where she was acclaimed as a national hero, although haunted
by the memory of the 9,000 soldiers which she had seen dying because of
ignorance, disbelief and stubbornness of the military sanitary service.
With the support of Queen Victoria, an official commission was charged in
1857 with the investigation of the sanitary conditions in the army.
Florence, because of being a woman, was not admitted as a member of
- 8 -

the commission, but she relentlessly kept lobbying for her cause. In 1858
she supplied the commission with reports from her statistical records of
the casualties during the war with Russia, which covered 800 pages [7].
This and subsequent reports were illustrated with colored diagrams of her
own design, called polar area diagrams or 'rose charts'. These were also
referred to as 'coxcombs' by Florence because of their vivid colors and
dented appearance. The polar area diagram is constructed by dividing a
circle in segments or wedges, each representing a particular period of the
year. The full circle covers 12 consecutive months. The area of each
wedge is made proportional to the current mortality in the corresponding
period, i.e., the number of wounded that died in the given period for every
1,000 hospitalized soldiers. The numbers indicated in the wedges of the
diagram are the mortalities in the hospital, extrapolated to an annual basis.
Each of these numbers represents the annual mortality under the
assumption that the rate observed during the corresponding period would
have been the same for the whole year.
- 9 -

5.4 The polar area diagrams
Figure 5.2. Polar area diagram showing the mortality (extrapolated to an annual yearly basis per 1,000 wounded) at the army hospitals at Scutari and Kulali (near Constantinopel) during the Crimean War, from October 1854 to September 1855 [8]. The circular diagram extends over the period of one year. The dotted line indicates the yearly mortality rate in the army hospitals in London around the same time, which was 20.9 per thousand.
The polar area diagram or 'coxcomb' in Fig. 5.2 shows the mortality in the
hospitals at Scutari and Kulali from October 1, 1854, the month of
Nightingale's arrival, until September 30, 1855 [8]. The mortality during the
first period was 192 per 1,000 hospitalized soldiers (on a yearly basis). In
the following period of October-November, the death rate decreased, only
to rise sharply in the four months that followed, reaching a peak value of
- 10 -

427 per 1,000 per annum in February of 1855. The 'commencement of
sanitary improvements' is indicated in the wedge extending from March 18
to April 7. From that time, mortality declined rapidly until it reached a value
of 22 per 1,000, which was almost equal to the average annual mortality of
21 per 1,000 sick in the military hospitals in and near London. The latter
reference level is indicated on the diagram by means of a dashed circle. A
comparison of an actual death rate in the hospital behind the front with the
one in peace time provides a contrast. It shows the difference between an
observed value against a corresponding reference or expected value. In
later chapters on multivariate analysis we will stress the importance of
displaying contrasts in statistical diagrams.
Figure 5.3. Polar area diagrams showing the mortality in the British army in the east from April 1854 to March 1856. Each diagram extends over a period of one year. The dotted line corresponds with the yearly mortality in the city of Manchester around the same time (which amounted to 12.4 per thousand
Figure 5.3 provides another illustration of Nightingale's polar area
diagrams. It shows the overall mortality due to deficient sanitary measures
in the British army in Russia, Bulgaria and Turkey over a period of two
- 11 -

years [8]. The right-hand part of the diagram covers the 12-month period
from April 1854 to March 1855. The dashed circle represents the annual
mortality in Manchester, one of the less healthy cities of England at that
time, which reached a level of 12 per 1,000 inhabitants per year. (Note
that this number is still about half that of the army hospitals around London
as indicated on Fig. 5.2). When the troops reached their gathering points
in Bulgaria, the mortality jumped abruptly to 160 per 1,000 per annum, due
to an epidemic of cholera. After the landing in the Crimea the death rate
of the army reached a peak level of 1,174 per 1,000 in January 1855. This
means that, unless sanitary measures were taken to prevent infections
and malnutrition, the entire British army would have been wiped out after
less than one year by causes that were unrelated to the battle. The effect
of Nightingale's reform shows clearly from March 1855 onwards in the left-
hand part of the diagram. This covers the period of sanitary reform from
April 1855 to the end of the war. At that point the annual mortality in the
army at the front is comparable to that of the city of Manchester. Again,
Florence Nightingale took care to display contrasts in the data by
comparing observed values with an appropriate reference value. The
display of contrasts in statistical diagrams enhances their quality to a large
extent.
The polar area diagrams were published in the form of pamphlets and
were distributed to influential politicians. As a result, several sub-
commissions were set up in order to implement the reforms in the army
hospitals proposed by Nightingale in order to obtain the same life-saving
effect during peace time as the one she witnessed during the war. There is
no doubt that the innovative diagrams designed by Florence Nightingale
produced the necessary change in the minds of those who held political
- 12 -

power to alter the course of history. It is difficult, however, to fully
appreciate the courage and endurance of a woman who saved the life of
so many, almost single-handedly and against all odds, against Victorian
tradition, ignorant bureaucracy and military stubbornness.
After her pioneering reform of the military sanitary services in Britain,
Florence Nightingale became invalided by a mysterious, perhaps neurotic,
condition that kept her homebound for most of the time [10]. Nevertheless,
she kept on fighting for the noble cause that she had assumed at the age
of 17 and for which she had refused several proposals for marriage. She
subsequently founded the Nightingale Training School for Nurses, started
a reform of the sanitary conditions in the British army in India, initiated a
reform of the poor houses and studied the causes of mortality at child
birth.(Ignaz Semmelweis had published a similar far-reaching study in the
maternity hospitals of Vienna in 1861, some six years earlier [9]). She also
campaigned for a long-term relief of famine in India by proposing the
construction of irrigation works.
One would wish to have a person such as Nightingale in our own troubled
times, endowed with such wisdom, courage and humility. Karl Pearson
recollected: 'To understand God's thoughts, she held we must study
statistics, for these are the measures of His purpose. Thus the study of
statistics was for her a religious duty.' [11].
- 13 -

5.5 The significance of the Sanitary Reform
In what follows, we return to the polar area diagram (or coxcomb) of Fig.
5.2 that we will examine in somewhat more detail. From a medical-
statistical point of view, this diagram can be regarded as a report on a
large-scale, long-term open clinical trial, designed, conducted and
analyzed by Nightingale. The treatment which is studied here comprises a
sanitary reform of the army hospitals and included washing, clothing,
laundering, nutrition, medication, general sanitation of the building and
other measures which now appear as obvious and elementary. How would
a clinical statistician handle such a study today? First, one has to decide
upon a suitable effect parameter. Nightingale converted her data into
annual mortality values for each period of observation. This seems to be a
good choice because it allows comparing data from periods of unequal
length and provides a comparison with other demographic data. The next
step is to define control values with which the size of the effect of
treatment can be compared. Basically, there are two types of comparison.
First, one may compare the values obtained after initiation of treatment
with comparable base line values observed before treatment. The average
mortality in the period preceding the sanitary improvements amounted to
239 per 1,000 per annum, against a final value of 22 per thousand, which
corresponds with a reduction of the annual mortality by 91 percent. This
assumes, however, that conditions before and after treatment were more
or less the same. In a modern approach one would have to account for
factors that may have biased the outcome of the study, such as the intake
of wounded and sick soldiers in the hospital, the duration of their stay
- 14 -

before their dismissal or death, the proportions of those that died from
preventable causes, the conditions at the front, the climate, the age and
experience of the soldiers, etcetera. One should also consider the possible
interactions between these factors. For example, younger soldiers may be
more resistant to infections while more experienced ones have a better
chance of avoiding serious wounding. In Nightingale's days, however, one
did not possess the sophisticated modeling techniques, such as the
analysis of variance and covariance that are available to the modern
statistician. As a result one could only look at the overall effect at the
expense of neglecting the various sources of variation and their possible
interactions.
A second type of comparison involves randomization of subjects over a
treatment and a control group. This would require concurrent observations
in a comparable hospital (or ward) in which no sanitary reform was
imposed, and that wounded and sick soldiers are sent at random to either
of the two hospitals. This would have prevented that the outcome was
biased by the fact that the more serious cases were sent systematically to
one of them. Semmelweis in his study of 1874 on deaths resulting from
child birth fever was able to make a comparison between two hospital
wards, one in which women were visited by doctors who previously had
conducted autopsies, and one in which only midwives attended to the
patients. His conclusions were severely rebutted, nevertheless, and his
recommendations for washing and disinfection were only implemented
after his death [9]. This was not a designed experiment either. Allocation
of patients to the two obstetrical wards was not random as it depended on
social class and other factors. For lack of randomization and absence of
an independent control, Nightingale presented mortality figures from the
- 15 -

army hospitals in London for the same period. One would expect that
hospital mortality at the front would be substantially larger than at home,
assuming that sanitary conditions are comparable Surprisingly, it is found
that the two rates are almost identical (22 and 21 per thousand per
annum), which strongly suggests a beneficial effect of her reform
Nightingale's report would meet today with as much criticism as it was in
her own time, but for different reasons. A modern statistician would
determine the statistical significance of Nightingale's finding. This requires
the calculation of the probability that her observations could have been
due to chance alone in the absence of a real effect of treatment. (For
reasons that no one seems to remember well, this probability must at least
be smaller than 0.05 [12]) The objective of statistical testing is to prevent
self-deception and wishful thinking, on the one hand, as well as the
unwarranted rejection of a useful finding on the other hand. On purely
statistical ground, the main objection would be directed at the lack of
randomization. One may argue that there was no proper basis for
comparison of the result of the sanitary reform with a reference situation,
and that possible sources of bias have not been controlled. In defense of
Nightingale one can say that, in her time, the calculus of probabilities was
only in its beginning. In fact, it was Nightingale who insisted with Francis
Galton, that statistics would be made a part of university curricula. This
had a great influence on Karl Pearson, who occupied the Galton chair at
the University College in London, and his successors Ronald Fisher and
Egon Pearson. The latter, together with Jerzy Neyman, founded the basis
of modern hypothesis testing [13]. Apart from the statistical significance,
there can be no doubt about the clinical relevance of Nightingale's reform.
The importance of her observations has been strengthened by her
- 16 -

relentless direct involvement, her ability for keen and careful observation
and her immense care for detail. One must therefore consider the polar
area diagram in the light of her detailed reports to the commission which
eventually implemented her plans.
- 17 -

5.6 The records of the Sanitary Reform revisited
Table 5.1. Data, measurements and computed quantities from the 'Diagram representing the mortality in the hospitals at Scutari and Kulali, from October 1st 1854 to September 30th 1855'. The values between brackets in the last two columns have been computed under the assumption that period 6 ended on February 24, or that the last period 7 started on March 1. These recalculations have been performed in order to account for an overlap of 4 days between the last two periods.
In Table 5.1 we have compiled the number of days (d) of each period
preceding the reform and the annual mortality (m) in those periods as
indicated on Fig. 5.2. Additionally, we provide measurements of the cord
length (l) and radius (r) of the corresponding wedges. (The radius has
been determined in the middle of each segment.) It appears that the last
period in the table overlaps with the preceding one by four days. Either the
last period should have started on March 1 instead of February 25, or the
preceding one should have ended on February 24 instead of 28 as
indicated. The alternative values for the two contingencies are indicated
between brackets in the table. At the same time we have added some
derived quantities such as the current mortality (mc) in each period, which
- 18 -

can be computed from the annual mortality (m) and the corresponding
number of days (d):
mc = md
365
The angle (a) subtended by a wedge is determined for the cord length (c)
and radius (r) by means of:
d ≅ α = 2 arc sinc
2r
where the symbol ≡ indicates proportionality. If the angles of the wedges
are truly proportional to the lengths of the corresponding periods (d) as
stated above, then we must obtain that the ratio of subtended arc to cord
length (a/d) is a constant, or at least approximately so. From Table 1 we
obtain that a/d ranges from .015 to .018 with a median value of .017. Next,
we derived the area (A) of the wedges from the angle (a) and radius (r)
from the formula:
mc ≅ A = 12αr2
If the areas are truly proportional to the computed current mortality (mc) in
the corresponding period, then we must obtain that their ratio (A/mc) is
constant, or nearly so. The values of A/mc in Table 1 range from 1.11 to
1.39 with a median of 1.33. Clearly the A/mc ratio of 1.11 in the last period
is an outlier, while the corresponding value of 1.38 within brackets is more
plausible. This indicates that the wedge area for the last period is based
upon the mortality during a period of 17 days and not of 21 days as one
- 19 -

would assume from the dates in Fig. 5.2. The angle subtended by the
wedge, on the other hand, is based on a time span of 21 days. This
follows from the a/d ratio of .015 which is consistent with the other data,
and from the ratio of .021 for the shorter period of 17 days which is not.
Similar arguments can be used to show that the dates in the penultimate
column of Table 1 are correct and, hence, that the error must reside in
those of the last one. It seems plausible therefore that Nightingale has
produced the correct mortality data, but that an inconsistency slipped
through during their graphical transformation. Notwithstanding this, we can
only admire the overall design and clarity of the polar area diagrams, as
well as the craftsmanship of the lithographic technique.
- 20 -
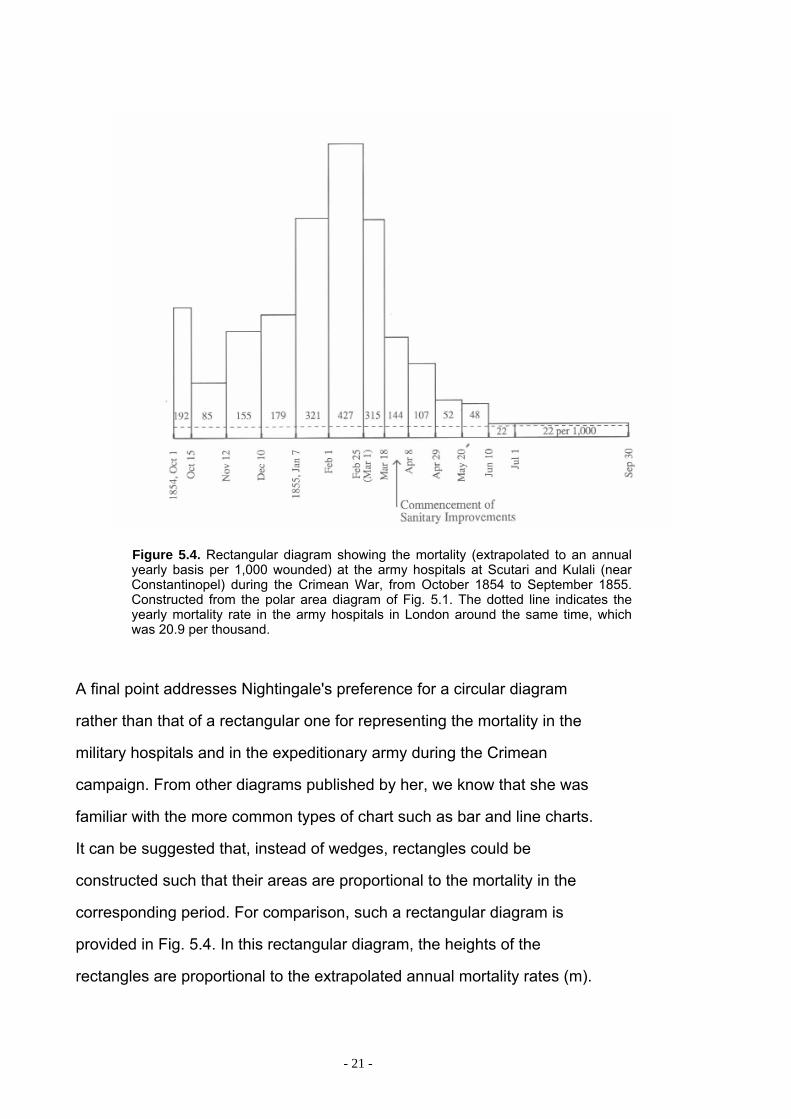
Figure 5.4. Rectangular diagram showing the mortality (extrapolated to an annual yearly basis per 1,000 wounded) at the army hospitals at Scutari and Kulali (near Constantinopel) during the Crimean War, from October 1854 to September 1855. Constructed from the polar area diagram of Fig. 5.1. The dotted line indicates the yearly mortality rate in the army hospitals in London around the same time, which was 20.9 per thousand.
A final point addresses Nightingale's preference for a circular diagram
rather than that of a rectangular one for representing the mortality in the
military hospitals and in the expeditionary army during the Crimean
campaign. From other diagrams published by her, we know that she was
familiar with the more common types of chart such as bar and line charts.
It can be suggested that, instead of wedges, rectangles could be
constructed such that their areas are proportional to the mortality in the
corresponding period. For comparison, such a rectangular diagram is
provided in Fig. 5.4. In this rectangular diagram, the heights of the
rectangles are proportional to the extrapolated annual mortality rates (m).
- 21 -

In the polar area diagram, the radiuses of the wedges (r) are proportional
to the square root of the annual mortality rates (m). Implicitly, Nightingale
has performed a square root transformation of her data [14]. This follows
from the construction of the diagram which is such that wedge area (A) is
proportional to current mortality (mc), and such that length (a/c) is
proportional to the number of days (d) in the period. From the formulas
defined above one can derive that:
12αr2 = A ≅ mc = m
d365
and since a ≡ d, we obtain that m ≡ r2 .
This can be verified by comparing the radiuses (r) with the corresponding
annual mortalities (m) as listed in Table 1. For example we consider the
second and sixth periods. One finds that the ratio of the radiuses (r) is
equal to the ratio of the square roots of the annual mortalities (m):
13.42
6.0 =
42785
= 2.24
within the limits of precision of our graphical determination.
The effect is similar to that of the logarithmic transformation which we will
discuss in a later section. This way, small values are given more emphasis
at the expense of the larger ones. Observational errors also appear more
homogeneous on a square root and logarithmic scale. Both the circular
and rectangular diagrams show the excess mortality (in terms of the
number of deaths (m) that could have been prevented in the given period)
by looking at the areas above the dotted reference line.
- 22 -

The choice of a full circle to represent the course of one year was also a
fortunate one. It is easily associated with the annual movement of the
earth around the sun. This way, the diagram relates to the progression of
time and the periodic recurrence of the seasons. In the case when events
are spread out over several years, such as the Crimean war which lasted
somewhat less than two years, the years can be more easily compared
with each other, especially for the detection of seasonal contrasts.
Nightingale invented her 'coxcombs' for the purpose of communication and
for persuasion of people that were contemporary with the events that are
described by it. She was lobbying for her hospital reform. The audience
she had in mind was the health commission and the government of her
time, rather than the historian and statistician of today. It is difficult, of
course, for us now to apprehend the emotional impact created then by
these diagrams that reminded people of senseless killing and death. This
indicates that the quality of a diagram cannot be fully appreciated without
also considering the historical, social and economical context from which it
arose. As such, diagrams can be witting or unwitting testimonies from the
past and one must ask for whom they were intended, for what purpose
they were produced and under what circumstances they were used [15].
- 23 -
5.7 The statistical legacy of Nightingale
We undertook our reanalysis of Nightingale's coxcomb in order to better
understand the data and its way of representation rather than to search for
possible defects. Reanalysis and reconstruction of important historical
data are excellent means for acquainting oneself with the issues of a
seemingly distinct past. Such exercises are not only a form of statistical
archeology, but they may illuminate some of our present day problems.
The message from Nightingale's work is that one should collect data on
relevant issues diligently and carefully, and, if feasible, involve oneself
passionately in this process. One should also try to find novel and
imaginative ways for presenting the results and conclusions of the data.
The effects of Nightingale's lifelong commitment still affect the organization
of hospitals, the training of nurses and the recording of medical data and
the field of statistics itself. Her approach can be applied equally well to the
threats that weigh upon our own lives today, such as the AIDS pandemic,
global pollution, poverty, the threat of nuclear conflict, drug abuse,
religious fanaticism and much more. It requires, however, more than a
casual and distant relationship with statistical data. It probably demands
the sacrifice and dedication of the best part if not all of one's active life. In
this respect, Florence Nightingale serves as a role model for the
practitioner of statistics.
- 24 -
Notes [1] An abundantly illustrated biography of Florence Nightingale has been written by: Pam Brown, Florence Nightingale. Exley Publ., Watford, UK, 1988. [2] Her contribution to the design of statistical diagrams is recognized by: H. Osborne (Ed.), The Oxford Companion to the decorative Arts. Clarendon Press, Oxford, 1975, pp. 293-297. and more recently by: Peter Wildbur, Information Graphics. Trefoil Publ., London, 1989. [3] (Lambert) Adolphe Jacques Quetelet (1796-1874), Belgian mathematician, astronomer and meteorologist. In 1823 he studied during three months in Paris with Pierre Simon de Laplace and others, in view of a new observatory that was to be constructed. This left a profound mark which directed Quetelet to the application of statistics to the social sciences, especially in population research (births, deaths, marriages, crime, diseases, poverty, etc.), although August Comte, the founder of sociology, rejected the idea. The concept of an Average Man is due to Quetelet. The inconsiderate application of statistics to the human sciences has been called Quetelismus, especially the (often unwarranted) assumption that observations are normally distributed. The correspondence between Nightingale and Quetelet has been reprinted in: Marion Diamond and Mervyn Stone, Nightingale and Quetelet. Journal of the Royal Stat. Soc. (A), 144, 66-79, 176-213, 323-351, 1981. For more details one should consult : Stephen M. Stigler, The History of Statistics. The Measurement of Uncertainty before 1900. The Belknap Press of Harvard Univ. Press, Cambridge, Mass., 1986. [4] Robert V. Hogg. How to cope with statistics. Journal of the Amer. Stat. Ass. (JASA), 84, 1-5, 1989. Florence Nightingale wrote a letter to Francis Galton in 1891 on the subject of a professorship in statistics, where she mentioned problems concerning food, education, child labor, crime, workhouses and other troubles. By means of a donation by Galton, the chain of Eugenics was created in 1911 at Unversity College in London, which was first occupied by Karl Pearson. [5] Egon S. Pearson, Karl Pearson, An Appreciation of some Aspects of his Life and Work. Cambridge Univ. Press, Cambridge, Engl., 1938. When Karl Pearson retired in 1933, the department of 'applied statistics' was split into eugenics (directed by Ronald A. Fisher) and biometrics (headed by his son Egon Pearson). [6] Bernard I. Cohen, Florence Nightingale. Scient. American, 250, 128-137, 1984.
- 25 -

[7] Florence Nightingale, Notes on Matters affecting the Health, Efficiency and Hospital Administration of the British Army. 1858. [8] Florence Nightingale, A Contribution to the sanitary History of the British Army during the late War with Russia. Harrison and Sons, London, 1859. J.W. Parker and Sons, London, 1859. [9] Ignaz Philipp Semmelweis, The Etiology, the Concept and the Prophylaxis of Childbed Fever. Medical Classics, 5, 357, 1941 Translated from the original text: Die Aetiologie und die Prophylaxis des Kindbettfievers. 1861. The story is poignantly described by: Adrienne Rich, Of Women born. W.W. Norton, New York, 1976. Although there is a remarkable parallel between Semmelweis and Nightingale, the latter failed to recognize the importance of communicable pathogens in infectious diseases. [10] It is also possible that her condition was the result of an intense desire to concentrate her efforts on intellectual and organizational work, rather than to waste time on public appearances. Such a condition has been referred to as 'creative malady'. A parallel can be found in Descartes' habit of not rising before noon, and doing most of his thinking in bed. He developed the habit in his youth at the college of La Flèche, where he was allowed to stay in bed because of ill health. In later life, he continued to do so because he found the practice very convenient for his work. [11] Quoted by Robert V. Hogg, How to cope with statistics. Opus cit. [12] Alvan Feinstein, Clinical Biostatics. C.V. Mosby, Saint Louis, 1977. The magic number of 0.05 (5 %) for the level of significance seems to have been suggested first by Ronald A. Fisher, and has been followed rather uncritically by statistical practitioners since then, according to: Mainland D., Elementary medical Statistics. Saunders, Philadelphia, 1964, pp. 220 and 330. In a leading textbook on statistical theory, the use of an arbitrary level of significance is avoided, because it can be misleading: Maurice G. Kendall and Alan Stuart, The advanced Theory of Statistics. Ch. Griffin, London, 1963. [13] G.S. Watson, Hypothesis Testing. In: Encyclopedia of Statistical Sciences. (S. Kotz and L. Johnson, Eds.), Vol. 3, J. Wiley, New York, 1983, pp. 712-722. [14] If the incidence of mortality had been small with respect to the large hospital population, the square root transformation would have been the best choice from a purely statistical point of view. In this case the data can be thought to follow a Poisson distribution and sampling errors on individual observations are homogeneous on the square root scale.
- 26 -

[15] The subject of 'witting and unwitting' testimonies in historical research is discussed by: Arthur Marwick, Arts Foundation Course A102. The Open University, Milton Keynes, Engl., 1991.
- 27 -

Biographical Notes 1820 Florence Nightingale is born in Florence, Italy. 1837 'Call' to devote her life to the service of the helpless. 1844 Decision to concentrate her efforts entirely to the improvement of
prevailing conditions in the hospitals. 1847 Encounter in Rome with Sidney Herbert, the future Secretary of
War, and start of a lifelong friendship and co-operation. 1854 Declaration of war to Russia by Great Britain, France and Turkey
(August). Landing of allied troops in the Crimea (September). Florence is commissioned by Sidney Herbert to the army hospital at Scutari in Turkey, in charge of 38 nurses (October).
1855 Commencement of sanitary improvements at Scutari (March). 1856 End of the Crimean war (April) and return of Florence to England
(July). 1857 Installation of the commission for the reform of the hospital system
in the British army. 1860 Foundation of the Nightingale Training School for Nurses. 1864 Start of reform of the poor houses. 1867 Statistical study of mortality at child birth. 1876 Proposals for community nursing. 1877 Proposals for long term relief of famine in India. 1901 Florence becomes blind. 1910 Florence Nightingale dies peacefully. She is buried at Embley,
Hampshire, near to her ancestral house. _________________________________
- 28 -

- 29 -


![FULLTEXT01[1] Sog Si Review](https://img.pdfslide.net/doc/110x75/55340ef25503464f7d8b4a5b/fulltext011-sog-si-review.jpg)