Embed Size (px)
Citation preview

$ $ $ $ $ $ $ $ $ $ $ $ $ $ $ $ $ $ $ $$ $ $ $ $ $ $ $ $ $ $ $ $ $ $ $ $ $ $ $$ $ $ $ $ $ $ $ $ $ $ $ $ $ $ $ $ $ $ $$ $ $ $ $ $ $ $ $ $ $ $ $ $ $ $ $ $ $ $$ $ $ $ $ $ $ $ $ $ $ $ $ $ $ $ $ $ $ $$ $ $ $ $ $ $ $ $ $ $ $ $ $ $ $ $ $ $ $$ $ $ $ $ $ $ $ $ $ $ $ $ $ $ $ $ $ $ $$ $ $ $ $ $ $ $ $ $ $ $ $ $ $ $ $ $ $ $$ $ $ $ $ $ $ $ $ $ $ $ $ $ $ $ $ $ $ $

Paying for the Boomer’s Healthcare: SHOW ME THE MONEY!
4th Annual Health Policy ForumSt. Louis, MissouriOctober 19, 2006
Signature
Healthcare Foundation

$ $ $ $ $ $ $ $ $ $ $ $ $ $ $ $ $ $ $ $$ $ $ $ $ $ $ $ $ $ $ $ $ $ $ $ $ $ $ $$ $ $ $ $ $ $ $ $ $ $ $ $ $ $ $ $ $ $ $$ $ $ $ $ $ $ $ $ $ $ $ $ $ $ $ $ $ $ $$ $ $ $ $ $ $ $ $ $ $ $ $ $ $ $ $ $ $ $$ $ $ $ $ $ $ $ $ $ $ $ $ $ $ $ $ $ $ $$ $ $ $ $ $ $ $ $ $ $ $ $ $ $ $ $ $ $ $$ $ $ $ $ $ $ $ $ $ $ $ $ $ $ $ $ $ $ $$ $ $ $ $ $ $ $ $ $ $ $ $ $ $ $ $ $ $ $

$ $ $ $ $ $ $ $ $ $ $ $ $ $ $ $ $ $ $ $$ $ $ $ PAY ME NOWPAY ME NOW $ $ $ $ $ $ $ $ $ $ $ OR PAY ME LATEROR PAY ME LATER $ $ $ $ $ $ $ $ $ $ $ $ $ $ $ $ $ $ $ $ $ $ $ $ $ $ $ $ $ $ $ $ $ $ $ $ $ $ $ $ $ $ $ $ $ $ $ $ $ $ ISSUES INISSUES IN $ $ $ $ $ $ $ $ $ HEALTH CARE SPENDINGHEALTH CARE SPENDING $ $ $ $ $ $ $ $ $ $ $ $ $ $ $ $ $ $ $ $ $ $$ $ $ $ $ $ $ $ $ $ $ $ $ $ $ $ $ $ $ $ $ $ $ $ $ $ $ $ $ $ $ $ $ $ $ $ $ $ $ $

$ $ $ $ $ $ $ $ $ $ $ $ $ $ $ $ $ $ $ $$ $ $ $ $ $ $ $ $ $ $ $ $ $ $ $ $ $ $ $$ $ $ $ $ $ $ $ $ $ $ $ $ $ $ $ $ $ $ $$ $ $ $ $ $ $ $ $ $ $ $ $ $ $ $ $ $ $ $$ $ $ $ $ $ $ $ $ $ $ $ $ $ $ $ $ $ $ $$ $ $ $ $ $ $ $ $ $ $ $ $ $ $ $ $ $ $ $$ $ $ $ $ $ $ $ $ $ $ $ $ $ $ $ $ $ $ $$ $ $ $ $ $ $ $ $ $ $ $ $ $ $ $ $ $ $ $$ $ $ $ $ $ $ $ $ $ $ $ $ $ $ $ $ $ $ $
BoomerJohn Rother
DirectorPolicy & Strategy

BoomerJohn Rother
DirectorPolicy & Strategy


Changing Demographics
over 65under 65
1906
Age 65+ population 4% of nation

Changing Demographics
over 65under 65
TODAY
Age 65+ population has tripled
(12%)
Changing Demographics
over 65under 65
2030
Age 65+ population will double again

Boomer
Percentage of Total Population Age 50+
% Age 50+
% Age 65+
% Age 85+0%
5%
10%
15%
20%
25%
30%
35%
40%
% Age 50+
% Age 65+
% Age 85+
Source: U.S. Census Bureau, middle series projections and historical data, U.S.
People over 65
1900-1 in 252006-1 in 82030-1 in 5
50+
65+
85+
2006
We are here
As a result of size and longevity, MORE boomers will draw entitlements LONGER
Will these changes have a profound, “unsustainable” impact on the federal budget by pushing a rapid growth in federal spending for health and retirement benefits for older Americans?

Standard measure to gauge size and growth of entitlement spending is its ratio in any year to the Gross Domestic Product (GDP)
How do we measureentitlement spending?
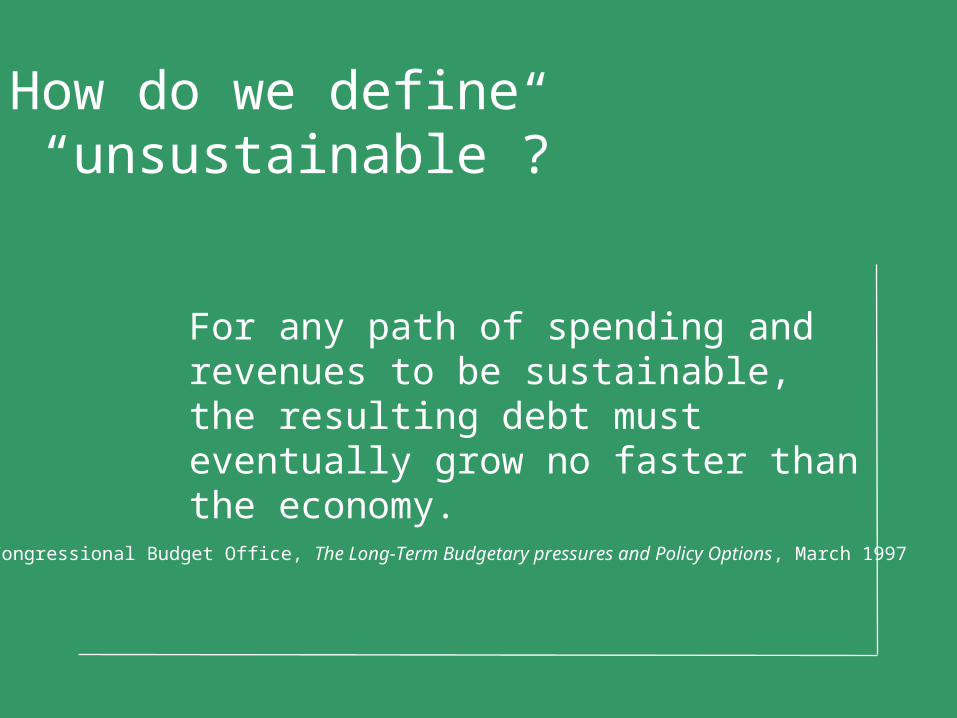
For any path of spending and revenues to be sustainable, the resulting debt must eventually grow no faster than the economy.
How do we define “unsustainable”?
Congressional Budget Office, The Long-Term Budgetary pressures and Policy Options, March 1997

What are the categories of entitlements?
The top 10 . . .

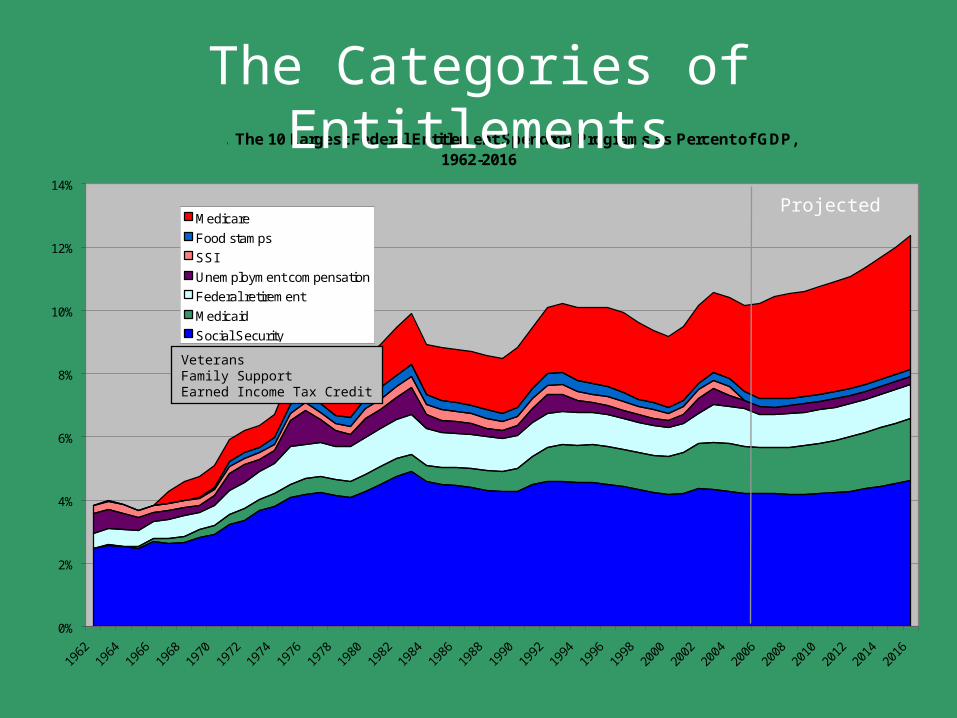
Figure 4. The 10 Largest Federal Entitlement Spending Programs as Percent of GDP, 1962-2016
0%
2%
4%
6%
8%
10%
12%
14%
1962
1964
1966
1968
1970
1972
1974
1976
1978
1980
1982
1984
1986
1988
1990
1992
1994
1996
1998
2000
2002
2004
2006
2008
2010
2012
2014
2016
Medicare
Food stamps
SSI
Unemployment compensation
Federal retirement
Medicaid
Social Security
Source: Congressional Budget Office, The Budget and Economic Outlook, Fiscal Years 2007 to 2016 , Appendix F, Historical Budget Data
Projected
The Categories of Entitlements
VeteransFamily SupportEarned Income Tax Credit


Figure 3. Ten Largest Spending Entitlements in Billions of 2005 Dollars and as Percent of All Spending Entitlements, 2005
$517
$325
$186
$103
$48
$39
$35
$33
$32
$25
38.5%
24.2%
13.8%
7.7%
3.6%
2.9%
2.6%
2.5%
2.4%
1.9%
$0 $100 $200 $300 $400 $500 $600
Social Security
Medicare
Medicaid
Federal retirement (civ. and mil.)
Earned Income Tax Credit
SSI
Veterans/ benefits
Unemployment compensation
Food stamps
Family support
Source: Congressional Budget Office, The Budget and Economic Outlook, Fiscal Years 2007 to 2016, Appendix F, Historical Budget Data
2005 Entitlement Spending
Social Security
Medicare
Medicaid
Federal Retirement – civilian and military
Earned Income Tax Credit
SSI
Veterans Benefits
Unemployment Compensation
Food Stamps
Family Support

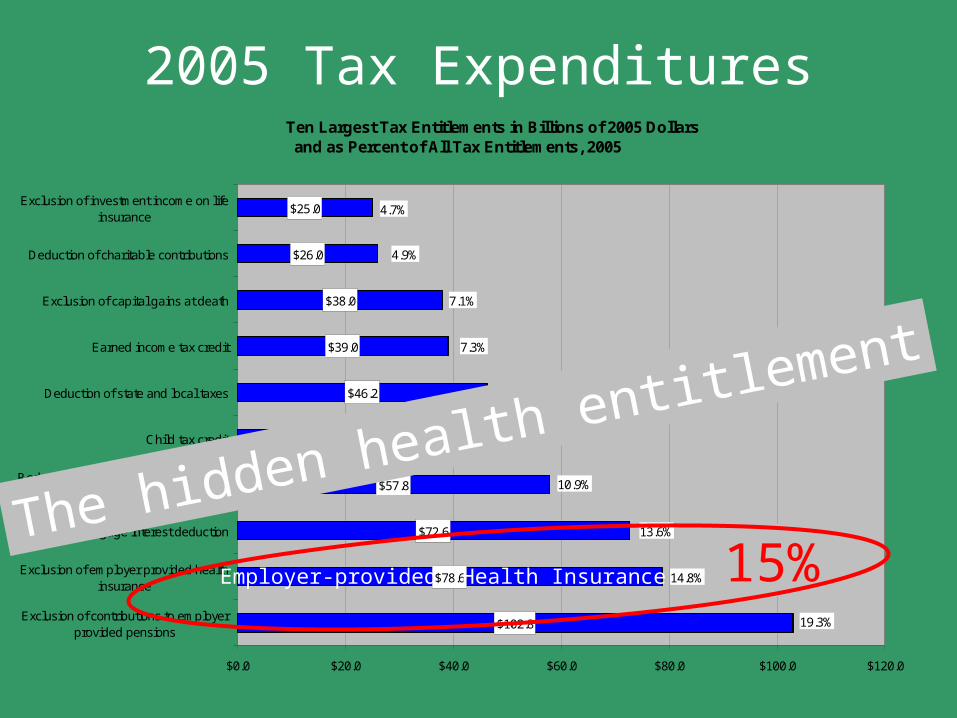
Figure 6. Ten Largest Tax Entitlements in Billions of 2005 Dollars and as Percent of All Tax Entitlements, 2005
$102.8
$78.6
$72.6
$57.8
$46.6
$46.2
$39.0
$38.0
$26.0
$25.0
19.3%
14.8%
13.6%
10.9%
8.7%
8.7%
7.3%
7.1%
4.9%
4.7%
$0.0 $20.0 $40.0 $60.0 $80.0 $100.0 $120.0
Exclusion of contributions to employerprovided pensions
Exclusion of employer provided healthinsurance
Mortgage interest deduction
Reduced rates of tax on dividends andcapital gains
Child tax credit
Deduction of state and local taxes
Earned income tax credit
Exclusion of capital gains at death
Deduction of charitable contributions
Exclusion of investment income on lifeinsurance
Source: U. S. Congress, Joint Committee on Taxation, Estimates of Federal Tax Expenditures for Fiscal Years 2006-2010 .
2005 Tax Expenditures
Employer-provided Health Insurance
The hidden health entitlement
15%

Demography misses much of the story.
What are the driversof entitlement spending?
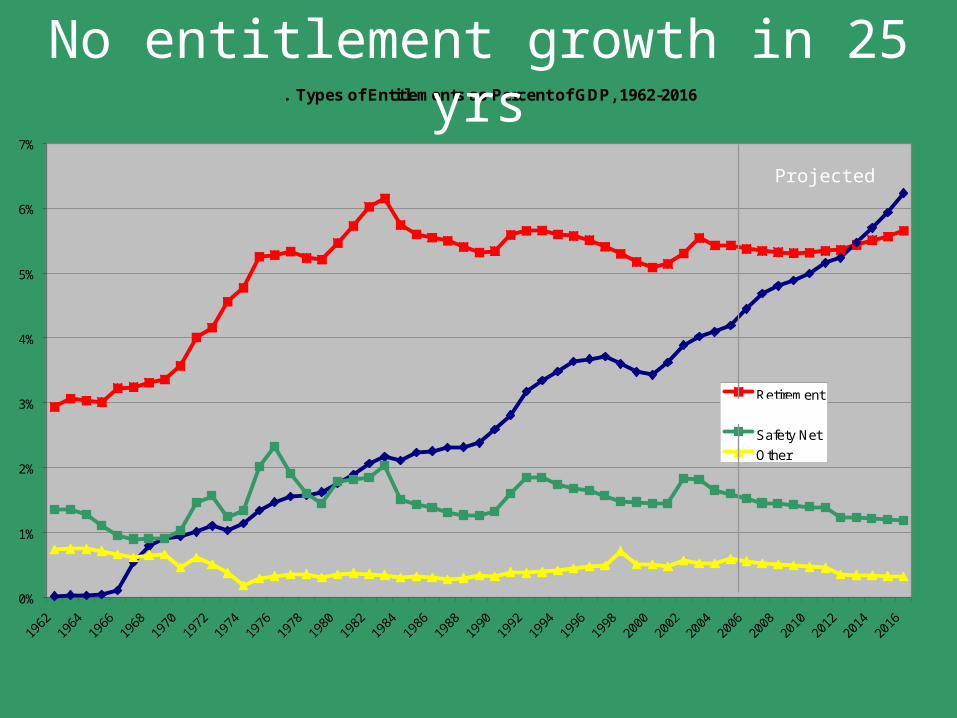
Figure 8. Types of Entitlements as Percent of GDP, 1962-2016
0%
1%
2%
3%
4%
5%
6%
7%
1962
1964
1966
1968
1970
1972
1974
1976
1978
1980
1982
1984
1986
1988
1990
1992
1994
1996
1998
2000
2002
2004
2006
2008
2010
2012
2014
2016
Retirement
Health
Safety Net
Other
Source: Congressional Budget Office, The Budget and Economic Outlook, Fiscal Years 2007 to 2016, Appendix F , Historical Budget Data
Projected
No entitlement growth in 25 yrs
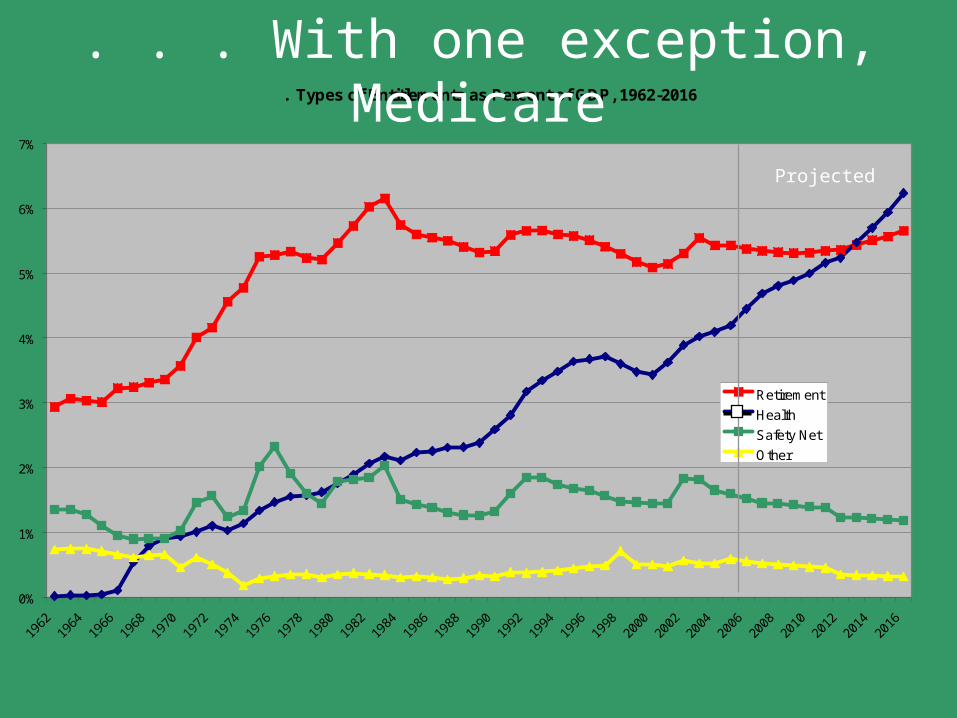
Figure 8. Types of Entitlements as Percent of GDP, 1962-2016
0%
1%
2%
3%
4%
5%
6%
7%
1962
1964
1966
1968
1970
1972
1974
1976
1978
1980
1982
1984
1986
1988
1990
1992
1994
1996
1998
2000
2002
2004
2006
2008
2010
2012
2014
2016
Retirement
Health
Safety Net
Other
Source: Congressional Budget Office, The Budget and Economic Outlook, Fiscal Years 2007 to 2016, Appendix F , Historical Budget Data
. . . With one exception, Medicare
Projected

Interestingly, it does not . . .
Does aging explain the rapidgrowth in federal health spending?

Figure 10. Mean Expenditures Per Person for Acute and Long-Term Care From Age 65 Until Death, by Age at Death
0
50,000
100,000
150,000
200,000
250,000
300,000
350,000
400,000
450,000
65 70 75 80 85 90 95 100 >101Age at Death
Exp
end
itu
res
per
per
son
($)
All services
Medicare-covered services plus cost-sharing
Nursing home care
Home care
Prescription drugs
Other services
Spillman and Lubitz, "The Effect of Longevity on Spending for Acute and Long-Term Care," New England Journal of Medicine , Vol. 342 (19) 1409-15, 2000.
Per person Medicare expenditures do not rise with age
Mean Expenditures Per Person for Acute and Long-Term Care From Age 65 Until Death by Age at Death
Medicare

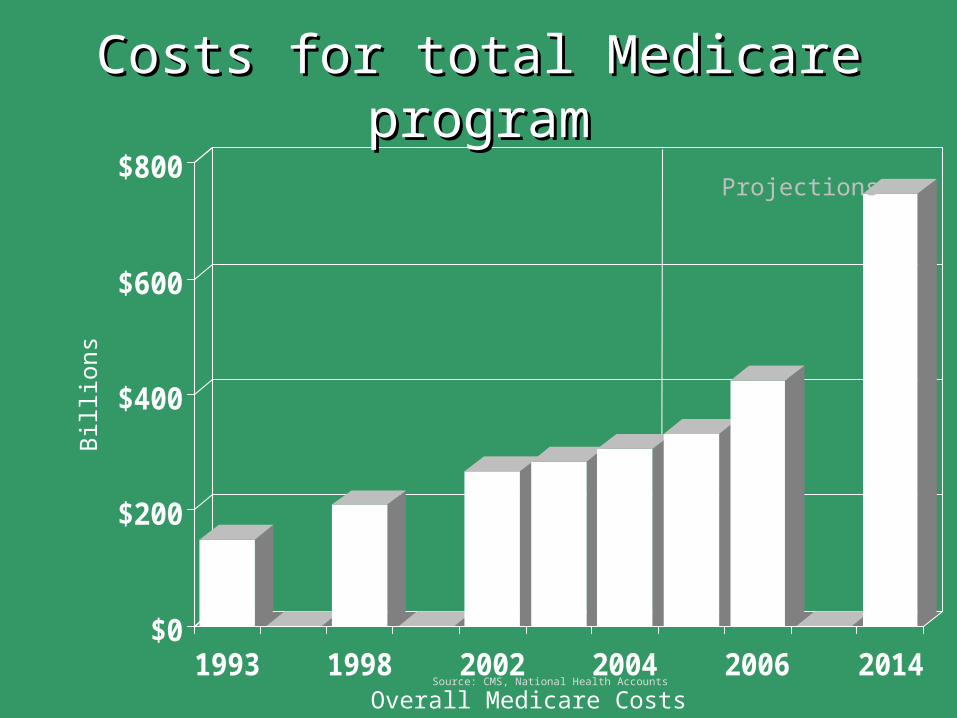
$0
$200
$400
$600
$800
1993 1998 2002 2004 2006 2014
Costs for total Medicare programCosts for total Medicare programB
illio
ns
Overall Medicare Costs
Projections
Source: CMS, National Health Accounts
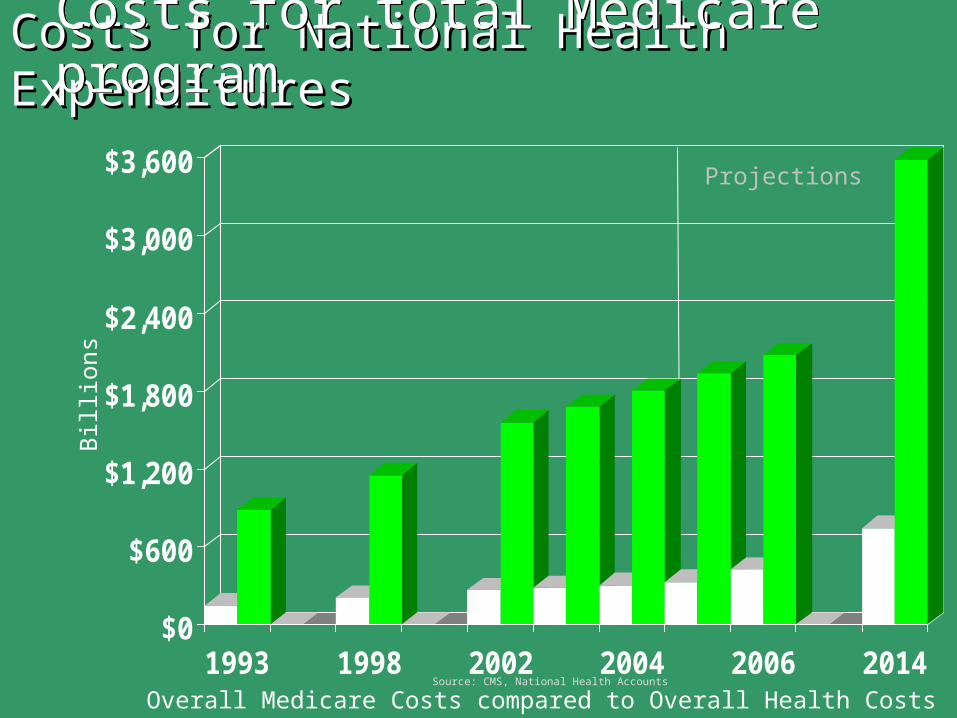
Costs for National Health ExpendituresCosts for National Health Expenditures
$0
$600
$1,200
$1,800
$2,400
$3,000
$3,600
1993 1998 2002 2004 2006 2014
Bill
ions
Overall Medicare Costs compared to Overall Health CostsSource: CMS, National Health Accounts
Projections
Costs for total Medicare programCosts for total Medicare program

Is the rise in national health spending due to health entitlements?
No . . .

Figure 11. Average Annual Change in Per Enrollee Medicare Spending and Private Health Insurance Premiums (for Common Benefits), 1969-2004
10.1%
15.2%
14.4%
6.2%
7.2%
4.1%
5.8%
12.7%
15.7%
12.0%
10.6%
7.9%
3.5%
8.8%
0.0%
2.0%
4.0%
6.0%
8.0%
10.0%
12.0%
14.0%
16.0%
18.0%
1970-1974 1975-1979 1980-1984 1985-1989 1990-1994 1995-1999 2000-2004
Year
Ave
rag
e A
nn
ual
Ch
ang
e in
Per
En
roll
ee S
pen
din
g MedicarePrivate Health Insurance
Note: Annual change is calculated from previous year. Common benefits refers to benefits commonly covered by Medicare and Private Health Insurance. These benefits are hospital services, physician and clinical services, other professional services and durable medical products.Source: Centers for Medicare and Medicaid Services, Office of the Actuary, National Health Statistics Group, Table 13 at http://www.cms.hhs.gov/NationalHealthExpendData/downloads/tables.pdf.
Medicare spending increased less than private sector
✔✔✔
✔✔

What’s driving up health costs??
Healthcareby service sectors . . .

If costs rose equally in every sector, the distribution of increases by sector of total National Health Expenditures 1995 to 2004 would look like this: Hospital Care
Physician and Clinical Services
Dental Services
Other Prof. Services
Home Health Care
Other Non-Durable Medical Products
Rx Drugs
Durable Medical Equipment
Nursing Home Care
Other Personal Health Care
Admin. & Net Cost of Priv. HealthInsurancePublic Health Activity
Research
Structures & Equipment

Health cost increases in 10 years (1995-04) due to 4 major sectors:
4.3%
14.9%
0.9%
4.8%
3.5%
9.1%
2.9%
2.4% 4.3%
0.8%2.8%1.5%
26.8%
20.9%
Hospital Care
Physician and Clinical Services
Dental Services
Other Prof. Services
Home Health Care
Other Non-Durable Medical Products
Rx Drugs
Durable Medical Equipment
Nursing Home Care
Other Personal Health Care
Admin. & Net Cost of Priv. HealthInsurancePublic Health Activity
Research
Structures & Equipment
Sou
rce:
Cal
cula
tions
by
PP
I AA
RP
usi
ng C
ente
rs fo
r M
edic
are
& M
edic
aid
Ser
vice
s,
Offi
ce o
f the
Act
uary
, CY
196
0-20
04 N
atio
nal H
ealth
Exp
endi
ture
Dat
a
Hospital CareHospital Care
Rx DrugsRx Drugs
Physician &Physician &Clinical Clinical ServicesServices
Administration &Administration &Net Cost of Private InsNet Cost of Private Ins
27%
21%15%
9%

What’s driving up health costs??
Economic, demographic, and technological factors . . .

Analysis of Cost Growth 2000-04
0%
20%
40%
60%
80%
100%
Growth in Health Care Expenditures So
urc
e:
Na
tion
al H
ea
lth E
xpe
nd
iture
s A
cco
un
ts:
De
finiti
on
s, S
ou
rce
s, a
nd
Me
tho
ds
use
d in
th
e N
HE
A 2
00
4,
CM
S
GeneralInflation
Medical Inflationabove general inflation
Population Growth
Intensity, Volume, Technological Change& other residual factors

Intensity and volume . . .
What’s driving up health costs??
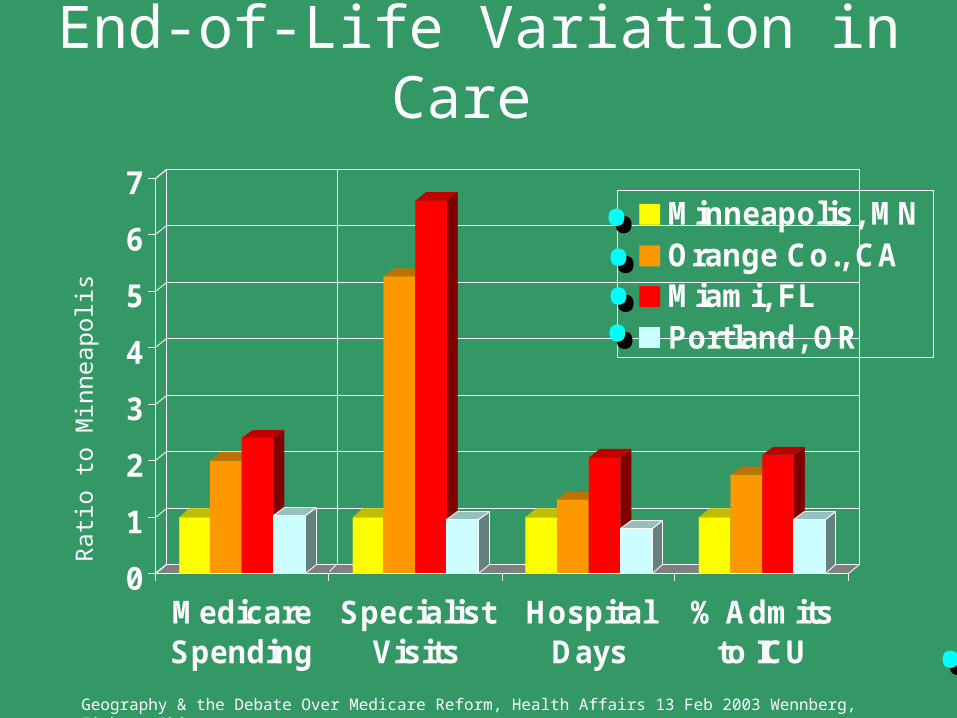
End-of-Life Variation in Care
0
1
2
3
4
5
6
7
MedicareSpending
SpecialistVisits
HospitalDays
% Admitsto ICU
Minneapolis, MNOrange Co., CAMiami, FLPortland, OR
Rati
o t
o M
inn
eapolis
Geography & the Debate Over Medicare Reform, Health Affairs 13 Feb 2003 Wennberg, Fisher, Skinner
........
..

Crucial to get control of the management of chronic care . . .
What’s driving up health costs??

Percent of Population
100%
20
40
60
80
20% 40% 60% 80% 100%0%
10% of costs for70% of people
30% of costs for 1% of people
% H
ealt
h C
are
Dolla
rs
Spent
Chronic Care Management Key to a Large Segment of Cost
A back-of-the-envelope representation . . .

$0
$2,000
$4,000
$6,000
$8,000
$10,000
$12,000
$14,000
$16,000
$18,000
$20,000
None 1 chronic 3+ chronic 3+ chronic,& disabled
50-6465-7475-8485+
Highest healthcare costs comewith multiple conditions, not age
Sou
rce:
Par
tner
ship
for
Sol
utio
ns, J
ohns
Hop
kins
U
nive
rsity
ana
lysi
s of
Med
ical
Exp
endi
ture
Pan
el
Sur
vey
1996
, unp
ublis
hed
data
, Aug
ust 2
001.
Average healthcare expenditures for non-institutionalized population, by age and severity of chronic conditions, disability, and functional limitations
with functional limits

•First, that does nothing to contain costs.
•Second, in terms of Medicare, the patients are already bearing about as large a burden as possible.
What about more beneficiary cost-sharing??

Average Medicare out-of-pocketcosts take 23% of income
30%24%
34%
23%
29%
0% 10% 20% 30% 40%
Percent of IncomeFigures for non-institutionalized Medicare beneficiaries only. “Out-of-Pocket” includes payments for Medicare cost-sharing, Part B & private insurance premiums, physician balance billing, and goods & services not covered by Medicare. It excludes cost of home care and long-term nursing home care. S
ourc
e:
AA
RP P
ublic
Polic
y Inst
itute
pro
ject
ions
usi
ng
Medic
are
Benefits
Model, v
5.3
06
.
Under 135% Poverty
People in “Fair” or “Poor” health
Women
85+ only
ALL 65+
Average Out-of-Pocket Health Care Spending 2004

Looking at one of the four big cost growth areas – prescription drugs . . .
Pharmaceutical prices are rising at more than double the rate of inflation
Are we sure expenditures are used wisely?

40%
0%
10%
20%
30%
40%
Cumulative Rise 2000 thru 2005
Average Manufacturers’ Price Increases far outpacing Inflation
Yea
rs r
efer
to c
hang
e fr
om p
revi
ous
year
. Sou
rce:
AA
RP
Pub
lic P
olic
y In
stitu
te
Ave
rag
e P
erce
nt
Ch
ang
e
Inflation 17%
40%
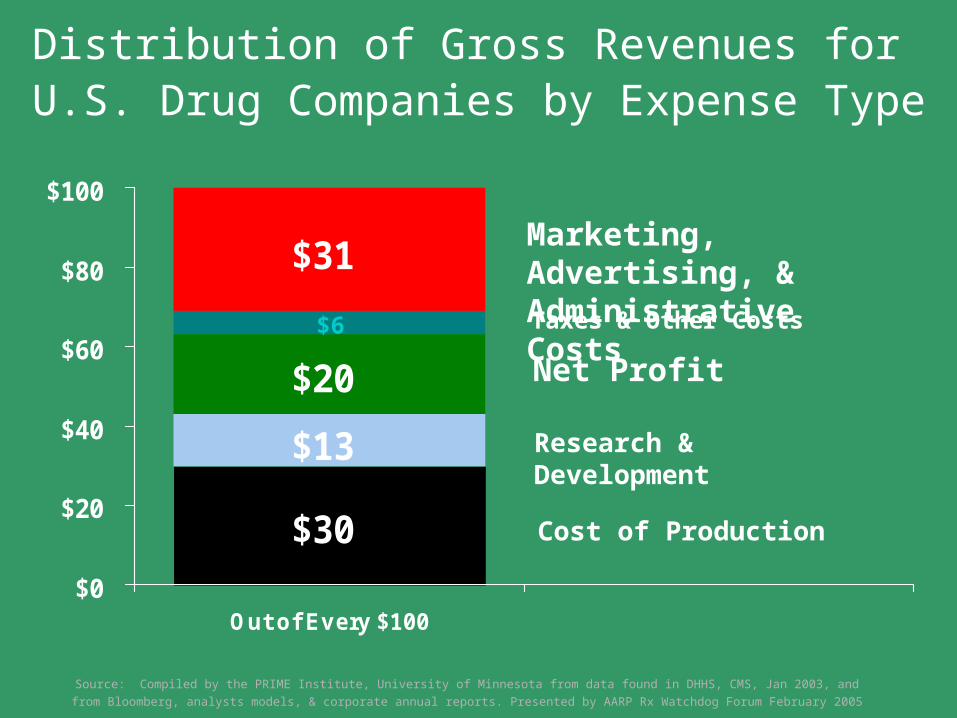
$13
$31
$30
$20
$0
$20
$40
$60
$80
$100
Out of Every $100
Distribution of Gross Revenues for U.S. Drug Companies by Expense Type
Net Profit
Taxes & Other Costs
Cost of Production
Research & Development
Marketing, Advertising, & Administrative Costs
Source: Compiled by the PRIME Institute, University of Minnesota from data found in DHHS, CMS, Jan 2003, and
from Bloomberg, analysts models, & corporate annual reports. Presented by AARP Rx Watchdog Forum February 2005
$6

Looking at the Medicare spending for physician payments 2000-2005 . . .
What about physician services?

Costs for physician FFS up an average of almost 10% per year
2000-2005
0
10
20
30
40
50
60
2000 2001 2002 2003 2004 2005
Med
icare
Spend
ing (
dolla
rs in b
illio
ns)
Sourc
e 2
00
6 A
nnual R
eport
of
the B
oard
of
Tru
stees
of
the M
edic
are
Tru
st F
unds
NOTE: Dollars do not include beneficiary co-pays

With healthcare growth unchecked (and small Social Security fixes ignored), here is the picture:
And what happens if we continue, business as usual?

Figure 1. Spending for Total and Largest Three Entitlements as Percent of GDP, 1962-2050
0%
2%
4%
6%
8%
10%
12%
14%
16%
18%
20%
1962
1965
1968
1971
1974
1977
1980
1983
1986
1989
1992
1995
1998
2001
2004
2007
2010
2013
2016
2019
2022
2025
2028
2031
2034
2037
2040
2043
2046
2049
Total entitlement spending
Largest 3 entitlements
Source: Congressional Budget Office, The Budget and Economic Outlook, Fiscal Years 2007 to 2016, January, 2006, Appendix F, Historical Budget Data; The Long-Term Budget Outlook , December, 2005, Supplemental Data (Intermediate projections)
ProjectionsActual
Tomorrow?
Today
Predicting Entitlement Spending

Looking at the Hospital Trust Fund alone, here is the projected cash flow . . .

Cash Flow of the HI Trust Fund
$0
$100
$200
$300
$400
1970 1980 1990 1995 2000 2006 2008 2010 2012 2014
Income
Expenditures
Projected
Source: Office of the Chief Actuary -SUMMARY OF THE 2005 ANNUAL REPORTS From the Social Security and Medicare Boards of Trustees
Actual
Will exceed income in 2012

And here is the projected Hospital Trust Fund balance . . .
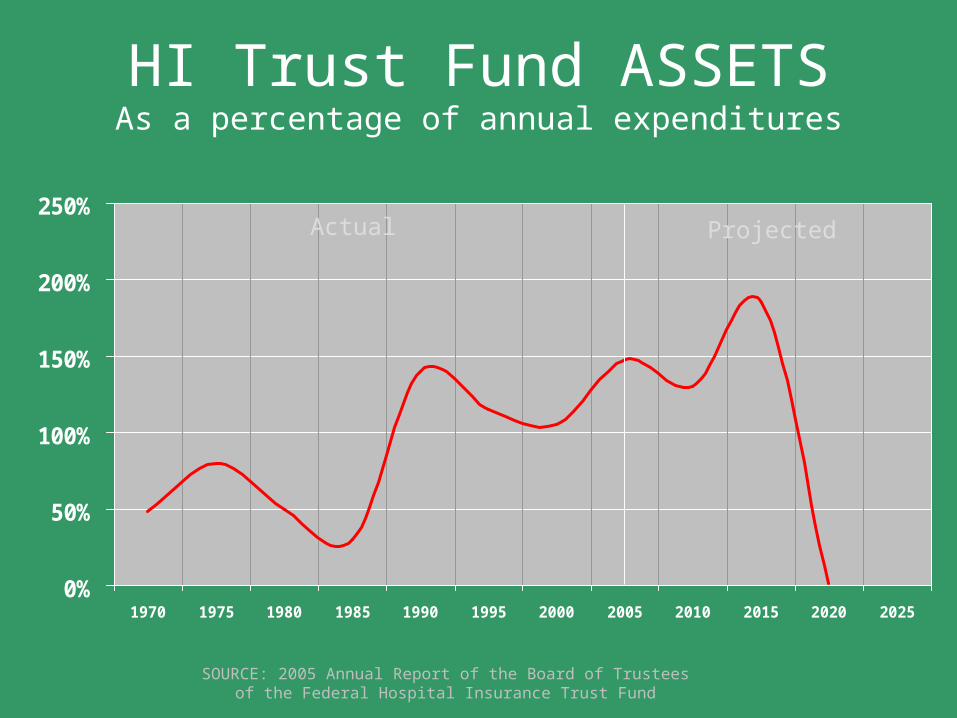
0%
50%
100%
150%
200%
250%
1970 1975 1980 1985 1990 1995 2000 2005 2010 2015 2020 2025
HI Trust Fund ASSETSAs a percentage of annual expenditures
SOURCE: 2005 Annual Report of the Board of Trustees of the Federal Hospital Insurance Trust Fund
ProjectedActual

What are needed steps to reform both public and private health care?

Leadership Solutions
Foster widespread, inter-operable H.I.T. Fund prevention Manage, coordinate (and pay for)
quality chronic care Pursue comparative-effectiveness
research for pharmaceuticals and for technology, other evidence-based medicine
Target escalating Rx drug pricing
Reduce costs, improve quality:

Leadership Solutions
Reform payment to reward excellence –e.g. Pay for Performance
Target waste and unnecessary care (misuse, overuse)
Reduce toll of errors Work toward universal coverage Provide patients with decision tools Promote lifelong healthy behavior
Reduce costs, improve quality:

Pay me now, or pay me later!
Either we take steps now to aggressively reform healthcare, even if there are short-term investment costs
Or, we will pay more in the long-run, as taxpayers, as patients, and as providers
Either we take steps now to aggressively reform healthcare, even if there are short-term investment costs
Or, we will pay more in the long-run, as taxpayers, as patients, or as providers suffering reduced resources and income
Pay me now, or pay me later!
$ $ $ $ $ $ $ $ $ $ $ $ $ $ $ $ $ $ $ $$ $ $ $ PAY ME NOWPAY ME NOW $ $ $ $ $ $ $ $ $ $ $ OR PAY ME LATEROR PAY ME LATER $ $ $ $ $ $ $ $ $ $ $ $ $ $ $ $ $ $ $ $ $ $ $ $ $ $ $ $ $ $ $ $ $ $ $ $ $ $ $ $ $ $ $ $ $ $ $ $ $ $ ISSUES INISSUES IN $ $ $ $ $ $ $ $ $ HEALTH CARE SPENDINGHEALTH CARE SPENDING $ $ $ $ $ $ $ $ $ $ $ $ $ $ $ $ $ $ $ $ $ $$ $ $ $ $ $ $ $ $ $ $ $ $ $ $ $ $ $ $ $ $ $ $ $ $ $ $ $ $ $ $ $ $ $ $ $ $ $ $ $

$ $ $ $ $ $ $ $ $ $ $ $ $ $ $ $ $ $ $ $$ $ $ $ $ $ $ $ $ $ $ $ $ $ $ $ $ $ $ $$ $ $ $ $ $ $ $ $ $ $ $ $ $ $ $ $ $ $ $$ $ $ $ $ $ $ $ $ $ $ $ $ $ $ $ $ $ $ $$ $ $ $ $ $ $ $ $ $ $ $ $ $ $ $ $ $ $ $$ $ $ $ $ $ $ $ $ $ $ $ $ $ $ $ $ $ $ $$ $ $ $ $ $ $ $ $ $ $ $ $ $ $ $ $ $ $ $$ $ $ $ $ $ $ $ $ $ $ $ $ $ $ $ $ $ $ $$ $ $ $ $ $ $ $ $ $ $ $ $ $ $ $ $ $ $ $