Embed Size (px)
Citation preview
Parliamentary Commissioner for the Environment
Te Kaitiaki Taiao a Te Whare Parematapce11 October 2007
Dairy Farming Impact on Water Quantity and QualityBriefing to the Primary Production Committee
Dr Jan WrightParliamentary Commissioner for the Environment
I understand that you have asked me here because of the Insight radio documentary on the dairy farming boom in which I suggested that water should be priced. Although you asked me to speak on the impact of dairy farming on water quality, the pricing issue is about water quantity, so I will speak about both quality and quantity.
The suggestion that water should be priced is not original to me so I have been somewhat surprised that it has been treated this way by the media.
I was rather amused by one report that said I had bared my teeth at the dairy industry, because it reminded me of Helen Hughes’ famous response. Helen Hughes was the first Parliamentary Commissioner for the Environment and once when asked if the Commissioner had any teeth, she replied, “No, but very powerful gums”.
There is no well-researched report sitting behind my comments on the radio documentary or behind this briefing. I am not yet an expert on water – but I do know we have some problems.
In the Insight documentary, the first question I was asked was: “Does dairying have an environmental impact?” I responded, “Everything does.” That response was edited out.
Everything we do has an environmental impact. What matters is its size and nature in deciding how serious it is.
On the one hand I am told that it takes 1,200 litres of water to make a litre of milk and on the other, that only 14 percent of the water in Canterbury is used by farmers. These are factoids. What is the basis of these numbers? What is their significance?
They are the kind of factoids that seem to be fuelling an increasingly heated urban–rural debate.
I want to acknowledge the good work that is going on. Much of it is taking place under the Dairying and Clean Streams Accord. For example:
• The building of bridges and culverts over regular crossing points, the fencing of waterways, and the riparian planting.
• The use of nutrient budgets – keeping nitrogen and phosphorus accounts.
• The proposed National Environmental Standard on water meters which will make metering compulsory at the first point of abstraction from the river, lake, dam or aquifer. South Wairarapa is going further: it plans water meters in place for all users after 2009.
2
• The increased enforcement by regional councils of those whose management of dairy effluent is unacceptable.
• The use of nitrogen inhibitors that enable grass to take up more of the nitrogen that comes from urine, urea and clover – and in so doing, reduces both the outgassing of the greenhouse gas nitrous oxide to the atmosphere and the nitrate entering rivers, lakes, and groundwater. I understand there has been significant take-up in Canterbury and Otago where it is currently profitable because of the resulting increase in grass growth and the high price of urea fertiliser (due to the huge demand by growers of maize for biofuels in the USA).
And an environmental positive from the dairy industry is that, from a global perspective, the export of dairy products from New Zealand to the United Kingdom is a good thing for climate change.
We know from the work of Professor Caroline Saunders at Lincoln that we can get our dairy products on to UK supermarket shelves with a lower carbon footprint than UK farmers can. However, the margin is not that large.
The much-quoted first Saunders report dealt only with carbon dioxide, and showed that the carbon dioxide emitted during the production and delivery of a kilogram of milk solids in the UK was twice that of New Zealand.
The second Saunders report dealt with all the agricultural greenhouse gases – methane and nitrous oxide as well as carbon dioxide. The result of this more thorough calculation is that the ratio of the greenhouse footprint of a UK kg of milk solids to the greenhouse footprint of a New Zealand kg of milk solids shrinks from two-to-one to four-to-three. This is not a comfortable margin.
I see the world as a scientist and as an economist. My comment on pricing water arose from my economic view of the world.
From an economic perspective, the water problem is characterised as a Tragedy of the Commons. Uncontrolled use of a resource – because it is free – leads to “tragic” results. Climate change is a Tragedy of the Commons – because we have all dumped our waste gases into the atmosphere for free.
Water functions as a resource in two ways:
• As a source – what we want. This is the quantity issue
• As a sink – what we don’t want. This is the quality issue.
The two are often connected. For example, consider the situation where water is taken from a river for some purpose and pollutants are discharged into the same river. The more water that is taken, the lower will be the flow and the higher the concentration of pollutants.
The Tragedy of the Commons is one characteristic that makes water management so challenging. Another is variability. There is so much variability in the amount of rain and the time of year when it falls. And while our general understanding of aquifers is good, we lack understanding of particular aquifers.
�
An economic perspective on environmental problems leads to so-called Blue-Green instruments – like a carbon cap-and-trade market. Blue-Green solutions involve pricing what has previously been free:
• Quantity – user pays
• Quality – polluter pays.
That said, economic Blue-Green instruments are not always the answer, but are increasingly likely to be part of the answer.
I will be presenting some slides that are mostly about water quality.
But before doing so, I will make a few comments about water quantity.
Comment 1
Pricing may be part of the answer for allocating water where it is scarce. Other parts of the answer may be regulation, voluntarism, or investment in capture and storage.
Comment 2
There is no case for putting a price on a resource that is in plentiful supply. There is no national water shortage. Sir Geoffrey Palmer famously said, “New Zealand is an irredeemably pluvial country”.
But we don’t always have rain where and when we want it. So there is a scarcity problem in some areas at some times of the year in some years.
Comment �
Pricing is the normal way in which society allocates scarce resources. And water is becoming increasingly scarce in our dry East Coast areas. About 70 percent of the consumptive use of water is in Canterbury and there the easy water has gone.
Comment 4
It is important to distinguish between paying for infrastructure (and resource consent charges) to abstract, store, and deliver water – and paying for water itself. Sometimes the infrastructure is charged for on a cubic metre basis, so it looks as if the water itself is being paid for. It is not. These payments are cost recovery.
Comment 5
Our consenting system for allocating water is first-come, first-served. Where water is scarce, first-come, first-served is inefficient in two ways.
The first kind of inefficiency is that no farmer gets enough in dry periods.
This is because the consented amount is subject to availability. The consent gives the right to take so many cubic metres but it may not be there to give. This suggests that consents to take water are best expressed as a percentage of a cap rather than a set number of cubic metres.
The second kind of inefficiency is that the water doesn’t go to the highest value use.
First-come first-served is allocation by time, not by value. Pricing is the mechanism that leads to allocation by value.
4
Comment 6
Some are concerned that pricing water is privatising water.
But it already is effectively privatised through the consents process. A property right has been established because water users can trade consents.
Consider two hypothetical farmers who own identical land in a dry area, one with a consent to take water and the other without such a consent because he applied later and the available water was over-allocated. If they sell their farms, the former will get a much higher price – simply because he got in first.
Comment 7
The catchment needs to be the fundamental management unit. I understand that Environment Waikato is re-establishing catchment boards. In some catchments, the water available for commercial use needs to be capped to preserve other uses of water:
• Lake, river, and stream ecosystems need to be sustained
• The public use of lake, rivers, and streams
• Water for stock (which does not require a resource consent)
• Water is required for diluting pollutants – preserving its assimilative capacity.
I have talked a good deal about the potential use of pricing instruments for dealing with the water quantity problem because it was clearly my “pricing” comment that caught your attention.
Pricing can also be used to address the quality problem. For instance, the right to discharge nitrogen into certain water bodies could be capped and traded in approp- riate units.
But I don’t want to leave you with the impression that Blue-Green instruments will solve our water problems. They make a lot of sense in theory. But practice is another matter – the devil will be in the detail.
I also do not want to leave you with the impression that dairying is the only land use that has impacts on the environment. Market gardening, for instance, can cause serious water quality problems. But the environmental impact of dairying is particularly important because of the sheer scale of the change that is occurring.
The slides show that we have a water problem. Some of this is due to historical practices.
But these are problems that will not self-correct.
It is easy to find fault with proposed solutions. But the challenge is to find solutions that are workable and to do it reasonably fast.
Finally, the Business Council for Sustainable Development is doing excellent work on water and I suggest that you watch out for their report.
The following slides are presented with the permission of Environment Waikato, Environment Southland, and Environment Canterbury.
5
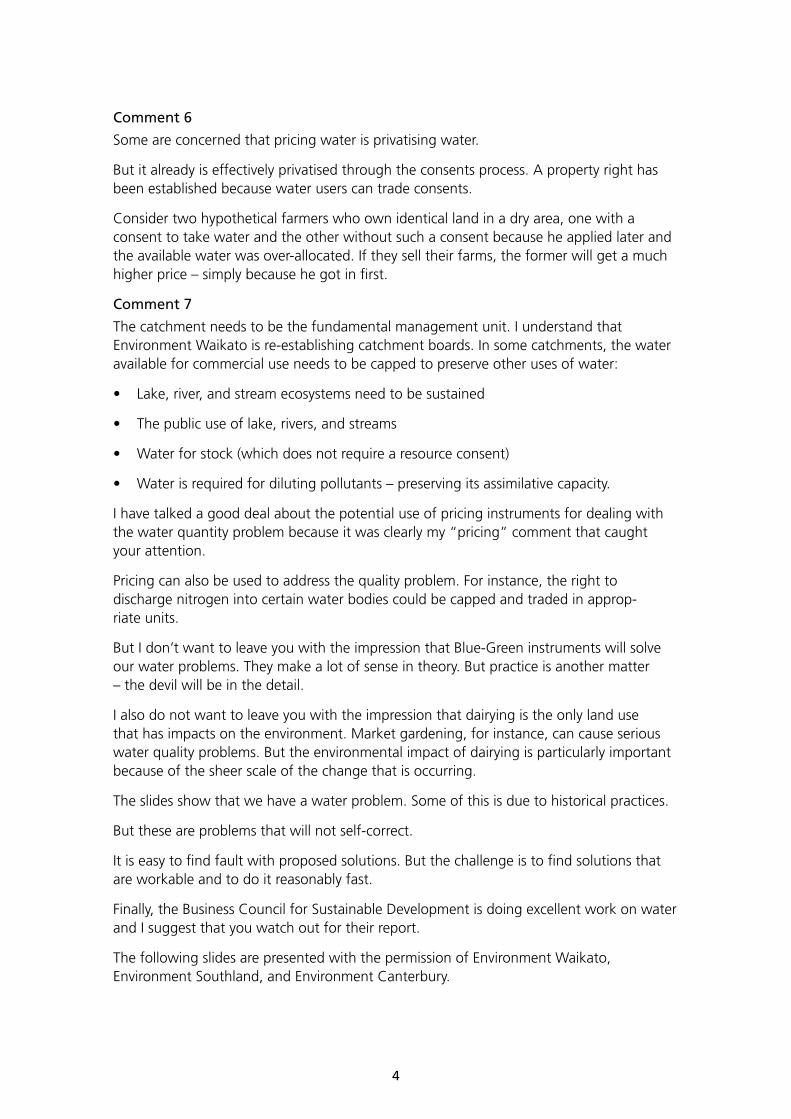
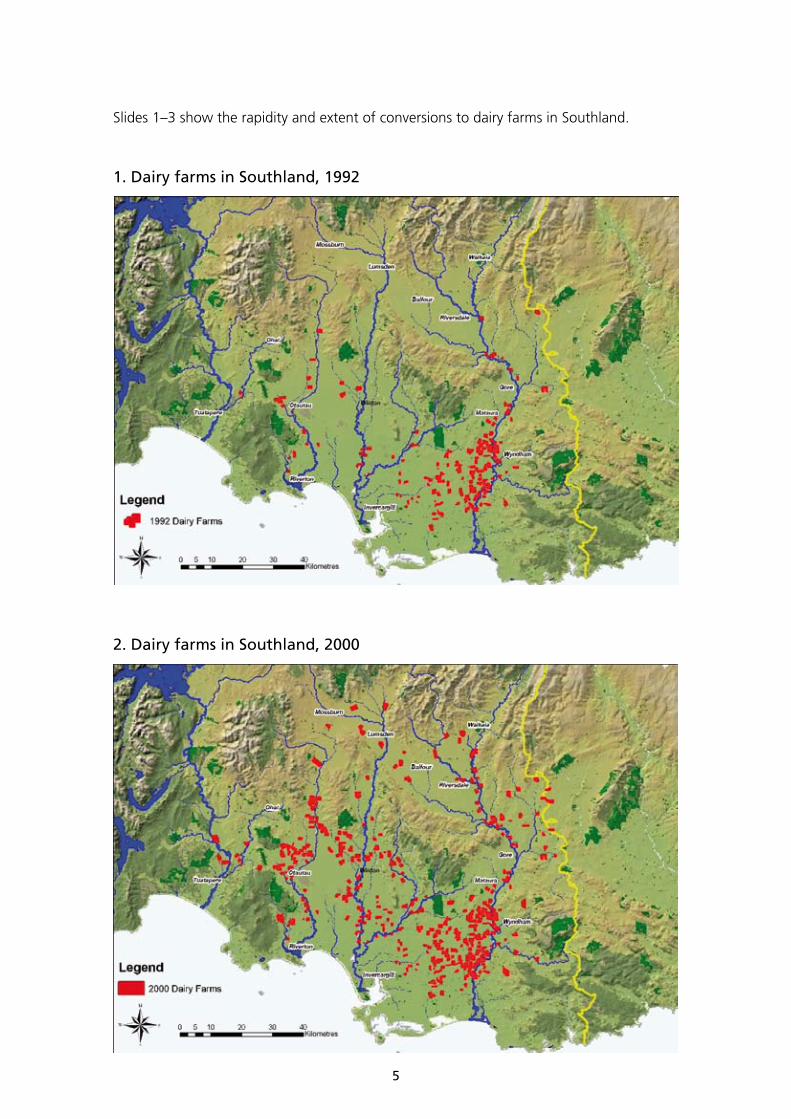
Slides 1–3 show the rapidity and extent of conversions to dairy farms in Southland.
1. Dairy farms in Southland, 1992
2. Dairy farms in Southland, 2000
6
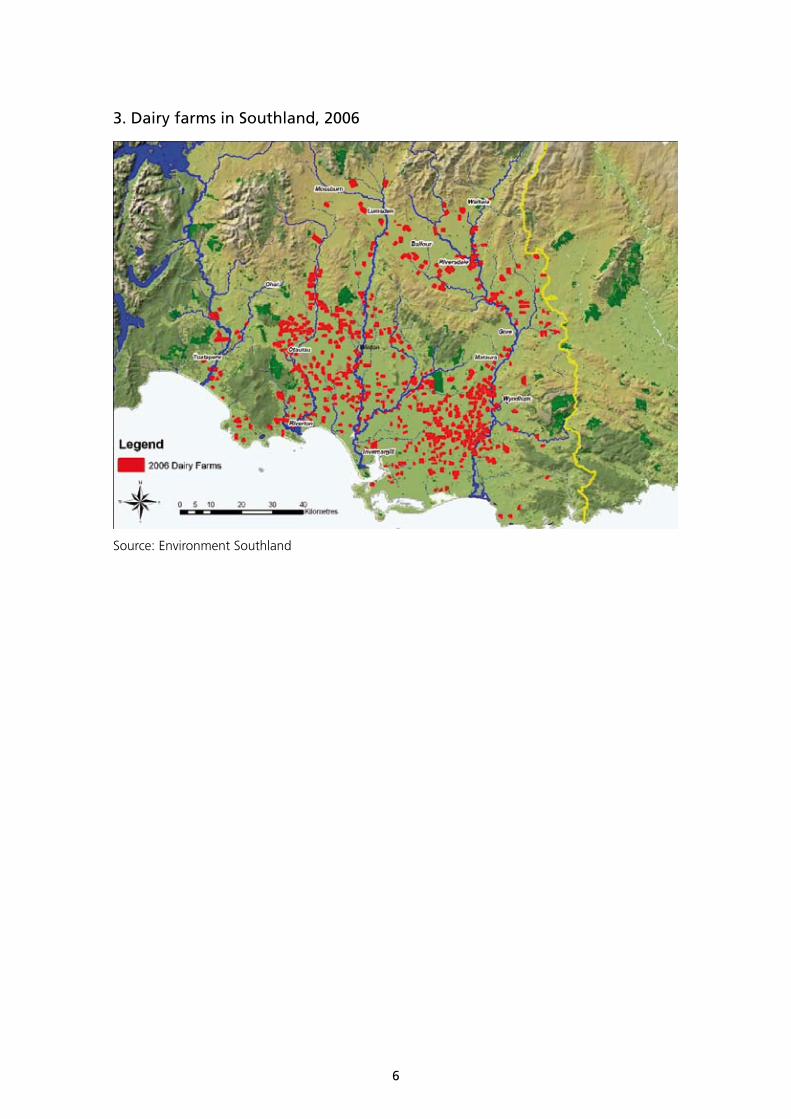
�. Dairy farms in Southland, 2006
Source: Environment Southland
7
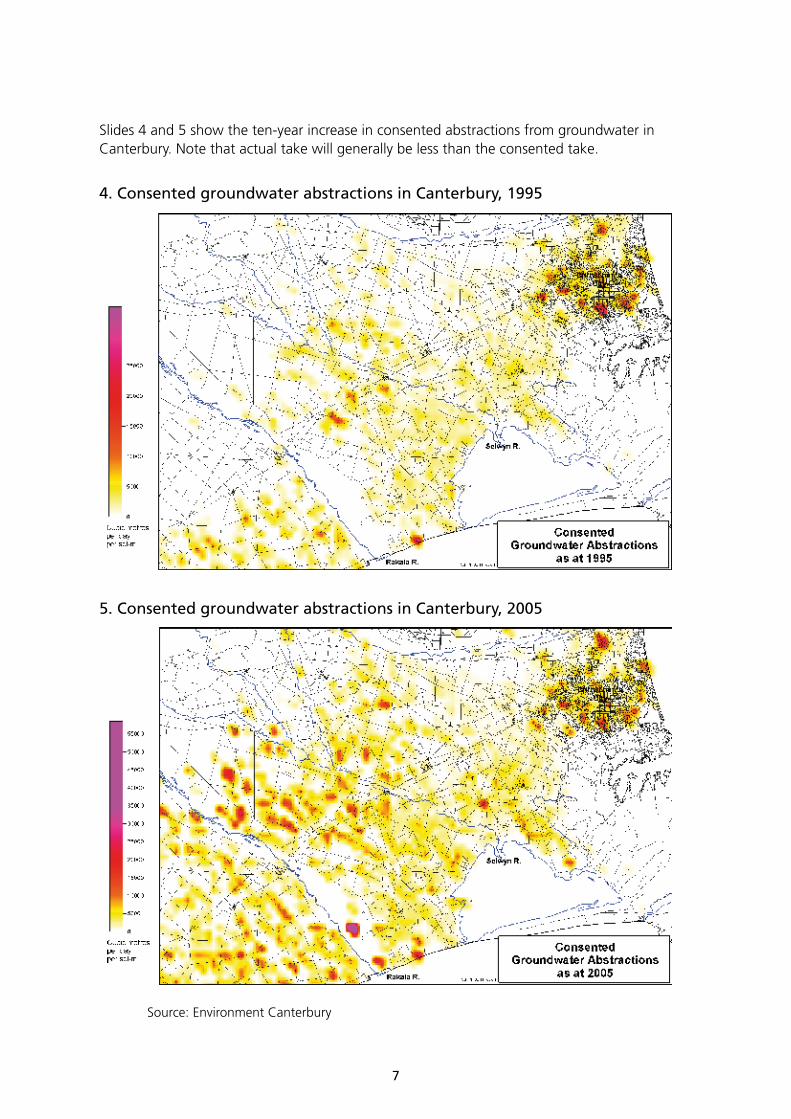
Slides 4 and 5 show the ten-year increase in consented abstractions from groundwater in Canterbury. Note that actual take will generally be less than the consented take.
4. Consented groundwater abstractions in Canterbury, 1995
5. Consented groundwater abstractions in Canterbury, 2005
Source: Environment Canterbury
�
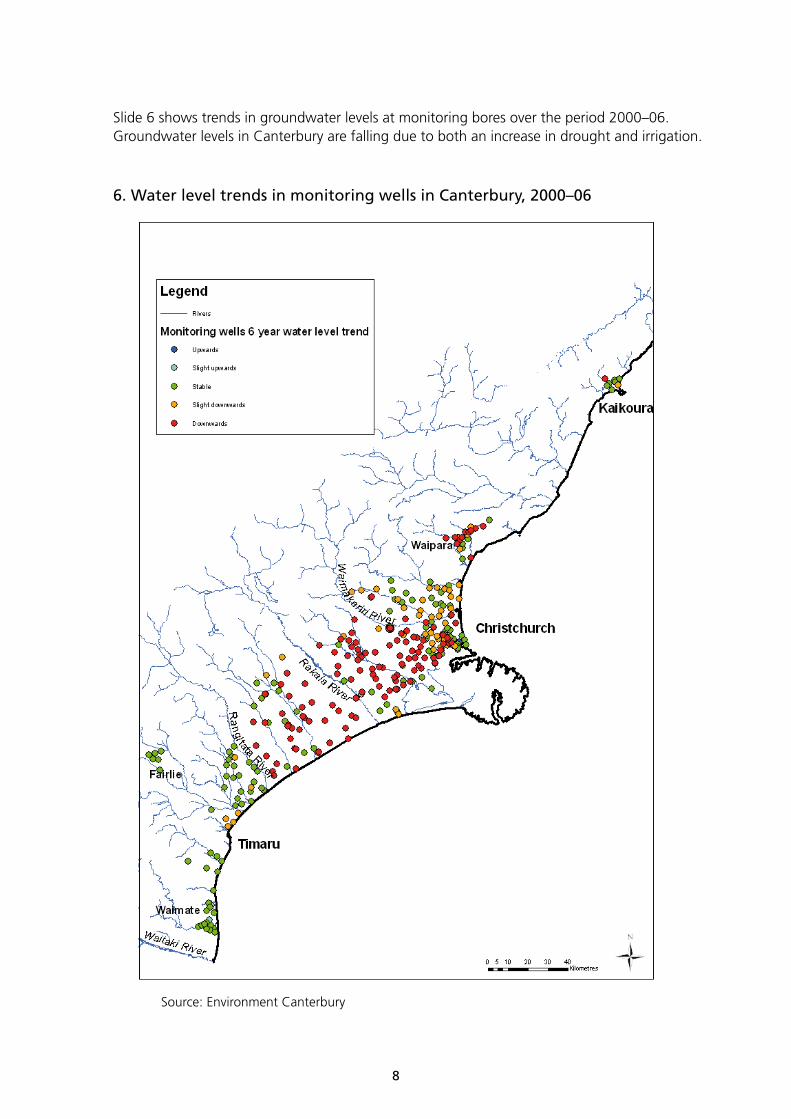
Slide 6 shows trends in groundwater levels at monitoring bores over the period 2000–06. Groundwater levels in Canterbury are falling due to both an increase in drought and irrigation.
6. Water level trends in monitoring wells in Canterbury, 2000–06
Source: Environment Canterbury
9
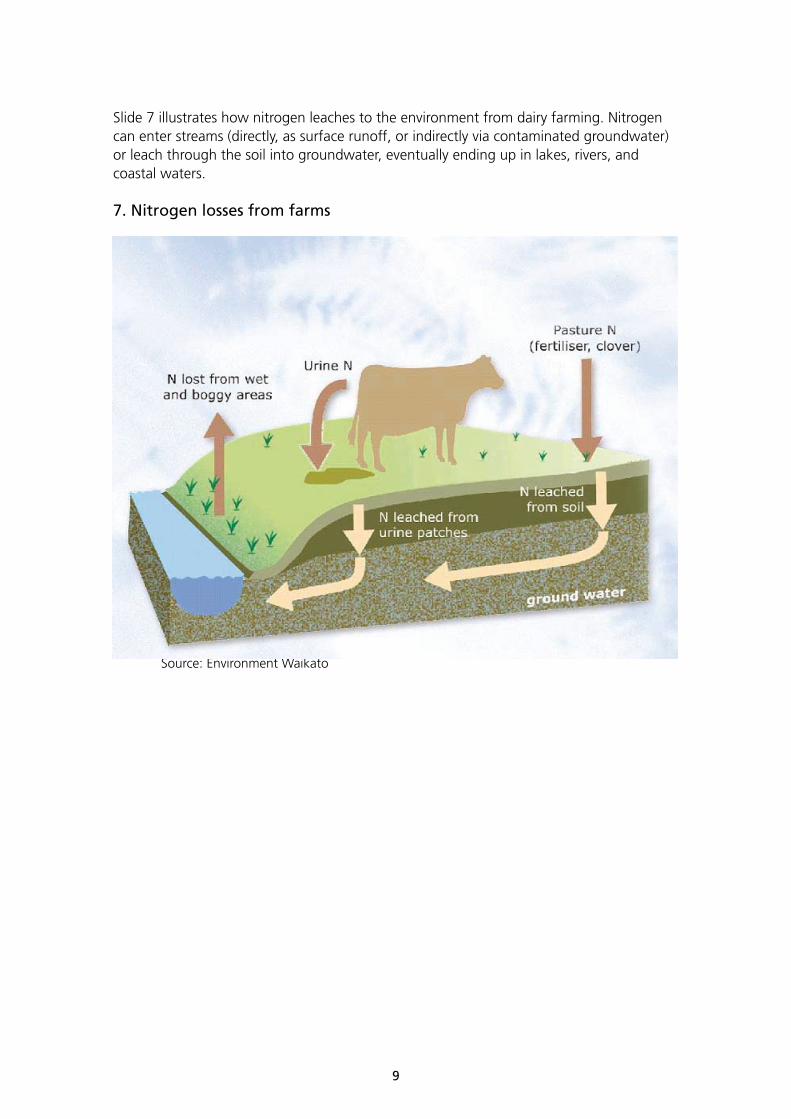
Slide 7 illustrates how nitrogen leaches to the environment from dairy farming. Nitrogen can enter streams (directly, as surface runoff, or indirectly via contaminated groundwater) or leach through the soil into groundwater, eventually ending up in lakes, rivers, and coastal waters.
7. Nitrogen losses from farms
Source: Environment Waikato
10
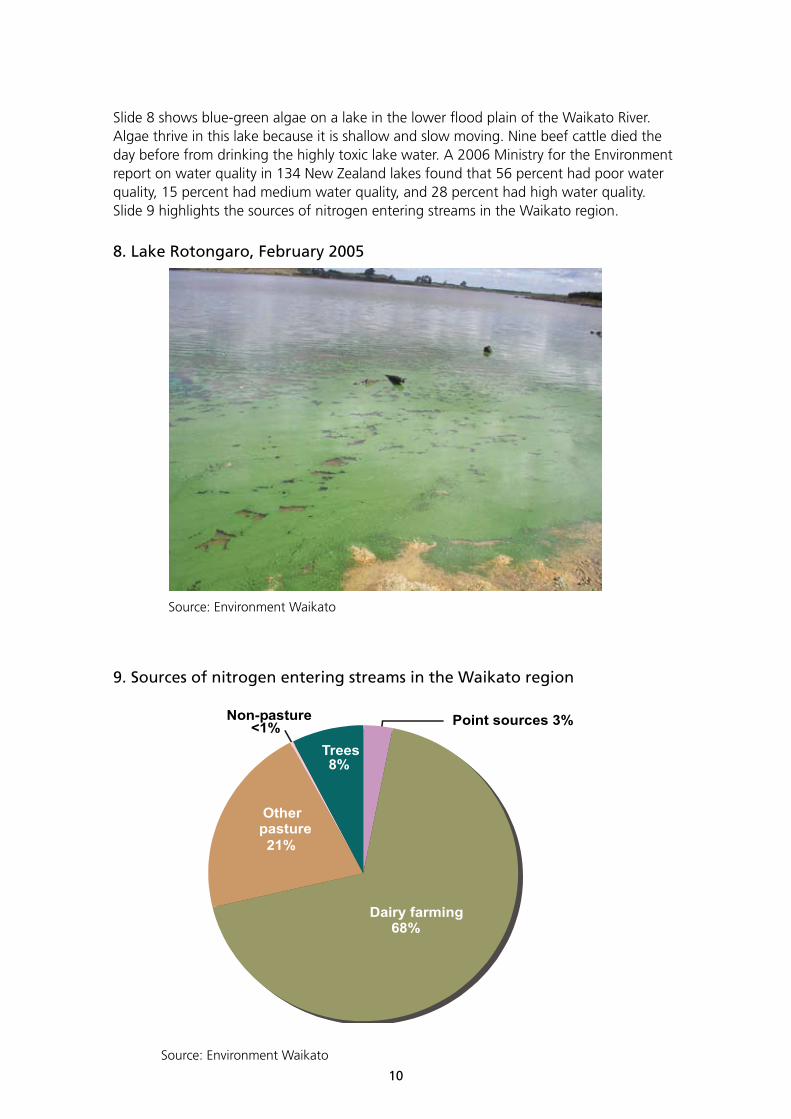
Slide 8 shows blue-green algae on a lake in the lower flood plain of the Waikato River. Algae thrive in this lake because it is shallow and slow moving. Nine beef cattle died the day before from drinking the highly toxic lake water. A 2006 Ministry for the Environment report on water quality in 134 New Zealand lakes found that 56 percent had poor water quality, 15 percent had medium water quality, and 28 percent had high water quality. Slide 9 highlights the sources of nitrogen entering streams in the Waikato region.
�. Lake Rotongaro, February 2005
Source: Environment Waikato
9. Sources of nitrogen entering streams in the Waikato region
Source: Environment Waikato
Point sources 3%
Dairy farming68%
Otherpasture21%
Trees8%
Non-pasture<1%

11
Slide 10 presents nitrogen levels as an indicator of the ecological health of the Waikato River. Environment Waikato considers that rivers and streams with total nitrogen levels above 0.5 grams per cubic metre are undesirably nutrient-enriched (i.e. from above the Huntly Bridge out to sea). Predicted dairy conversions (a land area the size of Lake Taupo) are expected to increase the Waikato catchment’s nitrogen load by 70 percent by 2030.
10. Ecological health of the Waikato River
Source: Environment Waikato
12
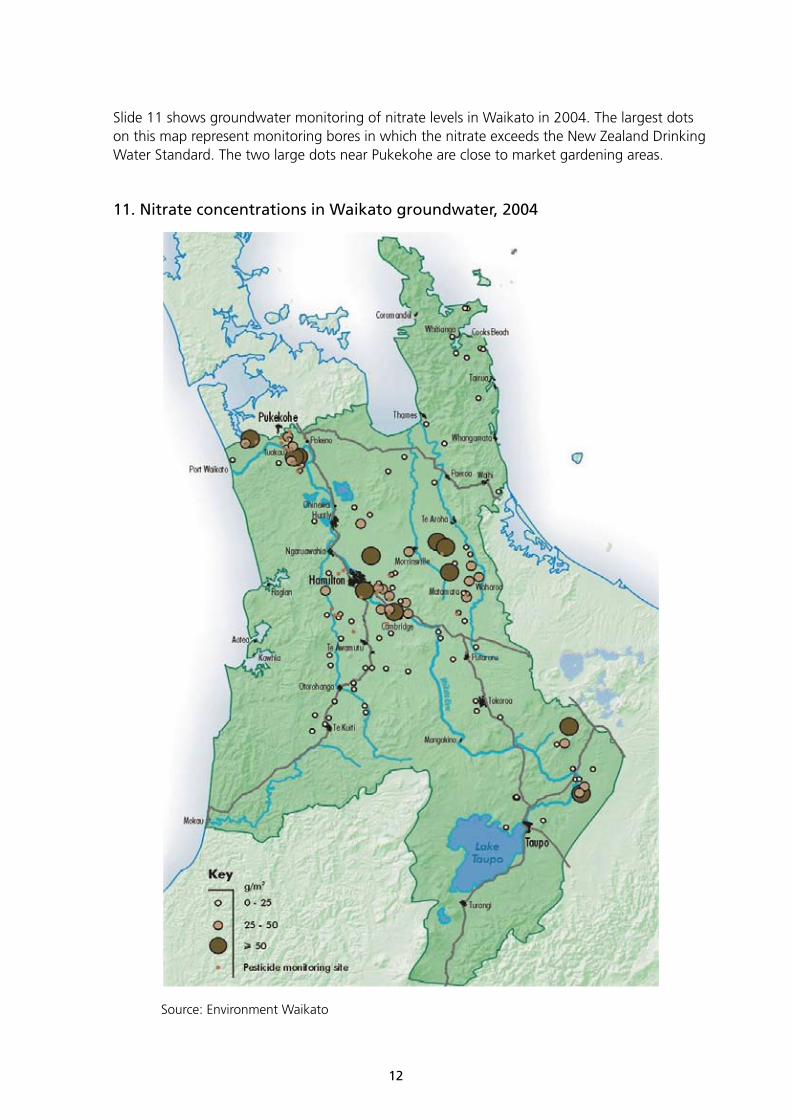
Slide 11 shows groundwater monitoring of nitrate levels in Waikato in 2004. The largest dots on this map represent monitoring bores in which the nitrate exceeds the New Zealand Drinking Water Standard. The two large dots near Pukekohe are close to market gardening areas.
11. Nitrate concentrations in Waikato groundwater, 2004
Source: Environment Waikato
1�
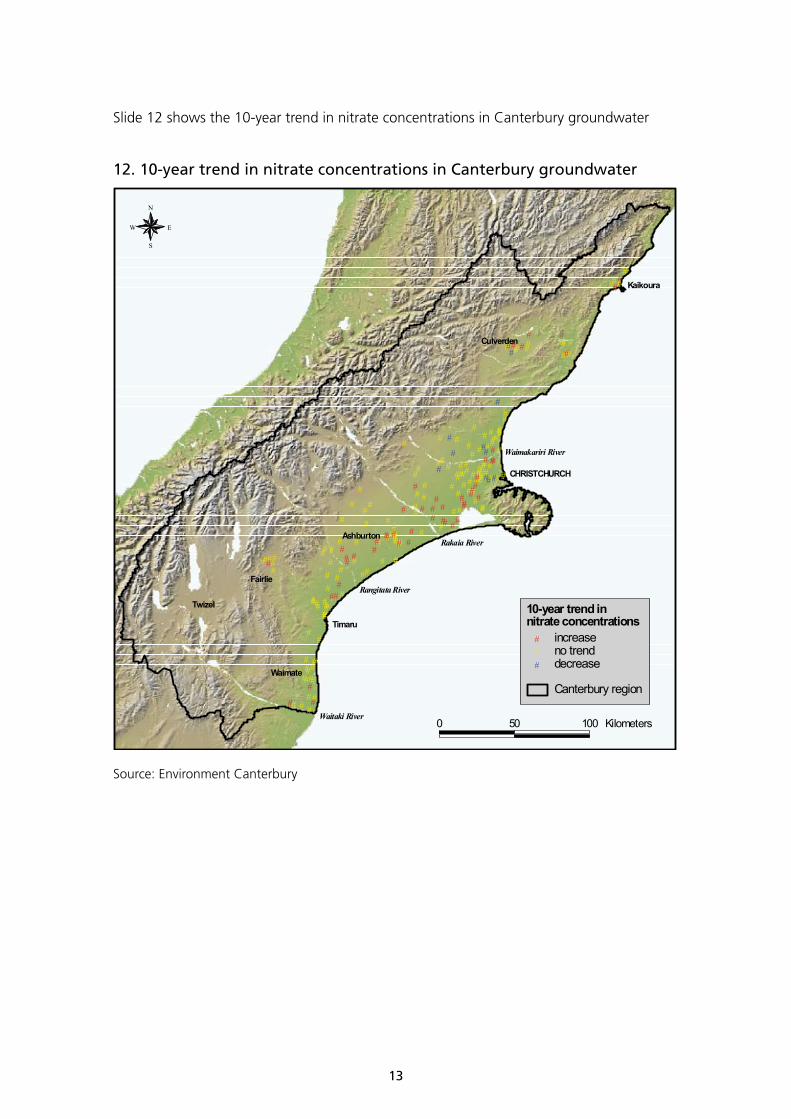
Slide 12 shows the 10-year trend in nitrate concentrations in Canterbury groundwater
12. 10-year trend in nitrate concentrations in Canterbury groundwater
Source: Environment Canterbury
#
#
#
#
#
#
#
##
#
#
#
#
##
#
#
# ##
#
#
##
#
#
#
#
#
#
#
#
#
#
#
##
#
##
#
#
#
#
#
#
#
#
#
#
##
#
#
#
##
#
#
# ##
#
#
# ##
#
#
#
#
#
#
#
#
##
#
#
#
#
#
#
#
#
#
#
#
#
#
##
#
#
#
#
#
#
#
#
#
#
##
#
#
#
#
##
#
#
#
#
#
#
#
#
#
#
#
#
#
#
#
#
##
##
#
#
#
#
#
#
#
#
##
#
#
#
# #
#
#
#
#
#
#
#
##
##
##
# ##
#
#
##
#
# #
#
#
##
#
#
#
#
#
##
#
#
#
#
#
#
#
#
#
#
#
#
#
##
#
#
#
#
#
#
#
#
#
#
#
#
##
##
#
#CHRISTCHURCH
Kaikoura
Culverden
Fairlie
Ashburton
Timaru
Waimate
Twizel
Waimakariri River
Rakaia River
Rangitata River
Waitaki River
Canterbury region
10-year trend innitrate concentrations
# increase# no trend# decrease
0 50 100 Kilometers
N
EW
S
14
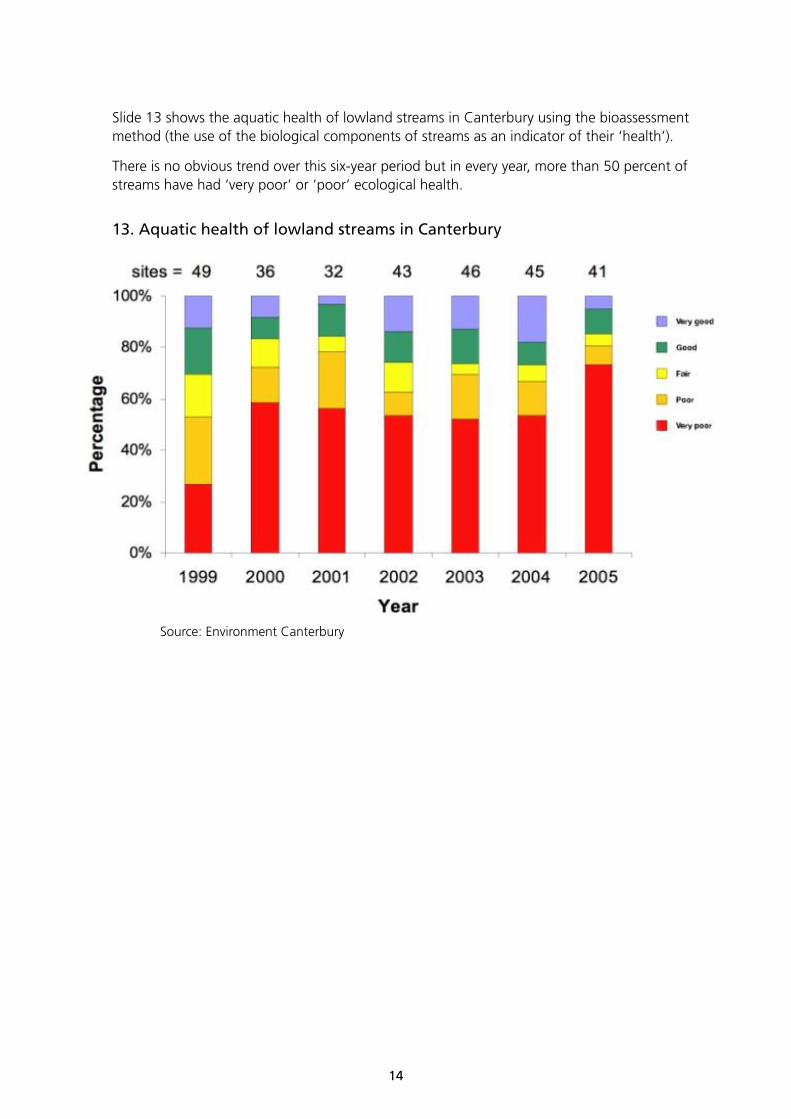
Slide 13 shows the aquatic health of lowland streams in Canterbury using the bioassessment method (the use of the biological components of streams as an indicator of their ‘health’).
There is no obvious trend over this six-year period but in every year, more than 50 percent of streams have had ‘very poor’ or ‘poor’ ecological health.
1�. Aquatic health of lowland streams in Canterbury
Source: Environment Canterbury
15
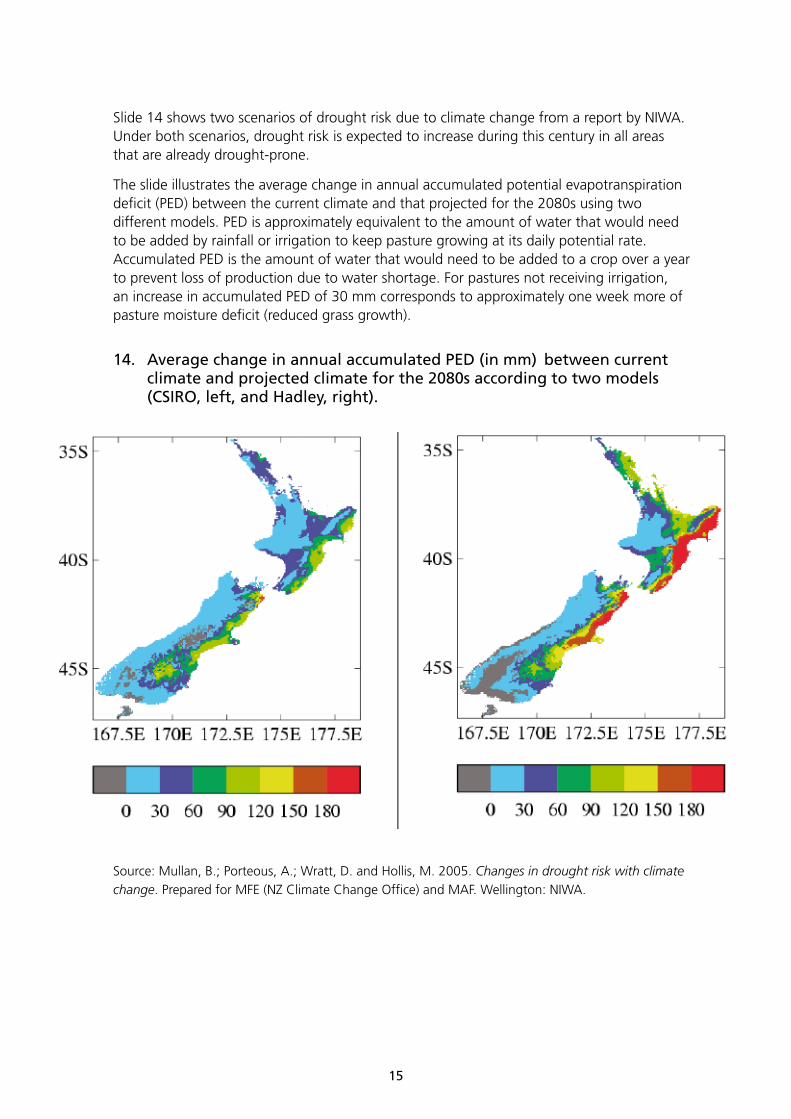
Slide 14 shows two scenarios of drought risk due to climate change from a report by NIWA. Under both scenarios, drought risk is expected to increase during this century in all areas that are already drought-prone.
The slide illustrates the average change in annual accumulated potential evapotranspiration deficit (PED) between the current climate and that projected for the 2080s using two different models. PED is approximately equivalent to the amount of water that would need to be added by rainfall or irrigation to keep pasture growing at its daily potential rate. Accumulated PED is the amount of water that would need to be added to a crop over a year to prevent loss of production due to water shortage. For pastures not receiving irrigation, an increase in accumulated PED of 30 mm corresponds to approximately one week more of pasture moisture deficit (reduced grass growth).
14. Average change in annual accumulated PED (in mm) between current climate and projected climate for the 20�0s according to two models (CSIRO, left, and Hadley, right).
Source: Mullan, B.; Porteous, A.; Wratt, D. and Hollis, M. 2005. Changes in drought risk with climate change. Prepared for MFE (NZ Climate Change Office) and MAF. Wellington: NIWA.