Embed Size (px)
Citation preview


PhD thesis
Fish assemblages dynamic in the tropical flood-pulse system of the Lower Mekong River Basin
Peng Bun NGOR
Jury composition
Anna Vila-Gispert Adjunct Professor Referee
Stefan Schmutz Professor Referee
Thierry OBERDORFF Research director Jury member
Sébastien BROSSE Professor Jury member
Gaël GRENOUILLET Senior lecturer Jury member
Nam SO Researcher Jury member
Christine AGRILLIER Research Director Jury member
Marta MUÑOZ Professor Jury member
Sovan LEK Professor PhD supervisor
Defended on 10 April 2018
University of Toulouse

This research was performed at:
Laboratoire Evolution & Diversité Biologique, UMR 5174, Université Paul Sabatier
– Toulouse III, 118 route de Narbonne, 31062 Toulouse cédex 4 – France.
Cite this document as:
Ngor P. B., 2018. Fish assemblages dynamic in the tropical flood-pulse system of the Lower
Mekong River Basin. Thesis submitted in fulfilment of the requirements for the Degree of
Doctor of Philosophy, University of Toulouse 3 Paul Sabatier, Toulouse, France.
The author and the supervisor give the authorization to consult and to copy parts of this work
for personal use only. Every other use is subject to the copyright laws. Permission to reproduce
any material contained in this work should be obtained from the author.


iii
Acknowledgements
First and foremost, my sincerest gratitude goes to Professor Sovan Lek, my supervisor, for his
kindest support, valuable guidance and encouragement from the beginning to the completion of my PhD
Program. This thesis would be impossible without his continuous assistance and constructive advice. I
would like to profoundly thank Associate Professor Sithan Lek-Ang, my supervisor’s wife, for her
warm welcome and kindness to offer the homestay during my first arrival, and indeed both of whom
offer both academic and personal supports during my entire stay in Toulouse. I am wholeheartedly
thankful for their heartfelt support and care-taking.
I am also very grateful to His Excellency Eng Cheasan, Director General of the Fisheries
Administration for his support to undertake my PhD Program. Sincere thanks are also given to Mr.
Chheng Phen, acting director of the Inland Fisheries and Development Institute, Dr. So Nam, Chief of
Environment Division of the Mekong River Commission for his cooperation and support in supplying
the data for this study.
I am grateful to Dr. Thierry Oberdorff, Research Director at the French Research Institute for
Development; Professor Gaël Grenouillet, Professor Sébastien Brosse and Dr. Loïc Tudesque at the
Laboratoire Evolution et Diversité Biologique, Université de Toulouse; Professor Pierre Legendre,
Département de Sciences Biologiques, Université de Montréal; Professor Kevin McCann, University
of Guelph and Professor Bailey McMeans, University of Toronto Mississauga for their technical advice,
comments and supports during data analyses and manuscript preparations. Last, but not least, my
sincerest thanks go to Mr. Peter Degen who is always available for helping edit my writing and Mr.
Kunthea Nuon for his technical support in GIS mapping.
I am indented to my PhD colleagues, Seng Ratha, Sor Ratha, Chea Ratha, Chan Bunyeth and
Heng Kong for their academic, social and personal sharing, support and assistance especially during
my stay in Toulouse. My sincere thanks are also given to Ms. Catherine Stasiulis, Ms. Romy Duchesne,
Ms. Aurore Berthier and Ms. Dominique Pantalacci for their administrative support.
My deepest thanks go to my beloved parents and wife as well as my brothers and sisters for
their unconditional company, endless love and support.
Finally, my special thanks are given to the Erasmus Plus Program, Belmont Forum (TLSCC
project), CONCEA Program and Laboratoire Evolution & Diversité Biologique (EDB), Université de
Toulouse for funding this study and support, Mekong River Commission (Fisheries Programme), the
Inland Fisheries Research and Development Institute of the Fisheries Administration in Cambodia for
giving the required datasets for the study.


iv
PART I: SYNTHESIS
Table of Contents
I. Introduction ......................................................................................................................................... 1
1.1 A brief about the Mekong system ................................................................................................. 1
1.1.1 The Mekong River ................................................................................................................. 1
1.1.2 The 3S Rivers ......................................................................................................................... 2
1.1.3 The Tonle Sap system ............................................................................................................ 3
1.2 The Mekong fisheries ................................................................................................................... 4
1.2.1 Fish community structure ....................................................................................................... 4
1.2.2 Fish migration system ............................................................................................................ 6
1.2.3 Socio-economic importance of fisheries in the Lower Mekong Basin .................................. 7
1.3 Challenges of inland capture fisheries in the Lower Mekong Basin ............................................. 9
1.3.1 Water infrastructure development in the Mekong ................................................................. 9
1.3.2 Habitat loss ........................................................................................................................... 13
1.3.3 Open-access fisheries ........................................................................................................... 14
II. Objectives ......................................................................................................................................... 14
III. Materials and methods .................................................................................................................... 15
3.1 Study area .................................................................................................................................... 15
3.2 Data collection ............................................................................................................................ 16
3.3 Statistical analysis ....................................................................................................................... 18
3.3.1 Seasonal partitioning ............................................................................................................ 18
3.3.2 Data preparation ................................................................................................................... 18
3.3.3 Flow seasonality and predictability ...................................................................................... 19
3.3.4 Spatial and temporal description of fish community ........................................................... 19
3.3.5 Species diversity .................................................................................................................. 20
3.3.6 Linear regression models ..................................................................................................... 20
IV. Results ............................................................................................................................................ 21
4.1 Summary of recorded catches in the Lower Mekong Basin ....................................................... 21
4.2 Overall fish assemblage structure and diversity .......................................................................... 23
4.2.1 The Lower Mekong River .................................................................................................... 23
4.2.2 The complex Mekong-3S system ......................................................................................... 24

v
4.2.3 The Tonle Sap system .......................................................................................................... 25
4.3 Spatial variation in fish abundance distribution .......................................................................... 27
4.3.1 The Lower Mekong River .................................................................................................... 27
4.3.2 The Mekong-3S system ....................................................................................................... 28
4.3.3 The Tonle Sap system .......................................................................................................... 28
4.4 Temporal dynamics of fish community ...................................................................................... 31
4.4.1 Temporal variation of fish community in the Tonle Sap River and Lake ............................ 31
4.4.2 Temporal dynamics of fish communities in the Lower Mekong system ............................. 40
V. Discussion ........................................................................................................................................ 50
5.1 Fish species richness and diversity ............................................................................................. 50
5.2 Spatial variation in fish community structure ............................................................................. 52
5.3 Temporal variation in fish community structure ......................................................................... 55
5.3.1 Flow variation in the Lower Mekong system ...................................................................... 55
5.3.2 Intra-annual variation in fish community structure .............................................................. 55
5.3.3 Inter-annual variation in fish community structure .............................................................. 57
VI. Conclusion and implications for fisheries management and conservation ..................................... 59
6.1 Conclusion .................................................................................................................................. 59
6.2 Implications for fisheries management and conservation ........................................................... 60
VII. Further research ............................................................................................................................. 62
References ............................................................................................................................................. 64
Annexes ................................................................................................................................................ 75
Annex 1. List of indicator species in each cluster in the Lower Mekong River ............................... 75
Annex 2. Important species contributing to overall beta diversity ................................................... 77

vi
PART II: PUBLICATIONS
Article 1. Large-scale patterns of fish diversity and assemblage structure in the longest-tropical
river in Asia.
Ratha Chea, Sovan Lek, Peng Bun Ngor, Gaël Grenouillet 2016
Ecology of Freshwater Fish, 2016, 1–11
Article 2. Spatial and temporal variation in fish community structure and diversity in the largest
tropical flood-pulse system of Southeast Asia.
Peng Bun Ngor, Gaël Grenouillet, Nam So, Sea Phem, Sovan Lek
Ecology of Freshwater Fish (accepted, in press)
Article 3. Evidence of indiscriminate fishing effects in one of the world's largest inland fisheries.
Peng Bun Ngor, Kevin McCann, Gaël Grenouillet, Nam So, Bailey McMeans,
Evan Fraser, Sovan Lek
Scientific Reports 2018 (in revision)
Article 4. Flow alterations by dams shaped fish assemblage dynamics in the complex Mekong-3S
river system.
Peng Bun Ngor, Pierre Legendre, Thierry Oberdorff, Sovan Lek
Ecological Indicators, 88 (2018), 103-114.
Article 5. Fish assemblage responses to flow seasonality and predictability in a tropical flood
pulse system.
Peng Bun Ngor, Thierry Oberdorff, Phen Chheng, Christophe Baehr,
Gaël Grenouillet, Sovan Lek
Ecoshpere (in revision)


vii
PART I: SYNTHESIS


1
I. Introduction
Inland waters cover lakes, reservoirs, rivers, wetlands and coastal transitional waters (Welcome
2001, Welcomme et al. 2010), extending over an area of about 7.8 million km2 (de Graaf et al. 2015).
Inland waters cover only about 0.01% of the world’s water and about 0.8% of the earth surface (Revenga
and Kura 2003, Dudgeon et al. 2006), yet support humankind countless environmental goods and
services, of which fish are among the most important resources, supplying food, nutrition, income,
livelihoods and recreation to tens of millions of people on earth (Béné et al. 2015, de Graaf et al. 2015,
Lynch et al. 2016). Some 13,000 inland fishes from 170 families strictly live in freshwaters (Lévêque
et al. 2008), making up around 41% of all fish species and 20% of all vertebrate species (Helfman et al.
2009). Inland capture fisheries employ about 61 million people 50% of whom are women (Bartley et
al. 2015). Globally, catches in inland waters yielded 11.9 million tonnes in 2014 (11.3% of the world
total capture fish production) (FAO 2016), with an average annual growth between 2 and 3% since 1950
(Allan et al. 2005, Bartley et al. 2015). Albeit positive trends, fisheries data reported by FAO member
states are of major concern in terms of its reliability (Watson and Pauly 2001, Bartley et al. 2015).
World fisheries catches are shown declining when corrective measures are considered in its fish catch
estimation (Watson and Pauly 2001, Pauly et al. 2002). Evidence suggests that inland wild fish are
declining or overharvested particularly in the tropical Asia (Allan et al. 2005, Welcomme et al. 2010),
the region exceptionally rich in flora and fauna, yet attract comparatively little ecological research and
lesser conservation effort on biodiversity (Dudgeon 2000, Allen et al. 2012). A typical example of this
is the Mekong River Basin and its fisheries, one among the world’s most biodiverse rivers and has been
designated to be part of the world’s 35 biodiversity hotspots (Baird 2006, Mittermeier et al. 2011,
Vaidyanathan 2011). Arguably, Tonle Sap, among the world’s largest tropical floodplains, has been
studied the least with regards to its hydrology-ecology interactions (Junk et al. 2006, Kummu et al.
2006, Arias et al. 2013, Sabo et al. 2017, Ngor et al. 2018a).
1.1 A brief about the Mekong system
1.1.1 The Mekong River
The Mekong River originating in Tibetan plateau and running for some 4,350 km through
China, Myanmar, Lao PDR, Thailand and Viet Nam is the largest in Southeast Asia, the 12th longest on
the planet, the 8th world’s largest in terms of flows having a mean annual discharge of approximately
475 km3 and the world’s 21st largest in terms of area draining around 795,000 km2 (van Zalinge et al.
2004, Gupta and Liew 2007). The Upper Mekong which is called Lancang Jiang contributes around
16% to the total annual mean flow while the Lower Mekong Basin (LMB) which begins at the Golden
Triangle marking the borders of Thailand, Lao PDR, China and Burma, and consists of Cambodia, Lao
PDR, Thailand and Viet Nam shares the remainder of the total flow (~84%). The Mekong’s major
tributaries systems develop in the LMB. Among these, the Sekong, Sesan, Srepok Rivers together

2
known as the 3S system, contributing ~20% of flow and the Tonle Sap River and Lake (~9% of flow)
are among the largest tributaries and constitute significant parts of the LMB (MRC 2005, 2010).
The Lower Mekong River (LMR) forms the Lao-Thai border for a river reach of approximately
900 km (van Zalinge et al. 2004). There is an inland delta at the geological fault line which forms the
21-meter high Khone Falls on the Lao-Cambodian border. At Kratie ~545 km from the sea, the river
becomes a lowland river. At Phnom Penh, ~330 km from the sea, the Mekong River is joined by the
Tonle Sap River, where it splits into the Mekong proper and the Bassac forming a large estuarine delta
before discharging into the South China Sea.
The Mekong annual flood pulse takes place between June and October. It is influenced by the
tropical monsoonal climate and flood runoff which converges and accumulates into a single seasonal
flow. This results in a distinct seasonality in the annual hydrological cycle: flood (wet) season and low-
flow (dry) season. During the flood season, the discharge is 30 times greater than in the dry season at
Pakse and up to 53 times at Kratie (van Zalinge et al. 2004). The hydrological cycle (Fig. 1) is a main
ecological driver structuring up- and downstream aquatic communities in the Mekong including fishes
that seasonally migrate for spawning, feeding/rearing and refuge (Valbo-Jorgensen and Poulsen 2000,
Poulsen et al. 2002, Baran 2006).
Fig. 1. Observed hydrological cycle patterns, based on daily water levels over nine-year period (2007-
2015) on the Mekong mainstream in Stung Treng Province. Thick red line curve represents the nine-
year mean daily water levels.
1.1.2 The 3S Rivers
The 3S Rivers drain northeastern Cambodia, southern Lao PDR, and Viet Nam’s Central
Highlands. Their sources originate in the Central Highlands of Viet Nam, from where the Sekong (SK)

3
River begins its flow toward southern Lao PDR and then northeastern Cambodia where it merges with
the Sesan (SS) and Srepok (SP) Rivers. The Sesan and Srepok flow directly from Viet Nam to
Cambodia, and the three rivers meet over an approximate distance of 40 km before forming the
confluence with the Mekong mainstream at the provincial town of Stung Treng in Cambodia
(MacQuarrie et al. 2013).
The 3S Basin covers a surface area of about 78,650 km2 of which 33%, 29% and 38% is shared
by Cambodia, Lao PDR and Viet Nam, respectively (Piman et al. 2013, Constable 2015). The basin’s
annual discharge contributes about 20% to the total annual flow of the Mekong mainstream (91,000 ×
106 m3 or an average of 2,886 m3/s), making the 3S the largest tributary of the Mekong Basin (MRC
2005, Adamson et al. 2009), and the main hydrological contribution to the Mekong mainstream between
Pakse, Lao PDR and Kratie, Cambodia. The 3S flow contribution indeed exceeds that from the upper
Mekong in China (16%) (MRC 2005, Adamson et al. 2009) and plays a significant part in the seasonal
reverse flow of the Tonle Sap River (MRC 2005). Therefore, flow regulations resulting from
hydropower development in the 3S system could have significantly adverse effects, not only on flow
regimes, ecosystems and overall biological integrity of the 3S system itself, but also on the Mekong-3S
system, the downstream Tonle Sap system and the Mekong delta (Ziv et al. 2012, Arias et al. 2014b).
1.1.3 The Tonle Sap system
The Mekong River, roughly 4,300 km from its source (Halls et al., 2013a), meets with the Tonle
Sap River on the right bank at the Chaktomuk junction in the capital city of Phnom Penh. The Tonle
Sap Lake which is situated in the heart of Cambodia contains the largest continuous areas of natural
wetland habitats remaining in the Mekong system (van Zalinge et al. 2004), and the largest wetlands in
Southeast Asia. The lake was formed some 5 - 6000 years ago (Carbonnel 1963), is located at the apex
of the Tonle Sap River around 130 km to the northwest of Chaktomuk junction. The Tonle Sap River
and Tonle Sap Lake form the Tonle Sap River and Lake System (TSRL) which is of high biological
productivity and considered as one of the world’s largest tropical inland fisheries (Baran 2005, Baran
et al. 2013b). It has become a world Biosphere Reserve approved by the United Nations Educational,
Scientific and Cultural Organization (UNESCO) since 1997, given the wetlands of global significance
for its biodiversity conservation value (Davidson 2006). The TSRL catchment covers an area of 85,790
km2 or 11% of the Mekong Basin (MRC, 2003). The waters for the system originates mainly from the
Mekong River (54%) while the lake tributaries contribute 34% and the rest is from precipitation (M.
Kummu et al., 2014). During the wet season (June-October), Tonle Sap River flows from the Mekong
River to the Tonle Sap Lake (inflow) when the Mekong waters rise faster than the lake, expanding its
mean surface area from ~3,500 to ~14,500 km2, inundating huge floodplain areas surrounding the
TSRL, with maximum depths in the lake recorded at 6 to 9 meters in late September to early October
and minimum depths of around 0.5 meter in late April (MRC, 2005).

4
The TSRL’s fisheries productivity reaches its peak during this flooding period as both
migratory fishes from the Mekong and resident fishes in the lake invade the floodplains for
feeding/rearing and reproduction. Eggs, larvae and fry of fish that spawn upstream in the Mekong
mainstream are also carried by the flow and dispersed into the TSRL’s sourrounding floodplains
through numerous channels, streams and man-made cannals for feeding/rearing, nurseries and growth.
When the Mekong flood recedes (September/October) and the Tonle Sap River reverses its flow
direction (outflow), large numbers of fish migrate back to the Tonle Sap Lake, then the Tonle Sap River
and Mekong River for dry-season refuge. It is during this period of receeding water (October – March)
when fishing activities are intensifying in the Tonle Sap Lake and River Systm as well as in the Mekong
River. The fishery in Tonle Sap River is highly predictable, and usually peaks in December and January
in a time window of 6/7-1 days before full moon during which the river is described as ‘packed solid
with fish’ (Lieng et al. 1995 p. 257, Halls et al. 2013c). Such events can still be observed nowadays at
the stationary trawl bagnet (Dai) fishery which has been operating in the Tonle Sap River for more than
a century (Halls et al. 2013c).
1.2 The Mekong fisheries
Fish communities in the Mekong River Basin are extremely diverse and characterized by the
presence of large distance migratory species (Rainboth 1996, Baran et al. 2001, Poulsen et al. 2002).
Natural annual flood pulses inundate huge floodplain areas and drive enormous fish production upon
which millions of people depend for their livelihoods (van Zalinge et al. 2004, Hortle 2007, So et al.
2015). The geographical space, habitat heterogeneity, river gradients and physicochemical as well as
climatic factors, additionally, define broad-scale patterns of the spatial fish diversity and community
composition of the river basin with species richness and level of endemism decreasing towards higher
altitude (Kang et al. 2009, Chea et al. 2016).
1.2.1 Fish community structure
The Mekong Basin harbors an estimated 1,200 fish species (Rainboth 1996), with 877 species
recorded, 18% of which is endemic to the system (Ziv et al. 2012, Baran et al. 2013b) while the Mekong
Fish Database reports up to 911 species (MFD 2003). The LMB countries together possess one of the
world’s highest fish diversity per square kilometer; only French Guiana and Suriname in South America
share similar or higher fish species diversity per unit area of land (Baran et al. 2013b). The largest

5
fishery of the basin takes place in the extensive floodplain of the
Tonle Sap (van Zalinge et al. 2004); the complex river-lake
system which hosts an estimated 296 fish species, making it the
third most fish species-rich lake after Lake Malawi (438 fish
species) and Lake Tanganyika (316 fish species) (Baran et al.
2013b). Capture fisheries production in the LMB was estimated
at approximately 2.3 million tonnes annually (MRC 2010, Hortle
and Bamrungrach 2015), equivalent to around 2% of the world
total fisheries production or approximately 19.3% of the world
freshwater capture production which is 11.9 million tonnes (FAO
2016). Of the LMB’s estimated fish biomass, white, black and
grey fishes (see definitions in the next section) share ~34%, 50%
and 16%, respectively; whereas of the total number of species,
white, black and grey fishes represent 37%, 13% and 50%,
respectively (Baran et al. 2013b).
Mekong fishes have different sizes ranging from very
small-sized gobies and minnows, which sexually mature at a
length of less than 15 mm, to some of the largest inland fishes on
the planet such as the Mekong giant catfish (Pangasianodon
gigas, max. length ~3 m, max. published weight: 350 kg), the
enormous stingray (Himantura chaophrya, max. length ~2.4 m ;
max. published weight: 600 kg), and the Mekong giant carb
(Catlocarpio siamensis, max. length 3 m, max. published weight
300 kg). Mekong fish size composition is given in Fig. 2.
Fishes in this basin are categorized into at least three
broad ecological guilds in accordance with their ecological
characteristics and migration patterns: white, black and grey fish
(Poulsen and Albo-Jørgensen 2000, Welcome 2001, Poulsen et
al. 2002). White fishes perform long-distance migrations between the Mekong mainstream and
floodplains as well as major tributaries; the black fishes are floodplain residents, spending their life in
lakes and swamps on floodplains adjacent to rivers and moving to flooded areas during the flood season;
and grey fishes, ecologically intermediate between the white and black fishes, undertaking short-
distance migrations in local tributaries and not spending their life in floodplain ponds during the dry
season (van Zalinge et al. 2000, Welcome 2001, Valbo-Jørgensen et al. 2009, MRC 2010). Apart from
these three main groups of fish, some freshwater fishes remain within the main river channels and many
fishes are confined to tributaries and hill streams (Rainboth 1996). In the lower reaches of the river
Order No. of species
Cypriniformes 382
Perciformes 206
Siluriformes 125
Clupeiformes 32
Beloniformes 27
Tetraodontiformes 20
Pleuronectiformes 18
Anguilliformes 14
Gasterosteiformes 13
Synbranchiformes 13
Rajiformes 12
Carcharhiniformes 8
Aulopiformes 7
Atheriniformes 7
Scorpaeniformes 7
Osteoglossiformes 5
Orectolobiformes 3
Cyprinodontiformes 2
Elopiformes 2
Batrachoidiformes 2
Lophiiformes 2
Characiformes 1
Gonorhychiformes 1
Osmeriformes 1
Gadiformes 1
Total 911 Source: MFD, 2003.

6
system in the Mekong delta, many euryhaline (salt-tolerant) coastal and estuarine fishes as well as some
marine visitors are also present in reported catches (MRC 2010). In the Tonle Sap Basin, white fishes
belong mostly to Cyprinidae and Pangasiidae while black fishes contain species from Channidae,
Clariidae, Bagridae, Anabantidae and Osphronemidae and grey fishes refer to some species from
Siluridae and Notopteridae (van Zalinge et al. 1998, Lim et al. 1999, Lamberts 2001, Welcome 2001,
Campbell et al. 2006, Halls et al. 2013b, 2013c).
Fig. 2. Fish size composition of the Mekong Basin (data source: MFD 2003)
1.2.2 Fish migration system
Mekong fishes migrate longitudinally and laterally among critical habitats of the Mekong
mainstream and its tributaries or between the floodplains and deeper areas of lakes or permanent water
bodies. Migration usually takes place for all life stages of fish and is associated with dry-season
refuging, flood-season feeding and rearing, and migrations for spawning as well as escaping from
adverse environmental conditions (Welcome 2001, Poulsen et al. 2002). Generally, three different fish
migration systems have been identified in the LMB (Valbo-Jorgensen and Poulsen 2000, Poulsen et al.
2002, 2004). The first migration system takes place in the lower part of the Mekong system between
deep pools of the Mekong mainstream in Kratie-Stung Treng reach (dry-season refuge habitats) and the
floodplain of Tonle Sap Lake, area South of Phnom Penh and the Mekong delta of Viet Nam together
known as flood-season feeding and rearing habitats. The second occurs in the middle part of the LMB
(between Khone Falls and Loei Province) and is characterized by the migration between the rapids and
deep pools of the Mekong mainstream and the floodplain habitats which are connected with the
Mekong’s major tributaries. The third migration system occurs in the areas of upper part of the LMB in

7
Jan
Feb
Mar
Apr
MayJunJul
Aug
Sep
Oct
Nov
Dec
Concentration of fish in permanent water bodies.
Longitudinal migrations to spawning grounds.Spawning.
Lateral movements of juvenile and adult fish from seasonal to permanent waterbodies.
Flood season
Dry season
Transition period
Drift of larvae to feeding areas on the floodplain.
Lateral movement of adult fish into floodplain areas for feeding and growth.
Longitudinal movement to dry season refuges, and dispersal.
the downstream stretch of Loei River in Thailand to Luang Prabang in Lao PDR. This last migration
reach is represented by rapids with deep pools and restricted floodplain habitats.
In the three migration systems, hydrology plays a central role in structuring up- and downstream
fish community dynamics such as triggering fish to migrate among critical habitats during their life
cycles (Poulsen et al. 2002, Baran 2006). General seasonal migration patterns of the Mekong fishes
particularly those with white and grey ecological charateristics are reflected in seasonal hydrological
patterns. For instance, fishes migrate for spawning in early wet season in May and June when the
Mekong’s water levels start rising. Afterwards, between July and November, both adult fish and larvae
move to floodplains for feeding and growth. When water levels are falling particularly in December
and January, these fishes migrate to permanent water bodies such as deep pools in the Mekong
mainstream or lakes, and then remain sedentary in the permanent water bodies during the dry season
(February – April). Fig. 3 gives a generalized life cycle of a Mekong fish species. Changes in
hydrological patterns caused by anthropogenic activities such as infrastructure development are highly
likely to distrupt the river biological system i.e. fish migration and reproduction success, which in effect
alters fish community structure and reduce the overall fisheries productity in the Mekong system.
Fig. 3. A generalized life cycle of a Mekong fish species (Sverdrup-Jensen 2002)
1.2.3 Socio-economic importance of fisheries in the Lower Mekong Basin
In 2015, the total population of the LMB was estimated at 68.9 million (So et al. 2015). Some
80% of the LMB’s dwellers is rural, and the economy highly depends on farming, fishing and
aquaculture (Hortle 2009). About 66% of the LMB population was engaged in capture fisheries either
part-time or seasonally (MRC 2010). At country level, ~80% of rural households in Cambodia, Lao

8
PDR and Thailand and 60-95% of households in Viet Nam delta were involved in capture fisheries
(Hortle 2007). In large water bodies such as the Tonle Sap, commercial fishing appears to represent
more than 40% of household (Ahmed et al. 1998).
Inland fish and other aquatic animals make up of more than half the animal protein consumed
by people in the LMB which is more than three times the world average of 16% (Baran et al. 2013b),
and which range from ~50% in Lao PDR and Thailand to ~60% in Viet Nam and ~80% in Cambodia
(Hortle 2007). The average consumption of aquatic animals in the basin is 46 kg per capita per year,
similar to the Southeast Asian rate of 51 kg/person/year but significantly higher than the world average
of 24 kg/person/year (Baran et al. 2013b). Other inland aquatic animals such as frogs, insects, clams,
shrimps, snails and snakes contribute ~6% to the total animal protein consumption (Hortle 2007).
A recent estimate indicates that, based on the first sale landing prices, the LMB capture fisheries
is worth about US$11 billion annually in 2015 (So et al. 2015). The largest single fishery in the basin
is the century-old dai or stationary trawl bagnet fishery on the Tonle Sap River. The fishery operates
between October through March and targets mainly white and grey fishes that migrate out of the
floodplains surrounding the Tonle Sap Lake to the main river channels for dry season refuge. Based on
first-sale prices, the value of the fishery, on average, is estimated at around US$10 million seasonally
(Ngor et al. 2015b). First sale fish prices recorded at the dai fishery indicate that there have been
increasing fish prices observed particularly since the fishing season of 2006-2007 at the time when there
was also global food crisis. Fish prices of small mud carps (Henicorhynchus spp.), recorded over 20-
year period at the dai fishery are shown in Fig. 4. These are ecological keystone species which are the
most abundant with their critical role in food security throughout the LMB and important prey species
for many predatory fishes and Irrawaddy dolphins (Roberts and Baird 1995, Hurwood et al. 2008, Baird
2011, Fukushima et al. 2014, Ngor et al. 2015a).
Fig. 4. First sale landing prices for small mud carps (Henicorhynchus spp.) 1995-2014 (Ngor et al.
2015b). Note: the average exchange rate is about Riel 4,000 to US$1.00.

9
1.3 Challenges of inland capture fisheries in the Lower Mekong Basin
Many freshwater faunal species particularly fishes have experienced severe declines in their
ranges and abundances, and they are now far more endangered than their marine or terrestrial
counterparts (Jenkins 2003, Strayer and Dudgeon 2010). In the Mekong Basin, several dangers are
identified as threats to the sustainability of the Mekong fish and fisheries. These threats stem from
sources both outside and inside the fishery sector including population growth, hydropower dams, water
extraction and diversion for agriculture, widespread habitat fragmentation and loss, water quality
degradation, mining, farming expansion and intensification, land-use change, urbanization, climate
change, pollution, overharvesting and introduced species etc. Among these threats, water resources
infrastructure development, habitat loss and open-access nature of fisheries (overharvesting) in the
region are among the great dangers threatening the region’s fishes and fisheries (van Zalinge et al. 2000,
Welcome 2001, Halls and Kshatriya 2009, Valbo-Jørgensen et al. 2009, Welcomme et al. 2016, 2010,
Ferguson et al. 2011, Ziv et al. 2012, Grumbine et al. 2012, Cochrane et al. 2014, Kummu et al. 2014,
Winemiller et al. 2016, Sabo et al. 2017).
1.3.1 Water infrastructure development in the Mekong
During the last three decades or so, infrastructure development significantly poses by far the
most significant threat to the Mekong River ecosystem, biodiversity and its fisheries (Arias et al. 2012,
2014b, Ziv et al. 2012, Piman et al. 2013, Cochrane et al. 2014, Winemiller et al. 2016, Sabo et al. 2017,
Ngor et al. 2018b). For example, at least six large dams have been built in the upper Mekong River
since mid-1990s (Fan et al. 2015, Winemiller et al. 2016) and in the LMB, two mainstream dams are
under construction in Lao PDR and 10 others are planned. Among 144 tributaries dams, 42 are in
operation, 27 under construction, 17 licensed and 58 planned by 2030 (Nielsen et al. 2015, Schmutz
and Mielach 2015, Ngor et al. 2018b). These dams are known to disrupt river continuity, block
migration routes of riverine fishes, dampen natural flood pulses, mute flow seasonality, fragment
habitats, degrade water quality, and alter sediment and nutrient dynamics as well as other
biogeochemical processes, which, in effect, alters the structure of aquatic faunal communities that adapt
to natural seasonal flow dynamics as part of their life cycles (Collier et al. 1996, Agostinho et al. 2004,
Graf 2006, Poff et al. 2007, Latrubesse et al. 2017, Sabo et al. 2017, Ngor et al. 2018b). Specifically,
dams generate hydropower-related pulsed flows e.g. hydropeaking reacting to energy demands (from
hourly to seasonally) which adversely affect riverine fishes and other aquatic organisms through, among
other factors, stranding/extirpation, downstream displacement and spawning/rearing disruption (Young
et al. 2011, Schmutz et al. 2015, Kennedy et al. 2016, Tonolla et al. 2017). In total, these pressures may
lead to fish community compositional changes, fish recruitment failure and a continued diminishment
of fisheries productivity in the system (Poulsen et al. 2002, ICEM 2010, Baird 2011, Grumbine et al.

10
2012, Ziv et al. 2012, Winemiller et al. 2016, Ngor et al. 2018b). Fig. 5 provides an overview of
hydropower projects in the Mekong Basin.
For example, under the current functioning dams, the 3S’s dry seasonal flow shows an increase
of 28% and the wet seasonal flows a decrease of 4%, when measured at the 3S outlet (Piman et al.
2013). Similarly, hydropower dams upstream of the Mekong have caused the most distinct changes to
the Mekong’s flow, and their cascade impacts have been demonstrated from Chiang Sen in Thailand
(the beginning of the LMB) as far as downstream in the Tonle Sap River in Cambodia which reduces
flood pulses by 23% and 11% in rising and falling rates with observed changes taking place since 1991
(Arias et al. 2014a, Cochrane et al. 2014). These changes in natural flow dynamics and flood pulses
have severe implications for fish community structure because, of an estimated 1200 fish species with
877 species recorded in the Mekong Basin (Rainboth 1996, Baran 2006, Baran et al. 2013b), about 87%
are longitudinal and lateral migratory species (white and grey fishes) (MRC 2010, Baran et al. 2013b).
Also, at least 89 migratory species including 14 endangered and critically endangered species
characterize fish community from the 3S system (Baran et al. 2013a). In addition, of the 161 Mekong
endemics, 17 species exist exclusively in the 3S Basin, and nowhere else on the planet (Baran et al.
2013a). More serious impacts are also expected for the fishes in the Tonle Sap Basin, hosting some 296
fish species (Baran 2005, Baran et al. 2013b). These fishes depend on natural seasonal-predictable flows
and flood pulses as the main ecological trigger to disperse, reproduce and seek refuge (Valbo-Jorgensen
and Poulsen 2000, Poulsen et al. 2002, 2004, Sverdrup-Jensen 2002, Baran 2006). Fig. 6 shows
temporal change in daily water levels in the Mekong mainstream in Stung Treng Province over 95-year
periods. Observably, there has been a general significant decrease in wet season flow (June-November),
and an increase of dry season flow (December-May). Hydropower dams upstream in China have been
attributed to cause the most ‘distinct change’ in the Mekong flow regimes as compared to other
anthropogenic activities such as climate change (Cochrane et al. 2014, Winemiller et al. 2016, Sabo et
al. 2017).

11
Fig. 5. Map showing hydropower dams in the Mekong Basin at different stages: existing, under-
construction and planned. Data source: MRC hydropower project database 2015.

12
Fig. 6. Temporal raster plot of daily water levels (m) of the Mekong River, Stung Streng Province,
1920-2015.
Fig. 7 below, additionally, displays the maximum and minimum water levels in September and
April respectively over 95-year periods in the Mekong mainstream in Stung Treng Province. A
pronounced decrease in the maximum flow in September (wet season) and increase in minimum flow
in April (dry season) are observed.
Fig. 7. (a) Maximum daily water levels in September and (b) minimum daily water levels in April
between 1920 and 2015 with pronounced increase in the wet season and decrease in the dry season
flows.

13
1.3.2 Habitat loss
Wetlands and river habitat degradation and losses in freshwater ecosystems are widespread
worldwide. These habitats are critical for fish spawning, rearing, feeding, or for dry reason refuge. In
the Mekong system, dry season refuge are usually situated in perminant water bodies or in the Mekong
mainstream (with deep pools) such as in Kratie and Stung Treng Provinces in Cambodia and
Champasack Province in southern Lao PDR. The critical habitats are also found either in the main river
channel of the major tributaries or floodplains such as the 3S system, the Tonle Sap system and areas
south of Phnom Penh and the Mekong delta. Natural flow dynamics ensure the lateral and longitudinal
connectivity among these habitats. Many Mekong riverine fishes are known to migrate longitudinally
up- and downstream and laterally between tributary rivers and floodplain areas to access the crtical
habitats to complete their lifecycles. Therefore, dams physically block migrating fishes from accessing
the critical habitats to complete their life cycle. Also, critical habitats such as deep pools that serve as
dry season refuge in the main river channel are filled up with particles, sediments released by erosions
triggered by hydropower related pulsed flows. As a result, fish is disabled to access these critical
habitats which reduces feeding, rearing, spawinng and recruitment success, and thereby, diminishing
the system’s overall productivity.
Habitat loss is also linked to cumulative effects of flow regulation which is caused by water
infrastructure development. Various models indicate that effects of hydropower dams distinctly reduce
wet season water levels and increase dry season water levels (Piman et al. 2013, Arias et al. 2014a).The
reduction in water levels in the flood season means that seasonally flooded habiats (spawning, rearing
and feeding habitats) are less available for fish. In the Tonle Sap, seasonally flooded habitats and gallery
forest are estimated to have been reduced by 13 to 22% and 75 to 83%, respectively, whereas the
increase in water levels in dry season (i.e. 18 to 21% in the open area of Tonle Sap) is causing permanent
submersion of existing vegetation and forests (Arias et al. 2012) triggering a permanent dieback
situation of the plants in the submerged area. Thus, these type of changes in the Mekong’s natural flow
patterns ultimately lead to habitat fragmentation and destruction.
Moreover, other habitat losses are caused by the expansion of agriculture land, gathering of
fuelwood, as well as enlargement of settlements in the LMB floodplains as a result of increasing
population and government policies. Agriculture policies often focus more on the expansion and
intensification of rice farming and industrial crop cultivation. The conversion of flooded forests into
farmland and settlements have been accerlated during the last two decades (van Zalinge and Nao 1999,
Hortle et al. 2004). These flooded forests are imortant for fishes as shelter, sources of food supply and
breeding areas.
14
1.3.3 Open-access fisheries
Both increased fishing effort, efficiency of fishing gears and increased human population size
have likely contributed to high fishing pressure and, thus, overexploitation of the fisheries resources.
For example, the use of monofilament nylon gillnets in the LMB has accelerated the decline of some
common and commercial species such as Cirrhinus microlepis, Boesemania microlepis, Probarbus spp.
and Tenualosa thibaudeaui, Pangasianodon hypophthalmus, Wallago leeri (maxTL: 150cm) and
Irrawaddy dolphins (van Zalinge and Nao 1999, Deap et al. 2003, Baird 2006). These highly efficient
nets were considered as a ‘wall-of-death’ for many migrating fishes (Hortle et al. 2004 p. 33). The
problems caused by these fishing techniques have likely been exacerbated by population growth in the
countries sharing the LMB; statistics show that the population has increased about three folds between
1960 and 2015 with about 80-85% rural dwellers (World Bank Group 2015). Factors like free entry into
fishing (open-access), affordability of fishing gears (Deap et al. 2003, Hortle et al. 2004), and the
combination of rising population along with the lack of complementary and alternative livelihood
options, has resulted in millions of people moving into the fishing sector. In addition, prevailing illegal
fishing practices such as the use of dynamite, mosquito netting with fences and other destructive fishing
methods have put high pressure on fish stocks in the region. Combined with many other streesors (i.e.
hydrological alterations, pollution, invasive species and climate change), Mekong fishes and fisheries
are facing severe challenges in sustaining its productivity that has for centuries supported millions of
peoples’ livelihoods in the region.
II. Objectives
As briefly described, rapid water infrastructure development in the Mekong region (particularly
hydropower dams and irregation schemes) since 1991 have changed the perception of the pristine
Mekong system, one of the world’s most biodiverse river basins (Cochrane et al. 2014, Winemiller et
al. 2016). The Mekong’s natural flow patterns are considered a key environmental driver which plays
a main role in structuring the communities of aquatic organsims both up and dowstream (Brownell et
al. 2017). Although change in the Mekong flow patterns have been documented to a certain extent, its
impacts on fishes and fisheries in some critical areas such as the Mekong-3S system and the Mekong
largest wetland of the Tonle Sap are largely undocumented (Arias et al. 2012, Piman et al. 2013,
Cochrane et al. 2014). Further, status and trends of fisheries in the LMB during this last decade have
not been documented albeit the perception that the region’s fisheries have been declining (MRC 2010).
Aguably, among the tropical largest wetlands on the planet, the Mekong River and the Tonle Sap, which
supports one of the world’s biggest freshwater fisheries, have received little ecologcial research and
conservation attention (Dudgeon 2000, Junk et al. 2006, Vaidyanathan 2011, Allen et al. 2012, Ngor et
al. 2018a). Therefore, there is an urgent need to document and update the system’s fish biodiversity, i.e.

15
to generate reliable information about fish species diversity, species’ distribution, fish community
composition and evolution through space and time. Combined with data on their ecological
requirements the new insights from research can inform basin development planning as well as fisheries
management and fish conservation actions.
In recognition of this important fact, the overall objective of the study is to investigate the
dynamics of spatial and temporal fish community structure in the Lower Mekong system i.e. Lower
Mekong River (LMR) and its major tributaries. To achieve the overall objective, the specific objectives
are set out as follows:
(i) describe large-scale spatial fish diversity patterns and assemblage structure in LMR and
its major tributaries.
(ii) examine spatial and temporal variation of fish assemblages in the complex Tonle Sap
River and Lake system;
(iii) explore the signature of ‘indiscriminate fishing’ effects by examining the rates of
temporal dynamics of the entire fish biomass composition of the Mekong’s largest,
commercial-scale stationary trawl bagnet Dai fishery operating in the Tonle Sap River.
(iv) investigate spatial and temporal fish community responses to flow changes in regulated
and unregulated rivers of the Lower Mekong system.
This thesis is divided into two main Parts. Part I is the Synthesis and Part II comprises the
corresponding publications. In this Synthesis, Article 1-5 contribute to the overall description on broad-
scale spatial and temporal variation in fish diversity patterns and assemblage structure in the LMR and
its major tributaries (objective i). While Article 1 describes spatial fish distribution patterns in the LMR
(objective i), Article 2 specifically investigates spatial and temporal variation of fish assemblages in the
complex Tonle Sap River and Lake system (objective ii). Article 3 exclusively examines the
‘indiscriminate fishing’ effects of the Tonle Sap fisheries, by analysing temporal changes in the biomass
of 116 fish species that seasonally utilize the Tonle Sap River system (objective iii). Finally, Article 4
and 5 scrutinize the spatial and temporal fish community responses to flow changes in regulated and
unregulated rivers of the Lower Mekong system.
III. Materials and methods
3.1 Study area
This study covers the Lower Mekong system: the LMR and its major tributaries. LMR extends
from the Golden Triangle which marks the borders of Thailand, Lao PDR, China and Burma, and which
consists of Cambodia, Lao PDR, Thailand and Viet Nam. Key largest tributaries of the LMB include
the TSRL and the Sekong, Sesan and Srepok Rivers known as the 3S Rivers (Fig. 8).

16
Fig. 8. Maps showing study sites in the Lower Mekong system.
3.2 Data collection
This study uses data from the long-term routine daily artisanal fish monitoring (2007-2014) in
the LMB and a standardized catch assessment of the stationary trawl Dai fishery (2000-2015), the
largest commercial fishery in the Mekong Basin. Data were made available by the Fisheries Program
of the Mekong River Commission (MRC) that technically and financially supported the monitoring and
catchment assessment programs.
For the daily artisanal fish monitoring, standard sampling procedures of the MRC (MRC 2007)
were applied. Fishers were trained on sampling procedures, fish identification and the use of data
recording forms. They were supervised by the fishery researchers from the fisheries line agencies and
research institutes of the MRC member countries with technical support from the MRC fisheries
17
monitoring specialist. Fish photo books containing more than 200 fish species were also made available
for all fishers to assist them in fish identification. Fish captured were identified to the species level and
counted. Unidentified species were kept in formalin and taken to laboratory in the central office in each
of the respective countries for further identification by professional taxonomists. At the end of each
sampling quarter, the fishery researchers collected all recorded forms and data from all fishers. The
recorded data were cross-checked with fishers for its accuracy and completeness before being brought
to the national central offices for transfer into the national fish monitoring databases. The databases
were quarterly cleaned and synchronized into a regional database with the help of an MRC database
expert and capture fisheries specialist prior to the analyses.
For the Dai fishery, time series data of the fishery’s standardized catch assessment between
2000 and 2015 were used. The fishery operates seasonally from October through February/March in a
specific location along the lower section of the Tonle Sap River, stretching about 4-30 km north of
Phnom Penh. All Dai (64 units) are organized into 14 rows (row 2 to row 15) and operated individually
or jointly of up to 7 units in a single row with the most upstream row 15 situated close to the Tonle Sap
Lake. General concepts and formula for assessing catches and catch composition are outlined in
Stamatopoulos (2002), and these concepts were used to frame the sampling protocols and assessing
catches of the fishery. The sampling unit was based on Dai unit and a randomly stratified sampling
method was used for the catch assessment. More specifically, Dai units were stratified based on: (i)
administrative space divided into two strata (Phnom Penh Municipality and Kandal Province), (ii) time
– the lunar period (low period and peak period) and (iii) Dai types (high yield and low yield Dai units).
Random sampling on catches per haul or catches per unit of effort (CPUE; including CPUE for species
in catch composition) and daily number of hauls of a Dai unit were conducted in each stratum, lunar
period and Dai type within each month for monthly catch estimate. Likewise, fishing effort (number of
active Dai units and active days) were recorded according to the stratification framework throughout
each fishing month over the whole fishing season. Apart from sampling data on total catch for each
species in each season, data were also obtained for the number, weight and length of some common and
commercial individual fish specimens caught per day of each fishing season. These species (i.e.
Henicorhynchus lobatus, Labiobarbus lineatus, Pangasianodon hypophthalmus, Cyclocheilichthys
enoplos, Cirrhinus microlepis, Osteochilus melanopleurus) are among the most ecologically,
socioculturally (food nutrition and security) and economically important species in the region (Rainboth
1996, Poulsen et al. 2004, Sabo et al. 2017). Therefore, they were used to examine the temporal changes
in body weight and length for this study (Article 3).
In addition, this study uses a fish species list (about 900 species and their ecological attributes)
that was obtained from the Mekong Fish Database (MFD 2003); the species list was updated by cross-
checking with FishBase (Froese and Pauly, 2017), the Catalogue of Fishes Online Database and other
literature sources i.e. (Rainboth 1996, Rainboth et al. 2012, Kottelat 2013). Moreover, other fish datasets

18
i.e. maximum total length (maxTL), trophic level and habitats in the water column were consulted from
FishBase.
Article 1 uses daily fish monitoring datasets from 38 sites along the Lower Mekong River
collected from November 2000 to December 2001. Article 2 uses 4-year daily time-series datasets from
artisanal fishers (stationary gillnets and cylinder traps) in six sites: first site located on the Tonle Sap
River and the other five sites situated in each of the five provinces around the Tonle Sap Lake from
2012 to 2015, whereas Article 3 uses the 15-year standardized seasonal catch assessment data of 116
fish species from the commercial-scale Dai fishery in the Tonle Sap River from 2000 to 2015. Finally,
Article 4 and 5 uses a 7-year daily stationary gillnet monitoring data (riverine habitat) from six sites in
the complex Mekong-3S system and Tonle Sap River.
3.3 Statistical analysis
3.3.1 Seasonal partitioning
In the Tonle Sap system (Article 2), the unique tropical flood pulse with flow reversal system i.e.
rising water levels with flow direction to the Tonle Sap Lake (inflow) and falling water levels with
reverse flow direction to the Mekong River (outflow) plays a pivotal role in influencing the intra-annual
variation in fish community structure. For this reason, three seasons are defined to reflect the importance
of the TSRL flood pulse system, using the 10-year mean intra-annual variation of daily water levels
measured at the Tonle Sap Lake (Kampong Loung in Pursat [PS]): inflow or high flow period (July-
October), outflow (November-February) and low-flow (March-June). In the Cambodian Mekong and
3S systems, seasonality is defined by a general wet and dry season of the tropical zone for the
investigation of the intra-annual variation of fish communities (Article 1, 4, 5). The seasonal partitioning
was based on 9-year mean daily water levels of the Mekong River, when entering Cambodia (at Stung
Treng [ST]), with wet season covering the period from June to November and dry season from
December to May.
3.3.2 Data preparation
For Article 1, all fish catches are transformed into relative abundance to reduce the effect of
varying fishing efforts between sites and averaged to annual mean relative abundance prior to analysis.
For Article 2, 4, 5, daily abundance data on stationary gillnet (and cylinder traps for Article 2 only) are
computed as mean daily samples and then aggregated into weekly species abundance data. Article 3 is
based on seasonal catch assessment data from all 64 units of the stationary trawl bagnet (Dai) fishery
operating in the Tonle Sap River.

19
3.3.3 Flow seasonality and predictability
To quantify the strength of seasonality, Colwell’s seasonality index (Colwell 1974) on site daily
water levels (Mekong, Sesan [3S], Tonle Sap) is computed using Colwells function of hydrostats
package. The seasonality index M/P which is the Colwell’s measure of contingency (M) standardized
by Colwell’s within-season predictability (P) (Colwell 1974, Tonkin et al. 2017) is used. In addition,
modern wavelet analysis is applied to quantify the strength of predictability of site hydrology, using
analyze.wavelet function, from WaveletComp package of the ‘mother’ Morlet wavelet (Roesch and
Schmidbauer 2014).
3.3.4 Spatial and temporal description of fish community
All data analyses are performed in R (R Core Team 2017). Summary statistics, cluster analyses
(using hclust with Ward hierarchical, and K-means clustering methods), boxplots, scatterplots, bubble
plots, violin plots, jittering plots and histograms are applied to give a descriptive overview on the spatial
and temporal dynamics of fish community structure, as well as weight and length of individual fishes
by site and entire species pool in relevant study locations.
Unconstrained ordination techniques, e.g. Nonmetric Multidimensional Scaling (NMDS) and
Principal Components Analysis (PCA) (Borcard et al. 2011, Kassambara 2017) are used to visualize
fish assemblage samples in a two-ordination plane for the description and analyses of spatial and
temporal variability of fish assemblage patterns in important areas of the LMB (Article 2, 4, 5). In
addition, for time-series analyses, various time-series analytical tools are applied (Article 2-5). These
tools include Whittaker–Robinson periodograms (Legendre and Legendre 2012, Dray et al. 2017),
cross-correlation analyses (Shumway and Stoffer 2011), wavelet and cross-wavelet analyses (Roesch
and Schmidbauer 2014).
For statistical tests, Permutational Multivariate Analysis of Variance (PERMANOVA) using
adonis function of vegan package (with 999 permutations and bray method) is used to test the influence
of different factors (e.g. cluster, season and year) on the fish community composition. Complementary,
contrast methods are applied to test the pairwise differences between different levels in each of these
factors, using pairwise.adonis function in R. In addition, non-parametric Wilcoxon rank-sum and
Turkey’s multiple comparison tests are performed to test the significant differences between variables
i.e. survey sites or weeks/years over the study period. For correlation tests, non-parametric Spearman's
correlation tests are used. Significance at the 0.05 level is applied for all tests. Further, to identify species
indicator characterizing fish communities in a study site or a cluster, multipatt function from
indicspecies package is applied (Cáceres and Legendre 2009, De Cáceres and Jansen 2011).

20
3.3.5 Species diversity
Richness is computed using specnumber function, whereas inverse Simpson index is computed
using diversity function (method = ‘inv’) of vegan package. To compare species richness between sites,
rarefaction technique (Article 2) is used to standardize sampling efforts and generate smooth curves for
comparison. Rarefaction technique is performed using rarc function from rich package, and c2cv
function is used to assess the significance of differences in species richness among sites (Rossi 2011).
Moreover, to investigate temporal dynamics of community composition, temporal beta
diversity (Article 4) is computed using beta.div function of the adespatial package (Legendre and De
Cáceres 2013, Dray et al. 2017). In estimating total beta diversity (BDtotal), the total variance of
Hellinger-transformed weekly assemblage abundance data is used (Legendre and De Cáceres, 2013).
BDtotal has a value between 0 and 1 for Hellinger-transformed data. BDtotal can be compared among sites
if the sampling units across the study sites are of the same size (Legendre and Salvat 2015), which is
the case for the study (Article 4). If BDtotal is equal to 1, all sampling units have a completely different
species composition. BDtotal is then partitioned into Local (temporal) Contributions to Beta Diversity
(LCBD) and Species Contributions to Beta Diversity (SCBD). LCBD is a comparative indicator of the
ecological uniqueness of the sampling units. LCBD values give a total sum of 1 for a given data matrix
and can be tested for significance (at the 0.05 level in the present study [Article 4]). Species with SCBD
indices well above the mean are regarded as important species contributing to beta diversity (Legendre
and De Cáceres 2013).
3.3.6 Linear regression models
Linear regression is used to predict the rate of change in the total catch weight of 116 fish
species recorded at the Dai fishery between 2000 and 2015 (Article 3). The temporal trend for each of
the 116 species is expressed as a standardized regression coefficient to allow comparison among
species. Linear regression models are also used to describe temporal changes of fish biomass in relation
to maximum fish size and trophic positions as well as individual fish weights and length through time.
To identify the key species contributing to the temporal dynamics of species composition over
the study period (Article 4), species with SCBD indices greater than the mean at each site are extracted
from the community composition matrix. Redundancy Analysis (RDA) is then performed on the
community composition data against time and its quadratic effect as explanatory variables. Using RDA,
the relationship between the observations (sampling units), species and explanatory variables (the years)
can be visualized. Further, to help identify the key species explaining the temporal shift in assemblage
composition, indicator species characterizing fish assemblages at each site are computed using the
multipatt function of the indicspecies package (Cáceres and Legendre 2009, De Cáceres and Jansen
2011) for comparison.

21
IV. Results
4.1 Summary of recorded catches in the Lower Mekong Basin
Of three MRC fisheries monitoring programs in the LMB during this last decade, namely the
artisanal fish monitoring, the commercial dai fishery monitoring and lee trap monitoring, some 504 fish
species and two groups of other aquatic animals (OAAs), which are freshwater prawns and clams, are
recorded. These fish species belong to 252 genera, 78 families and 22 orders. Four main orders
representing ~82% of the total species counts are: Cypriniformes (202), Siluriformes (101), Perciformes
(94) and Clupeiformes (20) (Fig. 9).
Among the recorded 78 fish families, the top six families which account for 52% of total species
counts are Cyprinidae (32%), Cobitidae (5%), Siluridae (4%), Bagridae (4%), Pangasiidae (4%), and
Gobiidae (4%); each of the remaining 72 families comprise less than 4% of the species counts. Most of
these top fish families also form the largest proportion of both total species abundance and biomass
(Fig. 10 and 11).
Fig. 9. Number of species by order: 22 fish orders and 2 orders of other aquatic animal (OAA)1 i.e.
Decapoda (freshwater prawns) and Veneroida (clams). Data source: MRC routine fish monitoring
programs: commercial Dai fishery (2000-2014), lee trap fishery (2000-2014) and artisanal fisheries
(2007-2014).
1 They are NOT identified to species level but representing the common names of many species under each order.

22
Fig. 10. Relative total abundance highlighting the four top fish families that contribute 96% to the total
abundance and the list of other fish and two OAA families reported in the MRC fish monitoring
programs. Data source: MRC routine fish monitoring programs: commercial Dai fishery (2000-2014),
lee trap fishery (2000-2014) and artisanal fisheries (2007-2014).
Fig. 11. Relative total biomass highlighting the four top fish families that contribute 94% to the total
fish biomass and the list of other fish and two OAA families reported in the MRC fish monitoring
programs. Data source: MRC routine fish monitoring programs: commercial Dai fishery (2000-2014),
lee trap fishery (2000-2014) and artisanal fisheries (2007-2014).
23
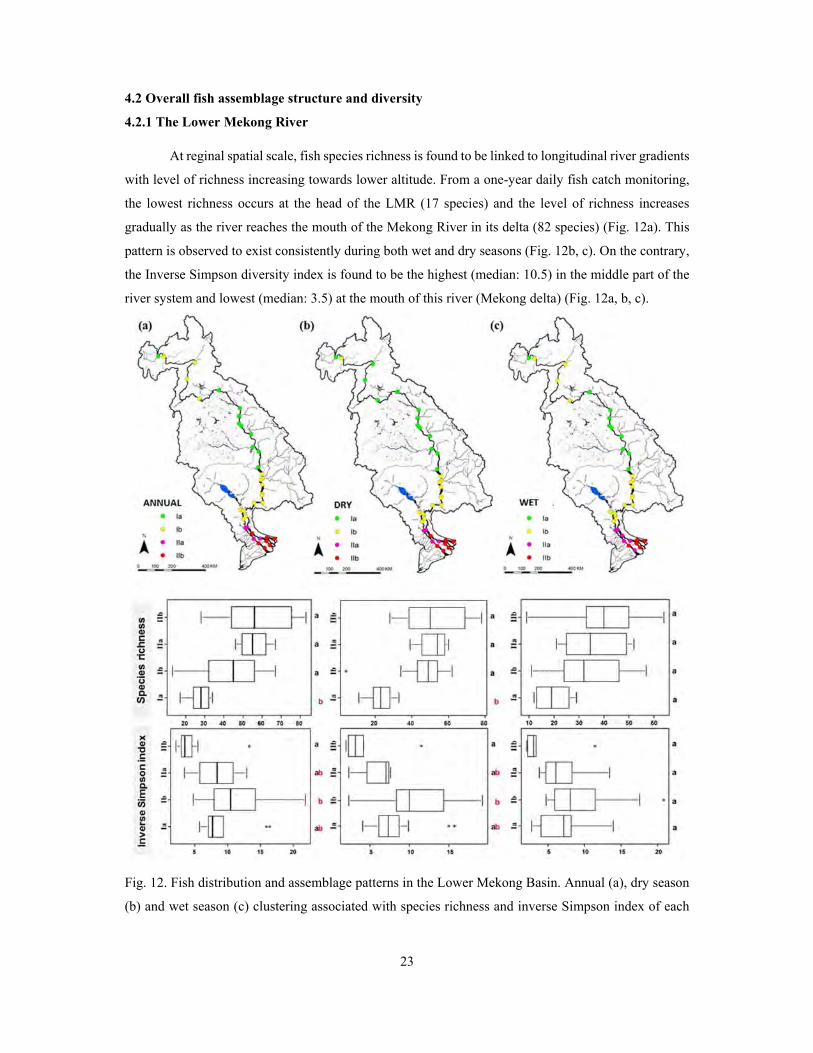
4.2 Overall fish assemblage structure and diversity
4.2.1 The Lower Mekong River
At reginal spatial scale, fish species richness is found to be linked to longitudinal river gradients
with level of richness increasing towards lower altitude. From a one-year daily fish catch monitoring,
the lowest richness occurs at the head of the LMR (17 species) and the level of richness increases
gradually as the river reaches the mouth of the Mekong River in its delta (82 species) (Fig. 12a). This
pattern is observed to exist consistently during both wet and dry seasons (Fig. 12b, c). On the contrary,
the Inverse Simpson diversity index is found to be the highest (median: 10.5) in the middle part of the
river system and lowest (median: 3.5) at the mouth of this river (Mekong delta) (Fig. 12a, b, c).
Fig. 12. Fish distribution and assemblage patterns in the Lower Mekong Basin. Annual (a), dry season
(b) and wet season (c) clustering associated with species richness and inverse Simpson index of each

24
cluster (Ia, Ib, IIa, IIb). Mean values among clusters with a common letter are not significantly different
at p-value=0.05 (Tukey’s HSD tests).
Some 80 indicator fish species are identified from the four annual clusters as shown in Fig. 12a.
Species indicators in each cluster are given in Annex 1. The highest number of indicator species is
found in IIb (31 species), while the lowest is observed in Ia (11 species). The clusters in the Mekong
delta (IIa and IIb) make up 66% of the total indicator species. The indicator species in Ia and Ib are
mostly species from Cyprinidae, Pangasiidae, Siluridae and Bagridae families, namely Cosmochilus
harmandi, Bagnana behri, Helicophagus waandersii, Labeo chrysophekadion, Bagarius yarelli,
Henicorhynchus spp., Micronema bleekeri and Hemibagrus nemurus, which are known as
potamodromous fish and indigenous to the LMB. Assemblage IIa contains 21 indicator species. Among
them, many are known as freshwater and secondary freshwater fishes such as Glossogobius giuris,
Macrognathus siamensis, Acantopsis sp., Puntioplites proctozysron, Mastacembelus armatus and
Mystus mysticetus. Similarly, the main indicator species of IIb are mostly characterized by secondary
freshwater fish and marine species, known as amphidromous and anadromous fishes, that is
Clupeichthys aesarnensis, Rasbora trilineata, Scomberomorus sinensis, Eleotris spp., Liza spp., Arius
stormi, Toxotes spp. and Lates calcarifer. Most of indicator species during the dry season are also
identified as indicator species using annual assemblage compositions. Overall, dry season assemblages
contain more indicator species (73 species) as compared to wet season assemblages (51 species), while
many indicators species from annual IIa and IIb are absent in the wet season.
4.2.2 The complex Mekong-3S system
Over the 7-year period, 292 species have been recorded in the catch samples. Among those,
208 fish species are recorded in Kratie (KT), 196 in Stung Treng (ST), 177 in the Srepok River (SP),
133 in the Sesan River (SS) and 216 in the Sekong River (SK). These fishes belong to 14 orders, 48
families and 151 genera. Five main orders represent 90% of the total species count: Cypriniformes (146
species), Siluriformes (66), Perciformes (34), Pleuronectiformes (9) and Clupeiformes (6). The top five
families accounting for 63% of total species counts are Cyprinidae (123 species), Bagridae (16),
Cobitidae (16), Pangasiidae (15) and Siluridae (11).
In addition, boxplots on weekly abundance, richness and inverse Simpson diversity index (Fig.
13a-c) indicate that Kratie (KT) has lowest weekly abundance, whereas ST possesses the highest
abundance. The abundance in SP is comparable to that of ST while the fish abundance in SS and SK
displays intermediate status among the five sites. For richness, the Mekong sites has the highest
richness (KT: median=23, sd=10.95; ST: median=27, sd=9.87) and inverse Simpson indices (KT:
median=9.20, sd=5.30; ST: median=8.82, sd=5.10) relative to the 3S sites. Noticeably, SS shows both
the lowest species richness (median=12, sd=5.14) and diversity index (median=5.45, sd=2.78) of all
sites, whereas SP is comparable with KT in terms of species richness. Although SP had higher species

25
richness (median=23, sd=7.52) than SK (median=19, sd=8.25), the diversity indices between the two
sites are not significantly different (SP: median=6.89, sd=3.70; SK: median=7.49, sd=4.38).
Fig. 13. Fish diversity in the Mekong-3S system. (a) Weekly species abundance (log-scale); (b) Weekly
species richness; and (c) Weekly inverse Simpson diversity index. Mean values among sites with a
common letter are not significantly different at the 0.05 level (Pairwise Wilcoxon Rank Sum Tests).
For site names, KT=Kratie, SK=Sekong, SP=Srepok, SS=Sesan, and ST=Stung Treng.
4.2.3 The Tonle Sap system
In the Tonle Sap system, the largest wetlands and a major tributary of the Mekong Basin, 204
species from 114 genera, 38 families and 13 orders have been recorded over four-year monitoring period
in six study sites on the Tonle Sap River and around the Tonle Sap Lake. The three main orders
representing 87% of the total species count are Cypriniformes (100 species), Siluriformes (48) and
Perciformes (29). Clupeiformes, Osteoglossiformes and Synbranchiformes, each containing five
species; the rest contributes less than 6% to the total species counts. At family level, the top five families
accounting for 60% of total species counts are Cyprinidae (80), Bagridae (12), Pangasiidae (11),
Cobitidae (10) and Siluridae (10); each of the remaining 33 families comprise one to six species. At
species level, ~62% of catches is dominated by 12 fish species namely Henicorhynchus lobatus (11%),
H. siamensis (10%), Trichopodus trichopterus (7%), Puntioplites proctozysron (7%), Osteochilus
vittatus (6%), Trichopodus microlepis (5%), Labiobarbus lineatus (4%), Paralaubuca typus (3%) and
Mystus mysticetus (3%), Notopterus notopterus (3%) and Rasbora tornieri (3%). Ecologically,
longitudinal migratory species (white fish) account for ~58% of total abundance, while floodplain
resident black and lateral-migrant gray fishes contribute 19% and 21%, respectively. The rest (1%) is
composed of estuarine species and marine visitors. Among the six survey sites, the highest species
richness is observed in the middle section of the lake in Kampong Thom (KT) and Pursat (PS) while
the lowest richness occurs in the northern part in Battambang (BB) (Fig. 14a). Similar richness is
observed in Kandal (KD), Kampong Chhnang (KC) and Siem Reap (SR). Also, richness in PS is

26
comparable with that of KD and SR. In addition, the lowest abundance is observed in KD, while the
highest was reported in Kampong Thom (KT) (Fig. 15). Likewise, the highest diversity index occurs in
the middle part of the lake in PS and KT while the lowest is observed in the river section in KD (Fig.
14b). Diversity index in KC is similar to that in BB.
Fig. 14. Spatiotemporal comparison of site fish species richness and diversity in the Tonle Sap River
and Lake: (a) site rarefaction curves on species richness; (b) site inverse Simpson index with south-
north gradient along the Tonle Sap Rive and Lake. Sites with a common letter are not significantly
different at p-value=0.05. For site names: KD=Kandal, KC=Kampong Chhnang, KT=Kampong Thom,
PS=Pursat, SR=Siem Reap and BB=Battambang.
Fig. 15. Spatiotemporal comparison of site fish species abundance in the Tonle Sap River and Lake.
Mean values among sites with a common letter are not significantly different at p-value=0.05 (Wilcoxon
test). For site names, see Fig. 14.

27
4.3 Spatial variation in fish abundance distribution
4.3.1 The Lower Mekong River
The relative abundance of fish orders varies greatly along the longitudinal gradient of the LMR
system, and this pattern is consistent between seasons for all fish orders except Clupiformes, Fig. 16,
Wilcoxon test, p<0.05). Apart from the Mekong delta, that is particularly in Ia and Ib (see Fig. 12),
Cypriniformes and Siluriformes dominated and occurred almost in every site, while their abundances
declined dramatically in the delta. Additionally, Osteoglosiformes and Perciformes are found in some
sites of Ib in Cambodia. In the delta (IIa and IIb), the fish composition is diverse and characterized by
many species from different orders such as Clupeiformes, Perciformes, Pleuronectiformes,
Synbranchiformes, Tetraodontiformes; among those, Perciformes and Clupeiformes are the most
abundant (Fig. 16).
Fig. 16. Relative abundances of fish order along the Lower Mekong River. Open and closed circles
denote the wet and dry seasons respectively. The acronyms in the vertical axis denote the species order:
angu (Anguilliformes), batr (Batrachoidiformes), belo (Beloniformes), clup (Clupeiformes), cypr
(Cypriniformes), mugi (Mugiliformes), oste (Osteoglossiformes), perc (Perciformes), pleu
(Pleuronectiformes), raji (Rajiformes), silu (Siluriformes), synb (Synbranchiformes), tetr
(Tetraodontiformes). The acronyms in the horizontal axis indicate the location of the sites: TH
(Thailand), LA (Lao PDR), CA (Cambodia) and VN (Viet Nam). *denotes significant differences in
fish relative abundance between seasons (Wilcoxon test, p-value=0.04).

28
4.3.2 The Mekong-3S system
K-means clustering (with five clusters) on a PCA plot (Fig. 17) shows that sites on the Mekong
(cluster 4 and 5) overlap, indicating assemblage similarities between the two sites, while the 3S sites,
particularly SK (cluster 1) and SS (cluster 2), are distant from the Mekong sites, suggesting distinct
assemblages. SP (cluster 3) exhibits some similarities with the Mekong sites (ST). Assemblage
dissimilarities are further observed among the 3S sites (axis 2).
Fig. 17. Fish assemblage patterns in the Mekong-3S system, using K-means cluster on PCA plot (k=5)
on Hellinger-transformed yearly assemblage data. Five convex hulls (with different colors) represent
each assemblage cluster of the Mekong-3S system. A combination of two letters and two digits denotes
the site name and year; for example, KT07 is Kratie in 2007. For site names, KT=Kratie, SK=Sekong,
SP=Srepok, SS=Sesan, and ST=Stung Treng.
4.3.3 The Tonle Sap system
Based on fish community composition, KD in the most southern section of the system is
significantly different from the other sites along the first axis of the NMDS, whereas the second axis
mainly opposes BB in the northern part of the lake to the other sites (Fig. 18b). Hierarchical clustering
with Ward agglomerative method allows classifying all weekly samples into three clusters (Fig. 18a)
according to their species composition similarities. The first split of the dendrogram defines fish
assemblages in riverine (cluster 1) and lacustrine environments (cluster 2 and cluster 3), while the

29
second split separates the two main assemblages (clusters 2 and 3) in the middle and northern sections
of the lake. The first cluster (159 samples) is mainly associated with samples from KD. The second, the
largest cluster (613 samples), mainly groups samples from KC, KT, PS and SR, and the third cluster
(456 samples) is related to samples from BB.
Fig. 18. NMDS biplot of the weekly fish abundance samples (with Bray-Curtis dissimilarity matrix),
showing the Tonle Sap River and Lake (TSRL) fish community spatial variation. Dots on the biplots
represent samples. (a) Ward hierarchical clustering dendrogram of the weekly samples showing 3
distinct clusters; (b) spatial distribution patterns of sites along the TSRL gradient grouped into three
clusters. For site names: KD=Kandal, KC=Kampong Chhnang, KT=Kampong Thom, PS=Pursat,
SR=Siem Reap and BB=Battambang.
Overall, 114 species have been reported in cluster 1, 182 in cluster 2 and 154 in cluster 3. The
ten most abundant species for each assemblage cluster account for ~97% in cluster 1, ~58% in cluster
2 and ~65% in cluster 3 (Fig. 19a). Interestingly, two small-sized cyprinids: Henicorhynchus lobatus
(Hlob) and H. siamensis (Hsia) make up of ~45% of the total abundance in cluster 1 while they account
for only ~19% and ~16% in cluster 2 and cluster 3, respectively. Further, of the top ten species, only
five species (~84%) dominate the catch in cluster 1, whereas in cluster 2 and 3, the ten dominant species
share the catch proportionately between 3 and 10%. Puntioplites proctozysron (Ppro) is found among
the top ten species for all clusters. Ecologically, catches in cluster 1 comprise ~96% of migratory white
fish which decreases gradually to ~57% and ~52% in cluster 2 and cluster 3, respectively (Fig. 19b).

30
Fig. 19. Species relative abundance organized by cluster and fish migration guild. (a) Ten most abundant
species by cluster. (b) Community composition by migration guilds. For cluster, see Fig. 17a, b. For
species details and migration guilds, see S9, Article 2.
For the entire species pool of the TSRL, 96 indicator species are identified from the three
assemblage clusters (for species details, see Article 2, S5). The largest number is observed in cluster 2
(45 species) while the least is detected in cluster 1 (20). Key indicator species with high indicator values
characterizing cluster 1 belong to Pangasiidae (river catfishes), e.g. Pangasius macronema, P.
conchophilus and P. bocourti; Cyprinidae (cyprinids) e.g. Labiobarbus siamensis, Puntioplites falcifer,
Paralaubuca typus and P. riveroi; Siluridae (sheatfishes) e.g. Phalacronotus bleekeri and
Belodontichthys truncates and Cobitidae (loaches) Yasuhikotakia caudipunctata. Interestingly,
Cyprinus carpio, an exotic species is also identified for this cluster.

31
Key indicator species representing cluster 2 are those of Bagridae (Bagrid catfishes) such as
Mystus mysticetus and M. singaringan (floodplain spawners); Cyprinidae (white/gray fish) including
Labiobarbus lineatus, Osteochilus vittatus, Labeo chrysophekadion, Thynnichthys thynnoides and
Henicorhynchus siamensis; Anabantidae (climbing perches) i.e. Anabas testudineus (floodplain
resident); Pristolepididae (leaffish) i.e. Pristolepis fasciata (floodplain spawner); Ambassidae (asiatic
glassfish) i.e. Parambassis wolffii (floodplain spawner); Cobitidae i.e. Yasuhikotakia modesta (main
channel spawner); Mastacembelidae (spiny eels) i.e. Macrognathus siamensis (floodplain resident);
Osphronemidae (gouramies) such as Trichopodus trichopterus (floodplain resident) etc.
Finally, main species which are indicative of cluster 3 include Notopteridae (featherbacks) i.e.
Notopterus notopterus; Bagridae i.e. Hemibagrus spilopterus; Osphronemidae i.e. Trichopodus
microlepis and T. pectoralis; Cyprinidae i.e. Barbonymus gonionotus and Hampala macrolepidota;
Channidae (airbreathing snakeheads) i.e. Channa striata; Siluridae i.e. Ompok bimaculatus, Eleotridae
(sleepers) i.e. Oxyeleotris marmorata; Clariidae (airbreathing catfishes) i.e. Clarias microcephalus, C.
meladerma and C. batrachus; and Tetraodontidae (puffers) Pao leiurus.
4.4 Temporal dynamics of fish community
4.4.1 Temporal variation of fish community in the Tonle Sap River and Lake
4.4.1.1 Intra-annual (seasonal) variation in the TSRL fish community
Over the 4-year survey, it has been discerned that seasons related to the inflow (I), outflow (O)
and low-flow (L) periods appear to significantly influence the variation in the TSRL fish community
(Fig. 20a). PERMANOVA and contrast pairwise tests indicate significant differences among seasons
with p-value=0.001 and between seasons with p-adjusted value=0.003 for all pairwise comparisons.
Wilcoxon tests on NMDS site scores reveal significant differences between I and L on axis1 (p-
value=0.044), and between O and I (p-value=0.004) as well as between I and L (p-value=0.008) on
axis2. Generally, high abundance and richness occurs during the outflow period while lowest abundance
and richness are observed during the inflow for all sites except for BB where richness is high during
the inflow period.
Finally, significant changes in fish communities are also observed over the four-year period
(Fig. 20b), with PERMANOVA test among years, p-value=0.001 and contrast pairwise tests between
years, p-adjusted value=0.006 for all pairwise comparisons. Significant changes are mainly observed
toward negative values along NMDS axis2. Wilcoxon tests show that 2012 is significantly differed from
other years along axis1 (p-value<0.001), while along axis2, the differences between all pairs of years
are significant at p-value<0.001. Overall, weekly abundances show some fluctuations with no clear
trend over the four-year period for all sites; however, a decreasing trend is observed for weekly richness
in the middle part of the lake (KC, PS, KT, SR).
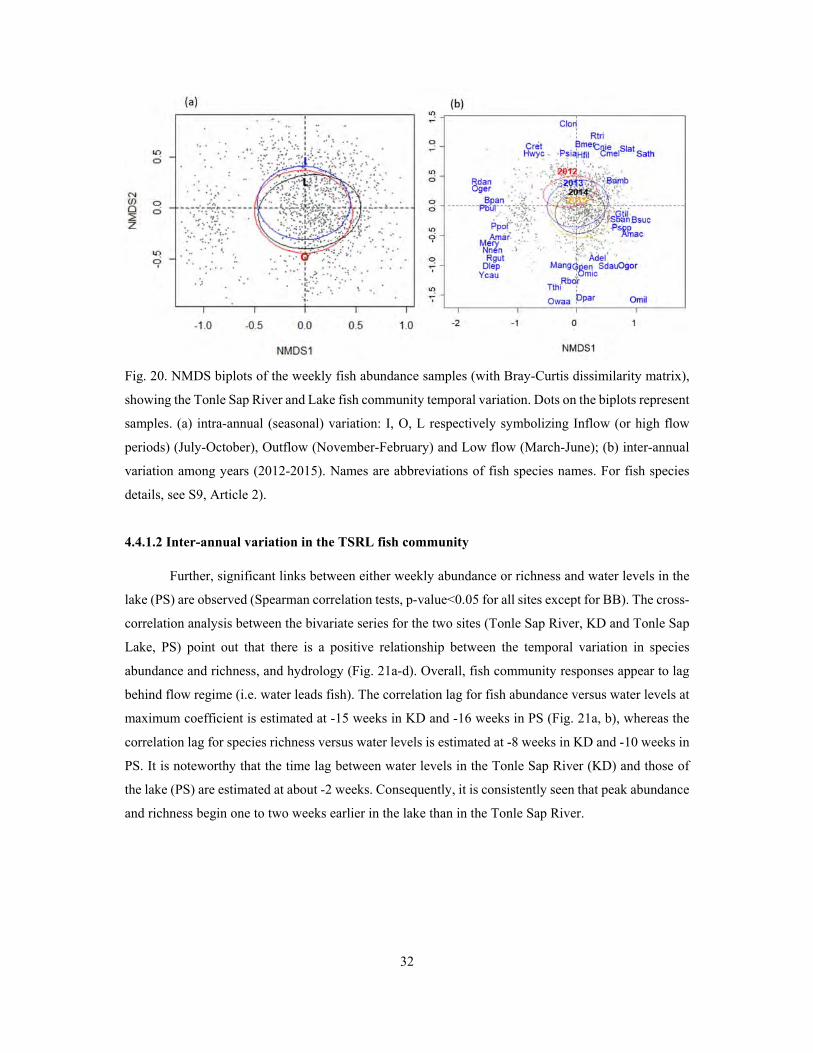
32
Fig. 20. NMDS biplots of the weekly fish abundance samples (with Bray-Curtis dissimilarity matrix),
showing the Tonle Sap River and Lake fish community temporal variation. Dots on the biplots represent
samples. (a) intra-annual (seasonal) variation: I, O, L respectively symbolizing Inflow (or high flow
periods) (July-October), Outflow (November-February) and Low flow (March-June); (b) inter-annual
variation among years (2012-2015). Names are abbreviations of fish species names. For fish species
details, see S9, Article 2).
4.4.1.2 Inter-annual variation in the TSRL fish community
Further, significant links between either weekly abundance or richness and water levels in the
lake (PS) are observed (Spearman correlation tests, p-value<0.05 for all sites except for BB). The cross-
correlation analysis between the bivariate series for the two sites (Tonle Sap River, KD and Tonle Sap
Lake, PS) point out that there is a positive relationship between the temporal variation in species
abundance and richness, and hydrology (Fig. 21a-d). Overall, fish community responses appear to lag
behind flow regime (i.e. water leads fish). The correlation lag for fish abundance versus water levels at
maximum coefficient is estimated at -15 weeks in KD and -16 weeks in PS (Fig. 21a, b), whereas the
correlation lag for species richness versus water levels is estimated at -8 weeks in KD and -10 weeks in
PS. It is noteworthy that the time lag between water levels in the Tonle Sap River (KD) and those of
the lake (PS) are estimated at about -2 weeks. Consequently, it is consistently seen that peak abundance
and richness begin one to two weeks earlier in the lake than in the Tonle Sap River.

33
Fig. 21. Relationships between water levels and (a-b) species abundance and (c-d) richness in the TSRL.
In cross-correlation plots, the dotted blue lines give the values beyond which the correlations are
significantly different from zero. The X-axis (a) is the number of weeks for the period from 1 January
2012 to 31 December 2015.
4.4.1.3 Temporal changes in fish biomass and its relationships with max. length and trophic
level
The distribution of the standardized regression coefficients for 116 species reported in the
Mekong’s largest commercial Dai fishery, which reflected the nature of the relationship between
seasonal fish catch and time for each species over the last 15-year period, is skewed to the right, centered
around -0.4, and spread between -0.78 and 0.66 (Fig. 22). Out of the 116-total species, 90 (78%) have
negative standardized regression coefficients. These results indicate that the seasonal catches of these
species harvested by the Dai fishery decline over the 15 years studied. On the contrary, there are also
species (26 out of 116 or 22%) with positive standardized regression coefficients, indicating an increase
in the catch of these species by the Dai fishery.

34
Interestingly, Oreochromis mossambicus is an exotic species that is among the largest positive
coefficients observed. In addition, Labiobarbus lineatus, Henicorhynchus lobatus and H. cryptopogon
(synonym of Lobocheilos cryptopogon) are all known to be highly prolific and form the largest
proportion of the catch from the fishery. These species also have positive standardized coefficients. In
fact, the increase in these species stabilizes the seasonal Dai catches as it is evidenced in the total catch
of the fishery which was stationary over the study period (p-value=0.982, Fig. S8, Article 3).
Fig. 22. Distribution of standardized regression coefficients of seasonal catches of 116 fish species
recorded at the Dai fishery, Tonle Sap River from the fishing season of 2000/01 to 2014/15.
Species with declining catch in the Dai fishery are disproportionately represented by those with
larger body sizes and higher trophic levels based on linear regressions (Fig. 23a, b), which demonstrates
overall negative relationships between the log+1 transformed standardized regression coefficients and
the corresponding log-transformed maxTL (slope=-0.08, p-value=0.08, r2=0.03), and trophic level
(slope=-0.15, p-value=0.024, r2=0.04). In the regression model, five endangered and critically
endangered species (solid points on Fig. 23a, b) are included. However, it is also likely that these species
are very rare and, as such, their catches obtained in the catch assessment could be misleading. Therefore,
when they are dropped from the analysis, the significant relationships are indicated with both maxTL
(slope=-0.13, p-value=0.006, r2=0.06) and trophic level (slope=-0.16, p-value=0.02, r2=0.05).
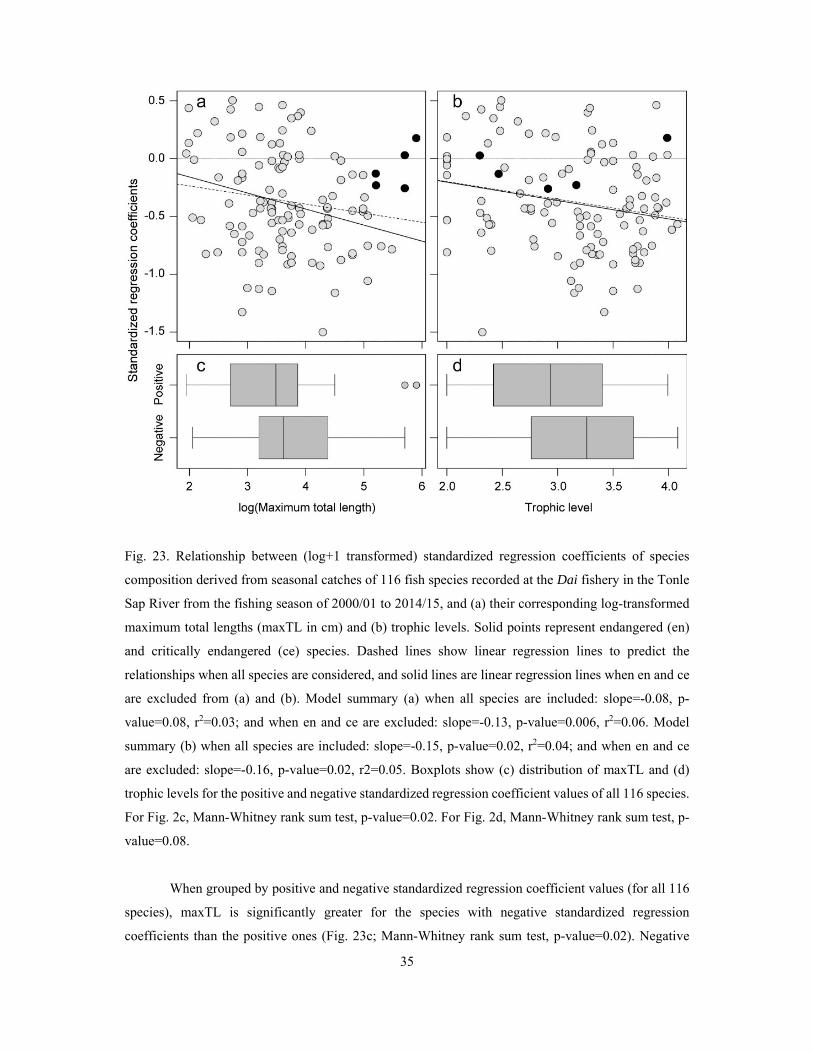
35
Fig. 23. Relationship between (log+1 transformed) standardized regression coefficients of species
composition derived from seasonal catches of 116 fish species recorded at the Dai fishery in the Tonle
Sap River from the fishing season of 2000/01 to 2014/15, and (a) their corresponding log-transformed
maximum total lengths (maxTL in cm) and (b) trophic levels. Solid points represent endangered (en)
and critically endangered (ce) species. Dashed lines show linear regression lines to predict the
relationships when all species are considered, and solid lines are linear regression lines when en and ce
are excluded from (a) and (b). Model summary (a) when all species are included: slope=-0.08, p-
value=0.08, r2=0.03; and when en and ce are excluded: slope=-0.13, p-value=0.006, r2=0.06. Model
summary (b) when all species are included: slope=-0.15, p-value=0.02, r2=0.04; and when en and ce
are excluded: slope=-0.16, p-value=0.02, r2=0.05. Boxplots show (c) distribution of maxTL and (d)
trophic levels for the positive and negative standardized regression coefficient values of all 116 species.
For Fig. 2c, Mann-Whitney rank sum test, p-value=0.02. For Fig. 2d, Mann-Whitney rank sum test, p-
value=0.08.
When grouped by positive and negative standardized regression coefficient values (for all 116
species), maxTL is significantly greater for the species with negative standardized regression
coefficients than the positive ones (Fig. 23c; Mann-Whitney rank sum test, p-value=0.02). Negative

36
values of standardized coefficients are noted for species with maxTL corresponding to >45 cm (3rd
quartile), whereas positive standardized regression coefficients are noted for species with maxTL <25
cm (2nd quartile). Species with both negative and positive coefficient values fall within maxTL of ~25
cm and ~45 cm. Trophic level does not significantly differ between negative and positive standardized
regression coefficients (Fig. 23d; Mann-Whitney rank sum test, p-value=0.08). Nevertheless, species
with negative standardized coefficients have higher trophic levels >3.3 (3rd quartile), and species with
positive standardized regression coefficients have lower trophic levels (<2.75). Species with both
negative and positive coefficient values fall within trophic levels of ~2.75 and ~3.3.
4.4.1.3 Temporal changes in the community weighted mean of maxTL and trophic level
Weighted mean maxTL and trophic level of seasonal total catch (Fig. 24a, b) oscillates with a
mean range of ~25-55 cm and ~2.4-2.8, respectively, and significantly decline across the 15-year period
(mean maxTL: slope=-1.26, p-value=0.007, r2=0.44; mean trophic level: slope=-0.013, p-value =0.025,
r2=0.33). Although some small-bodied species including Parachela siamensis (maxTL: 18.3 cm;
trophic level: 3.4), Parambassis wolffii (maxTL: 24.4 cm, trophic level: 3.72) and Acantopsis sp. cf.
dialuzona (maxTL: 30.5, trophic level: 3.5) also exhibit significant declines in seasonal catches
(standardized coefficients<-0.66), the combined findings indicate that smaller, lower trophic position
species increase and compensate for declines in larger bodied, higher trophic position species in the
Tonle Sap fishery over the study period.

37
Fig. 24. Community weighted mean: (a) maximum total length (maxTL) and (b) trophic level in
seasonal catches of the Dai fishery from the fishing season of 2000/01 to 2014/15. For Model summary
(a), intercept=42.53, slope=-1.29, predictor p-value=0.007, r2=0.44. For Model summary (b),
intercept=2.74, slope=-0.013, predictor p-value=0.025, r2=0.33. Pink shaded area denotes standard
deviation around the mean values. 2001 represents the fishing season of 2000/2001 and the same for
other years.
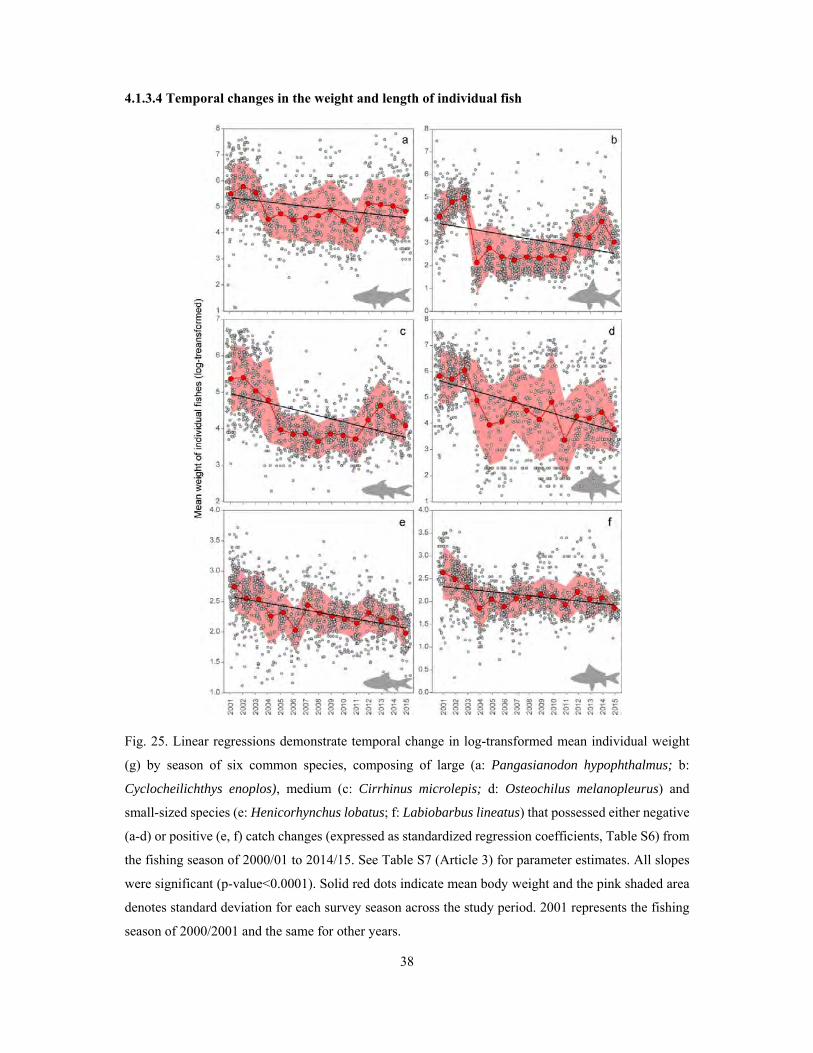
38
4.1.3.4 Temporal changes in the weight and length of individual fish
Fig. 25. Linear regressions demonstrate temporal change in log-transformed mean individual weight
(g) by season of six common species, composing of large (a: Pangasianodon hypophthalmus; b:
Cyclocheilichthys enoplos), medium (c: Cirrhinus microlepis; d: Osteochilus melanopleurus) and
small-sized species (e: Henicorhynchus lobatus; f: Labiobarbus lineatus) that possessed either negative
(a-d) or positive (e, f) catch changes (expressed as standardized regression coefficients, Table S6) from
the fishing season of 2000/01 to 2014/15. See Table S7 (Article 3) for parameter estimates. All slopes
were significant (p-value<0.0001). Solid red dots indicate mean body weight and the pink shaded area
denotes standard deviation for each survey season across the study period. 2001 represents the fishing
season of 2000/2001 and the same for other years.
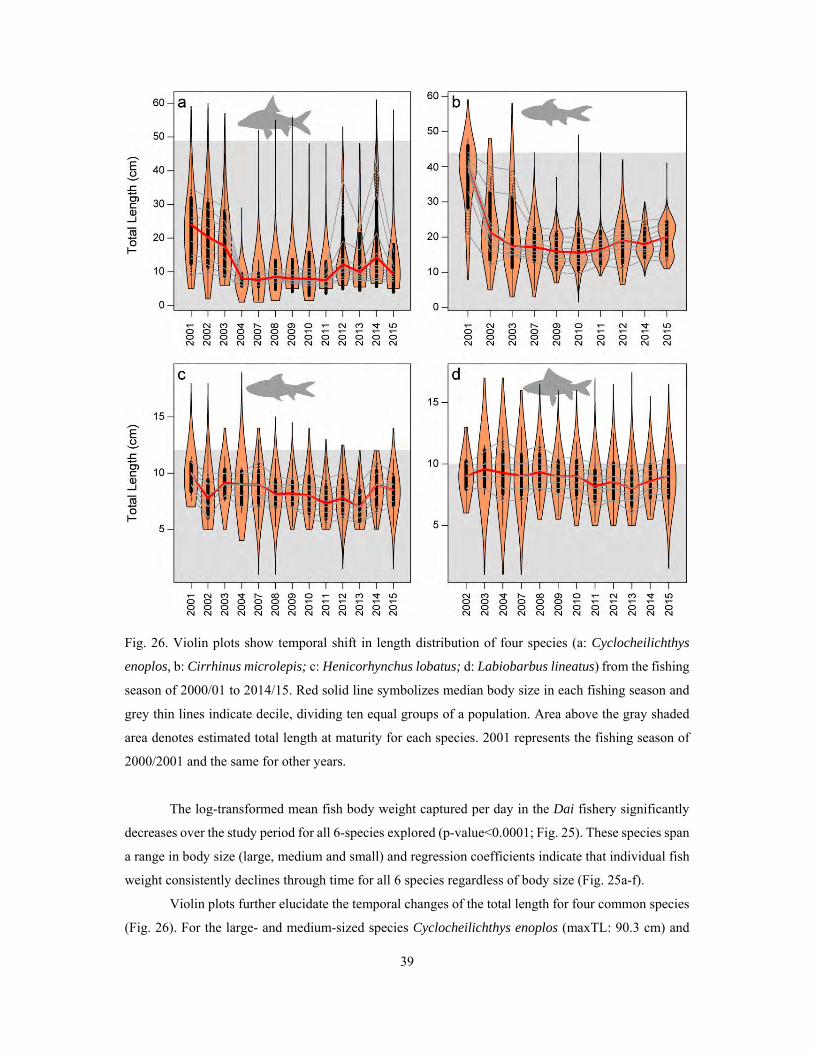
39
Fig. 26. Violin plots show temporal shift in length distribution of four species (a: Cyclocheilichthys
enoplos, b: Cirrhinus microlepis; c: Henicorhynchus lobatus; d: Labiobarbus lineatus) from the fishing
season of 2000/01 to 2014/15. Red solid line symbolizes median body size in each fishing season and
grey thin lines indicate decile, dividing ten equal groups of a population. Area above the gray shaded
area denotes estimated total length at maturity for each species. 2001 represents the fishing season of
2000/2001 and the same for other years.
The log-transformed mean fish body weight captured per day in the Dai fishery significantly
decreases over the study period for all 6-species explored (p-value<0.0001; Fig. 25). These species span
a range in body size (large, medium and small) and regression coefficients indicate that individual fish
weight consistently declines through time for all 6 species regardless of body size (Fig. 25a-f).
Violin plots further elucidate the temporal changes of the total length for four common species
(Fig. 26). For the large- and medium-sized species Cyclocheilichthys enoplos (maxTL: 90.3 cm) and

40
Cirrhinus microlepis (maxTL: 79.3 cm), both of which are mainly captured at juvenile sizes with an
average total length<20 cm and 25 cm, respectively; body lengths have declined since the early 2000s
when some comparatively large individuals (>30 cm) were present in the Dai fishery’s catches (Fig.
26a, b). Noticeably, the medians for these large and medium-sized species are significantly lower than
49 and 44 cm (Fig. 26a, b), the estimated lengths at maturity for C. enoplos and C. microlepis,
respectively. For the smaller species (maxTL<20 cm), H. lobatus and L. lineatus, which are common
and highly productive, total length in the Dai catches have a median of ~9 cm, with some individuals
possessing lengths greater than lengths at maturity which are ~12 cm for H. lobatus and ~10 cm for L.
lineatus (Fig. 26c, d). Both species also exhibit gradual decrease in the median total length, but less
pronounced than those of large-sized species.
4.4.2 Temporal dynamics of fish communities in the Lower Mekong system
4.4.2.1 Seasonality-predictability of site hydrology
Flows of the Mekong River in Kratie (KT) and Tonle Sap (TS) has more seasonal-predictable
patterns than in Sesan River (SS) of the 3S where strong flow modifications are observed (Fig. 27a).
As further evidenced in the wavelet plots (Fig. 27b), flows in TS and KT comparably exhibit very strong
continuous seasonal-predicable patterns as indicated by the red color at ~52-week frequency (annual
cycle). Such patterns are relatively weak in SS, with observed chaotic signals of strong wavelet power
at multiple periods across the wavelet spectrum. Flow variation in KT and TS also demonstrates a
secondary strong predicable power (red-yellow) at ~26-week frequency (semi-annual cycle), while no
such patterns are captured in the wavelet power spectrum in SS (Fig. 27b). Such patterns are illustrated
clearly in the average wavelet power across the full 7-year period, showing the strongest peaks at 52-
week frequencies for all sites, with increasing average wavelet power (i.e. predictability strength) in the
respective order of site SS, KT and TS (Fig. 27c). Colwell’s seasonality index on hydrology consistently
shows that flows in TS exhibit the strongest seasonality (M/P=0.93), whereas KT ranks second in its
seasonal flow patterns (M/P=0.90) and SS shows the weakest flow seasonality (M/P=0.83).
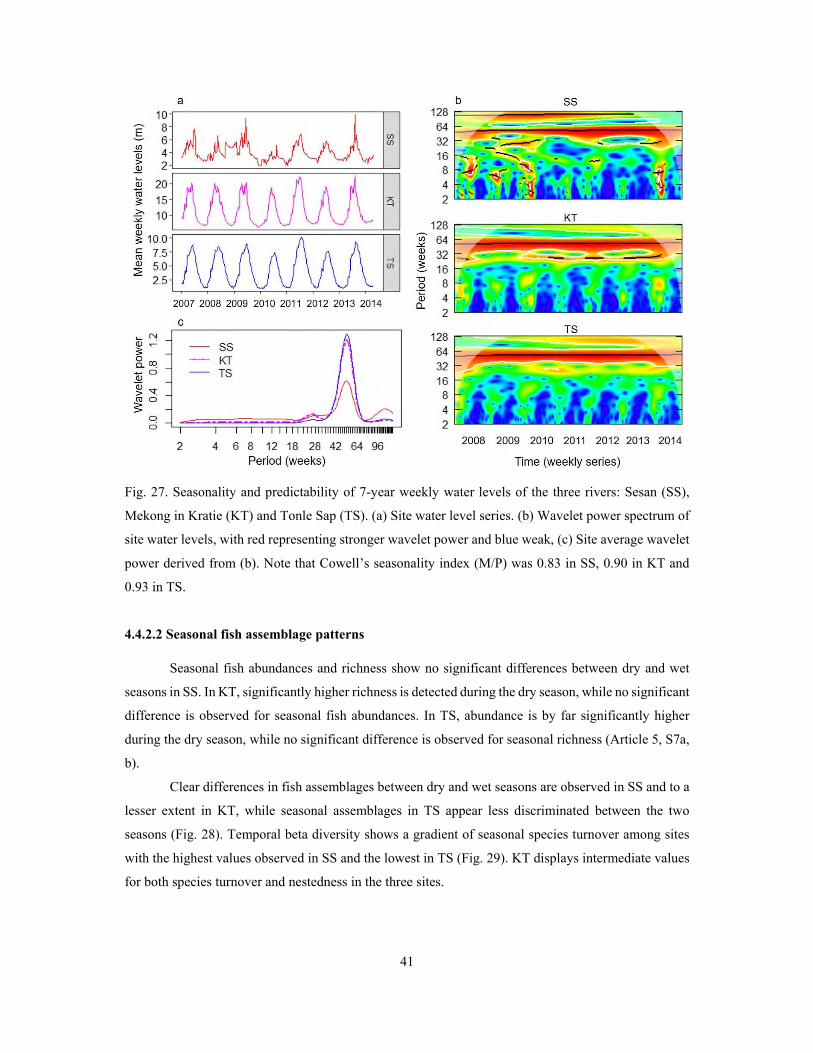
41
Fig. 27. Seasonality and predictability of 7-year weekly water levels of the three rivers: Sesan (SS),
Mekong in Kratie (KT) and Tonle Sap (TS). (a) Site water level series. (b) Wavelet power spectrum of
site water levels, with red representing stronger wavelet power and blue weak, (c) Site average wavelet
power derived from (b). Note that Cowell’s seasonality index (M/P) was 0.83 in SS, 0.90 in KT and
0.93 in TS.
4.4.2.2 Seasonal fish assemblage patterns
Seasonal fish abundances and richness show no significant differences between dry and wet
seasons in SS. In KT, significantly higher richness is detected during the dry season, while no significant
difference is observed for seasonal fish abundances. In TS, abundance is by far significantly higher
during the dry season, while no significant difference is observed for seasonal richness (Article 5, S7a,
b).
Clear differences in fish assemblages between dry and wet seasons are observed in SS and to a
lesser extent in KT, while seasonal assemblages in TS appear less discriminated between the two
seasons (Fig. 28). Temporal beta diversity shows a gradient of seasonal species turnover among sites
with the highest values observed in SS and the lowest in TS (Fig. 29). KT displays intermediate values
for both species turnover and nestedness in the three sites.
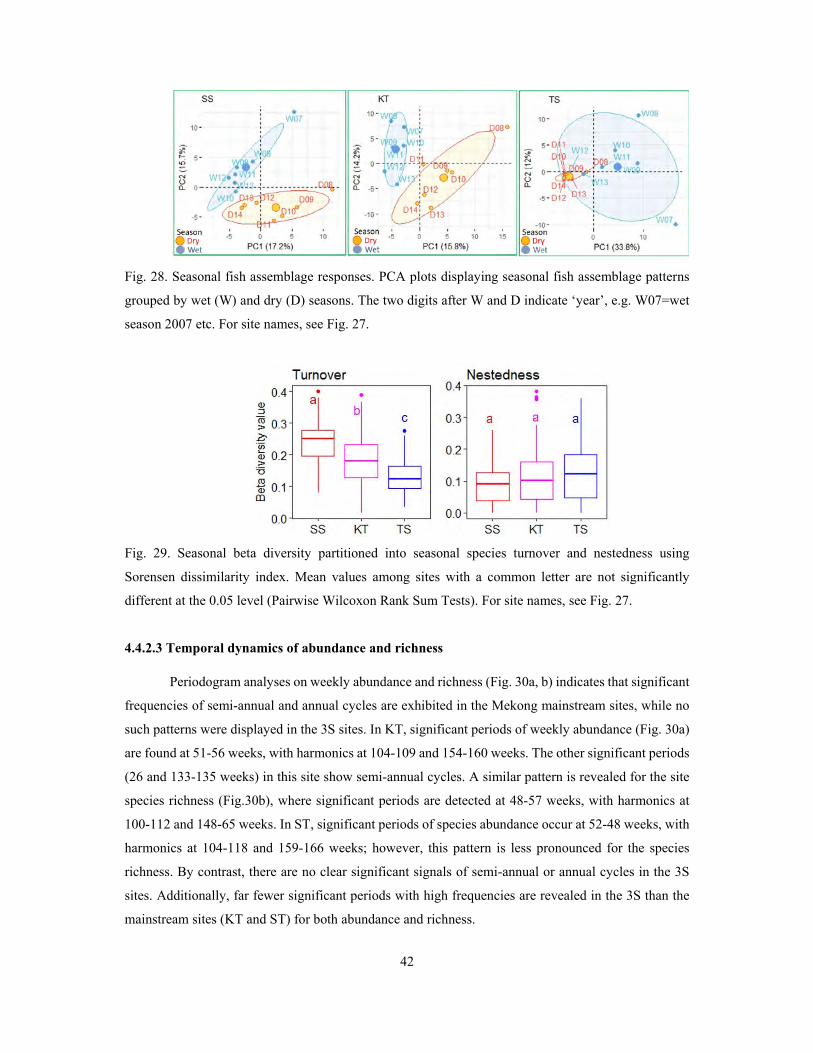
42
Fig. 28. Seasonal fish assemblage responses. PCA plots displaying seasonal fish assemblage patterns
grouped by wet (W) and dry (D) seasons. The two digits after W and D indicate ‘year’, e.g. W07=wet
season 2007 etc. For site names, see Fig. 27.
Fig. 29. Seasonal beta diversity partitioned into seasonal species turnover and nestedness using
Sorensen dissimilarity index. Mean values among sites with a common letter are not significantly
different at the 0.05 level (Pairwise Wilcoxon Rank Sum Tests). For site names, see Fig. 27.
4.4.2.3 Temporal dynamics of abundance and richness
Periodogram analyses on weekly abundance and richness (Fig. 30a, b) indicates that significant
frequencies of semi-annual and annual cycles are exhibited in the Mekong mainstream sites, while no
such patterns were displayed in the 3S sites. In KT, significant periods of weekly abundance (Fig. 30a)
are found at 51-56 weeks, with harmonics at 104-109 and 154-160 weeks. The other significant periods
(26 and 133-135 weeks) in this site show semi-annual cycles. A similar pattern is revealed for the site
species richness (Fig.30b), where significant periods are detected at 48-57 weeks, with harmonics at
100-112 and 148-65 weeks. In ST, significant periods of species abundance occur at 52-48 weeks, with
harmonics at 104-118 and 159-166 weeks; however, this pattern is less pronounced for the species
richness. By contrast, there are no clear significant signals of semi-annual or annual cycles in the 3S
sites. Additionally, far fewer significant periods with high frequencies are revealed in the 3S than the
mainstream sites (KT and ST) for both abundance and richness.

43
Fig. 30. Whittaker-Robinson periodograms computed for (a) weekly abundance and (b) richness,
featuring periods between 2 and 182 weekly intervals from a 365-week data series from 01 June 2007
to 31 May 2014. The upper limit of the observation window of the periodograms is the number of
observation intervals divided by 2 or a 182-week period. Black squares identify periods that are
significant at the 0.05 level. For site names, KT=Kratie, SK=Sekong, SP=Srepok, SS=Sesan, and
ST=Stung Treng.

44
4.4.2.3 Temporal dynamics of beta diversity
Fig. 31. Temporal changes in LCBD indices (red line) and mean log-transformed weekly water levels
(blue line) over 7-year hydrological cycles on the five sites of the Mekong-3S River system. More
predictable-seasonal flow patterns are shown in KT and ST, and unpredictable/regulated flows are
displayed in SP, SK, and SS. The red dots indicate weeks with significant LCBD indices at the 0.05
level. P denotes the p-value of the pairwise correlation test using the Spearman method. For site names,
see Fig. 30.

45
Total beta diversity (BDtotal) indices estimated for the Mekong-3S sites are 0.50 in SP, 0.59 in
ST, 0.66 in KT, 0.73 in SS and 0.74 in SK. Temporal Local Contributions to Beta Diversity (LCBD)
weekly values range between 1.26E-03 and 6.36E-03; the LCBD values are small because they are
made to sum to 1 across all weeks for each site. The site with the highest LCBD values is SS
(median=2.71E-03, sd=4.33E-04), whereas the site with the lowest LCBD value is SP (median=2.53E-
03, sd=9.69E-04). The other sites have intermediate values of weekly LCBD. Among the 365 weeks,
10% (35 weeks), 13% (48), 13% (46), 8% (29) and 18% (66) have statistically significant values of
LCBD (assemblage composition being unique) in KT, ST, SP, SS and SK, respectively. This manifests
strong temporal changes in the uniqueness of fish assemblage compositions over the study period for
all sites. For the two Mekong sites (i.e. KT and ST), these significant temporal LCBDs (red dots on Fig.
31) are found to occur at the time when seasonal water levels start rising on the annual cycle basis,
whereas no such patterns are exhibited in the 3S Rivers. Significant correlation between LCBDs and
water levels are observed in KT (P=0.003), SP (P<0.001), and SK (P=0.015). While ST is on the margin
(P=0.052), no significant correlation of the two variables is indicated in SS (P=0.074).
4.4.2.3 Temporal coherence of fish abundance/richness and flow
No clear peak in both weekly abundance and richness in relation to hydrological cycles is
observed in SS (Fig. 32a, 33a). By contrast, a clear seasonal peak in abundance is repeated annually,
i.e. before the peak water levels in KT (i.e. at the onset of wet season) and after the peak water levels
in TS (i.e. during the falling water levels), whereas richness in both sites recur after the peak flows (i.e.
during the dry season). Noticeably, fish abundance shows a significant declining trend in SS (p-
value=0.03) and KT (p-value<0.0001), while richness exhibits significant decreasing trends for all sites
(p-value<0.0001) (Article 3, S3).
Cross-wavelet analysis on variation of weekly abundance and richness with water levels shows
that KT and TS are characterized by strong, coherent seasonality-predictability cross-wavelet power in
the two data series at annual (~52 weeks) and semi-annual (26 weeks) frequencies (Fig. 32b, 33b). Such
patterns are incoherent and mixed up in SS, as illustrated by disordered responses of the bivariate series
with patchy red colors, fragmented ridges and arrows, pointing to different directions across the cross-
wavelet power spectrum. These patterns are illustrated clearly in the average cross-wavelet power over
the 7-year study period, showing the strongest peak at 52-week and secondary peak at 26-week
frequencies for all sites, with SS having the weakest average cross-wavelet power relative to KT and
TS (Fig. 34a, b). Noticeably, average cross-wavelet power for the abundance versus water series is
muted in SS relative to KT and TS (7a).

46
Fig. 32. Temporal variation of total weekly abundance (y) and mean weekly water levels (x as
predictor). (a) Weekly abundance and mean water level data series, covering the period from 1 June
2007 to 31 May 2014. (b) Cross-wavelet power spectrum of weekly abundance and water levels. Red
color represents stronger cross-wavelet power, and blue weak. Arrows in each plot depict phase-
differences. Ridge lines illustrate cross-wavelet power coherence within a band of neighboring periods.
Areas in the upper corners, outside the ‘cone of influence’ in each plot indicated the exclusion of areas
from edge effects (with weak predictive ability). For site names, SS=Sesan, KT=Mekong River in
Kratie, TS=Tonle Sap River.

47
Fig. 33. Temporal variation of total weekly richness (y) and mean weekly water levels (x as predictor).
(a) Weekly richness and mean water level data series, covering the period from 1 June 2007 to 31 May
2014. (b) Cross-wavelet power spectrum of weekly richness and water levels. Red color represents
stronger cross-wavelet power, and blue weak. Arrows in each plot depict phase-differences. Ridge lines
illustrate cross-wavelet power coherence within a band of neighboring periods. Areas in the upper
corners, outside the ‘cone of influence’ in each plot indicated the exclusion of areas from edge effects
(with weak predictive ability). For site names, see Fig. 32.
Fig. 34. Site average cross-wavelet power. (a) abundance versus water series derived from Fig. 32b and
(b) richness versus water series derived from Fig. 33b. For site codes, see Fig. 32.

48
4.4.2.4 Temporal shifts in the species composition of the Mekong-3S system
RDA analysis on assemblage composition with (Species Contributions to Beta Diversity
[SCBD] indices greater than mean) against time depicts a strong temporal shift in assemblage
composition at all sites. In the Mekong mainstream (Fig. 35a), during the early years of the survey
(2007-2010), temporal assemblage variability is mostly due to small-sized generalist and specialist
species. After 2010, the composition tends to be disproportionally represented by specialists. Small-
sized mud carps (maximum total length - maxTL<25 cm) i.e. Henicorhynchus lobatus (Hlobatu), H.
siamensis (Hsiamen) and Labiobarbus siamensis (Lsiamen), the most common and abundant species in
the LMB, are found to be characteristic and important species for both sites during the period 2007-
2010. Afterwards, specialists disproportionally represent the assemblage in both sites. Some common
specialists describing assemblages in the Mekong mainstream during 2011-2014 are short distance
migrants and mainstream spawners such as Hypsibarbus malcolmi (Hmalcol), Phalacronotus apogon
(Papogon.1), Hypsibarbus lagleri (Hlagler), H. wetmorei (Hwetmor); long distance migrants such as
large-sized cyprinids (maxTL>60 cm) Cosmochilus harmandi (Charman), Cirrhinus microlepis
(Cmicrol), Cyclocheilichthys enoplos (Cenoplo), Labeo chrysophekadion (Lchryso); and river
catfishes, namely, Helicophagus waandersii (Hwaande) and Pangasius conchophilus (Pconcho) (only
in ST). Important species contributing to overall site beta diversity are given in Annex 2.
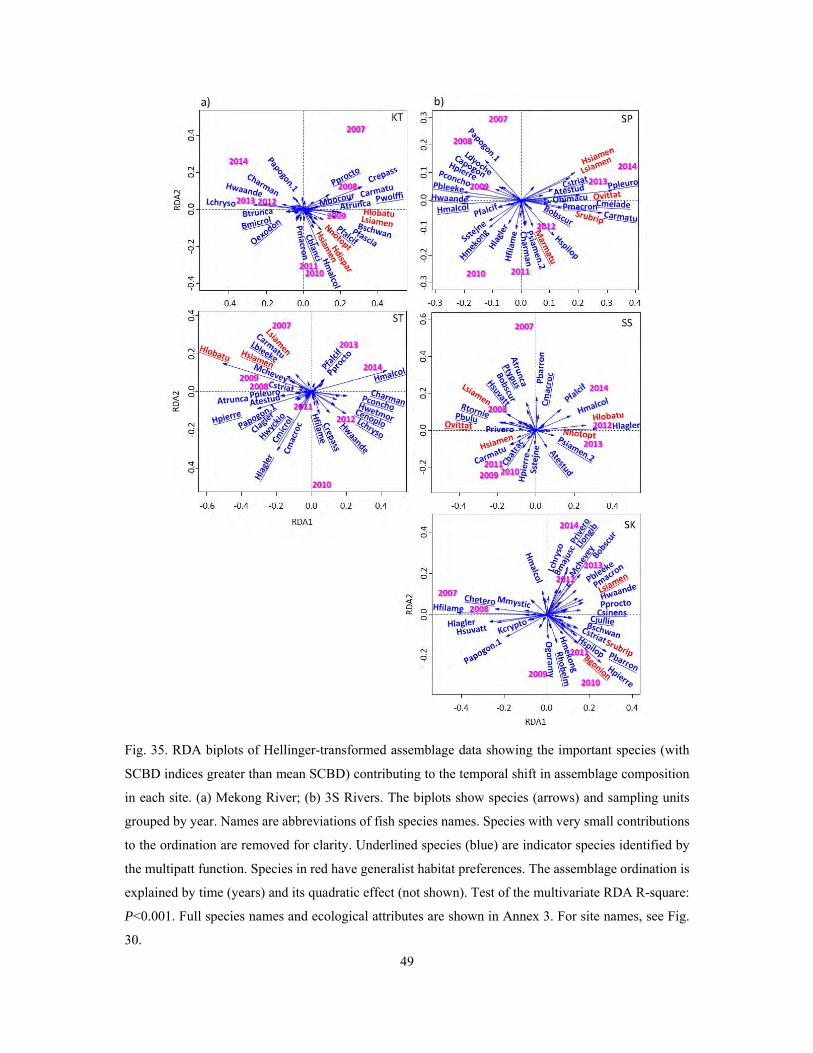
49
Fig. 35. RDA biplots of Hellinger-transformed assemblage data showing the important species (with
SCBD indices greater than mean SCBD) contributing to the temporal shift in assemblage composition
in each site. (a) Mekong River; (b) 3S Rivers. The biplots show species (arrows) and sampling units
grouped by year. Names are abbreviations of fish species names. Species with very small contributions
to the ordination are removed for clarity. Underlined species (blue) are indicator species identified by
the multipatt function. Species in red have generalist habitat preferences. The assemblage ordination is
explained by time (years) and its quadratic effect (not shown). Test of the multivariate RDA R-square:
P<0.001. Full species names and ecological attributes are shown in Annex 3. For site names, see Fig.
30.

50
In contrast, temporal dynamics in assemblage composition shift from specialists (during the
2007-2010 period) to generalists (after 2010) in the 3S (Fig. 35b). The pattern is pronounced in SP and
SK, where long-distance migratory species and main channel spawners with large-bodied sizes, such as
Phalacronotus apogon (Papogon.1), Hypsibarbus lagleri (Hlagler), Helicophagus waandersii
(Hwaande), Hypsibarbus malcolmi (Hmalcol), Pangasius conchophilus (Pconcho), P. bleekeri
(Pbleeke), Hypsibarbus pierrei (Hpierre), etc., represent the assemblages between 2007 and 2010 and
are then replaced by small-sized minnows and carps with generalist habitat preference, such as
Labiobarbus siamensis (Lsiamen), Systomus rubripinnis (Srubrip), Henicorhynchus siamensis
(Hsiamen) and Osteochilus vittatus (Ovittat), etc., between 2011 and 2014. This pattern is less clear in
SS where the generalist H. lobatus significantly contributes to the temporal changes in assemblage
composition during the 2011-2014 period. Moreover, assemblages in the SS during the entire period
are largely represented by generalists and other small-sized minnows and carps, such as Paralaubuca
typus (Ptypus), P. riveroi (Privero), P. barroni (Pbarron), Rasbora tornieri (Rtornie), Cyclocheilichthys
armatus (Carmatu), etc. as found in SP and SK Further, assemblages in the 3S towards 2011-2014 are
partly composed of black fishes (floodplain residents) such as climbing perch Anabas testudineus
(Atestud), airbreathing catfish Clarias batrachus (Cbatrac) and snakehead Channa striata (Cstriat).
V. Discussion
5.1 Fish species richness and diversity
The LMB possesses extremely high fish diversity hosting one of the world’s most prolific
tropical freshwater capture fisheries (Rainboth 1996, Baran 2005, MRC 2010). Fishes of the basin are
characterized by a diverse range of body size, habitat use and feeding ecology (Rainboth 1996, Rainboth
et al. 2012, Ou et al. 2017). The complex seasonal flood pulses which create greater ecological niches
for fishes and historical biogeography of the region etc. explain this high diversity (Rainboth 1996,
Poulsen et al. 2002, Junk and Wantzen 2004).
The MRC routine fish monitoring programs during the last decade or so have recorded some
504 fish species belonging to 252 genera, 78 families and 22 orders in the LMB (Fig. 9-11). The richness
reported from these monitoring accounts for 42% of the total estimated 1200 species or 57% of total
877 recorded fish species in the Mekong Basin (Rainboth 1996, Baran et al. 2013b). These species
represent mainly the common fish species captured by common fishing gears used in the region e.g.
Dai stationary bagnet, cylinder traps, gillnets, cast nets, hook and lines etc. details of which are
described in (Deap et al. 2003). Cyprinidae are the largest family representing ~80% of both total
abundance and biomass, while Pangasiidae, Siluridae, Cobitidae and Clupeidae each contributed
between 1-8%. Other 73 families combined make up only less than 6% to both total abundance and
biomass. The lesser number of reported richness is likely due to the area coverage in these monitoring
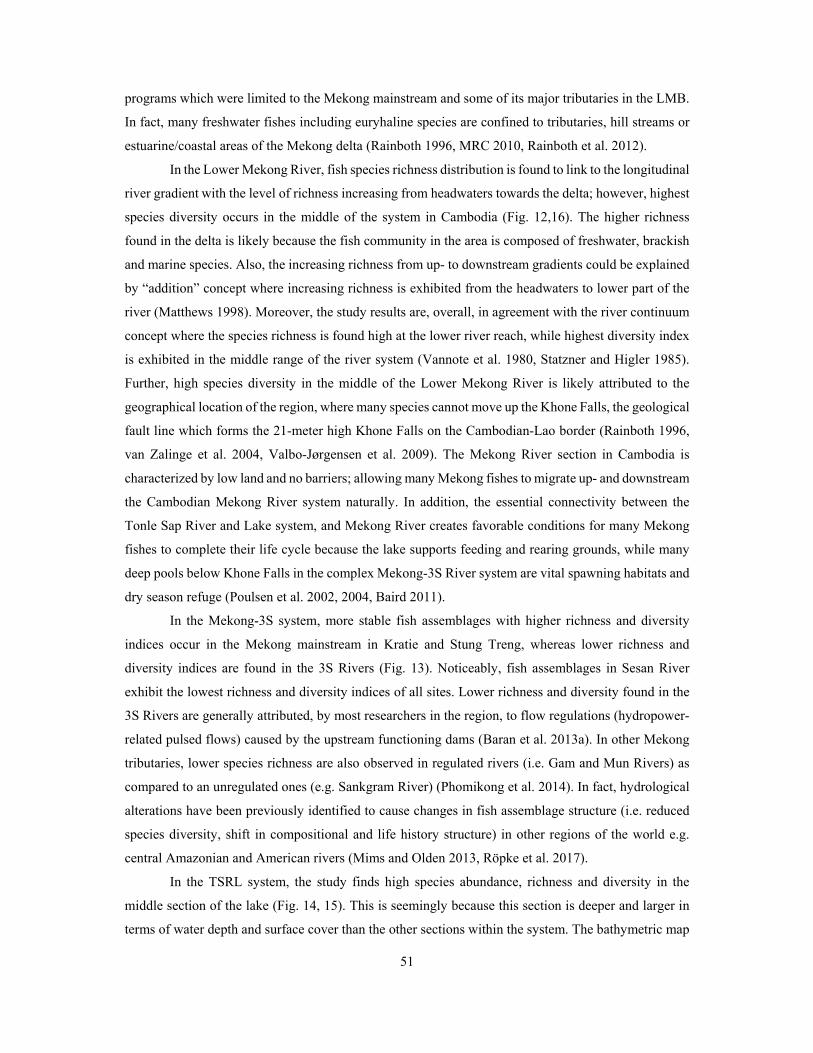
51
programs which were limited to the Mekong mainstream and some of its major tributaries in the LMB.
In fact, many freshwater fishes including euryhaline species are confined to tributaries, hill streams or
estuarine/coastal areas of the Mekong delta (Rainboth 1996, MRC 2010, Rainboth et al. 2012).
In the Lower Mekong River, fish species richness distribution is found to link to the longitudinal
river gradient with the level of richness increasing from headwaters towards the delta; however, highest
species diversity occurs in the middle of the system in Cambodia (Fig. 12,16). The higher richness
found in the delta is likely because the fish community in the area is composed of freshwater, brackish
and marine species. Also, the increasing richness from up- to downstream gradients could be explained
by “addition” concept where increasing richness is exhibited from the headwaters to lower part of the
river (Matthews 1998). Moreover, the study results are, overall, in agreement with the river continuum
concept where the species richness is found high at the lower river reach, while highest diversity index
is exhibited in the middle range of the river system (Vannote et al. 1980, Statzner and Higler 1985).
Further, high species diversity in the middle of the Lower Mekong River is likely attributed to the
geographical location of the region, where many species cannot move up the Khone Falls, the geological
fault line which forms the 21-meter high Khone Falls on the Cambodian-Lao border (Rainboth 1996,
van Zalinge et al. 2004, Valbo-Jørgensen et al. 2009). The Mekong River section in Cambodia is
characterized by low land and no barriers; allowing many Mekong fishes to migrate up- and downstream
the Cambodian Mekong River system naturally. In addition, the essential connectivity between the
Tonle Sap River and Lake system, and Mekong River creates favorable conditions for many Mekong
fishes to complete their life cycle because the lake supports feeding and rearing grounds, while many
deep pools below Khone Falls in the complex Mekong-3S River system are vital spawning habitats and
dry season refuge (Poulsen et al. 2002, 2004, Baird 2011).
In the Mekong-3S system, more stable fish assemblages with higher richness and diversity
indices occur in the Mekong mainstream in Kratie and Stung Treng, whereas lower richness and
diversity indices are found in the 3S Rivers (Fig. 13). Noticeably, fish assemblages in Sesan River
exhibit the lowest richness and diversity indices of all sites. Lower richness and diversity found in the
3S Rivers are generally attributed, by most researchers in the region, to flow regulations (hydropower-
related pulsed flows) caused by the upstream functioning dams (Baran et al. 2013a). In other Mekong
tributaries, lower species richness are also observed in regulated rivers (i.e. Gam and Mun Rivers) as
compared to an unregulated ones (e.g. Sankgram River) (Phomikong et al. 2014). In fact, hydrological
alterations have been previously identified to cause changes in fish assemblage structure (i.e. reduced
species diversity, shift in compositional and life history structure) in other regions of the world e.g.
central Amazonian and American rivers (Mims and Olden 2013, Röpke et al. 2017).
In the TSRL system, the study finds high species abundance, richness and diversity in the
middle section of the lake (Fig. 14, 15). This is seemingly because this section is deeper and larger in
terms of water depth and surface cover than the other sections within the system. The bathymetric map

52
of the Tonle Sap Lake shows a general slope down towards the middle section from both southern
section in Kampong Chhnang and northern section in Battambang (Campbell et al. 2006). In addition,
the middle section has a higher degree of inundation throughout the year, which is contributed by at
least three largest tributary rivers of the Tonle Sap sub-basin, namely the Sen River in Kampong Thom
with a lower reach drainage within 230 km2 of the lake, Chinit River in Kampong Thom with a total
drainage area of 5,649 km and Pursat River in Pursat with catchment area of 5,965 km2 (CGIAR 2013,
Nagumo et al. 2013, 2015). The large extent of inundation, combined with greater depths, tends to
increase habitat connectivity and availability which creates more living space and stable environment.
This gives fish species a colonizing advantage, which drives greater richness and diversity (Henriques-
Silva et al. 2013). For example, Boeng Chhmar and its associated rivers and floodplains, covering an
area of 28,000 ha in the middle section of the Tonle Sap Lake in Kampong Thom is described as a near-
natural wetland, encompassing permanent open water surrounded by a creek system; the area has been
designated a RAMSAR wetland of global significance since 1999 (The Ramsar Convention Secretariat
2014).
By contrast, relatively low richness and diversity are found in the southern (Kandal, Kampong
Chhnang) and northern sites (Siem Reap, Battambang) where total species richness among these sites
are similar. This is because sites in the southern part are representative of riverine habitat, mainly
serving as a natural fish passageway for migratory species that seasonally migrate between the lake and
the Mekong River to complete their life cycle (Poulsen et al. 2004, Halls et al. 2013c). This site is
laterally connected with the surrounding floodplains only partly during the high-flow period and
become disconnected for most parts of the year (Valbo-Jørgensen et al. 2009). Similarly, sites in the
northern section have lesser connection with large and permanent wetted tributary rivers, and the main
land use types of the location are rice farming, herbaceous floating vegetation and dense mats of water
hyacinths as well as seasonal flooded grasslands (Hortle et al. 2008, MRC 2011 pp. 64–65). Such
habitats favor mainly black (floodplain residents) and some gray (lateral migrants between floodplains
and rivers) fishes capable of tolerating anoxia conditions (Welcome 2001, Aloo 2003).
5.2 Spatial variation in fish community structure
Overall, spatial abundance distribution patterns of the Mekong fishes are associated with their
seasonal migration patterns and their population structure. Some Mekong fishes migrate upstream for
reproduction, while others migrate downstream for feeding and rearing.
In the Lower Mekong River, clear broad-scale patterns of the assemblage structure are observed
between the upper Lower Mekong River and its delta. Specifically, assemblages Ia and Ib (Fig. 12, 16)
are characterized by cyprinids and catfishes (mostly potamodromous fishes) frequently occurring in a
large-sized river, specifically in the Mekong mainstream i.e. C. harmandi, L. chrysophekadion, H.
waandersii, B. yarelli and Bangana behri (Lucas et al. 2001). Below Khone Falls, the cyprinids in Ib
53
are dominated by opportunist and small-sized species, such as Henicorhynchus spp., Labiobarbus spp.,
Paralaubucca spp., and Thynnichthys thynnoides. These species are known as fast growing with short
lifespan and are reported to perform long-distance migration, commonly occurring between the Tonle
Sap system and upstream Cambodian Mekong River system and beyond (Poulsen et al. 2002, 2004,
Baird et al. 2003, Halls et al. 2013c).
In the Mekong delta, perch-like fishes (Perciformes) and clupeids (Clupeiformes) are common
species in IIa and IIb; these groups of fish are tolerant to salinity and turbid water (Albert and Reis
2011). Nevertheless, many species in IIa, are characterized as stenohaline species such as C.
aesarnensis, Mastacembelus spp., Acanthopsis spp., which are less tolerant to the brackish conditions
of the delta. However, some of them need the marine environment to complete their life cycle including
Cynoglossus microlepis, while others are said to reside permanently in the estuary, for example G.
giuris (Valbo-Jørgensen et al. 2009, Froese and Pauly 2017). In IIb, marine species are dominant,
among those are Liza spp., Scomberomorus sp., Toxotes spp., Allenbatrachus grunniens,
Boleophthalmus boddarti; they are well suited to the marine environment with less light penetration
(Moyle and Cech 1988). Of course, these species are known as amphidromous fishes and some of them
are catadromous fishes, for example Anguilla sp., Ellochelon vaigiensis, Mugil cephalus, which inhabit
fresh-brackish water and live permanently in the estuary like the small anchovies (Coilia sp. and
Tenualosa toti) (Froese and Pauly 2017).
In the complex Mekong-3S system, fish assemblages in the Mekong sites are more species-rich
and diverse as compared to the 3S (Fig. 13). This is expected as the Mekong River is deeper and larger
in size, and species richness are generally found to have strong positive relationship with surface
drainage area and flow (Guégan et al. 1998). Among the 3S, Srepok (SP) is the most species-rich and
comparable to the Mekong River in Kratie. As discussed, high species richness in SP is perhaps because
the river has the largest basin area (30,650 km2) as compared to SK (28,820 km2) and SS (18,890 km2)
(see Fig. 8) and is the deepest, with better flow conditions relative to Sekong (SK) and Sesan (SS) rivers
(see S1, Article 4). In addition, some similarities of fish assemblage patterns found between SP and the
Mekong sites (Fig. 17) are likely because SP had the highest number of migratory species (81) relative
to SK (64) and SS (54) (Baran et al. 2013a). These migratory species e.g. Pangasiidae and Cyprinidae
can migrate hundreds of kilometers between the mainstream, tributaries and floodplains during their
life cycles (Poulsen et al. 2002, 2004, Sverdrup-Jensen 2002). Local fish migration behavior may
additionally explain the pattern i.e. most cyprinids are known to migrate upriver along the edges of
rivers; therefore, when fish leave the Mekong, enter the Sekong River (SK) and travel up along its
southern bank, they will enter Sesan (SS) and will soon continue right into SP (Baran et al. 2013a) (see
also Fig. 8). These factors combined with greater depths and better flow conditions in SP, tend to explain
some similarities of the assemblage patterns between the two rivers.

54
In Tonle Sap River and Lake system fish fauna is distributed along a south-north gradient,
classifying the entire community into three assemblage clusters (Fig. 18). Characteristic species in
cluster 1 of the southern section are mainly restricted to migratory (riverine) white fishes such as river
catfishes, cyprinids, loaches and sheatfishes. These white fishes are generally intolerant of anoxia,
preferring migrations as a means to escape adverse environmental conditions in the dry season
(Welcome 2001). Well-oxygenated water such as the lotic main river channel and deep pools are
generally required for these species to shelter in the dry season (Halls et al. 2013a). In addition, the
distribution of the white fish in this cluster is part of seasonal migrations to complete their life cycles,
i.e. accessing the Tonle Sap floodplains for rearing and feeding, and returning to the Mekong
mainstream for dry season refuge and spawning during early flooding cycle (Dudgeon 2000, Poulsen
et al. 2002, 2004, Baran 2006, Kong et al. 2017).
Cluster 2 in the middle section of the lake is characterized by both restricted and widespread
species including small bagrid catfishes (Mystus spp.), cyprinids, glassfishes, leaf fishes, climbing
gouramies and spiny eels. Overall, this cluster is represented by high number of indicator species with
different ecological attributes such as longitudinal migratory white fishes, floodplain residents (black
fishes) and lateral migrants (gray fishes). This is likely due to overall environmental stability in this
section, i.e. with deeper waters, larger surface cover and habitat connectivity through the permanent
water bodies (i.e. Ramsar Wetlands of Boeng Chhmar) and presence of permeant wetted largest
tributaries of the Tonle Sap Basin.
Indicator species for cluster 3 in the northern section are mainly restricted to black and gray
fishes such as gouramies, airbreathing catfishes, sleepers, snakeheads, featherbacks and sheatfishes as
well as few cyprinid white fishes with general habitat preferences such as Barbonymus gonionotus and
Hampala macrolepidota. The underlying reason is that this cluster is associated with the lake’s northern
section that encompasses prominently lentic habitats and poorly oxygenated waters as compared to the
open area of the lake (cluster 2) with effective wind mixing conditions throughout the water columns
(van Zalinge et al. 2003). Black and some gray fishes are permanently found in such oxygen-poor
habitats (MRCS 1992, van Zalinge et al. 2003, Hortle et al. 2008). These fish groups are carnivores or
detritus feeders; some are able to migrate over land and some fishes including snakeheads, airbreathing
catfishes, gouramies and bagrid catfishes have developed auxiliary organs for oxygen uptake from the
atmospheric air (MRCS 1992, Lamberts 2001). In the Yala Swamp of the Lake Victoria, African
catfishes (black fish) are also found to flourish in such poorly-oxygenated habitats (Aloo 2003).
Consistently, the study finds very high relative abundance of white fish in cluster 1 (96%), and
gradually along south-north gradient of the TSRL, the proportion of white fish decreases and is replaced
by gray and black fishes towards cluster 2 and cluster 3 (Fig. 19). The results of this study also
strengthen those of previous studies that specifically find high abundance of featherbacks and
airbreathing catfishes in the northern section of the lake (Siem Reap, Battambang) (Lim et al. 1999),

55
and snakeheads and gouramies in Battambang (Enomoto et al. 2011). In addition, the present results
show that three species, namely, Henicorhynchus lobatus (Hlob), H. siamensis (Hsia), and Puntioplites
proctozysron (Ppro) are ubiquitously abundant for all the three clusters. These species, particularly
Henicorhynchus lobatus are among the ecological keystone species with its critical role in food security
throughout the LMB and an important prey for predatory fishes and Irrawaddy dolphins (Baird 2011,
Fukushima et al. 2014).
5.3 Temporal variation in fish community structure
In a tropical flood pulse system such as the Mekong, hydrologic variation is a key driver
influencing the temporal dynamics of fish assemblage structure. This study finds both significant intra-
and inter-annual variations of fish assemblages in the Tonle Sap specifically, and in the Lower Mekong
system more generally.
5.3.1 Flow variation in the Lower Mekong system
While more natural flow conditions are observed in the Mekong River in Kratie (KT) and Tonle
Sap River (TS), flows in the 3S Rivers e.g. Sesan (SS) appear to be highly altered by upstream dams,
which weaken the flow seasonality and predictability strength of the system and generate strong
aseasonality with unnatural sudden rising and falling water levels (Fig. 27). Such unnatural pulsed flows
in SS can be related to hydropeaking which is commonly experienced with hydropower dams
worldwide (Young et al. 2011, Kennedy et al. 2016) and known to alter hydraulic parameters such as
water levels, velocity and bed shear stress (Meile et al. 2010, Young et al. 2011, Kennedy et al. 2016,
Bejarano et al. 2017, Tonolla et al. 2017). Previous qualitative studies describe rapid rising and falling
water levels in the downstream SS when the 720 MW Yali Falls dam was under construction in 1996
and became officially operational in 2000 (Ratanakiri Fisheries Office 2000, Baird et al. 2002, Claasen
2004, Hirsch and Wyatt 2004, Baird and Meach 2005, Rutkow et al. 2005). Flow alternations became
even more severe when five more dams were commissioned between 2006 and 2011 (see Fig. 2, Article
4). As indicated in a recent study, the upstream SS’s under-construction and operational dams in Viet
Nam Highlands have caused an overall increase of 52% in dry season flow and a decrease of 22% in
the wet season flow of this river near the Cambodia border (Piman et al. 2013). Therefore, strong
aseasonal and unpredictable variabilities of flow evidenced in SS are highly likely explained by
hydropower-related pulsed flows.
5.3.2 Intra-annual variation in fish community structure
In the TSRL system, the abundance and richness of fish communities is found significantly
greater during the outflow period. (Fig. 20a and S3.7, Article 2). This is due to seasonally longitudinal

56
migration of white fishes from the TSRL to the Mekong mainstream for dry-season refugia (Poulsen et
al. 2002, 2004). Such seasonal migrations are reliably predictable as observed in the Mekong’s largest
Dai fishery operating in the Tonle Sap River for more than a century. The observed peaks often occur
in a time-window of ~7-1 days particularly before the full moon of December and January (Halls et al.
2013c). Likewise during this outflow, gray and black fishes also undertake short-distance lateral
movements from the nearby TSRL seasonal floodplains to the deeper area of the Tonle Sap Lake or the
main river channel. Seasonal migrations during the outflow usually drive huge fishing activities in the
TSRL and the LMB. By contrast, the least fish abundance in the TSRL is found during the inflow when
white fishes longitudinally migrate for spawning in rapids, deep pools of the Mekong River, and mature
fish, juveniles and larvae then migrate and drift down the river and invade the TSRL’s surrounding
floodplains for rearing and feeding (Valbo-Jørgensen et al. 2009). The lower abundance during the
inflow is likely attributed to low fish density as fish is widely dispersed by the seasonal flooding to the
floodplains and inundated forests surrounding the TSRL which makes capture difficult. The cross-
correlation analysis points out that peak abundance and richness (Fig. 21b, d) are respectively related
to the peak flow occurring about four months (-15 weeks in Kandal [KD] and -16 weeks in Pursat [PS])
and 2-2.5 months (-8 weeks in KD and -10 weeks in PS) earlier. Given that the peak flow occurs early
October (MRC, 2005; S1), the peak abundance takes place in around January, whereas the peak richness
happens early in between November and mid-December. The period for peak abundance and richness
found from the cross-correlation analysis corresponds with the defined outflow (falling water level)
period for this study (Article 2). Such seasonal patterns are also reported in other tropical river-
floodplain fish communities such as the Amazonian Juruá River and forest streams (Silvano et al. 2000,
Espírito-Santo et al. 2009), Venezuelan rivers (Hoeinghaus et al. 2003) and French Guiana (Boujard
1992) where greater abundance and richness with more species interactions are driven by the relative
low flow.
In the Lower Mekong system, the study finds that fish assemblages in the highly regulated river
(e.g. Sesan) is characterized by little seasonal variation in fish abundance, richness and distinct seasonal
assemblage composition with high species turnover. Assemblages in highly seasonal-predictable rivers
are represented by repeated seasonal-predictable peak abundance and richness at semi-annual and
annual cycles, and more similar seasonal assemblage composition with low species turnover (Fig. 28,
29, 34). This is because, in aseasonal-unpredictable rivers, dams generate hydropower-related pulsed
flows i.e. hydropeaking known to alter hydraulic parameters (Meile et al. 2010, Young et al. 2011,
Kennedy et al. 2016, Bejarano et al. 2017, Tonolla et al. 2017) which fragment habitats and alter fish
assemblage composition and diversity due to, among other factors, stranding, downstream displacement
and creating false attraction flows that reduce spawning and rearing success of fish (Hunter 1992,
McLaughlin et al. 2006, Habit et al. 2007, Poff et al. 2007, Clarke et al. 2008, Young et al. 2011,
Schmutz et al. 2015, Kennedy et al. 2016). This results in strong temporal fish assemblage

57
compositional changes with high species turnover. While partly in line with the recent Tonkin’s et al.
seasonality-predictability framework of highly seasonal-predictable environmental conditions
promoting the greatest temporal changes in diversity (abundance and richness), the results of this study
are overall not consistent with Tonkin’s et al. framework hypothesizing that predictably seasonal
environmental conditions promote the highest levels of temporal changes in assemblage composition
with high species turnover due to the hypothetical distinct habitats and thus distinct fauna should appear
between seasons (Tonkin et al. 2017). The study indicates that while the hypothesis works for stream
invertebrates, with which Tonkin et al. used to validate their hypothesis, whether it applies to fish
assemblages is far from evident. First, native fish assemblages are adapted to these predictable natural
seasonal disturbances and are resistant to change and, second, the habitat does not change structurally
during high flow periods, except for water volume and water velocity. Species not adapted to high water
velocities will disperse to escape these periodic unfavorable conditions and latter recolonize the site
during dry season periods. In the Mekong, the highly seasonal-predictable system, riverine fishes also
are known to have overlapping seasonal migration patterns between critical habitats (dry-season
refugia, spawning, feeding/rearing) (Valbo-Jorgensen and Poulsen 2000, Poulsen et al. 2002, 2004,
Sverdrup-Jensen 2002, Baran 2006), and possibly have homing behavior and site fidelity (Dittman and
Quinn 1996, Thorrold et al. 2001, O’Connor et al. 2005, Koehn et al. 2009, Duponchelle et al. 2016)
which likely constitutes more similar seasonal assemblage composition with low species turnover.
5.3.3 Inter-annual variation in fish community structure
In the TSRL, inter-annual variation in the fish community structure are closely linked to
hydrology. The annual peak flows in the Tonle Sap Lake are found highly contrasted during the four-
year study period (Fig. 20b, 21), i.e. a peak flow of 9.9 m was recorded in 2011, while only 7.5 m was
observed in 2012, 9.0 m in 2013, 7.3 m in 2014 and only 5.3 m in 2015. High flows e.g. in 2011 and
2013, may have facilitated fish spawning success, survival and growth as greater flood levels equated
with the higher volumes of water in the TSRL and, hence, larger inundated areas of rearing/feeding
habitats were available for fish. Prey species and juveniles could stay longer in rearing habitats which
increases their survival rates. Higher flows also mean that more food become available and, thereby,
competition for food among fish is reduced. In fact, the highest catch on record over 17-year monitoring
period was observed in the fishing season of 2011/2012 at the Tonle Sap Dai fishery (Chheng et al.
2012).
Flows also constrain fish species with the longitudinal and lateral dispersal ability among
habitats such as different river reaches and floodplains (Franssen et al. 2006, Bunn & Harthington
2002). The significant inter-annual changes (Fig. 20b) were also due to the presence of more species
from high gradient river/streams and clear/fast flowing water in 2012 such as Clupisoma longianalis
(Clorn), Balitora meridionalis (Bmer) and Crossocheilus reticulatus (Cret), Hemibagrus wyckii (Hwyc)

58
and fewer slowly flowing/lowland rivers such as Parachela siamensis (Psia) and Hemibagrus
filamentus (Hfil), while towards 2015, there were more species with the habitat preference of lowland
rivers and peats such as Osteogeneiosus militaris (Omil), Osteochilus microcephalus (Omic),
Osphronemus goramy (Ogor), Tenualosa thibaudeaui (Tthi) and fewer high gradient river fishes such
as Discherodontus parvus (Dpar) and Osteochilus waandersii (Owaa).
In the Tonle Sap River (TS), long-term trends (2000-2015) in the seasonal catches of harvested
species of the Mekong’s largest commercial Dai fishery revealed that 78% of the 116-species are in
decline (Fig. 22). The results are consistent with the prediction of an intensively exploited
indiscriminate fishery. Consistent with indiscriminate fishing theory, a closer examination of the data
indicates that the catch declines are disproportionally represented by the larger, slower growing, higher
trophic level organisms of the Tonle Sap (Fig. 23). By contrast, the 22% of species caught by the Dai
fishery that tend to show increases are disproportionally represented by small-bodied, faster growing
lower trophic level organisms. In addition, significant declines of the mean fish size and trophic level
are evidenced in the seasonal catches of the fishery over the study period (Fig. 24). Finally, the data
consistently showed for common species spanning a range in adult body sizes that individual weights
and lengths of all these species, even in many of the small-bodied species, have been significantly
reduced over the last 15 years (Fig. 25, 26), a result that resonates with much research that has found
that heavy fishing pressure is known to drive shifts in life history towards smaller sizes and earlier ages
at maturation (Sharpe and Hendry 2009). The results also point out for select species that the number
of immature fish captured has increased throughout the study period (Fig. 26). Moreover, a significant
decreasing trend in species evenness is observed over the study period (Fig. S5, Article 3). Thus,
although this fishery has been amazingly resilient to changes in total fish harvest levels, these results
collectively are in agreement with predicted effects of indiscriminate fishing theory. Because this theory
ultimately predicts declines in fish catches and diversity with sustained, heavy indiscriminate fishing
pressure (Jacobsen et al. 2014, McCann et al. 2016, Andersen and Gislason 2017, Szuwalski et al.
2017), these findings may be seen as an ‘early yet clear warning signal’ of looming negative impacts of
indiscriminate fishing in the Tonle Sap.
In the Lower Mekong system, the study finds that sites with altered flows (Sekong [SK], Sesan
[SS], Srepok [SP] – 3S) caused by upstream operating dams exhibit lowest levels of temporal changes
in diversity (abundance, richness and temporal beta diversity [LCBD indices]) as compared to the
predictably seasonal ones (Mekong [KT, ST] and Tonle Sap [TS]) (Fig. 27, 30, 31). The results indicate
that dams modulate flows and weaken the flows’ seasonality and predictability strengths and thus mute
seasonal variation of fish abundance, richness, temporal beta diversity (LCBD indices) in the 3S,
whereas sites with more naturally predictable flow conditions (Mekong, Tonle Sap) promote reliable
seasonal variation in fish abundance, richness and temporal beta diversity (LCBD) with regular-
predictable peaks at semi-annual and annual frequencies. Such reliable recurrence and coherence

59
patterns of hydrology and fish (Fig. 32-34, for Mekong [KT] and Tonle Sap [TS]) are indeed consistent
with the existing knowledge about timing of fish migration, fishing and local fisheries management
practices in the Lower Mekong system (Valbo-Jorgensen and Poulsen 2000, Bao et al. 2001, Poulsen
et al. 2002, 2004, Baird et al. 2003, FiA 2006, Halls et al. 2013c). When the river seasonal-predictable
flows are modified as evidenced in the 3S e.g. SS (Fig. 32-34), such reliably seasonal-predictable events
of fish assemblages no longer exist.
Finally, the study finds that the temporal dynamics of assemblage composition are driven by
specialist species in the Mekong mainstream (Fig. 35a) and by generalist species in the 3S (Fig. 35b).
Key species contributing to the temporal changes in the Mekong sites during the last four years of the
survey are disproportionately represented by specialists, including medium and large-sized cyprinids of
the family Cyprinidae, river catfishes of Pangasiidae and sheatfishes of Siluridae. These fishes are often
long-distance migrants and/or mainstream spawners and prefer mainstream rivers as their main habitats.
The opposite is observed in the 3S Rivers, where small-sized species (minnows and carps) of cyprinids
with generalist habitat preferences are among the key species contributing to the assemblage change.
Further, some floodplain resident fishes, such as climbing perches, snakeheads and airbreathing
catfishes, are also among the key species in the assemblage composition of the 3S Rivers towards the
last few years of the survey. These fishes have airbreathing organs and can physically withstand adverse
environmental conditions (MRCS 1992, Welcome 2001, Poulsen et al. 2002). This trend in assemblage
composition of the Mekong-3S system is likely to resemble the environmental filtering by dams because
many migratory (specialist) species that depend on seasonal flow dynamics to complete their life cycles
are constrained or extirpated by flow disruption caused by dams (Liermann et al. 2012), which finally
leads to increased faunal homogenization as observed in the middle Lancang-Mekong River (Li et al.
2013), many Chinese lakes connecting to the Yangtze River (Cheng et al. 2014), and rivers across the
United States (Poff et al. 2007). These results also strengthen recent review and field studies that find
fish assemblages in SS to be represented by small-sized and generalist species such as small mud carps
(mTL<25 cm) of the family Cyprinidae, and fewer large-sized migratory species such as river catfishes
of Pangasiidae (mTL>100 cm), relative to the Mekong mainstream sites (Baran et al. 2013a, Ou and
Winemiller 2016, Ou et al. 2017).
VI. Conclusion and implications for fisheries management and conservation
6.1 Conclusion
Fishes and fisheries of the LMB are globally acknowledged for its extremely high diversity and
productivity. 504 fish species belonging to 252 genera, 78 families and 22 orders were recorded in the
MRC routine fish monitoring programs. Seasonal flood pulse dynamics play a key role in structuring
the spatial and temporal dynamics of fish communities. Fish species richness of the LMR is found to
increase along its longitudinal ecological gradient from the upper LMR towards its delta. In contrast,

60
high species diversity occurs in the middle of the system in Cambodia. Species in the upper and middle
of the LMR are more indicative of potamodromous cyprinids and river catfishes; while in the delta, fish
communities are composed of both steno- and euryhaline species, represented mainly by perch-like
fishes and clupeids. In the Tonle Sap system, both species richness and diversity are found highest in
the middle of the lake. The spatial abundance distribution patterns display a river-lake gradient with
three fish assemblages clustered according to their composition similarities and characterized by 96
indicator species. In the southern section, fish assemblages are characterized by longitudinal migratory
fish (i.e. cyprinids, river catfishes, loaches, sheatfishes), while in the middle system, the assemblage is
represented by species with combined ecological attributes (longitudinal and lateral migratory species,
and floodplain residents). Towards the northern part, fish assemblages are composed by lateral
migratory fishes (i.e. featherbacks, sheatfishes and puffers) and floodplain resident species (i.e.
gouramies, airbreathing catfishes, sleepers, snakeheads). Besides, the analyses on trends in the seasonal
catches of 116 species shows that while overall production is sustained over the last 15-year period, fish
communities utilizing the Tonle Sap system resemble the signature of indiscriminate fishing effects,
with strong evidence that many medium- to large-sized fishes are declining and being replaced by
smaller-sized fishes that, in turn, are responding to fishing pressure with significant reductions in body
size. In the 3S system, more stable fish communities are revealed in Srepok (SP) River than those in
Sekong (SK) and Sesan (SS) Rivers. In the Lower Mekong system, upstream functioning dams are
found to weaken flow seasonality-predictability strength of the 3S relative to the Mekong and Tonle
Sap Rivers reflecting the system’s different spatial and temporal responses of fish communities.
Overall, there have been declining trends on local species richness and abundance with strong temporal
variability in local beta diversity. Rivers with highly seasonal-predictable flows (Mekong, Tonle Sap)
are indicated by seasonal assemblage variability and regular annual peaks of fish migration, while rivers
with highly regulated flows (3S) are characterized by aseasonal assemblage changes. Moreover, rivers
with predictably seasonal flows are characterized by broad similarities of seasonal fish assemblage
composition with low species turnover, whereas disturbed rivers are represented by distinct seasonal
assemblage composition with high species turnover. Temporal shifts in assemblage composition
suggest ecological filtering by dams, which alters seasonal flow patterns and favors generalist species
which are observed, especially, in the 3S system.
6.2 Implications for fisheries management and conservation
For centuries, fishes of the LMB have been supporting the livelihoods of communities and
millions of people. Will the great resources sustain in supporting its environmental goods and services
in the face of combined effects of increased fishing pressure, increasing hydropower dam development
and other anthropogenic stressors such as land use change, invasive species and climate change? This
study demonstrates that fish species richness, abundance and biomass are significantly decreasing over

61
time. Overfishing is threatening Tonle Sap’s fisheries. Flow alternations by dams particularly in the 3S
severely affect fish community structure and gradually diminish the system’s productivity. Several
planned dams in the Lower Mekong system including those in the mainstream are being pushed forward
to the construction phase. Possible collapse in resource productivity may be on the horizon, making it
critical to the protection and conservation of fish biodiversity and ecosystems of the Mekong including
those of the Tonle Sap and 3S Basins. In so doing,
it is imperative to maintain the Mekong’s robust and predictably seasonal flood pulse dynamics
and habitat connectivity which ensures the dispersal ability of fishes in the region both
longitudinally along the river mainstream and laterally between the river mainstream and
floodplain habitats such as those of Tonle Sap and the 3S System.
attention should be given to setting appropriate regulations based on known peak fish migrations
at various time-scales of the year would allow migratory fish to pass through rivers and complete
their life cycles. Also, strengthening the existing formal institutions and allocating sufficient
resources to the fishery sector by the governments of countries sharing the LMB could contribute
to better enforcement of the current fishery laws and regulations in each respective country in
order to reduce prevailing illegal fishing practices particularly those occurring in critical fish
habitats. For instance, the formal institutions such as fisheries sector administrations, fisheries
communities or fisheries associations as well as the LMB transboundary fisheries management
bodies which have been established in the form of community-based fisheries management and
joint mechanisms for transboundary fisheries management by the LMB national governments
and the Mekong Rover Commission should be strengthened and enabled to fulfill their mandates.
Priority of the protection or conservation initiatives should be given to key critical fish habitats
where fishes breed, feed and seek refuge, aiming at (1) letting fish spawn at least for the first time
before capture, (2) let fish grow and (3) let the mega-spawners live to deal with overfishing
(Froese 2004).
decisive efforts should be made to minimise the dam impacts, (1) there should be a basin-scale
integrated strategic plan (accounting for cumulative impacts on hydrology and ecosystem
services) that finds the balance between exploiting hydropower potential and sustaining key
resources, e.g. in dam site selection (Winemiller et al. 2016). (2) the best available technologies
related to up- and downstream fish pass facilities (Schmutz and Mielach 2015) must be built for
existing and planned dams to facilitate up- and downstream fish migrations. Flow designs or flow
management measures that could mimic as far as possible the natural hydraulic variation should
be applied as a mitigation measure because the variation is the main ecological driver for fish
dispersal and reproduction success.
finally, continued support for basin-wide fish monitoring programs is highly necessary to provide
updated data for fisheries impact assessment studies and for updating the status of the LMB fishes

62
and fisheries. Fish monitoring methods may be revisited to suit specific research needs, yet a
mechanism for sharing and integrating national datasets needs to be maintained and used to
inform both fisheries management and other water development plans.
VII. Further research
The Lower Mekong system is one of the most biodiverse rivers in the world. However, it has
received little ecology research on many aspects of its resources and ecology including fish, reptiles,
invertebrate and primary producers (Dudgeon 2000, 2003, Junk et al. 2006, Kummu et al. 2006,
Vaidyanathan 2011, Allen et al. 2012). While this study provides an important contribution to
understanding fishes and fisheries of the LMB, much fish ecological research is urgently required for
better planning, management and biodiversity conservation in response to rapid developments
particularly hydropower dams in the river basin. To contribute to such urgent calls, some immediate
fish ecology research is suggested as follows:
Update the basin-scale study related to ecological drivers that determine the spatial uniqueness
of the LMB fish taxonomic composition. The research would generate data and information
useful for the local and basin-wide fisheries planning, management and conservation. This study
can be achieved through the use of the available updates of MRC fish and environment
monitoring data in the LMB, and the framework of analysis as developed by (Legendre and De
Cáceres 2013).
Apart from the taxonomic component of fish biodiversity, the assessment of functional diversity
(i.e. the range of biological traits) to measure the range of functions performed by fish fauna in
the system could be a good approach to understand the role of fish biodiversity in sustaining
ecosystem services, as well as the effects of anthropogenic disturbances on fish biodiversity in
the Mekong. Several recent literatures e.g. (S. Villéger , N. W. H. Mason 2008, Cilleros et al.
2016, Toussaint et al. 2016, Teichert et al. 2017, Vitule et al. 2017, Kuczynski et al. 2018) would
provide the framework of analysis to start such studies. In addition, data, i.e. morphological traits
and other ecological attributes for this study can be collected from various existing databases
such as the Mekong Fish Database (MFD 2003), FishBase (Froese and Pauly 2017) and a recent
online database (ffish.asia) providing high resolution photos of the Mekong fishes (Kano et al.
2013). A software package to measure e.g. fish morphological traits is now available in ImageJ
(http://rsb.info.nih.gov/ij/index.html).
Moreover, this study finds out that small-sized mud carps e.g. Henicorhynchus spp. and
Labiobarbus spp. are among the ecologically keystone species of the LMB which serve as prey
for many predators, and significantly contribute to food security of the people in the LMB. These
species are among the most abundant species and highly resilient to fishing pressure. To
63
understand what determines the bio-ecological success of these species under high fishing
pressure would help shed light on ideas or generate information which could contribute to better
management and conservation of these important species in support of ecology and food security
in the region.
Last, but not least, Other Aquatic Animals (OAAs) such as mollusk and crustacean are highly
abundant particularly in the Tonle Sap floodplain and lake and heavily exploited. These resources
play vital roles in support of food web dynamics and ecology as well as sources of income and
food security of the LMB dwellers. However, these important resources are generally forgotten
in fisheries management legislation, many research agendas and water development discussions
in the region. Research initiatives in support of appropriate planning, management and
conservation actions for these resources ought to be promoted before the resources become
extinct due to human actions.

64
References
Adamson, P. T., I. D. Rutherfurd, M. C. Peel, and I. A. Conlan. 2009. The Hydrology of the Mekong River. Pages 53–76in I. C. Campbell, editor.The Mekong Biophysical Environment of an International River Basin. 1st edition. Elsevier Inc., Amsterdam.
Agostinho, A. A., L. C. Gomes, S. Veríssimo, and E. K. Okada. 2004. Flood regime, dam regulation and fish in the Upper Paraná River: Effects on assemblage attributes, reproduction and recruitment. Reviews in Fish Biology and Fisheries 14:11–19.
Ahmed, M., N. Hap, V. Ly, and M. Tiongco. 1998. Socioeconomic Assessment of Freshwater Capture Fisheries of Cambodia: a report on a household survey. Project for the management of the freshwater capture fisheries of Cambodia, Mekong River Commission/Department of Fisheries/Danish International Development Agency, Phnom Penh.
Albert, S. J., and E. R. Reis. 2011. Introduction to neotropical freshwaters. Pages 3–16in S. J. Albert and E. R. Reis, editors.Historical biogeography of neotropical freshwater fishes. University of California Press, Berkeley Los Angeles.
Allan, J. D., R. Abell, Z. Hogan, C. Revenga, B. W. Taylor, R. L. Welcomme, and K. Winemiller. 2005. Overfishing of Inland Waters. BioScience 55:1041–1051.
Allen, D. J., K. G. Smith, and W. R. T. Darwall. 2012. The Status and Distribution of Freshwater Biodiversity in Indo-Burma. IUCN, Cambridge, UK and Gland, Switzerland.
Aloo, P. A. 2003. Biological diversity of the Yala Swamp lakes, with special emphasis on fish species composition, in relation to changes in the Lake Victoria Basin (Kenya): threats and conservation measures. Biodiversity & Conservation 12:905–920.
Andersen, K. H., and H. Gislason. 2017. Unplanned ecological engineering. Proceedings of the National Academy of Sciences 114:634–635.
Arias, M. E., T. A. Cochrane, M. Kummu, H. Lauri, G. W. Holtgrieve, J. Koponen, and T. Piman. 2014a. Impacts of hydropower and climate change on drivers of ecological productivity of Southeast Asia’s most important wetland. Ecological Modelling 272:252–263.
Arias, M. E., T. A. Cochrane, D. Norton, T. J. Killeen, and P. Khon. 2013. The flood pulse as the underlying driver of vegetation in the largest wetland and fishery of the Mekong Basin. Ambio 42:864–876.
Arias, M. E., T. A. Cochrane, T. Piman, M. Kummu, B. S. Caruso, and T. J. Killeen. 2012. Quantifying changes in flooding and habitats in the Tonle Sap Lake (Cambodia) caused by water infrastructure development and climate change in the Mekong Basin. Journal of Environmental Management 112:53–66.
Arias, M. E., T. Piman, H. Lauri, T. A. Cochrane, and M. Kummu. 2014b. Dams on Mekong tributaries as significant contributors of hydrological alterations to the Tonle Sap Floodplain in Cambodia. Hydrology and Earth System Sciences 18:5303–5315.
Baird, I., M. Baird, M. C. Chum, S. Kim, M. Nuon, S. Phat, B. N. Phouy, S. Prom, S. Ros, H. Rushton, and P. Sia. 2002. A Community-Based Study of the Downstream Impacts of the Yali Falls Dam Along the Se San, Sre Pok and Sekong Rivers in Stung Treng Province, Northeast Cambodia. Se San District Agriculture, Fisheries and Forestry Office, Stung Treng, Cambodia.
Baird, I. G. 2006. Probarbus jullieni and Probarbus labeamajor: The management and conservation of two of the largest fish species in the Mekong River in southern Laos. Aquatic Conservation: Marine and Freshwater Ecosystems 16:517–532.
Baird, I. G. 2011. The Don Sahong Dam. Critical Asian Studies 43:211–235.
Baird, I. G., M. S. Flaherty, and B. Phylavanh. 2003. Rhythms of the river: lunar phases and migrations of small carps (Cyprinidae) in the Mekong River. Natural History Bulletin of the Siam Society

65
51:5–36.
Baird, I. G., and M. Meach. 2005. Sesan River Fisheries Monitoring in Ratanakiri Province, Northeast Cambodia: Before and After the Construction of the Yali Falls Dam in the Central Highlands of Viet Nam. 3S Rivers Protection Network and the Global Association for People and the Environment, Ban Lung, Ratanakiri, Cambodia.
Bao, T. Q., K. Bouakhamvongsa, S. Chan, K. Chhuon, T. Phommavong, A. F. Poulsen, P. Rukawoma, U. Suornratana, D. V. Tien, T. T. Tuan, N. T. Tung, J. Valbo-Jorgensen, S. Viravong, and N. Yoorong. 2001. Local knowledge in the study of river fish biology: experiences from the Mekong. Mekong River Commission, Phnom Penh.
Baran, E. 2005. Cambodia inland fisheries: facts, figures and context. WorldFish Center and Inland Fisheries Research and Development Institute, Phnom Penh, Cambodia.
Baran, E. 2006. Fish Migration Triggers and Cues in the Lower Mekong Basin and Other Freshwater Tropical Systems. Mekong River Commission, Vientiane.
Baran, E., S. Samadee, T. S. Jiau, and T. C. Tran. 2013a. Fish and fisheries in the Sesan, Sekong and Srepok River Basins (Mekong Watershed). ICEM – International Centre for Environmental Management, Hanoi.
Baran, E., N. So, P. Degen, X. Y. Chen, and P. Starr. 2013b. Update information on fish and fisheries in the Lower Mekong Basin. Catch and Culture 19:24–25.
Baran, E., N. P. van Zalinge, and P. B. Ngor. 2001. Floods, Floodplains and Fish Production in the Mekong Basin: Present and Past Trends. Pages 920–932in A. Ali, editor.Proceedings of the Second Asian Wetlands Symposium, 27-30 August 2001, Penang, Malaysia. Penerbit Universiti Sains Malaysia, Pulau Pinang, Malaysia.
Bartley, D. M., G. J. De Graaf, J. Valbo-Jørgensen, and G. Marmulla. 2015. Inland capture fisheries: Status and data issues. Fisheries Management and Ecology 22:71–77.
Bejarano, M. D., R. Jansson, and C. Nilsson. 2017. The effects of hydropeaking on riverine plants: a review. Biological Reviews:1–16.
Béné, C., M. Barange, R. Subasinghe, P. Pinstrup-Andersen, G. Merino, G.-I. Hemre, and M. Williams. 2015. Feeding 9 billion by 2050 – Putting fish back on the menu. Food Security 7:261–274.
Borcard, D., F. Gillet, and P. Legendre. 2011. Numerical Ecology with R. Page (R. Gentleman, K. Hornik, and G. G. Parmigiani, Eds.). Springer Science, New York.
Boujard, T. 1992. Space-time organization of riverine fish communities in French Guiana. Environmental Biology of Fishes 34:235–246.
Brownell, R. L., R. R. Reeves, P. O. Thomas, B. D. Smith, and G. E. Ryan. 2017. Dams threaten rare Mekong dolphins. Science 355:805.
Bunn, S. E., and A. H. Arthington. 2002. Basic principles and ecological consequences of altered flow regimes for aquatic biodiversity. Environmental Management 30:492–507.
De Cáceres, M., and F. Jansen. 2011. indicspecies: Functions to assess the strength and significance of relationship of species site group associations. R package version 1.6.0. http://cran.r-project.org/web/packages/indicspecies.
Cáceres, M. De, and P. Legendre. 2009. Associations between species and groups of sites: indices and statistical inference. Ecology 90:3566–3574.
Campbell, I. C., C. Poole, W. Giesen, and J. Valbo-Jorgensen. 2006. Species diversity and ecology of Tonle Sap Great Lake, Cambodia. Aquatic Sciences 68:355–373.
Carbonnel, J. P. 1963. Vitesse d’ accumulation des sediments recents du Grand Lac du Cambodge d’apres le carbone 14. Conꞏelations stratigraphiques et morphologiques. Comptes Rendus de l ’Academie des Sciences 257:25 14-2516.

66
CGIAR. 2013. Working paper on population growth and natural resource pressures in Pursat catchment. Australian Aid and CGIAR Challenge Program on Water and Food, Vientiane.
Chea, R., S. Lek, P. B. Ngor, and G. Grenouillet. 2016. Large-scale patterns of fish diversity and assemblage structure in the longest tropical river in Asia. Ecology of Freshwater Fish 2016:1–11.
Cheng, L., S. Blanchet, G. Loot, S. Villéger, T. Zhang, S. Lek, S. Lek-Ang, and Z. Li. 2014. Temporal changes in the taxonomic and functional diversity of fish communities in shallow Chinese lakes: The effects of river-lake connections and aquaculture. Aquatic Conservation: Marine and Freshwater Ecosystems 24:23–34.
Chheng, P., N. So, P. B. Ngor, and T. Nao. 2012. Record fish catch on Tonle Sap River. Catch and Culture 18:4–5.
Cilleros, K., L. Allard, G. Grenouillet, and S. Brosse. 2016. Taxonomic and functional diversity patterns reveal different processes shaping European and Amazonian stream fish assemblages. Journal of Biogeography 43:1832–1843.
Claasen, A. H. 2004. Abundance, distribution, and reproductive success of sandbar nesting birds below the Yali Falls hydropower dam on the Sesan River, northeastern Cambodia. WWF/Danida/WCS/BirdLife International, Phnom Penh.
Clarke, K. D., T. C. Pratt, R. G. Randall, A. Dave, and K. E. Smokorowski. 2008. Validation of the flow management pathway: effects of altered flow on fish habitat and fishes downstream from a hydropower dam. Canadian Technical Report of Fisheries and Aquatic Sciences 2784, Canada.
Cochrane, T. A., M. E. Arias, and T. Piman. 2014. Historical impact of water infrastructure on water levels of the Mekong River and the Tonle Sap system. Hydrology and Earth System Sciences 18:4529–4541.
Collier, M., R. H. Webb, and J. C. Schmidt. 1996. Dams and rivers: A Primer on the Downstream Effects of Dams. U.S. Geological Survey, Circular 1 1 2 6, Colorado.
Colwell, R. K. 1974. Predictability, constancy, and contingency of periodic phenomena. Ecology 55:1148–1153.
Constable, D. 2015. Atlas of the 3S Basins. International Union for Conservation of Nature and Natural Resources (IUCN), Bangkok.
Davidson, P. J. 2006. The biodiversity of the Tonle Sap Biosphere Reserve: 2005 status review. UNDP-GEF funded Tonle Sap Conservation Project, Phnom Penh, Cambodia.
Deap, L., P. Degen, and N. van Zalinge. 2003. Fishing gears of the Cambodian Mekong. Inland Fisheries Research and Development Institute of Cambodia & Mekong River Commission, Phnom Penh, Cambodia.
Dittman, A., and T. Quinn. 1996. Homing in Pacific salmon: mechanisms and ecological basis. The Journal of experimental biology 199:83–91.
Dray, S., G. Blanchet, D. Borcard, G. Guénard, T. Jombart, G. Larocque, P. Legendre, N. Madi, and H. H. Wagner. 2017. adespatial: Multivariate multiscale spatial analysis. R package version 0.0-8. http://cran.r-project.org/package=adespatial.
Dudgeon, D. 2000. The Ecology of Tropical Asian Rivers and Streams in Relation to Biodiversity Conservation. Annual Review of Ecology, Evolution, and Systematics 31:195–229.
Dudgeon, D. 2003. The contribution of scientific information to the conservation and management of freshwater biodiversity in tropical Asia. Hydrobiologia 500:295–314.
Dudgeon, D., A. H. Arthington, M. O. Gessner, Z.-I. Kawabata, D. J. Knowler, C. Lévêque, R. J. Naiman, A.-H. Prieur-Richard, D. Soto, M. L. J. Stiassny, and C. A. Sullivan. 2006. Freshwater biodiversity: importance, threats, status and conservation challenges. Biological Reviews of the Cambridge Philosophical Society 81:163–82.

67
Duponchelle, F., M. Pouilly, C. Pécheyran, M. Hauser, J. F. Renno, J. Panfili, A. M. Darnaude, A. García-Vasquez, F. Carvajal-Vallejos, C. García-Dávila, C. Doria, S. Bérail, A. Donard, F. Sondag, R. V. Santos, J. Nuñez, D. Point, M. Labonne, and E. Baras. 2016. Trans-Amazonian natal homing in giant catfish. Journal of Applied Ecology 53:1511–1520.
Enomoto, K., S. Ishikawa, M. Hori, H. S., L. S. Srun, T. Nao, and H. Kurokura. 2011. Data mining and stock assessment of fisheries resources in Tonle Sap Lake, Cambodia. Fisheries Science 77:713–722.
Espírito-Santo, H. M. V., W. E. Magnusson, J. Zuanon, F. P. Mendoça, and V. L. Landeiro. 2009. Seasonal variation in the composition of fish assemblages in small Amazonian forest streams: Evidence for predictable changes. Freshwater Biology 54:536–548.
Fan, H., D. He, and H. Wang. 2015. Environmental consequences of damming the mainstream Lancang-Mekong River: A review. Earth-Science Reviews 146:77–91.
FAO. 2016. The State of World Fisheries and Aquaculture 2016. Contributing to food security and nutrition for all. Food and Agriculture Organization of the United Nations, Rome.
Ferguson, J. W., M. Healey, P. Dugan, and C. Barlow. 2011. Potential effects of dams on migratory fish in the Mekong River: Lessons from salmon in the fraser and Columbia Rivers. Environmental Management 47:141–159.
FiA. 2006. Law on Fisheries. Fisheries Administration, Ministry of Agriculture, Forestry and Fisheries, Phnom.
Franssen, N. R., K. B. Gido, C. S. Guy, J. A. Tripe, S. J. Shrank, T. R. Strakosh, K. N. Bertrand, C. M. Franssen, K. L. Pitts, and C. P. Paukert. 2006. Effects of floods on fish assemblages in an intermittent prairie stream. Freshwater Biology 51:2072–2086.
Froese, R. 2004. Keep it simple: Three indicators to deal with overfishing. Fish and Fisheries 5:86–91.
Froese, R., and D. Pauly. 2017. FishBase. www.fishbase.org.
Fukushima, M., T. Jutagate, C. Grudpan, P. Phomikong, and S. Nohara. 2014. Potential effects of hydroelectric dam development in the Mekong River basin on the migration of Siamese mud carp (Henicorhynchus siamensis and H. lobatus) elucidated by otolith microchemistry. PLoS ONE 9:1–13.
de Graaf, G., D. Bartley, J. Jorgensen, and G. Marmulla. 2015. The scale of inland fisheries, can we do better? Alternative approaches for assessment. Fisheries Management and Ecology 22:64–70.
Graf, W. L. 2006. Downstream hydrologic and geomorphic effects of large dams on American rivers. Geomorphology 79:336–360.
Grumbine, R. E., J. Dore, and X. Jianchu. 2012. Mekong hydropower: Drivers of change and governance challenges. Frontiers in Ecology and the Environment 10:91–98.
Guégan, J. F., S. Lek, and T. Oberdorff. 1998. Energy availability and habitat heterogeneity predict global riverine fish diversity. Nature 391:382–384.
Gupta, A., and S. C. Liew. 2007. The Mekong from satellite imagery: a quick look at a large river. Geomorphology 85:259–274.
Habit, E., M. C. Belk, and O. Parra. 2007. Response of the riverine fish community to the construction and operation of a diversion hydropower plant in central Chile. Aquatic Conservation: Marine and Freshwater Ecosystems 17:37–49.
Halls, A. S., I. Conlan, W. Wisesjindawat, K. Phouthavongs, S. Viravong, S. Chan, and V. A. Vu. 2013a. Atlas of deep pools in the Lower Mekong River and some of its tributaries. Mekong River Commission, Phnom Penh.
Halls, A. S., and M. Kshatriya. 2009. Modelling the cumulative barrier and passage effects of mainstream hydropower dams on migratory fish populations in the Lower Mekong Basin. Page

68
Technical Paper No. 25. Mekong River Commission, Vientiane.
Halls, A. S., B. Paxton, N. Hall, K. Hortle, N. So, T. Chea, P. Chheng, S. Putrea, S. Lieng, N. Peng Bun, N. Pengby, S. Chan, V. Vu, D. Nguyen Nguyen, V. Doan, V. Sinthavong, S. Douangkham, S. Vannaxay, S. Renu, U. Suntornatana, T. Tiwarat, and S. Boonsong. 2013b. Integrated Analysis of Data from MRC Fisheries Monitoring Programmes in the Lower Mekong Basin. Page MRC Technical Paper No. 33. Mekong River Commission, Phnom Penh.
Halls, A. S., B. R. Paxton, N. Hall, P. B. Ngor, S. Lieng, P. Ngor, and N. So. 2013c. The Stationary Trawl (Dai) Fishery of the Tonle Sap-Great Lake System, Cambodia. Mekong River Commission, Phnom Penh.
Helfman, G. S., B. B. Collette, D. E. Facey, and B. W. Bowen. 2009. The Diversity of Fishes: Biology, Evolution, and Ecology. Wiley-Blackwell, Malaysia.
Henriques-Silva, R., Z. Lindo, and P. R. Peres-Neto. 2013. A community of metacommunities : Exploring patterns in species distributions across large geographical areas. Ecology 94:627–639.
Hirsch, P., and A. Wyatt. 2004. Negotiating local livelihoods: scales of conflict in the Se San River Basin. Asia Pacific Viewpoint 45:51–68.
Hoeinghaus, D. J., C. . Layman, D. A. Arrington, and K. O. Winemiller. 2003. Spatiotemporal variation in fish assemblage structure in tropical floodplain creeks. Environmental Biology of Fishes 67:379–387.
Hortle, K. G. 2007. Consumption and the yield of fish and other aquatic animals from the Lower Mekong Basin. Page MRC Technical Paper No. 16. Mekong River Commission, Vientiane.
Hortle, K. G. 2009. Fisheries of the Mekong River Basin. Pages 1997–1249in I. C. Campbell, editor.The Mekong biophysical Environment of an International River Basin. First edit. Elsevier Inc., Amsterdam.
Hortle, K. G., and P. Bamrungrach. 2015. Fisheries Habitat and Yield in the Lower Mekong Basin. Page MRC Technical Paper No. 47. Mekong River Commission, Phnom Penh.
Hortle, K. G., S. Lieng, and J. Valbo-Jorgensen. 2004. An introduction to Cambodia’s inland fisheries. Page Mekong Development Series No. 4. Mekong River Commission, Phnom Penh.
Hortle, K. G., R. Troeung, and S. Lieng. 2008. Yield and value of the wild fishery of rice fields in Battambang Province, near the Tonle Sap Lake, Cambodia. Page MRC Technical Paper No.18. Mekong River Commission, Vietiane.62 PP. Mekong River Commission, Vientiane.
Hunter, M. A. 1992. Hydropower flow fluctuations and salmonids: A review of the biological effects, mechanical causes, and options for mitigation. State of Washington Department of Fisheries, Washington.
Hurwood, D. A., E. A. S. Adamson, and P. B. Mather. 2008. Evidence for strong genetic strcuture in an economically important, highly vagile (Henicorhynchus lobatus) in the Mekong River. Ecology of Freshwater Fish 17:273–283.
ICEM. 2010. MRC Strategic Environmental Assessment (SEA) of hydropower on the Mekong mainstream. Mekong River Commission, Hanoi.
Jacobsen, N. S., H. Gislason, and K. H. Andersen. 2014. The consequences of balanced harvesting of fish communities. Proceedings. Biological sciences / The Royal Society 281:1–9.
Jenkins, M. 2003. Prospects for biodiversity. Science 302:1175–1177.
Junk, W. . J., and K. M. Wantzen. 2004. The flood pulse concept: new aspects, approaches and applications - an update. Pages 117–140in R. Welcomme and T. Petr, editors.Proceedings of the second international symposium on the management of large rivers for fisheries. FAO Regional Office for Asia and the Pacific, Bangkok.
Junk, W. J., M. Brown, I. C. Campbell, M. Finlayson, B. Gopal, L. Ramberg, and B. G. Warner. 2006.

69
The comparative biodiversity of seven globally important wetlands: A synthesis. Aquatic Sciences 68:400–414.
Kang, B., D. He, L. Perrett, H. Wang, W. Hu, W. Deng, and Y. Wu. 2009. Fish and fisheries in the Upper Mekong: Current assessment of the fish community, threats and conservation. Reviews in Fish Biology and Fisheries 19:465–480.
Kano, Y., M. S. B. Adnan, C. Grudpan, J. Grudpan, W. Magtoon, P. Musikasinthorn, Y. Natori, S. Ottomanski, B. Praxaysonbath, K. Phongsa, A. Rangsiruji, K. Shibukawa, Y. Shimatani, N. So, A. Suvarnaraksha, P. Thach, P. N. Thanh, D. D. Tran, K. Utsugi, and T. Yamashita. 2013. An online database on freshwater fish diversity and distribution in Mainland Southeast Asia. Ichthyological Research 60:293–295.
Kassambara, A. 2017. Pratical guide to cluster analysis in R: unsupervised machine learning. STHDA, Poland.
Kennedy, T. A., J. D. Muehlbauer, C. B. Yackulic, D. A. Lytle, S. W. Miller, K. L. Dibble, E. W. Kortenhoeven, A. N. Metcalfe, and C. V Baxter. 2016. Flow Management for Hydropower Extirpates Aquatic Insects, Undermining River Food Webs. BioScience 66:562–575.
Koehn, J. D., J. A. McKenzie, D. J. O’Mahony, S. J. Nicol, J. P. O’Connor, and W. G. O’Connor. 2009. Movements of Murray cod (Maccullochella peelii peelii) in a large Australian lowland river. Ecology of Freshwater Fish 18:594–602.
Kong, H., M. Chevalier, P. Laffaille, and S. Lek. 2017. Spatio-temporal variation of fish taxonomic composition in a South-East Asian flood-pulse system. PLoS ONE 12:1–16.
Kottelat, M. 2013. The Fishes of the inland waters of Southeast Asia: A catalogue and core bibliography of the fishes known to occur in freshwaters, mangroves and estuaries. The Raffles Bulletin of Zoology 27:1–663.
Kuczynski, L., J. Côte, A. Toussaint, S. Brosse, L. Buisson, and G. Grenouillet. 2018. Spatial mismatch in morphological, ecological, and phylogenetic diversity, in historical and contemporary European freshwater fish faunas. Ecography 41:1–10.
Kummu, M., J. Sarkkula, J. Koponen, and J. Nikula. 2006. Ecosystem Management of the Tonle Sap Lake: An Integrated Modelling Approach Ecosystem. Water Resources Development 22:497–519.
Kummu, M., S. Tes, S. Yin, P. Adamson, J. Józsa, J. Koponen, J. Richey, and J. Sarkkula. 2014. Water balance analysis for the Tonle Sap Lake-floodplain system. Hydrological Processes 28:1722–1733.
Lamberts, D. 2001. Tonle Sap fisheries: a case study on floodplain gillnet fisheries. Page RAP publication. Asia-Pacific Fisheries Commission, Food and Agriculture Organisation of the United Nations, Regional Office for Asia and the Pacific, Bangkok.
Latrubesse, E. M., E. Y. Arima, T. Dunne, E. Park, V. R. Baker, F. M. Horta, C. Wight, F. Wittmann, J. Zuanon, P. A. Baker, C. C. Ribas, R. B. Norgaard, and N. Filizola. 2017. Damming the rivers of the Amazon basin. Nature 546:363–369.
Legendre, P., and M. De Cáceres. 2013. Beta diversity as the variance of community data: Dissimilarity coefficients and partitioning. Ecology Letters 16:951–963.
Legendre, P., and L. Legendre. 2012. Numerical Ecology. Third Engl. Elsevier Science B.V., Great Britain.
Legendre, P., and B. Salvat. 2015. Thirty-year recovery of mollusc communities after nuclear experimentations on Fangataufa atoll (Tuamotu, French Polynesia). Proceedings of the Royal Society B: Biological Sciences 282:20150750.
Lévêque, C., T. Oberdorff, D. Paugy, M. K. J. Stiassny, and P. A. Tedesco. 2008. Global diversity of

70
fish (Pisces) in freshwater. Hydrobiologia 595:545–567.
Li, J., S. Dong, M. Peng, Z. Yang, S. Liu, X. Li, and C. Zhao. 2013. Effects of damming on the biological integrity of fish assemblages in the middle Lancang-Mekong River basin. Ecological Indicators 34:94–102.
Lieng, S., C. Yim, and N. van Zalinge. 1995. Freshwater fisheries of Cambodia, I: The bagnet (Dai) fishery in the Tonle Sap River. Asian Fisheries Science 8:255–262.
Liermann, C. R., C. Nilsson, J. Robertson, and R. Y. Ng. 2012. Implications of Dam Obstruction for Global Freshwater Fish Diversity. BioScience 62:539–548.
Lim, P., S. Lek, S. T. Touch, S. O. Mao, and B. Chhouk. 1999. Diversity and spatial distribution of freshwater fish in Great Lake and Tonle Sap river (Cambodia, Southeast Asia). Aquatic Living Resources 12:379–386.
Lucas, M. C., E. Baras, T. J. Thom, A. Duncan, and O. Slavik. 2001. Migration and spatial behaviour. Pages 1–12Migration of freshwater fishes. lackwell Science Ltd, Osney Mead, Oxford OX2 0EL.
Lynch, A. J., S. J. Cooke, A. M. Deines, S. D. Bower, D. B. Bunnell, I. G. Cowx, V. M. Nguyen, J. Nohner, K. Phouthavong, B. Riley, M. W. Rogers, W. W. Taylor, W. Woelmer, S. Youn, and T. D. Beard. 2016. The social, economic, and environmental importance of inland fish and fisheries. Environmental Reviews 24:1–7.
MacQuarrie, P. R., R. Welling, L. Rammont, and G. Pangare. 2013. The 3S River Basin. IUCN, Switzerland.
Matthews, W. J. 1998. Patterns in freshwater fish ecology. Chapman & Hall, Massachusetts, USA.
McCann, K. S., G. Gellner, B. C. McMeans, T. Deenik, G. Holtgrieve, N. Rooney, L. Hannah, M. Cooperman, S. Nam, and H. Giacomini. 2016. Food webs and the sustainability of indiscriminate fisheries. Canadian Journal of Fisheries and Aquatic Sciences 73:1–10.
McLaughlin, R. L., L. Porto, D. L. Noakes, J. R. Baylis, L. M. Carl, H. R. Dodd, J. D. Goldstein, D. B. Hayes, and R. G. Randall. 2006. Effects of low-head barriers on stream fishes: taxonomic affiliations and morphological correlates of sensitive species. Canadian Journal of Fisheries and Aquatic Sciences 63:766–779.
Meile, T., J. L. Boillat, and A. J. Schleiss. 2010. Hydropeaking indicators for characterization of the Upper-Rhone River in Switzerland. Aquatic Sciences 73:171–182.
MFD. 2003. Mekong Fish Database: A taxonomic fish database for the Mekong Basin. Mekong River Commission, Phnom Penh.
Mims, M. C., and J. D. Olden. 2013. Fish assemblages respond to altered flow regimes via ecological filtering of life history strategies. Freshwater Biology 58:50–62.
Mittermeier, R. A., W. R. Turner, F. W. Larsen, T. M. Brooks, and C. Gascon. 2011. Global biodiversity conservation: The critical role of hotspots. Pages 3–22in F. . Zachos and J. . Habel, editors.Biodiversity hotspots: Distribution and protection of conservation priority areas. Springer-Verlag Berlin Heidelberg.
Moyle, P. B., and J. J. Cech. 1988. Fishes: an introduction to ichthyology. Prentice Hall, Upper Saddle River NJ 07458.
MRC. 2005. Overview of the Hydrology of the Mekong Basin. Mekong River Commission, Vientiane.
MRC. 2007. Monitoring Fish Abundance and Diversity in the Lower Mekong Basin: Methodological Guidelines. Mekong River Commission, Phnom Penh.
MRC. 2010. State of the Basin Report 2010. Mekong River Commission, Vientiane, Lao PDR.
MRC. 2011. Planning Atlas of the Lower Mekong River Basin. Mekong River Commission, Phnom Penh.

71
MRCS. 1992. Fisheries in the Lower Mekong Basin, Main Report and Annex. (Review of the fishery sector in the lower Mekong basin). Interim Committee for the Coordination of Investigations of the Lower Mekong Basin, Mekong River Commission Secretariat, Bangkok.
Nagumo, N., T. Sugai, and S. Kubo. 2013. Late Quaternary floodplain development along the Stung Sen River in the Lower Mekong Basin, Cambodia. Geomorphology 198:84–95.
Nagumo, N., T. Sugai, and S. Kubo. 2015. Fluvial Geomorphology and Characteristics of Modern Channel Bars in the Lower Stung Sen River, Cambodia. Geographical Review of Japan Series B 87:115–121.
Ngor, P. B., P. Chheng, and N. So. 2015a. Declines in catches of some large and medium-sized species in Tonle Sap River. Catch and Culture 21:4–7.
Ngor, P. B., G. Grenouillet, S. Phem, N. So, and S. Lek. 2018a. Spatial and temporal variation in fish community structure and diversity in the largest tropical flood-pulse system of Southeast Asia. Ecology of Freshwater Fish In press.
Ngor, P. B., P. Legendre, T. Oberdorff, and S. Lek. 2018b. Flow alterations by dams shaped fish assemblage dynamics in the complex Mekong-3S river system. Ecological Indicators 88:103–114.
Ngor, P. B., P. Starr, P. Chheng, and N. So. 2015b. Rising fish prices in Cambodia. Catch and Culture 21:50.
Nielsen, N. M., R. S. Brown, and Z. D. Deng. 2015. Review of Existing Knowledge on the Effectiveness and Economics of Fish-Friendly Turbines. Mekong River Commission, Phnom Penh.
O’Connor, J. P., D. J. O’Mahony, and J. M. O’Mahony. 2005. Movements of Macquaria ambigua, in the Murray River, south-eastern Australia. Journal of Fish Biology 66:392–403.
Ou, C., C. G. Montaña, and O. Winemiller. 2017. Body size – trophic position relationships among fishes of the lower Mekong basin. Royal Society Open Science 4:160645.
Ou, C., and K. O. Winemiller. 2016. Seasonal Hydrology Shifts Production Sources Supporting Fishes in Rivers of the Lower Mekong Basin. Canadian Journal of Fisheries and Aquatic Sciences 73:1–21.
Pauly, D., V. Christensen, S. Guénette, T. J. Pitcher, U. R. Sumaila, C. J. Walters, R. Watson, and D. Zeller. 2002. Towards sustainability in world fisheries. Nature 418:689–695.
Phomikong, P., M. Fukushima, B. Sricharoendham, S. Nohara, and T. Jutagate. 2014. Diversity and community structure of fishes in the regulated versus unregulated tributaries of the mekong river. River Research and Applications:14 pp.
Piman, T., T. A. Cochrane, M. E. Arias, A. Green, and N. D. Dat. 2013. Assessment of Flow Changes from Hydropower Development and Operations in Sekong, Sesan, and Srepok Rivers of the Mekong Basin. Journal of Water Resources Planning and Management 139:723–732.
Poff, N. L., J. D. Olden, D. M. Merritt, and D. M. Pepin. 2007. Homogenization of regional river dynamics by dams and global biodiversity implications. Proceedings of the National Academy of Sciences of the United States of America 104:5732–5737.
Poulsen, A. F., and J. Albo-Jørgensen. 2000. Fish migrations and spawning habits in the Mekong Mainstream – a survey using local knowledge. Page AMFC Technical Report. Vientiane.
Poulsen, A. F., K. G. Hortle, J. Valbo-Jorgensen, S. Chan, C. K. Chhuon, S. Viravong, K. Bouakhamvongsa, U. Suntornratana, N. Yoorong, N. T.T., and B. Q. Tran. 2004. Distribution and Ecology of Some Important Riverine Fish Species of the Mekong River Basin. Mekong River Commission, Phnom Penh.
Poulsen, A. F., P. Ouch, S. Viravong, U. Suntornratana, and T. T. Nguyen. 2002. Fish Migrations of the Lower Mekong Basin: Implications for Development, Planning and Environmental Management. Mekong River Commission, Phnom Penh.

72
R Core Team. 2017. R: A language and environment for statistical computing. R Foundation for Statistical Computing, Vienna, Austria.
Rainboth, W. J. 1996. Fishes of the Cambodian Mekong. Food and Agriculture Organisation of the United Nations, Rome.
Rainboth, W. J., C. Vidthayanon, and D. Y. Mai. 2012. Fishes of the Greater Mekong Ecosystem with Species List and Photoraphic Atlas. Museum of Zoology, University of Michigan, Ann Arbor.
Ratanakiri Fisheries Office. 2000. A Study of Downstream Impacts of the Yali Falls Dam in the Se San River Basin in Ratanakiri Province, Northeast Cambodia. The Fisheries Office, Ratanakiri Province in cooperation with the Non-Timber Forest Products (NTFP) Project, Ratanakiri Province, Cambodia.
Revenga, C., and Y. Kura. 2003. Status and trends of biodiversity of inland water ecosystems. Montreal.
Roberts, T. R., and I. G. Baird. 1995. Traditional fisheries and fish ecology on the Mekong River at Khone Waterfalls in Southern Laos. Natural History Bulletin of the Siam Society 43:219–26.
Roesch, A., and H. Schmidbauer. 2014. WaveletComp: Computational Wavelet Analysis. R package version 1.0. CRAN.R-project.org.
Röpke, C. P., S. Amadio, J. Zuanon, E. J. G. Ferreira, C. P. de Deus, T. H. S. Pires, and K. O. Winemiller. 2017. Simultaneous abrupt shifts in hydrology and fish assemblage structure in a floodplain lake in the central Amazon. Scientific Reports 7:1–10.
Rossi, J. P. 2011. Rich: An R package to analyse species richness. Diversity 3:112–120.
Rutkow, E., C. Crider, and T. Giannin. 2005. Down River. The consequences of Vietnam’s Se San River dams on life in Cambodia and their meaning in International law. NGO Forum on Cambodia, Phnom Penh.
S. Villéger , N. W. H. Mason, D. M. 2008. New Multidimensional Functional Diversity Indices for a Multifaceted Framework in Functional Ecology. America 89:2290–2301.
Sabo, J. L., A. Ruhi, G. W. Holtgrieve, V. Elliott, M. E. Arias, P. B. Ngor, T. A. Räsänen, and S. Nam. 2017. Designing river flows to improve food security futures in the Lower Mekong Basin. Science 358:1–11.
Schmutz, S., T. H. Bakken, T. Friedrich, T. Greimel, A. Harby, M. Jungwirth, A. Melcher, G. Unfer, and B. Zeiringer. 2015. Response of fish communities to hydrological and morphological alterations in hydropeaking rivers of Austria. River Research and Applications 31:919–930.
Schmutz, S., and C. Mielach. 2015. Review of existing research on fish passage through large dams and its applicability to Mekong mainstream dams. Mekong River Commission, Phnom Penh.
Sharpe, D. M. T., and A. P. Hendry. 2009. Life history change in commercially exploited fish stocks: An analysis of trends across studies. Evolutionary Applications 2:260–275.
Shumway, R. H., and D. S. Stoffer. 2011. Time series analysis and its applications: with R examples. Third Edit. Springer Science+Business Media, New York.
Silvano, R. A. M., D. Benedito, and O. T. Oyakawa. 2000. Spatial and temporal patterns of diversity and distribution of the Upper Juruá River fish community (Brazilian Amazon). Environmental Biology of Fishes 57:25–35.
So, N., S. Phommakone, V. Ly, T. Samphawamana, H. S. Nguyen, M. Khumsri, P. B. Ngor, S. Kong, P. Degen, and P. Starr. 2015. Lower Mekong fisheries estimated to be worth around $ 17 billion a year. Catch and Culture 21:4–7.
Stamatopoulos, C. 2002. Sample-based fishery surveys: a technical handbook. Page FAO. Fisheries Technical Paper. Food and Agriculture Organisation of the United Nations, Rome.
Statzner, B., and B. Higler. 1985. Questions and comments on the River Continuum Concept. Canadian

73
Journal of Fisheries and Aquatic Sciences 42:1038–1044.
Strayer, D. L., and D. Dudgeon. 2010. Freshwater biodiversity conservation: recent progress and future challenges. Journal of the North American Benthological Society 29:344–358.
Sverdrup-Jensen, S. 2002. Fisheries in the Lower Mekong Basin: Status and Perspectives. Mekong River Commission, Phnom Penh.
Szuwalski, C. S., C. C. Matthew G. Burgess, and S. D. Gaines. 2017. High fishery catches through trophic cascades in China. PNAS 114:717–721.
Teichert, N., M. Lepage, A. Sagouis, A. Borja, G. Chust, M. T. Ferreira, S. Pasquaud, R. Schinegger, P. Segurado, and C. Argillier. 2017. Functional redundancy and sensitivity of fish assemblages in European rivers, lakes and estuarine ecosystems. Scientific Reports 7:1–11.
The Ramsar Convention Secretariat. 2014. Ramsar. http://www.ramsar.org/wetland/cambodia.
Thorrold, S. R., C. Latkoczy, P. K. Swart, and C. M. Jones. 2001. Natal Homing in a Marine Fish Metapopulation. Science 291:297–299.
Tonkin, J. D., M. T. Bogan, N. Bonada, B. Ríos-Touma, and D. A. Lytle. 2017. Seasonality and predictability shape temporal species diversity. Ecology 0:1–16.
Tonolla, D., A. Bruder, and S. Schweizer. 2017. Evaluation of mitigation measures to reduce hydropeaking impacts on river ecosystems – a case study from the Swiss Alps. Science of the Total Environment 574:594–604.
Toussaint, A., N. Charpin, S. Brosse, and S. Villéger. 2016. Global functional diversity of freshwater fish is concentrated in the Neotropics while functional vulnerability is widespread. Scientific Reports 6:1–9.
Vaidyanathan, G. 2011. Dam controversy: Remaking the Mekong. Nature 478:305–307.
Valbo-Jørgensen, J., D. Coates, and K. G. Hortle. 2009. Fish diversity in the Lower Mekong Basin. Pages 161 – 196in I. C. Campbell, editor.The Mekong Biophysical Environment of an International River Basin. 1st edition. Elsevier Inc., Amsterdam.
Valbo-Jorgensen, J., and A. F. Poulsen. 2000. Using local knowledge as a research tool in the study of river fish biology: Experiences from the Mekong. Environment, Development and Sustainability 2:253–276.
Vannote, R. L., G. W. Minshall, K. W. Cummins, J. R. Sedell, and C. E. Cushing. 1980. The River Continuum Concept. Canadian Journal of Fisheries and Aquatic Sciences 37:130–137.
Vitule, J. R. S., A. A. Agostinho, V. M. Azevedo-Santos, V. S. Daga, W. R. T. Darwall, D. B. Fitzgerald, F. A. Frehse, D. J. Hoeinghaus, D. P. Lima-Junior, A. L. B. Magalhães, M. L. Orsi, A. A. Padial, F. M. Pelicice, M. J. Petrere, P. S. Pompeu, and K. O. Winemiller. 2017. We need better understanding about functional diversity and vulnerability of tropical freshwater fishes. Biodiversity Conservation 26:757–762.
Watson, R., and D. Pauly. 2001. Systematic distortions in world fisheries catch trends. Nature 414:534–536.
Welcome, R. L. 2001. Inland fisheries: ecology and management. 1st edition. Food and Agriculture Organization of the United Nations by Blackwell Science, Great Britain.
Welcomme, R. L., I. G. Baird, D. Dudgeon, A. and Halls, and D. Lamberts. 2016. Fisheries of the rivers of Southeast Asia. Pages 363–376in J. F. Craig, editor.Freshwater Fisheries Ecology. First edit. John Wiley & Sons, Ltd., UK.
Welcomme, R. L., I. G. Cowx, D. Coates, C. Béné, S. Funge-Smith, A. Halls, and K. Lorenzen. 2010. Inland capture fisheries. Philosophical transactions of the Royal Society of London. Series B, Biological sciences 365:2881–96.

74
Winemiller, K., P. McIntyre, L. Castello, E. Fluet-Chouinard, T. Giarrizzo, N. So, I. Baird, W. Darwall, N. Lujan, I. Harrison, M. Stiassny, R. Silvano, D. Fitzgerald, F. Pelicice, A. Agostinho, L. Gomes, J. Albert, E. Baran, M. Petrere, C. Zarfl, M. Mulligan, J. Sullivan, C. Arantes, L. Sousa, A. Koning, D. Hoeinghaus, M. Sabaj, J. Lundberg, J. Armbruster, M. Thieme, P. Petry, J. Zuanon, G. Vilara, J. Snoeks, C. Ou, W. Rainboth, C. Pavanelli, A. Akama, A. van Soesbergen, and L. Saenz. 2016. Balancing hydropower and biodiversity in the Amazon, Congo, and Mekong. Science 351:128–129.
World Bank Group. 2015. Population, total. Cambodia. http://data.worldbank.org/indicator/SP.POP.TOTL?locations=KH.
Young, P. S., J. J. Cech, and L. C. Thompson. 2011. Hydropower-related pulsed-flow impacts on stream fishes: A brief review, conceptual model, knowledge gaps, and research needs. Reviews in Fish Biology and Fisheries 21:713–731.
van Zalinge, N. P., T. Nao, and S. Nuov. 2000. Status of the Cambodian inland capture fisheries sector with special reference to the Tonle Sap Great Lake. Mekong River Commission/Department of Fisheries/Danida, Phnom Penh, Cambodia.
van Zalinge, N., L. Deap, P. B. Ngor, J. Sarkula, and J. Koponen. 2003. Mekong flood levels and Tonle Sap fish catches. Page 13pp. Second International Symposium on the Management of Large Rivers for Fisheries. Second International Symposium on the Management of Large Rivers for Fisheries, Phnom Penh.
van Zalinge, N., P. Degen, C. Pongsri, S. Nuov, J. G. Jensen, V. H. Nguyen, and X. Choulamany. 2004. The Mekong River System. Pages 335–357in R. Welcomme and T. Petr, editors.Proceedings of the second international symposium on the management of large rivers for fisheries. FAO Regional Office for Asia and the Pacific, Bangkok.
van Zalinge, N., and T. Nao. 1999. Summary of Project Findings: Present status of Cambodia’s freshwater capture fisheries and management implications. Pages 1–20in N. P. van Zalinge, T. Nao, and L. Deap, editors.Present status of Cambodia’s fisheries and management implications. Mekong River Commission and Department of Fisheries, Phnom Penh.
van Zalinge, N., T. Nao, and S. T. Touch. 1998. Where there is water, there is fish? Fisheries issues in the Lower Mekong Basin from a Cambodian perspective. Page 14Contribution to the Mekong Panel at the Seventh Common Property Conference of the International Association for the Study of Common Property, Vancouver, Canada, 10 - 14 June 1998. International Association for the Study of Common Property, Vancouver, Canada.
Ziv, G., E. Baran, N. So, I. Rodriguez-Iturbe, and S. A. Levin. 2012. Trading-off fish biodiversity, food security, and hydropower in the Mekong River Basin. Proceedings of the National Academy of Sciences 109:5609–5614.

75
Annexes
Annex 1. List of indicator species in each cluster in the Lower Mekong River. Given are the values of indicator species (IndVal) for each cluster with their associated significance levels (Sign. level) (***, p<0.01; ** p<0.01; *, p<0.05). Indicator species were identified using mean annual fish composition, as well as composition computed during dry and wet seasons separately.
Assemblage Ia : 11 species Annual Dry Wet
Scientific names Code IndVal Sign. level
IndVal Sign. level
IndVal Sign. level
Cosmochilus harmandi coha 0.922 *** - - 0.905 ***
Bangana behri babe 0.885 *** 0.752 ** 0.845 **
Helicophagus waandersii hewa 0.877 *** - - 0.839 *
Labeo chrysophekadion moch 0.86 *** 0.826 *** 0.899 ***
Bagarius yarelli baya 0.854 *** 0.92 *** 0.769 **
Mekongina erythrospila meer 0.844 ** 0.814 * 0.747 **
Labeo erythropterus laer 0.788 ** 0.783 * - -
Phalacronotus apogon phap 0.787 ** 0.818 *** -
Pangasius conchophilus paco 0.769 * - - 0.785 **
Tenualosa thibaudeaui teth 0.767 * 0.79 * - -
Syncrossus helodes syhe 0.748 * - - 0.673 *
Assemblage Ib: 17 species
Henicorhynchus spp. hecr 0.933 *** 0.859 ** 0.945 ***
Thynnichthys thynnoides thth 0.865 ** - - 0.859 **
Wallago attu waat 0.849 ** 0.891 ** 0.785 **
Belodontichthys dinema bedi 0.843 ** 0.961 *** 0.804 **
Puntioplites falcifer pufa 0.838 ** 0.955 *** 0.84 **
Micronema bleekeri mibl 0.828 *** 0.844 *** 0.817 **
Labiobarbus lineata lali 0.817 ** 0.909 ** 0.744 *
Osteochilus melanopleura osme 0.813 ** 0.927 *** 0.75 **
Gyrinocheilus pennocki gype 0.802 * 0.873 ** 0.642 *
Cyclocheilichthys furcatus cyfu 0.798 ** 0.912 *** 0.804 **
Pangasianodon hypophthalmus pahy 0.78 * 0.863 ** 0.708 *
Hemibagrus nemurus hene 0.768 *** 0.669 * 0.787 ***
Paralaubuca typus paty 0.768 * - - 0.784 *
Hemibagrus wyckioides hewyd 0.736 * 0.775 * - -
Leptobarbus hoevenii leho 0.728 * - - - -
Brachirus harmandi brha 0.686 * 0.784 * - -
Bagrichthys macropterus bama 0.64 * 0.679 * - -
Assemblage IIa: 21 species
Macrognathus siamensis masi 1 *** 0.997 *** 0.816 ***
Acanthopsis sp. acsp 0.995 *** 0.861 ** 0.816 **
Puntioplites proctozysron pupr1 0.954 *** 0.948 *** 0.951 ***
Mastacembelus armatus maar 0.954 *** 0.95 *** 0.643 *
Cynoglossus microlepis cymi 0.894 ** 0.909 ** 0.927 ***
Hampala macrolepidota hama 0.889 *** 0.721 * 0.811 **

76
Plotosus canius plca 0.877 ** 0.713 * 0.869 **
Mystus singaringan mysi 0.854 ** 0.908 ** 0.718 *
Mystus mysticetus mymy 0.843 *** 0.735 * 0.755 **
Osteochilus vittatus osvi 0.822 ** - - 0.794 **
Notopterus notopterus nono 0.825 ** 0.861 ** - -
Cyclocheilichthys armatus cyar 0.806 ** 0.809 ** - -
Glossogobius giuris glgi 0.787 *** 0.863 *** 0.652 *
Brachirus orientalis bror 0.787 ** 0.855 ** 0.728 **
Boesemania microlepis bomi 0.775 * - - - -
Oxyeleotris marmorata oxma 0.748 ** 0.862 ** - -
Bagrichthys obscurus baob 0.707 ** 0.707 ** - -
Hypsibarbus vernayi hyve 0.707 ** 0.707 ** - -
Pseudomystus siamensis pssi 0.707 ** - - 0.577 *
Puntioplites sp. pupr2 0.707 ** 0.707 ** - -
Akisis sp. aksp 0.693 * 0.686 * - -
Assemblage IIb: 31 species
Clupeichthys aesarnensis clae 0.954 *** 0.946 *** 0.987 ***
Rasbora trilineata ratr 0.927 *** 0.926 ** 0.977 ***
Trichogaster trichopterus trtr 0.821 ** - - 0.766 **
Rasbora sp. rasp 0.8 ** 0.849 ** - -
Scomberomorus sinensis scsp 0.755 *** 0.756 ** - -
Toxotes chatareus toch 0.755 ** 0.756 *** 0.775 ***
Toxotes spp. tosp 0.755 ** 0.756 *** - -
Arius stormi arst 0.753 * 0.681 * - -
Liza spp. lisp 0.751 ** 0.752 ** 0.629 *
Parambassis wolffi pabwo 0.725 * 0.749 * - -
Anabas testudineus ante 0.7 * 0.782 * - -
Hemisilurus mekongensis heme 0.686 * 0.789 ** - -
Polynemus dubius podu 0.681 * 0.69 * 0.727 **
Lates calcarifer laca 0.674 * 0.827 ** - -
Eleutheronema tetradactylum elte 0.656 * 0.655 * - -
Pangasius juvernile paju 0.656 * 0.535 * 0.775 ***
Scatophagus argus scar 0.656 * 0.655 * - -
Zenarchopterus ectuntio zesp 0.656 * 0.655 * - -
Ellochelon vaigiensis liva 0.656 * 0.534 * - -
Coilia magrognathos cosp2 0.636 * - - 0.624 *
Pseudapocryptes elongatus psel 0.631 * 0.596 * - -
Acentrogobius sp. acens 0.539 * - - 0.632 *
Allenbatrachus grunniens algr 0.539 * 0.535 * - -
Arius spp. arsp 0.539 * 0.535 * - -
Arius thallassinus arth 0.539 * 0.535 * - -
Boleophthalmus boddarti bobo 0.539 * - - - -
Butis butis bubu 0.539 * 0.535 * - -
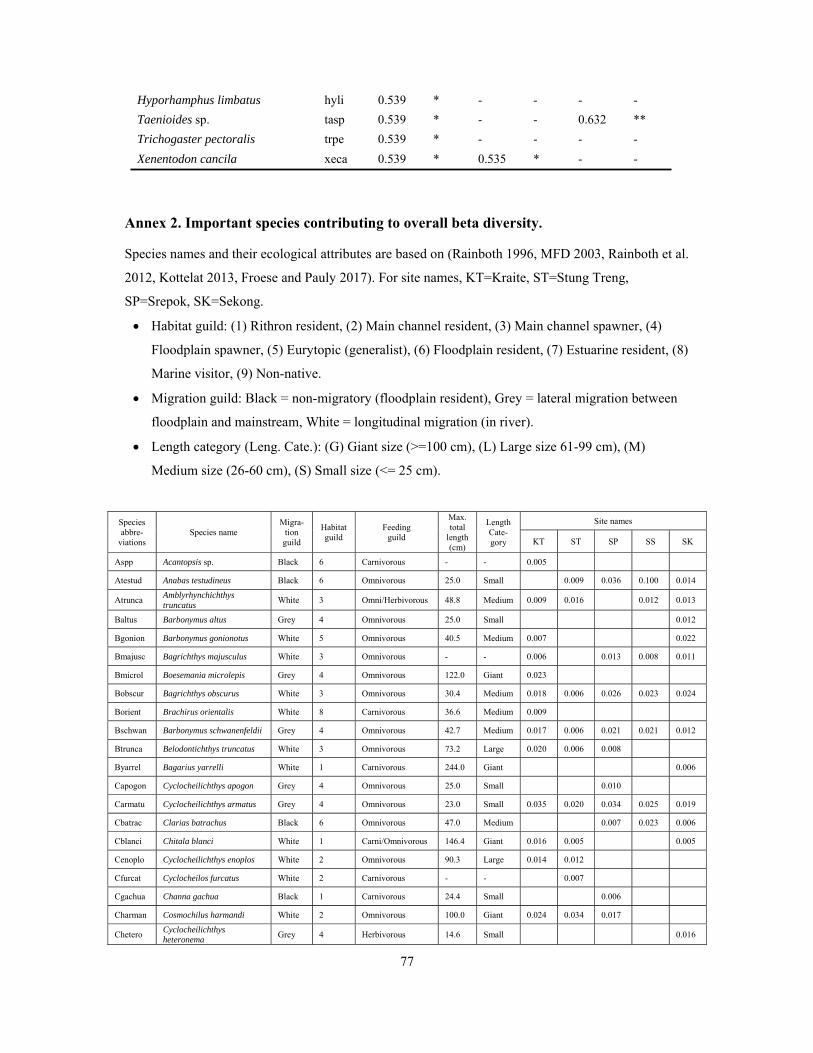
77
Hyporhamphus limbatus hyli 0.539 * - - - -
Taenioides sp. tasp 0.539 * - - 0.632 **
Trichogaster pectoralis trpe 0.539 * - - - -
Xenentodon cancila xeca 0.539 * 0.535 * - -
Annex 2. Important species contributing to overall beta diversity. Species names and their ecological attributes are based on (Rainboth 1996, MFD 2003, Rainboth et al.
2012, Kottelat 2013, Froese and Pauly 2017). For site names, KT=Kraite, ST=Stung Treng,
SP=Srepok, SK=Sekong.
Habitat guild: (1) Rithron resident, (2) Main channel resident, (3) Main channel spawner, (4)
Floodplain spawner, (5) Eurytopic (generalist), (6) Floodplain resident, (7) Estuarine resident, (8)
Marine visitor, (9) Non-native.
Migration guild: Black = non-migratory (floodplain resident), Grey = lateral migration between
floodplain and mainstream, White = longitudinal migration (in river).
Length category (Leng. Cate.): (G) Giant size (>=100 cm), (L) Large size 61-99 cm), (M)
Medium size (26-60 cm), (S) Small size (<= 25 cm).
Species abbre-
viations Species name
Migra- tion
guild
Habitat guild
Feeding guild
Max. total
length (cm)
Length Cate- gory
Site names
KT ST SP SS SK
Aspp Acantopsis sp. Black 6 Carnivorous - - 0.005
Atestud Anabas testudineus Black 6 Omnivorous 25.0 Small 0.009 0.036 0.100 0.014
Atrunca Amblyrhynchichthys truncatus
White 3 Omni/Herbivorous 48.8 Medium 0.009 0.016 0.012 0.013
Baltus Barbonymus altus Grey 4 Omnivorous 25.0 Small 0.012
Bgonion Barbonymus gonionotus White 5 Omnivorous 40.5 Medium 0.007 0.022
Bmajusc Bagrichthys majusculus White 3 Omnivorous - - 0.006 0.013 0.008 0.011
Bmicrol Boesemania microlepis Grey 4 Omnivorous 122.0 Giant 0.023
Bobscur Bagrichthys obscurus White 3 Omnivorous 30.4 Medium 0.018 0.006 0.026 0.023 0.024
Borient Brachirus orientalis White 8 Carnivorous 36.6 Medium 0.009
Bschwan Barbonymus schwanenfeldii Grey 4 Omnivorous 42.7 Medium 0.017 0.006 0.021 0.021 0.012
Btrunca Belodontichthys truncatus White 3 Omnivorous 73.2 Large 0.020 0.006 0.008
Byarrel Bagarius yarrelli White 1 Carnivorous 244.0 Giant 0.006
Capogon Cyclocheilichthys apogon Grey 4 Omnivorous 25.0 Small 0.010
Carmatu Cyclocheilichthys armatus Grey 4 Omnivorous 23.0 Small 0.035 0.020 0.034 0.025 0.019
Cbatrac Clarias batrachus Black 6 Omnivorous 47.0 Medium 0.007 0.023 0.006
Cblanci Chitala blanci White 1 Carni/Omnivorous 146.4 Giant 0.016 0.005 0.005
Cenoplo Cyclocheilichthys enoplos White 2 Omnivorous 90.3 Large 0.014 0.012
Cfurcat Cyclocheilos furcatus White 2 Carnivorous - - 0.007
Cgachua Channa gachua Black 1 Carnivorous 24.4 Small 0.006
Charman Cosmochilus harmandi White 2 Omnivorous 100.0 Giant 0.024 0.034 0.017
Chetero Cyclocheilichthys heteronema
Grey 4 Herbivorous 14.6 Small 0.016

78
Cjullie Cirrhinus jullieni White 3 Omnivorous 24.4 Small 0.009
Clagler Cyclocheilichthys lagleri Grey 4 Omnivorous 18.3 Small 0.007 0.011 0.008
Clopis Chitala lopis White 3 Piscivorous 183.0 Giant 0.010
Cmacroc Clarias macrocephalus Black 6 Carnivorous 120.0 Giant 0.010 0.017 0.005
Cmaruli Channa marulioides Black 6 Carnivorous 27.0 Medium 0.007
Cmelade Clarias meladerma Black 6 Carnivorous 42.7 Medium 0.009
Cmicrol Cirrhinus microlepis White 3 Omnivorous 79.3 Large 0.008
Cmicrop Channa micropeltes Black 6 Carnivorous 158.6 Giant 0.005
Cmolito Cirrhinus molitorella White 3 Herbivorous 55.0 Medium 0.010
Crepass Cyclocheilichthys repasson Grey 4 Omnivorous 32.2 Medium 0.021 0.041 0.008
Csinens Clupisoma sinense White 3 Omnivorous 37.8 Medium 0.013 0.020
Cstriat Channa striata Black 6 Carnivorous 122.0 Giant 0.012 0.008 0.027 0.013 0.012
Dundeci Datnioides undecimradiatus White 3 Carnivorous 48.8 Medium 0.008 0.009
Gpennoc Gyrinocheilus pennocki White 3 Herbivorous 34.2 Medium 0.020
Hdispar Hampala dispar White 5 Carnivorous 42.7 Medium 0.013 0.009 0.018
Hfilame Hemibagrus filamentus White 3 Omni/carnivorous 50.0 Medium 0.007 0.007 0.012 0.028
Hlagler Hypsibarbus lagleri White 3 Omnivorous 48.8 Medium 0.007 0.052 0.021 0.034 0.028
Hlobatu Henicorhynchus lobatus White 5 Herbivorous 18.3 Small 0.050 0.202 0.090 0.022
Hmacrol Hampala macrolepidota White 5 Omnivorous 80.5 Large 0.006
Hmalcol Hypsibarbus malcolmi White 3 Omnivorous 61.0 Large 0.026 0.030 0.068 0.032 0.010
Hmekong Hemisilurus mekongensis White 3 Omni/carnivorous 80.0 Large 0.007 0.028 0.012
Hpierre Hypsibarbus pierrei White 3 Omnivorous 36.6 Medium 0.007 0.036 0.010 0.032 0.033
Hsiamen Henicorhynchus siamensis White 5 Herbivorous 24.4 Small 0.015 0.023 0.017 0.034 0.016
Hspilop Hemibagrus spilopterus White 3 Carnivorous 37.7 Medium 0.021 0.025 0.021 0.012 0.030
Hstormi Hemiarius stormii White 7 Omnivorous 50.0 Medium 0.006
Hsuvatt Hypsibarbus suvattii White 3 Omnivorous 42.7 Medium 0.006 0.016 0.014
Hwaande Helicophagus waandersii White 3 Molluscivorous 70.0 Large 0.027 0.017 0.066 0.007
Hwetmor Hypsibarbus wetmorei White 3 Omnivorous 25.0 Small 0.007 0.012 0.011 0.023
Hwyckii Hemibagrus wyckii White 3 Carnivorous 86.6 Large 0.006
Hwyckio Hemibagrus wyckioides White 3 Carnivorous 130.0 Giant 0.010 0.006 0.007
Kcrypto Kryptopterus cryptopterus White 3 Carni/Omnivorous 16.8 Small 0.006
Lbleeke Luciosoma bleekeri White 3 Carni/Omnivorous 30.5 Medium 0.011 0.005
Lchryso Labeo chrysophekadion White 3 Herbi/Omnivorous 90.0 Large 0.033 0.027 0.014 0.006
Lcrocod Lycothrissa crocodilus White 7 Carnivorous 36.6 Medium 0.005 0.021 0.007
Ldyoche Labeo dyocheilus White 9 Herbivorous 90.0 Large 0.011
Llongib Laides longibarbis White 3 Omnivorous 17.3 Small 0.007 0.014
Lsiamen Labiobarbus siamensis White 5 Omnivorous 22.0 Small 0.015 0.018 0.023 0.027 0.050
Malboli Mystus albolineatus Grey 4 Omnivorous 42.7 Medium 0.005
Marmatu Mastacembelus armatus White 5 Omnivorous 35.5 Medium 0.010
Mbocour Mystus bocourti Grey 4 Carnivorous 29.3 Medium 0.009 0.011
Mchevey Micronema cheveyi White 3 Carnivorous 35.0 Medium 0.017 0.012 0.025
Merythr.1
Mekongina erythrospila White 1 Herbivorous 54.9 Medium 0.007 0.005
Mmystic Mystus mysticetus Grey 4 Carnivorous 15.9 Small 0.005
Nnotopt Notopterus notopterus Grey 5 Omnivorous 73.2 Large 0.009 0.006 0.007 0.013
Obimacu Ompok bimaculatus Grey 4 Carnivorous 51.8 Medium 0.006 0.010
Oexodon Osphronemus exodon Black 1 Omnivorous 73.2 Large 0.023

79
Ogoramy Osphronemus goramy Black 1 Omnivorous 85.4 Large 0.010 0.007 0.009
Omarmor Oxyeleotris marmorata White 5 Carnivorous 79.3 Large 0.009
Omelano Osteochilus melanopleurus White 3 Herbivorous 73.2 Large 0.007
Omicroc Osteochilus microcephalus White 5 Herbivorous 29.3 Medium 0.006
Oniloti Oreochromis niloticus White 9 Herbivorous 73.2 Large 0.008
Ovittat Osteochilus vittatus White 5 Herbi/omnivorous 39.0 Medium 0.013 0.025 0.030
Papogon.1
Phalacronotus apogon White 3 Carnivorous 158.6 Giant 0.007 0.008 0.008 0.020
Pbarron Paralaubuca barroni Grey 4 Omnivorous 18.3 Small 0.021 0.051
Pbleeke Phalacronotus bleekeri White 3 Omni/carnivorous 73.2 Large 0.016 0.017 0.067 0.018 0.014
Pbulu Puntioplites bulu White 3 Herbi/Omnivorous 35.0 Medium 0.033
Pconcho Pangasius conchophilus White 2 Omnivorous 146.4 Giant 0.005 0.020 0.028
Pdubius Polynemus dubius White 7 Carnivorous 24.4 Small 0.006
Pfalcif Puntioplites falcifer White 3 Omnivorous 38.3 Medium 0.058 0.049 0.030 0.036 0.031
Pfascia Pristolepis fasciata Black 4 Omnivorous 20.0 Small 0.029 0.006 0.013 0.011
Pjullie Probarbus jullieni White 2 Omnivorous 183.0 Giant 0.009
Plabeam Probarbus labeamajor White 2 Omnivorous 183.0 Giant 0.005
Plabeam.1
Probarbus labeaminor White 2 Omnivorous 150.0 Giant 0.006
Pmacron Pangasius macronema White 3 Omnivorous 36.6 Medium 0.014 0.027 0.020
Pmicron.1
Pseudolais micronemus White 3 Omnivorous 42.7 Medium 0.006
Ppleuro Pseudolais pleurotaenia White 3 Omnivorous 42.7 Medium 0.006 0.025
Pprocto Puntioplites proctozysron White 3 Omnivorous 30.0 Medium 0.023 0.007 0.015
Privero Paralaubuca riveroi Grey 4 Carnivorous 22.0 Small 0.017 0.023
Psiamen.2
Pseudomystus siamensis White 3 Omnivorous 18.3 Small 0.006 0.015 0.017
Ptypus Paralaubuca typus White 2 Omnivorous 22.0 Small 0.009 0.009
Pwolffi Parambassis wolffii Grey 4 Carnivorous 24.4 Small 0.036
Rhobelm Rasbora hobelmani Grey 4 Insectivorous 7.3 Small 0.010
Rtornie Rasbora tornieri Grey 4 Insectivorous 20.7 Small 0.018
Srubrip Systomus rubripinnis White 5 Omnivorous 30.5 Medium 0.012 0.042 0.016
Sstejne Scaphognathops stejnegeri White 3 Omnivorous 30.5 Medium 0.018 0.010 0.033 0.052 0.021


80
PART II: PUBPLICATIONS


81
ARTICLE 1
Large-scale patterns of fish diversity and assemblage structure in the longest tropical river in Asia
Ratha Chea, Sovan Lek, Peng Bun Ngor, Gaël Grenouillet 2016
Ecology of Freshwater Fish, 2016, 1–11


Ecology of Freshwater Fish 2016; 1–11 wileyonlinelibrary.com/journal/eff | 1© 2016 John Wiley & Sons A/S. Published by John Wiley & Sons Ltd
Accepted: 8 July 2016
DOI:10.1111/eff.12301
AbstractAlthoughtheMekongRiverisoneoftheworld’s35biodiversityhotspots,thelarge-scalepatternsoffishdiversityandassemblagestructureremainpoorlyaddressed.Thisstudyaimedto investigatethefishdistributionpatterns intheLowerMekongRiver(LMR)andtoidentifytheirenvironmentaldeterminants.Dailyfishcatchdata(i.e.fromDecember2000toNovember2001)at38sitesdistributedalongtheLMRwererelatedto 15 physicochemical and19 climatic variables.As a result, four different clustersweredefinedaccordingtothesimilarityinassemblagecompositionand80indicatorspecieswereidentified.WhilefishspeciesrichnesswashighestintheMekongdeltaandlowestintheupperpartoftheLMR,thediversityindexwashighestinthemiddlepartoftheLMRandlowestinthedelta.Wefoundthatfishassemblageschangedalongtheenvironmentalgradientsandthatthemaindriversaffectingthefishassemblagestructureweretheseasonalvariationoftemperature,precipitation,dissolvedoxygen,pHand totalphosphorus.Specifically, upstreamassemblageswerecharacterisedbycyprinids and Pangasiuscatfish,wellsuitedtolowtemperature,highdissolvedoxygenandhighpH.Fishassemblagesinthedeltaweredominatedbyperch-likefishandclu-peids,moretolerant tohightemperatures,andhigh levelsofnutrients (nitratesandtotalphosphorus)andsalinity.Overall,thepatternswereconsistentbetweenseasons.OurstudycontributestoestablishingthefirstholisticfishcommunitystudyintheLMR.
K E Y W O R D S
distributionpatterns,environmentalgradient,fishassemblage,fishery,LowerMekongRiver
1UniversitédeToulouse,LaboEvolution&DiversitéBiologique,UMR5174EDBCNRS-UniversitéPaulSabatier-ENFA,Toulouse,France2Faculty of Agriculture and Food Processing,UniversityofBattambang,BattambangCity,Cambodia3FisheriesProgram,MekongRiverCommission,PhnomPenh,Cambodia4InstitutUniversitairedeFrance,Paris,France
CorrespondenceR.Chea,UniversitédeToulouse,LaboEvolution&DiversitéBiologique,UMR5174EDBCNRS-UniversitéPaulSabatier-ENFA,Toulouse,France.Email:[email protected]
O R I G I N A L A R T I C L E
Large-scalepatternsoffishdiversityandassemblagestructureinthelongesttropicalriverinAsia
RathaChea1,2 | SovanLek1,2 | PengbunNgor3 | GaëlGrenouillet1,4
1 | INTRODUCTION
Largetropicalriversrepresentecosystemsofhistoricallyimmenseval-ueforhumanity,bothintermsofthehighbiodiversitytheysupportand of the number of people whose livelihoods depend directly upon thatbiodiversity(Coates,2001).MekongRiver,thelargesttropicalriv-er inAsia, is knownasoneof theworld’s35biodiversityhot spots(Mittermeier,Turner,Larsen,Brooks,&Gascon,2011).Itisabiologi-callydiverseandhighlyproductiveecosystem,ranked3rdintermsoffishdiversity (877species,Ziv,Baran,So,Rodriguez-Iturbe,&Levin,2012), just after theAmazon River Basin (3,000 species, Rainboth,1996)andtheCongoRiverBasin(991species,Froese&Pauly,2015);yet,onaperunitareabasisandfishfamilydiversityMekongisindeed
therichest.Annually,Mekongharvests2.3milliontonnesofwildfishsupporting theworld’s largest inlandfisheryandprovidingessentiallivelihoods,nutritionand foodsecurity formillionsofpeoplewithinthe region (MRC 2015). The economic values of fisheries in LowerMekongalonewereestimatedtobewortharound17billionUSDayeargeneratingemploymentsandconstitutingasafetynetformorethan60millionpeoplewithintheregion,especially thepoorhouse-holdsinruralcommunities(MRC2015).Moreimportantly,incombina-tionwithitssocio-economicvalues,theMekongRiverBasinaccountsforhigh levelsofendemism,forexampleamongtheknownspecies,219areendemictothebasin(76%arecyprinidsand12%catfishes;Dudgeon, 2011).However, compared to other riverine ecosystems,thatistemperate,neotropicalandsubtropical,stillverylittleefforthas
82
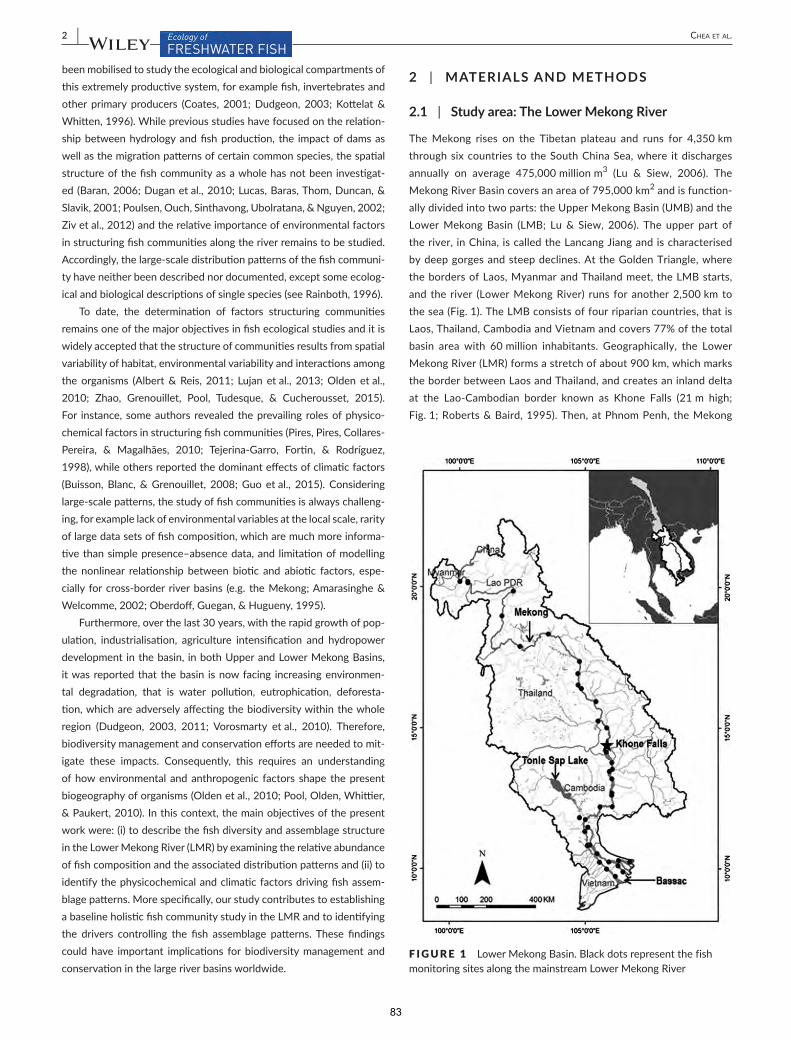
2 | Chea et al.
been mobilised to study the ecological and biological compartments of thisextremelyproductivesystem,forexamplefish,invertebratesandother primary producers (Coates, 2001;Dudgeon, 2003;Kottelat&Whitten,1996).Whilepreviousstudieshavefocusedontherelation-shipbetweenhydrologyandfishproduction, the impactofdamsaswellasthemigrationpatternsofcertaincommonspecies,thespatialstructureofthefishcommunityasawholehasnotbeeninvestigat-ed(Baran,2006;Duganetal.,2010;Lucas,Baras,Thom,Duncan,&Slavik,2001;Poulsen,Ouch,Sinthavong,Ubolratana,&Nguyen,2002;Zivetal.,2012)andtherelativeimportanceofenvironmentalfactorsinstructuringfishcommunitiesalongtheriverremainstobestudied.Accordingly,thelarge-scaledistributionpatternsofthefishcommuni-tyhaveneitherbeendescribednordocumented,exceptsomeecolog-icalandbiologicaldescriptionsofsinglespecies(seeRainboth,1996).
To date, the determination of factors structuring communitiesremainsoneofthemajorobjectivesinfishecologicalstudiesanditiswidelyacceptedthatthestructureofcommunitiesresultsfromspatialvariabilityofhabitat,environmentalvariabilityandinteractionsamongtheorganisms (Albert&Reis, 2011; Lujan etal., 2013;Oldenetal.,2010; Zhao, Grenouillet, Pool, Tudesque, & Cucherousset, 2015).For instance, someauthors revealed theprevailing rolesofphysico-chemicalfactorsinstructuringfishcommunities(Pires,Pires,Collares-Pereira, & Magalhães, 2010; Tejerina-Garro, Fortin, & Rodríguez,1998),whileothersreportedthedominanteffectsofclimaticfactors(Buisson,Blanc,&Grenouillet, 2008;Guo etal., 2015). Consideringlarge-scalepatterns,thestudyoffishcommunitiesisalwayschalleng-ing,forexamplelackofenvironmentalvariablesatthelocalscale,rarityoflargedatasetsoffishcomposition,whicharemuchmoreinforma-tivethansimplepresence–absencedata,and limitationofmodellingthe nonlinear relationship betweenbiotic and abiotic factors, espe-cially forcross-border riverbasins (e.g. theMekong;Amarasinghe&Welcomme,2002;Oberdoff,Guegan,&Hugueny,1995).
Furthermore,overthelast30years,withtherapidgrowthofpop-ulation, industrialisation, agriculture intensification and hydropowerdevelopmentinthebasin, inbothUpperandLowerMekongBasins,it was reported that the basin is now facing increasing environmen-tal degradation, that is water pollution, eutrophication, deforesta-tion,whichareadverselyaffectingthebiodiversitywithinthewholeregion (Dudgeon, 2003, 2011; Vorosmarty etal., 2010). Therefore,biodiversitymanagementandconservationeffortsareneededtomit-igate these impacts. Consequently, this requires an understandingof how environmental and anthropogenic factors shape the present biogeographyoforganisms(Oldenetal.,2010;Pool,Olden,Whittier,&Paukert,2010).Inthiscontext,themainobjectivesofthepresentworkwere:(i)todescribethefishdiversityandassemblagestructureintheLowerMekongRiver(LMR)byexaminingtherelativeabundanceoffishcompositionandtheassociateddistributionpatternsand(ii)toidentifythephysicochemicalandclimaticfactorsdrivingfishassem-blagepatterns.Morespecifically,ourstudycontributestoestablishingabaselineholisticfishcommunitystudyintheLMRandtoidentifyingthe drivers controlling the fish assemblage patterns.These findingscouldhave important implications for biodiversitymanagement andconservationinthelargeriverbasinsworldwide.
2 | MATERIALSANDMETHODS
2.1 | Studyarea:TheLowerMekongRiver
TheMekong rises on the Tibetan plateau and runs for 4,350kmthroughsixcountries to theSouthChinaSea,where itdischargesannually on average 475,000millionm3 (Lu & Siew, 2006). TheMekongRiverBasincoversanareaof795,000km2andisfunction-allydividedintotwoparts:theUpperMekongBasin(UMB)andtheLowerMekongBasin (LMB; Lu& Siew, 2006). The upper part oftheriver,inChina,iscalledtheLancangJiangandischaracterisedbydeepgorgesandsteepdeclines.AttheGoldenTriangle,wherethebordersofLaos,MyanmarandThailandmeet,theLMBstarts,and the river (LowerMekongRiver) runs foranother2,500kmtothesea(Fig.1).TheLMBconsistsoffourripariancountries,thatisLaos,Thailand,CambodiaandVietnamandcovers77%ofthetotalbasin area with 60million inhabitants. Geographically, the LowerMekongRiver(LMR)formsastretchofabout900km,whichmarkstheborderbetweenLaosandThailand,andcreatesaninlanddeltaat the Lao-Cambodian border known as Khone Falls (21m high;Fig.1;Roberts&Baird,1995).Then,atPhnomPenh,theMekong
F IGURE 1 LowerMekongBasin.BlackdotsrepresentthefishmonitoringsitesalongthemainstreamLowerMekongRiver
83
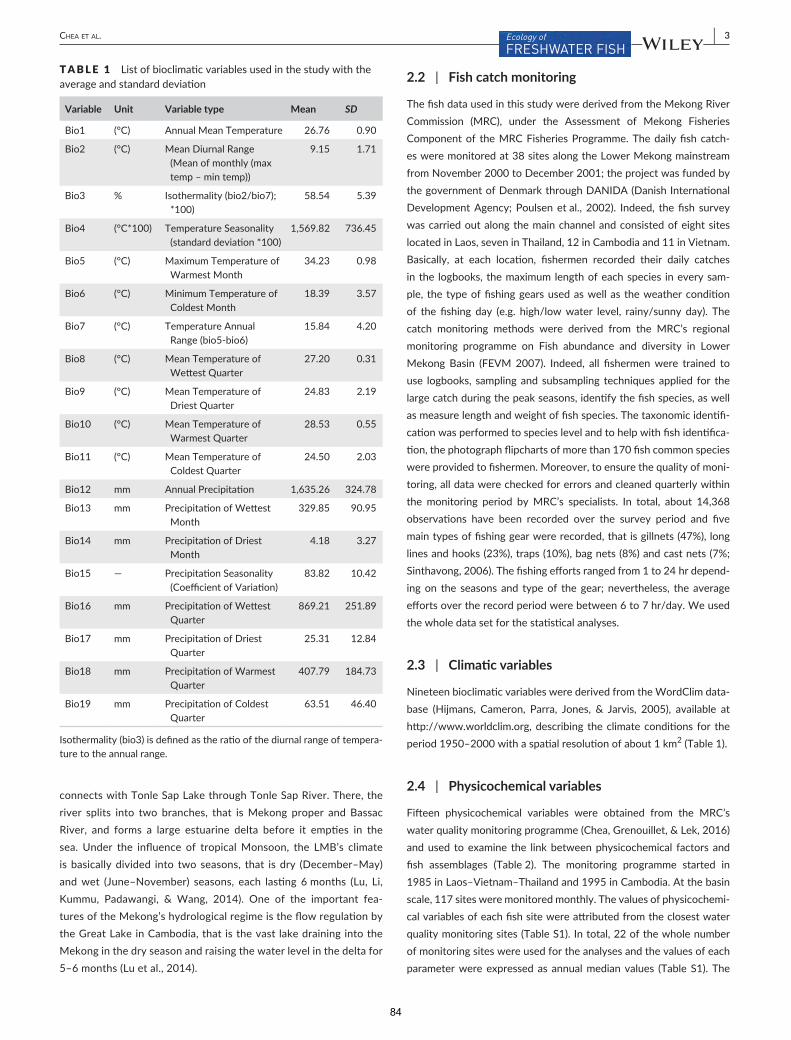
| 3Chea et al.
connectswithTonleSapLakethroughTonleSapRiver.There,theriver splits into two branches, that isMekong proper and BassacRiver, and forms a large estuarine delta before it empties in thesea. Under the influence of tropicalMonsoon, the LMB’s climateisbasicallydivided into twoseasons, that isdry (December–May)andwet (June–November) seasons, each lasting 6months (Lu, Li,Kummu, Padawangi, & Wang, 2014). One of the important fea-turesoftheMekong’shydrologicalregimeistheflowregulationbytheGreatLakeinCambodia,thatisthevastlakedrainingintotheMekong in the dry season and raising the water level in the delta for 5–6months(Luetal.,2014).
2.2 | Fishcatchmonitoring
ThefishdatausedinthisstudywerederivedfromtheMekongRiverCommission (MRC), under the Assessment of Mekong FisheriesComponentof theMRCFisheriesProgramme.Thedailyfishcatch-esweremonitoredat38sitesalongtheLowerMekongmainstreamfrom November 2000 to December 2001; the project was funded by thegovernmentofDenmarkthroughDANIDA(DanishInternationalDevelopmentAgency;Poulsenetal., 2002). Indeed, thefish surveywas carried out along the main channel and consisted of eight sites locatedinLaos,seveninThailand,12inCambodiaand11inVietnam.Basically, at each location, fishermen recorded their daily catchesinthe logbooks, themaximumlengthofeachspecies ineverysam-ple, thetypeoffishinggearsusedaswellas theweatherconditionof the fishing day (e.g. high/lowwater level, rainy/sunny day). Thecatch monitoring methods were derived from the MRC’s regionalmonitoring programme on Fish abundance and diversity in LowerMekong Basin (FEVM2007). Indeed, all fishermenwere trained touse logbooks, samplingand subsampling techniquesapplied for thelargecatchduringthepeakseasons,identifythefishspecies,aswellasmeasurelengthandweightoffishspecies.Thetaxonomicidentifi-cationwasperformedtospecieslevelandtohelpwithfishidentifica-tion,thephotographflipchartsofmorethan170fishcommonspecieswereprovidedtofishermen.Moreover,toensurethequalityofmoni-toring,alldatawerecheckedforerrorsandcleanedquarterlywithinthe monitoring period byMRC’s specialists. In total, about 14,368observations have been recorded over the survey period and fivemaintypesoffishinggearwererecorded,thatisgillnets(47%),longlinesandhooks(23%),traps(10%),bagnets(8%)andcastnets(7%;Sinthavong,2006).Thefishingeffortsrangedfrom1to24hrdepend-ingon the seasonsand typeof thegear; nevertheless, theaverageeffortsovertherecordperiodwerebetween6to7hr/day.Weusedthewholedatasetforthestatisticalanalyses.
2.3 | Climaticvariables
NineteenbioclimaticvariableswerederivedfromtheWordClimdata-base (Hijmans, Cameron, Parra, Jones, & Jarvis, 2005), available athttp://www.worldclim.org,describing theclimateconditions for theperiod1950–2000withaspatialresolutionofabout1km2(Table1).
2.4 | Physicochemicalvariables
Fifteen physicochemical variables were obtained from the MRC’swaterqualitymonitoringprogramme(Chea,Grenouillet,&Lek,2016)andused toexamine the linkbetweenphysicochemical factorsandfish assemblages (Table2). The monitoring programme started in1985inLaos–Vietnam–Thailandand1995inCambodia.Atthebasinscale,117sitesweremonitoredmonthly.Thevaluesofphysicochemi-calvariablesofeachfishsitewereattributedfromtheclosestwaterqualitymonitoringsites(TableS1).Intotal,22ofthewholenumberof monitoring sites were used for the analyses and the values of each parameterwereexpressedasannualmedianvalues (TableS1).The
TABLE 1 Listofbioclimaticvariablesusedinthestudywiththeaverageandstandarddeviation
Variable Unit Variabletype Mean SD
Bio1 (°C) AnnualMeanTemperature 26.76 0.90
Bio2 (°C) Mean Diurnal Range (Meanofmonthly(maxtemp–mintemp))
9.15 1.71
Bio3 % Isothermality(bio2/bio7);*100)
58.54 5.39
Bio4 (°C*100) TemperatureSeasonality(standarddeviation*100)
1,569.82 736.45
Bio5 (°C) MaximumTemperatureofWarmestMonth
34.23 0.98
Bio6 (°C) MinimumTemperatureofColdestMonth
18.39 3.57
Bio7 (°C) TemperatureAnnualRange(bio5-bio6)
15.84 4.20
Bio8 (°C) MeanTemperatureofWettestQuarter
27.20 0.31
Bio9 (°C) MeanTemperatureofDriestQuarter
24.83 2.19
Bio10 (°C) MeanTemperatureofWarmestQuarter
28.53 0.55
Bio11 (°C) MeanTemperatureofColdestQuarter
24.50 2.03
Bio12 mm AnnualPrecipitation 1,635.26 324.78
Bio13 mm PrecipitationofWettestMonth
329.85 90.95
Bio14 mm PrecipitationofDriestMonth
4.18 3.27
Bio15 — PrecipitationSeasonality(CoefficientofVariation)
83.82 10.42
Bio16 mm PrecipitationofWettestQuarter
869.21 251.89
Bio17 mm PrecipitationofDriestQuarter
25.31 12.84
Bio18 mm PrecipitationofWarmestQuarter
407.79 184.73
Bio19 mm PrecipitationofColdestQuarter
63.51 46.40
Isothermality(bio3)isdefinedastheratioofthediurnalrangeoftempera-ture to the annual range.
84

4 | Chea et al.
averagedistancebetweenfishandphysicochemicalsiteswas27.36(±27.08SD)km.
2.5 | Statisticalanalysis
Here,wefocusedonpatternsofcommunityintermsofcompositionratherthanabundance.Therefore,allfishcatchesweretransformedintorelativeabundancetoreducetheeffectofvaryingfishingeffortsbetween sites and averaged to annualmean relative abundance tosummarisethedataset.Next,weperformedWardhierarchicalclus-teringbasedon theannualmean relativeabundance toclassify thefishsitesintodifferentgroupsaccordingtotheirsimilarityinspeciescomposition(Murtagh&Legendre,2014).Speciesrichnessanddiver-sityindex(i.e.inverseSimpsonindex)werecomputedtodescribetheclustersidentified,andsignificantdifferences(p<.05)amongclustersweretestedusingTukey’sHSD(HonestSignificantDifference)tests.
Afterwards, the indicator species of each group of sites weredeterminedusingthe“indicspecies”packagetodescribethedifferenc-esintheclustersidentified(DeCáceres,Legendre,&Moretti,2010).Foragivencluster,theindicatorvalueofthespeciesisthesquarerootoftheproductoftwoquantitiescalledAandB,thatispredictivevalueand sensitivity.QuantityA is the probability of the target group ofsitesgiventhatanindividualspecieshasbeenfoundandwasdefinedas the mean abundance of the species in the target site group divided by the sumof themeanabundancevalueover all groups.QuantityB is the average relativeabundanceof individualsof the species ata site that belongs to the target site group and was determined as therelativefrequencyofoccurrenceofthespeciesinsidethetargetsitegroup(DeCáceresetal.,2010).Hence,specieswithhighindicatorvalueswereusedascharacteristicmembersofthecluster.Thesameprocedure was performed simultaneously for dry and wet seasons of fishdatasets.
Tostudytherelationshipbetweenfishassemblagesandenviron-mentalvariables,ordinationmethodswereperformedonannualmeanfish data. First, detrended correspondence analysis (DCA)was per-formedtoselecttheappropriateordinationmethodforourstudy(i.e.redundancyanalysis(RDA)versuscanonicalcorrespondenceanalysis(CCA;Legendre&Legendre,2012).CCAwasdescribedasthemostappropriatemethod as the calculatedDCAordination gradientwas>3(i.e.4.22forourstudy),revealingthatunimodalresponsestoenvi-ronmentalfactorspredominated(TerBraak&Prentice,1988).CCAisaconstraintordinationmethodwhichrevealstherelationshipsbetweencommunitystructure,sitesandenvironmentalvariables (Legendre&Legendre,2012).InthebiplotofCCA,theimportanceofenvironmen-talvariables isdepictedby the lengthof thevectors,while thecor-relationbetweenthemisexhibitedbytheanglebetweenthevectors.WeusedMonteCarlo permutation testswith999permutations totestwhetherthevariablessignificantly(p<.05)explainedthefishdata(Legendre&Legendre,2012).
Lastly,toexaminethecontributionofthetwosetsofenvironmen-talfactorsinexplainingthevariationinfishassemblages,variancepar-titioningwasperformedtoseehowthephysicochemicalandclimaticvariablescontributedtoexplainfishassemblages(Borcard,Legendre,&Drapeau,1992;Legendre&Legendre,2012).Spatialvectorswerealsoincludedinthevariancepartitioningtodisentangletheinfluenceofenvironmentalandspatialfactorsonfishdistribution.Thegeograph-ic coordinates of the sites were modelled following the Asymmetric EigenvectorsMap(AEM)procedureproposedbyBlanchet,Legendre,andBorcard (2008).ForwardselectionwasperformedonAEMvec-tors,andonlysignificantenvironmentalandAEMvariableswerekeptfortheanalysis.Thepartitioningwasperformedthroughthe“vegan”packageanddisplayedintheformofaVenndiagram(Borcardetal.,1992).AllstatisticalanalyseswereconductedinR3.2.2(RCoreTeam2015).
3 | RESULTS
3.1 | Fishdiversityandassemblagestructure
Atotalof182speciesbelongingto110genera,42familiesand13different orders were recorded by the fishermen at 38 monitor-ing sites. Three main orders accounted for 80% of the total num-ber of species, that is Cypriniformes (54 species), Siluriformes(53 species) and Perciformes (39 species), while Anguilliformes,Batrachoidiformes, Beloniformes, Clupeiformes, Mugiliformes,Osteoglossiformes,Pleuronectiformes,Rajiformes,SynbranchiformesandTetraodontiformes representedeachof them<5%of the totalfishspeciesrichness.
The38monitoringsiteswerepatterned intofourdifferentcom-munity assemblage clusters based on the similarity of their species composition(Fig.2a).Twomaincommunityclustersweredefinedatthefirst split (clusters I and II), revealing the longitudinal character-isticsof theMekong systembetween theupper LMRand itsdelta.Subsequently, themain clusterswere subdivided into four differentgroups considered as four different fish assemblages (Ia, Ib, IIa and
TABLE 2 Listofphysicochemicalvariablesused
Variables Unit Mean SD
pH — 7.38 0.33
Totalsuspendedsolids(TSS) mg/L 124.47 84.70
Conductivity(EC) μS/cm 202.19 105.07
Calcium(Ca+2) mg/L 19.30 6.21
Magnesium (Mg+2) mg/L 5.36 2.29
Sodium (Na+) mg/L 12.56 17.22
Potassium(K+) mg/L 1.85 1.01
Alkalinity(Alk) mg/L 76.07 20.00
Chloride(Cl−) mg/L 15.69 30.00
Sulphate (SO−2
4) mg/L 14.22 5.99
Nitrate (NO−
3) mg/L 0.23 0.07
Ammonium (NH+
4) mg/L 0.05 0.02
Totalphosphorus(TP) mg/L 0.09 0.06
Dissolvedoxygen(DO) mg/L 7.09 0.69
Chemicaloxygendemand(COD) mg/L 2.59 1.13
85

| 5Chea et al.
IIb)intheLMR(Fig.2a).Indeed,clusterIawascomposedof10sites,stretching down in the upper part of the LMR, along the borderbetweenLaosandThailand.Onlyonesiteof thisclusterwas foundattheheadoftheLMB.ClusterIbwascomposedof17sites,main-lylocatedinCambodiaandfoursiteswerefoundinupstreamoftheLMR, aboveVientianecity.The smallest cluster IIawasmadeupoffour sites, that is two sites located at the border of Cambodia andMekong delta and other two sites in the middle part of the delta. Finally, thecluster IIbwascharacterisedbysevensites in the lower
partoftheMekongdelta,knownasthebrackishzone;onlyonesiteof IIb was found in the middle part of the delta. Fish species richness ofeachassemblagerangedfrom17speciesattheheadoftheLMRto82atthemouthoftheriver(Fig.2a).ThehighestspeciesrichnesswasfoundinIIb(median:56species),followedbyIIa(55species)andthenIb(45species),andIacontainedthelowestspeciesrichness(28spe-cies;Fig.2a). Indeed,cluster Iapresentedsignificantly lowerspeciesrichnessthantheotherthreeclusters,whilenosignificantdifferenceswereobservedbetweenclustersIb,IIaandIIb.Moreover, important
F IGURE 2 FishdistributionandassemblagepatternsinLowerMekongRiver.Annual(a),dryseason(b)andwetseason(c)clusteringassociatedwithspeciesrichnessandInverseSimpsonindexofeachcluster(Ia,Ib,IIa,IIb).Foreachboxplot,thedarklineinsidetheboxrepresentsthemedianvalue,whilethelinesbelowandaboveindicatethe25and75percentilesrespectively.Thewhiskermarksrepresenttheminimumandmaximumvalues.Meanvaluesamongclusterswithacommonletterarenotsignificantlydifferentatp=.05(Tukey’sHSDtests)
86

6 | Chea et al.
variations in species richnesswerenoticedbetweenclusters IbandIIb. In contrast, the diversity indexwas highest (median: 10.5) in Ibandlowest(median:3.5)inIIb(Fig.2a).Accordingly,thediversityinIbwassignificantlydifferentfromIIb,whiletheothersexhibitedsimilardiversityindices(Fig.2a).
Theseasonalpatternswereconsistentbetweendryandwetsea-son(Fig.2b,c).Duringthedryseason,fishassemblageswerecharac-terisedbyhigherspeciesrichnessthaninwetseasonandthepatternsofdiversitywerepronounced,especiallybetweenclustersIbandIIb(Fig.2b).Bycontrast,duringthewetseason,fishassemblagepatternsweremore similar to the annual patterns; and no significant differ-ences in species richness and diversity were observed between the identifiedclusters(Fig.2c).
Furthermore,therelativeabundanceoffishordersvariedgreatlyalong the longitudinalgradientof theLMRsystem,and thispatternwas consistent between seasons for all except one fish order (i.e.Clupiformes, Fig.3,Wilcoxon test,p<.05).Apart from theMekongdelta,thatisparticularlyinIaandIb,CypriniformesandSiluriformesdominatedandoccurredalmost ineverysite,while theirabundanc-es decline dramatically in the delta. Additionally, OsteoglosiformesandPerciformeswere found in some sitesof Ib, that is the sites inCambodia.Inthedelta(IIaandIIb),thefishcompositionwasdiverseand characterised by many species from different orders such asClupeiformes, Perciformes, Pleuronectiformes, Synbranchiformes,Tetraodontiformes;amongthose,PerciformesandClupeiformeswerethemostabundant(Fig.3).
3.2 | Indicatorspeciesofclusters
Atotalof80 indicatorspecieswere identifiedfromthefourannualclusters(TableS2).ThehighestnumberofindicatorspecieswasfoundinIIb(31species),whilethelowestwasobservedinIa (11species).
Theclustersinthedelta(IIaandIIb)accountedfor66%ofthetotalindicatorspecies.TheindicatorspeciesinIaandIbweremostlyspe-ciesfromCyprinidae,Pangasiidae,SiluridaeandBagridaefamilies,thatis Cosmochilus harmandi, Bagnana behri, Helicophagus waandersii, Labeo chrysophekadion, Bagarius yarelli, Henicorhynchus spp., Micronema bleekeri and Hemibagrus nemurus, which are known as potamodro-mousfishand indigenoustotheLMB.Assemblage IIacontained21indicator species.Among them,manyareknownas freshwaterandsecondary freshwaterfish such asGlossogobius giuris, Macrognathus siamensis, Acanthopsis sp., Puntioplites proctozysron, Mastacembelus armatus and Mystus mysticetus. Similarly, themain indicator speciesof IIbweremostly characterised by secondary freshwater fish andmarinespecies,knownasamphidromousandanadromousfish, thatis Clupeichthys aesarnensis, Rasbora trilineata, Scomberomorus sinen-sis, Eleotris spp.,Liza spp.,Arius stormi, Toxotes spp.,Lates calcarifer. Mostofindicatorspeciesduringthedryseasonwerealsoidentifiedas indicator speciesusingannualassemblagecompositions.Overall,dryseasonassemblagescontainedmoreindicatorspecies(73species)comparedtowetseasonassemblages(51species),whilemanyindi-cators species from annual IIa and IIb were absent in the wet season (TableS2).
3.3 | Environmentaldeterminantsofthefishassemblages
TheCCAmodel testingtheassociationbetweenannualfishassem-blagesandclimaticvariableswassignificant (F=1.55,p=.001)andthefirsttwoaxesexplained15.8%and7.2%ofthevariationinfishcompositionrespectively.Amongtheclimaticvariablestested,18hadasignificant(p<.05)effectonfishassemblage(Fig.4a,b,Tables1and3).Indeed,clusterIawasmainlycharacterisedbyhighvaluesofbio15,bio16andbio13respectivelytheseasonalvariationofprecipitation,
F IGURE 3 RelativeabundancesoffishorderalongtheLowerMekongRiver.Openandclosecirclesdenotethewetanddryseasonrespectively.Theacronymsintheverticalaxisdenotethespeciesorder:angu(Anguilliformes),batr(Batrachoidiformes),belo(Beloniformes),clup(Clupeiformes),cypr(Cypriniformes),mugi(Mugiliformes),oste(Osteoglossiformes),perc(Perciformes),pleu(Pleuronectiformes),raji(Rajiformes),silu(Siluriformes),synb(Synbranchiformes),tetr(Tetraodontiformes).Theacronymsinthehorizontalaxisindicatethelocationofthesites:TH(Thailand),LA(Laos),CA(Cambodia)andVN(Vietnam).*denotessignificantdifferencesinfishrelativeabundancebetweenseasons(Wilcoxontest,V=313andp=.04)
87

| 7Chea et al.
theprecipitationof thewettestmonthandwettestquarter. SimilarclimaticpatternswereassociatedtoIb,exceptthathighvaluesofbio5(maximal temperature of warmest month) and bio19 (precipitationofcoldestquarter)werestronglyassociatedwiththiscluster. IntheMekongdelta,clustersIIaandIIbwerecharacterisedbyhighvaluesoftheisothermality(bio3),minimaltemperatureofthecoldestmonth(bio6),themeantemperatureofthedriestquarter(bio9)andcoldestquarter(bio11).Overall,intheupperpartoftheLMR,theclustersIaand Ibwere associatedwith high values of precipitation,while thedeltaclusters(IIaandIIb)werestronglycharacterisedbyhighvaluesof temperature.
In parallel, the CCA model testing the effect of physicochemi-calvariables on annual fish assemblage compositionwas significant(F=1.77,p=.001).Thefirsttwoaxesexplained22.5%ofthevariationinfishassemblage (15.5%and7.0%respectively).Among thephys-icochemical variables tested, 14 had a significant effect on the fishassemblages (p<.05;Fig.4c,d,Tables2and3).ClustersIaandIbwerestronglycharacterisedbyhighvaluesofDO,pH,Ca,alkandTSS;whiletheIIaandIIbwerepositivelyassociatedwithhighvaluesofTP,CODand NH+
4.Inaddition,clusterIIbwasfoundtobeassociatedwithhigh
levels of NO−
3andCl−aswell,especiallyforthesitesclosetothesea.
3.4 | Effectsofenvironmentalandspatialfactorsonthefishassemblages
Variance partitioning in fish assemblage composition indicated thatboth environmental (physicochemical and climatic) and spatial vari-ablescontributedsignificantlytoexplainpatternsinfishassemblages
(Fig.5).Thepurephysicochemicalfactorsexplained8.0%ofvariationinfishassemblages,while10.9%and4.0%wereexplaineduniquelybyclimaticandspatialfactorsrespectively.Physicochemicalandclimaticfactorsjointlyexplained5.3%ofthetotalvariance,whilethecompo-nentsharedbythethreefactors(physicochemical,climaticandspa-tial)explained20.1%ofthevariationinfishassemblages.TheadjustedR2fromthemodelwas46.7%.
4 | DISCUSSION
4.1 | Fishdiversityandassemblagestructure
Toourknowledge,thisstudyisthefirstholisticfishcommunitystudyto investigate the large-scale patterns of fish distribution and theirenvironmental determinants in the lower Mekong river. In terms of fishdiversity,theupstreampartoftheLMRexhibitedthelowestspe-cies richness,while the highest richnesswas observed in the deltawherefishspecieswerecomposedoffreshwater,brackishandmarinespecies.Indeed,thelongitudinalchangesofspeciesrichnessalongthephysical and chemical gradients, that is upstream–downstream, arewellknowninlarge-scalepatternsoffishassemblages.Manydiscus-sionsandexplanationsofthemechanismsresponsibleforsuchpat-terns have come up with the concept of “addition” leading to theincrease in species richness from the headwaters to lower part of the river(seeMatthews,1998).
In contrast to species richness, cluster IIb exhibited the low-est diversity index, while the highest value was observed in Ib inCambodia. Consequently, these patterns of diversity could reflect
F IGURE 4 Canonicalcorrespondenceanalysis(CCA)relatingfishrelativeabundanceto(a,b)climaticvariablesand(c,d)physicochemicalvariables.Thedifferent colour dots on the left plots represent the indicator species in each fish assemblage; while the grey dots on the right hand side indicate the fish monitoring sites.Thebluearrowsrepresentthevectors of environmental variables (i.e. climaticandphysicochemical)andonlysignificant variables (p<.05)aredepicted.Details about the indicator species and environmental variables are given in Tables1–3andS2
88

8 | Chea et al.
therivercontinuumconcept(RCC)wherethespeciesrichnessishighat the lower part of the river and highest diversity is observed in the middle reach (Statzner&Higler, 1985;Vannote,Minshall, Cummins,Sedell,&Cushing,1980).However,RCCismoreapplicabletosmall-tomedium-sized rivers, that is probably not the case for the lowerMekong.AnotherreasonforthehighdiversityinCambodiacouldbethegeographicalconditionsoftheregion,wheremanyspeciescannotmigrateuptheKhoneFalls(Valbo-Jorgensen,Coates,&Hortle,2009).InCambodia, the river is characterisedby low land andnobarriers;thus,manyspeciescouldmoveeasilyupanddownthispart (Baran,So,&Leng,2008).Besides, thevitalconnectivitybetweentheTonleSapLakeandMekongprovidesfavourableconditionsformanyspeciesto complete their life cycle as the lake provides feeding and nursing
grounds,whilemanydeeppoolsbelowKhoneFallsandatlargetrib-utaries (3S river system) are essential for spawning and dry seasonrefuge.
Dry season fish assemblages were characterised by significantchanges in species richness and diversity along the LMR, similar toobservedannualpatterns.Itcanbeduetothefactthatfishmaybeconcentratedindeeppools,microhabitatsormainrivercourseduringthedryseason,whilefishwouldprobablydispersemoreastheriverexpandswith increased inundated floodplains and habitat diversityduringwetseason(Ferreira&Stohlgren,1999;Junk,Barley,&Sparks,1989;Silvano,doAmaral,&Oyakawa,2000).Consequently,thiscon-centrationwouldleadfishermentocatcheasilythefishwithvarietyof species compared towet season.Moreover, differentpatterns incommunitycompositionbetweenseasonscouldbeexplainedbythemigratory fishmovement in the basin (Baran, 2006).Therefore, theseasonalturnovermaybeattributedtothedifferentcatchability,habi-tatdiversityandmigrationoffishwithinthebasin.SimilarconclusionshavebeenpreviouslyreportedfromfishcommunitystudiesintropicalAmazonianrivers(Albert&Reis,2011;Matthews,1998;Winemiller,1996).
AttheupperpartofLMR,thedifferentpatternsinIaandIbbetweendryandwetseasonsrevealedtheassociationofcommunitystructurewithmigrationpatterns(Fig.2a,c).Forinstance,manywetseasonindi-catorspeciesfromIaandIb,thatisC. harmandi,Henicorhynchusspp.,Pangasianodon hypophthalmus,H. nemurus,arelong-distancemigrants,andtheirspawninggroundwasidentifiedatuppermostpartsofLMR(Baran,2006;Poulsenetal.,2004).Similarly,tomanyAmazonianfish,some of the Mekong species were reported to migrate upwards for reproduction,whileothersmigratedownwardsforfeedingandnurs-ing(Poulsenetal.,2004).Accordingly,inthemiddlepartofLMR,most
TABLE 3 Canonicalcorrelationcoefficientsofclimaticandphysicochemicalvariableswiththefirsttwocanonicalcorrespondenceanalysisaxes(CCA1andCCA2).Thecorrelationoftheexplanatoryvariablestothefinalordination(r2)determinestheirimportanceinexplainingfishassemblagecomposition,withtheirassociated p-valuescomputedfrompermutationtests.VariablecodesareinTables1and2
Parameters CCA1 CCA2 r2 p
ClimaticvariablesBio1 −.664 −.748 .393 .001Bio2 .937 .349 .676 .001Bio3 −.870 −.493 .820 .001Bio4 .861 .509 .658 .001Bio5 1.000 −.010 .727 .001Bio6 −.838 −.546 .656 .001Bio7 .901 .434 .743 .001Bio8 .272 −.962 .013 .756Bio9 −.803 −.595 .518 .001Bio10 .658 −.753 .191 .025Bio11 −.783 −.622 .516 .001Bio12 .736 .677 .336 .001Bio13 .750 .662 .561 .001Bio14 .830 −.557 .197 .020Bio15 .613 .790 .788 .001Bio16 .714 .700 .566 .001Bio17 .538 −.843 .360 .002Bio18 .463 .886 .382 .001Bio19 .016 −1.000 .500 .001
Physicochemical variablespH −.918 .397 .721 .001TSS −.789 .615 .236 .014EC .494 .869 .170 .043Ca −.780 .626 .476 .001Mg .637 .771 .213 .016Na .876 .482 .199 .023K .877 .480 .202 .021Alk −.768 .640 .415 .001Cl .890 .456 .217 .011SO4 −.294 .956 .154 .066NO3 .707 .708 .377 .001NH4 .985 .174 .334 .005TP .998 .061 .736 .001DO −.987 .161 .600 .001COD .984 −.180 .703 .001
F IGURE 5 Venndiagramofvariancepartitioningresultsshowingtherelativeeffectsofphysicochemical,climaticandspatialfactorsalone and in combination with the variation of the fish assemblages. Numbersrepresent%variationexplainedbyeachfactor.Allpurefactors were statistically significant (p-value<.05)
89

| 9Chea et al.
ofthemigrantsfeedinTonleSapLakeandspawnbelowKhoneFalls;whileatupperpart,theriverservesboth,thatisspawningandfeeding,forallmigrants(Poulsenetal.,2004;Rainboth,1996).Nevertheless,asa result offishmovement, no significantdifference indiversitywasobservedduringthewetseason,revealingthatdiversitypatternsweremorehomogenouscomparedtodryseasonandannualpatterns.
Clear patterns of the assemblage structure were observedbetweentheupperLMRanditsdelta.Specifically,assemblagesIaandIbwerecharacterisedbycyprinidsandcatfish,speciesknowntobepotamodromous,whichfrequentlyoccurinalarge-sizedriver,specif-ically intheMekongmainstream,that isC. harmandi, L. chrysopheka-dion, H. waandersii, B. yarelli and Bangana behri (Lucas etal., 2001).BelowKhoneFalls,thecyprinidsinIbweredominatedbyopportun-ist species, that isHenicorhynchus spp.,Thynnichthys thynnoides and Paralaubucca typus; these species are known as fast growing with short lifespanandarereportedtodothelong-distancemigrationaswell, commonly betweenTonle Sap Lake and upstreamCambodianMekong(Baranetal.,2008).
In theMekongdelta, thefishassemblageschangedsignificantly,withsharpdeclinesinfishabundancesobservedforcyprinidsandcat-fish,knownasstenohalinespecieswithlowtolerancetosalinity(Valbo-Jorgensen etal., 2009). Obviously, the perch-like fish (Perciformes)andclupeids(Clupeiformes)werecommonspeciesinIIaandIIb;thesegroupsoffisharetoleranttosalinityandturbidwater(Albert&Reis,2011). Nevertheless, in IIa, many species were known as stenoha-line species, that is C. aesarnensis, Mastacembelus spp., Acanthopsis sp.,which are less tolerant to the brackish conditions of the delta.However, someof themneed themarineenvironment to completetheirlifecycle,forexampleCynoglossus microlepis,whileotherswerebelieved to reside permanently in the estuary, for exampleG. giuris (Froese&Pauly,2015;Valbo-Jorgensenetal.,2009).InIIb,wefoundmostlymarine species, that is Liza spp.,Scomberomorus sp.,Toxotes spp.,Allenbatrachus grunniens, Boleophthalmus boddarti,whicharewellsuitedtothemarineenvironmentwith less lightpenetration(Moyle&Cech,1988).Ofcourse,thesespeciesareknownasamphidromousfishandsomeofthemarecatadromousfish,forexampleAnguillasp.,Ellochelon vaigiensis, Mugil cephalus,whichinhabitfresh-brackishwaterand live permanently in the estuary like the small anchovies (Coilia sp. and Tenualosa toti;Froese&Pauly,2015;Motomura,Iwatsuki,Kimura,&Yoshino,2002).
Sofar,thedifferenceinfishassemblagepatternscouldresultfromthedifferentmigrationroutesoffishwithin thebasin,where itwasestimatedthatabout40%of lowerMekongspeciesare“whitefish”that conduct long-distance migrations (Baran, 2006; Poulsen etal.,2004).
4.2 | Relativeimportanceofenvironmentalandspatialfactorsstructuringthefishassemblages
Overall,ourstudyshowedthattheseasonalvariationofprecipitation(bio15), theprecipitationofthewettestmonth (bio16), themaximaltemperature of warmest month (bio5), the precipitation of cold-est quarter (bio19), aswell as the isothermality (bio3), theminimal
temperatureofthecoldestmonth(bio6)andthemeantemperatureofthedriestquarter(bio9)werethekeyclimaticfactorsdrivingthechanges infishassemblagestructure.Obviously, theseasonalvaria-tionsoftemperatureandprecipitationhaveprovedtobeimportantfactorsaffectingthedistributionoforganismsinecosystems(Buissonetal.,2008;Cheungetal.,2009).Alternatively,TP,DO,CODandpHsignificantly influencedthespatialstructureof thefishassemblagesaswell. Indeed,manystudieshaverevealedthe linkbetweenphys-icochemicalfactors,particularlynutrientsandDO,andthepatternsoffishassemblagesalongriversystems(Fialho,Oliveira,Tejerina-Garro,& de Mérona, 2007; Trujillo-Jiménez, López-López, Díaz-Pardo, &Camargo,2009).
According to the results of our study, the differences betweenupstream(Iaand Ib)anddeltaassemblages (IIaand IIb)weremainlyexplainedbytemperatureaswellasnutrientsandthenaturaleffectsofseawaterintrusion.Consequently,theupstreamspecieswerespe-cialisedforupstreamconditionswithhighaltitude,lowertemperature,highrainfall,DOandpH,particularlyinclusterIa.Bycontrast,thedel-ta species were suited to high levels of nutrients and could tolerate hightemperatureandsalinity.TheseconclusionswerealsoconsistentwithpreviousstudieswhichreportedthattheupperMekongfishweredominatedbyCyprinidae,Balitoridae,CobitidaeandSisoridaethatallprefercold,oxygen-richwaterbodies (Valbo-Jorgensenetal.,2009),while Gobiidae, Polynemidae, Toxotidae, Eleotridae, Clupeidae andEngraulidaedominated in thedelta,with species known to tolerateestuarineconditions,thatislowoxygen,highnutrient,eutrophicationand salinity.
So far,many studies on the environmental determinants of fishassemblagestructurehave reported themaincontributionofphysi-cochemical factors (Braaten&Guy,1999;Piresetal.,2010;Trujillo-Jiménez etal., 2009), while others revealed a predominant role ofclimaticfactorsinstructuringthespatialdistributionoffish(Buissonetal.,2008;Guoetal.,2015;Reash&Pigg,1990;Zhaoetal.,2015).However,inourstudy,thecombinationofenvironmentalandspatialfactorsprovidedabetterexplanationof thevariation infishassem-blages.Thus,thephysicochemicalorclimaticfactorsalonewouldnotoptimallyexplainthedistributionpatternsoffishassemblages(Lujanetal.,2013).
4.3 | Fishdiversitymanagementandconservation
Ourresultsprovidethecurrentbaseline informationonfishassem-blagestructureintheLMRsystem.Accordingtoourresults,fishcon-servationzonesshouldbeprioritisedinthemiddlepartoftheLMR,that ismainly cluster Ib,where thehighestdiversitywasexhibited.Moreover,conservationplanningshouldalsoconsidertheupstreampart of the LMR (Cluster Ia), between Khone Falls and Vientianecity,wherehighlevelsofendemismtotheLMRsystemarerecorded(Coates,2001).Accordingly,itwasreportedthattheconstructionofnaturalreserveswouldbeaneffectiveapproachtoprotectfishbio-diversity (Park,Chang,Lek,&Brosse,2003).Besides, theconserva-tionstrategiesshouldbeprioritisedtospecialistgroupsoffishastheyareendangeredandvulnerabletoenvironmentalchanges(Kangetal.,
90
10 | Chea et al.
2009).Alternatively,conservationpracticesshouldbecarriedoutinanetworkedregionratherthaninsinglereserveanddifferentconserva-tionstrategiesshouldbeproposedaccordingtothedifferentobjec-tivesandeco-regions,forexampleupstreamLMRandMekongdelta.
Furthermore, the maintaining of the connectivity betweenupstream–downstream habitats (including deep pools as dry refuge)and major tributaries (3S river systems, Tonle Sap River, the GreatLakeanditsfloodplains)isessentialformanyshort-andlong-distancemigrants such as Pangasianodon gigas and Pangasius kremfi to com-plete their lifecycle.Therefore,westronglysupport theconcernsofbiodiversity losses due to the constructionof dams across themainchannel (Hortle,2007;Valbo-Jorgensenetal.,2009;Zivetal.,2012).Meanwhile, water quality monitoring and improvement need to beaddressed rigorouslywithin the region (Chea etal., 2016; Dudgeon,2011).Forinstance,ourstudyexhibitedthelowestfishdiversityinthedelta, likely to reflectwaterpollutioneffectson thefishcommunity.Thus,thecyprinidsandPangasiuscatfish,whicharethemainsourcesofproteins(Hortle,2007),wouldbestronglyaffectedastheyareunabletowithstandsignificantchangesinwatercondition.Nevertheless,ourstudyrevealedthatthecombinationofbothenvironmentalandspatialfactorscontributessignificantlyinstructuringthefishcommunityalongtheLMR.Takingthesefactorsintoaccountappearsthereforecrucialifweareto initiatemanagementstrategiestoensuretheconservationandsustainableuseoffisheriesresourcesintheLowerMekongRiver.
ACKNOWLEDGEMENTS
WearegratefultotheErasmusMundusTECHNOProgramandtheBelmontForum(TLSCCproject)forfundingourstudy.Greatthanksto theMekongRiverCommission (MRC) for providing thefish andwaterqualitydatasetsusedinthisstudy.WewouldliketothanktoDr.PeterWintertonforhelpingustocorrecttheEnglish.ThankstoUniversityofBattambangforthedatarequestandourcolleaguesattheLaboratoryofEvolutionandBiologicalDiversity (EDB) for theirsupportanddiscussionconcerningdatapreparationandanalysis.EDBlaboratorywassupportedby“Investissementd’Avenir”grants(CEBA,ref.ANR-10-LABX-0025;TULIP,ref.ANR-10-LABX-41).
REFERENCES
Albert,S.J.,&Reis,E.R.(2011).Introductiontoneotropicalfreshwaters.InS.J.Albert,&E.R.Reis(Eds.),Historical biogeography of neotropical freshwater fishes(pp.3–16).Berkeley,CA:UniversityofCaliforniaPress.
Amarasinghe,U.S.,&Welcomme,R.L.(2002).Ananalysisoffishspeciesrichness in natural lakes. Environmental Biology of Fishes,65,327–339.
Baran,E.(2006).Fish migration triggers in the Lower Mekong Basin and other tropical freshwater systems.MRCTechnicalPaperNo.14.MekongRiv-erCommission,Vientiane.56pp.Retrievedfromhttp://agris.fao.org/agris-search/search.do?recordID=QW2016000150
Baran,E.,So,N.,&Leng,S.V.(2008).Integrating fish resources to agro-eco-system analyses. FisheriesComponent.CGIARChallengeProgramonWater&Food,PhnomPenh,Cambodia.65pp.Retrievedfromhttp://pubs.iclarm.net/resource_centre/WF_2581.pdf
Blanchet,F.G.,Legendre,P.,&Borcard,D.(2008).Modellingdirectionalspatial processes in ecological data.Ecological Modelling,215, 325–336.
Borcard,D.,Legendre,P.,&Drapeau,P.(1992).Partiallingoutthespatialcomponentofecologicalvariation.Ecology,73,1045–1055.
Braaten, P. J., & Guy, C. S. (1999). Relations between physicochemicalfactorsandabundanceoffishesintributaryconfluencesoftheLowerChannelizedMissouriRiver.Transactions of the American Fisheries Soci-ety,128,1213–1221.
Buisson,L.,Blanc,L.,&Grenouillet,G.(2008).Modellingstreamfishspe-ciesdistributioninarivernetwork:Therelativeeffectsoftemperatureversus physical factors. Ecology of Freshwater Fish,17,244–257.
Chea,R.,Grenouillet,G.,&Lek,S.(2016).Evidenceofwaterqualitydeg-radationinLowerMekongBasinrevealedbyself-organizingmap.PLoS ONE,11,e0145527.
Cheung,W.W.L.,Lam,V.W.Y.,Sarmiento,J.L.,Kearney,K.,Watson,R.,&Pauly,D.(2009).Projectingglobalmarinebiodiversityimpactsunderclimate change scenarios. Fish and Fisheries,10,235–251.
Coates,D.(2001).Biodiversity and fisheries management opportunities in the Mekong River Basin.MRCTechnicalPaper.MekongRiverCommission,PhnomPenh.40pp.Retrievedfromhttps://www.cbd.int/doc/nbsap/fisheries/Coates.pdf.
DeCáceres,M.,Legendre,P.,&Moretti,M.(2010).Improvingindicatorspecies analysis by combining groups of sites. Oikos, 119, 1674–1684.
Dudgeon,D.(2003).Thecontributionofscientificinformationtothecon-servationandmanagementoffreshwaterbiodiversityintropicalAsia.Hydrobiologia,500,295–314.
Dudgeon,D. (2011).Asian riverfishes in theanthropocene:Threatsandconservationchallengesinaneraofrapidenvironmentalchange.Jour-nal of Fish Biology,79,1487–1524.
Dugan,P.J.,Barlow,C.,Agostinho,A.A.,Baran,E.,Cada,G.F.,Chen,D.,…Winemiller,K.O.(2010).Fishmigration,dams,andlossofecosystemservices in the Mekong Basin. Ambio,39,344–348.
Ferreira,L.V.,&Stohlgren,T.J.(1999).Effectsofriverlevelfluctuationonplantspeciesrichness,diversity,anddistributioninafloodplainforestinCentralAmazonia.Oecologia,120,582–587.
FEVM.(2007).Monitoring fish abundance and diversity in the Lower Mekong Basin: Methodological guidelines. Regional fish abundance and diver-sity monitoring programme. Phnom Penh, MRCS, 12 pp. Retrievedfrom http://www.mrcmekong.org/assets/Publications/technical/Tech-No33-Integreted-Analysis-of-Data.pdf
Fialho,A.P.,Oliveira,L.G.,Tejerina-Garro,F.L.,&deMérona,B. (2007).Fish-habitatrelationshipinatropicalriverunderanthropogenicinflu-ences. Hydrobiologia,598,315–324.
Froese,R.,&Pauly,D. (2015).FishBase.Worldwidewebelectronpubli-cation.Retrievedfromhttp://www.fishbase.org,version(lastaccessed25/11/2015).
Guo,C.,Lek,S.,Ye,S.,Li,W.,Liu,J.,Chen,Y.,&Li,Z.(2015).Predictingfishspeciesrichnessandassemblageswithclimatic,geographicandmor-phometric factors:Abroad-scale study inChinese lakes.Limnologica - Ecology and Management of Inland Waters,54,66–74.
Hijmans,R.J.,Cameron,S.E.,Parra,J.L.,Jones,P.G.,&Jarvis,A.(2005).Veryhighresolutioninterpolatedclimatesurfacesforgloballandareas.International Journal of Climatology,25,1965–1978.
Hortle,K.G.(2007).Consumption and the yield of fish and other aquatic an-imals from the Lower Mekong Basin.MRCTechnicalPaperNo.16.Me-kongRiverCommission,Vientiane.87pp.Retrievedfromhttp://www.mrcmekong.org/assets/Publications/technical/tech-No16-consump-tion-n-yield-of-fish.pdf.
Junk,W.J.,Barley,P.B.,&Sparks,R.E.(1989).Thefloodpulseconceptinriver-floodplain systems. Proceedings of the International Large Riv-er Symposium. Canadian Journal of Fisheries and Aquatic Sciences,106,110–127.
Kang,B.,He,D.,Perrett,L.,Wang,H.,Hu,W.,Deng,W.,&Wu,Y.(2009).FishandfisheriesintheUpperMekong:Currentassessmentofthefishcommunity,threatsandconservation.Reviews in Fish Biology and Fish-eries,19,465–480.
91

| 11Chea et al.
Kottelat,M.,&Whitten,J.A.(1996).Freshwater biodiversity in Asia with spe-cial reference to fish.WorldBankTechnicalPaper343.TheWorldBank,Washington,DC,USA.59pp.
Legendre,P.,&Legendre,L.(2012).Canonicalanalysis.InP.Legendre,&L.Legendre(Ed.),Numerical ecology (3rded.,pp.575–633).Amsterdam:Elsevier.
Lu,X.X.,Li,S.,Kummu,M.,Padawangi,R.,&Wang,J.J.(2014).ObservedchangesinthewaterflowatChiangSaeninthelowerMekong:ImpactsofChinesedams?Quaternary International,336,145–157.
Lu,X.X.,&Siew,R.Y.(2006).WaterdischargeandsedimentfluxchangesoverthepastdecadesintheLowerMekongRiver:PossibleimpactsoftheChinesedams.Hydrology and Earth System Sciences Discussions,10,181–195.
Lucas,M.C.,Baras,E.,Thom,T.J.,Duncan,A.,&Slavik,O.(2001).Migra-tionandspatialbehaviour.InM.C.Lucas,&E.Baras(Ed.),Migration of freshwater fishes(pp.1–12).Oxford:BlackwellScienceLtd.
Lujan,N.K.,Roach,K.A.,Jacobsen,D.,Winemiller,K.O.,Vargas,V.M.,Ching,V.R.,&Maestr,J.A.(2013).Aquaticcommunitystructureacrossan Andes-to-Amazon fluvial gradient. Journal of Biogeography, 40,1715–1728.
Matthews,W.J.(1998).Patterns in freshwater fish ecology(pp.30–85).Dor-drecht:SpringerScience&BusinessMedia.
Mittermeier,A.R.,Turner,R.W.,Larsen,W.F.,Brooks,M.T.,&Gascon,C.(2011).Globalbiodiversityconservation:Thecriticalroleofhotspots.In F. Zachos, & J. Habel (Eds.),Biodiversity hotspots: Distribution and protection of conservation priority areas(pp.3–7).Heidelverg:Springer.
Motomura,H., Iwatsuki,Y., Kimura, S.,&Yoshino,T. (2002). Revision oftheIndo-WestPacificpolynemidfishgenusEleutheronema(Teleostei:Perciformes).Ichthyological Research,49,47–61.
Moyle,P.B.,&Cech,J.J.(1988).Fishes: An introduction to ichthyology (pp. 193–211).UpperSaddleRiver,NJ:PrenticeHall.
MRC (2015).Fisheries researchanddevelopment in theMekong region.Catch and Culture,21,1–56.
Murtagh,F.,&Legendre,P.(2014).Ward’shierarchicalagglomerativeclus-teringmethod:WhichalgorithmsimplementWard’scriterion?Journal of Classification,31,274–295.
Oberdoff,T.,Guegan,J.-F.,&Hugueny,B.(1995).Globalscalepatternsoffishspeciesrichnessinrivers.Ecography,18,345–352.
Olden,J.D.,Kennard,M.J.,Leprieur,F.,Tedesco,P.A.,Winemiller,K.O.,&García-Berthou,E.(2010).Conservationbiogeographyoffreshwaterfishes: Recent progress and future challenges.Diversity and Distribu-tions,16,496–513.
Park,Y.S.,Chang,J.,Lek,S.,&Brosse,S.(2003).ConservationstrategiesforendemicfishspeciesthreatenedbytheThreeGorgesDam.Conserva-tion Biology,17,1748–1758.
Pires,D.F.,Pires,A.M.,Collares-Pereira,M.J.,&Magalhães,M.F.(2010).Variationinfishassemblagesacrossdry-seasonpoolsinaMediterra-neanstream:Effectsofpoolmorphology,physicochemicalfactorsandspatialcontext.Ecology of Freshwater Fish,19,74–86.
Pool,T.K.,Olden,J.D.,Whittier,J.B.,&Paukert,C.P.(2010).Environmen-tal drivers of fish functional diversity and composition in the LowerColoradoRiverBasin.Canadian Journal of Fisheries and Aquatic Sciences,67,1791–1807.
Poulsen,A.F.,Hortle,K.G.,Valbo-Jorgensen,J.,Chan,S.,Chhuon,C.K.,Sinthavong,V.,…Tran,B.Q. (2004).Distribution and ecology of some important riverine fish species of the Mekong River Basin.MRCTechnicalPaperNo.10.MekongRiverCommission,PhnomPenh.115pp.Re-trieved from http://www.mrcmekong.org/assets/Publications/techni-cal/tech-No10-distribution-n-ecology-of-important.pdf.
Poulsen, A. F., Ouch, P., Sinthavong, V., Ubolratana, S., & Nguyen, T. T.(2002).Fish migrations of the Lower Mekong River Basin: implications for development, planning and environmental management.MRCTechnical
PaperNo.8.MekongRiverCommission,PhnomPenh.62pp.Retrievedfrom http://www.mrcmekong.org/assets/Publications/technical/tech-No8-fish-migration-of-LMB.pdf.
RCoreTeam(2015).R: A language and environment for statistical computing. Vienna,Austria:RFoundationforStatisticalComputing.
Rainboth,W.J.(1996).Fishes of the Cambodian Mekong. FAO species identifi-cation field guide for fishery purposes.FAO,Italy.265pp.Retrievedfromhttp://library.enaca.org/inland/fishes-cambodian-mekong.pdf.
Reash,J.R.,&Pigg,J.(1990).Physicochemicalfactorsaffectingtheabun-danceandspeciesrichnessoffishesintheCimarronRiver.Proceeding of the Oklahoma Academy of Science,70,23–28.
Roberts,T.R.,&Baird,I.G.(1995).TraditionalfisheriesandfishecologyontheMekongRiveratKhoneWaterfallinSouthernLaos.Natural History Bulletin of the Siam Society,43,219–262.
Silvano,R.A.M.,doAmaral,B.D.,&Oyakawa,O.T. (2000).SpatialandtemporalpatternsofdiversityanddistributionoftheUpperJuruaRiverfishcommunity(BrazilianAmazon).Environmental Biology of Fishes,57,25–35.
Sinthavong,V. (2006).Observationsof thefisheriesof theMekongwithnotesonthelifehistorystrategiesoffourfishspecies(Botia modesta, Henicorhynchus siamensis, Helicophagus waandersii and Probarbus jul-lieni).DoctorofPhilosophy:TheUniversityofHull.216pp.Retrievedfromhttp://lad.nafri.org.la/fulltext/2216-0.pdf.
Statzner,B.,&Higler,B.(1985).Questionsandcommentsontherivercon-tinuumconcept.Canadian Journal of Fisheries and Aquatic Sciences,42,1038–1044.
Tejerina-Garro,F.L.,Fortin,R.,&Rodríguez,M.A.(1998).Fishcommunitystructure in relationtoenvironmentalvariation infloodplain lakesoftheAraguaiaRiver,AmazonBasin.Environmental Biology of Fishes,51,399–419.
TerBraak,C.J.F.,&Prentice, I.C. (1988).A theoryofgradientanalysis.Advances in Ecological Research,34,235–282.
Trujillo-Jiménez,P.,López-López,E.,Díaz-Pardo,E.,&Camargo,J.A.(2009).PatternsinthedistributionoffishassemblagesinRíoAmacuzac,Mexi-co:Influenceofabioticfactorsandbioticfactors.Reviews in Fish Biology and Fisheries,20,457–469.
Valbo-Jorgensen, J., Coates, D., &Hortle, K. G. (2009). Fish diversity intheMekongRiverBasin.InC.I.Cambell(Ed.),The Mekong biophysical environment of an international river basin (pp.162–185).Amsterdam:ElsevierAcademicPress.
Vannote,R.L.,Minshall,G.W.,Cummins,K.W.,Sedell,J.R.,&Cushing,C.E. (1980).The rivercontinuumconcept.Canadian Journal of Fisheries and Aquatic Sciences,37,130–137.
Vorosmarty,C.J.,McIntyre,P.B.,Gessner,M.O.,Dudgeon,D.,Prusevich,A., Green,P.,…Davies,P.M.(2010).Globalthreatstohumanwatersecu-rity and river biodiversity. Nature,467,555–561.
Winemiller,K.O.(1996).Dynamicdiversityinfishassemblagesoftropicalrivers.InM.L.Cody,&J.A.Smallwood(Eds.),Long-term studies of verte-brate communities(pp.99–134).Orlando,FL:AcademicPress.
Zhao,T.,Grenouillet,G.,Pool,T.,Tudesque,L.,&Cucherousset,J.(2015).Environmentaldeterminantsoffishcommunitystructureingravelpitlakes. Ecology of Freshwater Fish,25,412–421.
Ziv,G.,Baran,E.,So,N.,Rodriguez-Iturbe,I.,&Levin,S.A.(2012).Trading-offfishbiodiversity,foodsecurity,andhydropowerintheMekongRiv-er Basin. Proceedings of the National Academy of Science of the United States of America,109,5609–5614.
SUPPORTINGINFORMATION
AdditionalSupportingInformationmaybefoundonlineinthesupport-inginformationtabforthisarticle.
92


ARTICLE 2
Spatial and temporal variations in fish community structure and diversity in the largest tropical flood-pulse system of Southeast Asia
Peng Bun Ngor, Gaël Grenouillet, Nam So, Sea Phem, Sovan Lek
Ecology of Freshwater Fish (accepted, in press)
93


1
Title: Spatial and temporal variation in fish community structure and diversity
in the largest tropical flood-pulse system of Southeast Asia
Peng Bun Ngor1,2¥, Gaël Grenouillet2,3, Sea Phem4, Nam So1, Sovan Lek2
1 Fisheries Administration, No. 186, Preah Norodom Blvd., Khan Chamcar Morn, P.O. Box 582, Phnom
Penh, Cambodia.
2 CNRS, Université Toulouse III Paul Sabatier, ENFA; UMR5174 EDB (Laboratoire Évolution &
Diversité Biologique); 118 route de Narbonne, F-31062 Toulouse, France
3 Institut Universitaire de France, Paris, France.
4 Tonle Sap Authority, 364, Monivong Blvd., Khan Chamkar Mon, Phnom Penh, Cambodia.
¥ Current address: CNRS, Université Toulouse III Paul Sabatier, ENFA; UMR5174 EDB (Laboratoire
Évolution & Diversité Biologique); 118 route de Narbonne, F-31062 Toulouse, France.
Running head: Fish community structure and diversity in a tropical flood-pulse system
Corresponding author: [email protected]
94

2
Abstract
The Tonle Sap River and Lake (TSRL) is Southeast Asia’s largest tropical flood pulse with a flow-
reversal system that supports one of the world’s largest freshwater fisheries. However, among the
world’s tropical floodplains, the resources of the TSRL have received little ecological research. Here,
we described the spatiotemporal TSRL fish diversity and community variation using daily records from
2012 to 2015 on fish abundance from six sites covering the TSRL system. We found that high fish
diversity occurred in sites located in the middle of Tonle Sap Lake, and the lowest diversity was
observed in the southern section. The spatial abundance distribution patterns displayed a river-lake
gradient, with three fish assemblages that were clustered based on their composition similarities and
were characterised by 96 indicator species. In the southern section, fish assemblages were characterised
by longitudinal migratory fishes; in contrast, in the middle system, fish assemblages were represented
by species with combined ecological attributes (i.e., longitudinal and lateral migratory species and
floodplain residents). Towards the northern section, fish assemblages were composed of lateral
migratory and floodplain resident species. Species richness and abundance peaked at approximately 2-
2.5 and 4 months, respectively, after the peak flow in early October, during which Tonle Sap River
resumes its normal flow direction (outflow). This suggests that seasonal flood pulses (i.e., rising and
falling water levels) play a pivotal role in structuring spatiotemporal variation in the TSRL fish
assemblages. Our study has implications for fisheries monitoring and conservation initiatives.
Keywords: fish richness, distribution pattern, ordination, rarefaction, cross-correlation, Tonle Sap,
Lower Mekong Basin.
95

3
1 | INTRODUCTION
The hydrology of the Mekong River is characterised by its extreme predictability, with regular
wet and dry seasons throughout the basin (Adamson et al., 2009). The hydrology is controlled by the
tropical monsoonal climate and flood runoff from the snowmelt in the Tibetan plateau as well as by its
tributaries that converge and accumulate into a single large wet-seasonal peak flow (MRC, 2005;
Adamson et al., 2009). The biological systems of the river basin have both developed in and adapted to
these tropical flood-pulse environments, and the Mekong’s predictable seasonal flood pulses are indeed
a key ecological driver that supports one of the most biodiverse and productive inland fisheries in the
world (Rainboth, 1996; Poulsen et al., 2002; MRC, 2003, 2010).
This study focuses on the Tonle Sap River and Lake (TSRL), which is a key part of the
Mekong’s hydrological system (MRC, 2005; Adamson et al., 2009). The TSRL is a unique tropical
flood pulse with a flow-reversal system that creates the only and largest continuous areas of natural
wetlands in the Mekong Basin and Southeast Asia (van Zalinge et al., 2004). It was designated a World
Biosphere Reserve under the United Nations Educational, Scientific and Cultural Organization
(UNESCO) in 1997 (Davidson, 2006). Two Ramsar wetlands of international importance were also
designated in the TSRL: Boeng Chhmar in 1999 and Prek Toal in 2015 (The Ramsar Convention
Secretariat, 2014).
The TSRL supports highly diverse communities of birds, reptiles, plants and mammals
(Campbell et al., 2006) and is home to one of the world’s largest inland fisheries (Baran, 2005; Baran
et al., 2013). The TSRL contributes ~70% to Cambodia’s annual production of inland capture fisheries
totalling 767,000 tonnes (FiA, 2013; Hortle & Bamrungrach, 2015). The TSRL hosts ~296 fish species,
making it the third richest lake in terms of fish diversity after Lake Malawi and Lake Tanganyika
(Baran, Starr, & Kura, 2007; Baran et al., 2013). Such high diversity makes it different from the lake
and stream ecosystems in temperate and high-latitude regions, which are often less diverse and highly
impacted by humans. Among other drivers such as accessible vegetation and high rates of nutrient
cycling, the predictable and extensive seasonal flood-pulse cycles of the Mekong and TSRL system and
its biogeography mainly explain the high fish stock diversity and productivity (Rainboth, 1996; Baran,
van Zalinge, & Ngor, 2001; van Zalinge et al., 2003).
Despite being highly productive, the Mekong system, including the Tonle Sap, has received
little ecological research on many aspects of its resources and ecology, including fish, reptiles,
invertebrates and primary producers (Dudgeon, 2000, 2003; Sabo et al., 2017). Arguably, the TSRL,
among the world’s tropical floodplains, has been studied the least in terms of its hydrology-ecology
interactions (Junk et al., 2006; Matti Kummu et al., 2006; Arias et al., 2013). The primary research
conducted on fisheries has been very spotty and has mainly focused on biological assessments, e.g.,
Lamberts (2001), Enomoto et al. (2011) and Halls, Paxton, et al. (2013), or on broad-scale migration
patterns, e.g., Poulsen et al., 2002, 2004. Few studies have been conducted on the fish community
96

4
ecology in the TSRL, including Lim et al. (1999) who studied the spatial fish diversity and community
patterns; additionally, the most recent study was on the determinants of species composition (i.e., beta
diversity) (Kong et al., 2017).
Therefore, to better monitor, manage and conserve the TSRL fisheries, there is an urgent need
to update the information on the spatial and temporal fish diversity, community structure and
distribution patterns, especially given the growing population, hydropower dam development, climate
change, decreasing flooded forest cover, and indiscriminate fishing effects that have taken place in the
Mekong Basin including the Tonle Sap system during recent decades. For example, dams on the
Mekong in China reduced the rising and falling flood-pulse rates by 23 and 11%, respectively, at the
Tonle Sap (Cochrane, Arias, & Piman, 2014). This affects fish distribution patterns and their
reproductive success, as natural flood pulses are a key environmental determinant in tropical freshwater
systems and trigger fish migrations, colonisation of unoccupied niches and successful dispersal for
spawning, rearing and refugia (Baran, 2006; Henriques-Silva, Lindo, & Peres-Neto, 2013; Sabo et al.,
2017; Ngor et al., 2018). The flooded forests around Tonle Sap Lake were forecasted to decline by
5,000 ha (1.1%) in an average year and up to 23,000 ha (5.3%) in a dry year due to ongoing water
developments (i.e., hydropower, irrigation, water supply and flood protection) over the next 20 years
(MRC, 2011a). The indiscriminate fisheries in the TSRL modify the structure of the fish community,
leading to depleted species diversity, that seemingly put them at high risk of being severely affected by
these environmental changes (McCann et al., 2016). Such indiscriminate fishing effects may be due to
a variety of fishing gears e.g., some 150 fishing gears have been documented in Cambodia (Deap,
Degen, & van Zalinge, 2003). These fishing gears range from commercial and rather non-selective
fishing gears i.e., the century-old stationary trawl bagnet fishery and the barrage or fishing lot fishery
(abolished since 2012) to artisanal fishing gears such as gillnets, traps, cast nets, hooks and lines,
scooping devices, seine nets, covering devices, push nets, lift nets, bag nets etc. Generally, these fishing
gears target different fish species across sizes and trophic positions in the TSRL.
Hence, this study contributes to the call in the research literature for studies on fish community
ecology and establishes baseline data and information about the spatiotemporal patterns in species
diversity and community composition, which better inform fisheries management and conservation
objectives in one of the world’s largest tropical flood-pulse systems. The aims of this study were to (i)
describe spatiotemporal patterns in the diversity and composition of fish assemblages in the complex
TSRL system, (ii) identify indicator species of different fish assemblages observed along the TSRL
gradients and (iii) explore the spatial and temporal variation in species abundance and richness in
relation to hydrological regimes. For this investigation, we used daily time-series data from 2012 to
2015 on fish abundance from six sites and water levels from two sites; this selection represented the
different geographical gradients along the TSRL system.
97

5
2 | MATERIALS AND METHODS
2.1 | Study area
Fig. 1. Location of sampling sites along Tonle Sap Lake and River.
The Tonle Sap catchment covers an area of 85,790 km2, or 11% of the Mekong Basin (MRC,
2003). The floodplain-lake is located at the apex of the Tonle Sap River approximately 130 km to the
northwest of its junction with the Mekong River (Halls, Paxton, et al., 2013). Waters for the TSRL
system originate mainly from the Mekong River (54%), while the lake tributaries contribute 34%, and
the rest generates from precipitation (M. Kummu et al., 2014). During the wet season (i.e., June-
October), the Tonle Sap Lake expands its mean surface area from ~3,500 to ~14,500 km2, inundating
huge floodplain areas surrounding the TSRL, with maximum depths in the lake recorded at 6 to 9 metres
from late September to early October and minimum depths of approximately 0.5 metres in late April
98
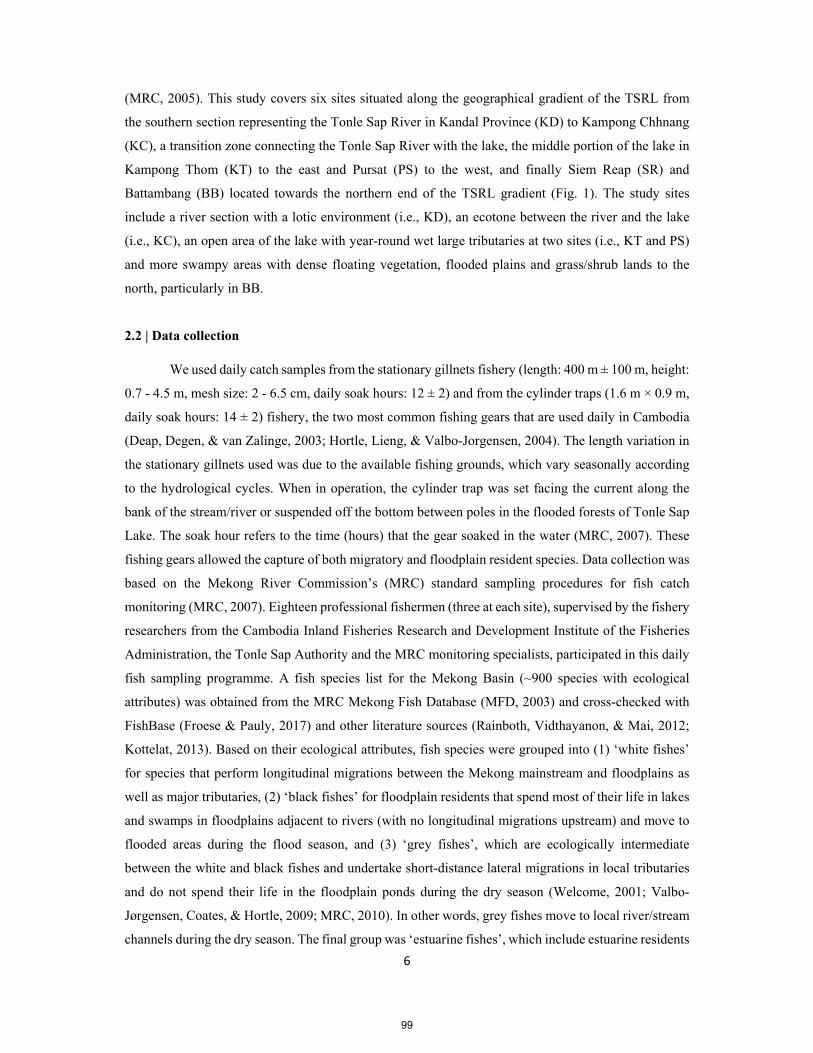
6
(MRC, 2005). This study covers six sites situated along the geographical gradient of the TSRL from
the southern section representing the Tonle Sap River in Kandal Province (KD) to Kampong Chhnang
(KC), a transition zone connecting the Tonle Sap River with the lake, the middle portion of the lake in
Kampong Thom (KT) to the east and Pursat (PS) to the west, and finally Siem Reap (SR) and
Battambang (BB) located towards the northern end of the TSRL gradient (Fig. 1). The study sites
include a river section with a lotic environment (i.e., KD), an ecotone between the river and the lake
(i.e., KC), an open area of the lake with year-round wet large tributaries at two sites (i.e., KT and PS)
and more swampy areas with dense floating vegetation, flooded plains and grass/shrub lands to the
north, particularly in BB.
2.2 | Data collection
We used daily catch samples from the stationary gillnets fishery (length: 400 m ± 100 m, height:
0.7 - 4.5 m, mesh size: 2 - 6.5 cm, daily soak hours: 12 ± 2) and from the cylinder traps (1.6 m × 0.9 m,
daily soak hours: 14 ± 2) fishery, the two most common fishing gears that are used daily in Cambodia
(Deap, Degen, & van Zalinge, 2003; Hortle, Lieng, & Valbo-Jorgensen, 2004). The length variation in
the stationary gillnets used was due to the available fishing grounds, which vary seasonally according
to the hydrological cycles. When in operation, the cylinder trap was set facing the current along the
bank of the stream/river or suspended off the bottom between poles in the flooded forests of Tonle Sap
Lake. The soak hour refers to the time (hours) that the gear soaked in the water (MRC, 2007). These
fishing gears allowed the capture of both migratory and floodplain resident species. Data collection was
based on the Mekong River Commission’s (MRC) standard sampling procedures for fish catch
monitoring (MRC, 2007). Eighteen professional fishermen (three at each site), supervised by the fishery
researchers from the Cambodia Inland Fisheries Research and Development Institute of the Fisheries
Administration, the Tonle Sap Authority and the MRC monitoring specialists, participated in this daily
fish sampling programme. A fish species list for the Mekong Basin (~900 species with ecological
attributes) was obtained from the MRC Mekong Fish Database (MFD, 2003) and cross-checked with
FishBase (Froese & Pauly, 2017) and other literature sources (Rainboth, Vidthayanon, & Mai, 2012;
Kottelat, 2013). Based on their ecological attributes, fish species were grouped into (1) ‘white fishes’
for species that perform longitudinal migrations between the Mekong mainstream and floodplains as
well as major tributaries, (2) ‘black fishes’ for floodplain residents that spend most of their life in lakes
and swamps in floodplains adjacent to rivers (with no longitudinal migrations upstream) and move to
flooded areas during the flood season, and (3) ‘grey fishes’, which are ecologically intermediate
between the white and black fishes and undertake short-distance lateral migrations in local tributaries
and do not spend their life in the floodplain ponds during the dry season (Welcome, 2001; Valbo-
Jørgensen, Coates, & Hortle, 2009; MRC, 2010). In other words, grey fishes move to local river/stream
channels during the dry season. The final group was ‘estuarine fishes’, which include estuarine residents
99

7
and marine visitors. Sampled fish were identified to the species level and counted. Fish particularly
those that were entangled in the gillnets were dead, and fishermen often consumed or sold them for
other consumers. After field verification, field collected data were recorded into the national fish
monitoring databases and were quarterly cleaned and synchronised by the responsible researchers with
the help of the MRC database expert and fisheries monitoring specialists. Daily water levels at two
sites: the Tonle Sap River in Kandal (latitude: 11.81329, longitude: 104.8041) and the Tonle Sap Lake
in Pursat (latitude: 12.57662, longitude: 104.20779) were registered by the MRC.
2.3 | Statistical analysis
Prior to analysis, daily fish samples were computed as daily mean samples from three fishermen
and then aggregated into weekly fish richness and abundance data by species over the study period that
lasted from 1 January 2012 to 31 December 2015 (i.e., 209 weeks) at each site. Likewise, daily water
levels in both locations (the Tonle Sap River at KD and the lake at PS) were computed into weekly
mean water levels for the same 209 weeks. All data analyses were performed in R (R Core Team, 2015).
Species diversity
Rarefaction curves were constructed to describe variation in cumulative species richness among
sites. The rarefaction technique is an important diagnostic tool that considers randomised richness
against sampling intensity and is based on resampling with replacement so that the variance among
randomisations remains meaningful for large numbers of sampling units or individuals (Rossi, 2011).
To implement the rarefaction procedures, the ‘rarc’ function (with 999 randomisations) from the ‘rich’
package (Rossi, 2011) was used on the fish community matrix in each of the six study sites. Afterwards,
the significance of differences in species richness among sites was tested by randomisation (n random
= 999) using the ‘c2cv’ function from the ‘rich’ package (Rossi, 2011).
Furthermore, weekly inverse Simpson indices were also computed to describe the weekly
biological site diversity along the TSRL. The Simpson diversity index (D) was computed using the
equation: D = ∑(n/N)2, where n = the total number of organisms of a species, and N = the total number
of organisms of all species. The inverse Simpson diversity index is 1/D. The inverse Simpson index is
a meaningful and robust diversity index that captures the variance in the distribution of species
abundance (Magurran, 2004). Finally, non-parametric pairwise Wilcoxon tests were performed to
compare diversity indices among the sites.
Spatiotemporal variation in fish assemblages
Nonmetric multidimensional scaling (NMDS), an unconstrained ordination method, was
performed to describe the spatial, intra- and inter-annual variation in the TSRL fish community. NMDS
100

8
with two and three dimensions were computed separately for the spatial, seasonal and inter-annual
variation to examine the variability in the community data. Since three-dimensional NMDS analysis
revealed similar patterns, we therefore present results in two dimensions only (but see Supplementary
Information [S1] for the three-dimensional analysis). First, NMDS was used to visualise the spatial
abundance distribution patterns among sites along the TSRL gradients. Afterwards, Ward hierarchical
clustering was computed to classify fish sites into different assemblages based on their similarities in
species composition (Murtagh & Legendre 2014). Next, we performed permutation tests (999
permutations) to identify indicator species of each assemblage cluster using the ‘multipatt’ function
from the ‘indicspecies’ package to describe the spatial differences in each of those identified assemblage
clusters (Dufrence & Legendre, 1997; Miquel De Cáceres & Legendre, 2009; M. De Cáceres & Jansen,
2011). Indicator species were also assessed for each season (defined below) to identify the species that
characterised the seasonal fish assemblages in each identified cluster.
In addition, NMDS was performed to graphically display intra- (i.e., seasonal) and inter-annual
changes in the species abundances of the entire system. For intra-annual variation, three seasons were
defined based on the 10-year mean intra-annual variation in the daily water levels of the lake, i.e., inflow
or high-flow period (July-October), outflow period (November-February) and low-flow period (March-
June) (S2). The partitioning of the three seasons reflects the importance of the TSRL flood-pulse system
with the seasonal rising and falling flow regimes that influence the variation in the fish community
structure (Poulsen et al., 2002; Baran, 2006).
NMDS was performed on the community abundance matrix using the ‘metaMDS’ function of
the ‘vegan’ package with the Bray-Curtis dissimilarity index in R (Borcard, Gillet, & Legendre, 2011).
We then performed permutational multivariate analysis of variance (PERMANOVA) using the ‘adonis’
function of the ‘vegan’ package (with 999 permutations and the Bray method) to test the influence of
different factors (e.g., cluster, season and year) on the composition of the fish community. Afterwards,
contrast methods were applied to test the pairwise differences between different levels in each of these
factors using the ‘pairwise.adonis’ function in R.
Temporal variation in fish abundance and richness in relation to hydrology
Given that hydrology is a key driver that influences the temporal variation in the TSRL fish
communities, the temporal changes between weekly species abundance and richness at each site in
relation to water levels in Tonle Sap Lake were investigated. Non-parametric Spearman’s correlation
tests were computed for each site to test the link between the two variables. Further, cross-correlation
functions (CCF) were performed between both abundance and richness and water levels to describe the
relationship between each of the two series. Since water level data were available at the two sites in the
Tonle Sap River (Kandal) and Tonle Sap Lake (Pursat), we used fish data from these two sites for the
CCF analysis to assess fish community responses to changes in site hydrology. CCF determines which
101

9
lags (h) of the time series, i.e., xt, predicts the value of series yt and the correlation between the series
xt+h and yt for h = 0 is: ± 1, ± 2, ± 3, etc. (Shumway & Stoffer, 2011). Here, xt (the predictor) and yt were
the site water levels and the site species abundance or richness, respectively. The time lags (h in weeks)
represented the responses of the fish community to the hydrological variation and were derived from
the maximum value of the CCF coefficients. If the time lag h is negative (i.e., the left side of the plot),
there is a correlation between the x-series at a time before t and the y-series at time t (or, to put it simply,
x leads y). In contrast, if the time lag h is positive (i.e., the right side of the plot), it is said that x lags y
(Shumway & Stoffer, 2011). Prior to CCF analyses, the time-series data were tested for stationarity at
both sites for both fish and water levels, and no significant linear temporal trend was detected for all
data series.
3 | RESULTS
3.1 | Fish community structure
Over the four-year monitoring period, 204 fish species were recorded in all catch samples. The
species comprised 114 genera, 38 families and 13 orders. The three main orders represented 87% of the
total species count and included Cypriniformes (100 species), Siluriformes (48) and Perciformes (29).
Clupeiformes, Osteoglossiformes and Synbranchiformes each contained five species, and the rest
contributed less than 6% to the total species counts. At the family level, the top five families that
accounted for 60% of the total species counts included Cyprinidae (80), Bagridae (12), Pangasiidae
(11), Cobitidae (10) and Siluridae (10), while each of the other 33 families comprised one to six species.
At the species level, ~62% of catches were dominated by 12 fish species, namely, Henicorhynchus
lobatus (11%), H. siamensis (10%), Trichopodus trichopterus (7%), Puntioplites proctozysron (7%),
Osteochilus vittatus (6%), Trichopodus microlepis (5%), Labiobarbus lineatus (4%), Paralaubuca
typus (3%), Mystus mysticetus (3%), Notopterus notopterus (3%) and Rasbora tornieri (3%).
Ecologically, longitudinal migratory species (i.e., white fishes) accounted for ~58% of total abundance,
while floodplain resident black and lateral-migrant grey fishes contributed 19% and 21%, respectively.
The rest (1%) were composed of estuarine species and marine visitors.
Among the six survey sites, the highest species richness was observed in the middle section of
the lake in KT, while the lowest richness occurred in the northern part in BB (Fig. 2a). Similar richness
values were observed in KD, KC and SR. Additionally, the richness in PS was comparable with that of
KD and SR. In addition, the lowest abundance was observed in KD, while the highest abundance was
reported in KT (S3). Likewise, the highest diversity index occurred in the middle part of the lake in PS
and KT, while the lowest diversity index was observed in the river section in KD (Fig. 2b). The diversity
index in KC was similar to that in BB.
102

10
Fig. 2. Spatiotemporal comparison of site fish species richness and diversity in the TSRL: (a) site
rarefaction curves on species richness; (b) site inverse Simpson diversity index with south-north
gradient along the TSRL. Sites with a common letter are not significantly different at p = 0.05. Site
codes are the same as those in Fig. 1.
3.2 | Spatiotemporal variation
Hierarchical clustering with the Ward agglomerative method enabled the classification of all
weekly samples into three clusters (Fig. 3a) based on species composition similarities. The first split of
the dendrogram defined fish assemblages in riverine (cluster 1) and lacustrine environments (cluster 2
and cluster 3), while the second split separated the two main assemblages (clusters 2 and 3) in the middle
and northern sections of the lake. The first cluster (159 samples) was mainly associated with samples
from KD. The second, i.e., the largest cluster (613 samples), mainly grouped samples from KC, KT, PS
and SR, and the third cluster (456 samples) was related to samples from BB. Based on the system’s fish
community composition, KD (in the southernmost section of the system) was opposed to the other sites
along the first axis of the NMDS; in contrast, the second axis mainly opposed BB (in the northern part
of the lake) to the other sites (Fig. 3b).
PERMANOVA on the community composition among clusters indicated significant (p =
0.001) differences (S4.1), and the contrast pairwise tests of the assemblages between clusters showed
statistical significance at the p-adjusted value = 0.003 for all pairs (S4.2). Wilcoxon tests on the NMDS
site scores of the clusters revealed significant differences (p < 0.001) between cluster 1 and cluster 2
and between cluster 1 and cluster 3 on axis 1 as well as between cluster 1 and cluster 3 and between
103

11
cluster 2 and cluster 3 on axis 2. For details on the use of NMDS scores to compare the three clusters,
see S4.3.
Fig. 3. NMDS biplot of the weekly fish abundance samples (with Bray-Curtis dissimilarity matrix),
showing the TSRL community spatiotemporal variation. Dots on the biplots represent samples. (a)
Ward hierarchical clustering dendrogram of the weekly samples showing 3 distinct clusters; (b) spatial
distribution patterns of sites along the TSRL gradient grouped into three clusters; (c) seasonal variation,
categorised into three seasons: I, O, L, respectively symbolising inflow (or high-flow periods) (July-
October), outflow (November-February) and low flow (March-June); (d) inter-annual variation among
years (2012-2015). Names are abbreviations of fish species names. Site codes are the same as those in
Fig. 1. For fish species details, see S9.
104

12
Seasons related to the inflow (I), outflow (O) and low-flow (L) periods appeared to significantly
influence the variation in the TSRL fish communities (Fig. 3c). PERMANOVA and contrast pairwise
tests indicated significant differences among seasons, with p = 0.001 (S4.4), and between seasons, with
a p-adjusted value = 0.003, for all pairwise comparisons (S4.5). Wilcoxon tests on the NMDS site scores
revealed significant differences between I and L on axis 1 (p = 0.044) and between O and I (p = 0.004)
as well as between I and L (p = 0.008) on axis 2. For details on using the NMDS scores to compare the
three seasons, see S4.6. Generally, high abundance and richness occurred during the outflow period,
and lowest abundance and richness were observed during the inflow for all sites except for BB, where
richness was high during the inflow period (S4.7). Seasonal patterns were also revealed in the axis 3 of
the three-dimensional NMDS (S1).
Significant changes in fish communities were also observed over the four-year period (Fig. 3d)
based on the PERMANOVA test among years, p = 0.001 (S4.8), and contrast pairwise tests between
years, p-adjusted value = 0.006 for all pairwise comparisons (S4.9). Significant changes were mainly
observed towards negative values along the NMDS axis 2. Wilcoxon tests showed that 2012
significantly differed from other years along axis 1 (p < 0.001); however, along axis 2, the differences
between all pairs of years were significant at p < 0.001 (S4.10). Overall, weekly abundance showed
some fluctuations, with no clear trends over the four-year period for all sites; however, decreasing trends
were observed for the weekly richness in the middle part of the lake (i.e., KC, PS, KT, SR) (S4.11).
3.3 | Indicator species by cluster
Overall, 96 indicator species were identified from the three assemblage clusters (S5). The
largest number was observed in cluster 2 (45 species), while the lowest number was detected in cluster
1 (20). Key indicator species with high indicator values that characterised cluster 1 in the southern river
section belonged to Pangasiidae (river catfishes), such as Pangasius macronema, P. conchophilus and
P. bocourti; Cyprinidae (cyprinids), such as Labiobarbus siamensis, Puntioplites falcifer, Paralaubuca
typus, and P. riveroi; Siluridae (sheatfishes), such as Phalacronotus bleekeri and Belodontichthys
truncatus; and Cobitidae (loaches), including Yasuhikotakia caudipunctata. Interestingly, Cyprinus
carpio, an exotic species, was also identified in this cluster.
Key indicator species representing cluster 2 in the middle lake were those of Bagridae (Bagrid
catfishes), such as Mystus mysticetus and M. singaringan (floodplain spawners); Cyprinidae (white/grey
fishes), including Labiobarbus lineatus, Osteochilus vittatus, Labeo chrysophekadion, Thynnichthys
thynnoides and Henicorhynchus siamensis; Anabantidae (climbing perches), i.e., Anabas testudineus
(floodplain resident); Pristolepididae (leaffish), i.e., Pristolepis fasciata (floodplain spawner);
Ambassidae (asiatic glassfish), i.e., Parambassis wolffii (floodplain spawner); Cobitidae, i.e.,
Yasuhikotakia modesta (main channel spawner); Mastacembelidae (spiny eels), i.e., Macrognathus
105

13
siamensis (floodplain resident); and Osphronemidae (gouramies), such as Trichopodus trichopterus
(floodplain resident).
The main species that were indicative of cluster 3 in the northern part of the lake included
Notopteridae (featherbacks), i.e., Notopterus notopterus; Bagridae, i.e., Hemibagrus spilopterus;
Osphronemidae, i.e., Trichopodus microlepis and T. pectoralis; Cyprinidae, i.e., Barbonymus
gonionotus and Hampala macrolepidota; Channidae (airbreathing snakeheads), i.e., Channa striata;
Siluridae, i.e., Ompok bimaculatus, Eleotridae (sleepers), i.e., Oxyeleotris marmorata; Clariidae
(airbreathing catfishes), i.e., Clarias microcephalus, C. meladerma and C. batrachus; and
Tetraodontidae (puffers), i.e., Pao leiurus.
Seasonally, key indicator species that matched with those belonging to cluster 1 included five
species (25%) for the outflow and two species (10%) for the low-flow, while no species were identified
for the inflow period. In cluster 2, 21 species (47%) were identified during the outflow, five species
(11%) were identified during the inflow and three species (6%) were identified during the low-flow
period. Finally, for cluster 3, 10 species (32%) were identified for the low-flow, while four species
(13%) were identified for the inflow and three species (10%) were identified for the outflow. For details
of indicator species by cluster and season, see S5.
3.4 | Species relative abundance by cluster
Overall, 114 species were reported in cluster 1, 182 were reported in cluster 2 and 154 in cluster
3. The ten most abundant species for each assemblage cluster accounted for ~97% in cluster 1, ~58%
in cluster 2 and ~65% in cluster 3 (Fig. 4a). Interestingly, two small-sized cyprinids, Henicorhynchus
lobatus (Hlob) and H. siamensis (Hsia) comprised ~45% of the total abundance in cluster 1 but
accounted for only ~19% and ~16% in cluster 2 and cluster 3, respectively. Further, of the top ten
species, only five species (~84%) dominated the catch in cluster 1; in contrast, in clusters 2 and 3, the
ten dominant species shared the catch more proportionately between 3 and 10%. Puntioplites
proctozysron (Ppro) was found among the top ten species for all clusters. Ecologically, catches in cluster
1 were composed of ~96% of migratory white fishes, and this value decreased gradually to ~57% and
~52% in cluster 2 and cluster 3, respectively (Fig. 4b).
106
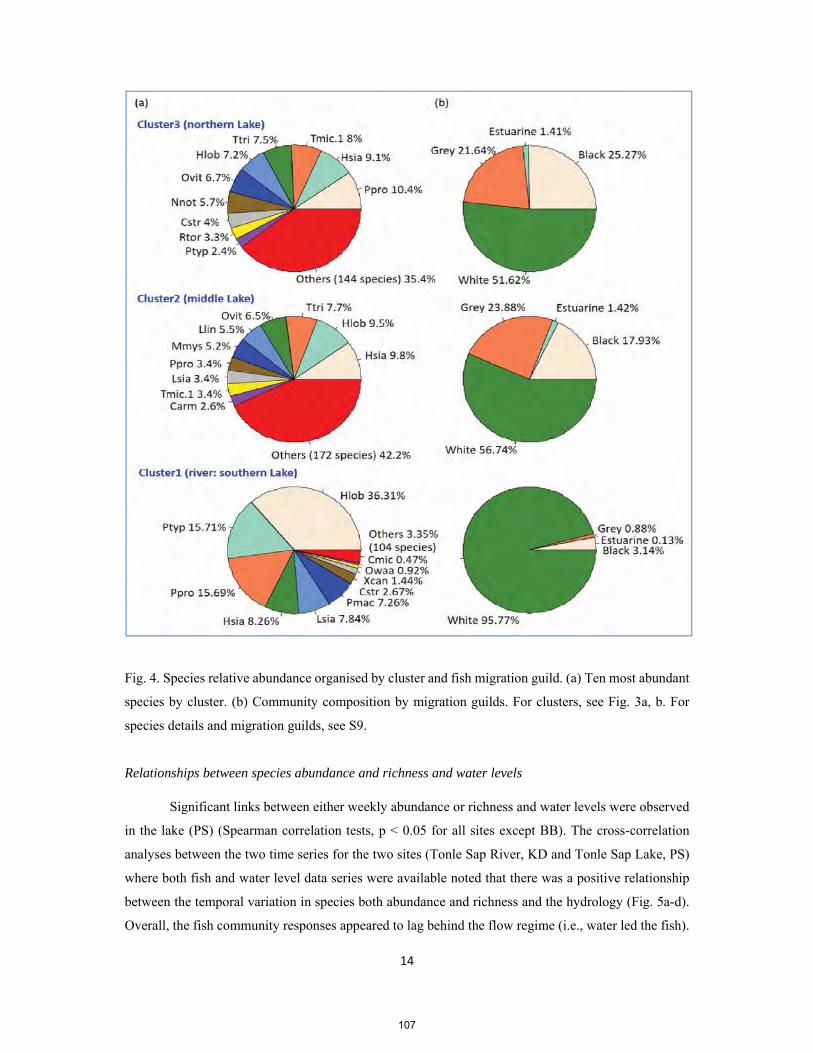
14
Fig. 4. Species relative abundance organised by cluster and fish migration guild. (a) Ten most abundant
species by cluster. (b) Community composition by migration guilds. For clusters, see Fig. 3a, b. For
species details and migration guilds, see S9.
Relationships between species abundance and richness and water levels
Significant links between either weekly abundance or richness and water levels were observed
in the lake (PS) (Spearman correlation tests, p < 0.05 for all sites except BB). The cross-correlation
analyses between the two time series for the two sites (Tonle Sap River, KD and Tonle Sap Lake, PS)
where both fish and water level data series were available noted that there was a positive relationship
between the temporal variation in species both abundance and richness and the hydrology (Fig. 5a-d).
Overall, the fish community responses appeared to lag behind the flow regime (i.e., water led the fish).
107

15
The correlation lag for fish abundance versus water levels at the maximum coefficient was estimated at
-15 weeks in KD and -16 weeks in PS (Fig. 5a, b); in contrast, the correlation lag for species richness
versus water level was estimated at -8 weeks in KD and -10 weeks in PS. It is noteworthy that the time
lag between the water levels in the Tonle Sap River (KD) and those of the lake (PS) was estimated at
about -2 weeks (S6). Therefore, it was consistently observed that peak abundance and richness began
one to two weeks earlier in the lake than in the Tonle Sap River. Additional investigations on the cross-
correlation between weekly abundance and richness of sites around the lake using water levels from PS
are provided in S7 and S8. For a full species list by genera, families and orders as well as key ecological
attributes used in this study, see S9.
Fig. 5. Relationships between water level and (a-b) fish abundance and (c-d) species richness in the
TSRL. In cross-correlation plots, the dotted blue lines provide the values beyond which the correlations
are significantly different from zero. The x-axis is the number of weeks for the period from 1 January
2012 to 31 December 2015.
108

16
4 | DISCUSSION
Overall, we found that the TSRL fish community structure varied through space and time. High
species richness, abundance and diversity indices occurred in the middle system of the lake (i.e., KT,
PS), while the lowest richness and diversity occurred in the river section (i.e., KD). The spatial
distribution pattern in fish abundance displayed the river-lake gradient and differentiated the fish
assemblages among the southern, the middle and the northern sections of the system. In the southern
section, the fish assemblages were characterised mainly by longitudinal migratory white fishes, while
in the middle system, the assemblages were represented by species with combined ecological attributes
(i.e., white, black and grey fishes). Towards the northern part of the system, the fish assemblages were
mainly composed of black and grey fishes. Seasonal flood pulses, such as rising and falling water levels,
played pivotal roles in influencing spatial and temporal variation in the TSRL fish community structure.
4.1 | Richness and diversity
High species richness and diversity in the middle section of the lake (KT, PS) were likely
because this section was deeper and larger in terms of water depth and surface cover than were other
sections within the system. A bathymetric map of the Tonle Sap Lake reveals a general downward slope
towards the middle section from both the southern section (KC) and the northern section in BB
(Campbell et al., 2006). In addition, the middle section had a higher degree of inundation throughout
the year, which was associated with at least three large tributary rivers of the Tonle Sap basin, namely,
the Sen River of KT, with a lower reach drainage within 230 km2 of the lake; the Chinit River of KT,
with a total drainage area of 5,649 km; and the Pursat River of PS, with a catchment area of 5,965 km2
(CGIAR, 2013; Nagumo, Sugai, & Kubo, 2013, 2015). The high degree of inundation, combined with
greater depths, tended to increase habitat connectivity and availability, which created more living space
and a more stable environment. This gives fish species a colonising advantage, which drives greater
richness and diversity (Henriques-Silva, Lindo, & Peres-Neto, 2013). For example, Boeng Chhmar and
its associated rivers and floodplains, which cover an area of 280 km2 in the middle section of the lake
in KT, were described as near-natural wetlands, encompassing permanent open water surrounded by a
creek system; furthermore, the area was designated a RAMSAR wetland of global significance in 1999
(The Ramsar Convention Secretariat, 2014). In other tropical river-lake floodplain systems, water depth
and surface cover are the two most significant variables that were found to explain higher species
abundance and richness, e.g., in the Venezuelan Cinaruco River (Rodríguez & Lewis, 1997; Hoeinghaus
et al., 2003) and the Brazilian Pantanal River (Fernandes, Machado, & Penha, 2010). Similarly, local
features such as sites with permanent channel connection and water surface connectivity were also
identified to positively influence local species richness in Artic lakes. Sites with these attributes were
109
17
found to harbour both restricted and widespread species (Laske et al., 2016). Fish populations in these
sites are likely to be sustained by immigration from adjacent habitats (Brown & Kodric-Brown, 1977).
In contrast, relatively lower richness and diversity values were found in the southern (KD, KC)
and northern sites (SR, BB), where total species richness among these sites were similar. This was
because sites in the southern part were representative of riverine habitat, mainly serving as a natural
fish passageway for migratory species that seasonally migrate between the lake and the Mekong River
to complete their life cycle (Poulsen et al., 2002, 2004; Halls, Paxton, et al., 2013). This site is laterally
connected to the surrounding floodplains only partly during the high-flow period and becomes
disconnected during most parts of the year (Valbo-Jørgensen, Coates, & Hortle, 2009). Similarly, sites
in the northern section have fewer connections with large and permanent wet tributary rivers, and the
main land-use types of the location are rice farming, herbaceous floating vegetation and dense mats of
water hyacinths as well as seasonal flooded grasslands (Hortle, Troeung, & Lieng, 2008; MRC, 2011b,
pp. 64–65). Such habitats strictly favour mainly black and some grey fishes that are capable of tolerating
anoxic conditions (Welcome, 2001; Aloo, 2003).
4.2 | Spatial variation
We found that fish fauna within the TSRL were distributed along the south-north gradient,
classifying the entire community into three assemblage clusters. The characteristic species in cluster 1
of the southern section were mainly restricted to migratory (riverine) white fishes, such as river
catfishes, cyprinids, loaches and sheatfishes. These white fishes are generally intolerant to anoxia,
preferring migration as a means to escape adverse environmental conditions during the dry season
(Welcome 2001). Well-oxygenated water, such as the lotic main river channel and deep pools, are
generally required for these species to shelter during the dry season (Halls, Conlan, et al., 2013). In
addition, the distribution of white fishes in this cluster was part of the seasonal migration conducted to
complete their life cycles, i.e., accessing the Tonle Sap floodplains for rearing and feeding and returning
to the Mekong mainstream for dry season refugia and spawning sites during the early flooding cycle
(Dudgeon, 2000; Poulsen et al., 2002, 2004; Baran, 2006; Kong et al., 2017).
Cluster 2 in the middle section of the lake was characterised by both restricted and widespread
species, including small bagrid catfishes (Mystus spp.), cyprinids, glassfishes, leaf fishes, climbing
gouramies and spiny eels. Overall, this cluster was represented by a high number of indicator species
with different ecological attributes, such as longitudinal migratory white fishes, floodplain residents
(i.e., black fishes) and lateral migrants (i.e., grey fishes). This result was likely due to the overall
environmental stability in this section, i.e., deeper water, larger surface cover and habitat connectivity
through the permanent water bodies (i.e., Ramsar Wetlands of Boeng Chhmar) and presence of
permanent wet large tributaries of the Tonle Sap basin.
110

18
Indicator species for cluster 3 in the northern section were mainly restricted to black and grey
fishes, such as gouramies, airbreathing catfishes, sleepers, snakeheads, featherbacks and sheatfishes as
well as a few cyprinid white fishes with general habitat preferences, such as Barbonymus gonionotus
and Hampala macrolepidota. The underlying reason for this result was that the cluster was associated
with the lake’s northern section, which encompasses mostly lentic habitats and poorly oxygenated
waters compared to the open area of the lake (cluster 2), which has effective wind mixing conditions
throughout the water column (van Zalinge et al., 2003). Black and some grey fishes are permanently
found in such oxygen-poor habitats (MRCS, 1992; van Zalinge et al., 2003; Hortle, Troeung, & Lieng,
2008). These fish groups are carnivores or detritivores, and some are able to migrate over land, including
snakeheads, airbreathing catfishes, gouramies and bagrid catfishes, which have developed auxiliary
organs for oxygen uptake from the atmospheric air (MRCS, 1992; Lamberts, 2001). In the Yala Swamp
of Lake Victoria, African catfishes (i.e., black fishes) were also found to flourish in such poorly
oxygenated habitats (Aloo, 2003).
Consistently, we found a very high relative abundance of white fishes in cluster 1 (96%);
however, this proportion gradually decreased along the south-north gradient of the TSRL and was
replaced by grey and black fishes towards cluster 2 and cluster 3 (Fig. 4). The results of this study also
supported previous studies that specifically found high abundances of featherbacks and airbreathing
catfishes in the northern section of the lake (SR, BB) (Lim et al., 1999) as well as snakeheads and
gouramies in BB (Enomoto et al., 2011). In addition, our results showed that three species were
ubiquitously abundant for all the three clusters, namely, Henicorhynchus lobatus (Hlob) and H.
siamensis (Hsia), and Puntioplites proctozysron (Ppro). These species, especially Henicorhynchus
lobatus, are among ecological keystone species with critical roles in food security throughout the Lower
Mekong Basin (LMB); additionally, these species are important prey for predatory species and
Irrawaddy dolphins (Baird, 2011; Fukushima et al., 2014).
4.3 | Temporal variation
In a tropical flood-pulse system such as the Tonle Sap, hydrologic variation is a key ecological
driver that influence the temporal dynamics of fish assemblage structure. We found significant intra-
(seasonal) and inter-annual variation in the TSRL fish communities.
Seasonally, the abundance and richness of the TSRL fish communities were found to be
significantly greater during the outflow period (S4.7). This was due to the seasonal longitudinal
migrations of white fishes from the TSRL to the Mekong mainstream for dry-season refugia (Poulsen
et al., 2002, 2004). Such seasonal migrations are usually predictable with the stationary trawl Dai
fishery, which has operated in the Tonle Sap River for more than a century. The observed peaks often
occur in a time-window of ~7-1 days, particularly before the full moon in December and January (Halls,
Paxton, et al., 2013). Likewise, during this outflow, grey and black fishes also undertake short-distance
111

19
lateral movements from the nearby TSRL seasonal floodplains to the deeper area of Tonle Sap Lake or
the main river channel. Seasonal migrations during the outflow usually drive huge fishing activities in
the TSRL, when the fisheries are opened for all as well as in many parts of the LMB. In contrast, we
found the lowest fish abundance in the TSRL during the inflow when white fishes longitudinally migrate
for spawning in the rapids and deep pools of the Mekong River, and mature fishes, juveniles and larvae
then migrate and drift downstream and invade the surrounding TSRL floodplains for feeding and rearing
(Valbo-Jørgensen, Coates, & Hortle, 2009). The lower abundance during the inflow was likely
attributed to low fish densities, as fish were widely dispersed by seasonal floods to floodplains and
inundated forests surrounding the TSRL, which makes them difficult to capture. Our cross-correlation
analyses noted that the peak abundance and richness (Fig. 5a, c) were respectively related to the peak
flow occurring about four months (-15 weeks in KD and -16 weeks in PS) and 2-2.5 months (-8 weeks
in KD and -10 weeks in PS) earlier. While the peak flow occurs around early October (MRC, 2005;
S2), the peak abundance occurs around January; in contrast, the peak richness occurs in between early
November and mid-December. The period for the peak abundance and richness found from the cross-
correlation analyses corresponded to the defined outflow (falling water levels) period for this study.
Such seasonal patterns were also reported in other tropical river-floodplain fish communities, such as
the Amazonian Juruá River and forest streams (Silvano, Benedito, & Oyakawa, 2000; Espírito-Santo et
al., 2009), Venezuelan rivers (Hoeinghaus et al., 2003) and in French Guiana (Boujard, 1992), where
greater abundance and richness with more species interactions were driven by the falling water levels
(i.e., low flows).
The inter-annual variation in the TSRL fish communities found in this study could be explained
by many reasons; however, the variation in annual flows (such as peak water levels) have been described
as a main factor affecting the TSRL fish communities (Baran, van Zalinge, & Ngor, 2001; van Zalinge
et al., 2003; Halls, Paxton, et al., 2013; Sabo et al., 2017). Our results highlighted that the changes in
the TSRL fish community were significantly linked to hydrology. The annual peak flows in Tonle Sap
Lake were highly contrasted during our study period, i.e., maximum water depths of 9.9 m were
recorded in 2011, while only 7.5 m was observed in 2012, 9.0 m was observed in 2013, 7.3 m was
observed in 2014 and only 5.3 m was observed in 2015. For example, the high flows in 2011 and 2013
may have facilitated fish spawning success, survival and growth, as greater flood levels equated with
higher volumes of water in the TSRL, and thus, larger inundated areas of rearing/feeding habitats were
available for fish. Prey species and juveniles could stay in rearing habitats longer, which increases their
survival rates. Higher flows also mean that more food becomes available and, thereby, competition for
food among fish is reduced. In fact, the highest catch on record over a 17-year monitoring period was
observed in the fishing season of 2011/2012 at the Tonle Sap Dai fishery (Chheng et al., 2012). Our
results also noted that fish communities in 2012 significantly differed from those in other years (S4.10,
NMDS axis 1).
112

20
Flows also constrain fish species with longitudinal and lateral dispersal abilities among habitats,
such as different river reaches and floodplains (Bunn & Arthington, 2002; Franssen et al., 2006). The
significant inter-annual changes (S4.10, NMDS axis 2) found in the study were also due to the presence
of more species from the high gradient river/streams and clear/fast flowing waters in 2012, such as
Clupisoma longianalis (Clorn), Balitora meridionalis (Bmer), Crossocheilus reticulatus (Cret), and
Hemibagrus wyckii (Hwyc), and fewer slowly flowing/lowland river species, such as Parachela
siamensis (Psia) and Hemibagrus filamentus (Hfil); however, towards 2015, there were more species
that preferred lowland rivers and peats habitat, such as Osteogeneiosus militaris (Omil), Osteochilus
microcephalus (Omic), Osphronemus goramy (Ogor), and Tenualosa thibaudeaui (Tthi) and fewer
high-gradient river fishes, such as Discherodontus parvus (Dpar) and Osteochilus waandersii (Owaa).
Human activities, such as on-going water development projects in the Mekong River (Sabo et
al., 2017; Ngor et al., 2018), intensive fishing and farming with the use of pesticides and chemical
fertilisers as well as the clearance of flooded forests in the TSRL, could also influence the inter-annual
changes of the TSRL fish communities, and this topic needs further investigation. In addition, during
the time of the survey, a fisheries policy reform, leading to the abolition of all 35-century-old industrial-
scale fishing lots (see Fig. 1), took effect in 2012. This reform was argued to benefit artisanal
(subsistence) fishers, although the impacts of this reform on the TSRL fish communities deserve further
research.
To conclude, understanding the dynamic nature of spatiotemporal variation and distribution
patterns as well as indicator species in the TSRL fish communities is necessary to inform fisheries
monitoring, management and conservation programmes. For instance, KD is a strategic location for fish
diversity management and conservation initiatives, as “white fishes” must use this natural passageway
to complete their seasonal life cycles between the Mekong River and the Tonle Sap floodplains.
Similarly, the northern lake (BB) could serve as a location for the management and conservation of
black fishes. For fisheries monitoring, the clusters and key indicator species identified in this study can
be proposed for the long-term fish monitoring programmes to understand spatiotemporal changes and
update the status and trends of the TSRL fisheries. The suggested timing of peak abundance and richness
in relation to the peak flows of the TSRL could also be part of fish regulation and conservation
initiatives. Finally, maintaining the naturally predictable seasonal rising and falling flood pulses as well
as the longitudinal and lateral connectivity of the main habitats of the Mekong and its tributary systems,
including the Tonle Sap River, are likely the key drivers to maintaining seasonal fish migrations and,
hence, the TSRL’s seasonal assemblage diversity and productivity. Given that hydropower dams are
still being built in the Mekong, good design flows (Sabo et al., 2017) that would help reduce dam effects
and boost fisheries production, e.g., in the Tonle Sap, should be prioritised and applied as one of the
mitigation measures on existing and planned dams in the Mekong.
113

21
ACKNOWLEDGEMENTS
We are grateful to the Erasmus Plus, the Belmont Forum (TLSCC project) and the European Erasmus+
credit mobility and capacity building CONSEA Programmes for funding our study. Cordial thanks to
the Fisheries Programme of the Mekong River Commission (MRC), the Inland Fisheries Research and
Development Institute (IFReDI) of the Fisheries Administration and the Tonle Sap Authority of
Cambodia for making available the fish monitoring datasets used in this study. We thank the two
anonymous reviewers for their input and constructive advice to improve this manuscript. Sincere thanks
are given to Peter Degen and Peter Starr for commenting on the earlier version of this paper. The EDB
lab is supported by “Investissement d’Avenir” grants (CEBA, ref. ANR-10-LABX-0025; TULIP, ref.
ANR-10-LABX-41).
ADDITIONAL INFORMATION
Conflict of interests: The authors declare no conflict of interests.
Supplementary information: accompanies this paper.
114
22
REFERENCES
Adamson, P. T., Rutherfurd, I. D., Peel, M. C., & Conlan, I. A. 2009. The Hydrology of the Mekong River. In: I. C. Campbell, ed. The Mekong Biophysical Environment of an International River Basin (1st ed.). Elsevier Inc.: Amsterdam, pp. 53–76.
Aloo, P. A. 2003. Biological diversity of the Yala Swamp lakes, with special emphasis on fish species composition, in relation to changes in the Lake Victoria Basin (Kenya): threats and conservation measures. Biodiversity & Conservation, 12: 905–920.
Arias, M. E., Cochrane, T. A., Norton, D., Killeen, T. J., & Khon, P. 2013. The flood pulse as the underlying driver of vegetation in the largest wetland and fishery of the Mekong Basin. Ambio, 42: 864–876.
Baird, I. G. 2011. The Don Sahong Dam. Critical Asian Studies, 43: 211–235.
Baran, E. 2005. Cambodia inland fisheries: facts, figures and context. Phnom Penh, Cambodia: WorldFish Center and Inland Fisheries Research and Development Institute.
Baran, E. 2006. Fish Migration Triggers and Cues in the Lower Mekong Basin and Other Freshwater Tropical Systems. Vientiane: Mekong River Commission.
Baran, E., So, N., Degen, P., Chen, X. Y., & Starr, P. 2013. Updated information on fish and fisheries in the Mekong Basin. Catch and Culture, 19: 24–25.
Baran, E., Starr, P., & Kura, Y. 2007. Influence of built structures on Tonle Sap fisheries. Phnom Penh, Cambodia: Cambodia National Mekong Committee and the WorldFish Center.
Baran, E., van Zalinge, N. P., & Ngor, P. B. 2001. Floods, Floodplains and Fish Production in the Mekong Basin: Present and Past Trends. In: A. Ali, ed. Proceedings of the Second Asian Wetlands Symposium, 27-30 August 2001, Penang, Malaysia. Pulau Pinang, Malaysia: Penerbit Universiti Sains Malaysia.
Borcard, D., Gillet, F., & Legendre, P. 2011. Numerical Ecology with R. (R. Gentleman, K. Hornik, & G. G. Parmigiani, Eds.). New York: Springer Science.
Boujard, T. 1992. Space-time organization of riverine fish communities in French Guiana. Environmental Biology of Fishes, 34: 235–246.
Brown, J. H., & Kodric-Brown, A. 1977. Turnover rates in insular biogeography: effect of immigration on extinction. Ecology, 58: 445–449.
Bunn, S. E., & Arthington, A. H. 2002. Basic principles and ecological consequences of altered flow regimes for aquatic biodiversity. Environmental Management, 30: 492–507.
Cáceres, M. De, & Legendre, P. 2009. Associations between species and groups of sites: indices and statistical inference. Ecology, 90: 3566–3574.
Campbell, I. C., Poole, C., Giesen, W., & Valbo-Jorgensen, J. 2006. Species diversity and ecology of Tonle Sap Great Lake, Cambodia. Aquatic Sciences, 68: 355–373.
CGIAR. 2013. Working paper on population growth and natural resource pressures in Pursat catchment. Vientiane: Australian Aid and CGIAR Challenge Program on Water and Food.
Chheng, P., So, N., Ngor, P. B., & Nao, T. 2012. Record fish catch on Tonle Sap River. Catch and Culture, 18: 4–5.
Cochrane, T. A., Arias, M. E., & Piman, T. 2014. Historical impact of water infrastructure on water levels of the Mekong River and the Tonle Sap system. Hydrology and Earth System Sciences, 18: 4529–4541.
Davidson, P. J. 2006. The biodiversity of the Tonle Sap Biosphere Reserve: 2005 status review. Phnom Penh, Cambodia: UNDP-GEF funded Tonle Sap Conservation Project.
115

23
De Cáceres, M., & Jansen, F. 2011. indicspecies: Functions to assess the strength and significance of relationship of species site group associations. R package version 1.6.0. http://cran.r-project.org/web/packages/indicspecies.
Deap, L., Degen, P., & van Zalinge, N. 2003. Fishing gears of the Cambodian Mekong. Phnom Penh, Cambodia: Inland Fisheries Research and Development Institute of Cambodia & Mekong River Commission.
Dudgeon, D. 2000. The Ecology of Tropical Asian Rivers and Streams in Relation to Biodiversity Conservation. Annual Review of Ecology, Evolution, and Systematics, 31: 195–229.
Dudgeon, D. 2003. The contribution of scientific information to the conservation and management of freshwater biodiversity in tropical Asia. Hydrobiologia, 500: 295–314.
Dufrence, M., & Legendre, P. 1997. Species assemblage and indicator species: the need for a flexible asymmetrical approach. Ecological Monographs, 67: 345–366.
Enomoto, K., Ishikawa, S., Hori, M., S., H., Srun, L. S., Nao, T., & Kurokura, H. 2011. Data mining and stock assessment of fisheries resources in Tonle Sap Lake, Cambodia. Fisheries Science, 77: 713–722.
Espírito-Santo, H. M. V., Magnusson, W. E., Zuanon, J., Mendoça, F. P., & Landeiro, V. L. 2009. Seasonal variation in the composition of fish assemblages in small Amazonian forest streams: Evidence for predictable changes. Freshwater Biology, 54: 536–548.
Fernandes, I. M., Machado, F. A., & Penha, J. 2010. Spatial pattern of a fish assemblage in a seasonal tropical wetland : effects of habitat , herbaceous plant biomass , water depth , and distance from species sources. Neotropical Ichthyology, 8: 289–298.
FiA. 2013. Annual report on fisheries sector 2013 and targets for 2014. Phnom Penh: Fisheries Administration, Ministry of Agriculture, Forestry and Fisheries.
Franssen, N. R., Gido, K. B., Guy, C. S., Tripe, J. A., Shrank, S. J., Strakosh, T. R., Bertrand, K. N., Franssen, C. M., Pitts, K. L., & Paukert, C. P. 2006. Effects of floods on fish assemblages in an intermittent prairie stream. Freshwater Biology, 51: 2072–2086.
Froese, R., & Pauly, D. 2017. FishBase. World Wide Web electronic publication. World Wide Web electronic publication.
Fukushima, M., Jutagate, T., Grudpan, C., Phomikong, P., & Nohara, S. 2014. Potential effects of hydroelectric dam development in the Mekong River basin on the migration of Siamese mud carp (Henicorhynchus siamensis and H. lobatus) elucidated by otolith microchemistry. PLoS ONE, 9: 1–13.
Halls, A. S., Conlan, I., Wisesjindawat, W., Phouthavongs, K., Viravong, S., Chan, S., & Vu, V. A. 2013. Atlas of deep pools in the Lower Mekong River and some of its tributaries. Phnom Penh: Mekong River Commission.
Halls, A. S., Paxton, B. R., Hall, N., Ngor, P. B., Lieng, S., Ngor, P., & So, N. 2013. The Stationary Trawl (Dai) Fishery of the Tonle Sap-Great Lake System, Cambodia. Phnom Penh: Mekong River Commission.
Henriques-Silva, R., Lindo, Z., & Peres-Neto, P. R. 2013. A community of metacommunities : Exploring patterns in species distributions across large geographical areas. Ecology, 94: 627–639.
Hoeinghaus, D. J., Layman, C. ., Arrington, D. A., & Winemiller, K. O. 2003. Spatiotemporal variation in fish assemblage structure in tropical floodplain creeks. Environmental Biology of Fishes, 67: 379–387.
Hortle, K. G., & Bamrungrach, P. 2015. Fisheries Habitat and Yield in the Lower Mekong Basin. MRC Technical Paper No. 47. Phnom Penh: Mekong River Commission.
Hortle, K. G., Lieng, S., & Valbo-Jorgensen, J. 2004. An introduction to Cambodia’s inland fisheries.
116

24
Mekong Development Series No. 4. Phnom Penh: Mekong River Commission.
Hortle, K. G., Troeung, R., & Lieng, S. 2008. Yield and value of the wild fishery of rice fields in Battambang Province, near the Tonle Sap Lake, Cambodia. MRC Technical Paper No.18. Mekong River Commission, Vietiane.62 PP. Vientiane: Mekong River Commission.
Junk, W. J., Brown, M., Campbell, I. C., Finlayson, M., Gopal, B., Ramberg, L., & Warner, B. G. 2006. The comparative biodiversity of seven globally important wetlands: A synthesis. Aquatic Sciences, 68: 400–414.
Kong, H., Chevalier, M., Laffaille, P., & Lek, S. 2017. Spatio-temporal variation of fish taxonomic composition in a South-East Asian flood-pulse system. PLoS ONE, 12: 1–16.
Kottelat, M. 2013. The Fishes of the inland waters of Southeast Asia: A catalogue and core bibliography of the fishes known to occur in freshwaters, mangroves and estuaries. The Raffles Bulletin of Zoology, 27: 1–663.
Kummu, M., Sarkkula, J., Koponen, J., & Nikula, J. 2006. Ecosystem Management of the Tonle Sap Lake: An Integrated Modelling Approach Ecosystem. Water Resources Development, 22: 497–519.
Kummu, M., Tes, S., Yin, S., Adamson, P., Józsa, J., Koponen, J., Richey, J., & Sarkkula, J. 2014. Water balance analysis for the Tonle Sap Lake-floodplain system. Hydrological Processes, 28: 1722–1733.
Lamberts, D. 2001. Tonle Sap fisheries: a case study on floodplain gillnet fisheries. RAP publication. Bangkok: Asia-Pacific Fisheries Commission, Food and Agriculture Organisation of the United Nations, Regional Office for Asia and the Pacific.
Laske, S. M., Haynes, T. B., Rosenberger, A. E., Koch, J. C., Wipfli, M. S., Whitman, M., & Zimmerman, C. E. 2016. Surface water connectivity drives richness and composition of Arctic lake fish assemblages. Freshwater Biology, 2016: 1–15.
Lim, P., Lek, S., Touch, S. T., Mao, S. O., & Chhouk, B. 1999. Diversity and spatial distribution of freshwater fish in Great Lake and Tonle Sap river (Cambodia, Southeast Asia). Aquatic Living Resources, 12: 379–386.
Magurran, A. E. 2004. Measuring biological diversity. Malden, USA: Blackwell Science Ltd.
McCann, K. S., Gellner, G., McMeans, B. C., Deenik, T., Holtgrieve, G., Rooney, N., Hannah, L., Cooperman, M., Nam, S., & Giacomini, H. 2016. Food webs and the sustainability of indiscriminate fisheries. Canadian Journal of Fisheries and Aquatic Sciences, 73: 1–10.
MFD. 2003. Mekong Fish Database: A taxonomic fish database for the Mekong Basin. Phnom Penh: Mekong River Commission.
MRC. 2003. State of the Basin Report 2003. Phnom Penh: Mekong River Commission.
MRC. 2005. Overview of the Hydrology of the Mekong Basin. Vientiane: Mekong River Commission.
MRC. 2007. Monitoring Fish Abundance and Diversity in the Lower Mekong Basin: Methodological Guidelines. Phnom Penh: Mekong River Commission.
MRC. 2010. State of the Basin Report 2010. Vientiane, Lao PDR: Mekong River Commission.
MRC. 2011a. Assessment of Basin-wide Development Scenarios: Cumulative impact assessment of the riparian countries’ water resources development plans, including mainstream dams and diversions (Vol. Basin Deve). Phnom Penh: Mekong River Commission.
MRC. 2011b. Planning Atlas of the Lower Mekong River Basin. Phnom Penh: Mekong River Commission.
MRCS. 1992. Fisheries in the Lower Mekong Basin, Main Report and Annex. (Review of the fishery sector in the lower Mekong basin). Bangkok: Interim Committee for the Coordination of
117

25
Investigations of the Lower Mekong Basin, Mekong River Commission Secretariat.
Murtagh, F., & Legendre, P. 2014. Ward’s hierarchical agglomerative clustering method: Which algorithms implement Ward’s criterion? Journal of Classification, 31: 274–295.
Nagumo, N., Sugai, T., & Kubo, S. 2013. Late Quaternary floodplain development along the Stung Sen River in the Lower Mekong Basin, Cambodia. Geomorphology, 198: 84–95.
Nagumo, N., Sugai, T., & Kubo, S. 2015. Fluvial Geomorphology and Characteristics of Modern Channel Bars in the Lower Stung Sen River, Cambodia. Geographical Review of Japan Series B, 87: 115–121.
Ngor, P. B., Legendre, P., Oberdorff, T., & Lek, S. 2018. Flow alterations by dams shaped fish assemblage dynamics in the complex Mekong-3S river system. Ecological Indicators, 88: 103–114.
Poulsen, A. F., Hortle, K. G., Valbo-Jorgensen, J., Chan, S., Chhuon, C. K., Viravong, S., Bouakhamvongsa, K., Suntornratana, U., Yoorong, N., T.T., N., & Tran, B. Q. 2004. Distribution and Ecology of Some Important Riverine Fish Species of the Mekong River Basin. Phnom Penh: Mekong River Commission.
Poulsen, A. F., Ouch, P., Viravong, S., Suntornratana, U., & Nguyen, T. T. 2002. Fish Migrations of the Lower Mekong Basin: Implications for Development, Planning and Environmental Management. Phnom Penh: Mekong River Commission.
R Core Team. 2015. R: A Language and Environment for Statistical Computing. R Foundation for Statistical Computing. Vienna, Austria: R Foundation for Statistical Computing.
Rainboth, W. J. 1996. Fishes of the Cambodian Mekong. Rome: Food and Agriculture Organisation of the United Nations.
Rainboth, W. J., Vidthayanon, C., & Mai, D. Y. 2012. Fishes of the Greater Mekong Ecosystem with Species List and Photoraphic Atlas. Ann Arbor: Museum of Zoology, University of Michigan.
Rodríguez, M. A., & Lewis, W. M. 1997. Structure of fish assemblages along environmental gradients in floodplain lakes of the Orinoco River. Ecological Monographs, 67: 109–128.
Rossi, J. P. 2011. Rich: An R package to analyse species richness. Diversity, 3: 112–120.
Sabo, J. L., Ruhi, A., Holtgrieve, G. W., Elliott, V., Arias, M. E., Ngor, P. B., Räsänen, T. A., & Nam, S. 2017. Designing river flows to improve food security futures in the Lower Mekong Basin. Science, 358: 1–11.
Shumway, R. H., & Stoffer, D. S. 2011. Time series analysis and its applications: with R examples (Third Edit.). New York: Springer Science+Business Media.
Silvano, R. A. M., Benedito, D., & Oyakawa, O. T. 2000. Spatial and temporal patterns of diversity and distribution of the Upper Juruá River fish community (Brazilian Amazon). Environmental Biology of Fishes, 57: 25–35.
The Ramsar Convention Secretariat. 2014. Ramsar. Ramsar Sites Information Services.
Valbo-Jørgensen, J., Coates, D., & Hortle, K. G. 2009. Fish diversity in the Lower Mekong Basin. In: I. C. Campbell, ed. The Mekong Biophysical Environment of an International River Basin (1st ed.). Elsevier Inc.: Amsterdam, pp. 161 – 196.
van Zalinge, N., Deap, L., Ngor, P. B., Sarkula, J., & Koponen, J. 2003. Mekong flood levels and Tonle Sap fish catches. In: Second International Symposium on the Management of Large Rivers for Fisheries. Phnom Penh: Second International Symposium on the Management of Large Rivers for Fisheries.
van Zalinge, N., Degen, P., Pongsri, C., Nuov, S., Jensen, J. G., Nguyen, V. H., & Choulamany, X. 2004. The Mekong River System. In: R. Welcomme & T. Petr, eds. Proceedings of the second
118

26
international symposium on the management of large rivers for fisheries. Bangkok: FAO Regional Office for Asia and the Pacific.
Welcome, R. L. 2001. Inland fisheries: ecology and management (1st ed.). Great Britain: Food and Agriculture Organization of the United Nations by Blackwell Science.
119

27
Supplementary Information (S)
Supplementary Information S1. Three-dimensional NMDS plots on the weekly abundance samples
(Bray-Curtis dissimilarity matrix) showing the TSRL community spatiotemporal variation. (a) Spatial,
(b) seasonal and (c) inter-annual variation. For (b), I, O, L, respectively symbolising the inflow, outflow
and the low flow periods. For site codes, see Fig. 1. For season partitioning, see S2. For fish species
details, see S9.
120

28
Supplementary Information S2. Intra-annual hydrological cycle of Tonle Sap Lake: partitioning
seasons into: Inflow (I) or high flow period (July-October), Outflow (O) period (November-February)
and Low-flow (L) period (March-June). Red line curve represents the 10-year mean of water levels in
Tonle Sap Lake.
121

29
Supplementary Information S3. Spatiotemporal comparison of site fish species abundance in Tonle
Sap Lake and River. Mean values among sites with a common letter are not significantly different at
p-value = 0.05 (Wilcoxon test). For site names, see Fig. 1.
122

30
Supplementary Information S4. Results of Permutational Multivariate Analysis of Variance
(PERMANOVA), contrast pairwise tests between different levels of factor (cluster, season and year)
and boxplots comparing NMDS scores among these factor levels.
S4.1. PERMANOVA test among clusters
Df SumOfSqs F Pr(>F) Sig. Level
cluster 2 70.85 117.41 0.001 ***
Residual 1225 369.63
S4.2. Contrast pair-wise tests between the different factor levels of cluster
No pairs F.Model R2 p.value p.adjusted Sig. Level
1 cluster 1 vs cluster 2 117.34 0.16 0.001 0.003 *
2 cluster 1 vs cluster 3 71.16 0.06 0.001 0.003 *
3 cluster 2 vs cluster 3 191.24 0.20 0.001 0.003 *
S4.3. NMDS scores comparing the three factor levels of cluster (Fig. 3b). Mean values among
seasons with a common letter are not significantly different at p-value = 0.05 (Wilcoxon test).
a a
b
a
b b
123

31
S4.4. PERMANOVA test among seasons
Df SumOfSqs F Pr(>F) Sig. Level
season 2 8.39 11.889 0.001 ***
Residual 1225 432.09
S4.5. Contrast pair-wise tests between different factor level of season (I = inflow/high-flow
period, O = outflow period and L = low-flow period)
No Pairs F.Model R2 p.value p.adjusted Sig. Level
1 O vs I 16.86 0.02 0.001 0.003 *
2 O vs L 12.27 0.02 0.001 0.003 *
3 I vs L 5.86 0.01 0.001 0.003 *
S4.6. NMDS scores comparing the three factor levels of season (Fig. 3c). O = Outflow period,
I = Inflow period and L = Low-flow period. Mean values among seasons with a common letter are not
significantly different at p-value = 0.05 (Wilcoxon test).
a b ab a b
a
124

32
S4.7. Seasonal variations in weekly abundance and richness (I = inflow period, O = outflow
period and L = low-flow period). Overall, Wilcoxon tests indicated statistical significant differences
between all pairs of season at p-value < 0.05 for both abundance and richness. For site names, see Fig.
1.
125
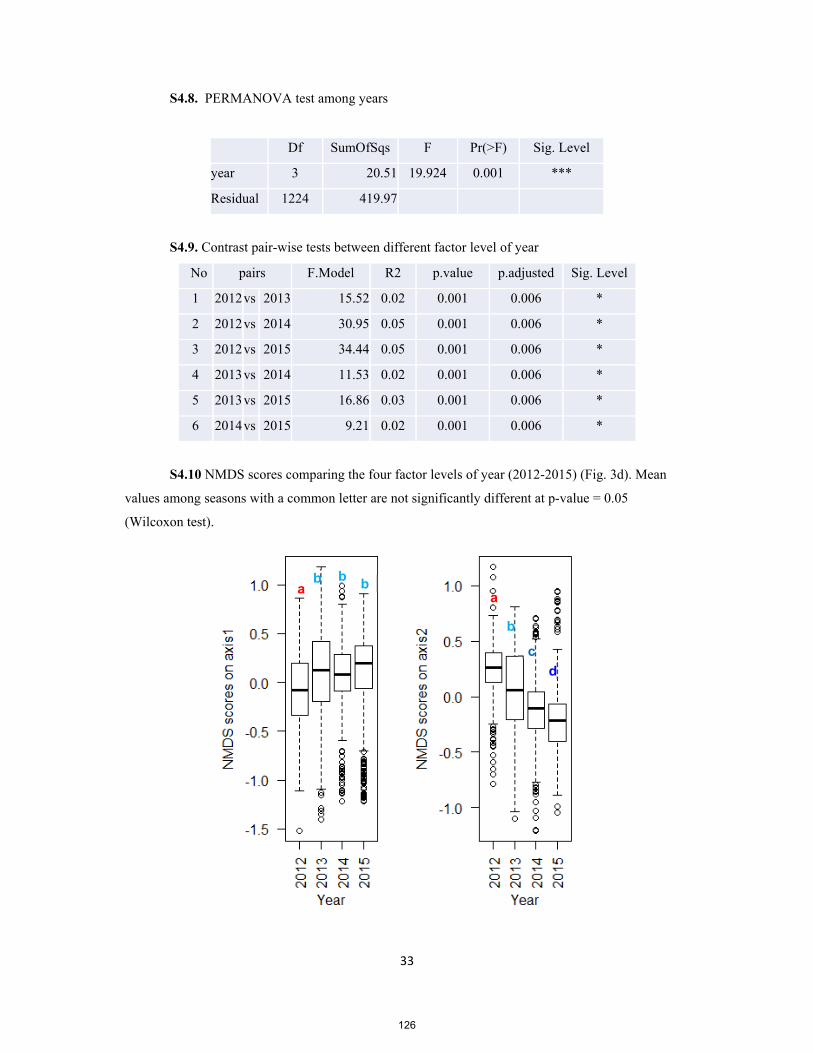
33
S4.8. PERMANOVA test among years
Df SumOfSqs F Pr(>F) Sig. Level
year 3 20.51 19.924 0.001 ***
Residual 1224 419.97
S4.9. Contrast pair-wise tests between different factor level of year
No pairs F.Model R2 p.value p.adjusted Sig. Level
1 2012vs 2013 15.52 0.02 0.001 0.006 *
2 2012vs 2014 30.95 0.05 0.001 0.006 *
3 2012vs 2015 34.44 0.05 0.001 0.006 *
4 2013vs 2014 11.53 0.02 0.001 0.006 *
5 2013vs 2015 16.86 0.03 0.001 0.006 *
6 2014vs 2015 9.21 0.02 0.001 0.006 *
S4.10 NMDS scores comparing the four factor levels of year (2012-2015) (Fig. 3d). Mean
values among seasons with a common letter are not significantly different at p-value = 0.05
(Wilcoxon test).
a b b b
a
b
c
d
126

34
S4.11. Inter-annual variations in weekly abundance and richness. Overall, Wilcoxon tests
indicated statistical significant differences at p-value < 0.05 between 2012-2014, 2013-2014 and 2014-
2015 for abundance, and between 2012-2015, 2013-2015, 2014-2015 for richness. For site names, see
Fig. 1.
127

35
Supplementary Information S5. List of indicator species by cluster and season in Tonle Sap Lake and
River. Given are the values of indicator species (IndVal) for each cluster and season with their
associated significance levels (Sig. level) (***, p < 0.001; ** p < 0.01; *, p < 0.05). The indicator
species for each of the three clusters were simultaneously computed from the TSRL fish community
matrix; whereas, indicator species characterizing each season for a given cluster were concurrently
computed from the community matrix for that cluster. For seasons, only indicator species that matched
with those for the cluster were shown here.
Fish assemblage cluster1 (20 species)
abbre-viations
Species name
Cluster Inflow (I) Outflow (O) Low-flow (L)
InVal Sig.
Level InVal
Sig. Level
InVal Sig.
Level InVal
Sig. Level
Pmac Pangasius macronema 0.92 *** - - - - - -
Lsia Labiobarbus siamensis 0.61 *** - - - - - -
Pcon Pangasius conchophilus 0.55 *** - - - - - -
Pfal Puntioplites falcifer 0.48 *** - - - - - -
Ppol Pangasius polyuranodon 0.46 *** - - - - - -
Ptyp Paralaubuca typus 0.46 ** - - 0.73 *** - -
Pble Phalacronotus bleekeri 0.43 *** - - 0.62 ** - -
Priv Paralaubuca riveroi 0.40 *** - - 0.46 ** - -
Btru Belodontichthys truncatus 0.38 *** - - 0.74 *** - -
Bpan Brachirus panoides 0.37 *** - - - - - -
Pboc Pangasius bocourti 0.36 *** - - - - 0.53 **
Ycau Yasuhikotakia caudipunctata 0.32 *** - - - - - -
Mery Mastacembelus erythrotaenia 0.28 *** - - - - 0.35 **
Mche Micronema cheveyi 0.26 ** - - 0.57 *** - -
Cgac Channa gachua 0.25 *** - - - - - -
Ccar Cyprinus carpio 0.25 *** - - - - - -
Psia.1 Parambassis siamensis 0.20 *** - - - - - -
Nnen Nemapteryx nenga 0.16 *** - - - - - -
Hwaa Helicophagus waandersii 0.12 * - - - - - -
Dpol Datnioides polota 0.10 * - - - - - -
Fish assemblage cluster2 (45 species)
Mmys Mystus mysticetus 0.80 *** - - 0.56 ** - -
Llin Labiobarbus lineatus 0.72 *** - - 0.59 ** - -
Ovit Osteochilus vittatus 0.71 *** - - 0.64 *** - -
Ates Anabas testudineus 0.68 *** - - - - - -
Lchr Labeo chrysophekadion 0.67 *** - - 0.60 *** - -
Tthy Thynnichthys thynnoides 0.66 *** - - 0.57 *** - -
Pfas Pristolepis fasciata 0.65 *** - - - - - -
Hsia Henicorhynchus siamensis 0.64 *** - - 0.65 *** - -
Ttri Trichopodus trichopterus 0.63 *** - - 0.67 *** - -
Carm Cyclocheilichthys armatus 0.61 *** - - 0.56 *** - -
Msin Mystus singaringan 0.59 *** 0.52 * - - - -
Pwol Parambassis wolffii 0.57 *** - - - - - -
128

36
Ymod Yasuhikotakia modesta 0.53 *** - - 0.54 *** - -
Msia Macrognathus siamensis 0.51 *** - - - - - -
Atru Amblyrhynchichthys truncatus 0.48 *** - - - - - -
Omel Osteochilus melanopleurus 0.47 ** - - 0.53 *** - -
Crep Cyclocheilichthys repasson 0.43 *** - - 0.39 ** - -
Cfur Cyclocheilos furcatus 0.42 *** - - - - - -
Mboc Mystus bocourti 0.40 ** - - - - 0.47 ***
Lcro Lycothrissa crocodilus 0.39 ** - - - - 0.38 **
Malb.1 Mystus albolineatus 0.37 *** - - - - - -
Papo.1 Phalacronotus apogon 0.37 ** - - - - - -
Hdis Hampala dispar 0.36 *** - - 0.35 ** - -
Char Cosmochilus harmandi 0.35 * - - 0.47 *** - -
Srub Systomus rubripinnis 0.35 *** 0.33 * - - - -
Aalb Albulichthys albuloides 0.33 ** - - - - 0.40 ***
Lhoe Leptobarbus hoevenii 0.33 * - - - - - -
Gpen Gyrinocheilus pennocki 0.32 *** - - 0.34 *** - -
Osch Osteochilus schlegeli 0.31 *** - - - - - -
Ldyo Labeo dyocheilus 0.28 *** - - 0.37 *** - -
Omic Osteochilus microcephalus 0.27 *** - - 0.26 * - -
Olin Osteochilus lini 0.27 *** - - - - - -
Corn Chitala ornata 0.26 ** 0.34 *** - - - -
Hmal Hypsibarbus malcolmi 0.25 *** - - - - - -
Cmac.1 Coilia macrognathos 0.24 * - - - - - -
Hwyc.1 Hemibagrus wyckioides 0.23 ** 0.23 * - - - -
Bsch Barbonymus schwanenfeldii 0.22 ** - - 0.23 * - -
Pmac.1 Parachela maculicauda 0.21 ** - - 0.31 *** - -
Gfas Garra fasciacauda 0.21 ** 0.27 ** - - - -
Mmac Macrochirichthys macrochirus 0.20 ** - - 0.24 ** - -
Clin Coilia lindmani 0.17 * - - - - - -
Mcir Macrognathus circumcinctus 0.17 ** - - 0.23 ** - -
Lmel Lobocheilos melanotaenia 0.17 * - - 0.26 *** - -
Cjul Cirrhinus jullieni 0.15 * - - - - - -
Catr Crossocheilus atrilimes 0.12 * - - - - - -
Fish assemblage cluster3 (31 species)
Nnot Notopterus notopterus 0.77 *** - - - - - -
Hspi Hemibagrus spilopterus 0.72 *** 0.60 *** - - - -
Tmic.1 Trichopodus microlepis 0.63 *** - - - - 0.52 *
Bgon Barbonymus gonionotus 0.60 *** 0.57 ** - - - -
Cstr Channa striata 0.59 * - - - - - -
Obim Ompok bimaculatus 0.57 *** - - - - 0.55 *
Hmac Hampala macrolepidota 0.57 *** - - - - - -
Omar Oxyeleotris marmorata 0.57 *** - - - - - -
Tpec Trichopodus pectoralis 0.57 *** - - - - 0.45 *
Ceno Cyclocheilichthys enoplos 0.56 *** - - - - 0.58 *
Phyp Pangasianodon hypophthalmus 0.55 *** - - - - - -
Pmic Phalacronotus micronemus 0.55 *** - - - - - -
Hlag Hypsibarbus lagleri 0.47 *** - - - - 0.44 **
Bmic Boesemania microlepis 0.47 *** - - - - - -
129

37
Cmac Clarias macrocephalus 0.42 *** 0.44 ** - - - -
Pdja Pangasius djambal 0.41 *** - - - - - -
Cmel Clarias meladerma 0.40 *** - - - - - -
Matr Mystus atrifasciatus 0.31 ** - - - - 0.43 ***
Cbat Clarias batrachus 0.30 *** - - 0.34 ** - -
Llep Labiobarbus leptocheilus 0.28 ** - - - - - -
Plei Pao leiurus 0.27 *** - - - - 0.30 **
Pbre Puntius brevis 0.26 ** - - - - - -
Plab Probarbus labeamajor 0.26 ** - - - - - -
Pspp Pangasius sp. 0.25 ** - - - - 0.30 *
Csp Clarias sp. 0.25 *** - - - - 0.26 *
Psia Parachela siamensis 0.23 ** - - 0.32 *** - -
Mhex Micronema hexapterus 0.21 ** - - 0.27 ** - -
Pjul Probarbus jullieni 0.19 * - - - - - -
Aleu Achiroides leucorhynchos 0.18 ** - - - - - -
Pmul Polynemus multifilis 0.18 ** - - - - 0.27 **
Hver Hypsibarbus vernayi 0.12 * 0.17 * - - - -
130

38
Supplementary Information S6. Cross-correlation between mean weekly water levels in Tonle Sap
River in Kandal (KD) and Tonle Sap Lake in Pursat (PS). The correlation lag with the maximum
coefficient was estimated at -2 weeks, implying that mean water levels in the Tonle Sap Lake lag
around two weeks behind that of the Tonle Sap River. Maximum time lags for the cross-correlation
plot were set at 52 weeks indicating an annual cycle.
131

39
Supplementary Information S7. Cross-correlation plots between fish community abundance and
water levels in the TSRL. Mean weekly water levels in KD were used for cross-correlation plot in KD
and mean weekly water levels in PS were used for cross-correlation plots in all sites around the lake.
Correlation lags at the site maximum coefficient were estimated at -15 weeks (KD), -10 (KC), -14 (KT),
-16 (PS), -13 (SR) and -10 (BB). Maximum time lags for the cross-correlation plots were set at 52
weeks indicating an annual cycle. For site names, see Fig. 1.
132

40
Supplementary Information S8. Cross-correlation plots between fish community richness and water
levels in the TSRL. Mean weekly water levels in KD were used for cross-correlation plot in KD and
mean weekly water levels in PS were used for cross-correlation plots in all sites around the lake.
Correlation time lags at the site maximum coefficient were estimated at -8 weeks (KD), -2 (KC), -2
(KT), -10 (PS), 20 (SR) and 8 (BB). Maximum time lags for the cross-correlation plots were set at 52
weeks indicating an annual cycle. For site names, see Fig. 1.
133

41
Supplementary Information – S9: List of species names and their abbreviation by genera, families
and orders. Species names and their ecological attributes are based on (Rainboth, 1996; MFD, 2003;
Rainboth et al., 2012; Kottelat, 2013; Froese & Pauly, 2017).
Habitat guild: (1) Rithron resident, (2) Main channel resident, (3) Main channel spawner, (4)
Floodplain spawner, (5) Eurytopic (generalist), (6) Floodplain resident, (7) Estuarine resident, (8)
Anadromous, (9) Catadromous, (10) Marine visitor, (9) Non-native.
Migration guild: Black = non-migratory (floodplain resident), Grey = short-distance lateral
migration between floodplain and river channel, White = longitudinal migration (in river),
Estuarine = Estuarine resident/marine visitor.
No Abbr‐eviaiton
Species name genus Family order Habitat guild
Migration guild
1 Bbag Bagarius bagarius Bagarius Sisoridae Siluriformes 1 White
2 Bmer Balitora meridionalis Balitora Balitoridae Cypriniformes 1 White
3 Bsuc Bagarius suchus Bagarius Sisoridae Siluriformes 1 White
4 Bzol Balitoropsis zollingeri Balitoropsis Balitoridae Cypriniformes 1 White
5 Cbla Chitala blanci Chitala Notopteridae Osteoglossiformes 1 White
6 Cgac Channa gachua Channa Channidae Perciformes 1 Black
7 Dash Discherodontus ashmeadi Discherodontus Cyprinidae Cypriniformes 1 White
8 Dlep Devario leptos Devario Cyprinidae Cypriniformes 1 White
9 Dpar Discherodontus parvus Discherodontus Cyprinidae Cypriniformes 1 White
10 Gfas Garra fasciacauda Garra Cyprinidae Cypriniformes 1 White
11 Gfus Glyptothorax fuscus Glyptothorax Sisoridae Siluriformes 1 White
12 Gksa Gobiidae ksan Gobiidae Gobiidae Perciformes 1 Black
13 Glao Glyptothorax laosensis Glyptothorax Sisoridae Siluriformes 1 White
14 Hpen Hemimyzon pengi Hemimyzon Balitoridae Cypriniformes 1 White
15 Lmel Lobocheilos melanotaenia Lobocheilos Cyprinidae Cypriniformes 1 White
16 Mobt Mystacoleucus obtusirostris Mystacoleucus Cyprinidae Cypriniformes 1 White
17 Nbla Neolissochilus blanci Neolissochilus Cyprinidae Cypriniformes 1 White
18 Oexo Osphronemus exodon Osphronemus Osphronemidae Perciformes 1 Black
19 Ofus Onychostoma fusiforme Onychostoma Cyprinidae Cypriniformes 1 White
20 Oger Onychostoma gerlachi Onychostoma Cyprinidae Cypriniformes 1 White
21 Ogor Osphronemus goramy Osphronemus Osphronemidae Perciformes 1 Black
22 Owaa Osteochilus waandersii Osteochilus Cyprinidae Cypriniformes 1 White
23 Pdea Poropuntius deauratus Poropuntius Cyprinidae Cypriniformes 1 White
24 Rgut Raiamas guttatus Raiamas Cyprinidae Cypriniformes 1 White
25 Sara Schistura aramis Schistura Nemacheilidae Cypriniformes 1 White
26 Sath Schistura athos Schistura Nemacheilidae Cypriniformes 1 White
27 Scra Schistura crabro Schistura Nemacheilidae Cypriniformes 1 White
28 Sdau Schistura daubentoni Schistura Nemacheilidae Cypriniformes 1 White
29 Sfor Scleropages formosus Scleropages Osteoglossidae Osteoglossiformes 1 Black
30 Slat Schistura latifasciata Schistura Nemacheilidae Cypriniformes 1 White
31 Tlat Tor laterivittatus Tor Cyprinidae Cypriniformes 1 White
32 Tsin Tor sinensis Tor Cyprinidae Cypriniformes 1 White
33 Ttam Tor tambroides Tor Cyprinidae Cypriniformes 1 White
34 Cmac.1 Coilia macrognathos Coilia Engraulidae Clupeiformes 10 Estuarine
35 Cmic.2 Cynoglossus microlepis Cynoglossus Cynoglossidae Pleuronectiformes 10 Estuarine
36 Gtil Gymnothorax tile Gymnothorax Muraenidae Anguilliformes 10 Estuarine
37 Mcyp Megalops cyprinoides Megalops Megalopidae Elopiformes 10 Estuarine
38 Ttol Tenualosa toli Tenualosa Clupeidae Clupeiformes 10 Estuarine
39 Ccar Cyprinus carpio Cyprinus Cyprinidae Cypriniformes 11 White
40 Ccir Cirrhinus cirrhosus Cirrhinus Cyprinidae Cypriniformes 11 White
41 Gaff Gambusia affinis Gambusia Poeciliidae Cyprinodontiformes 11 Black
134

42
42 Hmol Hypophthalmichthys molitrix Hypophthalmichthys Cyprinidae Cypriniformes 11 White
43 Ldyo Labeo dyocheilus Labeo Cyprinidae Cypriniformes 11 White
44 Lroh Labeo rohita Labeo Cyprinidae Cypriniformes 11 White
45 Mang Misgurnus anguillicaudatus Misgurnus Cobitidae Cypriniformes 11 White
46 Pbra Piaractus brachypomus Piaractus Serrasalmidae Characiformes 11 Black
47 Ppol Pangasius polyuranodon Pangasius Pangasiidae Siluriformes 11 White
48 Ceno Cyclocheilichthys enoplos Cyclocheilichthys Cyprinidae Cypriniformes 2 White
49 Cfur Cyclocheilos furcatus Cyclocheilos Cyprinidae Cypriniformes 2 White
50 Char Cosmochilus harmandi Cosmochilus Cyprinidae Cypriniformes 2 White
51 Csia Catlocarpio siamensis Catlocarpio Cyprinidae Cypriniformes 2 White
52 Pboc Pangasius bocourti Pangasius Pangasiidae Siluriformes 2 White
53 Pcon Pangasius conchophilus Pangasius Pangasiidae Siluriformes 2 White
54 Pdja Pangasius djambal Pangasius Pangasiidae Siluriformes 2 White
55 Phyp Pangasianodon hypophthalmus Pangasianodon Pangasiidae Siluriformes 2 White
56 Pjul Probarbus jullieni Probarbus Cyprinidae Cypriniformes 2 White
57 Plab Probarbus labeamajor Probarbus Cyprinidae Cypriniformes 2 White
58 Plar Pangasius larnaudii Pangasius Pangasiidae Siluriformes 2 White
59 Ptyp Paralaubuca typus Paralaubuca Cyprinidae Cypriniformes 2 White
60 Aalb Albulichthys albuloides Albulichthys Cyprinidae Cypriniformes 3 White
61 Adel Acanthopsoides delphax Acanthopsoides Cobitidae Cypriniformes 3 White
62 Agra Acanthopsoides gracilentus Acanthopsoides Cobitidae Cypriniformes 3 White
63 Agry Aaptosyax grypus Aaptosyax Cyprinidae Cypriniformes 3 White
64 Asid Ambastaia sidthimunki Ambastaia Cobitidae Cypriniformes 3 White
65 Atru Amblyrhynchichthys truncatus Amblyrhynchichthys Cyprinidae Cypriniformes 3 White
66 Bobs Bagrichthys obscurus Bagrichthys Bagridae Siluriformes 3 White
67 Bsp Bangana sp. Bangana Cyprinidae Cypriniformes 3 White
68 Btru Belodontichthys truncatus Belodontichthys Siluridae Siluriformes 3 White
69 Cjul Cirrhinus jullieni Cirrhinus Cyprinidae Cypriniformes 3 White
70 Clon Clupisoma longianalis Clupisoma Schilbeidae Siluriformes 3 White
71 Clop Chitala lopis Chitala Notopteridae Osteoglossiformes 3 White
72 Cmic.1 Cirrhinus microlepis Cirrhinus Cyprinidae Cypriniformes 3 White
73 Cmol Cirrhinus molitorella Cirrhinus Cyprinidae Cypriniformes 3 White
74 Dund Datnioides undecimradiatus Datnioides Datnioididae Perciformes 3 White
75 Gpen Gyrinocheilus pennocki Gyrinocheilus Gyrinocheilidae Cypriniformes 3 White
76 Hfil Hemibagrus filamentus Hemibagrus Bagridae Siluriformes 3 White
77 Hlag Hypsibarbus lagleri Hypsibarbus Cyprinidae Cypriniformes 3 White
78 Hmal Hypsibarbus malcolmi Hypsibarbus Cyprinidae Cypriniformes 3 White
79 Hspi Hemibagrus spilopterus Hemibagrus Bagridae Siluriformes 3 White
80 Hsuv Hypsibarbus suvattii Hypsibarbus Cyprinidae Cypriniformes 3 White
81 Hver Hypsibarbus vernayi Hypsibarbus Cyprinidae Cypriniformes 3 White
82 Hwaa Helicophagus waandersii Helicophagus Pangasiidae Siluriformes 3 White
83 Hwet Hypsibarbus wetmorei Hypsibarbus Cyprinidae Cypriniformes 3 White
84 Hwyc Hemibagrus wyckii Hemibagrus Bagridae Siluriformes 3 White
85 Hwyc.1 Hemibagrus wyckioides Hemibagrus Bagridae Siluriformes 3 White
86 Kcry Kryptopterus cryptopterus Kryptopterus Siluridae Siluriformes 3 White
87 Lble Luciosoma bleekeri Luciosoma Cyprinidae Cypriniformes 3 White
88 Lchr Labeo chrysophekadion Labeo Cyprinidae Cypriniformes 3 White
89 Mche Micronema cheveyi Micronema Siluridae Siluriformes 3 White
90 Mhex Micronema hexapterus Micronema Siluridae Siluriformes 3 White
91 Omel Osteochilus melanopleurus Osteochilus Cyprinidae Cypriniformes 3 White
92 Papo.1 Phalacronotus apogon Phalacronotus Siluridae Siluriformes 3 White
93 Pble Phalacronotus bleekeri Phalacronotus Siluridae Siluriformes 3 White
94 Pbul Puntioplites bulu Puntioplites Cyprinidae Cypriniformes 3 White
95 Pfal Puntioplites falcifer Puntioplites Cyprinidae Cypriniformes 3 White
96 Pmac Pangasius macronema Pangasius Pangasiidae Siluriformes 3 White
97 Pmic Phalacronotus micronemus Phalacronotus Siluridae Siluriformes 3 White
98 Pple Pseudolais pleurotaenia Pseudolais Pangasiidae Siluriformes 3 White
99 Ppro Puntioplites proctozysron Puntioplites Cyprinidae Cypriniformes 3 White
135

43
100 Psia.2 Pseudomystus siamensis Pseudomystus Bagridae Siluriformes 3 White
101 Pspp Pangasius sp. Pangasius Pangasiidae Siluriformes 3 White
102 Sban Scaphognathops bandanensis Scaphognathops Cyprinidae Cypriniformes 3 White
103 Sbea Syncrossus beauforti Syncrossus Cobitidae Cypriniformes 3 White
104 Shel Syncrossus helodes Syncrossus Cobitidae Cypriniformes 3 White
105 Tthi Tenualosa thibaudeaui Tenualosa Clupeidae Clupeiformes 3 White
106 Watt Wallago attu Wallago Siluridae Siluriformes 3 White
107 Ycau Yasuhikotakia caudipunctata Yasuhikotakia Cobitidae Cypriniformes 3 White
108 Ylec Yasuhikotakia lecontei Yasuhikotakia Cobitidae Cypriniformes 3 White
109 Ymod Yasuhikotakia modesta Yasuhikotakia Cobitidae Cypriniformes 3 White
110 Balt Barbonymus altus Barbonymus Cyprinidae Cypriniformes 4 Grey
111 Bmic Boesemania microlepis Boesemania Sciaenidae Perciformes 4 Grey
112 Brho Barbodes rhombeus Barbodes Cyprinidae Cypriniformes 4 Grey
113 Bsch Barbonymus schwanenfeldii Barbonymus Cyprinidae Cypriniformes 4 Grey
114 Carm Cyclocheilichthys armatus Cyclocheilichthys Cyprinidae Cypriniformes 4 Grey
115 Crep Cyclocheilichthys repasson Cyclocheilichthys Cyprinidae Cypriniformes 4 Grey
116 Lhoe Leptobarbus hoevenii Leptobarbus Cyprinidae Cypriniformes 4 Grey
117 Llau Laubuka laubuca Laubuka Cyprinidae Cypriniformes 4 Grey
118 Malb.1 Mystus albolineatus Mystus Bagridae Siluriformes 4 Grey
119 Matr Mystus atrifasciatus Mystus Bagridae Siluriformes 4 Grey
120 Mboc Mystus bocourti Mystus Bagridae Siluriformes 4 Grey
121 Mmac Macrochirichthys macrochirus Macrochirichthys Cyprinidae Cypriniformes 4 Grey
122 Mmul Mystus multiradiatus Mystus Bagridae Siluriformes 4 Grey
123 Mmys Mystus mysticetus Mystus Bagridae Siluriformes 4 Grey
124 Msin Mystus singaringan Mystus Bagridae Siluriformes 4 Grey
125 Obim Ompok bimaculatus Ompok Siluridae Siluriformes 4 Grey
126 Ohyp Ompok hypophthalmus Ompok Siluridae Siluriformes 4 Grey
127 Osch Osteochilus schlegeli Osteochilus Cyprinidae Cypriniformes 4 Grey
128 Papo Parambassis apogonoides Parambassis Ambassidae Perciformes 4 Grey
129 Pcam Pao cambodgiensis Pao Tetraodontidae Tetraodontiformes 4 Grey
130 Pfas Pristolepis fasciata Pristolepis Pristolepididae Perciformes 4 Black
131 Pmac.1 Parachela maculicauda Parachela Cyprinidae Cypriniformes 4 Grey
132 Priv Paralaubuca riveroi Paralaubuca Cyprinidae Cypriniformes 4 Grey
133 Psia Parachela siamensis Parachela Cyprinidae Cypriniformes 4 Grey
134 Pwol Parambassis wolffii Parambassis Ambassidae Perciformes 4 Grey
135 Rbor Rasbora borapetensis Rasbora Cyprinidae Cypriniformes 4 Grey
136 Rdan Rasbora daniconius Rasbora Cyprinidae Cypriniformes 4 Grey
137 Rspi Rasbosoma spilocerca Rasbosoma Cyprinidae Cypriniformes 4 Grey
138 Rtor Rasbora tornieri Rasbora Cyprinidae Cypriniformes 4 Grey
139 Rtri Rasbora trilineata Rasbora Cyprinidae Cypriniformes 4 Grey
140 Tthy Thynnichthys thynnoides Thynnichthys Cyprinidae Cypriniformes 4 Grey
141 Aleu Achiroides leucorhynchos Achiroides Soleidae Pleuronectiformes 5 White
142 Bgon Barbonymus gonionotus Barbonymus Cyprinidae Cypriniformes 5 White
143 Catr Crossocheilus atrilimes Crossocheilus Cyprinidae Cypriniformes 5 White
144 Corn Chitala ornata Chitala Notopteridae Osteoglossiformes 5 White
145 Cret Crossocheilus reticulatus Crossocheilus Cyprinidae Cypriniformes 5 White
146 Hdis Hampala dispar Hampala Cyprinidae Cypriniformes 5 White
147 Hlob Henicorhynchus lobatus Henicorhynchus Cyprinidae Cypriniformes 5 White
148 Hmac Hampala macrolepidota Hampala Cyprinidae Cypriniformes 5 White
149 Hsia Henicorhynchus siamensis Henicorhynchus Cyprinidae Cypriniformes 5 White
150 Llep Labiobarbus leptocheilus Labiobarbus Cyprinidae Cypriniformes 5 White
151 Llin Labiobarbus lineatus Labiobarbus Cyprinidae Cypriniformes 5 White
152 Lsia Labiobarbus siamensis Labiobarbus Cyprinidae Cypriniformes 5 White
153 Marm Mastacembelus armatus Mastacembelus Mastacembelidae Synbranchiformes 5 Estuarine
154 Mery Mastacembelus erythrotaenia Mastacembelus Mastacembelidae Synbranchiformes 5 White
155 Nnot Notopterus notopterus Notopterus Notopteridae Osteoglossiformes 5 Grey
156 Olin Osteochilus lini Osteochilus Cyprinidae Cypriniformes 5 White
157 Omar Oxyeleotris marmorata Oxyeleotris Eleotridae Perciformes 5 White
158 Omic Osteochilus microcephalus Osteochilus Cyprinidae Cypriniformes 5 White
136

44
159 Ovit Osteochilus vittatus Osteochilus Cyprinidae Cypriniformes 5 White
160 Psia.1 Parambassis siamensis Parambassis Ambassidae Perciformes 5 Grey
161 Srub Systomus rubripinnis Systomus Cyprinidae Cypriniformes 5 White
162 Xcan Xenentodon cancila Xenentodon Belonidae Beloniformes 5 White
163 Asp Acanthocobitis sp. Acanthocobitis Nemacheilidae Cypriniformes 6 Black
164 Aspp Acanthopsis spp. Acanthopsis Cobitidae Cypriniformes 6 Black
165 Ates Anabas testudineus Anabas Anabantidae Perciformes 6 Black
166 Cbat Clarias batrachus Clarias Clariidae Siluriformes 6 Black
167 Cluc Channa lucius Channa Channidae Perciformes 6 Black
168 Cmac Clarias macrocephalus Clarias Clariidae Siluriformes 6 Black
169 Cmar Channa marulioides Channa Channidae Perciformes 6 Black
170 Cmel Clarias meladerma Clarias Clariidae Siluriformes 6 Black
171 Cmic Channa micropeltes Channa Channidae Perciformes 6 Black
172 Cnie Clarias nieuhofii Clarias Clariidae Siluriformes 6 Black
173 Csp Clarias sp. Clarias Clariidae Siluriformes 6 Black
174 Cstr Channa striata Channa Channidae Perciformes 6 Black
175 Emet Esomus metallicus Esomus Cyprinidae Cypriniformes 6 Black
176 Malb Monopterus albus Monopterus Synbranchidae Synbranchiformes 6 Black
177 Mcir Macrognathus circumcinctus Macrognathus Mastacembelidae Synbranchiformes 6 Black
178 Msia Macrognathus siamensis Macrognathus Mastacembelidae Synbranchiformes 6 Black
179 Pbre Puntius brevis Puntius Cyprinidae Cypriniformes 6 Black
180 Pcoc Pao cochinchinensis Pao Tetraodontidae Tetraodontiformes 6 Grey
181 Tmic.1 Trichopodus microlepis Trichopodus Osphronemidae Perciformes 6 Black
182 Tpec Trichopodus pectoralis Trichopodus Osphronemidae Perciformes 6 Black
183 Ttri Trichopodus trichopterus Trichopodus Osphronemidae Perciformes 6 Black
184 Ajan Aulopareia janetae Aulopareia Gobiidae Perciformes 7 Estuarine
185 Amac Arius maculatus Arius Ariidae Siluriformes 7 Estuarine
186 Aven Arius venosus Arius Ariidae Siluriformes 7 Estuarine
187 Bamb Butis amboinensis Butis Eleotridae Perciformes 7 Estuarine
188 Bpan Brachirus panoides Brachirus Soleidae Pleuronectiformes 7 Estuarine
189 Clin Coilia lindmani Coilia Engraulidae Clupeiformes 7 Estuarine
190 Dpol Datnioides polota Datnioides Datnioididae Perciformes 7 White
191 Gaur Glossogobius aureus Glossogobius Gobiidae Perciformes 7 Estuarine
192 Ggiu Glossogobius giuris Glossogobius Gobiidae Perciformes 7 Estuarine
193 Hsto Hemiarius stormii Hemiarius Ariidae Siluriformes 7 White
194 Lcro Lycothrissa crocodilus Lycothrissa Engraulidae Clupeiformes 7 Estuarine
195 Nnen Nemapteryx nenga Nemapteryx Ariidae Siluriformes 7 White
196 Omil Osteogeneiosus militaris Osteogeneiosus Ariidae Siluriformes 7 Estuarine
197 Pdub Polynemus dubius Polynemus Polynemidae Perciformes 7 Estuarine
198 Plei Pao leiurus Pao Tetraodontidae Tetraodontiformes 7 Estuarine
199 Pmel Polynemus melanochir Polynemus Polynemidae Perciformes 7 Estuarine
200 Pmul Polynemus multifilis Polynemus Polynemidae Perciformes 7 Estuarine
201 Psep Periophthalmodon septemradiatus Periophthalmodon Gobiidae Perciformes 7 Black
202 Tmic Toxotes microlepis Toxotes Toxotidae Perciformes 7 Estuarine
203 Pkre Pangasius krempfi Pangasius Pangasiidae Siluriformes 8 White
204 Amar Anguilla marmorata Anguilla Anguillidae Anguilliformes 9 White
137

45
REFERENCES (for Supplementary Information)
Froese, R., & D. Pauly, 2017. FishBase. World Wide Web electronic publication. , www.fishbase.org.
Kottelat, M., 2013. The Fishes of the inland waters of Southeast Asia: A catalogue and core bibliography of the fishes known to occur in freshwaters, mangroves and estuaries. The Raffles Bulletin of Zoology 27: 1–663.
MFD, 2003. Mekong Fish Database: A taxonomic fish database for the Mekong Basin. Mekong River Commission, Phnom Penh.
Rainboth, W. J., 1996. FAO species identification field guide for fishery purposes. Fishes of the Cambodian Mekong. FAO, Rome.
Rainboth, W. J., C. Vidthayanon, & D. Y. Mai, 2012. Fishes of the Greater Mekong Ecosystem with Species List and Photoraphic Atlas. Museum of Zoology, University of Michigan, Ann Arbor.
138


ARTICLE 3
Evidence of indiscriminate fishing effects in one of the world's largest inland fisheries
Peng Bun Ngor, Kevin McCann, Gaël Grenouillet, Nam So, Bailey McMeans,
Evan Fraser, Sovan Lek
Scientific Reports (in revision)
139


25
Title: Evidence of indiscriminate fishing effects in one of
the world's largest inland fisheries
Authors: Peng Bun Ngor1,2¥, Kevin McCann3, Gaël Grenouillet2, Nam So4,
Bailey McMeans5, Evan Fraser3, Sovan Lek2
1 Fisheries Administration, No. 186, Preah Norodom Blvd., Khan Chamcar Morn, Phnom Penh,
Cambodia
2 CNRS, Université Toulouse III Paul Sabatier, ENFA; UMR5174 EDB (Laboratoire Évolution &
Diversité Biologique); 118 route de Narbonne, F-31062 Toulouse, France
3University of Guelph, Guelph Ontario, Canada
4Mekong River Commission
5University of Toronto Mississauga, Mississauga, Ontario, Canada
¥ Current address: CNRS, Université Toulouse III Paul Sabatier, ENFA; UMR5174 EDB (Laboratoire
Évolution & Diversité Biologique); 118 route de Narbonne, F-31062 Toulouse, France.
Corresponding author: [email protected]
140

26
Abstract
While human impacts like fishing have altered marine food web composition and body size, the status
of the world’s important tropical inland fisheries remains largely unknown. Here, we look for signatures
of human impacts on the indiscriminately fished Tonle Sap fish community that supports one of the
world’s largest freshwater fisheries. By analyzing a 15-year time-series (2000-2015) of fish catches for
116 species obtained from an industrial-scale ‘Dai’ fishery, we find: (i) 78% of the species exhibited
decreasing catches through time; (ii) downward trends in catches occurred primarily in medium to large-
bodied species that tend to occupy high trophic levels; (iii) a relatively stable or increasing trend in
catches of small-sized species, and; (iv) a decrease in the individual fish weights and lengths for several
common species. Because total biomass of the catch has remained remarkably resilient over the last 15
years, the increase in catch of smaller species has compensated for declines in larger species. Our
finding of sustained production but altered community composition is consistent with predictions from
recent indiscriminate theory, and gives a warning signal to fisheries managers and conservationists that
the species-rich Tonle Sap is being affected by heavy indiscriminate fishing pressure.
Keywords: freshwater fisheries, inland waters, declining catches, indiscriminate fisheries, Tonle Sap,
Mekong Basin.
141

27
Introduction
Globally, inland waters extend over an area of about 7.8 million km2 and are among the most
biologically productive and diverse ecosystems on earth 1–3. Inland capture fisheries are important
sources of food security, livelihoods, and recreation for tens of millions of people worldwide 4,5. Overall,
inland fisheries employ approximately 61 million people 6 and represent 11.3% of the world total
capture fish production 7. These fisheries, however, are facing numerous challenges from human
activities, namely, population growth, habitat degradation, hydrological changes, pollution, invasive
species and climate change 1,8–11.
Worries over the fate of inland waters 12, along with the concern that higher trophic levels of
marine food webs are being unsustainably exploited, have grown during the last decade. In particular,
fisheries ecologists have recently argued that increased indiscriminate fishing pressure is reducing
large-sized, slower-growing species with late maturity, and replacing them with smaller-sized, faster-
growing species that mature earlier 13–16. This leads to an overall reduction in the body size and,
consequently, a reduction in the overall trophic level of the fish assemblage remaining in an ecosystem.
Ultimately, these changes are expected to be reflected in catch composition 12,17–20. Shifts through time
in the slope of the catch-size spectra and decreases in the size of individual fish are also among the key
structural and functional ‘signatures’ of indiscriminate fishing on the fish community 21. Currently,
however, much of the fisheries impact research has focused on marine systems and very little is known
about freshwater fisheries in the sub-tropical and tropical environments such as the Mekong River Basin 22. What limited evidence exists from inland tropical fisheries suggests declining catches, particularly
in Asia and Africa where fish protein is of paramount importance in terms of food security. Hence,
there are increasing calls in the literature that inland tropical fisheries should receive more research
attention 1,4,5,8.
This paper contributes to the literature on inland tropical fisheries, demonstrating that larger
higher trophic level fish are being depleted in one of the world’s largest freshwater fisheries, while
smaller, lower trophic levels organisms are increasing in a manner that sustains overall fish catches.
Towards this, we study temporal dynamics of 116 fish species in the Tonle Sap over 15 years. The
dataset was obtained from a standardized biological catch assessment of an industrial-scale ‘Dai
fishery’ that operates during the dry season in the Tonle Sap River. We explore how temporal trends of
fish catch captured by this fishery relate to each species’ maximum body size and trophic level. We also
examine changes in the body weight and length of individual fish for select species over the assessment
period.
142

28
Results
Summary of the fishery catch
Over the 15-year assessment period, 141 fish species belonging to 12 orders, 36 families and
93 genera were recorded. The four main orders, representing 90% of the total species counts were:
Cypriniformes (59 species), Siluriformes (36), Perciformes (23) and Clupeiformes (7). The rest
contained one to three species in each order. Five families forming 95% of the total catch were
Cyprinidae (84%), Pangasiidae (4%), Cobitidae (4%), Siluridae (3%) and Cynoglossidae (1%). Three
genera forming 66% of the total catch were Henicorhynchus (42%), Paralaubuca (12%), Labiobarbus
(12%). Henicorhynchus contained three species namely Henicorhynchus lobatus (17%),
Henicorhynchus sp. (15%) (synonym of Lobocheilos cryptopogon and H. cryptopogon) and H.
siamensis (10%); whereas, Paralaubuca encompassed only one species Paralaubuca barroni (synonym
of P. typus), and finally, Labiobarbus consisted of two species: L. lineatus (10%) and L. siamensis (2%).
By size category, 75% of catch was from species with maximum total length (maxTL)<=30 cm, 9%
with maxTL 31-60 cm, 9% with maxTL 61-90 cm and 6% with maxTL>90 cm. By trophic level, 70%
of catch was from species with trophic level<=2.75, 27% with trophic level=2.76–3.75 and 3% with
trophic level>3.75. Ecologically, 82% of catch was longitudinal (riverine) migratory species, 17% was
lateral-migration species, and about 1% is from a combination of estuarine, marine and floodplain
resident species. For relative catch weight of 116 species captured by the Dai fishery, see Supplemental
Information Fig. S4. We also found an overall declining trend in species diversity (evenness index) (see
Fig. S5), signifying that fish community was highly unevenly distributed particularly between 2008 and
2015.
Temporal change in fish catch and relationship with maximum length and trophic level
The distribution of the standardized regression coefficients for all 116 species, which reflected
the nature of the relationship between seasonal fish catch and time for each species, was skewed to the
right, centered around -0.4, and spread between -0.78 and 0.66 (Fig. 1). Out of the 116-total species, 90
(78%) had negative standardized regression coefficients. These results indicate that the seasonal catches
of these species harvested by the Dai fishery declined over the 15 years studied. On the contrary, there
were also species (26 out of 116 or 22%) with positive standardized regression coefficients, indicating
an increase in the catch of these species by the Dai fishery. Interestingly, Oreochromis mossambicus is
an exotic species that was among the largest positive coefficients observed. In addition, Labiobarbus
lineatus, Henicorhynchus lobatus and H. cryptopogon (synonym of Lobocheilos cryptopogon) are all
known to be highly prolific and form the largest proportion of the catch from the fishery. These species
also had positive standardized coefficients (see Table S6 for standardized regression coefficients,
maxTL and trophic level for each species). In fact, the increase in these species stabilized the seasonal
143

29
Dai catches as it was evidenced in the total catch of the fishery which was stationary over the study
period (p-value=0.982, Fig. S8).
Fig. 1. Distribution of standardized regression coefficients of seasonal catches of 116 fish species
recorded at the Dai fishery, Tonle Sap River from the fishing season of 2000/01 to 2014/15.
Species with declining catch in the Dai fishery were disproportionately represented by those
with larger body sizes and higher trophic levels based on linear regressions (Fig. 2a, b), which
demonstrated overall negative relationships between the log+1 transformed standardized regression
coefficients and the corresponding log-transformed maxTL (slope=-0.08, p-value=0.08, r2=0.03), and
trophic level (slope=-0.15, p-value=0.024, r2=0.04). In the regression model, five endangered and
critically endangered species (solid points on Fig. 2a, b) were included. However, it was also likely that
these species were very rare and, as such, their catches obtained in the catch assessment could be
misleading. Therefore, when they were dropped from the analysis, the significant relationships were
indicated with both maxTL (slope=-0.13, p-value=0.006, r2=0.06) and trophic level (slope=-0.16, p-
value=0.02, r2=0.05).
144

30
When grouped by positive and negative standardized regression coefficient values (for all 116
species), maxTL was significantly greater for the species with negative standardized regression
coefficients than the positive ones (Fig. 2c; Mann-Whitney rank sum test, p-value=0.02). Negative
values of standardized coefficients were noted for species with maximum length corresponding to >45
cm (3rd quartile), whereas positive standardized regression coefficients were noted for species with
maxTL <25 cm (2nd quartile). Species with both negative and positive coefficient values fell within
maxTL of ~25 cm and ~45 cm. Trophic level did not significantly differ between negative and positive
standardized regression coefficients (Fig. 2d; Mann-Whitney rank sum test, p-value=0.08).
Nevertheless, species with negative standardized coefficients had higher trophic levels >3.3 (3rd
quartile), and species with positive standardized regression coefficients had lower trophic levels
(<2.75). Species with both negative and positive coefficient values fell within trophic levels of ~2.75
and ~3.3. Furthermore, weighted mean maxTL and trophic level of seasonal total catch (Fig. 3a, b)
oscillated with a mean range of ~25-55 cm and ~2.4-2.8, respectively, and significantly declined across
the 15-year period (mean maxTL: slope=-1.26, p-value=0.007, r2=0.44; mean trophic level: slope=-
0.013, p-value =0.025, r2=0.33). Although some small-bodied species including Parachela siamensis
(maxTL: 18.3 cm; trophic level: 3.4), Parambassis wolffii (maxTL: 24.4 cm, trophic level: 3.72) and
Acantopsis sp. cf. dialuzona (maxTL: 30.5, trophic level: 3.5) also exhibited significant declines in
seasonal catches (standardized coefficients<-0.66), our combined findings indicate that smaller, lower
trophic position species increased and compensated for declines in larger bodied, higher trophic position
species in the Tonle Sap fishery over the study period.
145
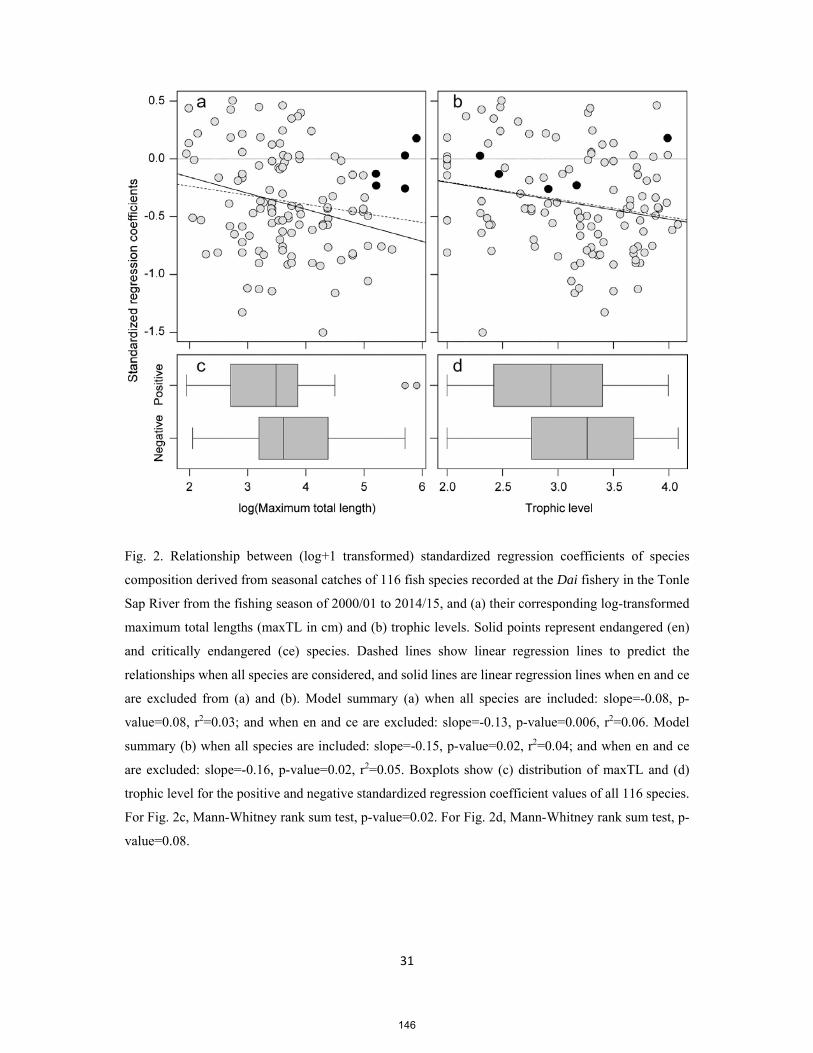
31
Fig. 2. Relationship between (log+1 transformed) standardized regression coefficients of species
composition derived from seasonal catches of 116 fish species recorded at the Dai fishery in the Tonle
Sap River from the fishing season of 2000/01 to 2014/15, and (a) their corresponding log-transformed
maximum total lengths (maxTL in cm) and (b) trophic levels. Solid points represent endangered (en)
and critically endangered (ce) species. Dashed lines show linear regression lines to predict the
relationships when all species are considered, and solid lines are linear regression lines when en and ce
are excluded from (a) and (b). Model summary (a) when all species are included: slope=-0.08, p-
value=0.08, r2=0.03; and when en and ce are excluded: slope=-0.13, p-value=0.006, r2=0.06. Model
summary (b) when all species are included: slope=-0.15, p-value=0.02, r2=0.04; and when en and ce
are excluded: slope=-0.16, p-value=0.02, r2=0.05. Boxplots show (c) distribution of maxTL and (d)
trophic level for the positive and negative standardized regression coefficient values of all 116 species.
For Fig. 2c, Mann-Whitney rank sum test, p-value=0.02. For Fig. 2d, Mann-Whitney rank sum test, p-
value=0.08.
146

32
Fig. 3. Community weighted mean: (a) maximum total length (maxTL) and (b) trophic level in seasonal
catches of the Dai fishery from the fishing season of 2000/01 to 2014/15. For Model summary (a),
intercept=42.53, slope=-1.29, predictor p-value=0.007, r2=0.44. For Model summary (b),
intercept=2.74, slope=-0.013, predictor p-value=0.025, r2=0.33. Pink shaded area denotes standard
deviation around the mean values. 2001 represents the fishing season of 2000/2001 and the same for
other years.
147
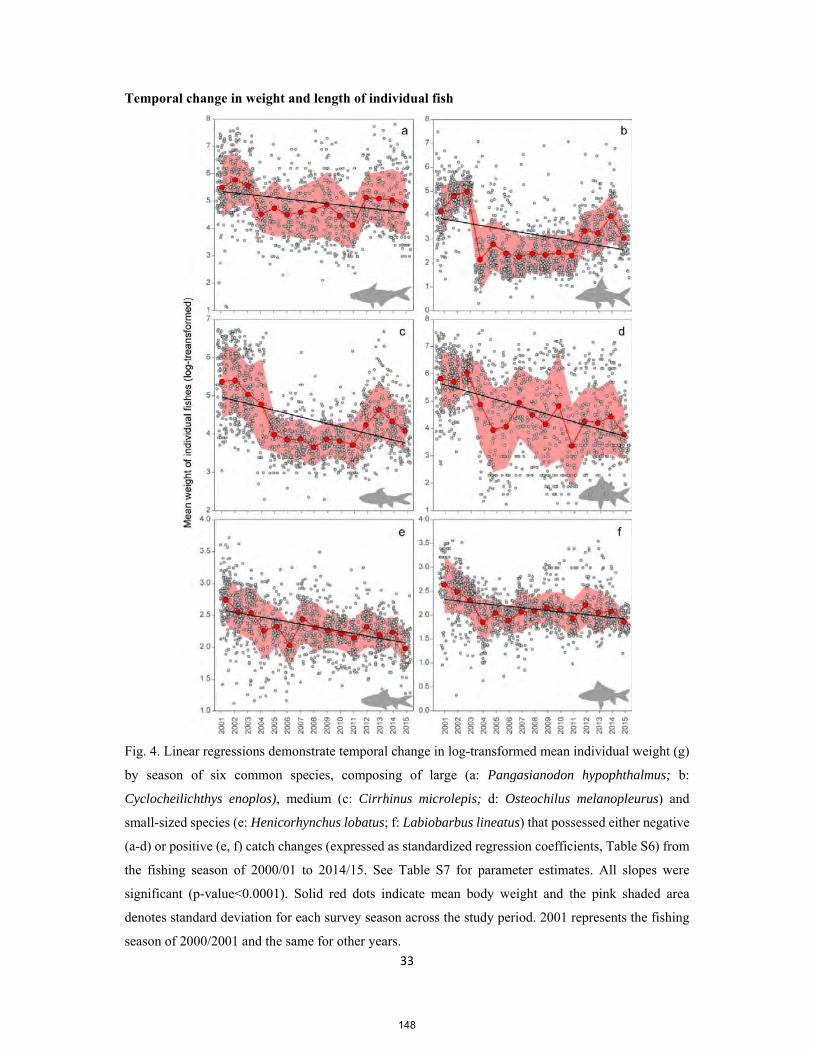
33
Temporal change in weight and length of individual fish
Fig. 4. Linear regressions demonstrate temporal change in log-transformed mean individual weight (g)
by season of six common species, composing of large (a: Pangasianodon hypophthalmus; b:
Cyclocheilichthys enoplos), medium (c: Cirrhinus microlepis; d: Osteochilus melanopleurus) and
small-sized species (e: Henicorhynchus lobatus; f: Labiobarbus lineatus) that possessed either negative
(a-d) or positive (e, f) catch changes (expressed as standardized regression coefficients, Table S6) from
the fishing season of 2000/01 to 2014/15. See Table S7 for parameter estimates. All slopes were
significant (p-value<0.0001). Solid red dots indicate mean body weight and the pink shaded area
denotes standard deviation for each survey season across the study period. 2001 represents the fishing
season of 2000/2001 and the same for other years.
148

34
The log-transformed mean fish body weight captured per day in the Dai fishery significantly
decreased over the study period for all 6-species explored (p-value<0.0001; Fig. 4; parameter estimates
provided in Table S7). These species span a range in body size (large, medium and small) and regression
coefficients indicated that individual fish weight consistently declined through time for all 6 species
regardless of body size (Fig. 4a-f).
Fig. 5. Violin plots show temporal shift in length distribution of four species (a: Cyclocheilichthys
enoplos, b: Cirrhinus microlepis; c: Henicorhynchus lobatus; d: Labiobarbus lineatus) from the fishing
season of 2000/01 to 2014/15. Red solid line symbolizes median body size in each fishing season and
grey thin lines indicate decile, dividing ten equal groups of a population. Area above the gray shaded
area denotes estimated total length at maturity for each species. 2001 represents the fishing season of
2000/2001 and the same for other years.
Violin plots further elucidated the temporal changes of the total length for four common species
(Fig. 5). For the large- and medium-sized species Cyclocheilichthys enoplos (maxTL: 90.3 cm) and
149

35
Cirrhinus microlepis (maxTL: 79.3 cm), both of which were mainly captured at juvenile sizes with the
average total length<20 cm and 25 cm, respectively; body lengths have declined since the early 2000s
when some comparatively large individuals (>30 cm) were present in the Dai fishery’s catches (Fig. 5a,
b). Noticeably, the medians for these large and medium-sized species were significantly lower than 49
and 44 cm (Fig. 5a, b), the estimated lengths at maturity for C. enoplos and C. microlepis, respectively.
For the smaller species (maxTL<20 cm), H. lobatus and L. lineatus, which are common and highly
productive, total length in the Dai catches had a median of ~9 cm, with some individuals possessing
lengths greater than lengths at maturity which are ~12 cm for H. lobatus and ~10 cm for L. lineatus
(Fig. 5c, d). Both species also exhibited gradual decrease in the median total length, but less pronounced
than those of large-sized species.
Discussion
Trends in the seasonal catches of harvested species revealed that 78% of the 116-species are in
decline. While we do not have fishery independent data to confirm the large Dai dataset, our results are
consistent with the prediction of an intensively exploited indiscriminate fishery. Consistent with
indiscriminate fishing theory, a closer examination of the data indicated that the catch declines are
disproportionally represented by the larger, slower growing, higher trophic level organisms of the Tonle
Sap. By contrast, the 22% of species caught by the Dai fishery that have tended to show increases are
disproportionally represented by small-bodied, faster growing lower trophic level organisms. In
addition, significant declines of the mean fish size and trophic level were evidenced in the seasonal
catches of the fishery over the study period (Fig. 3a, b). Finally, the data consistently showed for
common species spanning a range in adult body sizes that individual weights and lengths of all these
species, even in many of the small-bodied species, have been significantly reduced over the last 15
years, a result that resonates with much research that has found that heavy fishing pressure is known to
drive shifts in life history towards smaller sizes and earlier ages at maturation 23. Our results also pointed
out for select species that the number of immature fish captured has increased throughout the study
period. Moreover, a significant decreasing trend in species evenness was observed over the study period
(Fig. S5). Thus, although this fishery has been amazingly resilient to changes in total fish harvest levels,
these results collectively are in agreement with predicted effects of indiscriminate fishing theory.
Because this theory ultimately predicts declines in fish catches and diversity with sustained, heavy
indiscriminate fishing pressure13–15,24, our findings may be seen as an ‘early warning signal’ of looming
negative impacts of indiscriminate fishing in the Tonle Sap.
Intriguingly, recent work has argued that such indiscriminately fished systems may generally
occur in tropical systems where fish is the major source of animal protein 25. Consistent with this
conjecture, recent empirical fisheries data in the East China Sea15, where fish is also a major source of
protein, has argued that this fishery is relatively indiscriminate and has also showed a compensatory
150
36
positive growth response by small fish to heavy fishing. Further, and consistent with our results, they
argued that this compensatory response helped maintain fishery production21. This compensatory
response is expected in indiscriminate fisheries as fishing effectively replaces slow growing larger,
often higher trophic level fish, with faster growing smaller fish that tend to be from lower trophic levels 13–16. This reduction of upper trophic level fish drives a cascading effect whereby released predation
pressure allows lower trophic level species to flourish 15. As shown in Fig. S8, CPUE (catch per Dai
unit per day) in this large fishery fluctuated with no significant trend over the study period suggesting
that the smaller fish growth rates are indeed compensating for reduction in upper trophic level catches.
Given the reduction in mean body size and trophic level over time (Fig. 3a, b) as well as the average
positive growth rates of small species (Fig. 1) our results suggest that small faster growing species are
compensating for the heavy fishing pressure.
Our findings of declining catches of medium and large-sized species as well as falling mean
body size of fish catches support general perceptions by fishers throughout the Lower Mekong Basin 26–28. Our results, therefore, are consistent with existing knowledge that some giant- and large-sized fish
populations in the Mekong region have declined since the 1900s. For example, the Mekong giant catfish
(Pangasianodon gigas) (maxTL: 300 cm, max. weight: 350 kg), which was common and abundant in
the 1900s, has almost disappeared from the Mekong River System 27,29. Tonle Sap River is one of the
last few places where a small number of individuals of this species are still occasionally captured 29. In
particular, the standardized regression coefficient for this species was almost zero (0.03), indicating
little change in its contribution to the Dai catch since 2000. This perhaps reflects either effectiveness of
conservation measures or that its population status is close to extinction. Likewise, the Mekong giant
carp (Catlocarpio siamensis) (maxTL: 300 cm, max. weight: 300 kg) was seen regularly in the catch of
1938-39 and 1962-63 30,31. Nowadays, however, the Mekong giant carp has become critically
endangered. Similarly, the Mekong shad (Tenualosa thibaudeaui) (maxTL: 60 cm) was still relatively
abundant in the Dai catch in 1938-39 and 1962-63 and used to be one of the most important species.
Nonetheless, it too has been experiencing drastic decline during the last two decades 32. The list of large-
bodied species in decline goes on. Jullien's golden carp (Probarbus jullieni) (maxTL: 183 cm, max.
weight: 70 kg) was noticed as ‘comparatively scarce’ for at least 65 years in Thailand 33, and together
with Thicklipped barb (Probarbus labeamajor) were later observed to be very abundant in 1970s in the
Southern Laos and northern Cambodia (when the region was at war). Both have declined, particularly
since 1990s when the region’s border trade was re-opened up 22,34 and now these two species are
considered to be endangered by the IUCN Red List. Similarly, other formerly-common and high value
species, including Cirrhinus microlepis (maxTL: 79.3 cm), have been assessed as a vulnerable species
in the IUCN Red List. Based on our analysis, these giant- and large-sized species have all declined
during 2000-2015.
151

37
The decline in the giant and larger-bodied species is likely associated with their slower growth
and late age at maturation. For instance, both P. gigas and C. siamensis do not reach maturity until ~7
years of age 35. These larger species often require large geographical ranges to complete their lifecycle
and undertake long migrations between critical habitats 32,36, making them more susceptible to capture
before their first reproductive event. Given the increasing fishing pressure in the region, overfishing
seems a likely cause of the decline observed in giant, large and medium sized fish in the Tonle Sap,
which is consistent with previously observed declines in long-lived, late spawning freshwater fish
stocks such as the Murray River cod in Australia and ~21 sturgeon stocks across Asia, Europe and
America and Pirarucu (Arapaima gigas) in Amazon 37.
In contrast to large-bodied fish, the catch of some small-sized species such as Labiobarbus spp.
(synonym of Dangila spp.) increased significantly over the study period. For instance, members of this
genus accounted for ~5% of the Dai fishery catches between 1995 and 2000 27 but increased to 19% in
2013/1438. Additionally, Henicorhynchus spp., which are ecologically important in the LMB 34,39, made
up 25.4% of the total Dai catch weight in 1962-63 31 but increased to 40% between 1995 and 2000 27
and increased again to 43% in 2013/14 38. Comparable increasing trends are also manifested for other
small-sized cyprinids that are likely more robust to fishing pressure and also reproduce quickly on the
vast area of seasonal flooded land every year 13,15,26,32once predatory pressures of higher trophic level
fish 27,32,40 are reduced.
While our results from the Tonle Sap revealed that overall declining catches were associated
with large-bodied species, some small-sized species were also declining. These species feed in higher
trophic levels (3.4-3.7) than some giant- and large-sized species such as the Mekong giant catfish (2.3)
and Mekong giant carp (2.92) which are detritus and algae feeders. It is also likely that threat status of
freshwater fishes was not as clear-cut as that of the marine fishes as evidenced in a study of extinction
risk of European freshwater fishes where small-bodied species were most at-risk due to their small
geographical ranges41. Likewise, when comparing fish body-size distribution under different global
extinction risk levels, threats were found to disproportionately occur to both large- and small-sized
species42. It is likely that further research on individual life history traits may help shed light on reasons
of the decline, which is warranted because overfishing is not be the only threat to the Tonle Sap’s fishes.
Moreover, both increased efficiency of fishing gears and increased human population size have
likely contributed to declining large-sized species in the Tonle Sap. In Cambodia, the use of
monofilament nylon gillnets was to blame for the decline of C. microlepis, B. microlepis, Probarbus
spp., T. thibaudeaui, P. hypophthalmus, Wallago leeri (maxTL: 150 cm) and Irrawaddy dolphins 22,40,43
and were considered as a ‘wall-of-death’ for many migrating fishes 28. The problems caused by these
fishing techniques have likely been exacerbated by population growth and the population of countries
sharing the Lower Mekong Basin has increased about threefold between 1960 and 2015. Similarly, the
Cambodia population has also grown almost threefold with ~85% rural dwellers 44. Since entry into
152

38
fishing is free, and fishing gears are very affordable, 28,43 a combination of forces including rising
population along with the lack of other livelihood options, has resulted in millions of people moving
into the fishing sector thereby increasing fishing effort and pressure on fish stocks.
Further, hydropower development in the region also poses an increasingly large additional
threat to the Mekong fisheries. Numerous hydropower developments loom over the Mekong Basin
threatening to alter flows, fragment habitats, block fish migration routes from completing lifecycle,
degrade water quality and reduce the overall productivity of rivers resulting from nutrients and sediment
losses. This is particularly troubling because the migratory species present in the Tonle Sap represent a
third 45 of an estimated 1,200 fish species with 877 species recorded from the Mekong Basin 9,46. In
Cambodia, migratory species form 63% of catch by weight from Tonle Sap floodplains 27 and up to
82% from Tonle Sap River (Result Section).
The findings in this paper, for the first time, demonstrate evidence that the catches of the large-
and medium-sized species in the Tonle Sap are declining while some small-sized, fast-growing species
are increasing and contributing to the maintenance of the Dai fishery’s overall catches in the past
decades. This is akin to other notable indiscriminate fisheries such as that recently noted in the East
China Sea where catches consisted of 1-year-old fish and the high exploitation level has been sustained
for at least 10 fish generations15. This paper further demonstrates that even small-bodied species, so far
capable of increasing their production on average, are showing significant reductions in body size with
the consequence of an overall reduction in the percentage of mature individuals. This latter result is a
warning signal to fisheries managers and conservationists that the species-rich Tonle Sap, so far able to
maintain total harvest levels, may be close to its limit. The findings suggest that enhanced protection
and conservation efforts are urgently needed to maintain food security in this region.
Fortunately, formal institutions for fisheries protection and conservation in Cambodia are now
in place 47 with restrictions imposed on fishing seasons, gears and geographical areas (fish sanctuaries).
Sufficient resource allocation to the sector are therefore necessary to enforce and monitor these fisheries
regulations in order to protect and converse the fish biodiversity in the Tonle Sap, with the main aim to
(1) let fish spawn at least for the first time before capture, (2) let fish grow and (3) let the mega-spawners
live48. Tonle Sap River is specifically a natural passageway for many seasonal migratory fishes in the
region. Setting appropriate regulations on the basis of known peak seasonal migrations during the
inflow and outflow periods that allows some fishes (including endangered species) to pass through the
river, would enable some juveniles and broodfishes to complete their life cycles, i.e. accessing the Tonle
Sap floodplains and area south of Phnom Penh to feed, and the upstream of the Mekong mainstream
and tributaries to seek dry-season refuge and breed 36,49. Together with maintaining natural flow and
hydraulic conditions for the longitudinal and lateral connectivity among these critical habitats that
guarantee free migration routes for fishes are highly likely to be key drivers for the sustainability of the
Tonle Sap fisheries. Further, the current formal fisheries management regime favors community-based
153

39
fisheries co-management, where 516 community fisheries (CFis) including 228 in the Tonle Sap
floodplains have been established countrywide50. Conservation priority should be given to the CFis
situated in these key critical fish habitats. By effectively protecting and conserving these areas combined
with appropriate hydraulic conditions, some juveniles and broodfishes may be maintained to sustain the
seasonal reproduction, recruitment and growth. For future work, it is worth exploring a modelling
approach which is able to suggest a management strategy that maximizes the present benefits from the
Tonle Sap fishery while maintaining its long-term sustainability 51.
Methods
Dai fishery
This study used time series catch data of a standardized assessment on an industrial-scale ‘Dai
fishery’ between 2000-2015 (see also S1). The fishery seasonally operates between October and March
in a specific location along the lower section of the Tonle Sap River, stretching about 4-30 km north of
Phnom Penh. All Dai (64 units) are organized into 14 rows (referred to as row 2 to 15, with the most
upstream row 15 situated closest to the Tonle Sap Lake; Fig. 6a) and operated singly or jointly of up to
7 units in a single row (Fig. 6b). A Dai unit can be uniquely identified through a combined alpha-
numeric code of row number and the letter ‘A’ to ‘H’ of each individual Dai in that row. For example,
Dai 2A indicates Dai A in row number 2. The transversal position of Dai rows within the river channel
changes along up- and downstream axis (Table S2). In Row 2-4 and 7, Dai is positioned towards the
right bank (facing upstream) while row 13 and 14 are anchored more to the left bank, and the other units
are positioned around the center of the river. Such positions of Dai row remain relatively unchanged
for more than a century, with the aim to maximize catches dependent on local river morphology and
hydrology 52. Every Dai row is never broad enough to block the river, because by law, they have to
leave space for navigation 43,47.
Dai is a relatively indiscriminate fishing gear. The mesh sizes of the gear taper down from ~15
cm at the mouth to 1 cm at the codend. The Dai mouth is about ~25 m wide and its opening is determined
by the water depth with the lower footrope (with chain) anchored at the river bottom and the upper rope
on the water surface. The opening of the Dai mouth is maintained by the force of water current. The
fishing gear is installed in the Tonle River to filter fish that migrate out of the Tonle Sap floodplains
back to the Mekong River during the dry season each year. Overall, the fishing effort of the Dai fishery
(number of Dai units, gear dimensions, season of fishing and geographical location of the fishery)
remains relatively constant over the study period, although some increases in hauling time have been
reported during the peak migration periods 52. Technical details of the Dai gear are described in 43.
Assuming that (1) the migration of fish from nearby floodplains to the between-Dai rows and (2)
removals of fish by other small-scale fishing gears operating between Dai rows could be ignored, the
mean catch rate of the fishery has a general declining slope from row 15 down through row 2 (from
154
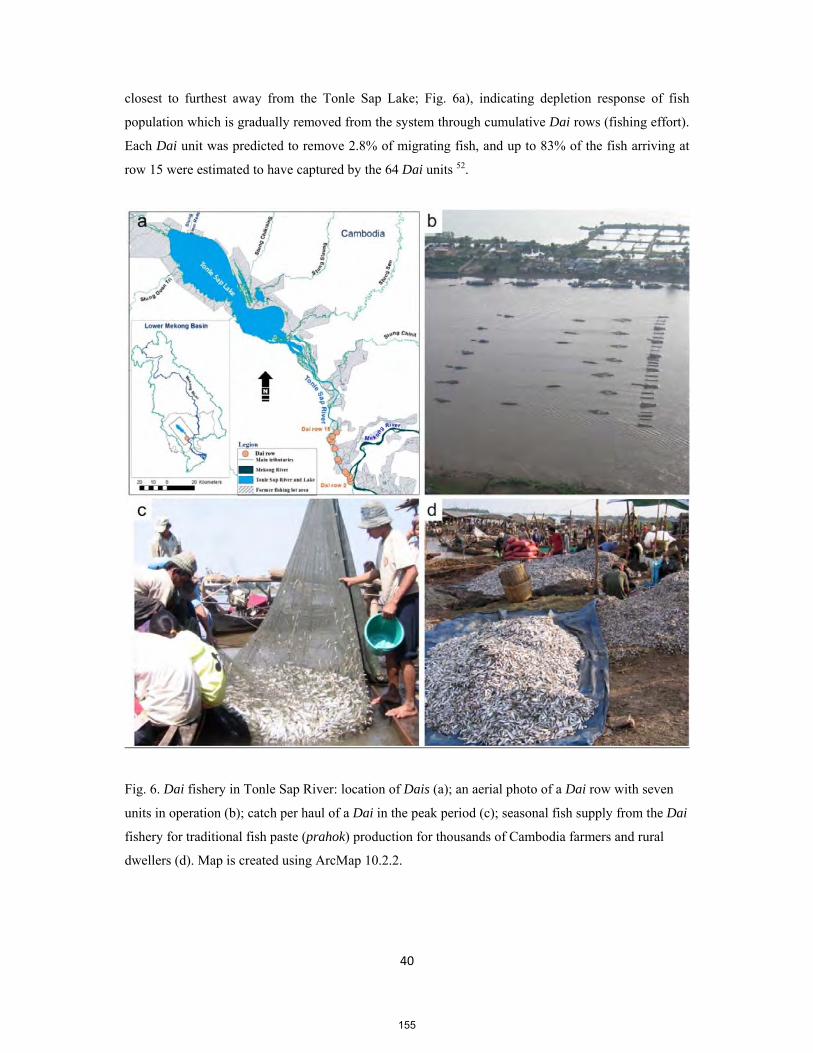
40
closest to furthest away from the Tonle Sap Lake; Fig. 6a), indicating depletion response of fish
population which is gradually removed from the system through cumulative Dai rows (fishing effort).
Each Dai unit was predicted to remove 2.8% of migrating fish, and up to 83% of the fish arriving at
row 15 were estimated to have captured by the 64 Dai units 52.
Fig. 6. Dai fishery in Tonle Sap River: location of Dais (a); an aerial photo of a Dai row with seven
units in operation (b); catch per haul of a Dai in the peak period (c); seasonal fish supply from the Dai
fishery for traditional fish paste (prahok) production for thousands of Cambodia farmers and rural
dwellers (d). Map is created using ArcMap 10.2.2.
155

41
Data collection
Catch data from the Dai fishery were made available by the Fisheries Programme of the
Mekong River Commission that technically and financially support the catch assessment programme.
The catch of the fishery has been routinely assessed by the former Department of Fisheries (currently
is the Fisheries Administration - FiA) and later by the Inland Fisheries Research and Development
Institute (IFReDI) of the FiA in cooperation with its sub-national counterparts. General concepts and
formula for assessing catches and catch composition are outlined in 53, and these concepts were used to
frame the sampling protocols and assessing catches of the fishery. The sampling unit was based on Dai
unit and a randomly stratified sampling method was used for this paper. More specifically, Dai units
were stratified based on (Fig. S3): (i) administrative space divided into two strata: Kandal Province
(row 15-7 containing 42 Dai units) and Phnom Penh Municipality (row 6-2, containing 22 units), (ii)
time based on the lunar period: Peak Period occurring in a time-window between 7-1 days before full
moon and Low Period, covering the rest of each month for the entire fishing season (iii) Dai types: High
Catch Dai units (11 in Kandal and 6 in Phnom Penh) and Low Catch Dai units (31 in Kandal and 16 in
Phnom Penh). Relative locations of all Dai units within the Tonle Sap River is given in (Table. S2).
Sampling on catches per haul or CPUE; including CPUE for species in catch composition and the daily
number of hauls of a Dai unit were conducted in each stratum, lunar period and Dai type within each
month of the fishing season for monthly catch estimate. Likewise, fishing effort (number of active Dai
units and active days) were recorded according to the stratification framework throughout each fishing
month over the whole fishing season across the study period. Sampling takes place around 17
days/month with intensive sampling (every day) during Peak Period and every second or third day in
the Low Period.
Catch Per Unit Effort or daily catch rate of the Dai unit (kg) is estimated as the product of
sampled weight for haul, i and estimated number of hauls in a day 52:
daidtlustmtddidaidtlustmtidaidtlustmtdd haulweightCPUE ,,,,,,,,,,,,,,,, . (1)
Where dd=day, mt=month, st=stratum, lu=lunar period, dt=Dai type, dai=individual Dai unit,
weight=weight of haul, and haul=estimated number of hauls in a day. Mean daily CPUE is based on
mean daily catch samples per haul multiplying by the total number of haul per day. The estimated
monthly catch for a given stratum, lunar period and Dai type, is as follows:
dtlustmtdtlustmdtlustmt FEEsCPUECMtEs ,,,,,,,,, ... (2)
Where, Es.Mt.C=Estimated Monthly Catch, Es.FE=Estimated Fishing Effort. Estimated fishing effort
is given by:
dtlustmtdtlustmdtlustmt AGADFEEs ,,,,,,,,,. (3)
156

42
Where AD is number of active (fishing) days and AG is number of active (fishing) gears for a given
stratum, lunar period and Dai type. Additionally, estimated monthly species composition is computed
as follows:
dtlustmtdtlustmdtlustmt CMtEsSPESpeciesMtEs ,,,,,,,,, .... (4)
Where Es.Mt.Species is Estimated Monthly Catch for a Species, SPE=a fraction of the total estimated
catch corresponding to that species and is formulated from the proportion of that species found in the
samples. The total catch estimated for a season is the aggregation of the monthly catch estimated for
that season.
Apart from sampling data on total catch for each species in each season, data were also obtained
for the number, weight and length of some common and commercial individual fish caught per day of
each fishing season. These species are among the most ecological, sociocultural (food nutrition and
security) and economic important species in the region 32,46,51. Therefore, they were used to examine the
temporal changes in body weight and length for this study (see Fig. 4, 5). Further description of the
sample sizes, sampling protocols, data collection forms on catch, species composition and fishing effort,
the formula for catch estimation as well as the database system to store and manage the collected data
of the fishery are given in detail by 52.
The current Dai fishery database contains information on a total of 141 species. However, only
116 fish species were included in the analysis for this paper because data on the seasonal catches of the
other species were sporadic throughout the time series. Furthermore, the species dropped from the
analysis were quite marginal in terms of overall catch, and the total catch of the 25-fish species not
included in this analysis only represented 0.38% of the total fishery’s catch recorded between 2000-
2015. Of 116 species, the analysis includes 5 endangered and critically endangered species namely
Probarbus jullieni, Probarbus labeamajor, Catlocarpio siamensis, Pangasianodon gigas and
Pangasius sanitwongsei.
In addition to the Dai fishery datasets, data was also obtained on maxTL and trophic level of
fish species in the Tonle Sap from FishBase 54. Fish species classification and their ecological attributes
were based on the Mekong Fish Database 55, and are updated using FishBase 56, in cross-checking with
the Catalogue of Fishes Online Database as well as other literature including 57,58.
Statistical analysis
All data analyses were performed in R Programme 59. Linear regression was used to predict the
rate of change in the total catch weight of 116 fish species recorded at the Dai fishery between 2000
and 2015. The temporal trend for each of the 116 species was expressed as a standardized regression
coefficient to allow comparison among species. Standardized regression coefficients measure the
change in the dependent variable resulting from a one-standard-deviation change in the independent
157

43
variable 60. In univariate linear regression, standardized regression coefficient equals the correlation
coefficient (with its values varying between -1 and +1), the intercept equals zero, and the positive and
negative signs of standardized coefficients or regression weights (slope) indicates the kind of correlation
between the variables 61,62. Linear regressions, and the generation of standardized regression
coefficients, were performed using the ‘lm’ function of ‘stats’ package and ‘lm.beta’ function of
‘QuantPsyc’ package 59.
Histograms were used to visualize the distribution of standardized regression coefficient values
of all species. Simple linear regressions were used to explore the global trend of the relationships
between standardized regressions coefficients and species’ maxTL and trophic levels (obtained through
FishBase). For all regression analyses, normality was ensured by Shapiro tests (p-value>0.05). Log+1
transformation was applied to normalize the skewness of standardized regression coefficients prior to
the linear regression analyses. In addition, weighted means of maxTL and trophic level in Dai catches
by season were computed to examine trends of mean maxTL and tropical level across the 15-year study
period. To explore temporal trends in the individual weights of the fish constituting the catch, the mean
weight of all individuals captured per species per day was calculated and regressed against time. To
deal with the data skewness, mean body weight was log-transformed before the analysis, and standard
deviation for each species was also computed for each fishing season for the whole study period. This
analysis was performed for six common species that spanned a range in standardized regression
coefficient values (positive, zero, negative), body sizes and trophic levels, and included large- and
medium-sized carps (Cyclocheilichthys enoplos, Osteochilus melanopleurus, and Cirrhinus
microlepis), a large-sized river catfish (Pangasianodon hypophthalmus), as well as small-sized and
highly productive mud carps (Henicorhynchus lobatus and Labiobarbus lineatus). Being ecological,
sociocultural and economic important species, the six species belong to the first two largest families
(Cyprinidae and Pangasiidae) forming the largest proportion of the total catches (84% and 4%
respectively) from the Dai fishery. In addition, H. lobatus is an ecological keystone species, the most
abundant species with its critical role in food security throughout the Lower Mekong Basin (including
the Tonle Sap) and an important prey species for many predatory fishes and Irrawaddy dolphins 63,64.
Labiobarbus lineatus shares similar ecological characteristics with H. lobatus. From the Dai fishery,
H. lobatus and L. lineatus are among the most dominant species contributing ~17% and 10% to the
Dai’s total catch weight respectively. Finally, an attempt was also made to analyze the temporal changes
in fish body length of the same six species (as we did with mean body weight). Given that, two of the
six species (P. hypophthalmus and O. melanopleurus) contained relatively small sample sizes on length,
only the other four species were included in the length frequency analysis. Nevertheless, the trends of
the four species (Fig. 5a-d) still provide a good example of the status and trends of riverine fishes in the
Tonle Sap and Lower Mekong Basin. Length frequency distributions of the four species were then
examined across the study period using the ‘violins’ function from ‘caroline’ package in R 65.
158

44
References
1. Welcomme, R. L. et al. Inland capture fisheries. Philosophical transactions of the Royal Society of London. Series B, Biological sciences 365, 2881–96 (2010).
2. Tockner, K. & Stanford, J. a. Riverine flood plains: present state and future trends. Environmental Conservation 29, 308–330 (2002).
3. de Graaf, G., Bartley, D., Jorgensen, J. & Marmulla, G. The scale of inland fisheries, can we do better? Alternative approaches for assessment. Fisheries Management and Ecology 22, 64–70 (2015).
4. Lynch, A. J. et al. The social, economic, and environmental importance of inland fish and fisheries. Environmental Reviews 24, 1–7 (2016).
5. Cook, S. J. et al. From ideas to action: Ten steps to responsible inland fisheries that support livelihoods, food security, and healthy aquatic ecosystems. in Freshwater, Fish and the Future Proceedings of the Global Cross-Sectoral Conference (eds. Taylor, W. W., Bartley, D. M., Goddard, C. I., Leonard, N. J. & Welcomme, R.) 343–351 (the Food and Agriculture Organisation of the United Nations and Michigan State University and American Fisheries Society, 2016).
6. Bartley, D. M., De Graaf, G. J., Valbo-Jørgensen, J. & Marmulla, G. Inland capture fisheries: Status and data issues. Fisheries Management and Ecology 22, 71–77 (2015).
7. FAO. The State of World Fisheries and Aquaculture 2016. Contributing to food security and nutrition for all. (Food and Agriculture Organization of the United Nations, 2016).
8. Welcomme, R. L., Baird, I. G., Dudgeon, D., Halls, A. and & Lamberts, D. in Freshwater Fisheries Ecology (ed. Craig, J. F.) 363–376 (John Wiley & Sons, Ltd., 2016).
9. Ziv, G., Baran, E., So, N., Rodriguez-Iturbe, I. & Levin, S. A. Trading-off fish biodiversity, food security, and hydropower in the Mekong River Basin. Proceedings of the National Academy of Sciences 109, 5609–5614 (2012).
10. Winemiller, K. et al. Balancing hydropower and biodiversity in the Amazon, Congo, and Mekong. Science 351, 128–129 (2016).
11. Grumbine, R. E., Dore, J. & Jianchu, X. Mekong hydropower: Drivers of change and governance challenges. Frontiers in Ecology and the Environment 10, 91–98 (2012).
12. Allan, J. D. et al. Overfishing of Inland Waters. BioScience 55, 1041–1051 (2005).
13. McCann, K. S. et al. Food webs and the sustainability of indiscriminate fisheries 1. Canadian Journal of Fisheries and Aquatic Sciences 73, 1–10 (2016).
14. Andersen, K. H. & Gislason, H. Unplanned ecological engineering. Proceedings of the National Academy of Sciences 114, 634–635 (2017).
15. Szuwalski, C. S., Matthew G. Burgess, C. C. & Gaines, S. D. High fishery catches through trophic cascades in China. PNAS 114, 717–721 (2017).
16. Costello, C. Fish harder; catch more? Proceedings of the National Academy of Sciences 114, 1442–1444 (2017).
17. Pauly, D. et al. Towards sustainability in world fisheries. Nature 418, 689–695 (2002).
18. Pauly, D., Christensen, V., Dalsgaard, J., Froese, R. & Torres, F. J. Fishing down marine food webs. Science 279, 860–863 (1998).
19. Shin, Y. J., Rochet, M. J., Jennings, S., Field, J. G. & Gislason, H. Using size-based indicators to evaluate the ecosystem effects of fishing. ICES Journal of Marine Science 62, 384–396 (2005).
159

45
20. Jennings, S. et al. Long-term trends in the trophic structure of the north sea fish community: Evidence from stable-isotope analysis, size-spectra and community metrics. Marine Biology 141, 1085–1097 (2002).
21. Piet, G. J. & Jennings, S. Response of potential fish community indicators to fishing. ICES Journal of Marine Science 62, 214–225 (2005).
22. Baird, I. G. Probarbus jullieni and Probarbus labeamajor: The management and conservation of two of the largest fish species in the Mekong River in southern Laos. Aquatic Conservation: Marine and Freshwater Ecosystems 16, 517–532 (2006).
23. Sharpe, D. M. T. & Hendry, A. P. Life history change in commercially exploited fish stocks: An analysis of trends across studies. Evolutionary Applications 2, 260–275 (2009).
24. Jacobsen, N. S., Gislason, H. & Andersen, K. H. The consequences of balanced harvesting of fish communities. Proceedings. Biological sciences / The Royal Society 281, 1–9 (2014).
25. McIntyre, P. B., Liermann, C. A. R. & Revenga, C. Linking freshwater fishery management to global food security and biodiversity conservation. PNAS 113, 12880–12885 (2016).
26. MRC. State of the Basin Report 2010. (Mekong River Commission, 2010).
27. van Zalinge, N., Nao, T. & Touch, S. T. Where there is water, there is fish? Fisheries issues in the Lower Mekong Basin from a Cambodian perspective. in Contribution to the Mekong Panel at the Seventh Common Property Conference of the International Association for the Study of Common Property, Vancouver, Canada, 10 - 14 June 1998 14 (International Association for the Study of Common Property, 1998).
28. Hortle, K. G., Lieng, S. & Valbo-Jorgensen, J. An introduction to Cambodia’s inland fisheries. Mekong Development Series No. 4 (Mekong River Commission, 2004).
29. Hogan, Z. S., Ngor, P. B. & van Zalinge, N. Status and conservation of two endangered fish species, the Mekong giant catfish Pangasianodon gigas and the giant carp Catlocarpio siamensis, in Cambodia’s Tonle Sap River. Natural History Bulletin of the Siam Society 49, 269–282 (2001).
30. Chevey, P. & Le Poulain, F. La pêche dans les eaux douces du Cambodge. Océanogr. Indochine 33, 1–183 (1940).
31. Fily, M. & D’Auberton, F. Cambodia. Report on fisheries technology in the Great Lake and the Tonle Sap, 1962-1963. (National Museum of Natural History, 1965).
32. Poulsen, A. F. et al. Distribution and Ecology of Some Important Riverine Fish Species of the Mekong River Basin. MRC Technical Paper No. 10 (Mekong River Commission, 2004).
33. Smith, H. M. The Fresh-water fishes of Siam, or Thailand. (United States National Museum Bulletin 188, 1945).
34. Roberts, T. R. & Baird, I. G. Traditional fisheries and fish ecology on the Mekong River at Khone Waterfalls in Southern Laos. Natural History Bulletin of the Siam Society 43, 219–26 (1995).
35. Mattson, N. S., Buakhamvongsa, K., Sukumasavin, N., Nguyen, T. & Ouk, V. Mekong giant fish species: on their management and biology. (Mekong River Commission, 2002).
36. Poulsen, A. F., Ouch, P., Viravong, S., Suntornratana, U. & Nguyen, T. T. Fish Migrations of the Lower Mekong Basin: Implications for Development, Planning and Environmental Management. (Mekong River Commission, 2002).
37. IUCN. The IUCN Red List of Threatened Species. Version 2016-2. (2016).
38. Ngor, P. B., Chheng, P. & So, N. Declines in catches of some large and medium-sized species in Tonle Sap River. Catch and Culture 21, 4–7 (2015).
160

46
39. Baird, I. G., Flaherty, M. S. & Phylavanh, B. Rhythms of the river: lunar phases and migrations of small carps (Cyprinidae) in the Mekong River. Natural History Bulletin of the Siam Society 51, 5–36 (2003).
40. van Zalinge, N. & Nao, T. Summary of Project Findings: Present status of Cambodia’s freshwater capture fisheries and management implications. in Present status of Cambodia’s fisheries and management implications (eds. van Zalinge, N. P., Nao, T. & Deap, L.) 1–20 (Mekong River Commission and Department of Fisheries, 1999).
41. Reynolds, J. D., Webb, T. J. & Hawkins, L. A. Life history and ecological correlates of extinction risk in European freshwater fishes. Canadian Journal of Fisheries and Aquatic Sciences 62, 854–862 (2005).
42. Olden, J. D., Hogan, Z. S. & Zanden, M. J. Vander. Small fish, big fish, red fish, blue fish: Size-biased extinction risk of the world’s freshwater and marine fishes. Global Ecology and Biogeography 16, 694–701 (2007).
43. Deap, L., Degen, P. & van Zalinge, N. Fishing gears of the Cambodian Mekong. (Inland Fisheries Research and Development Institute of Cambodia & Mekong River Commission, 2003).
44. World Bank Group. Population, total. Cambodia. World Bank Group (2015). Available at: http://data.worldbank.org/indicator/SP.POP.TOTL?locations=KH. (Accessed: 11th November 2016)
45. ICEM. MRC Strategic Environmental Assessment (SEA) of hydropower on the Mekong mainstream. (Mekong River Commission, 2010).
46. Rainboth, W. J. Fishes of the Cambodian Mekong. (Food and Agriculture Organisation of the United Nations, 1996).
47. FiA. Law on Fisheries. (Fisheries Administration, Ministry of Agriculture, Forestry and Fisheries, 2006).
48. Froese, R. Keep it simple: Three indicators to deal with overfishing. Fish and Fisheries 5, 86–91 (2004).
49. van Zalinge, N. et al. The Mekong River System. in Proceedings of the second international symposium on the management of large rivers for fisheries (eds. Welcomme, R. & Petr, T.) 335–357 (FAO Regional Office for Asia and the Pacific, 2004).
50. Jentoft, S. & Chuenpagdee, R. Interactive governance for small-scale fisheries: global reflections. (Springer International Publishing Switzerland, 2015).
51. Sabo, J. L. et al. Designing river flows to improve food security futures in the Lower Mekong Basin. Science 358, 1–11 (2017).
52. Halls, A. S. et al. The Stationary Trawl (Dai) Fishery of the Tonle Sap-Great Lake System, Cambodia. (Mekong River Commission, 2013).
53. Stamatopoulos, C. Sample-based fishery surveys: a technical handbook. FAO. Fisheries Technical Paper (Food and Agriculture Organisation of the United Nations, 2002).
54. Froese, R. & Pauly, D. FishBase. World Wide Web electronic publication (2017). Available at: www.fishbase.org. (Accessed: 1st February 2017)
55. MFD. Mekong Fish Database: A taxonomic fish database for the Mekong Basin. (Mekong River Commission, 2003).
56. Froese, R. & Pauly, D. FishBase. World Wide Web electronic publication. World Wide Web electronic publication (2017). Available at: www.fishbase.org. (Accessed: 1st February 2017)
57. Kottelat, M. The Fishes of the inland waters of Southeast Asia: A catalogue and core
161

47
bibliography of the fishes known to occur in freshwaters, mangroves and estuaries. The Raffles Bulletin of Zoology 27, 1–663 (2013).
58. Rainboth, W. J., Vidthayanon, C. & Mai, D. Y. Fishes of the Greater Mekong Ecosystem with Species List and Photoraphic Atlas. (Museum of Zoology, University of Michigan, 2012).
59. R Core Team. R: A Language and Environment for Statistical Computing. R Foundation for Statistical Computing 1, 409 (2015).
60. Schroeder, L. D., Sjoquist, D. L. & Stephan, P. E. Understanding Regression Analysis: An introductory Guide. 95 (1986).
61. Stellefson, M. L., Hanik, B. W., Chaney, B. H. & Chaney, J. D. A Tutorial on Calculating and Interpreting Regression Coefficients in Health Behavior Research. The Health Educator 40, (2008).
62. Vittinghoff, E., Glidden, D. V., Shiboski, S. C. & McCulloch, C. E. Regression methods in biostatistics: linear, logistic, survival, and repeated measures models. (Springer, 2012).
63. Fukushima, M., Jutagate, T., Grudpan, C., Phomikong, P. & Nohara, S. Potential effects of hydroelectric dam development in the Mekong River basin on the migration of Siamese mud carp (Henicorhynchus siamensis and H. lobatus) elucidated by otolith microchemistry. PLoS ONE 9, (2014).
64. Baird, I. G. The Don Sahong Dam. Critical Asian Studies 43, 211–235 (2011).
65. Schruth, D. A Collection of Database, Data Structure, Visualization, and Utility Functions for R. 38 (2013).
Acknowledgements
We are grateful to the Erasmus Plus, Belmont Forum (TLSCC project) and the European Erasmus+
credit mobility and capacity building CONSEA Programs for funding our study. This research was in
part funded by Belmont Freshwater Grant and Canada First Research Excellence Fund to KSM. Cordial
thanks to the Fisheries Programme of the Mekong River Commission, the Inland Fisheries Research
and Development Institute and the Fisheries Administration, Cambodia for making available the Dai
fishery datasets used in this study. We would like to thank Phen Cheng, Pengby Ngor, Loeung Deap,
Phalla Tan, Yuthy Sar and numerous data collectors and supervisors contributing to the Dai fishery data
collection and database management. Finally, great appreciation is extended to the Laboratory of
Evolution and Biological Diversity (EDB lab) supported by 'Investissement d'Avenir' grants (CEBA,
ref. ANR-10-LABX-0025; TULIP, ref. ANR-10-LABX-41).
Author contributions
SL supervised the project. PBN carried out fieldwork. PBN, SL and GG performed analysis. PBN
wrote the draft manuscript. PBN, SL, KM, BM, EF, GG and NS commented, edited and revised the
draft manuscript.
Additional information
Supplementary information: accompanies this paper.
Completing financial interests: The authors declare no competing financial interests.
162

48
Supplementary Information (S)
Supplementary information – S1
Tonle Sap River System
The TSRL is a flood pulse system, and is the largest wetland and an integral part of the history, culture,
ecology and economics in Southeast Asia 1. It is the only continuous area of natural wetland habitats
remaining in the Mekong system 2. UNESCO approved this area as a world Biosphere Reserve in 1997 3. During the dry season, the lake depth falls to 0.5 meter in late April with a surface area of about 2,000
km2 4. During the wet season (June-October), the Tonle Sap River, whose normal flow is from the Tonle
Sap Lake to the Mekong River, changes its direction when the Mekong waters rise faster than the Lake.
The Lake expands its size four to six times (10,000 to 15,780 km2) 5, inundating vast terrestrial
floodplain areas surrounding TSRL. TSRL’s biological productivity reaches its peak during this period
as both migratory fishes from the Mekong and resident fishes in the Lake invade the floodplains for
feeding, reproduction and nurseries. Eggs, larvae and fry of fish that spawn upstream in the Mekong
mainstream are also carried by the flow and dispersed into the TSRL’s sourrounding floodplains
through numerious channels, streams and man-made cannals for feeding, nurseries and growth. When
the Mekong flood recedes (September/October) and the Tonle Sap River reverses to its nornal flow,
large numbers of fish migrate back to the Tonle Sap Lake, then the Tonle Sap River and Mekong River
for dry-season refuges. It is during this period of receeding water (October – March) when Dai fishery
operates to target these migratory fishes. The fishery usually peaks in December and January in a time
window of 6-1 days before full moon during which the river is described as packed solid with fish.
Dai fishery
The Dai fishery or Loh Dai, was established around 140 years ago and resembles a stationary trawl net
anchored within the river channel 1. At present, it is the only industrial-scale inland fishery remaining
in the Lower Mekong Basin (LMB). Catches from the fishery contribute an estimated 14% of the
landings from the TSRL system (equivalent to 10% of total fish weight consumed in the LMB), and
make up of ~7% to the total inland capture fisheries landings in Cambodia 1. The Dai fishery seasonally
operates in a specific location along the lower section of the Tonle Sap River, stretching about 4-30 km
north of Phnom Penh. The river stretch covers two administrative zones: Phnom Penh Municipality and
Kandal Province. All Dai units are organized into 14 rows and operated singly or jointly of up to 7 units
in a single row (Fig. 1). Dai row 2-6 are situated in Phnom Penh municipality and row 7-15 are located
in Kandal Province with the most upstream row 15 situated in Kandal Province close to the Tonle Sap
Lake.
163

49
Between the 2000 and 2015 fishing seasons, the number of Dai seasonally operating in the Tonle Sap
River varied between 60 and 64 units. Generally, a Dai unit is between 100 and 120 meters long and 25
meters wide. The net opening (mouth) is determined by the water depth of the river where it is
positioned. The size and mesh sizes of the net taper down from the mouth (15 cm) to the cod-end (1
cm). Other details about gear dimensions are technically described by 6. Dai fishery operation is
regulated by a law on Cambodian fisheries 7. Dai fishery is technically standardized in terms of both
location and the gear use which are defined and controlled by the Cambodian law on fisheries. The so-
called ‘burden book’, attached to the law, further describes management legislation to be complied by
the Dai operators. The burden book explains operation rules such as rules on fishing season, Dai
positions in the river, size restrictions of fishing gear, payment and harvest, detailed descriptions of
which are explained by 1.
164
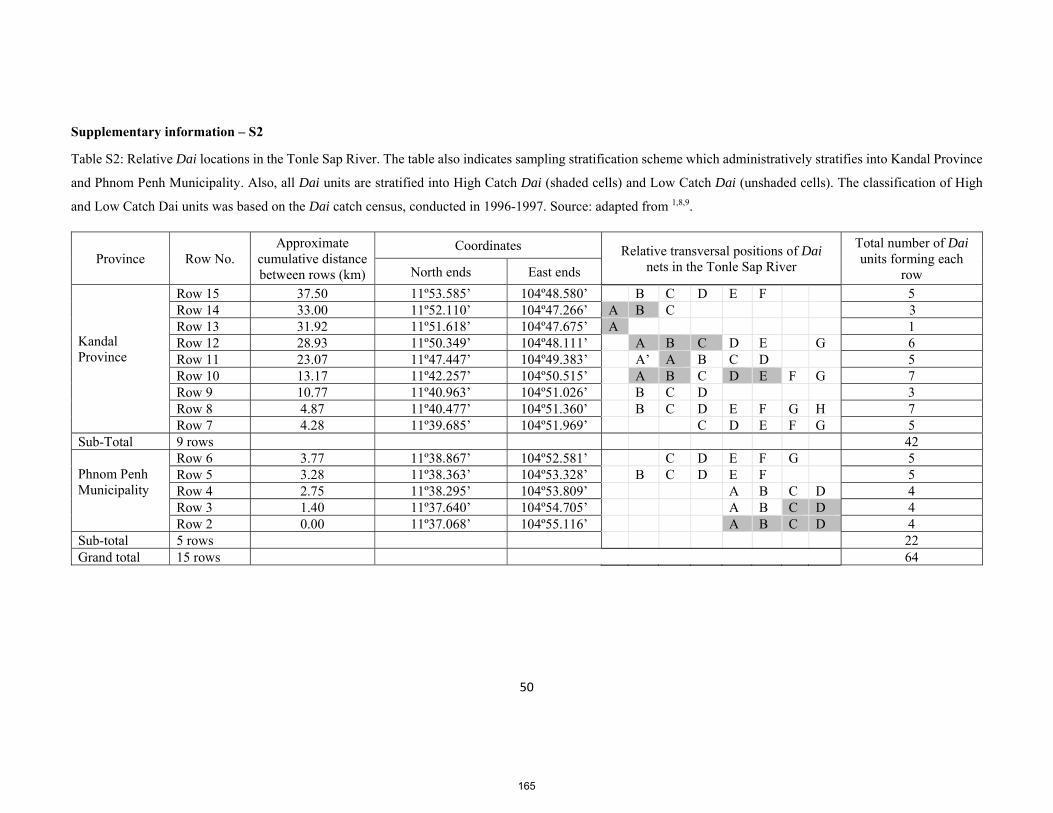
50
Supplementary information – S2
Table S2: Relative Dai locations in the Tonle Sap River. The table also indicates sampling stratification scheme which administratively stratifies into Kandal Province
and Phnom Penh Municipality. Also, all Dai units are stratified into High Catch Dai (shaded cells) and Low Catch Dai (unshaded cells). The classification of High
and Low Catch Dai units was based on the Dai catch census, conducted in 1996-1997. Source: adapted from 1,8,9.
Province Row No. Approximate
cumulative distance between rows (km)
Coordinates Relative transversal positions of Dai nets in the Tonle Sap River
Total number of Dai units forming each
row North ends East ends
Kandal Province
Row 15 37.50 11º53.585’ 104º48.580’ B C D E F 5 Row 14 33.00 11º52.110’ 104º47.266’ A B C 3 Row 13 31.92 11º51.618’ 104º47.675’ A 1 Row 12 28.93 11º50.349’ 104º48.111’ A B C D E G 6 Row 11 23.07 11º47.447’ 104º49.383’ A’ A B C D 5Row 10 13.17 11º42.257’ 104º50.515’ A B C D E F G 7Row 9 10.77 11º40.963’ 104º51.026’ B C D 3Row 8 4.87 11º40.477’ 104º51.360’ B C D E F G H 7Row 7 4.28 11º39.685’ 104º51.969’ C D E F G 5
Sub-Total 9 rows 42 Phnom Penh Municipality
Row 6 3.77 11º38.867’ 104º52.581’ C D E F G 5Row 5 3.28 11º38.363’ 104º53.328’ B C D E F 5Row 4 2.75 11º38.295’ 104º53.809’ A B C D 4Row 3 1.40 11º37.640’ 104º54.705’ A B C D 4Row 2 0.00 11º37.068’ 104º55.116’ A B C D 4
Sub-total 5 rows 22 Grand total 15 rows 64
165

51
Supplementary information – S3
Fig. S3 Outline of the sampling stratification scheme for the Dai fishery catch assessment. The mean catch
rate per haul (CPUE) is computed for a Dai unit on a day (large shaded area) within each stratum. The total
catch is calculated by multiplying the stratum-specific estimate of the mean daily CPUE by the two stratum-
specific raising factors: the number of active Dais and number of active days 1.
Dai 1 Dai 2 Dai 3
High Catch
Peak Period Low Period
Low
Phnom Penh Municipality Kandal Province
Month (Total Catch)
Species name
No. of fish
Body weight
Length (selected species) Big fish sample
Small fish sub-sample
Mean daily Effort per stratum Total haul
Season (Total Catch)
Mean daily CPUE per stratum
166

52
Supplementary information – S4
Fig. S4 Relative catch weight (%) of 116 fish species recorded at the Dai fishery between 2001 and 2015
Top five species, accounting for 65% of the total catch of Dai fishery
167

53
Supplementary information – S5
Fig. S5 Temporal variations in species evenness recorded at the Dai fishery between 2000 and 2015.
Species evenness (J) was computed based on J=H/log(S), where H is Shannon diversity index and S is
species richness. The value of species evenness varies between 0 and 1, with 0 signifying no evenness
and one indicating a complete evenness. Red points are the species evenness values representing fish
community for each fishing season. Blue solid line with shaded area around the smooth curve is loess
fitting with 95% confidence interval. Overall declining trend of species richness is discerned over the
study period between 2001 and 2015.
Supplementary information – S6:
Table S6: Species’ standardized regression coefficients and ecological attributes
Species Standardized regression coefficients
Status* Guild** maxTL Trophic level
Acantopsis sp. -0.68 ne 5 30.5 3.5 Albulichthys albuloides -0.53 ne 5 36.6 2.79 Amblyrhynchichthys truncatus -0.43 ne 5 48.8 2.4 Anabas testudineus 0.21 ne 1 25 2.98 Arius maculatus -0.40 ne 5 80 3.36 Bagarius bagarius -0.53 ne 5 200 3.72 Bagrichthys macracanthus -0.43 ne 5 30.5 2.95 Balantiocheilos melanopterus -0.57 ne 5 42.7 3 Barbichthys laevis -0.26 ne 5 36.6 2.66 Barbonymus altus -0.55 ne 3 24.4 2.4 Barbonymus gonionotus -0.40 ne 5 40.5 2.36 Barbonymus schwanenfeldii -0.47 ne 3 42.7 2.31 Belodontichthys truncatus -0.43 ne 5 73.2 4.08 Boesemania microlepis -0.13 ne 3 122 3.72 Carinotetraodon lorteti 0.15 ne 2 7.3 3.5
168
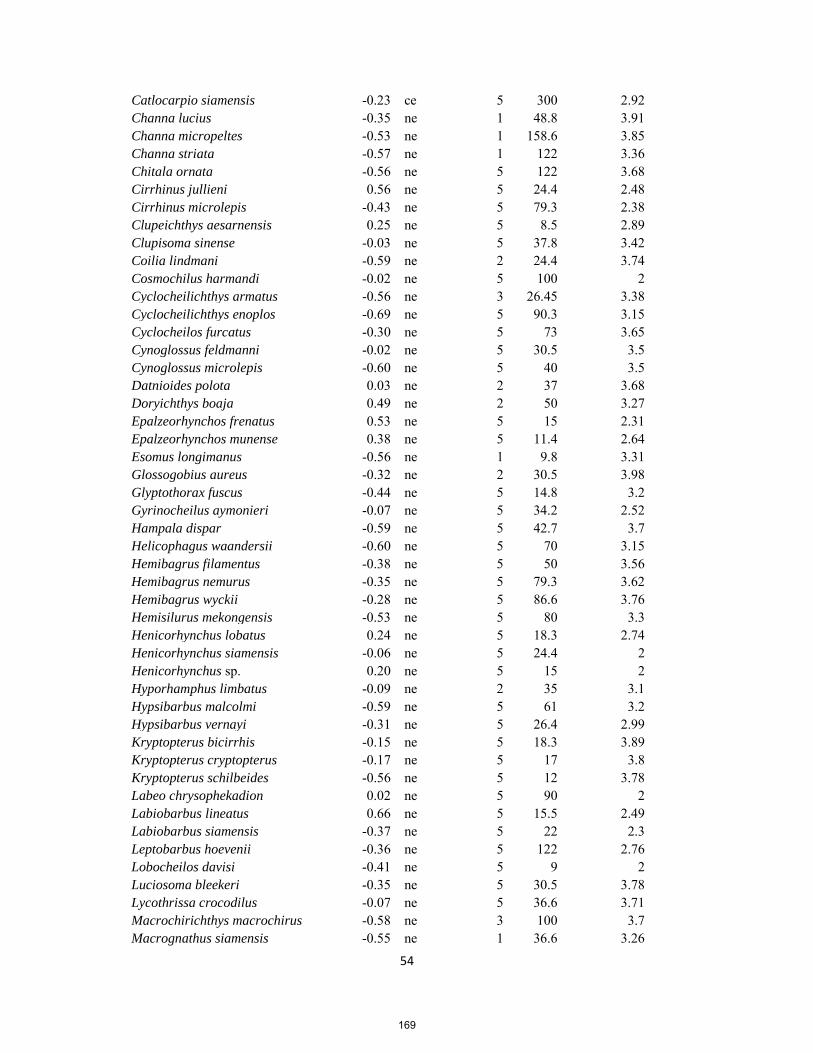
54
Catlocarpio siamensis -0.23 ce 5 300 2.92 Channa lucius -0.35 ne 1 48.8 3.91 Channa micropeltes -0.53 ne 1 158.6 3.85 Channa striata -0.57 ne 1 122 3.36 Chitala ornata -0.56 ne 5 122 3.68 Cirrhinus jullieni 0.56 ne 5 24.4 2.48 Cirrhinus microlepis -0.43 ne 5 79.3 2.38 Clupeichthys aesarnensis 0.25 ne 5 8.5 2.89 Clupisoma sinense -0.03 ne 5 37.8 3.42 Coilia lindmani -0.59 ne 2 24.4 3.74 Cosmochilus harmandi -0.02 ne 5 100 2 Cyclocheilichthys armatus -0.56 ne 3 26.45 3.38 Cyclocheilichthys enoplos -0.69 ne 5 90.3 3.15 Cyclocheilos furcatus -0.30 ne 5 73 3.65 Cynoglossus feldmanni -0.02 ne 5 30.5 3.5 Cynoglossus microlepis -0.60 ne 5 40 3.5 Datnioides polota 0.03 ne 2 37 3.68 Doryichthys boaja 0.49 ne 2 50 3.27 Epalzeorhynchos frenatus 0.53 ne 5 15 2.31 Epalzeorhynchos munense 0.38 ne 5 11.4 2.64 Esomus longimanus -0.56 ne 1 9.8 3.31 Glossogobius aureus -0.32 ne 2 30.5 3.98 Glyptothorax fuscus -0.44 ne 5 14.8 3.2 Gyrinocheilus aymonieri -0.07 ne 5 34.2 2.52 Hampala dispar -0.59 ne 5 42.7 3.7 Helicophagus waandersii -0.60 ne 5 70 3.15 Hemibagrus filamentus -0.38 ne 5 50 3.56 Hemibagrus nemurus -0.35 ne 5 79.3 3.62 Hemibagrus wyckii -0.28 ne 5 86.6 3.76 Hemisilurus mekongensis -0.53 ne 5 80 3.3 Henicorhynchus lobatus 0.24 ne 5 18.3 2.74 Henicorhynchus siamensis -0.06 ne 5 24.4 2 Henicorhynchus sp. 0.20 ne 5 15 2 Hyporhamphus limbatus -0.09 ne 2 35 3.1 Hypsibarbus malcolmi -0.59 ne 5 61 3.2 Hypsibarbus vernayi -0.31 ne 5 26.4 2.99 Kryptopterus bicirrhis -0.15 ne 5 18.3 3.89 Kryptopterus cryptopterus -0.17 ne 5 17 3.8 Kryptopterus schilbeides -0.56 ne 5 12 3.78 Labeo chrysophekadion 0.02 ne 5 90 2 Labiobarbus lineatus 0.66 ne 5 15.5 2.49 Labiobarbus siamensis -0.37 ne 5 22 2.3 Leptobarbus hoevenii -0.36 ne 5 122 2.76 Lobocheilos davisi -0.41 ne 5 9 2 Luciosoma bleekeri -0.35 ne 5 30.5 3.78 Lycothrissa crocodilus -0.07 ne 5 36.6 3.71 Macrochirichthys macrochirus -0.58 ne 3 100 3.7 Macrognathus siamensis -0.55 ne 1 36.6 3.26
169

55
Mastacembelus armatus -0.50 ne 5 34.9 2.78 Mastacembelus erythrotaenia -0.17 ne 5 100 2.74 Mystus albolineatus -0.33 ne 3 42.7 3.65 Mystus atrifasciatus -0.12 ne 3 18.3 3.04 Mystus bocourti -0.24 ne 3 29.3 3.5 Mystus singaringan -0.47 ne 3 36.6 3.77 Notopterus notopterus -0.44 ne 3 73.2 3.6 Oreochromis mossambicus 0.45 ne 5 47.6 2.17 Osteochilus lini -0.56 ne 5 18.3 2 Osteochilus melanopleurus -0.78 ne 5 73.2 2.32 Osteochilus schlegeli 0.00 ne 3 49 2 Oxyeleotris marmorata -0.34 ne 1 79.3 3.9 Pangasianodon gigas 0.03 ce 5 300 2.3 Pangasianodon hypophthalmus -0.65 ne 5 158.6 3.12 Pangasius bocourti -0.37 ne 5 146.4 3.18 Pangasius conchophilus -0.35 ne 5 146.4 2.73 Pangasius krempfi -0.13 ne 5 146.4 2 Pangasius larnaudii -0.39 ne 5 158.6 3.26 Pangasius sanitwongsei 0.20 ce 5 366 3.99 Parachela siamensis -0.73 ne 3 18.3 3.42 Paralaubuca barroni 0.06 ne 3 18.3 3.3 Parambassis apogonoides -0.15 ne 3 12.2 2.87 Parambassis ranga -0.01 ne 1 8 3.27 Parambassis wolffii -0.68 ne 3 24.4 3.72 Phalacronotus micronemus -0.46 ne 5 61 4.03 Plotosus canius -0.28 ne 2 150 3.88 Polynemus multifilis -0.41 ne 2 34.2 3.74 Pristolepis fasciata -0.67 ne 3 20 3.19 Probarbus jullieni -0.20 e 5 183 3.17 Probarbus labeamajor -0.12 e 5 183 2.47 Pseudolais pleurotaenia 0.42 ne 5 42.7 2.42 Pseudomystus siamensis -0.44 ne 5 18.3 3.3 Puntioplites bulu 0.14 ne 5 35 2.37 Puntioplites proctozysron -0.35 ne 5 30 2.7 Puntius brevis -0.32 ne 3 14.6 2.91 Raiamas guttatus 0.59 ne 5 36.6 3.89 Rasbora borapetensis 0.55 ne 3 7.3 3.29 Rasbora tornieri -0.49 ne 3 20.7 3.2 Setipinna melanochir -0.39 ne 2 40.3 3.88 Syncrossus helodes 0.28 ne 5 36.6 3.31 Systomus rubripinnis -0.37 ne 5 30.5 2.88 Tenualosa thibaudeaui -0.41 ne 5 36.6 2 Tenualosa toli 0.27 ne 5 60 2.48 Thryssocypris tonlesapensis -0.40 ne 2 7.8 3.2 Thynnichthys thynnoides -0.31 ne 3 25 2.31 Toxotes chatareus 0.03 ne 2 48.8 3.99 Trichopodus microlepis -0.48 ne 1 16 3.36 Trichopodus pectoralis -0.35 ne 1 25 2.76
170
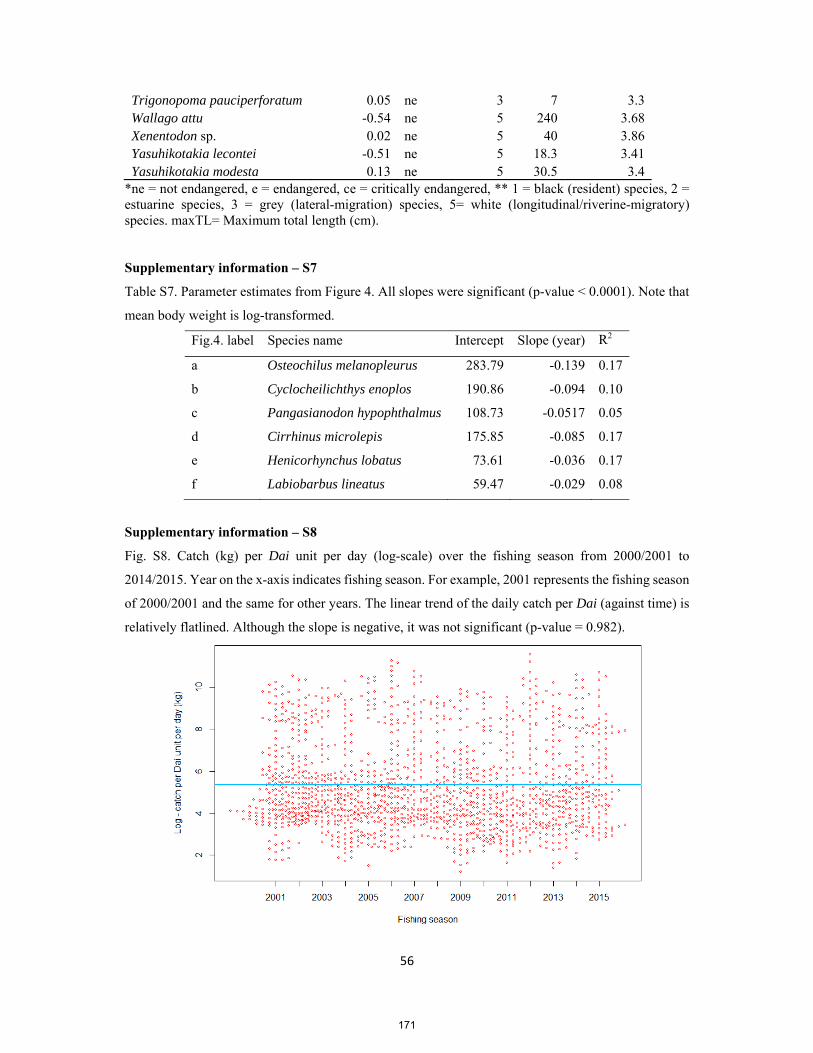
56
Trigonopoma pauciperforatum 0.05 ne 3 7 3.3 Wallago attu -0.54 ne 5 240 3.68 Xenentodon sp. 0.02 ne 5 40 3.86 Yasuhikotakia lecontei -0.51 ne 5 18.3 3.41 Yasuhikotakia modesta 0.13 ne 5 30.5 3.4
*ne = not endangered, e = endangered, ce = critically endangered, ** 1 = black (resident) species, 2 = estuarine species, 3 = grey (lateral-migration) species, 5= white (longitudinal/riverine-migratory) species. maxTL= Maximum total length (cm). Supplementary information – S7
Table S7. Parameter estimates from Figure 4. All slopes were significant (p-value < 0.0001). Note that
mean body weight is log-transformed.
Fig.4. label Species name Intercept Slope (year) R2
a Osteochilus melanopleurus 283.79 -0.139 0.17
b Cyclocheilichthys enoplos 190.86 -0.094 0.10
c Pangasianodon hypophthalmus 108.73 -0.0517 0.05
d Cirrhinus microlepis 175.85 -0.085 0.17
e Henicorhynchus lobatus 73.61 -0.036 0.17
f Labiobarbus lineatus 59.47 -0.029 0.08
Supplementary information – S8
Fig. S8. Catch (kg) per Dai unit per day (log-scale) over the fishing season from 2000/2001 to
2014/2015. Year on the x-axis indicates fishing season. For example, 2001 represents the fishing season
of 2000/2001 and the same for other years. The linear trend of the daily catch per Dai (against time) is
relatively flatlined. Although the slope is negative, it was not significant (p-value = 0.982).
171

57
References (for Supplementary Information)
1. Halls, A. S. et al. The Stationary Trawl (Dai) Fishery of the Tonle Sap-Great Lake System, Cambodia. (Mekong River Commission, 2013).
2. van Zalinge, N. et al. The Mekong River System. in Proceedings of the second international symposium on the management of large rivers for fisheries (eds. Welcomme, R. & Petr, T.) 335–357 (FAO Regional Office for Asia and the Pacific, 2004).
3. Davidson, P. J. The biodiversity of the Tonle Sap Biosphere Reserve: 2005 status review. (UNDP-GEF funded Tonle Sap Conservation Project, 2006).
4. MRC. Mekong: A River for the People. (Mekong River Commission, 2007).
5. Rainboth, W. J., Vidthayanon, C. & Mai, D. Y. Fishes of the Greater Mekong Ecosystem with Species List and Photoraphic Atlas. (Museum of Zoology, University of Michigan, 2012).
6. Deap, L., Degen, P. & van Zalinge, N. Fishing gears of the Cambodian Mekong. (Inland Fisheries Research and Development Institute of Cambodia & Mekong River Commission, 2003).
7. FiA. Law on Fisheries. (Fisheries Administration, Ministry of Agriculture, Forestry and Fisheries, 2006).
8. Ngor, P. B. & van Zalinge, N. Dai (Bagnet) fishery: 1994/95-2000/01: catch assessment methodology and results. (Mekong River Commission/Department of Fisheries/Danida, 2001).
9. Ngor, P. B. Dai fisheries in the Tonle Sap River of Phnom Penh and Kandal province (including a Review of the Census Data of 1996-97). in Management aspects of Cambodia’s Freshwater Capture Fisheries and Management Implications, Eleven presentation given at the Annual Meeting of the Department of Fisheries of the Ministry of Agriculture, Forestry and Fisheries, 27-27 January 2000 (eds. van Zalinge, N. P., Nao, T. & Lieng, S.) 30–47 (Mekong River Commission and Department of Fisheries, 2000).
172


ARTICLE 4
Flow alterations by dams shaped fish assemblage dynamics in the complex Mekong-3S river system
Peng Bun Ngor, Pierre Legendre, Thierry Oberdorff, Sovan Lek
Ecological Indicators, 88 (2018), 103-114.
173


Contents lists available at ScienceDirect
Ecological Indicators
journal homepage: www.elsevier.com/locate/ecolind
Original Articles
Flow alterations by dams shaped fish assemblage dynamics in the complexMekong-3S river system
Peng Bun Ngora,b,⁎, Pierre Legendrec, Thierry Oberdorffb, Sovan Lekb
a Fisheries Administration, No. 186, Preah Norodom Blvd., Khan Chamcar Morn, P.O. Box 582, Phnom Penh, Cambodiab CNRS, IRD, Université Toulouse III Paul Sabatier, ENFA, UMR5174 EDB (Laboratoire Évolution & Diversité Biologique), 118 route de Narbonne, F-31062 Toulouse,Francec Département de Sciences Biologiques, Université de Montréal, C.P. 6128, Succursale Centre-ville, Montréal, Québec H3C 3J7, Canada
A R T I C L E I N F O
Keywords:Dam effectsFish abundanceFish richnessTemporal beta diversityEnvironmental filteringLower Mekong Basin
A B S T R A C T
The Mekong, Sekong, Sesan, and Srepok (Mekong-3S) river system, a Ramsar wetlands of international im-portance and critical fish migration routes, is altered by dams that distort the seasonal flow dynamics, struc-turing dispersal and reproduction success of fishes. Here, we investigate the temporal responses of local fish betadiversity to hydrologic modification by the upstream functioning dams in five sites of the Mekong-3S system.The sampling design adopted (two sites on the Mekong River displaying relatively undisturbed flow and threesites in the 3S displaying a gradient in flow perturbation) allows us to focus on the effect of flow alteration onlocal fish assemblage compositions. By analysing 7-year daily fish monitoring data (06/2007–05/2014), wefound that there have been overall declining trends in local species richness and abundance, with strong tem-poral variability in local beta diversity. Undisturbed sites are characterized by seasonal assemblage variability,while disturbed sites are characterized by aseasonal assemblage changes. Temporal shifts in assemblage com-position suggest that dams alter seasonal flow patterns and favour generalist species. This study contributes to abetter understanding of the temporal changes of tropical freshwater fish beta diversity in regulated and un-regulated rivers. It is thus relevant for fisheries planning and conservation.
1. Introduction
The Mekong River Basin is one of the 35 biodiversity hotspots of theworld (Mittermeier et al., 2011). Fish assemblages in this basin areextremely diverse and characterized by the presence of fish speciesundertaking large-scale seasonal migrations (Poulsen et al., 2002). Thecomplex seasonal flood pulses and historical biogeography of the regionpartly explain this high diversity and seasonality (Poulsen et al., 2002;Rainboth, 1996). Rapid changes through time due to hydropower in-frastructure development in the basin may change the abiotic and bioticcomponents of the river ecosystem, including changes in river flow,habitat, food web, species distribution, and finally the river’s overallbiological integrity (Li et al., 2013; Macnaughton et al., 2015;Phomikong et al., 2014; Tonkin et al., 2017).
This study covers five sites. Three sites are in the lower reach of thethree Mekong major tributaries: Sekong (SK), Sesan (SS) and Srepok(SP) rivers, called the 3S; and two sites are in the Mekong mainstream:up- and downstream of the 3S outlet (Fig. 1). All sites are part of thecomplex Mekong-3S system, located in north-eastern Cambodia in the
Kratie (KT), Stung Treng (ST) and Ratanakiri provinces. The Mekongmainstream (KT and ST) is a critical habitat for many Mekong fishes,(Baran, 2006; Poulsen et al., 2004, 2002) and the Mekong River in SThas been designated a Ramsar wetlands of global significance since1999 (Try and Chambers, 2006). The 3S rivers on the other hand,draining north-eastern Cambodia, southern Lao People’s DemocraticRepublic (PDR), and Viet Nam’s Central Highlands, join the MekongRiver in ST. According to the Mekong River Commission (MRC), theycontribute∼25% of the Mekong mean annual flow at KT and play a keyrole in the hydrology of the downstream Mekong, including the TonleSap River showing seasonal reverse flows (MRC, 2005). In addition, the3S system is the main fish migration route from the lower Mekongsystem (Poulsen et al., 2004, 2002).
To address the energy needs and economic growth of the region,continued hydropower development has been underway in the MekongRiver Basin. Six large hydropower dams have been constructed in theupper Mekong River in China since the mid-1990s (Fan et al., 2015;Winemiller et al., 2016). In the Lower Mekong Basin (LMB), accordingto MRC’s Hydropower Project Database 2015, two mainstream dams
https://doi.org/10.1016/j.ecolind.2018.01.023Received 20 July 2017; Received in revised form 10 January 2018; Accepted 12 January 2018
⁎ Corresponding author at: CNRS, IRD, Université Toulouse III Paul Sabatier, ENFA, UMR5174 EDB (Laboratoire Évolution & Diversité Biologique), 118 route de Narbonne, F-31062Toulouse, France.
E-mail address: [email protected] (P.B. Ngor).
Ecological Indicators 88 (2018) 103–114
1470-160X/ © 2018 Elsevier Ltd. All rights reserved.
T
174

Fig. 1. Map showing the study sites and hydropower dam positions in the 3S sub-basin (Data source: MRC Hydropower Project Database 2015). Site names: KT=Kratie, SK=Sekong,SP= Srepok, SS= Sesan, and ST=Stung Treng.
P.B. Ngor et al. Ecological Indicators 88 (2018) 103–114
104 175

are under construction in Lao PDR, and nine others are planned; in theLMB tributaries, 42 dams are in operation, 27 are under-construction,17 are licensed and 58 are planned by 2030. In the 3S sub-basin alone,17 dams have been functioning since the 1990s, with a total grossstorage capacity of ∼5100millionm3 (Fig. 2).
Evidence suggests that these dams have significantly modified thenatural flow dynamics of the Mekong River system, with undocumentedeffects on the river ecology and fisheries (Cochrane et al., 2014; Pimanet al., 2013; Sabo et al., 2017; Winemiller et al., 2016; Ziv et al., 2012).In the 3S, the current functioning dams cause an increase of 28% in thedry seasonal flow and a decrease of 4% in the wet seasonal flow (Pimanet al., 2013). Dams in the Upper Mekong in China reduce flood pulses,for example, by 23 and 11% in rising and falling rates, respectively, inthe Tonle Sap River (Cochrane et al., 2014), a major tributary situateddownstream of the Mekong-3S system. These changes in natural floodpulse dynamics are expected to have altered fish assemblage structure,because in the 3S system, at least 89 migratory species are found, in-cluding 17 endemic and 14 endangered or critically endangered species(Baran et al., 2013a), and in the Mekong Basin, among the 877 recordedspecies (Rainboth, 1996; Ziv et al., 2012) ∼87% are migratory andmainstream spawners (Baran, 2006; Baran et al., 2013b). These fishesdepend on natural seasonal flood pulses as the main ecological triggerto disperse, reproduce and seek refuges during their life cycles (Baran,2006; Poulsen et al., 2004, 2002). Currently, however, far less is knownabout how downstream fish assemblages in the species-rich Mekong-3Ssystem respond to such hydrologic flow modifications caused by theupstream functioning hydropower dams.
The five sites selected for this study, being located in the sameecoregion and thus displaying similar environmental conditions, allowcomparing how fish assemblages respond to rivers displaying naturalversus regulated flows caused by upstream functioning dams. Amongthe five sites, the mainstream sites (ST and KT) are the least altered byhydropower dams and characterized by more predictable-seasonal flowpatterns (see Supplementary S1), as to date, there have been no func-tioning dams on the mainstream of LMB, which contributes 84% to thetotal annual flow of the Mekong Basin (MRC, 2010). By contrast, the 3Ssites (SS, SP, and SK) are characterized by unpredictable flows (see S1)due to the storage effects of multiple dams acting upstream (Fig. 2).Among the three sites, SS and SK have flow patterns more severelyaltered as documented in (Baird et al., 2002; Baird and Meach, 2005;Baran et al., 2013a; Claasen, 2004; Hirsch and Wyatt, 2004; Rutkowet al., 2005) and shown in S1. Suffering different levels of flow dis-ruption, the fish assemblages in these five sites are expected to displaydifferent inter-annual and seasonal responses (Röpke et al., 2017).
According to Tonkin et al. (2017), fish assemblages in predictablyseasonal flow conditions (i.e., ST and KT) should experience strongtemporal (seasonal) turnover and should host high species diversitythrough more specialist species occupying available temporal niches.By contrast, fish assemblages in more unpredictable flow environments(3S) should show low temporal diversity and should harbour broadgeneralist species displaying little seasonal turnover.
Here, we examine the temporal dynamics of fish assemblage com-positions among the five studied sites during the 7-year period betweenJune 2007 and May 2014. Our central hypothesis is that assemblages insites undergoing modifications in seasonal flow regime due to dams(3S) will display different temporal dynamics compared to assemblagesin sites enjoying more natural flow regimes (Mekong). First, we expectthat, by regulating flow regimes during the year, dams will decrease theseasonal responses of assemblages. Second, we expect that fish assem-blages in sites undergoing flow regulation (3S) will experience a de-crease in either species richness or diversity due to the escape of speciesfrom adverse environmental conditions, i.e., species strongly dependenton seasonal flow regimes to complete their life cycles. Third, and clo-sely linked to our second expectation, we predict a switch in assem-blage composition from more specialists in sites with predictable flow(Mekong) to more generalists in sites experiencing flow disruption (3S).To test these hypotheses, we use monitored daily fish and water leveltime-series data between 1 June 2007 and 31 May 2014, or 365weeks,initiated by the MRC on our five sites for assessing the impact of waterinfrastructure development in the Mekong River Basin (MRC, 2007).While our work contributes to the overall science-based understandingof fish assemblage dynamics in the Mekong-3S system, its original focusis on fish temporal beta diversity and how flow alterations caused byupstream functioning dams shape the temporal dynamics of fish betadiversity (assemblage composition) in the Mekong-3S river system.
2. Materials and methods
2.1. Data collection
Stationary gillnets were used for data collection. MRC standardsampling procedures for fish catch monitoring were applied (MRC,2007). Monitoring sites were selected to cover the Mekong-3S systemand the main riverine habitats that display a gradient of flow pertur-bation from upstream hydropower dams. The sampling sites extend afew kilometres in length and are located on the backwaters and/orsandbars of the river reach in the village where the participating pro-fessional fishermen are based. These sampling sites stayed relatively
Fig. 2. Timeline and cumulative installed gross storage capacity of existing hydropower dams in the 3S sub-basin (Data source: MRC Hydropower Project Database, 2015).
P.B. Ngor et al. Ecological Indicators 88 (2018) 103–114
105 176

unchanged over the study period. Daily, each fisherman (three for eachsite, and fifteen for the five study sites) used a set of stationary gillnetswith a range of mesh sizes (length: 120 ± 50m, height: 2–3.5 m, meshsize: 3–12 cm, soak hours/day: 12 ± 2). The fishermen were su-pervised by fishery researchers from the Inland Fisheries Research andDevelopment Institute (IFReDI) of the Cambodia Fisheries Administra-tion, with technical support from the MRC fisheries monitoring spe-cialists. The main advantages of such sampling designs are lower cost,but provide a sustained and coherent long-term records of fish datasetsfor the time-series analysis. The fish species list (∼900 species andincluding ecological attributes) comes from the MRC Mekong FishDatabase (MFD) (MFD, 2003) and was cross-checked with FishBase(Froese and Pauly, 2017) and other literature sources (Kottelat, 2013;Rainboth et al., 2012). Captured fish were identified to the species leveland counted. After field verification, field collected data were recordedinto the national fish monitoring database, which was quarterly cleanedby research officers from the IFReDI with the help of the MRC databaseexpert and fisheries monitoring specialists. Water levels at each sam-pling location were registered by MRC.
2.2. Data analyses
Daily fish samples were recorded as daily mean samples and thenaggregated into weekly fish richness and abundance data by speciesover the period from 1 June 2007 to 31 May 2014. For the entire periodof the study, we have 2557 mean daily samples, or a total for 365weeksand 2 days. We thereafter dropped the 2 days and consistently used365 weeks across all sites for the analysis. Likewise, daily water levelsin each site were computed into mean weekly water levels for the same365 weeks.
2.3. Overview of fish assemblage structure
To get an overview of the fish assemblage structure, K-means clus-tering (with five pre-determined clusters) on the Hellinger-transformedyearly fish assemblage data was computed to classify all observations inthe Mekong-3S system. The Fviz_cluster function of the factoextrapackage was applied to visualize the assigned five K-means clusters,with observations represented by points, using Principal ComponentsAnalysis (PCA) (Kassambara, 2017). PCA is used because it provides theproportion of variance accounted for by the first two axes (Borcardet al., 2011). Boxplots of total weekly species richness and the inverseSimpson diversity index were also computed to describe the spatial andtemporal dynamic patterns of the fish assemblage structure, both ateach site and in the entire Mekong-3S system. The inverse Simpsonindex was used because it is a meaningful and robust diversity indexthat captures the variance of species abundance distribution whilebeing less sensitive to species richness (Magurran, 2004). Non-para-metric Pairwise Wilcoxon Rank Sum Tests were used for multiplecomparison tests on species richness and diversity indices among thestudy sites.
2.4. Temporal dynamics of beta diversity
Beta diversity describes the variation in species composition amongsites in a study area or among survey times for a survey across years(Legendre and De Cáceres, 2013; Legendre and Gauthier, 2014). Inestimating total beta diversity (BDtotal), the total variance of Hellinger-transformed weekly assemblage abundance data was used to reducedisproportionate effects of large abundance values (Legendre and DeCáceres, 2013). BDtotal has a value between 0 and 1 for Hellinger-transformed data. BDtotal can be compared among sites if the samplingunits across the study sites are of the same size (Legendre and Salvat,2015), which is the case for the present study. If BDtotal is equal to 1, allsampling units have a completely different species composition. BDtotal
was then partitioned into Local (temporal) Contributions to Beta
Diversity (LCBD) and Species Contributions to Beta Diversity (SCBD).LCBD is a comparative indicator of the ecological uniqueness of thesampling units. LCBD values give a total sum of 1 for a given datamatrix and can be tested for significance (at the 0.05 level in the presentstudy). BDtotal and LCBD indices can be computed for repeated surveys,and thus form a time series (Legendre and Gauthier, 2014). SCBD in-dices, on the other hand, indicate the relative importance of eachspecies affecting beta diversity patterns. Species biological traits, in-cluding feeding type, habitat preferences, body size and dispersal ca-pacity, are likely to have an influence on SCBD (Heino and Grönroos,2016). Species with SCBD indices well above the mean were regardedas important species contributing to beta diversity (Legendre and DeCáceres, 2013). All these indices were computed separately for each ofthe five study sites using the beta.div function of the adespatial package(Dray et al., 2017; Legendre and De Cáceres, 2013) with 9999 permu-tations in R (R Core Team, 2015).
To explain the temporal dynamics of LCBD in each site, weeklyLCBD indices were modelled as a function of linear weekly abundance,weekly richness and mean weekly water levels. Standardised regressioncoefficients and p-values of each predictor were used to indicate theeffect and significance level of each predictor on the LCBD.Standardised regression coefficients are used to make the regressioncoefficients more comparable to each other. All explanatory variableswere log-transformed prior to the analysis to address the skewed dis-tribution of the variables. To determine the relative contribution (inpercentage) of each predictor to the total explained variance of eachmodel, hierarchical partitioning of the significant variables from theLCBD models was computed using the hier.part function of the hier.partpackage in R.
Further, to examine how fish assemblages responded to seasonalhydrology changes, temporal LCBD indices were plotted against waterlevels across the 7-year hydrological cycles. Significant LCBD indices(being unique) were also visualised on the plot to investigate whetherthe temporal uniqueness of an assemblage composition (temporal sig-nificant LCBDs) occurred in relation to the site hydrological cycles orotherwise. Further, the non-parametric Spearman’s correlation test wasperformed for each site to test the link between the two variables.
2.5. Temporal variation of assemblage structure
To identify significant seasonal assemblage variations, weekly per-iodic variability in species abundance and richness were examinedusing Whittaker–Robinson periodograms (Legendre and Legendre,2012). The periodograms were computed using the WRperiodogramfunction of the adespatial package (Dray et al., 2017). This method waschosen because of its simplicity of interpretation; i.e., the period withmaximum amplitude is taken as the best estimate for the true period ofoscillation (Legendre and Legendre, 2012). Prior to analyses, theweekly data for each site were tested for stationarity. When stationaritywas violated (i.e., KT, ST, SS, and SK, see S3), residuals from the linearregressions (against time) for individual sites were computed and usedin the periodogram analyses. Periodogram graphs were plotted to vi-sualize the seasonality of fish total abundance and richness at each site.
2.6. Temporal shift of species contributing to beta diversity
To identify the key species contributing to the temporal dynamics ofspecies composition over the study period, species with SCBD indicesgreater than the mean at each site were extracted from the assemblagecomposition matrix. Given that our interest is in how assemblagecomposition shifts through time, Redundancy Analysis (RDA) wasperformed on the assemblage composition data against time and itsquadratic effect as explanatory variables. The inclusion of a second-degree polynomial allows the assemblage time series to double backupon itself (Legendre and Salvat, 2015). The linear and quadratic ef-fects of time on the assemblage data were both significant predictors of
P.B. Ngor et al. Ecological Indicators 88 (2018) 103–114
106 177

the assemblage variations among years (test of RDA R-square,P < 0.001). RDA is an extension of multiple regression analysis(Legendre and Salvat, 2015). Using RDA, the relationship between theobservations (sampling units), species and explanatory variables (theyears) can be visualized. Further, to help identify the key species ex-plaining the temporal shift in assemblage composition, indicator spe-cies characterising fish assemblages at each site were computed usingthe multipatt function of the indicspecies package (Cáceres andLegendre, 2009; De Cáceres and Jansen, 2011) for comparison. In-dicator species are species that are used as ecological indicators ofcommunity or habitat types, environmental conditions, or environ-mental changes (De Cáceres et al., 2010), whereas species with largeSCBD values are those that are abundant and dominate the assemblage(Legendre and De Cáceres, 2013). Assemblage composition data wereHellinger-transformed prior to RDA computation.
3. Results
3.1. Overall assemblage structure
Over the study period, 292 species were recorded in the catchsamples. Among those, 208 fish species were recorded in Kratie (KT),196 in Stung Treng (ST), 177 in the Srepok River (SP), 133 in the SesanRiver (SS) and 216 in the Sekong River (SK). These fishes belong to 14orders, 48 families and 151 genera. Five main orders represent 90% ofthe total species count: Cypriniformes (146 species), Siluriformes (66),Perciformes (34), Pleuronectiformes (9) and Clupeiformes (6). The topfive families accounting for 63% of total species counts were Cyprinidae(123 species), Bagridae (16), Cobitidae (16), Pangasiidae (15) andSiluridae (11). See S6 for a full species list by genera, families and or-ders.
K-means clustering (with five clusters) on a PCA plot (Fig. 3a) showsthat sites on the Mekong (cluster 4 and 5) are overlapped, indicatingassemblage similarities between the two sites, while the 3S sites, par-ticularly SK (cluster 1) and SS (cluster 2), are distant from the Mekongsites, suggesting distinct assemblages. SP (cluster 3) exhibits some si-milarities with the Mekong sites (ST). Assemblage dissimilarities arefurther observed among the 3S sites (axis 2).
In addition, boxplots on weekly richness and inverse Simpson di-versity index (Fig. 3b, c) indicate that the Mekong sites have the highestrichness (KT: median=23, sd=10.95; ST: median= 27, sd=9.87)and inverse Simpson indices (KT: median=9.20, sd= 5.30; ST:median=8.82, sd= 5.10) relative to the 3S sites. Noticeably, SS showsboth the lowest species richness (median=12, sd=5.14) and diversityindex (median= 5.45, sd= 2.78) of all sites, whereas SP is comparablewith KT in terms of species richness. Although SP has higher speciesrichness (median= 23, sd= 7.52) than SK (median=19, sd= 8.25),the diversity indices between the two sites are not significantly different(SP: median= 6.89, sd=3.70; SK: median= 7.49, sd= 4.38).Overall, the Mekong-3S system has experienced gradual diminishingtrends of weekly fish abundance and richness, except for SK (S3),whereas trends of inverse Simpson diversity index are found to be de-clining, particularly in the Mekong sites (S2c).
3.2. Temporal dynamics of beta diversity
Total beta diversity (BDtotal) indices estimated for the sites were0.50 in SP, 0.59 in ST, 0.66 in KT, 0.73 in SS and 0.74 in SK. TemporalLCBD weekly values ranged between 1.26E−03 and 6.36E−03; theLCBD values are small because they are made to sum to 1 across allweeks for each site. The site with the highest LCBD values is SS(median=2.71E−03, sd=4.33E−04), whereas the site with thelowest LCBD value is SP (median=2.53E−03, sd=9.69E−04). Theother sites have intermediate values of weekly LCBD. Among the365 weeks, 10% (35 weeks), 13% (48), 13% (46), 8% (29) and 18%(66) have statistically significant values of LCBD (assemblage
composition being unique) in KT, ST, SP, SS and SK, respectively. Thismanifested strong temporal changes in the uniqueness of fish assem-blage compositions over the study period for all sites. For the twoMekong sites (i.e., KT and ST), these significant temporal LCBDs (reddots on Fig. 4) are found to occur at the time when seasonal water levelsstart rising on the annual cycle basis, whereas no such patterns areexhibited in the 3S rivers. Significant correlation between LCBDs andwater levels are revealed in KT (P=0.003), SP (P < 0.001), and SK(P=0.015). While ST is on the margin (P=0.052), no significantcorrelation of the two variables is indicated in SS (P=0.074).
3.3. Temporal determinants of LCBD indices
Multiple linear regressions show that LCBD values are significantlyrelated to the three predictors: total abundance, total richness and meanwater level, depending on the study site (Table 1). Overall, the adjustedcoefficient of determination (adjusted R2) for each site model explains50% in KT, 61% in ST, 31% in SP, 35% in SS and 62% in SK. Richness isthe most contributed variable negatively explaining the temporalchanges in LCBD for all sites. In contrast, positive relationships betweenLCBD and total abundance are exhibited in KT, ST and SP, while nosuch relationship is found in SS and SK. Water level is linearly linked toLCBD in all sites except for ST, with the significant negative linear re-lationships observed in KT and SS, and positive linear relationships inSP and SK.
Hierarchical partitioning (Table 1) highlights the high contributionof total richness and abundance in explaining LCBD variations (i.e., KT(85.55%), SS (94.99%), and SK (99.03%) for species richness, and KT(13.72%), ST (79.91%), and SP (53.16%) for abundance). Water level isfound to independently contribute the highest proportion (33.30%) ofthe model total variance in SP.
3.4. Temporal variation of assemblage structure
Periodogram analyses on weekly abundance and richness(Fig. 5a, b) indicate that significant frequencies of semi-annual andannual cycles are exhibited in the Mekong mainstream sites, while nosuch patterns are displayed in the 3S sites. In KT, significant periods ofweekly abundance (Fig. 5a) are found at 51–56weeks, with harmonicsat 104–109 and 154–160 weeks. The other significant periods (26 and133–135weeks) in this site show semi-annual cycles. A similar patternwas revealed for the site species richness (Fig. 5b), where significantperiods are detected at 48–57weeks, with harmonics at 100–112 and148–65weeks. In ST, significant periods of species abundance occur at52–48weeks, with harmonics at 104–118 and 159–166weeks; how-ever, this pattern is less pronounced for the species richness. By con-trast, there are no clear significant signals of semi-annual or annualcycles in the 3S sites. Additionally, far fewer significant periods withhigh frequencies are revealed in the 3S than the mainstream sites (KTand ST) for both abundance and richness.
3.5. Species contributions to temporal beta diversity
A total of 96 species, i.e., 33% of the total species, bring importantcontributions to site beta diversity (above overall mean SCBD value), 13of which are largely distributed across all sites (see S4, S5). Of the 96species, 55 are identified in KT, 45 in ST, 44 in SP, 34 in SS and 56 inSK. Among these important species, the number of species that are alsoindicator species generated by the multipatt function in each site are asfollows: 17 species in KT, 26 in ST, 14 in SP, 12 in SS and 17 in SK (seeS4 and S5 for species details). Species with the highest SCBD indices arePuntioplites falcifer in KT, Henicorhynchus lobatus in ST, Hypsibarbusmalcolmi in SP, Anabas testudineus in SS and Paralaubuca barroni in SK.
RDA analysis on assemblage composition (with SCBD indicesgreater than mean) against time depicts a strong temporal shift in as-semblage composition at all sites. In the Mekong mainstream (Fig. 6a),
P.B. Ngor et al. Ecological Indicators 88 (2018) 103–114
107 178

during the early years of the survey (2007–2010), temporal assemblagevariability is mostly due to small-sized generalist and specialist species.After 2010, the composition tends to be disproportionally representedby specialists. Small-sized mud carps (maximum total length –mTL < 25 cm) i.e., Henicorhynchus lobatus (Hlobatu), H. siamensis(Hsiamen) and Labiobarbus siamensis (Lsiamen), the most common andabundant species in LMB, are found to be characteristic and importantspecies for both sites during the period 2007–2010. Afterwards, spe-cialists disproportionally represent the assemblage in both sites. Somecommon specialists describing assemblage in the Mekong mainstreamduring 2011–2014 are short distance migrants and mainstream spaw-ners such as Hypsibarbus malcolmi (Hmalcol), Phalacronotus apogon(Papogon.1), Hypsibarbus lagleri (Hlagler), H. wetmorei (Hwetmor); longdistance migrants such as large-sized cyprinids (mTL > 60 cm) Cos-mochilus harmandi (Charman), Cirrhinus microlepis (Cmicrol), Cyclo-cheilichthys enoplos (Cenoplo), Labeo chrysophekadion (Lchryso); andriver catfishes, namely, Helicophagus waandersii (Hwaande) and Pan-gasius conchophilus (Pconcho) (only in ST).
In contrast, temporal dynamics in assemblage composition shiftedfrom specialists (during the 2007–2010 period) to generalists (after2010) in the 3S (Fig. 6b). The pattern is pronounced in SP and SK,where long-distance migratory species and main channel spawners withlarge-bodied sizes, such as Phalacronotus apogon (Papogon.1),
Hypsibarbus lagleri (Hlagler), Helicophagus waandersii (Hwaande), Hyp-sibarbus malcolmi (Hmalcol), Pangasius conchophilus (Pconcho), P. blee-keri (Pbleeke), Hypsibarbus pierrei (Hpierre), etc., represented the as-semblages between 2007 and 2010 and were then replaced by small-sized minnows and carps with generalist habitat preference, such asLabiobarbus siamensis (Lsiamen), Systomus rubripinnis (Srubrip), Heni-corhynchus siamensis (Hsiamen) and Osteochilus vittatus (Ovittat), etc.,between 2011 and 2014. This pattern is less clear in SS; however, thissite shows that the generalist H. lobatus significantly contributes to thetemporal changes in assemblage composition during the 2011–2014period. Moreover, assemblages in the SS during the entire period werelargely represented by generalists as found in SP and SK and othersmall-sized minnows and carps, such as Paralaubuca typus (Ptypus), P.riveroi (Privero), P. barroni (Pbarron), Rasbora tornieri (Rtornie), Cy-clocheilichthys armatus (Carmatu), etc. Further, assemblages in the 3Stowards 2011–2014 are partly composed of black fishes (floodplainresidents) such as climbing perches Anabas testudineus (Atestud), air-breathing catfishes Clarias batrachus (Cbatrac) and snakeheads Channastriata (Cstriat). Important species contributing to site beta diversity andtheir ecological attributes are given in S5.
Fig. 3. Fish assemblage patterns in the Mekong-3S system.(a) K-means cluster on PCA plot (k= 5) on Hellinger-transformed yearly assemblage data. Five convex hulls(with different colours) represent each assemblage cluster ofthe Mekong-3S system. A combination of two letters andtwo digits denotes the site name and year; for example,KT07 is Kratie in 2007. (b) Boxplots of total weekly richnessby site; (c) Boxplots of weekly inverse Simpson diversityindex by site. Mean values among sites (Fig. 5b, c) with acommon letter are not significantly different at the 0.05level (Pairwise Wilcoxon Rank Sum Tests). For site names,see Fig. 1.
P.B. Ngor et al. Ecological Indicators 88 (2018) 103–114
108 179

4. Discussion
We find that fish assemblages in SP have some similar compositionpatterns to those of the Mekong sites. We also find strong temporaldynamics of fish assemblages in the complex Mekong-3S system, withtotal site beta diversity (BDtotal) ranging between 0.50 and 0.74. Localspecies richness and abundance are the most important determinantsexplaining the temporal change in local beta diversity (LCBD). Ourfindings strengthen the results of previous studies highlighting thestrong relationships of species richness and abundance with localLCBDs (Heino and Grönroos, 2016; Legendre and De Cáceres, 2013;Qiao et al., 2015). Water level is also an important ecological de-terminant that further explains these temporal changes (Table 1). In theMekong-3S system, we observe that water levels in the Mekong sitesshow more seasonal-predictable patterns than those in the 3S siteswhere the seasonality of flow is disrupted by increasing dam operationsin the upper reach of these rivers since 1990s (S1, Figs. 1, 2 and 4).
Some similarities of fish assemblage patterns in SP to those with the
Mekong sites (Fig. 3a) are likely because SP has the highest number ofmigratory species (81) relative to SK (64) and SS (54) (Baran et al.,2013a). These migratory species e.g., Pangasiidae and Cyprinidae couldmigrate hundreds of kilometers between the mainstream, tributariesand floodplains during their life cycles (Poulsen et al., 2004, 2002;Sverdrup-Jensen, 2002). Local fish migration behaviour may ad-ditionally explain the pattern. Most cyprinids are known to migrateupriver along the edges of rivers; therefore, when fish leave the Me-kong, enter the SK and travel up along its southern bank, they will enterSS and will soon continue right into SP (Baran et al., 2013a) (see alsoFig. 1). Moreover, SP has greater depths and better flow conditionsrelative to SS and SK (see S1). These factors combined tend to explainsome similarities of the assemblage patterns between the two rivers.
Overall, our results support the central hypothesis that fish assem-blages in sites with unpredictable flows (3S) exhibit different temporalchanges compared to fish assemblages in sites with predictable flowpatterns (the Mekong) (Fig. 3a). As expected under our first hypothesis,assemblages in the Mekong (undisturbed sites) are characterized by a
Fig. 4. Temporal changes in LCBD indices (red line) andmean log-transformed weekly water levels (blue line) over7-year hydrological cycles on five sites of the Mekong-3SRiver system. More predictable-seasonal flow patterns areshown in KT and ST, and unpredictable/regulated flows aredisplayed in SP, SK, and SS. The red dots indicate weekswith significant LCBD indices at the 0.05 level. P denotesthe p-value of the pairwise correlation test using theSpearman method. For site names, see Fig. 1.
P.B. Ngor et al. Ecological Indicators 88 (2018) 103–114
109 180

strong seasonal variability. This is depicted by the significant temporalLCBD signals showing the uniqueness of the fish assemblage composi-tions in KT and ST occurring in relation to the annual flow cycles,particularly when water levels start rising (Fig. 4). Many Mekong fishesare known to start their seasonal migration for spawning and feeding/rearing grounds when seasonal flooding in the Mekong begins in lateMay or June (Poulsen et al., 2004, 2002; Sverdrup-Jensen, 2002).Water levels are the most important ecological determinants in trig-gering these seasonal migrations (Baran, 2006). In contrast, the sig-nificant temporal LCBDs indicating the uniqueness of fish assemblagesin the 3S sites (Fig. 4; SP, SS, and SK) are characterized by chaoticvariations unrelated to the seasonal hydrological cycles. Flow pertur-bation caused by dams in the 3S system has decreased seasonal varia-tion of flow, thus muting the seasonal structure of fish assemblages. Theresults from the periodogram analyses (Fig. 5) further indicate that inpredictable systems (KT and ST), significant period signals with highfrequencies of species abundance and richness are harmonic at semi-annual and annual cycles over the study period, which is not the casefor the 3S sites. Our findings are consistent with the seasonality fra-mework proposed by Tonkin et al. (2017), emphasizing that sites with
Table 1Standardised regression coefficients resulting from the multiple regression models ofweekly LCBD values against the weekly total abundance (AB), weekly total richness (SR)and mean weekly water levels (WL) in each study site. All variables are log-transformed.R2=coefficient of determination. Asterisks indicate the significance levels associated witheach predictor, with ‘*’ at 0.05, ‘**’ at 0.01, and ‘***’ at 0.001. Plus ‘+’ and minus ‘−’signs indicate the positive and negative relationships, and ‘ns’ denotes ‘not significant’.Values in brackets, resulting from hierarchical partitioning, indicate the relative in-dependent contribution (in percentage) of each significant variable to the total explainedvariance. (−) denotes ‘not available’ for variables that are not significant at the 0.05level.
Site AB SR WL Adjusted R2
KT +5.355***
(13.72%)−17.082***
(80.55%)−5.727***
(5.73%)0.50
ST +23.454***
(79.91%)−13.213***
(20.09%)−0.244 ns
(−)0.61
SP +10.152***
(53.16%)−6.406***
(13.81%)+7.647***
(33.03%)0.31
SS +1.358 ns
(−)−13.075***
(94.99%)−3.057**
(5.01%)0.35
SK −0.926 ns
(−)−15.671***
(99.03%)+2.157*
(0.97%)0.62
Fig. 5. Whittaker-Robinson periodograms computed for (a) weekly abundance and (b) richness, featuring periods between 2 and 182 weekly intervals from a 365-week data series from01 June 2007 to 31 May 2014. The upper limit of the observation window of the periodograms is the number of observation intervals divided by 2 or a 182-week period. Black squaresidentify periods that are significant at the 0.05 level. For site names, see Fig. 1.
P.B. Ngor et al. Ecological Indicators 88 (2018) 103–114
110 181

predictable environmental fluctuations are characterized by temporal(seasonal) assemblage change, whereas sites with unpredictable en-vironmental conditions are represented by aseasonal assemblagevariability, as exhibited in the 3S.
In addition, in line with our second expectation, we find that sitesdisplaying flow disruptions (i.e., SP, SK, and SS) are generally poorer inspecies richness and lower in species diversity than sites with morestable seasonal flow patterns (i.e., KT and ST) (Fig. 3b, c). This patternis most likely due to flow alterations caused by dams. In other Mekong
tributaries, lower species richness has also been observed in regulatedrivers (i.e., Gam and Mun Rivers) compared to an unregulated one(Sankgram River) (Phomikong et al., 2014), and hydrological altera-tions have also been previously identified to cause changes in fish as-semblage structure (i.e., reduced species diversity, shift in composi-tional and life history structure) in central Amazonian and Americanrivers (Mims and Olden, 2013; Röpke et al., 2017). Further, a generaldecreasing trend in species abundance, richness and diversity index inthe Mekong-3S system has been observed since 2010 (S2). This
Fig. 6. RDA biplots of Hellinger-transformed assemblage data showing the important species (with SCBD indices greater than mean SCBD) contributing to the temporal shift inassemblage composition in each site. (a) Mekong River; (b) 3S Rivers. The biplots show species (arrows) and sampling units grouped by year. Names are abbreviations of fish speciesnames. Species with very small contributions to the ordination are removed for clarity. Underlined species (blue) are indicator species identified by the multipatt function. Species in redhave generalist habitat preferences. The assemblage ordination is explained by time (years) and its quadratic effect (not shown). Test of the multivariate RDA R-square: P < 0.001. Fullspecies names and ecological attributes are shown in S5. For site names, see Fig. 1.
P.B. Ngor et al. Ecological Indicators 88 (2018) 103–114
111 182

temporal variation is coincident with the threefold increase in hydro-power dam reservoirs in the 3S sub-basin from 2007 to 2010 (Fig. 2)and the construction of a new mainstream dam (Xayaburi) in LMB,which has been underway since 2012 (International Rivers, 2014). Infact, hydropower dams severely alter flows of a river system, causingrecruitment failure and diminishment of fisheries productivity at bothlocal and regional spatiotemporal scales worldwide (Jellyman andHarding, 2012; Mims and Olden, 2013; Poff et al., 2007; Winemilleret al., 2016). However, the decreasing trends in species abundance,richness and diversity index are much stronger in sites of the 3S riversand are attributed to the increasing river impoundment upstream(Fig. 2), which dampens flood pulses, mutes seasonal and inter-annualflow variation, disrupts flow connectivity among fish critical habitats,and alters food web dynamics that support fish diversity and biomass,as previously documented in (Arias et al., 2014; Baird et al., 2002; Bairdand Meach, 2005; Claasen, 2004; Hirsch and Wyatt, 2004; Ou andWinemiller, 2016; Piman et al., 2013; Rutkow et al., 2005).
Relative to our third prediction, we find that the temporal dynamicsof assemblage composition are driven by specialist species in theMekong mainstream (Fig. 6a) and by generalist species in the 3S(Fig. 6b). The RDA biplots (Fig. 6a, b) illustrate that key species con-tributing to the temporal changes in the Mekong sites during the lastfour years of the survey are disproportionate towards specialists, in-cluding medium and large-sized cyprinids of the family Cyprinidae,river catfishes of Pangasiidae and sheatfishes of Siluridae. These fishesare often long-distance migrants and/or mainstream spawners andprefer mainstream rivers as their main habitats. The opposite is ob-served in the 3S rivers, where small-sized species minnows and carps ofCyprinidae with generalist habitat preferences are among the key spe-cies contributing to the assemblage change. Further, some floodplainresident fishes, such as climbing perches, snakeheads and airbreathingcatfishes, are also among the key species in the assemblage compositionof the 3S rivers towards the last few years of the survey. These fisheshave airbreathing organs and can physically withstand adverse en-vironmental conditions (MRCS, 1992; Poulsen et al., 2002; Welcome,2001). This trend in assemblage composition of the Mekong-3S systemis likely to resemble the environmental filtering by dams because manymigratory (specialist) species that depend on seasonal flow dynamics tocomplete their life cycles are constrained or extirpated by flow dis-ruption of dams (Liermann et al., 2012), which finally leads to in-creased faunal homogenization as observed in the middle Lancang-Mekong River (Li et al., 2013), many Chinese lakes connecting to theYangtze River (Cheng et al., 2014), and rivers across the United States(Poff et al., 2007). Our results also strengthen recent review and fieldstudies that find fish assemblages in SS to be represented by small-sizedand generalist species such as small mud carps (mTL < 25 cm) of thefamily Cyprinidae, and fewer large-sized migratory species such as rivercatfishes of Pangasiidae (mTL > 100 cm), relative to the Mekongmainstream sites (Baran et al., 2013a; Ou et al., 2017; Ou andWinemiller, 2016).
Interestingly, Henicorhynchus lobatus is among the highest SCBDvalues found in ST, KT and SS. The species is known to be an ecologicalkeystone species, playing a critical role in food security throughoutLMB and being an important prey species for many predatory fishes andIrrawaddy dolphins (Baird, 2011; Fukushima et al., 2014). This species,together with its relative H. siamensis, are claimed by the villagers tohave never been seen in the upper SS River in the last 10 years (Baranet al., 2013a). These species are therefore of high conservation value inKT and ST, and need restoration in the altered SS (Legendre and DeCáceres, 2013). Other generalist (Labiobarbus siamensis) and specialistspecies (Puntioplites falcifer, Hypsibarbus malcolmi) (migratory/main-stream spawners) share a similar status to H. lobatus and H. siamensis(among the highest SCBD values) and therefore deserve similar con-servation attention. In addition, fish species that have high SCBD valuesand are the indicator species demonstrated in S4 represent dominantlyabundant and ecologically important species in the Mekong-3S system.
They therefore have high values for fisheries health monitoring and fishbiodiversity conservation initiatives (De Cáceres et al., 2010; Legendreand De Cáceres, 2013).
5. Conclusion
The results of our study suggest that the hydrological conditions ofrivers play a pivotal role in shaping the temporal dynamics of tropicalfreshwater fish assemblages. Flow patterns act as an environmentalfiltering process in influencing the spatial and temporal organisation oflocal and regional fish assemblage structures. It is evident that hydro-power dams in the upper 3S rivers alter their natural flow seasonalityand predictability. This has adversely impacted aquatic organismsadapted to the natural flow conditions for their life cycles. We find thatthere are overall declining trends in local fish species abundance andrichness, with strong temporal variability in local beta diversity of theMekong-3S system. The disturbed 3S rivers are represented by asea-sonal assemblage changes, whereas the Mekong sites are characterisedby seasonal assemblage variability. Temporal shifts in assemblagecomposition are driven by generalist species in the disturbed 3S rivers;whereas specialists are more representative of the Mekong River. Theinformation presented here contributes to the understanding of fishassemblage responses to upstream flow modification and is thus im-portant to better inform river fisheries monitoring, management andconservation initiatives. Our present work focused on temporal fishassemblage composition responses in relation to flow regulation.Therefore, our results would be beneficial for future work aiming toforecast future flow changes and how this affects fish diversity in theMekong 3S-River System (Chau and Wu, 2010; Wang et al., 2017).
While further dam building is imminent in the Mekong Riversystem, the combined effects of the present and future 3S dams arepredicted to have catastrophic impacts on the fish productivity anddiversity which secures food to>60million people of LMB (Hortle,2007; Ziv et al., 2012). For this reason, we suggest that some mitigationmeasures must be undertaken to minimise such impacts. First, thereshould be a basin-scale integrative strategic plan (accounting for cu-mulative impacts on hydrology and ecosystem services) that finds thebalance between exploiting hydropower potential and sustaining keyresources, e.g., in dam site selection (Winemiller et al., 2016). Second,the best available technologies related to up- and downstream fish passfacilities (Schmutz and Mielach, 2015) must be built for existing andplanned dams to facilitate up- and downstream fish migrations. Flowmanagement measures that could mimic natural hydraulic variations,e.g., Sabo et al. (2017) should be privileged, as these variations are themain ecological trigger for fish dispersal and reproduction success inthe Mekong. Indeed, rivers downstream of gradual release storage damsare found to have higher fish biomass and richness than those down-stream of flow peaking storage dams (Guénard et al., 2016). Third,ecological effects of dams are not only restricted to ecosystem servicesand functioning but also to society, culture and livelihoods such aslosses of property, employment, social connections and culture throughhuman resettlements and the displacement of indigenous people. Bestpractice guidelines on a (participatory) Social Impact Assessmentshould be applied to assess such sociocultural costs at appropriatetemporal and spatial scales (Tilt et al., 2008) for formulating acceptablecompensation, resettlement and rehabilitation policies. Finally, in-stitutions permitting and financing hydropower dam developmentshould ensure that dam developers comply with these best practiceguidelines during their project design, commission and decommissionphases to meet both societal and environmental objectives; otherwise,key natural resources such as fisheries and rural communities that de-pend on those resources will continue to suffer from the impacts ofdams.
P.B. Ngor et al. Ecological Indicators 88 (2018) 103–114
112 183
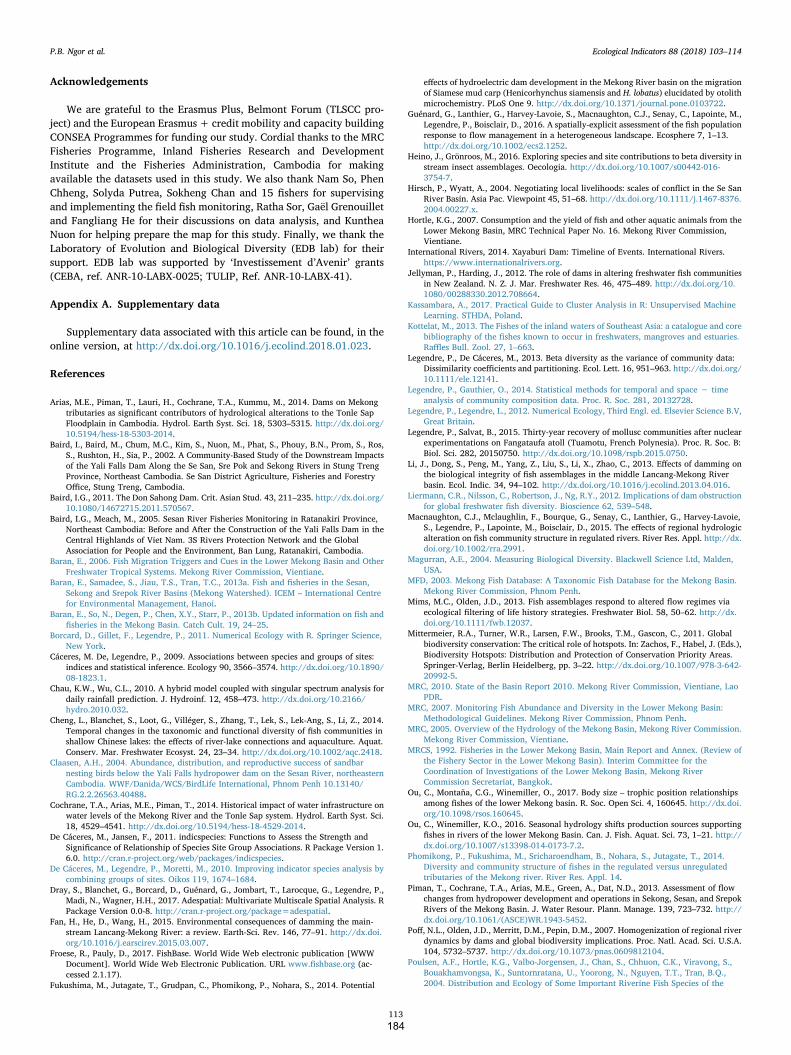
Acknowledgements
We are grateful to the Erasmus Plus, Belmont Forum (TLSCC pro-ject) and the European Erasmus+ credit mobility and capacity buildingCONSEA Programmes for funding our study. Cordial thanks to the MRCFisheries Programme, Inland Fisheries Research and DevelopmentInstitute and the Fisheries Administration, Cambodia for makingavailable the datasets used in this study. We also thank Nam So, PhenChheng, Solyda Putrea, Sokheng Chan and 15 fishers for supervisingand implementing the field fish monitoring, Ratha Sor, Gaël Grenouilletand Fangliang He for their discussions on data analysis, and KuntheaNuon for helping prepare the map for this study. Finally, we thank theLaboratory of Evolution and Biological Diversity (EDB lab) for theirsupport. EDB lab was supported by ‘Investissement d’Avenir’ grants(CEBA, ref. ANR-10-LABX-0025; TULIP, Ref. ANR-10-LABX-41).
Appendix A. Supplementary data
Supplementary data associated with this article can be found, in theonline version, at http://dx.doi.org/10.1016/j.ecolind.2018.01.023.
References
Arias, M.E., Piman, T., Lauri, H., Cochrane, T.A., Kummu, M., 2014. Dams on Mekongtributaries as significant contributors of hydrological alterations to the Tonle SapFloodplain in Cambodia. Hydrol. Earth Syst. Sci. 18, 5303–5315. http://dx.doi.org/10.5194/hess-18-5303-2014.
Baird, I., Baird, M., Chum, M.C., Kim, S., Nuon, M., Phat, S., Phouy, B.N., Prom, S., Ros,S., Rushton, H., Sia, P., 2002. A Community-Based Study of the Downstream Impactsof the Yali Falls Dam Along the Se San, Sre Pok and Sekong Rivers in Stung TrengProvince, Northeast Cambodia. Se San District Agriculture, Fisheries and ForestryOffice, Stung Treng, Cambodia.
Baird, I.G., 2011. The Don Sahong Dam. Crit. Asian Stud. 43, 211–235. http://dx.doi.org/10.1080/14672715.2011.570567.
Baird, I.G., Meach, M., 2005. Sesan River Fisheries Monitoring in Ratanakiri Province,Northeast Cambodia: Before and After the Construction of the Yali Falls Dam in theCentral Highlands of Viet Nam. 3S Rivers Protection Network and the GlobalAssociation for People and the Environment, Ban Lung, Ratanakiri, Cambodia.
Baran, E., 2006. Fish Migration Triggers and Cues in the Lower Mekong Basin and OtherFreshwater Tropical Systems. Mekong River Commission, Vientiane.
Baran, E., Samadee, S., Jiau, T.S., Tran, T.C., 2013a. Fish and fisheries in the Sesan,Sekong and Srepok River Basins (Mekong Watershed). ICEM – International Centrefor Environmental Management, Hanoi.
Baran, E., So, N., Degen, P., Chen, X.Y., Starr, P., 2013b. Updated information on fish andfisheries in the Mekong Basin. Catch Cult. 19, 24–25.
Borcard, D., Gillet, F., Legendre, P., 2011. Numerical Ecology with R. Springer Science,New York.
Cáceres, M. De, Legendre, P., 2009. Associations between species and groups of sites:indices and statistical inference. Ecology 90, 3566–3574. http://dx.doi.org/10.1890/08-1823.1.
Chau, K.W., Wu, C.L., 2010. A hybrid model coupled with singular spectrum analysis fordaily rainfall prediction. J. Hydroinf. 12, 458–473. http://dx.doi.org/10.2166/hydro.2010.032.
Cheng, L., Blanchet, S., Loot, G., Villéger, S., Zhang, T., Lek, S., Lek-Ang, S., Li, Z., 2014.Temporal changes in the taxonomic and functional diversity of fish communities inshallow Chinese lakes: the effects of river-lake connections and aquaculture. Aquat.Conserv. Mar. Freshwater Ecosyst. 24, 23–34. http://dx.doi.org/10.1002/aqc.2418.
Claasen, A.H., 2004. Abundance, distribution, and reproductive success of sandbarnesting birds below the Yali Falls hydropower dam on the Sesan River, northeasternCambodia. WWF/Danida/WCS/BirdLife International, Phnom Penh 10.13140/RG.2.2.26563.40488.
Cochrane, T.A., Arias, M.E., Piman, T., 2014. Historical impact of water infrastructure onwater levels of the Mekong River and the Tonle Sap system. Hydrol. Earth Syst. Sci.18, 4529–4541. http://dx.doi.org/10.5194/hess-18-4529-2014.
De Cáceres, M., Jansen, F., 2011. indicspecies: Functions to Assess the Strength andSignificance of Relationship of Species Site Group Associations. R Package Version 1.6.0. http://cran.r-project.org/web/packages/indicspecies.
De Cáceres, M., Legendre, P., Moretti, M., 2010. Improving indicator species analysis bycombining groups of sites. Oikos 119, 1674–1684.
Dray, S., Blanchet, G., Borcard, D., Guénard, G., Jombart, T., Larocque, G., Legendre, P.,Madi, N., Wagner, H.H., 2017. Adespatial: Multivariate Multiscale Spatial Analysis. RPackage Version 0.0-8. http://cran.r-project.org/package=adespatial.
Fan, H., He, D., Wang, H., 2015. Environmental consequences of damming the main-stream Lancang-Mekong River: a review. Earth-Sci. Rev. 146, 77–91. http://dx.doi.org/10.1016/j.earscirev.2015.03.007.
Froese, R., Pauly, D., 2017. FishBase. World Wide Web electronic publication [WWWDocument]. World Wide Web Electronic Publication. URL www.fishbase.org (ac-cessed 2.1.17).
Fukushima, M., Jutagate, T., Grudpan, C., Phomikong, P., Nohara, S., 2014. Potential
effects of hydroelectric dam development in the Mekong River basin on the migrationof Siamese mud carp (Henicorhynchus siamensis and H. lobatus) elucidated by otolithmicrochemistry. PLoS One 9. http://dx.doi.org/10.1371/journal.pone.0103722.
Guénard, G., Lanthier, G., Harvey-Lavoie, S., Macnaughton, C.J., Senay, C., Lapointe, M.,Legendre, P., Boisclair, D., 2016. A spatially-explicit assessment of the fish populationresponse to flow management in a heterogeneous landscape. Ecosphere 7, 1–13.http://dx.doi.org/10.1002/ecs2.1252.
Heino, J., Grönroos, M., 2016. Exploring species and site contributions to beta diversity instream insect assemblages. Oecologia. http://dx.doi.org/10.1007/s00442-016-3754-7.
Hirsch, P., Wyatt, A., 2004. Negotiating local livelihoods: scales of conflict in the Se SanRiver Basin. Asia Pac. Viewpoint 45, 51–68. http://dx.doi.org/10.1111/j.1467-8376.2004.00227.x.
Hortle, K.G., 2007. Consumption and the yield of fish and other aquatic animals from theLower Mekong Basin, MRC Technical Paper No. 16. Mekong River Commission,Vientiane.
International Rivers, 2014. Xayaburi Dam: Timeline of Events. International Rivers.https://www.internationalrivers.org.
Jellyman, P., Harding, J., 2012. The role of dams in altering freshwater fish communitiesin New Zealand. N. Z. J. Mar. Freshwater Res. 46, 475–489. http://dx.doi.org/10.1080/00288330.2012.708664.
Kassambara, A., 2017. Practical Guide to Cluster Analysis in R: Unsupervised MachineLearning. STHDA, Poland.
Kottelat, M., 2013. The Fishes of the inland waters of Southeast Asia: a catalogue and corebibliography of the fishes known to occur in freshwaters, mangroves and estuaries.Raffles Bull. Zool. 27, 1–663.
Legendre, P., De Cáceres, M., 2013. Beta diversity as the variance of community data:Dissimilarity coefficients and partitioning. Ecol. Lett. 16, 951–963. http://dx.doi.org/10.1111/ele.12141.
Legendre, P., Gauthier, O., 2014. Statistical methods for temporal and space − timeanalysis of community composition data. Proc. R. Soc. 281, 20132728.
Legendre, P., Legendre, L., 2012. Numerical Ecology, Third Engl. ed. Elsevier Science B.V,Great Britain.
Legendre, P., Salvat, B., 2015. Thirty-year recovery of mollusc communities after nuclearexperimentations on Fangataufa atoll (Tuamotu, French Polynesia). Proc. R. Soc. B:Biol. Sci. 282, 20150750. http://dx.doi.org/10.1098/rspb.2015.0750.
Li, J., Dong, S., Peng, M., Yang, Z., Liu, S., Li, X., Zhao, C., 2013. Effects of damming onthe biological integrity of fish assemblages in the middle Lancang-Mekong Riverbasin. Ecol. Indic. 34, 94–102. http://dx.doi.org/10.1016/j.ecolind.2013.04.016.
Liermann, C.R., Nilsson, C., Robertson, J., Ng, R.Y., 2012. Implications of dam obstructionfor global freshwater fish diversity. Bioscience 62, 539–548.
Macnaughton, C.J., Mclaughlin, F., Bourque, G., Senay, C., Lanthier, G., Harvey-Lavoie,S., Legendre, P., Lapointe, M., Boisclair, D., 2015. The effects of regional hydrologicalteration on fish community structure in regulated rivers. River Res. Appl. http://dx.doi.org/10.1002/rra.2991.
Magurran, A.E., 2004. Measuring Biological Diversity. Blackwell Science Ltd, Malden,USA.
MFD, 2003. Mekong Fish Database: A Taxonomic Fish Database for the Mekong Basin.Mekong River Commission, Phnom Penh.
Mims, M.C., Olden, J.D., 2013. Fish assemblages respond to altered flow regimes viaecological filtering of life history strategies. Freshwater Biol. 58, 50–62. http://dx.doi.org/10.1111/fwb.12037.
Mittermeier, R.A., Turner, W.R., Larsen, F.W., Brooks, T.M., Gascon, C., 2011. Globalbiodiversity conservation: The critical role of hotspots. In: Zachos, F., Habel, J. (Eds.),Biodiversity Hotspots: Distribution and Protection of Conservation Priority Areas.Springer-Verlag, Berlin Heidelberg, pp. 3–22. http://dx.doi.org/10.1007/978-3-642-20992-5.
MRC, 2010. State of the Basin Report 2010. Mekong River Commission, Vientiane, LaoPDR.
MRC, 2007. Monitoring Fish Abundance and Diversity in the Lower Mekong Basin:Methodological Guidelines. Mekong River Commission, Phnom Penh.
MRC, 2005. Overview of the Hydrology of the Mekong Basin, Mekong River Commission.Mekong River Commission, Vientiane.
MRCS, 1992. Fisheries in the Lower Mekong Basin, Main Report and Annex. (Review ofthe Fishery Sector in the Lower Mekong Basin). Interim Committee for theCoordination of Investigations of the Lower Mekong Basin, Mekong RiverCommission Secretariat, Bangkok.
Ou, C., Montaña, C.G., Winemiller, O., 2017. Body size – trophic position relationshipsamong fishes of the lower Mekong basin. R. Soc. Open Sci. 4, 160645. http://dx.doi.org/10.1098/rsos.160645.
Ou, C., Winemiller, K.O., 2016. Seasonal hydrology shifts production sources supportingfishes in rivers of the lower Mekong Basin. Can. J. Fish. Aquat. Sci. 73, 1–21. http://dx.doi.org/10.1007/s13398-014-0173-7.2.
Phomikong, P., Fukushima, M., Sricharoendham, B., Nohara, S., Jutagate, T., 2014.Diversity and community structure of fishes in the regulated versus unregulatedtributaries of the Mekong river. River Res. Appl. 14.
Piman, T., Cochrane, T.A., Arias, M.E., Green, A., Dat, N.D., 2013. Assessment of flowchanges from hydropower development and operations in Sekong, Sesan, and SrepokRivers of the Mekong Basin. J. Water Resour. Plann. Manage. 139, 723–732. http://dx.doi.org/10.1061/(ASCE)WR.1943-5452.
Poff, N.L., Olden, J.D., Merritt, D.M., Pepin, D.M., 2007. Homogenization of regional riverdynamics by dams and global biodiversity implications. Proc. Natl. Acad. Sci. U.S.A.104, 5732–5737. http://dx.doi.org/10.1073/pnas.0609812104.
Poulsen, A.F., Hortle, K.G., Valbo-Jorgensen, J., Chan, S., Chhuon, C.K., Viravong, S.,Bouakhamvongsa, K., Suntornratana, U., Yoorong, N., Nguyen, T.T., Tran, B.Q.,2004. Distribution and Ecology of Some Important Riverine Fish Species of the
P.B. Ngor et al. Ecological Indicators 88 (2018) 103–114
113 184
Mekong River Basin. MRC Technical Paper No. 10. Mekong River Commission,Phnom Penh.
Poulsen, A.F., Ouch, P., Viravong, S., Suntornratana, U., Nguyen, T.T., 2002. FishMigrations of the Lower Mekong Basin: Implications for Development, Planning andEnvironmental Management. Mekong River Commission, Phnom Penh.
Qiao, X., Li, Q., Jiang, Q., Lu, J., Franklin, S., Tang, Z., Wang, Q., Zhang, J., Lu, Z., Bao,D., Guo, Y., Liu, H., Xu, Y., Jiang, M., 2015. Beta diversity determinants inBadagongshan, a subtropical forest in central China. Sci. Rep. 5, 17043. http://dx.doi.org/10.1038/srep17043.
R Core Team, 2015. R: A Language and Environment for Statistical Computing. RFoundation for Statistical Computing.
Rainboth, W.J., 1996. Fishes of the Cambodian Mekong. Food and AgricultureOrganisation of the United Nations, Rome.
Rainboth, W.J., Vidthayanon, C., Mai, D.Y., 2012. Fishes of the Greater MekongEcosystem with Species List and Photographic Atlas. Museum of Zoology, Universityof Michigan, Ann Arbor.
Röpke, C.P., Amadio, S., Zuanon, J., Ferreira, E.J.G., de Deus, C.P., Pires, T.H.S.,Winemiller, K.O., 2017. Simultaneous abrupt shifts in hydrology and fish assemblagestructure in a floodplain lake in the central Amazon. Sci. Rep. 7, 1–10. http://dx.doi.org/10.1038/srep40170.
Rutkow, E., Crider, C., Giannin, T., 2005. Down River. The Consequences of Vietnam’s SeSan River dams on Life in Cambodia and Their Meaning in International Law. NGOForum on Cambodia, Phnom Penh.
Sabo, J.L., Ruhi, A., Holtgrieve, G.W., Elliott, V., Arias, M.E., Ngor, P.B., Räsänen, T.A.,Nam, S., 2017. Designing river flows to improve food security futures in the LowerMekong Basin. Science 358, 1–11. http://dx.doi.org/10.1126/science.aao1053.
Schmutz, S., Mielach, C., 2015. Review of existing research on fish passage through largedams and its applicability to Mekong mainstream dams. MRC Technical Paper No.48. Mekong River Commission, Phnom Penh.
Sverdrup-Jensen, S., 2002. Fisheries in the Lower Mekong Basin: Status and Perspectives.MRC Technical Paper No. 6. Mekong River Commission, Phnom Penh.
Tilt, B., Braun, Y., He, D., 2008. Social impacts of large dam projects: A comparison ofinternational case studies and implications for best practice. J. Environ. Manage. 1–9.http://dx.doi.org/10.1016/j.jenvman.2008.07.030.
Tonkin, J.D., Bogan, M.T., Bonada, N., Ríos-Touma, B., Lytle, D.A., 2017. Seasonality andpredictability shape temporal species diversity. Ecology 1–16. http://dx.doi.org/10.1002/ecy.1761.
Try, T., Chambers, M., 2006. Situation Analysis: Stung Treng Province, Cambodia.Mekong Wetlands Biodiversity Conservation and Sustainable Use Programme,Vientiane.
Wang, W. chuan, Chau, K. wing, Xu, D. mei, Qiu, L., Liu, C. can, 2017. The annualmaximum flood peak discharge forecasting using hermite projection pursuit regres-sion with SSO and LS method. Water Resour. Manage. 31, 461–477. http://dx.doi.org/10.1007/s11269-016-1538-9.
Welcome, R.L., 2001. Inland Fisheries: Ecology and Management, 1st ed. Food andAgriculture Organization of the United Nations by Blackwell Science, Great Britain.
Winemiller, K., McIntyre, P., Castello, L., Fluet-Chouinard, E., Giarrizzo, T., So, N., Baird,I., Darwall, W., Lujan, N., Harrison, I., Stiassny, M., Silvano, R., Fitzgerald, D.,Pelicice, F., Agostinho, A., Gomes, L., Albert, J., Baran, E., Petrere, M., Zarfl, C.,Mulligan, M., Sullivan, J., Arantes, C., Sousa, L., Koning, A., Hoeinghaus, D., Sabaj,M., Lundberg, J., Armbruster, J., Thieme, M., Petry, P., Zuanon, J., Vilara, G., Snoeks,J., Ou, C., Rainboth, W., Pavanelli, C., Akama, A., van Soesbergen, A., Saenz, L.,2016. Balancing hydropower and biodiversity in the Amazon, Congo, and Mekong.Science 351, 128–129.
Ziv, G., Baran, E., So, N., Rodriguez-Iturbe, I., Levin, S.A., 2012. Trading-off fish biodi-versity, food security, and hydropower in the Mekong River Basin. Proc. Natl. Acad.Sci. U.S.A. 109, 5609–5614.
P.B. Ngor et al. Ecological Indicators 88 (2018) 103–114
114 185


ARTICLE 5
Fish assemblage responses to flow seasonality and predictability
in a tropical flood pulse system
Peng Bun Ngor, Thierry Oberdorff, Phen Chheng, Christophe Baehr, Gaël
Grenouillet, Sovan Lek
Ecoshpere (in revision)
186


1
Fish assemblage responses to flow seasonality and predictability in a
tropical flood pulse system
Peng Bun Ngor1,2,¥, Thierry Oberdorff2, Chheng Phen1, Christophe Baehr3,
Gaël Grenouillet2,4, Sovan Lek2
1. Fisheries Administration, No. 186, Preah Norodom Blvd., Khan Chamcar Morn, P.O. Box 582,
Phnom Penh, Cambodia.
2. CNRS, IRD, Université Toulouse III Paul Sabatier; UMR5174 EDB (Laboratoire Évolution
& Diversité Biologique); 118 route de Narbonne, F-31062 Toulouse, France.
3. Météo-France CNRM/GMEI, 42 Avenue de Coriolis, 31057 Toulouse cedex, France.
4. Institut Universitaire de France, Paris, France.
¥. Current address: CNRS, IRD, Université Toulouse III Paul Sabatier; UMR5174 EDB (Laboratoire
Évolution & Diversité Biologique); 118 route de Narbonne, F-31062 Toulouse, France.
Running head: Fish assemblage response to flow change
Corresponding author: Peng Bun Ngor ([email protected])
187

2
Abstract
Hydropower dams are looming in the Mekong Basin, affecting river flows that structure aquatic
communities. Here, we quantitatively assessed flow seasonality and predictability in three sites located
in three rivers displaying a gradient in flow alterations caused by upstream dams and investigated how
fish assemblages responded seasonally and inter-annually to this gradient. By analyzing 7-year daily
fish and water monitoring data, we found that dams disturbed the natural flow seasonality and
predictability. While the river displaying the lower seasonality-predictability was characterized by a
distinct seasonal variation in assemblage composition with high species turnover, rivers with stronger
flow seasonality-predictability exhibited broadly similar seasonal patterns in fish assemblage
composition with low species turnover and regular annual peaks of fish migration. These results
challenge the expectation of higher species turnover in systems displaying higher flow seasonality and
predictability and may be partly due to the strong adaptation of fish assemblages to these specific
systems. By enhancing our understanding of biological systems in the highly seasonal-predictable and
aseasonal-unpredictable environments of the lower Mekong system, these findings suggest that
hydropower-related pulsed flows that can mimic as far as possible natural pulsed flows are critical to
reduce downstream effects on aquatic organisms.
Keywords: hydropower dam, freshwater fishes, flow regulation, species turnover, Mekong River Basin.
188

3
INTRODUCTION
Construction of hydropower dams are continuously increasing mainly in developing countries
and the emerging economies of Southeast Asia, South America and Africa (Zarfl et al. 2015). These
dams are constructed or planned predominantly in the world’s most bio-diverse river basins such as the
Amazon, the Congo and the Mekong (Winemiller et al. 2016). The Mekong Basin was, for example,
identified as one of the world’s regions with high threats for water security to both humans and
biodiversity (Mcintyre et al. 2010). In this basin, numerous large dams have been built since 1990s and
several others are planned or under construction (Fan et al. 2015, Winemiller et al. 2016, Ngor et al.
2018) (see also Fig. 1, S1).
Among other things dams are known worldwide to disrupt river continuity, to block migration
routes of riverine fishes, to dampen flood pulses and to mute flow seasonality. These disturbances alter
in return the structure of aquatic assemblages that are seasonally adapted to natural seasonal flow
dynamics (Collier et al. 1996, Agostinho et al. 2004, Graf 2006, Poff et al. 2007, Latrubesse et al. 2017,
Sabo et al. 2017). Specifically, dams generate hydropower-related pulsed flows e.g. hydropeaking
reacting to energy demands (from hourly to seasonally) which adversely affect riverine fishes and other
aquatic organisms through stranding/ extirpation, downstream displacement and spawning/rearing
disruption (Young et al. 2011, Schmutz et al. 2015, Kennedy et al. 2016, Tonolla et al. 2017).
Hydrology of the Mekong River is characterized by strong seasonality with regular wet and dry
seasons highly predictable across years (MRC 2005, Adamson et al. 2009). Given that the structuring
force of the Mekong fish assemblages is deeply embedded in the local seasonality and predictability of
the Mekong’s hydrological conditions, flow alterations caused by upstream dams (i.e. modifying
timing, magnitude and frequencies of seasonal flow) should have implications for spatiotemporal
dynamics of these assemblages (Valbo-Jorgensen and Poulsen 2000, Poulsen et al. 2002, Baran 2006,
Adamson et al. 2009, Sabo et al. 2017).
The seasonality concept is widely applied to explain life history adaptations of organisms
(Mcnamara and Houston 2008), changes in species trait distribution patterns (Fitzgerald et al. 2017),
shifts in abundance and coexistence of species (Shimadzu et al. 2013), shifts in food web structure
(McMeans et al. 2015) or changes in beta diversity patterns (Tonkin et al. 2017). In addition, to have a
complete understanding of the temporal patterns of local assemblages, there is a need to consider the
system predictability (Colwell 1974, Tonkin et al. 2017). By definition, “seasonality is the occurrence
of certain obvious biotic and abiotic events or groups of events within a definite limited period or
periods of the astronomic (solar, calendar) year” while predictability is “ the regularity of recurrence of
the within cycle (e.g. annual) distribution of events across multiple cycles” (Tonkin et al. 2017).
Here, we focused on a strongly tropical seasonal-predictable flood pulse system (MRC 2005,
Adamson et al. 2009) (i.e. the lower Mekong system) and used Tonkin’s et al. seasonality-predictability
framework (Tonkin et al. 2017) to assess how hydrological alterations caused by upstream dams
structured local fish assemblages. According to this framework, predictably seasonal environmental
189

4
conditions should promote the highest levels of temporal changes in species abundance, richness and
assemblage composition with high seasonal turnover due to hypothetical distinct habitats between
seasons. On the other hand, aseasonal and unpredictable systems should generate the lowest temporal
diversity, harboring assemblages that show little seasonal species turnover. In other words, species
turnover would be maximized under highly predictable seasonal conditions, while nestedness (i.e.
assemblages in one season being a subset of those in the other season) may dominate in unpredictable
aseasonal environments (Tonkin et al. 2017). To test these hypotheses, we focused on three study sites
experiencing different levels of flow alteration, and for which we expected a gradient in flow seasonality
and predictability. Specifically, we first assessed how seasonality and predictability of flow patterns
varied among the three sites. Second, we tested the hypotheses that seasonal variations in fish
assemblage abundance, richness and composition were driven by flow seasonality and predictability
using a unique 7-year daily fish and water level dataset monitored at the three sites. Seasonal patterns
of fish trait were also examined to explain the seasonal variation in fish assemblage due to the expected
gradient of flow alteration in the three sites.
METHODS
Study sites
This study covered three sites i.e. the Mekong mainstem at Kratie (KT), the Sesan River (SS) at
Ratanakri joining the Sekong and the Mekong River in Stung Treng, and the Tonle Sap River (TS) at
Kandal joining the Mekong River in the capital city of Phnom Penh (Fig. 1). At KT, the Mekong mean
annual discharge is ~475 billion m3 year-1 varying from < 3000m3 s-1 during low flows (March–April)
to ~40000m3 s-1 during high flows (August–September) (Adamson et al. 2009). SS covers ~24% of the
total surface area (78,645 km2) of the Sekong, Sesan, Srepok (3S), had mean daily water level of ~4.91
m (at Voeun Sai) for the period June 2007 – May 2014 and contributes ~20% to the Mekong total annual
flows (MRC 2005, Adamson et al. 2009). TS sub-basin covers a catchment area of 85,790 km2 (11% of
the Mekong Basin (MRC 2003)) and receives 54% of its waters from the Mekong River, 34% from its
lake tributaries and the rest from rainfalls (Kummu et al. 2014). Mean discharge at the Tonle Sap River
was estimated at ~83.1 and ~81.9 billion m3 during the inflow and outflow periods, respectively
(Kummu et al. 2014). The selected study sites are all located in the most fish biodiverse ecoregions of
the Lower Mekong Basin (LMB) (Poulsen et al. 2002, Chea et al. 2016). For example, TS and its
floodplain lake is a World Biosphere Reserve under the United Nations Educational, Scientific and
Cultural Organization (UNESCO) since 1997 (Davidson 2006), one of the world largest freshwater
fisheries zone (Baran 2005). Riverine fishes (87% of the total 1200 Mekong fishes) seasonally utilize
these river systems as part of their life cycles (Rainboth 1996, Baran et al. 2013). Most species spawn
and seasonally migrate down the river system in KT and Stung Treng to enter feeding and rearing
habitats in the TS floodplains and areas southern Phnom Penh, or up the Sekong, Sesan (SS) and Srepok
tributaries (3S) at the onset of the wet season, and later return in the Mekong mainstream (i.e. KT and
190

5
Stung Treng) to find refugia for sedentary periods at the onset of the dry season (Valbo-Jorgensen and
Poulsen 2000, Poulsen et al. 2002, 2004, Sverdrup-Jensen 2002, Baran 2006).
While more natural flow conditions were observed in KT and TS, flows in SS appeared to be
highly altered (compared to its pre-dam condition) by the functioning of upstream dams which weakens
the flow seasonality and predictability strength of the system and generates strong aseasonality with
unnatural sudden rising and falling water levels (see Supplementary Information S1, S2, Fig. 2). Such
unnatural pulsed flows in SS can be related to hydropeaking which is commonly experienced with
hydropower dams worldwide (Young et al. 2011, Kennedy et al. 2016) and known to alter hydraulic
parameters such as water levels, velocity and bed shear stress (Meile et al. 2010, Young et al. 2011,
Kennedy et al. 2016, Bejarano et al. 2017, Tonolla et al. 2017). Previous studies also qualitatively
described rapid rising and falling water levels in the downstream SS when the 720 MW Yali Falls dam
was under construction in 1996 and became officially operational since 2000 (Ratanakiri Fisheries
Office 2000, Baird et al. 2002, Claasen 2004, Hirsch and Wyatt 2004, Baird and Meach 2005, Rutkow
et al. 2005). Flow alternations became even more severe when five more dams were commissioned
between 2006 and 2011 (Fig. 2b, S1). As indicated in a recent study, the upstream SS’s under-
construction and operational dams in Viet Nam Highlands caused an overall increase of 52% in dry
season flow and a decrease of 22% in the wet season flow of this river near the Cambodia border (Piman
et al. 2013). Therefore, strong aseasonal and unpredictable variabilities of flow evidenced in SS are
highly likely explained by hydropower-related pulsed flows.
Data collection
Data collection was based on the standard sampling procedures of the Mekong River
Commission (MRC) (MRC 2007). Fish catches were routinely monitored between June 2007 and May
2014 at the three studied sites. Our sampling sites stayed unchanged over the 7-year study period (i.e.
the same habitats were prospected all along the period). Daily, a set of stationary gillnets (length:
120±50 m, height: 2–3.5 m, mesh size: 3-12 cm, soak hours/day: 12±2) was used to capture fish (three
fishers for each site). The fishers were supervised by the fish monitoring officers from the Cambodia
Inland Fisheries Research and Development Institute of the Fisheries Administration and the MRC. A
list of about 900 Mekong fishes and their traits was derived from the Mekong Fish Database (MFD
2003). Captured fish were identified to the species level and counted; and their taxonomic classification
as well as species traits were updated using FishBase (Froese and Pauly 2017) in cross-checking with
(Rainboth 1996, Rainboth et al. 2012, Kottelat 2013). The collected fish data were recorded into the
national fish monitoring database. Water levels at each location were registered by MRC. Key fish traits
used in the analysis of seasonal patterns fall in five broad categories namely physical habitat guilds,
migration guilds, maximum total lengths, trophic levels and positions in the water column. Details of
each fish trait category are given in S10.
191

6
Figure 1. Map showing the study sites and hydropower dam positions in the Mekong Basin (Data source: MRC Hydropower Project Database 2015). Site codes: SS = Sesan River, KT = Mekong River in Kratie, TS = Tonle Sap River.
192

7
Statistical analyses
Daily species abundance collected by the three fishers in each site was computed as daily mean
samples and then summed into weekly species abundance from 1 June 2007 to 31 May 2014 (i.e. 366
weeks). Similarly, site daily water levels were computed as mean weekly water levels for the same 366
weeks. All statistical analyses were performed in R (R Core Team 2015).
To quantify the strength of seasonality, Colwell’s seasonality index (Colwell 1974) on site daily
water levels was computed using Colwells function of hydrostats package (Bond 2016). The seasonality
index M/P which is the Colwell’s measure of contingency (M) standardized by Colwell’s within-season
predictability (P) (Colwell 1974, Tonkin et al. 2017) was used. Colwell’s contingency (consistency of
timing between years) quantifies the degree of repeatability of biological (e.g. fish migration) or
physical (e.g. hydrology) periodic phenomena. The value of the seasonality index varies between 0 and
1, with 1 being the maximum seasonality value. In addition, wavelet analysis was applied to quantify
the strength of predictability of site hydrology. The wavelet analysis is a harmonic analysis with a time-
frequency representation of a signal. This harmonic analysis uses a special function called mother
wavelets which allow time and scale localizations. Using the R-package WaveletComp, the Morlet
mother-wavelet was selected (Roesch and Schmidbauer 2014) for the analysis. While being comparable
to the Fourier analysis that detects the dominant frequencies over time series, wavelets offer the
advantage of investigating multiple scales simultaneously (Torrence and Compo 1998, Tonkin et al.
2017). In the wavelet transform, a time-series is decomposed into time, frequencies and the power which
can be examined in the three-dimensional space through the plot of the wavelet power spectrum (WPS).
In WPS plot, "time" indicates the time series on the X-axis while the contribution of the "frequencies"
is represented by "period" on the Y-axis. The "power" characterizes the magnitude of variance within
the time series at a given wavelet. The WPS determines which features of the signal are determinant
and contributive and which are less significant.
To compare seasonal fish assemblage responses among sites, we (i) defined the wet (June-
November) and dry (December-May) seasons, based on 9-year mean daily water levels of the Mekong
River, when entering Cambodia (at Stung Treng) (S3); (ii) computed weekly fish assemblage matrix in
each site as mean seasonal assemblage matrix; (iii) applied Principal Components Analyses (PCA) on
the Hellinger-transformed seasonal fish abundance and trait data matrices, using fviz_pca_ind function
of factoextra package (Kassambara 2017) to visualize seasonal (dry and wet seasons) patterns of fish
assemblages in each site. Hellinger transformation was applied because PCA is a linear ordination
model that requires pre-transformation of the abundance data to meet the (multi)normal distribution
assumption (Borcard et al. 2011). Finally, we computed the seasonal beta diversity, and partitioned it
into turnover (i.e. species replacement in one season by different species in the other season) and
nestedness (i.e. species in one season being a strict subset of the species at the other season) components,
using beta.pair function with Sorensen dissimilarity index from betapart package (Baselga 2010,
Baselga and Orme 2012). Also, species turnover and nestedness were computed separately for wet and
193

8
dry seasons to examine how each season affects the observed turnover and nested pattern of beta
diversity in each of the three study sites.
To identify significant interdependencies at multiple time-scales between fish assemblages and
water levels over the study period, cross-wavelet analyses were performed on the weekly series of fish
total abundance and richness (Y) and mean weekly water levels (second Y axis), using
analyze.coherency function from WaveletComp package (Roesch and Schmidbauer 2014). Cross-
correlation analysis (ccf function) on the abundance and richness (Y) and water series (second Y axis)
in each site was used to derive the time lag with the maximum value of cross-correlation coefficients
(Shumway and Stoffer 2011) that correlated the fish assemblage responses to site hydrological
variations. Prior to cross-correlation analyses, fish abundance, richness and water data series were tested
for stationarity (i.e. if there were significant linear temporal trends in the data). When stationarity was
violated (as detected for abundance, richness and water data series in SS, abundance and richness data
series in KT and richness data series in TS), residuals were computed to detrend the series (Legendre
and Legendre 2012) and used in the cross-correlation analyses.
RESULTS
Seasonality-predictability of site hydrology
Colwell’s seasonality index on hydrology consistently found that flows in TS exhibited the
strongest seasonality (M/P = 0.93), whereas KT ranked second in its seasonal flow patterns (M/P =
0.90) and SS showed the weakest flow seasonality (M/P = 0.83). Flows in KT and TS had more
seasonal-predictable patterns than in SS where strong flow variability was observed (Fig. 2a). As further
evidenced in the wavelet plots (Fig. 2b), flows in TS and KT comparably exhibited very strong
continuous seasonal-predicable patterns as indicated by a uniformly wide red band at ~52-week
frequency (annual cycle). Such patterns were relatively weak in SS, with observed chaotic signals of
strong wavelet power at multiple periods across the wavelet spectrum. Flow variations in KT and TS
also demonstrated a secondary strong predicable power (red-yellow) at ~26-week frequency (semi-
annual cycle), while no such patterns were captured in the wavelet power spectrum in SS (Fig. 2b).
Such patterns were illustrated clearly in the average wavelet power across the full 7-year period,
showing the strongest peaks at 52-week frequencies for all sites, with increasing average wavelet power
(i.e. predictability strength) in the respective order of site SS, KT and TS (Fig. 2c).
194

9
Figure 2. Seasonality and predictability of 7-year weekly water levels of the three rivers: SS, KT and
TS. (a) Site water level series. (b) Wavelet power spectrum of site water levels, with red representing
stronger wavelet power and blue weak, (c) Site average wavelet power derived from (b). Note that
Cowell’s seasonality index (M/P) was 0.83 in SS, 0.90 in KT and 0.93 in TS. For site codes, see Figure
1.
Fish assemblage patterns
Overall, 266 species were recorded from the three sites (133 in SS, 208 in KT and 143 in TS).
Fish abundance (number of individuals) was higher in SS and TS than in KT (S4a). By contrast, KT
was the most species-rich relative to SS and TS (S4b). Fish assemblages in SS and TS were
disproportionately dominated by small body-sized generalist species, whereas assemblages in KT were
more proportionally represented by species with different body-sized classes (small, medium, large and
giant-sized species) (S5, S6). However, three small-sized generalists (from family: Cyprinidae, order:
Cypriniformes) namely Henicorhynchus lobatus, H. siamensis, Labiobarbus siamensis, were
dominantly ubiquitous in the three sites. While H. lobatus was the most abundant species in KT and
TS, a small-sized floodplain resident climbing perch, Anabas testudineus (family: Anabantidae, order:
Perciformes), ranked top in SS. See S5 for top 15 abundant species and S6 for mean weekly abundance
of key species recorded in each of the three sites.
195

10
Figure 3. Seasonal fish assemblage and trait responses. PCA plots displaying (a) seasonal fish
assemblage patterns and (b) seasonal fish trait patterns grouped by wet (W) and dry (D) seasons. For
(a), the two digits after W and D indicate ‘year’, e.g. W07 = wet season 2007 etc. For (b), solid points
indicate season as shown in (a) and the abbreviations denote fish traits including (1) physical habitat
guilds i.e. F1 (Rithron resident), F2 (Main channel resident), F3 (Main channel spawner), F4
(Floodplain spawner), F5 (Eurytopic/generalist), F6 (Floodplain resident), F7 (Estuarine resident), F8
(Anadromous), F9 (Catadromous) F10 (Marine visitor), F11 (Non-native); (2) migration guilds i.e. WH
(White fishes = longitudinal migratory species between Mekong River, lower floodplains and major
tributaries, BL (Black fishes = non-longitudinal migratory or floodplain residents), GR (Grey fishes =
lateral migration between floodplain and local rivers or streams); (3) maximum total lengths i.e. LG
(Giant size, >=100 cm), LL (Large size, 61-99 cm), LM (Medium size, 26-60 cm), LS (Small size, <=
25 cm); (4) trophic levels i.e. T1 (trophic level <=2.75), T2 (trophic level, 2.76 – 3.75), T3 (trophic
level, > 3.75) and (5) positions in the water column include BE (benthopelagic), DE (demersal), PE
(pelagic), PN (pelagic-neritic), RA (Reef associated). For site codes, see Figure 1. For species trait
details, see S10.
Seasonal fish abundances and richness showed no significant difference between dry and wet
seasons (with p-values = 0.8 and 0.14, respectively) in SS (S7a, b). In KT, significantly higher richness
was detected during the dry season (p-value = 0.04), while no significant difference was observed for
seasonal fish abundances (p-value = 0.21). In TS, abundance was by far significantly higher during the
196

11
dry season (p-value = 0.0006), while no significant difference was observed for seasonal richness (p-
value = 0.52).
Clear differences in fish assemblages between dry and wet seasons were observed in SS and to
a lesser extent in KT, while seasonal assemblages in TS appeared less discriminated between the two
seasons (Fig. 3). Temporal beta diversity showed a gradient of seasonal species turnover among sites
with the highest values observed in SS and the lowest in TS (Fig. 4). KT displayed intermediate values
for both species turnover and nestedness in the three sites. In SS, high species turnover occurred during
the dry season (p-value < 0.0001) and high nested pattern occurred during the wet season (p-value =
0.004). In KT, high species turnover occurred during the wet season (p-value < 0.0001) and no
significant difference was revealed in seasonal nestedness. In TS, no significant difference between wet
and dry seasons was observed for both species turnover and nestedness (Fig. 4b).
Figure 4. Seasonal beta diversity partitioned into seasonal species turnover and nestedness using
Sorensen dissimilarity index. (a) Site seasonal species turnover and nested patterns. (b) Site species
turnover and nestedness patterns by wet and dry seasons. Mean values among sites with a common
letter are not significantly different at the 0.05 level (Pairwise Wilcoxon Rank Sum Tests). For site
codes, see Figure 1.
197

12
Generally, there is a clear distinct pattern of fish traits between the wet and dry season for the
three study sites regardless of different flow seasonality and predictability. Interestingly, longitudinal
migratory species used SS and KT mainly during the dry season and TS during the wet season. Also,
high trophic level floodplain resident species using demersal habitats appear to colonize tributary rivers
(i.e. SS, TS) during the wet season (Fig. 3b).
Fish abundance and richness, and flow coherence
No clear peak in both weekly abundance and richness in relation to hydrological cycles was
observed in SS (Fig. 5a, 6a). By contrast, a clear seasonal peak in abundance was repeated annually i.e.
before the peak water levels in KT (i.e. at the onset of wet season) and after the peak water levels in TS
(i.e. during the falling water levels), whereas richness in both sites was greater during the low flow.
Noticeably, fish abundance showed a significant declining trend in SS (p-value = 0.03) and KT (p-value
< 0.0001), while richness exhibited significant decreasing trends for all sites (p-value < 0.0001) over
the study period (S8).
Cross-wavelet analysis on variation of weekly abundance and richness with water levels
showed that KT and TS were characterized by strong, coherent seasonality-predictability cross-wavelet
power in the two data-series at annual (~52 weeks) and semi-annual (26 weeks) frequencies (Fig. 5b,
6b). Such patterns were incoherent and mixed up in SS, as illustrated by disordered responses of the
bivariate series with patchy red colors, fragmented ridges and arrows, pointing to different directions
across the cross-wavelet power spectrum. These patterns were illustrated clearly in the site average
cross-wavelet power over the 7-year study period, showing the strongest peak at 52-week and secondary
peak at 26-week frequencies for all sites, with SS having the weakest average cross-wavelet power
relative to KT and TS (Fig. 7a, b). Noticeably, average cross-wavelet power for the abundance versus
water series was muted in SS relative to KT and TS (Fig. 7a).
Cross-correlation analyses (Fig. 8) revealed that abundance and richness in SS exhibited no
seasonality, with almost no significant coefficients detected in the abundance series as compared to
those of KT and TS. Correlation lags with maximum coefficients between abundance and water levels
were estimated at -26 weeks in SS, 20 weeks in KT (before the peak flow in September) and -15 weeks
in TS (after the peak flow in early October), whereas correlation lags with maximum coefficients
between richness and water levels were estimated at -22 weeks in SS, -26 weeks in KT (after the peak
flow or during the low flow period) and -10 weeks in TS (after the peak flow). It is noteworthy that the
cross-correlation lag with the maximum coefficient between water levels in KT and TS was estimated
at -4 weeks (S9). The list of fish species names, their abbreviations and traits by genera, families and
orders is given in S10.
198
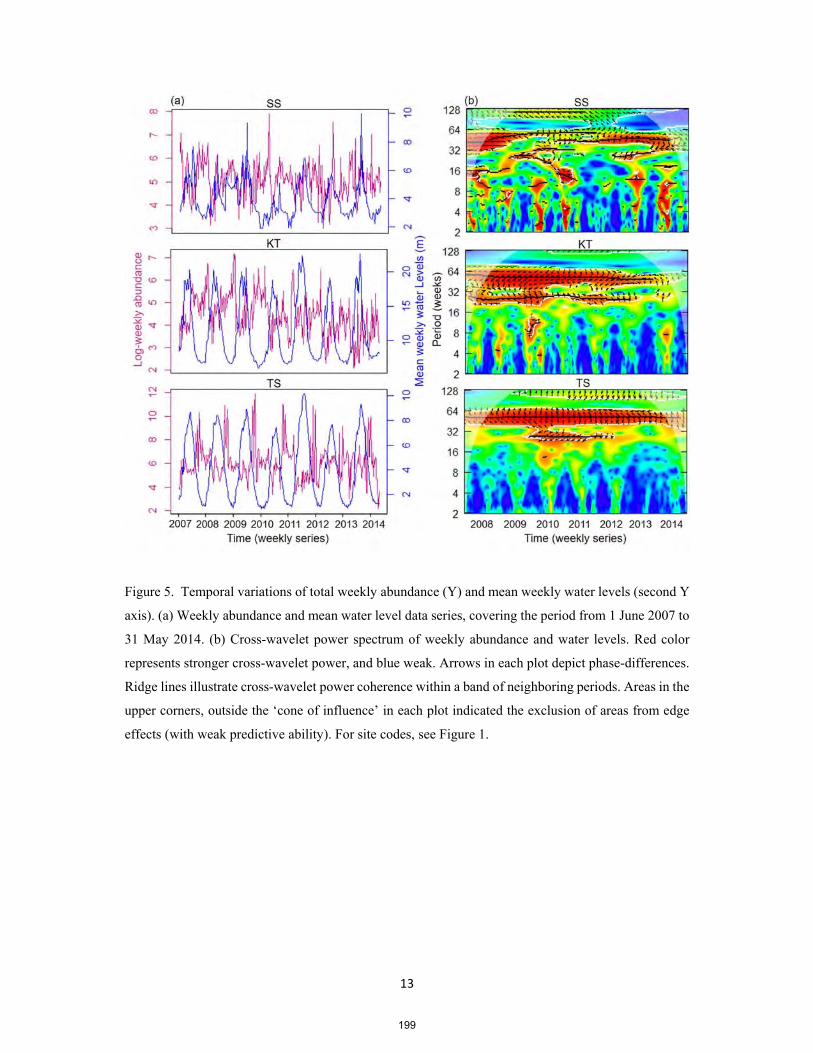
13
Figure 5. Temporal variations of total weekly abundance (Y) and mean weekly water levels (second Y
axis). (a) Weekly abundance and mean water level data series, covering the period from 1 June 2007 to
31 May 2014. (b) Cross-wavelet power spectrum of weekly abundance and water levels. Red color
represents stronger cross-wavelet power, and blue weak. Arrows in each plot depict phase-differences.
Ridge lines illustrate cross-wavelet power coherence within a band of neighboring periods. Areas in the
upper corners, outside the ‘cone of influence’ in each plot indicated the exclusion of areas from edge
effects (with weak predictive ability). For site codes, see Figure 1.
199

14
Figure 6. Temporal variations of total weekly richness (Y) and mean weekly water levels (second Y
axis). (a) Weekly richness and mean water level data series, covering the period from 1 June 2007 to
31 May 2014. (b) Cross-wavelet power spectrum of weekly richness and water levels. Red color
represents stronger cross-wavelet power, and blue weak. Arrows in each plot depict phase-differences.
Ridge lines illustrate cross-wavelet power coherence within a band of neighboring periods. Areas in the
upper corners, outside the ‘cone of influence’ in each plot indicated the exclusion of areas from edge
effects (with weak predictive ability). For site codes, see Figure 1.
Figure 7. Site average cross-wavelet power. (a) abundance versus water series derived from Figure 5b;
(b) richness versus water series derived from Figure 6b. For site codes, see Figure 1.
200

15
Figure 8. Cross-correlation plots between (a) weekly abundance (Y), (b) weekly richness (Y), and mean
weekly water levels (second Y axis) in each site. In the cross-correlations, the dotted blue lines give the
values beyond which the correlations are significantly different from zero. X-axis is the time lags, set
at 52 weeks (i.e. annual cycle). Data series on fish and water levels used for the cross-correlation plots,
covering the period from 1 June 2007 to 31 May 2014. For site codes, see Figure 1.
DISCUSSION
Overall our results support the hypothesis of a gradient in fish assemblage responses with flows
seasonality-predictability, but surprisingly in a way contrary to the Tonkin’s et al framework (Tonkin
et al. 2017). Indeed, we found higher assemblages seasonal turnover and lower nestedness in the site
experiencing seasonal flow disturbances (SS) than in the more pristine ones (KT, TS). At least one
201

16
reason could explain these contrasted results. The main hypothesis evoked by Tonkin et al. to expect
high seasonal turnover in assemblages is that distinct habitats and thus distinct fauna should appear
between seasons. To validate their hypothesis, they used stream invertebrate assemblages. While this
distinct habitat hypothesis could work for invertebrates (Tonkin et al. 2017), whether it applies to fish
assemblages is far from evident. First, native fish assemblages are adapted to these predictable natural
seasonal disturbances and are resistant to change and second the habitat does not change structurally
during high flow periods, except for water volume and water velocity. Species not adapted to high water
velocities will disperse to escape these periodic unfavorable conditions and latter recolonize the site
during dry season periods. Following this reasoning we expect, as what we actually found, low turnover
in sites displaying seasonal predictable flows and nested patterns in assemblage composition between
high flow and low flow periods (high flow assemblages being a subset of low flow assemblages). This
being said the high assemblage turnover found for our most disturbed site (SS) is more challenging to
explain but could be related to hydropeaking.
Indeed, hydropeaking is known to fragment habitats altering fish assemblage composition and
diversity due to, among other factors, stranding and downstream displacement, and reduced spawning
and rearing success of fish (Hunter 1992, McLaughlin et al. 2006, Habit et al. 2007, Poff et al. 2007,
Clarke et al. 2008, Young et al. 2011, Schmutz et al. 2015, Kennedy et al. 2016). First, fish stranding
was reported in SS (Baird and Meach 2005). Also, riverine fishes sheltering in the river deep pools or
potholes may be reluctant to leave during the low flow periods, and become stranded following rapid
falls in flow (Young et al. 2011). Such stranding affects assemblage structure and population as fish can
be extirpated through predation, temperature stress and/or oxygen depletion (Hunter 1992, Clarke et al.
2008, Young et al. 2011). As found in this study, significant high species turnover in SS occurred during
the dry season periods (Fig. 4b). Second, fish in SS are likely displaced downstream by hydropeaking,
and replaced by upstream fishes. Such downstream displacement happens particularly for juvenile and
small-sized fishes, and species preferring littoral and backwater areas that either swim or passively drift
with the current (Young et al. 2011). Experimental studies have shown that Cyprinidae could be
displaced downstream because of their less aerobic red muscle (Bainbridge 1960, 1962). Finally,
hydropeaking creates ‘false attraction flows’ giving false environmental cues for fish e.g. to migrate,
spawn or for eggs to hatch afterwards facing stranding, eggs and nest sites dewatering, stress and
insufficient food supply following sudden falls in flow and vice versa (Clarke et al. 2008, Young et al.
2011). Similar cases were reported in SS where nesting sites for snakeheads (Channidae) and giant
gouramies (Osphronemidae) along the river edges were damaged or washed off and the river deep pools
(fish dry-season refugia) were filled up by erosions, caused by hydropeaking (Baird and Meach 2005).
The situation reduces spawning success, rearing survival and growth rate. While research on the impacts
of hydropower-related pulsed flows on fish assemblages in the Mekong is still very limited, evidence
from e.g. North America and Europe (Hunter 1992, McLaughlin et al. 2006, Habit et al. 2007, Poff et
202

17
al. 2007, Clarke et al. 2008, Young et al. 2011, Schmutz et al. 2015) indicated that hydropower-related
pulsed flows promote strong temporal assemblage compositional changes and high species turnover.
Further, inconsistent with Tonkin’s et al framework, we found low species turnover in KT and
TS. As discussed succinctly earlier this is likely because the river section between these sites is still
free-flowing, and the riverine fishes that adapted to the system’s naturally seasonal-predictable flow
regimes have overlapping seasonal migration patterns and use the predictable-seasonal flow phenomena
as gauges for the timing of their migrations to successfully access critical habitats i.e. dry-season refugia
in KT (Mekong), spawning in KT, and rearing/feeding in TS (floodplains) (Valbo-Jorgensen and
Poulsen 2000, Bao et al. 2001, Poulsen et al. 2002, 2004, Baran 2006, Valbo-Jørgensen et al. 2009).
Moreover, in other river systems, riverine fishes are found to have homing behavior, and their
movements from hundred to thousand kilometers between critical habitats are associated with spawning
strategies e.g. Murray Darling golden perch (O’Connor et al. 2005), Murray cod (Koehn et al. 2009),
Amazonian giant catfish (Duponchelle et al. 2016), salmonids and a marine fish (weakfish) (Dittman
and Quinn 1996, Thorrold et al. 2001). The naturally adapted migration cycles of the riverine fishes in
KT and TS of the lower Mekong system may resemble such natal homing and site fidelity; and as such,
broadly similar seasonal assemblage composition with low species turnover are expected.
Besides, our results are partly in line with Tonkin’s et al seasonality and predictability
framework in that the disturbed site (SS) exhibited lowest levels of temporal changes in diversity
(abundance and richness) as compared to the predictably seasonal ones (KT, TS). We found that dams
modulated flows and weakened the flows’ seasonality and predictability strengths and thus muted
seasonal variations of fish abundance and richness in SS, whereas sites with more naturally predictable
flow conditions (KT, TS) promote reliable seasonal variations in fish abundance and richness with
regular-predictable peaks at semi-annual and annual frequencies (S7, Fig. 5, 6, 7, 8). As further
evidenced in the seasonal trait patterns, longitudinal migratory species colonized the mainstream
habitats (i.e. KT) during the dry season for refugia and spawning and dispersed to the lower floodplains
via TS for rearing and feeding during the wet season (Fig. 3b). Such reliable recurrence patterns of
hydrology and fish are indeed consistent with the existing knowledge about timing of fish migration,
fishing and local fisheries management practices in the lower Mekong system (Valbo-Jorgensen and
Poulsen 2000, Bao et al. 2001, Poulsen et al. 2002, 2004, Baird et al. 2003, FiA 2006, Halls et al. 2013).
When the river seasonal-predictable flows are modified as evidenced in SS, such reliably seasonal-
predictable events of fish assemblage no longer exist.
CONCLUSION
River flows structure riverine fishes that use seasonal-predictable hydrologic variations as
gauges for the timing of their migrations to successfully access critical habitats in the lower Mekong
system. We demonstrated that fish assemblages in highly regulated rivers were characterized by little
seasonal variations in fish abundance, richness and distinct seasonal assemblage composition with high
203
18
species turnover, whereas, assemblages in highly seasonal-predictable rivers were represented by
repeated seasonal-predictable peak abundance and richness at semi-annual and annual cycles, and more
similar seasonal assemblage composition with low species turnover. While partly in line with Tonkin’s
et al seasonality-predictability framework of highly seasonal-predictable environmental conditions
promoting the greatest temporal changes in diversity (abundance and richness), our results are overall
not consistent with Tonkin’s et al framework hypothesizing that predictably seasonal environmental
conditions promote the highest levels of temporal changes in assemblage composition with high species
turnover. We explained that, in aseasonal-unpredictable rivers, dams generate hydropower-related
pulsed flows i.e. hydropeaking which fragments habitats and alters fish assemblage composition and
diversity due to stranding, downstream displacement and creating false attraction flows that reduced
spawning and rearing success of fish. These resulted in strong temporal fish assemblage compositional
changes with high species turnover. While in highly seasonal-predictable system, riverine fishes have
overlapping seasonal migration patterns between critical habitats, and possibly have homing behavior
and site fidelity which likely constitutes more similar seasonal assemblage composition with low
species turnover. Our study also highlighted contrasted seasonal patterns in fish traits observed in the
three rivers, with the Mekong mainstream being important refugia and spawning habitats for
longitudinal migratory fishes during the dry season while the lower gradient river i.e. TS is their
important rearing and feeding habitats during the wet season. This study contributes to the
understanding of biological systems in the highly seasonal-predictable and aseasonal-unpredictable
environments of the lower Mekong system. It also provides knowledge about the downstream
ecological effects of and fish assemblage responses to hydropower-related pulsed flows. To date, dam
site selection (Ziv et al. 2012, Winemiller et al. 2016) and advanced fish passage facilities (Schmutz
and Mielach 2015) are among the important suggested measures to mitigate dam impacts. In addition,
flow designs that could minimize the effects of hydropower-related pulsed flows on aquatic organisms
i.e. mimic as far as possible natural seasonal hydrologic variations e.g. (Sabo et al. 2017) should be
privileged for the appropriate applications of mitigation measures of the ever-growing dam construction
in the Mekong.
ACKNOWLEDGEMENTS
We are grateful to the European Erasmus+ credit mobility and capacity building CONSEA Programs
for funding our study. Cordial thanks to the Fisheries Programme of the Mekong River Commission,
the Inland Fisheries Research and Development Institute and the Fisheries Administration, Cambodia
for making available the fish monitoring datasets used in this study. We would like to thank Nam So,
Solyda Putrea, Sokheng Chan and 9 fishers for supervising and implementing the field fish monitoring,
Kunthea Nuon for helping prepare the map for this study. EDB lab was supported by 'Investissement
d'Avenir' grants (CEBA, ref. ANR-10-LABX-0025; TULIP, ref. ANR-10-LABX-41).
204

19
LITERATURE CITED
Adamson, P. T., I. D. Rutherfurd, M. C. Peel, and I. A. Conlan. 2009. The Hydrology of the Mekong River. Pages 53–76in I. C. Campbell, editor.The Mekong Biophysical Environment of an International River Basin. 1st edition. Elsevier Inc., Amsterdam.
Agostinho, A. A., L. C. Gomes, S. Veríssimo, and E. K. Okada. 2004. Flood regime, dam regulation and fish in the Upper Paraná River: Effects on assemblage attributes, reproduction and recruitment. Reviews in Fish Biology and Fisheries 14:11–19.
Bainbridge, R. 1960. Speed and stamina in three fish. Journal of Experimental Biology 37:129–153.
Bainbridge, R. 1962. Training , speed and stamina in trout. Journal of Experimental Biology 39:537–555.
Baird, I., M. Baird, M. C. Chum, S. Kim, M. Nuon, S. Phat, B. N. Phouy, S. Prom, S. Ros, H. Rushton, and P. Sia. 2002. A Community-Based Study of the Downstream Impacts of the Yali Falls Dam Along the Se San, Sre Pok and Sekong Rivers in Stung Treng Province, Northeast Cambodia. Se San District Agriculture, Fisheries and Forestry Office, Stung Treng, Cambodia.
Baird, I. G., M. S. Flaherty, and B. Phylavanh. 2003. Rhythms of the river: lunar phases and migrations of small carps (Cyprinidae) in the Mekong River. Natural History Bulletin of the Siam Society 51:5–36.
Baird, I. G., and M. Meach. 2005. Sesan River Fisheries Monitoring in Ratanakiri Province, Northeast Cambodia: Before and After the Construction of the Yali Falls Dam in the Central Highlands of Viet Nam. 3S Rivers Protection Network and the Global Association for People and the Environment, Ban Lung, Ratanakiri, Cambodia.
Bao, T. Q., K. Bouakhamvongsa, S. Chan, K. Chhuon, T. Phommavong, A. F. Poulsen, P. Rukawoma, U. Suornratana, D. V. Tien, T. T. Tuan, N. T. Tung, J. Valbo-Jorgensen, S. Viravong, and N. Yoorong. 2001. Local knowledge in the study of river fish biology: experiences from the Mekong. Mekong River Commission, Phnom Penh.
Baran, E. 2005. Cambodia inland fisheries: facts, figures and context. WorldFish Center and Inland Fisheries Research and Development Institute, Phnom Penh, Cambodia.
Baran, E. 2006. Fish Migration Triggers and Cues in the Lower Mekong Basin and Other Freshwater Tropical Systems. Mekong River Commission, Vientiane.
Baran, E., N. So, P. Degen, X. Y. Chen, and P. Starr. 2013. Updated information on fish and fisheries in the Mekong Basin. Catch and Culture 19:24–25.
Baselga, A. 2010. Partitioning the turnover and nestedness components of beta diversity. Global Ecology and Biogeography 19:134–143.
Baselga, A., and C. D. L. Orme. 2012. betapart : an R package for the study of beta diversity. Methods in Ecology and Evolution 3:808–812.
Bejarano, M. D., R. Jansson, and C. Nilsson. 2017. The effects of hydropeaking on riverine plants: a review. Biological Reviews:1–16.
Bond, N. 2016. Hydrologic Indices for Daily Time Series Data. CRAN.R-project.org.
Borcard, D., F. Gillet, and P. Legendre. 2011. Numerical Ecology with R. Page (R. Gentleman, K. Hornik, and G. G. Parmigiani, Eds.). Springer Science, New York.
Chea, R., S. Lek, P. B. Ngor, and G. Grenouillet. 2016. Large-scale patterns of fish diversity and assemblage structure in the longest tropical river in Asia. Ecology of Freshwater Fish 2016:1–11.
Claasen, A. H. 2004. Abundance, distribution, and reproductive success of sandbar nesting birds below the Yali Falls hydropower dam on the Sesan River, northeastern Cambodia. WWF/Danida/WCS/BirdLife International, Phnom Penh.
Clarke, K. D., T. C. Pratt, R. G. Randall, A. Dave, and K. E. Smokorowski. 2008. Validation of the
205

20
flow management pathway: effects of altered flow on fish habitat and fishes downstream from a hydropower dam. Canadian Technical Report of Fisheries and Aquatic Sciences 2784, Canada.
Collier, M., R. H. Webb, and J. C. Schmidt. 1996. Dams and rivers: A Primer on the Downstream Effects of Dams. U.S. Geological Survey, Circular 1 1 2 6, Colorado.
Colwell, R. K. 1974. Predictability, constancy, and contingency of periodic phenomena. Ecology 55:1148–1153.
Davidson, P. J. 2006. The biodiversity of the Tonle Sap Biosphere Reserve: 2005 status review. UNDP-GEF funded Tonle Sap Conservation Project, Phnom Penh, Cambodia.
Dittman, A., and T. Quinn. 1996. Homing in Pacific salmon: mechanisms and ecological basis. The Journal of experimental biology 199:83–91.
Duponchelle, F., M. Pouilly, C. Pécheyran, M. Hauser, J. F. Renno, J. Panfili, A. M. Darnaude, A. García-Vasquez, F. Carvajal-Vallejos, C. García-Dávila, C. Doria, S. Bérail, A. Donard, F. Sondag, R. V. Santos, J. Nuñez, D. Point, M. Labonne, and E. Baras. 2016. Trans-Amazonian natal homing in giant catfish. Journal of Applied Ecology 53:1511–1520.
Fan, H., D. He, and H. Wang. 2015. Environmental consequences of damming the mainstream Lancang-Mekong River: A review. Earth-Science Reviews 146:77–91.
FiA. 2006. Law on Fisheries. Fisheries Administration, Ministry of Agriculture, Forestry and Fisheries, Phnom.
Fitzgerald, D. B., K. O. Winemiller, M. H. S. Pérez, and L. M. Sousa. 2017. Seasonal changes in the assembly mechanisms structuring tropical fish communities. Ecology 98:21–31.
Froese, R., and D. Pauly. 2017. FishBase. World Wide Web electronic publication. www.fishbase.org.
Graf, W. L. 2006. Downstream hydrologic and geomorphic effects of large dams on American rivers. Geomorphology 79:336–360.
Habit, E., M. C. Belk, and O. Parra. 2007. Response of the riverine fish community to the construction and operation of a diversion hydropower plant in central Chile. Aquatic Conservation: Marine and Freshwater Ecosystems 17:37–49.
Halls, A. S., B. R. Paxton, N. Hall, P. B. Ngor, S. Lieng, P. Ngor, and N. So. 2013. The Stationary Trawl (Dai) Fishery of the Tonle Sap-Great Lake System, Cambodia. Mekong River Commission, Phnom Penh.
Hirsch, P., and A. Wyatt. 2004. Negotiating local livelihoods: scales of conflict in the Se San River Basin. Asia Pacific Viewpoint 45:51–68.
Hunter, M. A. 1992. Hydropower flow fluctuations and salmonids: A review of the biological effects, mechanical causes, and options for mitigation. State of Washington Department of Fisheries, Washington.
Kassambara, A. 2017. Pratical guide to cluster analysis in R: unsupervised machine learning. STHDA, Poland.
Kennedy, T. A., J. D. Muehlbauer, C. B. Yackulic, D. A. Lytle, S. W. Miller, K. L. Dibble, E. W. Kortenhoeven, A. N. Metcalfe, and C. V Baxter. 2016. Flow Management for Hydropower Extirpates Aquatic Insects, Undermining River Food Webs. BioScience 66:562–575.
Koehn, J. D., J. A. McKenzie, D. J. O’Mahony, S. J. Nicol, J. P. O’Connor, and W. G. O’Connor. 2009. Movements of Murray cod (Maccullochella peelii peelii) in a large Australian lowland river. Ecology of Freshwater Fish 18:594–602.
Kottelat, M. 2013. The Fishes of the inland waters of Southeast Asia: A catalogue and core bibliography of the fishes known to occur in freshwaters, mangroves and estuaries. The Raffles Bulletin of Zoology 27:1–663.
Kummu, M., S. Tes, S. Yin, P. Adamson, J. Józsa, J. Koponen, J. Richey, and J. Sarkkula. 2014. Water
206

21
balance analysis for the Tonle Sap Lake-floodplain system. Hydrological Processes 28:1722–1733.
Latrubesse, E. M., E. Y. Arima, T. Dunne, E. Park, V. R. Baker, F. M. Horta, C. Wight, F. Wittmann, J. Zuanon, P. A. Baker, C. C. Ribas, R. B. Norgaard, and N. Filizola. 2017. Damming the rivers of the Amazon basin. Nature 546:363–369.
Legendre, P., and L. Legendre. 2012. Numerical Ecology. Third Engl. Elsevier Science B.V., Great Britain.
Mcintyre, P. B., M. O. Gessner, D. Dudgeon, A. Prusevich, P. Green, S. Glidden, S. E. Bunn, C. J. Vo, C. A. Sullivan, C. R. Liermann, and P. M. Davies. 2010. Global threats to human water security and river biodiversity. Nature 467:555–561.
McLaughlin, R. L., L. Porto, D. L. Noakes, J. R. Baylis, L. M. Carl, H. R. Dodd, J. D. Goldstein, D. B. Hayes, and R. G. Randall. 2006. Effects of low-head barriers on stream fishes: taxonomic affiliations and morphological correlates of sensitive species. Canadian Journal of Fisheries and Aquatic Sciences 63:766–779.
McMeans, B. C., K. S. McCann, M. Humphries, N. Rooney, and A. T. Fisk. 2015. Food Web Structure in Temporally-Forced Food Web Structure in Ecosystems. Trends in Ecology & Evolution 30:662–672.
Mcnamara, J. M., and A. I. Houston. 2008. Optimal annual routines : behaviour in the context of physiology and ecology. Philosophical Transactions of the Royal Society B 363:301–319.
Meile, T., J. L. Boillat, and A. J. Schleiss. 2010. Hydropeaking indicators for characterization of the Upper-Rhone River in Switzerland. Aquatic Sciences 73:171–182.
MFD. 2003. Mekong Fish Database: A taxonomic fish database for the Mekong Basin. Mekong River Commission, Phnom Penh.
MRC. 2003. State of the Basin Report 2003. Mekong River Commission, Phnom Penh.
MRC. 2005. Overview of the Hydrology of the Mekong Basin. Mekong River Commission, Vientiane.
MRC. 2007. Monitoring Fish Abundance and Diversity in the Lower Mekong Basin: Methodological Guidelines. Mekong River Commission, Phnom Penh.
Ngor, P. B., P. Legendre, T. Oberdorff, and S. Lek. 2018. Flow alterations by dams shaped fish assemblage dynamics in the complex Mekong-3S river system. Ecological Indicators 88:103–114.
O’Connor, J. P., D. J. O’Mahony, and J. M. O’Mahony. 2005. Movements of Macquaria ambigua, in the Murray River, south-eastern Australia. Journal of Fish Biology 66:392–403.
Piman, T., T. A. Cochrane, M. E. Arias, A. Green, and N. D. Dat. 2013. Assessment of Flow Changes from Hydropower Development and Operations in Sekong, Sesan, and Srepok Rivers of the Mekong Basin. Journal of Water Resources Planning and Management 139:723–732.
Poff, N. L., J. D. Olden, D. M. Merritt, and D. M. Pepin. 2007. Homogenization of regional river dynamics by dams and global biodiversity implications. Proceedings of the National Academy of Sciences of the United States of America 104:5732–5737.
Poulsen, A. F., K. G. Hortle, J. Valbo-Jorgensen, S. Chan, C. K. Chhuon, S. Viravong, K. Bouakhamvongsa, U. Suntornratana, N. Yoorong, N. T.T., and B. Q. Tran. 2004. Distribution and Ecology of Some Important Riverine Fish Species of the Mekong River Basin. Mekong River Commission, Phnom Penh.
Poulsen, A. F., P. Ouch, S. Viravong, U. Suntornratana, and T. T. Nguyen. 2002. Fish Migrations of the Lower Mekong Basin: Implications for Development, Planning and Environmental Management. Mekong River Commission, Phnom Penh.
R Core Team. 2015. R: A Language and Environment for Statistical Computing. R Foundation for Statistical Computing, Vienna, Austria.
207

22
Rainboth, W. J. 1996. Fishes of the Cambodian Mekong. Food and Agriculture Organisation of the United Nations, Rome.
Rainboth, W. J., C. Vidthayanon, and D. Y. Mai. 2012. Fishes of the Greater Mekong Ecosystem with Species List and Photoraphic Atlas. Museum of Zoology, University of Michigan, Ann Arbor.
Ratanakiri Fisheries Office. 2000. A Study of Downstream Impacts of the Yali Falls Dam in the Se San River Basin in Ratanakiri Province, Northeast Cambodia. The Fisheries Office, Ratanakiri Province in cooperation with the Non-Timber Forest Products (NTFP) Project, Ratanakiri Province, Cambodia.
Roesch, A., and H. Schmidbauer. 2014. WaveletComp: Computational Wavelet Analysis. R package version 1.0. CRAN.R-project.org.
Rutkow, E., C. Crider, and T. Giannin. 2005. Down River. The consequences of Vietnam’s Se San River dams on life in Cambodia and their meaning in International law. NGO Forum on Cambodia, Phnom Penh.
Sabo, J. L., A. Ruhi, G. W. Holtgrieve, V. Elliott, M. E. Arias, P. B. Ngor, T. A. Räsänen, and S. Nam. 2017. Designing river flows to improve food security futures in the Lower Mekong Basin. Science 358:1–11.
Schmutz, S., T. H. Bakken, T. Friedrich, T. Greimel, A. Harby, M. Jungwirth, A. Melcher, G. Unfer, and B. Zeiringer. 2015. Response of fish communities to hydrological and morphological alterations in hydropeaking rivers of Austria. River Research and Applications 31:919–930.
Schmutz, S., and C. Mielach. 2015. Review of existing research on fish passage through large dams and its applicability to Mekong mainstream dams. Mekong River Commission, Phnom Penh.
Shimadzu, H., M. Dornelas, P. A. Henderson, and A. E. Magurran. 2013. Diversity is maintained by seasonal variation in species abundance. BMC Biology 11:1–9.
Shumway, R. H., and D. S. Stoffer. 2011. Time series analysis and its applications: with R examples. Third Edit. Springer Science+Business Media, New York.
Sverdrup-Jensen, S. 2002. Fisheries in the Lower Mekong Basin: Status and Perspectives. Mekong River Commission, Phnom Penh.
Thorrold, S. R., C. Latkoczy, P. K. Swart, and C. M. Jones. 2001. Natal Homing in a Marine Fish Metapopulation. Science 291:297–299.
Tonkin, J. D., M. T. Bogan, N. Bonada, B. Ríos-Touma, and D. A. Lytle. 2017. Seasonality and predictability shape temporal species diversity. Ecology 0:1–16.
Tonolla, D., A. Bruder, and S. Schweizer. 2017. Evaluation of mitigation measures to reduce hydropeaking impacts on river ecosystems – a case study from the Swiss Alps. Science of the Total Environment 574:594–604.
Torrence, C., and G. P. Compo. 1998. A practical guide to wavelet analysis. Bulletin of the American Meteorological society 79:61–78.
Valbo-Jørgensen, J., D. Coates, and K. G. Hortle. 2009. Fish diversity in the Lower Mekong Basin. Pages 161 – 196in I. C. Campbell, editor.The Mekong Biophysical Environment of an International River Basin. 1st edition. Elsevier Inc., Amsterdam.
Valbo-Jorgensen, J., and A. F. Poulsen. 2000. Using local knowledge as a research tool in the study of river fish biology: Experiences from the Mekong. Environment, Development and Sustainability 2:253–276.
Winemiller, K., P. McIntyre, L. Castello, E. Fluet-Chouinard, T. Giarrizzo, N. So, I. Baird, W. Darwall, N. Lujan, I. Harrison, M. Stiassny, R. Silvano, D. Fitzgerald, F. Pelicice, A. Agostinho, L. Gomes, J. Albert, E. Baran, M. Petrere, C. Zarfl, M. Mulligan, J. Sullivan, C. Arantes, L. Sousa, A. Koning, D. Hoeinghaus, M. Sabaj, J. Lundberg, J. Armbruster, M. Thieme, P. Petry, J. Zuanon, G. Vilara, J. Snoeks, C. Ou, W. Rainboth, C. Pavanelli, A. Akama, A. van Soesbergen, and L. Saenz. 2016.
208

23
Balancing hydropower and biodiversity in the Amazon, Congo, and Mekong. Science 351:128–129.
Young, P. S., J. J. Cech, and L. C. Thompson. 2011. Hydropower-related pulsed-flow impacts on stream fishes: A brief review, conceptual model, knowledge gaps, and research needs. Reviews in Fish Biology and Fisheries 21:713–731.
Zarfl, C., A. E. Lumsdon, and K. Tockner. 2015. A global boom in hydropower dam construction. Aquatic Sciences 77:161–170.
Ziv, G., E. Baran, N. So, I. Rodriguez-Iturbe, and S. A. Levin. 2012. Trading-off fish biodiversity, food security, and hydropower in the Mekong River Basin. Proceedings of the National Academy of Sciences 109:5609–5614.
209

24
Supplementary Information (S)
Supplementary Information (S1): Timeline and cumulative installed gross storage capacity of
existing hydropower dams in the Sesan River Basin (Data source: MRC Hydropower Project Database,
2015). Note that Lower Sesan 2 dam has just recently been functioning since 2017.
0
500
1,000
1,500
2,000
2,500
3,000
3,500
4,000
4,500
5,000
1992
1993
1994
1995
1996
1997
1998
1999
2000
2001
2002
2003
2004
2005
2006
2007
2008
2009
2010
2011
2012
2013
2014
2015
2016
2017
O C
hum
2 Yal
i
Ses
an 3
Ses
an 3
A P
lei K
rong
Ses
an 4
Ses
an 4
A
Lower Sesan 2
210

25
Supplementary Information (S2): Seasonality and predictability strength of site hydrology for the
period 1965-1969 (pre-dam) and 2007-2014 (this study).
Overall, daily water level data are collected routinely in the Lower Mekong Basin, and can be
tracked back to around mid-1960s in some hydrological stations including our study sites i.e. the
Mekong River in Kratie (KT) and Tonle Sap River (TS) at Prek Kdam. However, during the period,
water level data are only partly available i.e. 1965-1969 and 1990s-present in Sesan River (SS). This is
likely due to the remoteness of the site and because the region was at war especially between 1970 and
1990. Given that hydropower dams in SS began in the early 1990s (see S1), daily water level data for
this river during the pre-dam are therefore only available between 1965 and 1969. For this reason, we
assume that daily water levels consistently available from the three study sites for the period between
January 1965 and December 1969 represent the baseline condition or what we refer to as the ‘natural
condition’ for the three rivers.
Colwell’s index and wavelet (see Method section in the manuscript for details) were used to
quantify the strength of seasonality and predictability of site hydrology between the baseline condition
(i.e. 1965-1969) and this study period (i.e. 2007-2014). Site average wavelet power (i.e. predictability
strength) between the two periods was extracted from the wavelet plots for comparison.
Colwell’s seasonality indices of site hydrology computed for the period 1965-1969 were: SS
(0.86), KT (0.94) and TS (0.94), and for this study period 2007-2014 were: SS (0.83), KT (0.90) and
TS (0.93). For the predictability strength of site hydrology for the two periods, see Figure S2.
Overall, there was little reduction in the seasonality index of site hydrology (i.e. 0.01-0.04)
between the two periods: 1965-1969 and 2007-2014. Noticeably, there was a strong reduction in the
predictability strength (~40%) of site hydrology at 52-week (annual) frequencies in SS (Figure S2).
Also, the second strong predictability strength of site hydrology that occurred at 26-week (semi-annual)
frequencies in 1965-1969 in SS had been muted for the period 2007-2014 due to hydrologic alterations.
Predictability strength of site hydrology for KT and TS were still comparable between the two periods.
It was highly likely that the change in the predictability strength in SS during the period 2007-2014
relative to its baseline condition (1965-1969) was due to upstream functioning dams of this river system
(See also S1, Piman et al. 2013, Ngor et al. 2018).
211

26
Figure S2: Average wavelet power on mean weekly water levels indicating changes in
the predictability strength of site hydrology between the two periods: 1965-1969 and
2007-2014. For site codes, see Figure 1.
212

27
Supplementary Information (S3): Seasonality partitioning: Dry season (June-November) and Wet
season (December-May). Data was based on mean 9-year daily water levels (red solid line) recorded at
Stung Treng Hydrological Station, when the Mekong River enters Cambodia.
Supplementary Information (S4): Boxplots summarizing (a) site weekly abundance; (b) site
weekly richness. Mean values among sites with a common letter are not significantly different at the
0.05 level (Pairwise Wilcoxon Rank Sum Tests). For site codes, see Figure 1.
0
2
4
6
8
10
12
1 1325 7 19311224 5 17291123 4 16281022 3 1527 8 20 3 1527 8 20 2 1426
Jun Jul Aug Sep Oct Nov Dec Jan Feb Mar Apr May
2007 20082009 20102011 20122013 2014
day
Wat
er L
evel
s (m
)
Wet season (W)
Dry season (D)
213

28
Supplementary Information (S5): Pie charts summarizing top 15 most abundant species (number
of individuals) in: (a) Sesan River (SS), (b) Mekong River in Kratie (KT) and (c) Tonle Sap River (TS).
For the list of fish species names, their abbreviations and traits by genera, families and orders, see S10.
In SS, of 15 top abundant species (S5a), seven species were small-sized (max. body size <=
25cm) and the rest was medium-sized species (max. body size: 26-60 cm). A small-sized floodplain
resident climbing perch, Anabas testudineus (Ates) ranked top (12%) in SS. Five dominant small-sized
species were recorded in this site i.e., Henicorhynchus lobatus (Hlob), H. siamensis (Hsia), Labiobarbus
siamensis (Lsia), Systomus rubripinnis (Srub), Osteochilus vittatus (Ovit).
In KT (S5b), of 15 top species, H. lobatus, H. siamensis, and L. siamensis were also among the
top dominant species; however, the site assemblage composition was also shared by six medium sized
species such as Puntioplites falcifer (Pfal), P. proctozysron (Ppro), Hypsibarbus malcolmi (Hmal),
Hemibagrus spilopterus (Hspi); two large-sized species (max. body size: 61-99 cm) i.e., Labeo
chrysophekadion (Lchr) and Helicophagus waandersii (Hwaa) and one giant-sized species (max. body
size: >100 cm), the croakers Boesemania microlepis (Bmic).
In TS (S5c), assemblage composition was dominantly represented by small-sized minnows and
carps, five of which i.e., Henicorhynchus lobatus (Hlob), Paralaubuca riveroi (Priv), Labiobarbus
siamensis (Lsia), Henicorhynchus siamensis (Hsia), Paralaubuca typus (Ptyp), accounted for up to
~85% of the total abundance.
214

29
Figure S5. Top 15 most abundant species in each study site. For site codes, see Figure 1.
215

30
Supplementary Information – S6: Means and standard errors of weekly abundance (number of
individuals) for 144 species (with mean value >=0.1). ‘–’ denotes that species did not occur at this site.
For the list of fish species names, their abbreviations and traits by genera, families and orders, see S10.
Code Scientific name SS KT TS
Hlob Henicorhynchus lobatus 24.1±2.8 19.3±5.3 1054.8±349.3 Priv Paralaubuca riveroi 3.6±0.6 0.7±0.3 658.6±235.5 Lsia Labiobarbus siamensis 7.7±1 3.3±0.9 333.4±138.1 Pmac Pangasius macronema 0.4±0.2 1.7±0.5 253.5±19.2 Hsia Henicorhynchus siamensis 8.1±1 6.2±3.4 181.3±82.1 Ptyp Paralaubuca typus 1.8±0.4 0.2±0.2 94±53.6 Pfal Puntioplites falcifer 7.9±0.6 14.2±1.5 39.3±5.5 Xcan Xenentodon cancila 0.1±0 0±0 31.2±12.3 Ates Anabas testudineus 26.3±5.1 0.1±0 0.2±0.1 Sste Scaphognathops stejnegeri 18.5±7.3 1.9±0.3 0±0 Pbar Paralaubuca barroni 5.2±1.4 0.6±0.6 6.9±4.7 Carm Cyclocheilichthys armatus 6±0.6 5.1±0.4 0.4±0.1 Srub Systomus rubripinnis 9.7±1 0.3±0.1 0.3±0.1 Bori Brachirus orientalis - 0.7±0.1 5.7±0.6 Pbul Puntioplites bulu 8.9±1.8 0.2±0.1 0.4±0.1 Pwol Parambassis wolffii - 5.8±0.5 0.4±0.1 Hlag Hypsibarbus lagleri 7.8±3.2 0.5±0.1 0.9±0.1 Hmal Hypsibarbus malcolmi 5.6±0.5 3.6±0.4 0±0 Rtor Rasbora tornieri 4.8±0.9 0±0 4.2±1.7 Ovit Osteochilus vittatus 8.3±0.8 0.3±0.1 0.3±0.1 Hpie Hypsibarbus pierrei 8±1 0.6±0.2 0±0 Hspi Hemibagrus spilopterus 1.9±0.2 2.7±0.3 3.9±0.6 Atru Amblyrhynchichthys truncatus 1.9±0.3 0.9±0.1 5.6±1 Plar Pangasius larnaudii 0±0 0.1±0 8±0.7 Ceno Cyclocheilichthys enoplos 0.1±0 1.8±0.5 5.6±0.6 Lchr Labeo chrysophekadion 0.1±0 3.8±0.3 3.3±0.3 Pfas Pristolepis fasciata 2.2±0.4 4.2±0.4 0.4±0.1 Hdis Hampala dispar 4.7±0.5 1.5±0.1 0.3±0.1 Cmic.2 Cynoglossus microlepis - 0.2±0 3.9±0.6 Bmic Boesemania microlepis - 2.6±0.4 1.4±0.3 Pdub Polynemus dubius - 0.4±0.1 3.6±0.8 Tthy Thynnichthys thynnoides 0±0 0.4±0.1 5.3±2.1 Bsch Barbonymus schwanenfeldii 3.7±0.3 1.7±0.2 0.2±0.1 Lble Luciosoma bleekeri 0.5±0.2 0.4±0.2 4.6±3 Pble Phalacronotus bleekeri 1.9±0.2 1.6±0.2 1.7±0.5 Ccar Cyprinus carpio - - 1.6±1 Hwaa Helicophagus waandersii 0.3±0.1 3.1±0.5 1.1±0.4 Mmys Mystus mysticetus 0±0 0.1±0 4.4±3.1 Ymod Yasuhikotakia modesta 0.1±0 0±0 4.2±1 Crep Cyclocheilichthys repasson 1.6±0.4 2.5±0.3 0±0 Mche Micronema cheveyi 0.6±0.2 0.4±0.1 3.1±1.9 Lcro Lycothrissa crocodilus 3.5±0.4 0.4±0 0.1±0
216

31
Nnot Notopterus notopterus 2.2±0.9 1±0.1 0.7±0.1 Bobs Bagrichthys obscurus 2.3±0.4 1.2±0.2 0.3±0.1 Psia.2 Pseudomystus siamensis 2.7±0.4 0.7±0.1 0.4±0.1 Cbat Clarias batrachus 3.2±0.6 0.1±0 0±0 Char Cosmochilus harmandi 0±0 2.3±0.2 1±0.1 Btru Belodontichthys truncatus 0.1±0 1.5±0.2 1.4±0.2 Cstr Channa striata 2±0.3 0.8±0.1 0.2±0 Hwet Hypsibarbus wetmorei 1.4±0.3 0.6±0.1 - Cmac Clarias macrocephalus 2.6±0.5 0.1±0 0.1±0.1 Ppro Puntioplites proctozysron 0.1±0 2.6±0.2 0.1±0.1 Gpen Gyrinocheilus pennocki 0.2±0.1 2.4±0.3 0.1±0 Aspp Acantopsis sp. 0.8±0.2 1.8±1.4 0±0 Dund Datnioides undecimradiatus - 0.8±0.1 - Mboc Mystus bocourti 0.1±0 0.8±0.2 1.5±0.3 Oexo Osphronemus exodon 0±0 2.3±0.4 0±0 Msin Mystus singaringan 0.1±0.1 0.1±0 2±0.4 Cbla Chitala blanci 0±0 2.1±0.2 0±0 Kcry Kryptopterus cryptopterus 0.9±0.5 0.5±0.3 - Marm Mastacembelus armatus 0.1±0 0.3±0 1.7±0.9 Pcon Pangasius conchophilus - 0.2±0 1.2±0.1 Csia Catlocarpio siamensis - 0±0 1.3±1.1 Pple Pseudolais pleurotaenia 0.7±0.2 0.2±0.1 1±0.1 Clag Cyclocheilichthys lagleri 1.5±0.3 0.3±0.1 0±0 Hsuv Hypsibarbus suvattii 1.7±0.3 0.1±0.1 0±0 Capo Cyclocheilichthys apogon 1.4±0.3 0.2±0.1 0±0 Bmaj Bagrichthys majusculus 0.9±0.2 0.6±0.1 0±0 Hmac Hampala macrolepidota 0.7±0.1 0.4±0.1 0.2±0 Lmel Lobocheilos melanotaenia 0.3±0.1 0.3±0.1 0.7±0.4 Clin Coilia lindmani - - 0.4±0.3 Omar Oxyeleotris marmorata 0.2±0.2 0.7±0.1 0.3±0.1 Phyp Pangasianodon hypophthalmus - 0.1±0 0.7±0.1 Balt Barbonymus altus 0.3±0.1 0.3±0.1 0.5±0.1 Shel Syncrossus helodes 0.1±0 0±0 1±0.5 Msia Macrognathus siamensis 0.5±0.1 - 0.2±0 Hwyc.1 Hemibagrus wyckioides 0±0 0.8±0.1 0.2±0 Omel Osteochilus melanopleurus 0±0 0.4±0.1 0.6±0.1 Bgon Barbonymus gonionotus 0.3±0.1 0.3±0.1 - Cgac Channa gachua 0.2±0.1 0±0 0.7±0.1 Hsto Hemiarius stormii - 0.4±0.1 0.2±0.1 Pboc Pangasius bocourti - 0±0 0.6±0.1 Pjul Probarbus jullieni 0±0 0.9±0.2 0±0 Tmic.1 Trichopodus microlepis 0.9±0.4 0±0 0±0 Ogor Osphronemus goramy 0.1±0 0.7±0.1 0±0 Ppol Pangasius polyuranodon 0±0 0.2±0 0.6±0.1 Sban Scaphognathops bandanensis 0.2±0.1 0.6±0.1 0±0 Clop Chitala lopis 0.5±0.3 0±0 - Cmic.1 Cirrhinus microlepis 0±0 0.2±0.1 0.5±0.1 Hfil Hemibagrus filamentus 0±0 0.7±0.1 0±0 Obim Ompok bimaculatus 0.4±0.1 0.2±0 0.1±0 Yeos Yasuhikotakia eos 0±0 0±0 0.7±0.1 Cjul Cirrhinus jullieni 0.5±0.1 0.1±0 0±0
217

32
Cmar Channa marulioides - 0.4±0.1 0±0 Lhoe Leptobarbus hoevenii - 0.2±0.1 0.2±0 Llon Laides longibarbis 0.3±0.1 0.1±0 - Plab Probarbus labeamajor - 0.4±0.1 0±0 Psia.1 Parambassis siamensis - 0±0 0.4±0.2 Ttri Trichopodus trichopterus 0.2±0.1 - - Aalb Albulichthys albuloides 0.1±0.1 0.3±0.1 0.1±0 Cmol Cirrhinus molitorella 0.3±0.1 0.1±0 0.1±0 Cmic Channa micropeltes - 0.3±0.1 0±0 Mmac Macrochirichthys macrochirus - 0.2±0 0.1±0 Raur Rasbora aurotaenia 0.3±0.2 0±0 - Corn Chitala ornata 0±0 0.2±0.1 0.2±0.1 Papo.1 Phalacronotus apogon 0±0 0.4±0.1 0±0 Pmic.1 Pseudolais micronemus 0±0 0.4±0.2 0±0 Rgut Raiamas guttatus 0.2±0.1 0.2±0 0±0 Amac Arius maculatus - 0.1±0 - Chet Cyclocheilichthys heteronema - - 0.1±0.1 Gfas Garra fasciacauda - 0.1±0.1 0.1±0 Gorn Gymnostomus ornatipinnis 0.2±0.2 0±0 - Hmek Hemisilurus mekongensis 0±0 0.2±0 0.1±0 Ibeh Incisilabeo behri 0.1±0 0.1±0 - Ldyo Labeo dyocheilus 0.1±0 0.2±0 0±0 Lgra Lobocheilos gracilis - 0.1±0 - Lhis Laocypris hispida 0.1±0.1 - - Lroh Labeo rohita - 0±0 0.2±0.1 Matr.1 Mystus atrifasciatus - 0.1±0 - Mery.1 Mekongina erythrospila 0±0 0.2±0.1 - Mwol Mystus wolffii 0.2±0.1 0±0 - Omic Osteochilus microcephalus 0.1±0.1 0.1±0 - Papo Parambassis apogonoides - 0.1±0 - Plab.1 Probarbus labeaminor 0±0 0.2±0 - Pmel Polynemus melanochir - 0±0 0.2±0 Pnas Pangasius nasutus 0.1±0.1 - - Tmic Toxotes microlepis - 0.1±0 0.1±0 Tpau Trigonopoma pauciperforatum 0.1±0.1 - - Tsin Tor sinensis - 0.1±0 0.1±0 Byar Bagarius yarrelli 0±0 0.2±0 0±0 Watt Wallago attu 0±0 0.1±0 0.1±0 Bhar Brachirus harmandi 0±0 0.1±0 - Bsuc Bagarius suchus 0±0 0.1±0 - Cfur Cyclocheilos furcatus 0±0 0.1±0 - Csin Clupisoma sinense 0.1±0.1 0±0 - Hwyc Hemibagrus wyckii - 0.1±0 0±0 Mcyp Megalops cyprinoides - 0.1±0 0±0 Mobt Mystacoleucus obtusirostris - 0.1±0.1 0±0 Owaa Osteochilus waandersii 0.1±0.1 0±0 - Pcam Pao cambodgiensis - 0.1±0 0±0 Phar Paralaubuca harmandi 0.1±0.1 0±0 - Rhob Rasbora hobelmani 0.1±0.1 0±0 - Tthi Tenualosa thibaudeaui - 0.1±0 0±0 Malb.1 Mystus albolineatus 0±0 0.1±0 0±0
218

33
Supplementary Information – S7: (a) Seasonal abundance and (b) richness. Red solid points
indicate the mean in each site. At x-axis, D = dry season and W = wet season. For seasonality
partitioning, see S3. Mean values among sites with a common letter are not significantly different at the
0.05 level (Pairwise Wilcoxon Rank Sum Tests).
219

34
Supplementary Information (S8): Trends in (a) weekly abundance and (b) richness against time.
For (a), significant declining trend is found in SS (p-value=0.03) and KT (p-value<0.0001) while no
significant change is dectected in TS (p-value=0.68). For (b), significant decreasing trends are exhibited
for all sites (p-value<0.0001). For site codes, see Figure 1.
220

35
Supplementary Information – S9: Cross-correlation plots of mean weekly water levels in KT
(second Y axis) and mean weekly water levels (Y) in TS. In the cross-correlations, the dotted
blue lines give the values beyond which the correlations are significantly different from zero.
X-axis is the time lags, set at 52 weeks (i.e. annual cycle). Data series on water levels used for
the cross-correlation plots, covering the period from 1 June 2007 to 31 May 2014. For site
codes, see Figure 1. The cross-correlation lag with the maximum coefficient between water
levels in KT and TS was estimated at -4 weeks.
221

36
Supplementary Information – S10: List of fish species names, their abbreviations and traits by genera, families and orders. Species names and traits are
compiled based on (Rainboth 1996, MFD 2003, Rainboth et al. 2012, Kottelat 2013, Froese and Pauly 2017, Ngor et al. 2018a, 2018b).
(1) Physcial habitat guilds include F1 (Rithron resident), F2 (Main channel resident), F3 (Main channel spawner), F4 (Floodplain spawner), F5
(Eurytopic/generalist), F6 (Floodplain resident), F7 (Estuarine resident), F8 (Anadromous), F9 (Catadromous) F10 (Marine visitor), F11 (Non-native);
(2) Migration guilds include White fishes = longitudinal migratory species between Mekong River, lower floodplains and major tributaries, Black fishes
= non-longitudinal migratory or floodplain residents, Grey fishes = lateral migration between floodplain and local rivers/streams; Estuarine fishes =
estuarine residents and marine visitors.
(3) Maximum total lengths include G (Giant >= 100 cm), L (Large, 61-99 cm), M (Medium, 26-60 cm), S (Small size <= 25 cm);
(4) Trophic levels include troph1 (trophic level <= 2.75), troph2 (trophic level, 2.76-3.75), troph3 (trophic level > 3.75) and
(5) Positions in the water column include benthopelagic, demersal, pelagic, pelagic-neritic, reef associated.
Code Scientific name Genus Family Order Physical habitat guild
Migration guild
Position in water column
Max. Total length (maxTL, cm)
Trophic level (TP)
maxTL Category TP Categetory
Chet Cyclocheilichthys heteronema Cyclocheilichthys Cyprinidae Cypriniformes F4 Grey benthopelagic 14.6 S 3.1 Troph2
Cjul Cirrhinus jullieni Cirrhinus Cyprinidae Cypriniformes F3 White benthopelagic 24.4 S 2.5 Troph1
Clac Corica laciniata Corica Clupeidae Clupeiformes F3 White pelagic 8.5 S 3.1 Troph2
Clag Cyclocheilichthys lagleri Cyclocheilichthys Cyprinidae Cypriniformes F4 Grey benthopelagic 18.3 S 3.4 Troph2
Clin Coilia lindmani Coilia Engraulidae Clupeiformes F7 Estuarine pelagic 24.4 S 3.7 Troph2
Clin.1 Cynoglossus lingua Cynoglossus Cynoglossidae Pleuronectiformes F10 White demersal 45 M 3.5 Troph2
Clon Clupisoma longianalis Clupisoma Schilbeidae Siluriformes F3 White demersal 16.2 S 3.3 Troph2
Clop Chitala lopis Chitala Notopteridae Osteoglossiformes F3 White demersal 183 L 4.5 Troph3
Cluc Channa lucius Channa Channidae Perciformes F6 Black benthopelagic 48.8 M 3.9 Troph3
Cmac Clarias macrocephalus Clarias Clariidae Siluriformes F6 Black benthopelagic 120 L 3.7 Troph2
Cmar Channa marulioides Channa Channidae Perciformes F6 Black benthopelagic 27 M NA NA
Cmar.1 Channa marulius Channa Channidae Perciformes F6 Black benthopelagic 183 L 4.5 Troph3
Cmel Channa melasoma Channa Channidae Perciformes F6 Black benthopelagic 36.6 M 4.2 Troph3
222

37
Cmel.1 Clarias meladerma Clarias Clariidae Siluriformes F6 Black demersal 42.7 M 3.5 Troph2
Cmic Channa micropeltes Channa Channidae Perciformes F6 Black benthopelagic 158.6 L 3.8 Troph3
Cmic.1 Cirrhinus microlepis Cirrhinus Cyprinidae Cypriniformes F3 White benthopelagic 79.3 L 2.4 Troph1
Cmic.2 Cynoglossus microlepis Cynoglossus Cynoglossidae Pleuronectiformes F10 White demersal 39.7 M 3.5 Troph2
Cmol Cirrhinus molitorella Cirrhinus Cyprinidae Cypriniformes F3 White benthopelagic 55 M 2 Troph1
Corn Chitala ornata Chitala Notopteridae Osteoglossiformes F5 White pelagic 122 L 3.7 Troph2
Cpun Cynoglossus puncticeps Cynoglossus Cynoglossidae Pleuronectiformes F10 White demersal 42.7 M 3.3 Troph2
Crep Cyclocheilichthys repasson Cyclocheilichthys Cyprinidae Cypriniformes F4 Grey benthopelagic 28 M 2.62 Troph1
Cret Crossocheilus reticulatus Crossocheilus Cyprinidae Cypriniformes F5 White benthopelagic 20.7 S 2.3 Troph1
Csia Catlocarpio siamensis Catlocarpio Cyprinidae Cypriniformes F2 White benthopelagic 300 L 2.9 Troph2
Csin Clupisoma sinense Clupisoma Schilbeidae Siluriformes F3 White demersal 37.8 M 3.4 Troph2
Cstr Channa striata Channa Channidae Perciformes F6 Black benthopelagic 122 L 3.4 Troph2
Ctal Congresox talabon Congresox Muraenesocidae Anguilliformes F10 Estuarine demersal 80 L 4 Troph3
Dalb Danio albolineatus Danio Cyprinidae Cypriniformes F4 Grey benthopelagic 7.9 S 3 Troph2
Dash Discherodontus ashmeadi Discherodontus Cyprinidae Cypriniformes F1 White benthopelagic 16.6 S 3.3 Troph2
Dflu Dichotomyctere fluviatilis Dichotomyctere Tetraodontidae Tetraodontiformes F7 Estuarine demersal 17 S 3.4 Troph2
Dlao Dasyatis laosensis Dasyatis Dasyatidae Myliobatiformes F3 White demersal 255.8 L 3.5 Troph2
Dlep Devario leptos Devario Cyprinidae Cypriniformes F1 White benthopelagic 6.3 S 3 Troph2
Dpol Datnioides polata Datnioides Datnioididae Perciformes F7 White benthopelagic 34.5 M 3.68 Troph2
Dund Datnioides undecimradiatus Datnioides Datnioididae Perciformes F3 White benthopelagic 48.8 M 3.6 Troph2
Emet Esomus metallicus Esomus Cyprinidae Cypriniformes F6 White benthopelagic 9.1 S 3 Troph2
Emic Eugnathogobius microps Eugnathogobius Gobiidae Perciformes F7 Estuarine demersal 2.7 S NA NA
Gaff Gambusia affinis Gambusia Poeciliidae Cyprinodontiformes F11 Black benthopelagic 5.1 S 3.22 Troph2
Gaym Gyrinocheilus aymonieri Gyrinocheilus Gyrinocheilidae Cypriniformes F3 White demersal 34.2 M 2.5 Troph1
Gfas Garra fasciacauda Garra Cyprinidae Cypriniformes F1 White benthopelagic 13.4 S 2.4 Troph1
Gfus Glyptothorax fuscus Glyptothorax Sisoridae Siluriformes F1 White demersal 14.8 S 3.2 Troph2
Ggiu Glossogobius giuris Glossogobius Gobiidae Perciformes F7 Estuarine benthopelagic 61 L 3.7 Troph2
Gorn Gymnostomus ornatipinnis Gymnostomus Cyprinidae Cypriniformes F5 White benthopelagic 10.9 S NA NA
Gpen Gyrinocheilus pennocki Gyrinocheilus Gyrinocheilidae Cypriniformes F3 White demersal 34.2 M 2.5 Troph1
Hdis Hampala dispar Hampala Cyprinidae Cypriniformes F5 White benthopelagic 42.7 M 3.7 Troph2
223
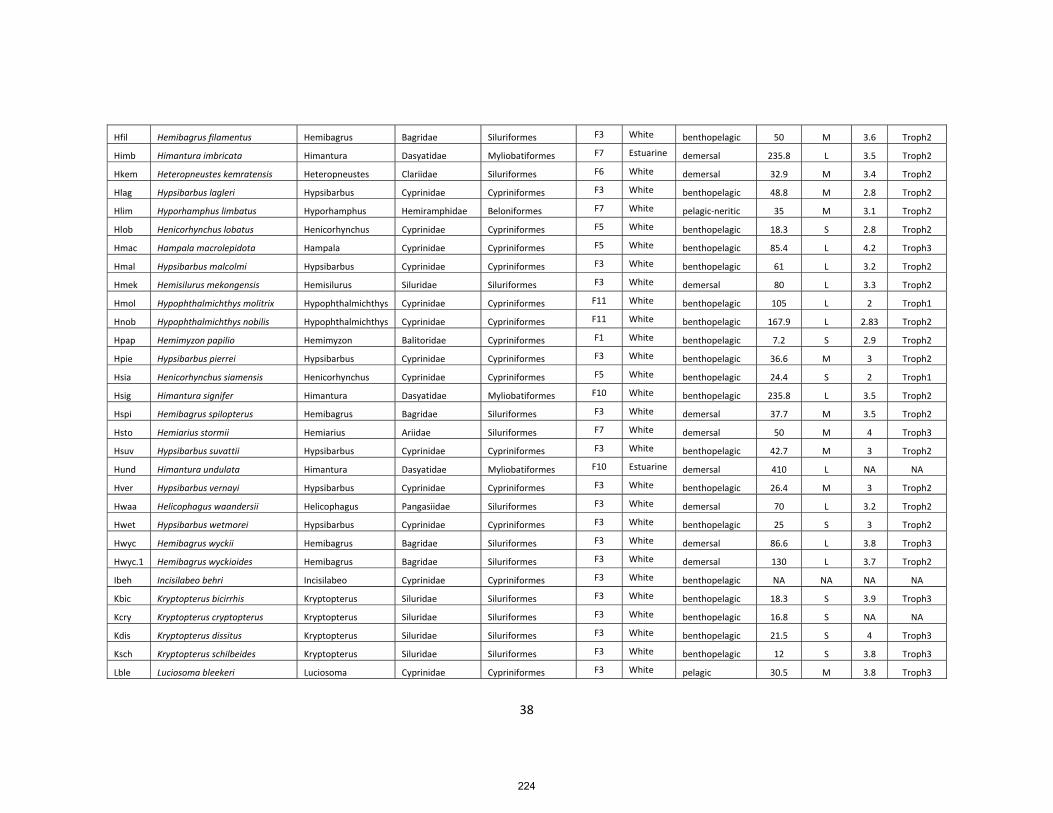
38
Hfil Hemibagrus filamentus Hemibagrus Bagridae Siluriformes F3 White benthopelagic 50 M 3.6 Troph2
Himb Himantura imbricata Himantura Dasyatidae Myliobatiformes F7 Estuarine demersal 235.8 L 3.5 Troph2
Hkem Heteropneustes kemratensis Heteropneustes Clariidae Siluriformes F6 White demersal 32.9 M 3.4 Troph2
Hlag Hypsibarbus lagleri Hypsibarbus Cyprinidae Cypriniformes F3 White benthopelagic 48.8 M 2.8 Troph2
Hlim Hyporhamphus limbatus Hyporhamphus Hemiramphidae Beloniformes F7 White pelagic‐neritic 35 M 3.1 Troph2
Hlob Henicorhynchus lobatus Henicorhynchus Cyprinidae Cypriniformes F5 White benthopelagic 18.3 S 2.8 Troph2
Hmac Hampala macrolepidota Hampala Cyprinidae Cypriniformes F5 White benthopelagic 85.4 L 4.2 Troph3
Hmal Hypsibarbus malcolmi Hypsibarbus Cyprinidae Cypriniformes F3 White benthopelagic 61 L 3.2 Troph2
Hmek Hemisilurus mekongensis Hemisilurus Siluridae Siluriformes F3 White demersal 80 L 3.3 Troph2
Hmol Hypophthalmichthys molitrix Hypophthalmichthys Cyprinidae Cypriniformes F11 White benthopelagic 105 L 2 Troph1
Hnob Hypophthalmichthys nobilis Hypophthalmichthys Cyprinidae Cypriniformes F11 White benthopelagic 167.9 L 2.83 Troph2
Hpap Hemimyzon papilio Hemimyzon Balitoridae Cypriniformes F1 White benthopelagic 7.2 S 2.9 Troph2
Hpie Hypsibarbus pierrei Hypsibarbus Cyprinidae Cypriniformes F3 White benthopelagic 36.6 M 3 Troph2
Hsia Henicorhynchus siamensis Henicorhynchus Cyprinidae Cypriniformes F5 White benthopelagic 24.4 S 2 Troph1
Hsig Himantura signifer Himantura Dasyatidae Myliobatiformes F10 White benthopelagic 235.8 L 3.5 Troph2
Hspi Hemibagrus spilopterus Hemibagrus Bagridae Siluriformes F3 White demersal 37.7 M 3.5 Troph2
Hsto Hemiarius stormii Hemiarius Ariidae Siluriformes F7 White demersal 50 M 4 Troph3
Hsuv Hypsibarbus suvattii Hypsibarbus Cyprinidae Cypriniformes F3 White benthopelagic 42.7 M 3 Troph2
Hund Himantura undulata Himantura Dasyatidae Myliobatiformes F10 Estuarine demersal 410 L NA NA
Hver Hypsibarbus vernayi Hypsibarbus Cyprinidae Cypriniformes F3 White benthopelagic 26.4 M 3 Troph2
Hwaa Helicophagus waandersii Helicophagus Pangasiidae Siluriformes F3 White demersal 70 L 3.2 Troph2
Hwet Hypsibarbus wetmorei Hypsibarbus Cyprinidae Cypriniformes F3 White benthopelagic 25 S 3 Troph2
Hwyc Hemibagrus wyckii Hemibagrus Bagridae Siluriformes F3 White demersal 86.6 L 3.8 Troph3
Hwyc.1 Hemibagrus wyckioides Hemibagrus Bagridae Siluriformes F3 White demersal 130 L 3.7 Troph2
Ibeh Incisilabeo behri Incisilabeo Cyprinidae Cypriniformes F3 White benthopelagic NA NA NA NA
Kbic Kryptopterus bicirrhis Kryptopterus Siluridae Siluriformes F3 White benthopelagic 18.3 S 3.9 Troph3
Kcry Kryptopterus cryptopterus Kryptopterus Siluridae Siluriformes F3 White benthopelagic 16.8 S NA NA
Kdis Kryptopterus dissitus Kryptopterus Siluridae Siluriformes F3 White benthopelagic 21.5 S 4 Troph3
Ksch Kryptopterus schilbeides Kryptopterus Siluridae Siluriformes F3 White benthopelagic 12 S 3.8 Troph3
Lble Luciosoma bleekeri Luciosoma Cyprinidae Cypriniformes F3 White pelagic 30.5 M 3.8 Troph3
224

39
Lchr Labeo chrysophekadion Labeo Cyprinidae Cypriniformes F3 White benthopelagic 90 L 2 Troph1
Lcro Lycothrissa crocodilus Lycothrissa Engraulidae Clupeiformes F7 White pelagic 36.6 M 3.7 Troph2
Ldyo Labeo dyocheilus Labeo Cyprinidae Cypriniformes F11 White benthopelagic 90 L 2 Troph1
Lgra Lobocheilos gracilis Lobocheilos Cyprinidae Cypriniformes F1 White demersal 24 S 2 Troph1
Lhis Laocypris hispida Laocypris Cyprinidae Cypriniformes F4 Grey benthopelagic 6.1 S NA NA
Lhoe Leptobarbus hoevenii Leptobarbus Cyprinidae Cypriniformes F4 Grey pelagic 122 L 2.8 Troph2
Llau Laubuka laubuca Laubuka Cyprinidae Cypriniformes F4 Grey pelagic 7 S 3.2 Troph2
Llin Labiobarbus lineatus Labiobarbus Cyprinidae Cypriniformes F5 White benthopelagic 15.5 S 2.5 Troph1
Llon Laides longibarbis Laides Schilbeidae Siluriformes F3 White demersal 17.3 S 3.9 Troph3
Lmel Lobocheilos melanotaenia Lobocheilos Cyprinidae Cypriniformes F1 White demersal 24.4 S 2 Troph1
Lroh Labeo rohita Labeo Cyprinidae Cypriniformes F11 White benthopelagic 200 L 2.2 Troph1
Lset Luciosoma setigerum Luciosoma Cyprinidae Cypriniformes F3 White pelagic 31.7 M 4.2 Troph3
Lsia Labiobarbus siamensis Labiobarbus Cyprinidae Cypriniformes F5 White benthopelagic 22 S 2.3 Troph1
Lstr Luciocyprinus striolatus Luciocyprinus Cyprinidae Cypriniformes F3 White benthopelagic 244 L 2.5 Troph1
Malb Monopterus albus Monopterus Synbranchidae Synbranchiformes F6 Black demersal 122 L 2.9 Troph2
Malb.1 Mystus albolineatus Mystus Bagridae Siluriformes F4 Grey demersal 42.7 M 3.7 Troph2
Mang Misgurnus anguillicaudatus Misgurnus Cobitidae Cypriniformes F11 White demersal 34.2 M 3.2 Troph2
Marg Monodactylus argenteus Monodactylus Monodactylidae Perciformes F10 Estuarine pelagic‐neritic 31.1 M 2.95 Troph2
Marm Mastacembelus armatus Mastacembelus Mastacembelidae Synbranchiformes F5 White demersal 35.5 M 2.8 Troph2
Matr Mystacoleucus atridorsalis Mystacoleucus Cyprinidae Cypriniformes F1 White benthopelagic 9.8 S 2.9 Troph2
Matr.1 Mystus atrifasciatus Mystus Bagridae Siluriformes F4 Grey demersal 18.3 S 3 Troph2
Mboc Mystus bocourti Mystus Bagridae Siluriformes F4 Grey demersal 29.3 M 3.5 Troph2
Mche Micronema cheveyi Micronema Siluridae Siluriformes F3 White benthopelagic 35 M 3.51 Troph2
Mchi Mystacoleucus chilopterus Mystacoleucus Cyprinidae Cypriniformes F1 White benthopelagic 11.1 S 2.9 Troph2
Mcir Macrognathus circumcinctus Macrognathus Mastacembelidae Synbranchiformes F6 White demersal 24.4 S 4 Troph3
Mcyp Megalops cyprinoides Megalops Megalopidae Elopiformes F10 Estuarine benthopelagic 150 L 3.5 Troph2
Mect Mystacoleucus ectypus Mystacoleucus Cyprinidae Cypriniformes F1 White benthopelagic 9.8 S 2.9 Troph2
Mery Mastacembelus erythrotaenia Mastacembelus Mastacembelidae Synbranchiformes F5 White demersal 100 L 2.7 Troph1
Mery.1 Mekongina erythrospila Mekongina Cyprinidae Cypriniformes F1 White benthopelagic 54.9 M 2 Troph1
Mgul Mystus gulio Mystus Bagridae Siluriformes F4 Grey demersal 46 M 4 Troph3
225

40
Mmac Macrochirichthys macrochirus Macrochirichthys Cyprinidae Cypriniformes F4 Grey benthopelagic 100 L 3.7 Troph2
Mmul Mystus multiradiatus Mystus Bagridae Siluriformes F4 Grey demersal 15.6 S 3.1 Troph2
Mmys Mystus mysticetus Mystus Bagridae Siluriformes F4 Grey demersal 15.9 S 3.1 Troph2
Mobt Mystacoleucus obtusirostris Mystacoleucus Cyprinidae Cypriniformes F1 White NA NA NA NA NA
Mrhe Mystus rhegma Mystus Bagridae Siluriformes F4 Grey demersal 14.6 S 3.5 Troph2
Msem Macrognathus semiocellatus Macrognathus Mastacembelidae Synbranchiformes F6 White benthopelagic 23.4 S 3.3 Troph2
Msia Macrognathus siamensis Macrognathus Mastacembelidae Synbranchiformes F6 White benthopelagic 36.6 M 3.3 Troph2
Msin Mystus singaringan Mystus Bagridae Siluriformes F4 Grey demersal 36.6 M 3.8 Troph3
Mwol Mystus wolffii Mystus Bagridae Siluriformes F4 Grey demersal 20 S 3.3 Troph2
Nbil Netuma bilineata Netuma Ariidae Siluriformes F7 Estuarine demersal 71.73 L 3.83 Troph3
Nbla Neolissochilus blanci Neolissochilus Cyprinidae Cypriniformes F1 White benthopelagic NA NA NA NA
Nneb Nandus nebulosus Nandus Nandidae Perciformes F7 White benthopelagic 12 S 3.3 Troph2
Nnen Nemapteryx nenga Nemapteryx Ariidae Siluriformes F7 White demersal 30 M NA NA
Nnot Notopterus notopterus Notopterus Notopteridae Osteoglossiformes F5 White demersal 73.2 L 3.6 Troph2
Ntha Netuma thalassina Netuma Ariidae Siluriformes F7 Estuarine demersal 185 L 3.49 Troph2
Obim Ompok bimaculatus Ompok Siluridae Siluriformes F4 Grey demersal 51.8 M 3.89 Troph3
Oexo Osphronemus exodon Osphronemus Osphronemidae Perciformes F1 Black pelagic 73.2 L 2.7 Troph1
Ofus Onychostoma fusiforme Onychostoma Cyprinidae Cypriniformes F1 White benthopelagic 28.1 M 2.7 Troph1
Oger Onychostoma gerlachi Onychostoma Cyprinidae Cypriniformes F1 White benthopelagic 38.6 M 2.7 Troph1
Ogor Osphronemus goramy Osphronemus Osphronemidae Perciformes F1 Black benthopelagic 85.4 L 2.8 Troph2
Ohyp Ompok hypophthalmus Ompok Siluridae Siluriformes F4 Grey demersal 36.6 M 3.9 Troph3
Aalb Albulichthys albuloides Albulichthys Cyprinidae Cypriniformes F3 White benthopelagic 36.6 M 2.8 Troph2
Adel Acanthopsoides delphax Acanthopsoides Cobitidae Cypriniformes F3 White demersal 7.3 S 3.5 Troph2
Agra Acanthopsoides gracilentus Acanthopsoides Cobitidae Cypriniformes F3 White demersal 7.3 S 3.5 Troph2
Akop Ambassis kopsii Ambassis Ambassidae Perciformes F7 Estuarine demersal 10.2 S 3 Troph2
Aleu Achiroides leucorhynchos Achiroides Soleidae Pleuronectiformes F7 White demersal 9.8 S 3.5 Troph2
Amac Arius maculatus Arius Ariidae Siluriformes F7 White demersal 80 L 3.4 Troph2
Amad Apocryptodon madurensis Apocryptodon Gobiidae Perciformes F7 Estuarine demersal 9 S 2 Troph1
Amar Anguilla marmorata Anguilla Anguillidae Anguilliformes F9 White demersal 200 L 3.8 Troph3
Amel Achiroides melanorhynchus Achiroides Soleidae Pleuronectiformes F7 White demersal 17.1 S 3.5 Troph2
226

41
Asid Ambastaia sidthimunki Ambastaia Cobitidae Cypriniformes F3 White demersal 6.7 S 2.9 Troph2
Aspp Acantopsis sp. Acantopsis Cobitidae Cypriniformes F3 White demersal NA NA 3.5 Troph2
Ates Anabas testudineus Anabas Anabantidae Perciformes F6 Black demersal 25 S 3 Troph2
Atru Amblyrhynchichthys truncatus Amblyrhynchichthys Cyprinidae Cypriniformes F3 White benthopelagic 48.8 M 2.4 Troph1
Aven Arius venosus Arius Ariidae Siluriformes F7 Estuarine demersal 30 M 4 Troph3
Balt Barbonymus altus Barbonymus Cyprinidae Cypriniformes F4 Grey benthopelagic 25 S 2.4 Troph1
Bbag Bagarius bagarius Bagarius Sisoridae Siluriformes F1 White benthopelagic 200 L 3.7 Troph2
Bbin Barbodes binotatus Barbodes Cyprinidae Cypriniformes F4 Grey benthopelagic 24.4 S 2.7 Troph1
Bbut Butis butis Butis Eleotridae Perciformes F7 Estuarine demersal 15 S 4 Troph3
Bele Bangana elegans Bangana Cyprinidae Cypriniformes F3 White benthopelagic 4.3 S 2.8 Troph2
Bgon Barbonymus gonionotus Barbonymus Cyprinidae Cypriniformes F5 White benthopelagic 40.5 M 2.4 Troph1
Bhar Brachirus harmandi Brachirus Soleidae Pleuronectiformes F5 White demersal 12.2 S 3.5 Troph2
Bkoi Butis koilomatodon Butis Eleotridae Perciformes F7 White demersal 10.7 S 4 Troph3
Blae Barbichthys laevis Barbichthys Cyprinidae Cypriniformes F3 White benthopelagic 36.6 M 2.7 Troph1
Bmaj Bagrichthys majusculus Bagrichthys Bagridae Siluriformes F3 White demersal NA NA NA NA
Bmic Boesemania microlepis Boesemania Sciaenidae Perciformes F4 Grey benthopelagic 122 L 3.7 Troph2
Bobs Bagrichthys obscurus Bagrichthys Bagridae Siluriformes F3 White demersal 30.4 M 3.4 Troph2
Bori Brachirus orientalis Brachirus Soleidae Pleuronectiformes F10 White demersal 36.6 M 3.5 Troph2
Bpan Brachirus panoides Brachirus Soleidae Pleuronectiformes F7 White demersal 20 S 3.5 Troph2
Brho Barbodes rhombeus Barbodes Cyprinidae Cypriniformes F4 Grey benthopelagic 7.9 S 2.9 Troph2
Bsch Barbonymus schwanenfeldii Barbonymus Cyprinidae Cypriniformes F4 Grey benthopelagic 42.7 M 2.3 Troph1
Bsp. Bangana sp. Bangana Cyprinidae Cypriniformes F3 White NA NA NA NA NA
Bsuc Bagarius suchus Bagarius Sisoridae Siluriformes F1 White demersal 85.4 L 3.3 Troph2
Btru Belodontichthys truncatus Belodontichthys Siluridae Siluriformes F3 White demersal 73.2 L 4.1 Troph3
Byar Bagarius yarrelli Bagarius Sisoridae Siluriformes F1 White demersal 244 L 3.7 Troph2
Byun Bangana yunnanensis Bangana Cyprinidae Cypriniformes F3 White benthopelagic 30.9 M 2.2 Troph1
Caes Clupeichthys aesarnensis Clupeichthys Clupeidae Clupeiformes F3 White pelagic 8.5 S 2.9 Troph2
Capo Cyclocheilichthys apogon Cyclocheilichthys Cyprinidae Cypriniformes F4 Grey benthopelagic 25 S 2.9 Troph2
Carm Cyclocheilichthys armatus Cyclocheilichthys Cyprinidae Cypriniformes F4 Grey benthopelagic 26.5 M 3.38 Troph2
Catr Crossocheilus atrilimes Crossocheilus Cyprinidae Cypriniformes F5 White benthopelagic 8.9 S 2.5 Troph1
227

42
Cbat Clarias batrachus Clarias Clariidae Siluriformes F6 Black demersal 47 M 3.4 Troph2
Cbil Cynoglossus bilineatus Cynoglossus Cynoglossidae Pleuronectiformes F10 White demersal 44 M 3.5 Troph2
Cbla Chitala blanci Chitala Notopteridae Osteoglossiformes F1 White demersal 146.4 L 3.7 Troph2
Ccar Cyprinus carpio Cyprinus Cyprinidae Cypriniformes F11 White benthopelagic 120 L 3.4 Troph2
Ccat Clarias cataractus Clarias Clariidae Siluriformes F6 White demersal NA NA NA NA
Ccir Cirrhinus cirrhosus Cirrhinus Cyprinidae Cypriniformes F11 White benthopelagic 122 L 2.4 Troph1
Ceno Cyclocheilichthys enoplos Cyclocheilichthys Cyprinidae Cypriniformes F2 White benthopelagic 90.3 L 3.2 Troph2
Cfel Cynoglossus feldmanni Cynoglossus Cynoglossidae Pleuronectiformes F10 White demersal 30.5 M 3.5 Troph2
Cfur Cyclocheilos furcatus Cyclocheilos Cyprinidae Cypriniformes F2 White benthopelagic NA NA NA NA
Cgac Channa gachua Channa Channidae Perciformes F1 Black benthopelagic 24.4 S 3.8 Troph3
Cgar Clarias gariepinus Clarias Clariidae Siluriformes F11 Black benthopelagic 170 L 3.8 Troph3
Char Cosmochilus harmandi Cosmochilus Cyprinidae Cypriniformes F2 White benthopelagic 100 L 2 Troph1
Olin Osteochilus lini Osteochilus Cyprinidae Cypriniformes F5 White benthopelagic 18.3 S 2 Troph1
Omar Oxyeleotris marmorata Oxyeleotris Eleotridae Perciformes F5 White demersal 79.3 L 3.9 Troph3
Omel Osteochilus melanopleurus Osteochilus Cyprinidae Cypriniformes F3 White benthopelagic 73.2 L 2.3 Troph1
Omic Osteochilus microcephalus Osteochilus Cyprinidae Cypriniformes F5 White benthopelagic 29.3 M 2 Troph1
Osch Osteochilus schlegeli Osteochilus Cyprinidae Cypriniformes F4 Grey benthopelagic 46 M 2 Troph1
Ovit Osteochilus vittatus Osteochilus Cyprinidae Cypriniformes F5 White benthopelagic 39 M 2 Troph1
Owaa Osteochilus waandersii Osteochilus Cyprinidae Cypriniformes F1 White benthopelagic 25 S 2 Troph1
Pabe Pao abei Pao Tetraodontidae Tetraodontiformes F3 Estuarine demersal 12.6 S 3.3 Troph2
Papo Parambassis apogonoides Parambassis Ambassidae Perciformes F4 Grey demersal 12.2 S 2.9 Troph2
Papo.1 Phalacronotus apogon Phalacronotus Siluridae Siluriformes F3 White benthopelagic 158.6 L 4.5 Troph3
Parg Plicofollis argyropleuron Plicofollis Ariidae Siluriformes F7 White demersal 50 M 2.75 Troph1
Pbai Pao baileyi Pao Tetraodontidae Tetraodontiformes F1 Estuarine demersal 14.6 S 3.3 Troph2
Pbar Paralaubuca barroni Paralaubuca Cyprinidae Cypriniformes F4 Grey benthopelagic 18.3 S 3.3 Troph2
Pble Phalacronotus bleekeri Phalacronotus Siluridae Siluriformes F3 White demersal 73.2 L 4.5 Troph3
Pboc Pangasius bocourti Pangasius Pangasiidae Siluriformes F2 White benthopelagic 146.4 L 3.2 Troph2
Pbra Piaractus brachypomus Piaractus Serrasalmidae Characiformes F11 Black pelagic 88 L 2.52 Troph1
Pbre Puntius brevis Puntius Cyprinidae Cypriniformes F6 White benthopelagic 14.6 S 2.9 Troph2
Pbul Puntioplites bulu Puntioplites Cyprinidae Cypriniformes F3 White benthopelagic 35 M 2.4 Troph1
228

43
Pcam Pao cambodgiensis Pao Tetraodontidae Tetraodontiformes F4 Grey demersal 18.7 S 3.3 Troph2
Pcan Plotosus canius Plotosus Plotosidae Siluriformes F7 Estuarine demersal 150 L 3.9 Troph3
Pcon Pangasius conchophilus Pangasius Pangasiidae Siluriformes F2 White benthopelagic 146.4 L 2.7 Troph1
Pdea Poropuntius deauratus Poropuntius Cyprinidae Cypriniformes F1 White benthopelagic 21.6 S 3.2 Troph2
Pdja Pangasius djambal Pangasius Pangasiidae Siluriformes F2 White benthopelagic 115.2 L 2.8 Troph2
Pdub Polynemus dubius Polynemus Polynemidae Perciformes F7 White demersal 24.4 S 3.7 Troph2
Pfal Puntioplites falcifer Puntioplites Cyprinidae Cypriniformes F3 White benthopelagic 38.3 M 2.6 Troph1
Pfas Pristolepis fasciata Pristolepis Pristolepididae Perciformes F4 Grey demersal 20 S 3.2 Troph2
Pgig Pangasianodon gigas Pangasianodon Pangasiidae Siluriformes F2 White benthopelagic 300 L 2.3 Troph1
Phar Paralaubuca harmandi Paralaubuca Cyprinidae Cypriniformes F4 Grey benthopelagic 26.7 M 3.3 Troph2
Phyp Pangasianodon hypophthalmus Pangasianodon Pangasiidae Siluriformes F2 White benthopelagic 158.6 L 3.1 Troph2
Pjul Probarbus jullieni Probarbus Cyprinidae Cypriniformes F2 White demersal 183 L 3.2 Troph2
Pkre Pangasius krempfi Pangasius Pangasiidae Siluriformes F8 White benthopelagic 146.4 L 2 Troph1
Pkun Pangasius kunyit Pangasius Pangasiidae Siluriformes F7 White benthopelagic 85.6 L 2.8 Troph2
Plab Probarbus labeamajor Probarbus Cyprinidae Cypriniformes F2 White benthopelagic 183 L 2.5 Troph1
Plab.1 Probarbus labeaminor Probarbus Cyprinidae Cypriniformes F2 White benthopelagic 150 L 2.5 Troph1
Plar Pangasius larnaudii Pangasius Pangasiidae Siluriformes F2 White benthopelagic 158.6 L 3.3 Troph2
Plei Pao leiurus Pao Tetraodontidae Tetraodontiformes F7 Estuarine demersal 16.4 S 3 Troph2
Pmac Pangasius macronema Pangasius Pangasiidae Siluriformes F3 White benthopelagic 36.6 M 3.2 Troph2
Pmel Polynemus melanochir Polynemus Polynemidae Perciformes F7 White demersal 30.5 M 3.5 Troph2
Pmic Phalacronotus micronemus Phalacronotus Siluridae Siluriformes F3 White benthopelagic 61 L 4 Troph3
Pmic.1 Pseudolais micronemus Pseudolais Pangasiidae Siluriformes F3 White benthopelagic 42.7 M 2.7 Troph1
Pnas Pangasius nasutus Pangasius Pangasiidae Siluriformes F2 White benthopelagic 90 L 2.8 Troph2
Ppar Puntigurus partipentazona Puntigurus Cyprinidae Cypriniformes F4 Grey benthopelagic 4.6 S 2.87 Troph2
Pple Pseudolais pleurotaenia Pseudolais Pangasiidae Siluriformes F3 White benthopelagic 42.7 M 2.4 Troph1
Ppol Pangasius polyuranodon Pangasius Pangasiidae Siluriformes F5 White benthopelagic 97.6 L 2.8 Troph2
Ppro Puntioplites proctozysron Puntioplites Cyprinidae Cypriniformes F3 White benthopelagic 30 M 2.7 Troph1
Priv Paralaubuca riveroi Paralaubuca Cyprinidae Cypriniformes F4 Grey benthopelagic 22 S 3.3 Troph2
Psia Parachela siamensis Parachela Cyprinidae Cypriniformes F4 Grey pelagic 18.3 S 3.4 Troph2
Psia.1 Parambassis siamensis Parambassis Ambassidae Perciformes F5 White demersal 7.3 S 3.3 Troph2
229

44
Psia.2 Pseudomystus siamensis Pseudomystus Bagridae Siluriformes F3 White demersal 18.3 S 3.3 Troph2
Psp. Pangasius sp. Pangasius Pangasiidae Siluriformes F2 White benthopelagic NA NA NA NA
Pste Pseudomystus stenomus Pseudomystus Bagridae Siluriformes F3 White demersal 12 S 3.2 Troph2
Ptyp Paralaubuca typus Paralaubuca Cyprinidae Cypriniformes F4 Grey benthopelagic 22 S 3.3 Troph2
Pwaa Puntioplites waandersi Puntioplites Cyprinidae Cypriniformes F3 White demersal 50 M 2.4 Troph1
Pwol Parambassis wolffii Parambassis Ambassidae Perciformes F4 Grey demersal 24.4 S 3.7 Troph2
Raur Rasbora aurotaenia Rasbora Cyprinidae Cypriniformes F4 Grey benthopelagic 18.3 S 2.6 Troph1
Rbor Rasbora borapetensis Rasbora Cyprinidae Cypriniformes F4 Grey benthopelagic 7.3 S 3.3 Troph2
Rdan Rasbora daniconius Rasbora Cyprinidae Cypriniformes F4 Grey benthopelagic 15 S 3.1 Troph2
Rgut Raiamas guttatus Raiamas Cyprinidae Cypriniformes F1 White benthopelagic 36.6 M 3.9 Troph3
Rhob Rasbora hobelmani Rasbora Cyprinidae Cypriniformes F4 Grey benthopelagic 7.3 S 3.2 Troph2
Rmye Rasbora myersi Rasbora Cyprinidae Cypriniformes F4 Grey benthopelagic 8.4 S NA NA
Rtor Rasbora tornieri Rasbora Cyprinidae Cypriniformes F4 Grey benthopelagic 20.7 S 3.2 Troph2
Rtri Rasbora trilineata Rasbora Cyprinidae Cypriniformes F4 Grey benthopelagic 13 S 3.3 Troph2
Sarg Scatophagus argus Scatophagus Scatophagidae Perciformes F7 White reef‐associated 38 M 3 Troph2
Sban Scaphognathops bandanensis Scaphognathops Cyprinidae Cypriniformes F3 White benthopelagic 48.8 M 2.4 Troph1
Sbea Syncrossus beauforti Syncrossus Cobitidae Cypriniformes F3 White demersal 30.5 M 3.5 Troph2
Shel Syncrossus helodes Syncrossus Cobitidae Cypriniformes F3 White demersal 36.6 M 3.3 Troph2
Slan Schizothorax lantsangensis Schizothorax Cyprinidae Cypriniformes F1 White benthopelagic 37.9 M 2.3 Troph1
Srub Systomus rubripinnis Systomus Cyprinidae Cypriniformes F5 White benthopelagic 30.5 M 2.9 Troph2
Sste Scaphognathops stejnegeri Scaphognathops Cyprinidae Cypriniformes F3 White benthopelagic 30.5 M 2.6 Troph1
Tate Tor ater Tor Cyprinidae Cypriniformes F1 White pelagic 40.5 M 2.9 Troph2
Tcha Toxotes chatareus Toxotes Toxotidae Perciformes F7 White pelagic 48.8 M 4 Troph3
Tlat Tor laterivittatus Tor Cyprinidae Cypriniformes F1 White benthopelagic 73.2 L 2.9 Troph2
Tmic Toxotes microlepis Toxotes Toxotidae Perciformes F7 White pelagic 18.3 S 3.2 Troph2
Tmic.1 Trichopodus microlepis Trichopodus Osphronemidae Perciformes F6 Black demersal 15.9 S 3.4 Troph2
Tpau Trigonopoma pauciperforatum Trigonopoma Cyprinidae Cypriniformes F4 Grey benthopelagic 7 S 3.3 Troph2
Tpec Trichopodus pectoralis Trichopodus Osphronemidae Perciformes F6 Black benthopelagic 25 S 2.8 Troph2
Tsin Tor sinensis Tor Cyprinidae Cypriniformes F1 White benthopelagic 56.7 M 3.3 Troph2
Ttam Tor tambroides Tor Cyprinidae Cypriniformes F1 White benthopelagic 122 L 2 Troph1
230

45
Tthi Tenualosa thibaudeaui Tenualosa Clupeidae Clupeiformes F3 White pelagic 36.6 M 2 Troph1
Tthy Thynnichthys thynnoides Thynnichthys Cyprinidae Cypriniformes F4 Grey benthopelagic 25 S 2.3 Troph1
Ttol Tenualosa toli Tenualosa Clupeidae Clupeiformes F10 White pelagic‐neritic 60 M 2.48 Troph1
Ttri Trichopodus trichopterus Trichopodus Osphronemidae Perciformes F6 Black benthopelagic 18.3 S 2.7 Troph1
Watt Wallago attu Wallago Siluridae Siluriformes F3 White demersal 240 L 3.7 Troph2
Wlee Wallago leerii Wallago Siluridae Siluriformes F11 White demersal 150 L 4.5 Troph3
Xcan Xenentodon cancila Xenentodon Belonidae Beloniformes F5 White pelagic‐neritic 40 M 3.9 Troph3
Ycau Yasuhikotakia caudipunctata Yasuhikotakia Cobitidae Cypriniformes F3 White demersal 11 S 3.4 Troph2
Yeos Yasuhikotakia eos Yasuhikotakia Cobitidae Cypriniformes F3 White demersal 11 S 3.5 Troph2
Ylec Yasuhikotakia lecontei Yasuhikotakia Cobitidae Cypriniformes F3 White demersal 18.3 S 3.4 Troph2
Ylon Yasuhikotakia longidorsalis Yasuhikotakia Cobitidae Cypriniformes F3 White demersal 9.8 S 3.4 Troph2
Ymod Yasuhikotakia modesta Yasuhikotakia Cobitidae Cypriniformes F3 White demersal 30.5 M 3.4 Troph2
Yspl Yasuhikotakia splendida Yasuhikotakia Cobitidae Cypriniformes F3 White demersal 12.2 S 3.5 Troph2
231

46
Literature Cited
Froese, R., and D. Pauly. 2017. FishBase. www.fishbase.org.
Kottelat, M. 2013. The Fishes of the inland waters of Southeast Asia: A catalogue and core bibliography of the fishes known to occur in freshwaters, mangroves and estuaries. The Raffles Bulletin of Zoology 27:1–663.
MFD. 2003. Mekong Fish Database: A taxonomic fish database for the Mekong Basin. Mekong River Commission, Phnom Penh.
Ngor, P. B., G. Grenouillet, S. Phem, N. So, and S. Lek. 2018a. Spatial and temporal variation in fish community structure and diversity in the largest tropical flood-pulse system of Southeast Asia. Ecology of Freshwater Fish In press.
Ngor, P. B., P. Legendre, T. Oberdorff, and S. Lek. 2018b. Flow alterations by dams shaped fish assemblage dynamics in the complex Mekong-3S river system. Ecological Indicators 88:103–114.
Piman, T., T. A. Cochrane, M. E. Arias, A. Green, and N. D. Dat. 2013. Assessment of Flow Changes from Hydropower Development and Operations in Sekong, Sesan, and Srepok Rivers of the Mekong Basin. Journal of Water Resources Planning and Management 139:723–732.
Rainboth, W. J. 1996. Fishes of the Cambodian Mekong. Food and Agriculture Organisation of the United Nations, Rome.
Rainboth, W. J., C. Vidthayanon, and D. Y. Mai. 2012. Fishes of the Greater Mekong Ecosystem with Species List and Photoraphic Atlas. Museum of Zoology, University of Michigan, Ann Arbor.
232


233


Fish assemblages dynamic in the tropical flood-pulse system of the
Lower Mekong River Basin
The Mekong seasonal flow plays a pivotal role in structuring up- and downstream aquatic communities.
The thesis investigates the dynamics of spatial and temporal fish community structure in the Lower Mekong
system, i.e. the Lower Mekong River and its major tributaries. Using spatial and time-series datasets and
univariate as well as multivariate statistical approaches, the thesis highlights:
The importance of flow and other environmental factors in explaining spatial and temporal
dynamics of fish diversity patterns and assemblage structure in the Lower Mekong system.
The effects of indiscriminate fishing in one of the world’s largest tropical inland fisheries, the Tonle
Sap, with the finding of, despite overall stationary catch per unit effort (CPUE), strong alterations
in assemblages composition, with decreasing trends in catches of large-sized species, and
increasing trends in the catches of some small-sized species.
Contrasted responses of fish assemblages to a gradient of disruption of flow seasonality and
predictability due to dams in the Lower Mekong system.
The results obtained through this thesis contribute to the ecological understanding of fish assemblages and
to the design of applications for long-term planning, monitoring, management and conservation of fisheries
in the Mekong Basin and beyond. The thesis suggests that:
Maintaining the Mekong robust and predictably seasonal flood pulse dynamics and habitat
connectivity is imperative to ensure fish longitudinal and lateral dispersal ability among critical
habitats for breeding, feeding and seeking refuge.
Setting appropriate regulations based on known peak fish migrations at various spatiotemporal
scales would allow migratory fish species to pass through rivers, access critical habitats and
complete their life cycles. Also, enforcing and operationalizing the existing formal fisheries
management mechanisms effectively at local, national and regional levels as well as allocating
sufficient resources to the fishery sector to combat illegal fishing practices and implementing
fisheries conservation measures in critical habitats would help deal with the problem of
overharvesting.
Hydropower-related pulsed flows that can mimic as far as possible the natural pulsed flows are
critical to reduce downstream effects on aquatic organisms, and, thus, should be prioritized and
applied as one of the measures to mitigate the impacts from existing and planned hydropower dams
in the Mekong Basin.
Keywords: Fish assemblage richness and composition, assemblages turnover, environmental filtering, flow
seasonality and predictability, fisheries effects, hydropower dams, Mekong Basin, Asia.

AUTEUR : Peng Bun NGOR
TITRE : Dynamique des peuplements de poissons dans le bassin inférieur du Mékong
DIRECTEUR DE THÈSE : Sovan LEK
LIEU ET DATE DE SOUTENANCE : Université Paul Sabatier, le 10 avril 2018
Le débit saisonnier du Mékong joue un rôle central dans la structuration amont/aval des communautés aquatiques. Cette étude examine les dynamiques de la structure spatiale et temporelle des communautés de poissons dans le bassin inférieur du Mékong, comprenant le Mékong aval et ses principaux affluents. L’application de méthodes statistiques univariées et multivariées, sur des bases de données spatiales et temporelles piscicoles et environnementales, met en évidence :
Le rôle prépondérant des débits dans l’explication de la dynamique spatiale et temporelle despatrons de diversité et de structure des assemblages piscicoles dans la bassin aval du Mékong.
Les effets de la pêche non sélective dans l’un des plus grands systèmes de production halieutiquetropicale au monde, le lac le Tonlé Sap, avec la mise en évidence d’une production globalementdurable marquée néanmoins par une composition altérée des communautés de poissons.
Les réponses des assemblages de poissons face aux fluctuations saisonnières et à la stabilité desdébits dans les rivières non régulées et régulées du bas Mékong.
Les résultats obtenus lors de cette thèse contribuent à la connaissance du fonctionnement des peuplements piscicoles et apportent une aide à la conception de plans de gestion et de conservation des ressources halieutiques et des autres ressources aquatiques dans le bassin du Mékong et au-delà. Cette étude suggère que :
Le maintien de la dynamique saisonnière des débits et de la connectivité des habitats est impératifafin d’assurer la dispersion longitudinale et latérale des poissons vers des habitats vitaux pour leurreproduction, leur alimentation et leur protection.
L’établissement d’une réglementation appropriée basée sur la connaissance des pics migratoires depoissons aux différentes échelles spatio-temporelles permettrait aux poissons migrateurs defranchir les rivières pour accéder à leurs habitats nécessaires à l’accomplissement de leur cycle devie. Aussi, faire respecter et opérationnaliser de façon efficace les mécanismes officiels de gestionhalieutique aux échelles locales, nationales et régionales, mais aussi allouer suffisamment demoyens pour le secteur de la pêche afin de lutter contre les pratiques de pêche illégale et pour lamise en œuvre de mesures de conservation contribuerait à résoudre les problèmes de surexploitationdes ressources aquatiques.
La mimique des variations naturelles des débits par les barrages hydroélectriques devrait êtrepriorisées et appliquées comme une des mesures permettant d’atténuer leurs impacts sur lespeuplements aquatiques du bassin du Mékong.
Mots-clés : Richesse et composition des peuplements de poissons, filtres environnementaux, saisonnalité et prédictibilité des débits, impact des pêcheries, barrages hydroélectriques, Bassin du Mékong, Asie.
DISCIPLINE ADMINISTRATIVE : ÉCOLOGIE
INTITULÉ ET ADDRESSE DE L’U.F.R OU DU LABORATOIRE : Laboratoire Évolution et Diversité Biologique (EDB) UMR5174 (CNRS/ENSFEA/IRD/UPS) Université Paul Sabatier, Bâtiment 4R1 118 route de Narbonne, 31062 TOULOUSE CEDEX9 – FRANCE