Embed Size (px)
Citation preview

Phase Diagrams—Understanding the BasicsF.C. Campbell, editor
Copyright © 2012 ASM International®
All rights reservedwww.asminternational.org
Chapter 6Peritectic Alloy Systems
SIMIlAr to the eUteCtIC group of invariant transformations is a group of peritectic reactions, in which a liquid and solid phase decomposes into a new solid phase on cooling through the peritectic isotherm. the generalized form of this peritectic reaction is:
L + α Æ β (peritectic reaction)
Because the β phase surrounds the solid α particles, as shown in Fig. 6.1, α atoms must diffuse through the β crust to reach the liquid for the reaction to continue. however, diffusion through the solid phase is much slower than diffusion through a liquid. As the peritectic reaction continues, the α layer gets thicker and the reaction slows down even more. Unless the cooling rate is very slow, a cored segregated structure will result. thus, equilibrium peritectic reactions are almost never observed in practice.
Actually, the term peritectic, in the science of heterogeneous equilibria, has a broader meaning. The term may be used to define all reactions in which two or more phases (gas, liquid, solid) react at a defined temperature (Tp) to form a new phase that is stable below Tp. Usually, the term peritectic
Fig. 6.1 Schematic of peritectic freezing
5342_ch06_6111.indd 117 3/2/12 12:24:49 PM

118 / Phase Diagrams—Understanding the Basics
refers to reactions in which a liquid phase reacts with at least one solid phase to form one new solid phase. this reaction can be written as α + L Æ β. Furthermore, the term peritectoid denotes the special case of an equilib-rium phase in which two or more solid phases (which are stable above the temperature Tp) react at Tp to form a new solid phase. this reaction can be written as α + β Æ γ. the phases formed during a peritectic or peritectoid reaction are a solid solution of one of the components, an allotropic phase of one of the components, or an intermetallic compound. Schematics of different types of peritectic phase diagrams are shown in Fig. 6.2.
Phase diagrams are very instructive when describing peritectic phase transformations.
Figure 6.3 shows a phase diagram with a peritectic reaction. this dia-gram shows that, under equilibrium conditions, all alloys to the left of I will solidify to α crystals. Similarly, all alloys to the right of III will
Fig. 6.2 typical peritectic phase diagrams. (a) peritectic reaction α + liquid Æ β and peritectoid reaction α + β Æ γ. (b) peritectic formation
of intermetallic phases from a high-melting intermetallic. (c) peritectic cascade between high- and low-melting components. adapted from ref 6.1
Fig. 6.3 phase diagram with a peritectic reaction. Source: ref 6.2
5342_ch06_6111.indd 118 3/2/12 12:24:49 PM

Chapter 6: Peritectic Alloy Systems / 119
solidify to β crystals. Alloys between II and III first solidify to α crys-tals and then transform to stable β crystals. Alloys between I and II also solidify to α crystals, but they are partially transformed to β crystals later. the volume fraction of each phase is determined with the lever rule if the alloy solidifies under equilibrium conditions. In practice, the lever rule usually will not give the volume fraction of the different phases, because the nucleation and growth kinetics, determined by the diffusion rate, in the solid phases determine the time required to reach equilibrium.
6.1 Freezing of Peritectic Alloys
Equilibrium Freezing of Peritectic Alloys. Consider the course of freezing of the peritectic Alloy 1 in Fig. 6.4. on cooling from the melt, the liquidus is reached at temperature T2, where crystals of the α phase (α2) begin to form. the liquid composition is displaced to the right as the temperature falls, and more solid is deposited. the composition of the α phase changing along the solidus reaches the end of the peritectic line, α4, when the liquid composition has reached the opposite end, L4:
Fig. 6.4 hypothetical peritectic phase diagram. adapted from ref 6.3
5342_ch06_6111.indd 119 3/2/12 12:24:50 PM
120 / Phase Diagrams—Understanding the Basics
% ( ) Alloy 1 above peritecticα βα
=
4 4
4 4
LL
( ) ≈100 35%
% ( ) Alloy 1 above peritectic 4 4LL
=
α βα4 4
( ) ≈100 65%
the peritectic reaction now occurs; the liquid and α react together to form β Under equilibrium conditions, freezing must be completed isother-mally by this process, and all the previously formed α as well as the liquid must be consumed.
If the alloy composition was at the left of the peritectic point, as Alloy 2 in Fig. 6.4, the α phase would not have been totally consumed in forming β. In this alloy, freezing begins at T1, where α1 first appears. Just above the peritectic temperature the quantities of α and liquid will be:
% ( ) Alloy 2 above peritectic4
αα
=
x LL
4 4
4 ( ) ≈100 80%
% ( ) Alloy 2 above peritecticL xL
=
αα
4 4
4 4 ( ) ≈100 20%
Just below the peritectic temperature, the liquid will have disappeared and there will be only the solid phases α and β:
% ( ) Alloy 2 below peritectic4 4
α βα β
=
x4 4 ( ) ≈100 70%
% ( ) Alloy 2 below peritectic4 4
β αα β
=
4 4x ( ) ≈100 30%
Notice that the quantity of the α phase has decreased during peritectic reaction from approximately 80% to approximately 70%.
If the composition of the alloy is to the right of the peritectic point, Alloy 3 in Fig. 6.4, then an excess of liquid would have survived the peritectic reaction. Freezing in this case begins at T3, where α3 is first rejected. There is a small quantity of the α phase present by the time the peritectic tem-perature is reached:
% ( ) Alloy 3 above peritecticαα
=
z LL
4 4
4 4 ( ) ≈100 10%
5342_ch06_6111.indd 120 3/2/12 12:24:53 PM

Chapter 6: Peritectic Alloy Systems / 121
% ( ) Alloy 3 above peritecticL zL
=
αα
4 4
4 4 ( ) ≈100 90%
But this is entirely consumed in forming the β phase:
% ( ) Alloy 3 below peritecticββ
=
z LL
4 4
4 4 ( ) ≈100 30%
% ( ) Alloy 3 below peritecticL zL
=
ββ
4 4
4 4 ( ) ≈100 70%
observe that the quantity of liquid has been reduced to approximately 70% and that the quantity of β formed is much greater than that of the α originally present.
Nonequilibrium Freezing of Peritectic Alloys. As pointed out earlier, the departure from equilibrium during the natural freezing of peritectic alloys is usually very large. referring back to Fig. 6.1, the β phase, in forming from the liquid and α phases, surrounds or encases the α-phase particles. this surrounding or encasement shields the α phase from fur-ther reaction with the liquid, and diffusion in the solid phases is usually insufficient to allow equilibrium to be established during cooling. If the solidified alloy is subjected to a homogenization heat treatment followed by hot working, the diffusion process is accelerated and equilibrium may be established.
6.2 Mechanisms of Peritectic Formation
Peritectic reactions or transformations are very common in the solidifica-tion of metals. Many interesting alloys undergo these types of reactions—for example, iron-carbon and iron-nickel-base alloys as well as copper-tin and copper-zinc alloys. the formation of peritectic structures can occur by at least three mechanisms:
Peritectic reaction,• where all three phases (α, β, and liquid) are in contact with each otherPeritectic transformation,• where the liquid and the α solid-solution phase are isolated by the β phase. the transformation takes place by long-range diffusion through the secondary β phase.Direct precipitation of • β from the melt, when there is enough under-coating below the peritectic temperature, Tp. Direct precipitation of β from the melt can occur when a peritectic reaction or peritectic trans-formation is sluggish, as is often the case.
5342_ch06_6111.indd 121 3/2/12 12:24:54 PM

122 / Phase Diagrams—Understanding the Basics
the three classes of peritectic phase diagram based on the shape of the peritectic (β) solid-solution region are shown in Fig. 6.5.
Peritectic reactions can proceed only as long as α and liquid are in contact. the β-phase solid nucleates at the α-liquid interface and readily forms a layer isolating α from the liquid. this mechanism occurs from short-range diffusion (Fig. 6.6a). In contrast, the term peritectic transfor-mation is used to describe a mechanism of long-range diffusion, where A atoms and B atoms migrate through the α layer to then form the β-phase solid at the α-β and the β-liquid interfaces, respectively (Fig. 6.6b).
From the final microstructure, it is not apparent by which mechanism β has formed. In any case, all three of the mechanisms require some under-cooling, because the driving force is zero at the peritectic temperature. the time dependence is pronounced for the peritectic transformation. there-fore, the amount of β phase formed will depend on the cooling rate or on holding time if isothermal conditions are established.
Fig. 6.5 types of peritectic systems. (a) type a system where the β/α + β solvus and the β solidus have slopes of the same sign. (b) type B system where the slopes have opposite signs. (c) type C system where the β phase
has a limited composition. Source: ref 6.1 as published in ref 6.4
Fig. 6.6 Mechanisms of peritectic reaction and transformation. (a) Lateral growth of a β layer along the α-liquid interface during peritectic reaction by liquid diffusion. (b) thicken-
ing of a β layer by solid-state diffusion during peritectic transformation. the solid arrows indicate growth direction of β; dashed arrows show the diffusion direction of the atomic species. ref 6.5 as published in ref 6.4
5342_ch06_6111.indd 122 3/2/12 12:24:55 PM

Chapter 6: Peritectic Alloy Systems / 123
localized nucleation of β and shape changes of β by solution repre-cipitation is driven by surface energy through diffusion in the liquid and influences the microstructure of peritectic alloys. Typical and specific microstructures are discussed in the following sections. For demonstration purposes, results are included from experimental alloys that were cooled rapidly from above the liquidus to a temperature above the peritectic equi-librium temperature, Tp, held for some time to achieve large homogeneous primary α crystals, then cooled to a temperature below Tp and held for extended times, inducing the formation of β by peritectic reaction and transformation, rather than by direct precipitation from the melt.
Nucleation-Controlled Peritectic Structures. the classical descrip-tion of peritectic reactions postulates heterogeneous nucleation of β at the α-liquid interface at the peritectic equilibrium temperature, Tp. Under-coolings of up to 4% of Tp are required for the systems investigated. If nucleation is limited to a few locations and lateral growth of the β nuclei does not readily occur, no continuous layer of the peritectic phase is formed, as in nickel-zinc and aluminum-uranium systems. A typical microstruc-ture is shown in Fig. 6.7. Small crystals of the peritectic phase nucleate at the interface and grow into the primary crystals. After extended annealing below Tp, the reaction goes to completion (Fig. 6.8). the original shape of
Fig. 6.7 primary Ual3 (gray) partially surrounded by peritectically-formed Ual4 (dark) in an al-6U alloy that was cooled slowly from above
liquidus to 760 °C (1400 °F) and held 10 min, then cooled to 670 °C (1240 °F) and held 15 min (peritectic temperature: 732 °C, or 1350 °F). the matrix is alu-minum (white) with Ual4 (dark) eutectic. this Ual3 + al Æ Ual4 reaction leads to unfavorable rolling behavior. Original magnification: 700¥. Source: ref 6.4
5342_ch06_6111.indd 123 3/2/12 12:24:55 PM

124 / Phase Diagrams—Understanding the Basics
the primary crystals is lost by decay into individual β crystals that coarsen by ostwald ripening during further annealing.
the peritectic reaction in the aluminum-uranium system was of special interest in the production of fuel elements for early nuclear reactors. the reaction UAl3 + Al (liquid or solid) Æ UAl4 is sluggish. In Fig. 6.7, this reaction could not be completely suppressed during the cooling cycles used, resulting in unfavorable rolling behavior. Additions of silicon or zirconium stabilize UAl3, extending the UAl3-Al equilibrium region below room temperature.
Peritectic Reactions. Depending on surface tension conditions, two different types of the peritectic reactions can occur:
Nucleation and growth of the • β crystals in the liquid without contact with the α crystalsNucleation and growth of the • β crystals in contact with the primary α phase
In the first case, the secondary phase is nucleated in the liquid and does not contact the primary phase. this occurs because of the surface tension conditions. Following nucleation, the secondary phase grows freely in the liquid. At the same time, the primary phase will dissolve. the secondary
Fig. 6.8 peritectically-formed Ual4 in an al-6U alloy that was cooled from above liquidus to 760 °C (1400 °F) and held 10 min, then cooled
to 600 °C (1110 °F) and held 7 days (peritectic temperature: 732 °C, or 1350 °F; eutectic temperature: 640 °C, or 1184 °F). Note the rounded crystals and the necking between crystals of different orientation. the matrix is aluminum (white) with coarsened eutectic Ual4 (dark). Original magnification: 700¥. Source: ref 6.1 as published in ref 6.4
5342_ch06_6111.indd 124 3/2/12 12:24:55 PM

Chapter 6: Peritectic Alloy Systems / 125
phase will not develop a morphology similar to a precipitated primary phase. this type of peritectic reaction has been observed for the reaction γ + L Æ β in the aluminum-manganese system. there has also been a tendency for the secondary phase to grow around the primary phase at increasing cooling rates. Similar reactions have been observed in nickel-zinc, and aluminum-uranium systems. In the second type of reaction, which is the most common, nucleation of the secondary β phase occurs at the interface between the primary α phase and the liquid. A lateral growth of the β phase around the α phase then takes place.
In an ideal peritectic reaction, undercooling is rather low (up to a few degrees Kelvin), and a plateau is observed in the cooling curve, as in the aluminum-titanium system. envelopes of the peritectic phase around the primary phase form by direct reaction in some systems—copper-tin and silver-tin, for example—through interrupted directional solidification experiments. Figure 6.9 shows the microstructures of a Cu-20Sn alloy that demonstrates the onset of the peritectic reactions α + liquid Æ β and ε + liquid Æ η, respectively. Figure 6.10 shows, at a higher magnification, the homogeneous thickness of the β layer around the α dendrites. the peritec-tic reaction can proceed very rapidly by liquid diffusion over a very short distance in the lateral direction, as shown in Fig. 6.6(a). the thickness of the layers has been calculated with fairly good agreement to experimental results for copper-tin and silver-tin alloys on the basis of maximum growth rate or minimum undercooling from the laws derived for solidification at low undercoolings. the thickness depends to some extent on the cooling rate, but more strongly on the interfacial energies, σ, with σ (liquid-β) + σ (α-β) – σ (liquid-α) as the determining factor.
Fig. 6.9 Start of the peritectic reaction in a directionally-solidified Cu-20Sn alloy. primary α dendrites (white) are covered by peritectically-
formed β layer (gray) shortly after the temperature reaches Tp. Matrix (dark) is a mixture of tin-rich phases. Original magnification: 40¥. Source: ref 6.6 as published in ref 6.4
5342_ch06_6111.indd 125 3/2/12 12:24:55 PM

126 / Phase Diagrams—Understanding the Basics
Peritectic Transformations. the precipitation of β directly from the liquid and the solid depends on the shape of the phase diagram and the cooling rate. After isolation of primary α from the liquid by the β layer, the direct peritectic reaction can no longer take place. the diffusion pro-cess through the β layer depends on the diffusion rate, the shape of the phase diagram, and the cooling rate. the thickness of the β layer will also normally increase during subsequent cooling. there are three reasons for this:
Diffusion through the • β layerPrecipitation of • β directly from the liquidPrecipitation of • β directly from the α phase
the thickness of the β phase envelope surrounding the α phase is deter-mined by the peritectic reaction followed by an increase in thickness due to a precipitation directly from the liquid. the rate of the peritectic transfor-mation is influenced by the diffusion rate and the extension of the β phase region in the phase diagram. If the diffusion rate is small, the peritectic transformation will be negligible compared to the peritectic reaction. Dur-ing continuous cooling, this diffusional growth is affected by precipitation from the liquid and from the primary α or by dissolution of β, according to the slopes of the solubility limits in the phase diagram. Under simplifying conditions, the growth rates have been calculated numerically and found to be in reasonable agreement with the experimental findings in the copper-tin and silver-tin systems. the kinetics of peritectic transformations can be studied under isothermal conditions. then, β is formed exclusively by dif-
Fig. 6.10 Start of the peritectic transformation in the same directionally-solid-ified Cu-20Sn alloy shown in Fig. 6.9, but at higher magnification.
Note the homogeneous thickness of the β layers (gray) around the primary α (white). the matrix (dark) is a mixture of tin-rich phases. Original magnification: 160¥. Source: ref 6.6 as published in ref 6.4
5342_ch06_6111.indd 126 3/2/12 12:24:55 PM

Chapter 6: Peritectic Alloy Systems / 127
Fig. 6.11 peritectic transformation of an Sb-14Ni alloy that was slowly cooled to 650 °C (1200 °F) and held 1 h, then cooled to 615 °C (1140 °F)
and held 10 min (peritectic temperature: 626 °C, or 1159 °F). an irregular layer of NiSb2 crystals (dark) is formed around the coarse primary NiSb crystals. the matrix is the coarsened NiSb2-Sb eutectic. Original magnification: 200¥. Source: ref 6.1 as published in ref 6.4
fusion of the two atomic species in the β layer at the α-β and the β-liquid interfaces.
A typical microstructure from a peritectic transformation is shown in Fig. 6.11. Similar results have been obtained in the copper-tin system for the transformation ε + liquid Æ η and for peritectic transformations in the cobalt-tin, gold-bismuth, and chromium-antimony systems. In contrast, two maxima of the thickness of the peritectically-formed CuCd3 were observed in the copper-cadmium system, as shown in Fig. 6.12. The first maximum is attributed to the contribution of grain-boundary diffusion, which is small for the faceted, large grains formed at high temperatures (Fig. 6.13) and large for the fine-grained, smooth layer formed below the eutectic temperature (Fig. 6.14).
Peritectic Cascades. In many systems, one peritectic reaction at a high temperature is followed by one or more peritectic reactions at lower tem-peratures. If the diffusion rate is low in the initially formed peritectic layer, a second peritectic layer can be formed when the second peritectic tem-perature is reached. this type of series of peritectic reactions is referred to as a cascade. the individual thicknesses depend on the growth rate and the rate of consumption by other growing phases, that is, on the diffusivities and the molar volumes of the individual phases.
5342_ch06_6111.indd 127 3/2/12 12:24:56 PM

128 / Phase Diagrams—Understanding the Basics
Fig. 6.12 temperature dependence of the peritectic transformation Cu5Cd8 + liquid Æ CuCd3 in a Cd-10Cu alloy at 40 and 160 min isothermal
annealing. Source: ref 6.7 as published in ref 6.4
Fig. 6.13 Microstructure of a Cd-10Cu alloy that was cooled to 410 °C (770 °F) and held 20 h, then cooled to 305 °C (580 °F) and held 160
min (peritectic temperature: 397 °C, or 747 °F). Note the faceted coarse crystals of the peritectically-formed CuCd3 envelopes (gray). the primary Cu5Cd8 crystals are white; the dark matrix is cadmium. Original magnification: 100¥. Source: ref 6.1 as published in ref 6.4
For example, the binary tin-antimony systems exhibit a peritectic cas-cade. In this case, it is possible to get layers of each phase around the initial pro-peritectic phase, as shown in Fig. 6.15. the cascade in the phase diagram for this alloy includes a peritectic and a peritectoid transforma-tion. As shown in a detailed study of the zirconium-aluminum system, peritectoid reactions and transformations follow the same principles as
5342_ch06_6111.indd 128 3/2/12 12:24:56 PM

Chapter 6: Peritectic Alloy Systems / 129
Fig. 6.14 Same as Fig. 6.13, except alloy was cooled to 410 °C (770 °F) and held 20 h, then cooled to 275 °C (525 °F) and held 160 min (peri-
tectic temperature: 397 °C, or 747 °F; eutectic temperature: 314 °C, or 597 °F). Note large number of grain boundaries in the peritectic CuCd3 phase (gray) and its smooth interfaces with the primary Cu5Cd8 crystals (white) and the matrix Cd (dark). Original magnification: 100¥. Source: ref 6.1 as published in ref 6.4
Fig. 6.15 Microstructure of a Sn-50wt%Sb alloy. the primary β phase is light, surrounded by a dark gray structure that was originally Sb2Sn3
but has decomposed to β + Sn. Original magnification: 50¥. Source: ref 6.4
5342_ch06_6111.indd 129 3/2/12 12:24:57 PM

130 / Phase Diagrams—Understanding the Basics
the peritectic ones. The theoretical analysis is confirmed by experimen-tal results of the reaction Zr + Zr2Al Æ Zr3Al, with a parabolic growth dependence and a maximum growth rate approximately 100 K below the peritectoid temperature.
6.3 Peritectic Structures in Iron-Base Alloys
From a technical viewpoint, the peritectic formation of austenite, γ, from primary ferrite, δ, is the most important peritectic reaction. thermal analy-sis indicates that the reaction δ + L Æ γ proceeds to a great extent during continuous cooling, and δ-ferrite usually disappears completely on cool-ing into the austenite region if not stabilized by alloying additions. Phase diagrams of iron with an austenite-stabilizing element (such as carbon, nitrogen, nickel, and manganese) always show a peritectic reaction. In most steels, austenite- and ferrite-stabilizing elements are present, as in stainless and high-speed steels for which peritectic formation of γ has been studied in detail.
A directionally-solidified high-speed steel with peritectic γ envelopes around the highly branched δ dendrites is shown in Fig. 6.16. the varying
Fig. 6.16 Longitudinal section through directionally-solidified high-speed steel (aISI t1) that was cooled at 0.23 K/s from above liquidus. the
peritectic envelopes of austenite (gray) around the highly branched dendrites of δ-ferrite (discontinuously transformed to austenite and carbide, dark) are clearly distinguishable. the matrix is fine ledeburite (white). Original magnification: 60¥. Source: ref 6.8 as published in ref 6.4
5342_ch06_6111.indd 130 3/2/12 12:24:57 PM

Chapter 6: Peritectic Alloy Systems / 131
Fig. 6.17 Longitudinal section through directionally-solidified high-speed steel (aISI M2 with 1.12% C and 1% Nb) that was cooled at 0.1 K/s
to approximately 1320 °C (2410 °F), that is, 20 K below the onset of the peritectic transformation. Note the thicker layers of peritectic austenite on the front faces of the secondary dendrites compared to the back. Original magnification: 100¥. Source: ref 6.1 as published in ref 6.4
thickness of the layers on the front and the back of the secondary dendrite arms are shown in Fig. 6.17. this is attributed to the wandering of the arms toward the tip of the dendrite, that is, in the solidification direction, during directional solidification due to temperature gradient zone melting. Under some cooling conditions, the layers appear to be partially missing on the back. this and other mechanisms related to the peritectic transformation complicate the interpretation of the microstructures found in high-speed steels and their weldments.
6.4 Multicomponent Systems
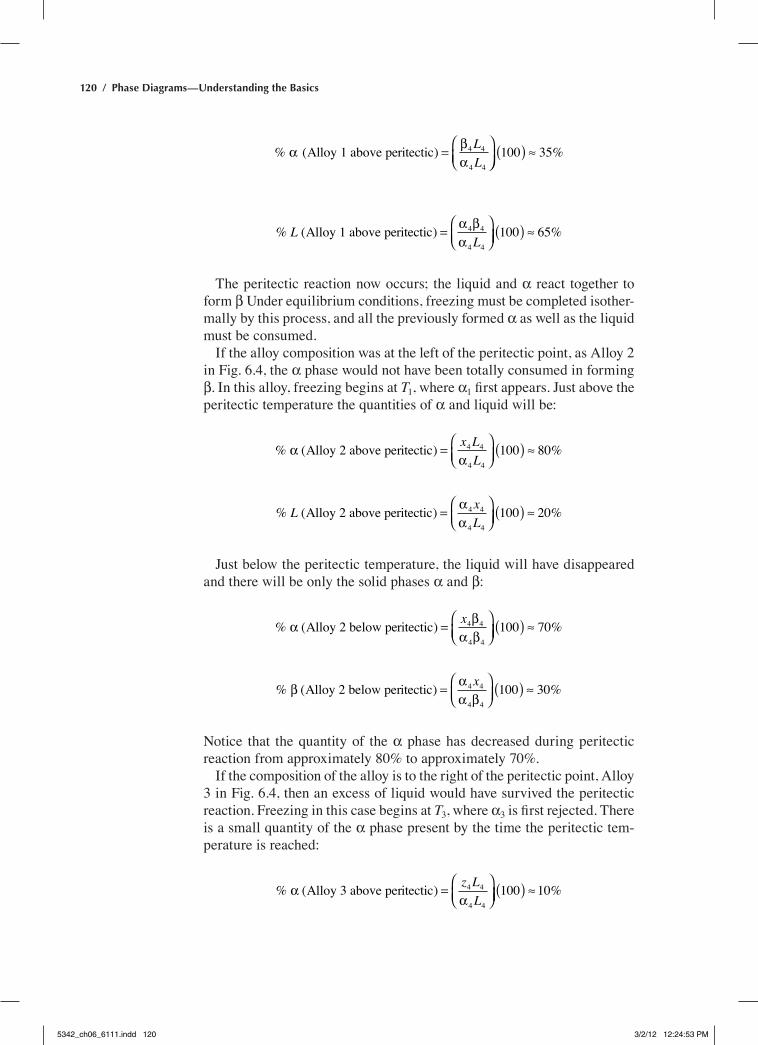
Alloys often consist of more than two alloying elements. however, very little information is given in the literature about the peritectic reaction in multicomponent alloys. recent investigations of iron-base alloys have shown that peritectic reactions are very common in stainless steels. the peritectic reaction in these alloys gives the type of distribution shown in Fig. 6.18. In stainless steels, the peritectic reaction will transfer to a eutec-tic reaction if the chromium content is increased to 20% or more. this transition is also influenced by the molybdenum content (Fig. 6.19).
5342_ch06_6111.indd 131 3/2/12 12:24:57 PM
132 / Phase Diagrams—Understanding the Basics
Fig. 6.19 the transition from a peritectic to a eutectic reaction as a function of chromium and molybdenum content in a stainless steel contain-
ing 11.9% Ni. Source: ref 6.10 as published in ref 6.4
Fig. 6.18 Nickel distribution after peritectic reaction in a steel containing 4 wt% Ni. the temperature gradient was 60 K/cm. Calculations were
made at different solidification rates. the dotted line shows the nickel distribution at the start of the peritectic reaction. δ, primary ferrite; γ, austenite. Source: ref 6.9 as published in ref 6.4
Iron-base alloys often consist of carbon with some other elements. Both chromium and nickel are substitutional alloying elements, while carbon is interstitially dissolved and has a very high diffusion rate. the other sub-stitutional alloying elements have much lower diffusion rates. this gives
5342_ch06_6111.indd 132 3/2/12 12:24:58 PM

Chapter 6: Peritectic Alloy Systems / 133
rise to transformations that are determined by the movement of the sub-stitutional elements, and carbon is distributed according to equilibrium conditions. As a result, a normal peritectic transformation does not occur. To fulfill the criterion that carbon should follow the equilibrium condi-tions, liquid must be formed at the border between ferrite and austenite. this reaction is shown in Fig. 6.20.
ACKNOWLEDGMENT
Portions of this chapter came from Invariant transformation Structures in Metallography and Microstructures, Vol 9, ASM Handbook, ASM International, 2004.
REFERENCES
6.1 h.e. exner and G. Petzow, Peritectic Structures, Metallography and Microstructures, Vol 9, Metals Handbook, 9th ed., American Society for Metals, 1985, p 675–680
6.2 Peritectic Solidification, Casting, Vol 15A, ASM Handbook, ASM International, 2008
6.3 F.N. rhines, Phase Diagrams in Metallurgy, McGraw-hill, 1956, p 84
6.4 Invariant transformation Structures, Metallography and Microstruc-tures, Vol 9, ASM Handbook, ASM International, 2004, p 152–164
6.5 M. Hillert, Keynote Address: Eutectic and Peritectic Solidification, Solidification and Castings of Metals, the Metals Society, london, 1979, p 81–87
6.6 h. Frederiksson and t. Nylén, Mechanism of Peritectic reactions and transformations, Met. Sci., Vol 16, 1982, p 283–294
Fig. 6.20 three stages of a peritectic reaction in a unidirectionally-solidified high-speed steel. (a) First-stage struc-ture. Dark gray is austenite; white is ferrite. the mottled structure is quenched liquid. (b) Subsequent
peritectic transformation of (a). (c) Further peritectic transformation of (a) and (b). Dark gray in the middle of the white ferrite is newly formed liquid. Source: ref 6.11 as published in ref 6.4
5342_ch06_6111.indd 133 3/2/12 12:24:58 PM
134 / Phase Diagrams—Understanding the Basics
6.7 G. Petzow and h.e. exner, Zur Kenntnis peritektischer Unwandlun-gen, Radex-Rundsch., Issue 3/4, 1967, p 534–539
6.8 r. riedl, “erstarrungsverlauf von Schnellarbeitsstrahlen,” Ph.D. the-sis, University of leoben, Austria, 1984
6.9 H. Fredriksson, The Solidification Sequence in an 18-8 Stainless Steel, Metall. Trans., Vol 3, 1972, p 2989–2997
6.10 H. Fredriksson, Solidification of Peritectics, Casting, Vol 15, ASM Handbook, ASM International, 1988, p 125–129
6.11 h. Frederiksson, the Mechanism of the Peritectic reaction in Iron-Base Alloys, Met. Sci., Vol 10, 1976, p 77–86
5342_ch06_6111.indd 134 3/2/12 12:24:58 PM