Embed Size (px)
Citation preview

Carbonyl-Reactive Tandem Mass Tag (TMT) Reagents for Mass Spectrometry-Based Quantitative GlycomicsSergei I. Snovida,1 Rosa Viner,2 John C. Rogers1 1Thermo Fisher Scientific, Rockford, IL; 2Thermo Fisher Scientific, San Jose, CA

2 Carbonyl-Reactive Tandem Mass Tag (TMT) Reagents for Mass Spectrometry-Based Quantitative Glycomics
Carbonyl-Reactive Tandem Mass Tag (TMT) Reagents for Mass Spectrometry-Based Quantitative Glycomics Sergei I. Snovida1, Rosa Viner2, John C. Rogers1 1Thermo Fisher Scientific, Rockford, IL; 2Thermo Fisher Scientific, San Jose, CA
Conclusion Increase sample analysis throughput with aminoxyTMT reagents
Overall improvement in MS sensitivity with aminoxyTMT label approach
Structural elements are preserved in labeled glycans
LC-UV/fluorescence and TMT-based quantitation can be complementary
Ideal for analysis of biotherapeutics and biomarker discovery
Acknowledgements We would like to thank the following colleagues and collaborators for critical advice and helpful discussions: Dr. Ryan Bomgarden, Dr. Chris Etienne, Dr. Kay Opperman, Dr. Venky Shivalingappa, and Dr. Julian Saba (Thermo Fisher Scientific); Dr. Kay-Hooi Khoo, Dr. Ming-Yi Ho, Dr. Shui-Hua Wang, and Dr. Chia-Wei Lin (Academia Sinica, Taipei, Taiwan); Dr. Ian Pike and Dr. Karsten Kuhn (Proteome Sciences); Dr. Bernhard Küster, Dr. Hannes Hahne, and Dr. Patrick Neubert (Technische Universität München, Munich, Germany); Dr. Lingjun Li, Dr. Xuefei Zhong, and Dr. Yan Liu (University of Wisconsin, Madison, WI, USA); Dr. Yehia Mechref, Shiyue Zhou, and Yunli Hu (Texas Tech University, Lubbock, TX, USA); Dr. Shonali Paul and Dr. Sanjib Meitei (Premier Biosoft).
Overview Purpose: To demonstrate applications of the new carbonyl-reactive aminoxyTMT reagent in quantitative analysis of carbohydrates by direct infusion and liquid chromatography-coupled mass spectrometry.
Methods: N-glycans released from standard glycoproteins, including several monoclonal antibodies, were individually labeled with the isobaric aminoxyTMT reagents, and combined together for quantitative analysis by mass spectrometry.
Results: Relative quantitation of the labeled glycans from different samples was done by measuring relative peak intensities of the TMT® reporter ions at MS2 or MS3 levels.
Introduction Aberrant glycosylation profiles may reflect abnormal physiological state of a cell, an organ, or an organism as a whole, and may be indicative of a disease state or cancer. Thus, glycans may be used as biomarkers. Additionally, many biotherapeutic drugs are glycoproteins and their activity and efficacy greatly depends on the type and extent of glycosylation. These compounds must be characterized in terms of their glycosylation profiles in both the development and quality control phases of drug development and manufacture.
Accurate quantitation of glycans remains elusive due to the lack of a comprehensive selection of available standards, poor ionization efficiency of carbohydrates relative to other classes of biomolecules, and broad structural heterogeneity of glycomic samples. Recently, we introduced a set of isobaric carbonyl-reactive TMT reagents, Thermo Scientific™ aminoxyTMT™ (Tandem Mass Tag®) Label Reagents (Figure 1), which can react with the reducing end of glycans to form a stable oxime product. The six compounds of the Thermo Scientific™ aminoxyTMTsixplex™ Reagent Set have the same mass (i.e., isobaric) and chemical structure (carbonyl-reactive aminoxy group, spacer arm, and mass reporter). However, the specific distribution of 13C and 15N isotopes on either side of the MS/MS fragmentation site in each reagent results in a unique reporter mass (126–131 Da) in the low m/z region of MS2 spectra. This set of reporter ions is used to measure the relative abundance of labeled molecules in a combined (multiplexed) MS sample representing six different treatment conditions, time points, or replicates. For glycobiology MS applications, the reagents enable quantitative profiling of glycoforms and discovery of glycan biomarkers; they provide improved ionization of glycans for increased sensitivity and increased analytical throughput by sample multiplexing.
In this work, we showcase the use of these reagents for quantitative glycomics by combining our multiplexed TMT-based approach with HILIC LC-MS technique to enable more-sensitive analysis with improved glycome coverage.
Methods Sample Preparation
Bovine thyroglobulin (Sigma-Aldrich) and several monoclonal antibodies (Thermo Fisher Scientific) were reduced, alkylated, and digested with MS-grade trypsin (Thermo Fisher Scientific). Digest mixture was then treated with PNGase F (New England Biolabs) to release N-linked glycans. Following deglycosylation, released glycans were separated from peptides using Oasis® HLB (Waters) solid phase extraction columns. After drying, glycan samples were labeled with aminoxyTMT reagents (Thermo Fisher Scientific) according to manufacturer’s protocol.
Liquid Chromatography
LC-MS experiments were performed in HILIC mode on a Thermo Scientific™ Accucore™ Amide column (2.6µm, 150Å; 75µm×150mm). Mobile phases were 0.1% formic acid in water (A) and 0.1% formic acid in acetonitrile (B). Separation was carried out with a 400 nL/min flowrate using different, sample-dependent gradients.
Mass Spectrometry
For direct infusion experiments, labeled glycan samples were dissolved in 50% acetonitrile solution containing 50 µM NaOH. Samples were analyzed on Thermo Scientific™ Orbitrap Velos Pro™ ion trap and Thermo Scientific™ Orbitrap Fusion™ Tribrid™ mass spectrometers in the positive ion mode.
Data Analysis
All data was processed manually.
FIGURE 1. Chemical structure of aminoxyTMT reagents and labeling reaction scheme.
Results General Features of aminoxyTMT-labeled Glycans
Two types of the reagent are available, Thermo Scientific™ aminoxyTMTzero™ Label Reagents, the light version of the reagent recommended for method development work, and the heavy, isobaric aminoxyTMT sixplex set (Figure 1). When a labeled glycan is subjected to MS/MS fragmentation by HCD, mass reporter region of the label molecule is cleaved, leading to an intense peak in the low m/z region of MS/MS spectrum. For the aminoxyTMTsixplex set, each member of the set produces a mass reporter ion with a unique m/z, thus allowing for relative quantitation of glycoforms across up to six different samples (Figure 3). The carbonyl-reactive alkoxyamine group reacts rapidly with aldehydes and ketones to yield a stable oxime product, which is resistant to hydrolysis over a broad range of experimental conditions.
Comparison of the fragmentation spectra of the sodiated precursors of unlabeled and aminoxyTMT-labeled glycans (Figure 2) shows that the same structurally relevant product ions are produced for both the labeled and the unlabeled glycans, suggesting that structural information is not lost or diminished after labeling with the aminoxyTMT reagent. Therefore, in addition to the mass reporter ions relevant for quantitation, information which can be derived from the MS/MS spectra of the unlabeled glycans is still present here.
Multiplexing Glycomic Samples - Overview
In a typical experiment, up to six separate samples may be analyzed together, which allows lower overall analysis time and minimizes the variations in quantitative reproducibility, as the number of independent sample handling steps is reduced in this workflow (Figure 3). After labeling with aminoxyTMT reagents, unreacted reagents are quenched with acetone and samples are combined. An additional clean-up step using HILIC solid phase extraction material is used to separate the quenched reagent from the labeled glycans. During MS analysis, precursor ions corresponding to the glycoforms of interest are identified and are subjected to MS/MS analysis by HCD fragmentation. Relative peak intensities of the reporter ions observed in the MS/MS spectra are proportional to the relative abundance levels of the selected glycoform in different samples in the set.
Several peaks observed in the low m/z region of MS/MS spectra of the labeled glycans may interfere with accurate quantitative analysis if a low resolution mass spectrometer is used (Figure 3). These peaks are some of the product ions of HexNAc fragmentation, and are thus present in MS/MS spectra of most glycoforms.
Although this may be an issue for low resolution instruments, these interferences are easily resolved and do not pose a problem for accurate quantitation at the lowest resolution settings of a Thermo Scientific™ Orbitrap™ mass spectrometer.
If a Velos Pro ion trap mass spectrometer is used for the analysis, application of a targeted MS3 method (Figure 4) solves this interference problem. First, precursor of interest is isolated and fragmented using CID or HCD fragmentation mode. In the second step, abundant Y1 ions, which still contain intact aminoxyTMT label, are isolated for MS3 HCD. MS3 spectra contain “clean” mass reporter ions and their ratios are now as expected for the sample set.
Multiplexing Glycomic Samples - Examples
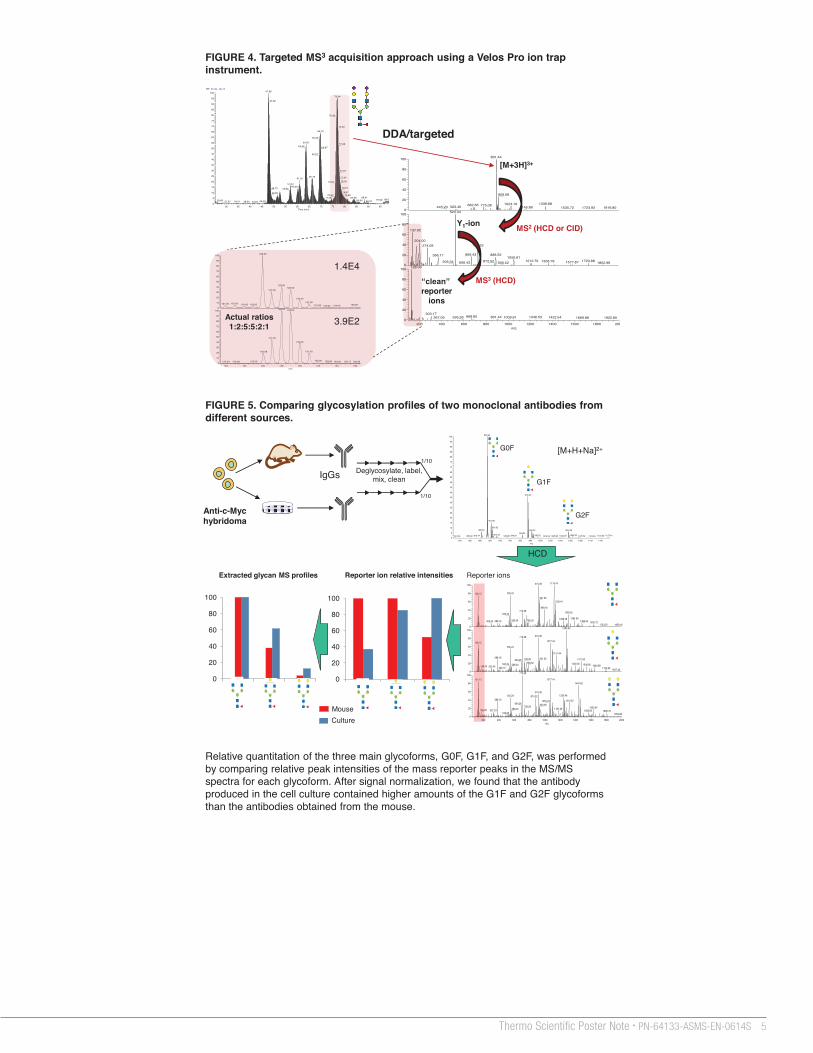
Several experiments showcasing the use of these reagents for quantitative analysis of glycans were performed using antibodies as glycan sources. In the first experiment (Figure 5), 100 µg of two anti c-Myc monoclonal antibodies, each coming from a different source, were separately deglycosylated using PNGase F glycosidase, glycans were isolated and each sample was labeled with a different heavy version of the isotopic aminoxyTMT reagent. After quenching and clean-up, the samples were combined and analyzed by direct infusion using a Velos Pro mass spectrometer.
Tandem Mass Tag and TMT are registered trademarks of Proteome Sciences plc. Sigma-Aldrich is a registered trademark of Sigma-Aldrich Co. LLC. Oasis is a registered trademark of Waters Corporation. All other trademarks are the property of Thermo Fisher Scientific and its subsidiaries.
This information is not intended to encourage use of these products in any manners that might infringe the intellectual property rights of others.
FIGURE 4. Targeted MS3 acquisition approach using a Velos Pro ion trap instrument.
FIGURE 5. Comparing glycosylation profiles of two monoclonal antibodies from different sources.
AminoxyTMT Reagent Structure AminoxyTMTsixplex Isobaric Reagents
HCD
+ glycan aminoxyTMT reagent Stable oxime product
Reaction:
122 124 126 128 130 132 134 136m/z
0
10
20
30
40
50
60
70
80
90
1000
10
20
30
40
50
60
70
80
90
100
Rela
tive
Abun
danc
e
126.00
128.00129.00
127.00
130.00131.00122.92121.92 124.00 124.92 135.92131.92 134.00132.92
128.00 129.00
127.00
130.00
131.00126.08
132.00 133.08125.00 134.00123.08 135.17 136.08122.00
NL: 1.30E4btg_ng_native_oxytmt_1_2_5_hilic_50acnsample_1_1ul#6214-6809 RT: 75.02-80.62 AV: 42 F: ITMS + p NSI d Full ms2 [email protected] [100.00-2000.00]
NL: 3.88E2bTg_NG_native_oxyTMT_1_2_5_HILIC_50ACNsample_1_1uL_140219224437#11906-12461 RT: 75.02-80.96 AV: 147 F: ITMS + p NSI d Full ms3 [email protected] [email protected] [100.00-2000.00]
200 400 600 800 1000 1200 1400 1600 1800 2000m/z
0
20
40
60
80
1000
20
40
60
80
100
Rela
tive
Abun
danc
e
0
20
40
60
80
100 891.44
909.08
1336.681024.16682.36 775.08523.40445.20 1145.88 1535.72 1723.92 1916.80523.34
137.92
204.00726.52274.09
669.43 888.52366.17 1050.611723.881212.70872.52 1358.78505.34 1577.87606.43 1852.96930.52
128.00
303.17668.85 891.44 1246.53595.26 1009.61 1422.54367.09 1669.88 1922.80
NL: 1.93E6bTg_NG_native_oxyTMT_1_2_5_HILIC_50ACNsample_1_1uL_140219224437#11906-12461 RT: 75.00-81.00 AV: 148 T: ITMS + p NSI E Full ms [400.00-2000.00]
NL: 7.54E4btg_ng_native_oxytmt_1_2_5_hilic_50acnsample_1_1ul#6214-6809 RT: 75.02-80.62 AV: 42 F: ITMS + p NSI d Full ms2 [email protected] [100.00-2000.00]
NL: 3.88E2bTg_NG_native_oxyTMT_1_2_5_HILIC_50ACNsample_1_1uL_140219224437#11906-12461 RT: 75.02-80.96 AV: 147 F: ITMS + p NSI d Full ms3 [email protected] [email protected] [100.00-2000.00]
MS2 (HCD or CID)
MS3 (HCD)
[M+3H]3+
Y1-ion
“clean” reporter
ions
DDA/targeted
1.4E4
3.9E2 Actual ratios 1:2:5:5:2:1
RT: 25.39 - 99.74
30 35 40 45 50 55 60 65 70 75 80 85 90 95Time (min)
0
5
10
15
20
25
30
35
40
45
50
55
60
65
70
75
80
85
90
95
100
Rela
tive
Abun
danc
e
47.85
76.94
47.92
76.49
77.09
69.73
69.39
63.62 77.2863.49 69.87
69.27
77.67
66.18 77.9261.0578.0076.02
57.0360.04 78.5748.73 56.85
78.9748.8979.6575.50
88.4183.6874.3098.0097.5025.66 84.94 89.2246.4934.5127.87 38.50 43.87
NL: 9.19E6Base Peak MS bTg_NG_native_oxyTMT_1_2_5_HILIC_50ACNsample_1_1uL_140219224437
200 400 600 800 1000 1200 1400 1600 1800 2000m/z
0
20
40
60
80
1000
20
40
60
80
100
Rel
ativ
e A
bund
ance
0
20
40
60
80
100 1118.44915.36
550.24128.12931.36
1136.44
989.40712.28 1309.52532.20
1384.561238.48786.32566.24388.16303.24 1482.64 1630.721743.52 1959.16
1280.52
915.36712.281077.44128.12
550.24
1151.44388.16 931.36728.28 1471.60694.28
786.32 1400.56532.24 1546.60568.24 1644.68168.04 303.24 406.16 1792.80 1927.48712.28
1077.44131.121442.60
915.361239.48550.24 874.32
388.16 1313.521055.76694.28 933.36728.28 1633.641181.48568.24168.08 327.24 1562.64 1806.76
532.20 1952.88
NL: 7.76E2native_TMT128_131_pos_894#5 RT: 0.10 AV: 1 T: ITMS + p ESI E Full ms2 [email protected] [50.00-2000.00]
NL: 2.25E2native_tmt128_131_pos_975#5 RT: 0.11 AV: 1 T: ITMS + p ESI E Full ms2 [email protected] [50.00-2000.00]
NL: 1.79E1native_tmt128_131_pos_1056#4 RT: 0.09 AV: 1 T: ITMS + p ESI E Full ms2 [email protected] [50.00-2000.00]
Reporter ions
HCD
0
20
40
60
80
100
1 2 3
Extracted glycan MS profiles
0
20
40
60
80
100
1 2 3
Reporter ion relative intensities
Culture Mouse
1to1_mix_native_TMT_pos #18 RT: 0.11 AV: 1 NL: 1.82E5T: ITMS + p ESI E Full ms [50.00-2000.00]
840 860 880 900 920 940 960 980 1000 1020 1040 1060 1080 1100 1120m/z
0
5
10
15
20
25
30
35
40
45
50
55
60
65
70
75
80
85
90
95
100
Rel
ativ
e A
bund
ance
893.92
974.92
901.88
904.92882.92 1055.96982.92
963.96913.40 1063.92993.92 1137.44946.92873.44 1044.92 1122.00933.88 1028.40 1076.52860.92831.56 1103.841014.92
Deglycosylate, label, mix, clean
1/10
1/10
Anti-c-Myc hybridoma
IgGs
G0F
G1F
G2F
[M+H+Na]2+
N-glycans N-glycans N-glycans
TMT129 TMT126 TMT127 TMT130 TMT128 TMT131
MS
Combined Sample
3_mAbs_123123 #54 RT: 0.11 AV: 1 NL: 2.41E6T: ITMS + p ESI Full ms [700.00-1500.00]
800 850 900 950 1000 1050 1100 1150 1200m/z
0
5
10
15
20
25
30
35
40
45
50
55
60
65
70
75
80
85
90
95
100
Rel
ativ
e Ab
unda
nce
893.84
974.92
882.84 901.841055.93
904.84 982.84963.92820.84 873.34
792.34 1040.18910.76 954.34 1063.84829.75 1140.10991.84855.67 1198.101098.09 1226.011168.18
G0F
G1F
G2F
3_mAbs_123123_894 #10 RT: 0.10 AV: 1 NL: 5.69E3T: ITMS + p ESI Full ms2 [email protected] [50.00-1500.00]
122 123 124 125 126 127 128 129 130 131 132 133 134 135m/z
0
5
10
15
20
25
30
35
40
45
50
55
60
65
70
75
80
85
90
95
100
Rel
ativ
e A
bund
ance
126.25 131.34128.34130.34
127.34129.34
124.25
132.25125.25 133.25123.25122.25 134.25 135.173_mabs_123123_975 #21 RT: 0.24 AV: 1 NL: 5.48E3T: ITMS + p ESI Full ms2 [email protected] [50.00-1500.00]
122 123 124 125 126 127 128 129 130 131 132 133 134 135 136m/z
0
5
10
15
20
25
30
35
40
45
50
55
60
65
70
75
80
85
90
95
100
Rel
ativ
e A
bund
ance
126.25
129.34
128.34 130.34127.34 131.34
124.17125.25 132.25123.25 133.25122.25 134.25 135.17
3_mabs_123123_1056 #8 RT: 0.10 AV: 1 NL: 1.22E3T: ITMS + p ESI Full ms2 [email protected] [50.00-1500.00]
122 123 124 125 126 127 128 129 130 131 132 133 134 135 136m/z
0
5
10
15
20
25
30
35
40
45
50
55
60
65
70
75
80
85
90
95
100
Re
lativ
e A
bu
nd
an
ce
126.25
129.34
127.25130.34128.34
131.34
124.17 125.25 132.25123.25 133.25122.25 134.17 135.17 136.25
HCD
HCD
HCD
Reporter Ions
Reporter Ions
Reporter Ions
FIGURE 6. Quantitative comparison of glycosylation of several monoclonal antibodies with replicates.
FIGURE 2. Positive ion mode HCD fragmentation of native unlabeled and aminoxyTMT-labeled high-mannose glycans.
100 200 300 400 500 600 700 800 900 1000 1100 1200 1300 1400m/z
0
10
20
30
40
50
60
70
80
90
1000
10
20
30
40
50
60
70
80
90
100
Rel
ativ
e Ab
unda
nce
1036.61
1257.69
874.52671.43
833.521095.61
447.34
907.52550.34 1156.61771.52640.68347.26 994.61599.35226.25 329.26138.17 1300.70 1415.70
1036.44
1054.44671.28131.12851.36
833.32 907.36653.28
979.40625.28 689.28527.20 1156.48817.36347.12 550.24 1211.52401.20303.24203.20 463.20 1400.681272.52
NL: 1.16E4RNAseB_NG_200ug_prot_eq_mL_641#9 RT: 0.10 AV: 1 T: ITMS + p ESI Full ms2 [email protected] [50.00-2000.00]
NL: 5.17E3blf_rnaseb_btg_tmt_pos_780#5 RT: 0.09 AV: 1 T: ITMS + p ESI E Full ms2 [email protected] [50.00-2000.00]
Reporter ions
Y (Na+)
Y (Na+)
Y (Na+)
[M+Na]+B (Na+)
B (Na+)B (Na+)
B (Na+)
0,2AB (Na+)B (Na+)
[M+ Na-reporter-CO]+
C (Na+)
unlabeled
aminoxyTMT Reagent-labeled
Trap-HCD 640.5 m/z [M+2Na]2+
Trap-HCD 779.9 m/z [M+H+Na]2+
0,2A
*
FIGURE 3. Workflow for quantitative glycomics multiplexed experiment.
3_mAbs_123123 #54 RT: 0.11 AV: 1 NL: 2.41E6T: ITMS + p ESI Full ms [700.00-1500.00]
800 850 900 950 1000 1050 1100 1150 1200m/z
0
5
10
15
20
25
30
35
40
45
50
55
60
65
70
75
80
85
90
95
100
Relat
ive Ab
unda
nce
893.84
974.92
882.84 901.841055.93
904.84 982.84963.92820.84 873.34
792.34 1040.18910.76 954.34 1063.84829.75 1140.10991.84855.67 1198.101098.09 1226.011168.18
Unknown Samples
#2 #1 #3 #4 #5
TMT126 TMT127 TMT128 TMT129 TMT130 TMT131 + + + + +
Sixplex Sample
MS
MS/MS
Std
bLf_NG_TMT6_20_1_infusion_OT_HCD45_1093_60000res #1-36 RT: 0.00-0.13 AV: 36 NL: 5.58E5T: FTMS + p ESI Full ms2 [email protected] [50.00-2000.00]
125.5 126.0 126.5 127.0 127.5 128.0 128.5 129.0 129.5 130.0 130.5 131.0 131.5m/z
0
5
10
15
20
25
30
35
40
45
50
55
60
65
70
75
80
85
90
95
100
Rel
ativ
e A
bund
ance
Std
#1
#2
#3
#4
#5
Lc-fluorescence Data
Reporter Ions
+
Standard Reference Sample
126 127 128 129 130 131 m/z
TMT Reporter Ion Channels
In another example (Figure 6), 100 µg of three different monoclonal antibodies were deglycosylated using PNGase F glycosidase, glycans were isolated, and each sample pool was divided into two equal parts. Each part was labeled with a different version of the heavy isobaric aminoxyTMTsixplex reagent, and after a quenching and clean-up, the individual samples were combined to yield a single sixplex sample consisting of three separate samples in a duplicate. The sample was then analyzed by direct infusion MS to reveal that two out of three different antibodies analyzed were identical with respect to glycosylation profiles of the three main glycoforms, with the third antibody having substantially higher abundance of the G1F and G2F glycoforms.
Relative quantitation of the three main glycoforms, G0F, G1F, and G2F, was performed by comparing relative peak intensities of the mass reporter peaks in the MS/MS spectra for each glycoform. After signal normalization, we found that the antibody produced in the cell culture contained higher amounts of the G1F and G2F glycoforms than the antibodies obtained from the mouse.
PO64133-EN 0614S

3Thermo Scientific Poster Note • PN-64133-ASMS-EN-0614S
Carbonyl-Reactive Tandem Mass Tag (TMT) Reagents for Mass Spectrometry-Based Quantitative Glycomics Sergei I. Snovida1, Rosa Viner2, John C. Rogers1 1Thermo Fisher Scientific, Rockford, IL; 2Thermo Fisher Scientific, San Jose, CA
Conclusion Increase sample analysis throughput with aminoxyTMT reagents
Overall improvement in MS sensitivity with aminoxyTMT label approach
Structural elements are preserved in labeled glycans
LC-UV/fluorescence and TMT-based quantitation can be complementary
Ideal for analysis of biotherapeutics and biomarker discovery
Acknowledgements We would like to thank the following colleagues and collaborators for critical advice and helpful discussions: Dr. Ryan Bomgarden, Dr. Chris Etienne, Dr. Kay Opperman, Dr. Venky Shivalingappa, and Dr. Julian Saba (Thermo Fisher Scientific); Dr. Kay-Hooi Khoo, Dr. Ming-Yi Ho, Dr. Shui-Hua Wang, and Dr. Chia-Wei Lin (Academia Sinica, Taipei, Taiwan); Dr. Ian Pike and Dr. Karsten Kuhn (Proteome Sciences); Dr. Bernhard Küster, Dr. Hannes Hahne, and Dr. Patrick Neubert (Technische Universität München, Munich, Germany); Dr. Lingjun Li, Dr. Xuefei Zhong, and Dr. Yan Liu (University of Wisconsin, Madison, WI, USA); Dr. Yehia Mechref, Shiyue Zhou, and Yunli Hu (Texas Tech University, Lubbock, TX, USA); Dr. Shonali Paul and Dr. Sanjib Meitei (Premier Biosoft).
Overview Purpose: To demonstrate applications of the new carbonyl-reactive aminoxyTMT reagent in quantitative analysis of carbohydrates by direct infusion and liquid chromatography-coupled mass spectrometry.
Methods: N-glycans released from standard glycoproteins, including several monoclonal antibodies, were individually labeled with the isobaric aminoxyTMT reagents, and combined together for quantitative analysis by mass spectrometry.
Results: Relative quantitation of the labeled glycans from different samples was done by measuring relative peak intensities of the TMT® reporter ions at MS2 or MS3 levels.
Introduction Aberrant glycosylation profiles may reflect abnormal physiological state of a cell, an organ, or an organism as a whole, and may be indicative of a disease state or cancer. Thus, glycans may be used as biomarkers. Additionally, many biotherapeutic drugs are glycoproteins and their activity and efficacy greatly depends on the type and extent of glycosylation. These compounds must be characterized in terms of their glycosylation profiles in both the development and quality control phases of drug development and manufacture.
Accurate quantitation of glycans remains elusive due to the lack of a comprehensive selection of available standards, poor ionization efficiency of carbohydrates relative to other classes of biomolecules, and broad structural heterogeneity of glycomic samples. Recently, we introduced a set of isobaric carbonyl-reactive TMT reagents, Thermo Scientific™ aminoxyTMT™ (Tandem Mass Tag®) Label Reagents (Figure 1), which can react with the reducing end of glycans to form a stable oxime product. The six compounds of the Thermo Scientific™ aminoxyTMTsixplex™ Reagent Set have the same mass (i.e., isobaric) and chemical structure (carbonyl-reactive aminoxy group, spacer arm, and mass reporter). However, the specific distribution of 13C and 15N isotopes on either side of the MS/MS fragmentation site in each reagent results in a unique reporter mass (126–131 Da) in the low m/z region of MS2 spectra. This set of reporter ions is used to measure the relative abundance of labeled molecules in a combined (multiplexed) MS sample representing six different treatment conditions, time points, or replicates. For glycobiology MS applications, the reagents enable quantitative profiling of glycoforms and discovery of glycan biomarkers; they provide improved ionization of glycans for increased sensitivity and increased analytical throughput by sample multiplexing.
In this work, we showcase the use of these reagents for quantitative glycomics by combining our multiplexed TMT-based approach with HILIC LC-MS technique to enable more-sensitive analysis with improved glycome coverage.
Methods Sample Preparation
Bovine thyroglobulin (Sigma-Aldrich) and several monoclonal antibodies (Thermo Fisher Scientific) were reduced, alkylated, and digested with MS-grade trypsin (Thermo Fisher Scientific). Digest mixture was then treated with PNGase F (New England Biolabs) to release N-linked glycans. Following deglycosylation, released glycans were separated from peptides using Oasis® HLB (Waters) solid phase extraction columns. After drying, glycan samples were labeled with aminoxyTMT reagents (Thermo Fisher Scientific) according to manufacturer’s protocol.
Liquid Chromatography
LC-MS experiments were performed in HILIC mode on a Thermo Scientific™ Accucore™ Amide column (2.6µm, 150Å; 75µm×150mm). Mobile phases were 0.1% formic acid in water (A) and 0.1% formic acid in acetonitrile (B). Separation was carried out with a 400 nL/min flowrate using different, sample-dependent gradients.
Mass Spectrometry
For direct infusion experiments, labeled glycan samples were dissolved in 50% acetonitrile solution containing 50 µM NaOH. Samples were analyzed on Thermo Scientific™ Orbitrap Velos Pro™ ion trap and Thermo Scientific™ Orbitrap Fusion™ Tribrid™ mass spectrometers in the positive ion mode.
Data Analysis
All data was processed manually.
FIGURE 1. Chemical structure of aminoxyTMT reagents and labeling reaction scheme.
Results General Features of aminoxyTMT-labeled Glycans
Two types of the reagent are available, Thermo Scientific™ aminoxyTMTzero™ Label Reagents, the light version of the reagent recommended for method development work, and the heavy, isobaric aminoxyTMT sixplex set (Figure 1). When a labeled glycan is subjected to MS/MS fragmentation by HCD, mass reporter region of the label molecule is cleaved, leading to an intense peak in the low m/z region of MS/MS spectrum. For the aminoxyTMTsixplex set, each member of the set produces a mass reporter ion with a unique m/z, thus allowing for relative quantitation of glycoforms across up to six different samples (Figure 3). The carbonyl-reactive alkoxyamine group reacts rapidly with aldehydes and ketones to yield a stable oxime product, which is resistant to hydrolysis over a broad range of experimental conditions.
Comparison of the fragmentation spectra of the sodiated precursors of unlabeled and aminoxyTMT-labeled glycans (Figure 2) shows that the same structurally relevant product ions are produced for both the labeled and the unlabeled glycans, suggesting that structural information is not lost or diminished after labeling with the aminoxyTMT reagent. Therefore, in addition to the mass reporter ions relevant for quantitation, information which can be derived from the MS/MS spectra of the unlabeled glycans is still present here.
Multiplexing Glycomic Samples - Overview
In a typical experiment, up to six separate samples may be analyzed together, which allows lower overall analysis time and minimizes the variations in quantitative reproducibility, as the number of independent sample handling steps is reduced in this workflow (Figure 3). After labeling with aminoxyTMT reagents, unreacted reagents are quenched with acetone and samples are combined. An additional clean-up step using HILIC solid phase extraction material is used to separate the quenched reagent from the labeled glycans. During MS analysis, precursor ions corresponding to the glycoforms of interest are identified and are subjected to MS/MS analysis by HCD fragmentation. Relative peak intensities of the reporter ions observed in the MS/MS spectra are proportional to the relative abundance levels of the selected glycoform in different samples in the set.
Several peaks observed in the low m/z region of MS/MS spectra of the labeled glycans may interfere with accurate quantitative analysis if a low resolution mass spectrometer is used (Figure 3). These peaks are some of the product ions of HexNAc fragmentation, and are thus present in MS/MS spectra of most glycoforms.
Although this may be an issue for low resolution instruments, these interferences are easily resolved and do not pose a problem for accurate quantitation at the lowest resolution settings of a Thermo Scientific™ Orbitrap™ mass spectrometer.
If a Velos Pro ion trap mass spectrometer is used for the analysis, application of a targeted MS3 method (Figure 4) solves this interference problem. First, precursor of interest is isolated and fragmented using CID or HCD fragmentation mode. In the second step, abundant Y1 ions, which still contain intact aminoxyTMT label, are isolated for MS3 HCD. MS3 spectra contain “clean” mass reporter ions and their ratios are now as expected for the sample set.
Multiplexing Glycomic Samples - Examples
Several experiments showcasing the use of these reagents for quantitative analysis of glycans were performed using antibodies as glycan sources. In the first experiment (Figure 5), 100 µg of two anti c-Myc monoclonal antibodies, each coming from a different source, were separately deglycosylated using PNGase F glycosidase, glycans were isolated and each sample was labeled with a different heavy version of the isotopic aminoxyTMT reagent. After quenching and clean-up, the samples were combined and analyzed by direct infusion using a Velos Pro mass spectrometer.
Tandem Mass Tag and TMT are registered trademarks of Proteome Sciences plc. Sigma-Aldrich is a registered trademark of Sigma-Aldrich Co. LLC. Oasis is a registered trademark of Waters Corporation. All other trademarks are the property of Thermo Fisher Scientific and its subsidiaries.
This information is not intended to encourage use of these products in any manners that might infringe the intellectual property rights of others.
FIGURE 4. Targeted MS3 acquisition approach using a Velos Pro ion trap instrument.
FIGURE 5. Comparing glycosylation profiles of two monoclonal antibodies from different sources.
AminoxyTMT Reagent Structure AminoxyTMTsixplex Isobaric Reagents
HCD
+ glycan aminoxyTMT reagent Stable oxime product
Reaction:
122 124 126 128 130 132 134 136m/z
0
10
20
30
40
50
60
70
80
90
1000
10
20
30
40
50
60
70
80
90
100
Rela
tive
Abun
danc
e
126.00
128.00129.00
127.00
130.00131.00122.92121.92 124.00 124.92 135.92131.92 134.00132.92
128.00 129.00
127.00
130.00
131.00126.08
132.00 133.08125.00 134.00123.08 135.17 136.08122.00
NL: 1.30E4btg_ng_native_oxytmt_1_2_5_hilic_50acnsample_1_1ul#6214-6809 RT: 75.02-80.62 AV: 42 F: ITMS + p NSI d Full ms2 [email protected] [100.00-2000.00]
NL: 3.88E2bTg_NG_native_oxyTMT_1_2_5_HILIC_50ACNsample_1_1uL_140219224437#11906-12461 RT: 75.02-80.96 AV: 147 F: ITMS + p NSI d Full ms3 [email protected] [email protected] [100.00-2000.00]
200 400 600 800 1000 1200 1400 1600 1800 2000m/z
0
20
40
60
80
1000
20
40
60
80
100
Rela
tive
Abun
danc
e
0
20
40
60
80
100 891.44
909.08
1336.681024.16682.36 775.08523.40445.20 1145.88 1535.72 1723.92 1916.80523.34
137.92
204.00726.52274.09
669.43 888.52366.17 1050.611723.881212.70872.52 1358.78505.34 1577.87606.43 1852.96930.52
128.00
303.17668.85 891.44 1246.53595.26 1009.61 1422.54367.09 1669.88 1922.80
NL: 1.93E6bTg_NG_native_oxyTMT_1_2_5_HILIC_50ACNsample_1_1uL_140219224437#11906-12461 RT: 75.00-81.00 AV: 148 T: ITMS + p NSI E Full ms [400.00-2000.00]
NL: 7.54E4btg_ng_native_oxytmt_1_2_5_hilic_50acnsample_1_1ul#6214-6809 RT: 75.02-80.62 AV: 42 F: ITMS + p NSI d Full ms2 [email protected] [100.00-2000.00]
NL: 3.88E2bTg_NG_native_oxyTMT_1_2_5_HILIC_50ACNsample_1_1uL_140219224437#11906-12461 RT: 75.02-80.96 AV: 147 F: ITMS + p NSI d Full ms3 [email protected] [email protected] [100.00-2000.00]
MS2 (HCD or CID)
MS3 (HCD)
[M+3H]3+
Y1-ion
“clean” reporter
ions
DDA/targeted
1.4E4
3.9E2 Actual ratios 1:2:5:5:2:1
RT: 25.39 - 99.74
30 35 40 45 50 55 60 65 70 75 80 85 90 95Time (min)
0
5
10
15
20
25
30
35
40
45
50
55
60
65
70
75
80
85
90
95
100
Rela
tive
Abun
danc
e
47.85
76.94
47.92
76.49
77.09
69.73
69.39
63.62 77.2863.49 69.87
69.27
77.67
66.18 77.9261.0578.0076.02
57.0360.04 78.5748.73 56.85
78.9748.8979.6575.50
88.4183.6874.3098.0097.5025.66 84.94 89.2246.4934.5127.87 38.50 43.87
NL: 9.19E6Base Peak MS bTg_NG_native_oxyTMT_1_2_5_HILIC_50ACNsample_1_1uL_140219224437
200 400 600 800 1000 1200 1400 1600 1800 2000m/z
0
20
40
60
80
1000
20
40
60
80
100
Rel
ativ
e A
bund
ance
0
20
40
60
80
100 1118.44915.36
550.24128.12931.36
1136.44
989.40712.28 1309.52532.20
1384.561238.48786.32566.24388.16303.24 1482.64 1630.721743.52 1959.16
1280.52
915.36712.281077.44128.12
550.24
1151.44388.16 931.36728.28 1471.60694.28
786.32 1400.56532.24 1546.60568.24 1644.68168.04 303.24 406.16 1792.80 1927.48712.28
1077.44131.121442.60
915.361239.48550.24 874.32
388.16 1313.521055.76694.28 933.36728.28 1633.641181.48568.24168.08 327.24 1562.64 1806.76
532.20 1952.88
NL: 7.76E2native_TMT128_131_pos_894#5 RT: 0.10 AV: 1 T: ITMS + p ESI E Full ms2 [email protected] [50.00-2000.00]
NL: 2.25E2native_tmt128_131_pos_975#5 RT: 0.11 AV: 1 T: ITMS + p ESI E Full ms2 [email protected] [50.00-2000.00]
NL: 1.79E1native_tmt128_131_pos_1056#4 RT: 0.09 AV: 1 T: ITMS + p ESI E Full ms2 [email protected] [50.00-2000.00]
Reporter ions
HCD
0
20
40
60
80
100
1 2 3
Extracted glycan MS profiles
0
20
40
60
80
100
1 2 3
Reporter ion relative intensities
Culture Mouse
1to1_mix_native_TMT_pos #18 RT: 0.11 AV: 1 NL: 1.82E5T: ITMS + p ESI E Full ms [50.00-2000.00]
840 860 880 900 920 940 960 980 1000 1020 1040 1060 1080 1100 1120m/z
0
5
10
15
20
25
30
35
40
45
50
55
60
65
70
75
80
85
90
95
100
Rel
ativ
e A
bund
ance
893.92
974.92
901.88
904.92882.92 1055.96982.92
963.96913.40 1063.92993.92 1137.44946.92873.44 1044.92 1122.00933.88 1028.40 1076.52860.92831.56 1103.841014.92
Deglycosylate, label, mix, clean
1/10
1/10
Anti-c-Myc hybridoma
IgGs
G0F
G1F
G2F
[M+H+Na]2+
N-glycans N-glycans N-glycans
TMT129 TMT126 TMT127 TMT130 TMT128 TMT131
MS
Combined Sample
3_mAbs_123123 #54 RT: 0.11 AV: 1 NL: 2.41E6T: ITMS + p ESI Full ms [700.00-1500.00]
800 850 900 950 1000 1050 1100 1150 1200m/z
0
5
10
15
20
25
30
35
40
45
50
55
60
65
70
75
80
85
90
95
100
Rel
ativ
e Ab
unda
nce
893.84
974.92
882.84 901.841055.93
904.84 982.84963.92820.84 873.34
792.34 1040.18910.76 954.34 1063.84829.75 1140.10991.84855.67 1198.101098.09 1226.011168.18
G0F
G1F
G2F
3_mAbs_123123_894 #10 RT: 0.10 AV: 1 NL: 5.69E3T: ITMS + p ESI Full ms2 [email protected] [50.00-1500.00]
122 123 124 125 126 127 128 129 130 131 132 133 134 135m/z
0
5
10
15
20
25
30
35
40
45
50
55
60
65
70
75
80
85
90
95
100
Rel
ativ
e A
bund
ance
126.25 131.34128.34130.34
127.34129.34
124.25
132.25125.25 133.25123.25122.25 134.25 135.173_mabs_123123_975 #21 RT: 0.24 AV: 1 NL: 5.48E3T: ITMS + p ESI Full ms2 [email protected] [50.00-1500.00]
122 123 124 125 126 127 128 129 130 131 132 133 134 135 136m/z
0
5
10
15
20
25
30
35
40
45
50
55
60
65
70
75
80
85
90
95
100
Rel
ativ
e A
bund
ance
126.25
129.34
128.34 130.34127.34 131.34
124.17125.25 132.25123.25 133.25122.25 134.25 135.17
3_mabs_123123_1056 #8 RT: 0.10 AV: 1 NL: 1.22E3T: ITMS + p ESI Full ms2 [email protected] [50.00-1500.00]
122 123 124 125 126 127 128 129 130 131 132 133 134 135 136m/z
0
5
10
15
20
25
30
35
40
45
50
55
60
65
70
75
80
85
90
95
100
Re
lativ
e A
bu
nd
an
ce
126.25
129.34
127.25130.34128.34
131.34
124.17 125.25 132.25123.25 133.25122.25 134.17 135.17 136.25
HCD
HCD
HCD
Reporter Ions
Reporter Ions
Reporter Ions
FIGURE 6. Quantitative comparison of glycosylation of several monoclonal antibodies with replicates.
FIGURE 2. Positive ion mode HCD fragmentation of native unlabeled and aminoxyTMT-labeled high-mannose glycans.
100 200 300 400 500 600 700 800 900 1000 1100 1200 1300 1400m/z
0
10
20
30
40
50
60
70
80
90
1000
10
20
30
40
50
60
70
80
90
100
Rel
ativ
e Ab
unda
nce
1036.61
1257.69
874.52671.43
833.521095.61
447.34
907.52550.34 1156.61771.52640.68347.26 994.61599.35226.25 329.26138.17 1300.70 1415.70
1036.44
1054.44671.28131.12851.36
833.32 907.36653.28
979.40625.28 689.28527.20 1156.48817.36347.12 550.24 1211.52401.20303.24203.20 463.20 1400.681272.52
NL: 1.16E4RNAseB_NG_200ug_prot_eq_mL_641#9 RT: 0.10 AV: 1 T: ITMS + p ESI Full ms2 [email protected] [50.00-2000.00]
NL: 5.17E3blf_rnaseb_btg_tmt_pos_780#5 RT: 0.09 AV: 1 T: ITMS + p ESI E Full ms2 [email protected] [50.00-2000.00]
Reporter ions
Y (Na+)
Y (Na+)
Y (Na+)
[M+Na]+B (Na+)
B (Na+)B (Na+)
B (Na+)
0,2AB (Na+)B (Na+)
[M+ Na-reporter-CO]+
C (Na+)
unlabeled
aminoxyTMT Reagent-labeled
Trap-HCD 640.5 m/z [M+2Na]2+
Trap-HCD 779.9 m/z [M+H+Na]2+
0,2A
*
FIGURE 3. Workflow for quantitative glycomics multiplexed experiment.
3_mAbs_123123 #54 RT: 0.11 AV: 1 NL: 2.41E6T: ITMS + p ESI Full ms [700.00-1500.00]
800 850 900 950 1000 1050 1100 1150 1200m/z
0
5
10
15
20
25
30
35
40
45
50
55
60
65
70
75
80
85
90
95
100
Relat
ive Ab
unda
nce
893.84
974.92
882.84 901.841055.93
904.84 982.84963.92820.84 873.34
792.34 1040.18910.76 954.34 1063.84829.75 1140.10991.84855.67 1198.101098.09 1226.011168.18
Unknown Samples
#2 #1 #3 #4 #5
TMT126 TMT127 TMT128 TMT129 TMT130 TMT131 + + + + +
Sixplex Sample
MS
MS/MS
Std
bLf_NG_TMT6_20_1_infusion_OT_HCD45_1093_60000res #1-36 RT: 0.00-0.13 AV: 36 NL: 5.58E5T: FTMS + p ESI Full ms2 [email protected] [50.00-2000.00]
125.5 126.0 126.5 127.0 127.5 128.0 128.5 129.0 129.5 130.0 130.5 131.0 131.5m/z
0
5
10
15
20
25
30
35
40
45
50
55
60
65
70
75
80
85
90
95
100
Rel
ativ
e A
bund
ance
Std
#1
#2
#3
#4
#5
Lc-fluorescence Data
Reporter Ions
+
Standard Reference Sample
126 127 128 129 130 131 m/z
TMT Reporter Ion Channels
In another example (Figure 6), 100 µg of three different monoclonal antibodies were deglycosylated using PNGase F glycosidase, glycans were isolated, and each sample pool was divided into two equal parts. Each part was labeled with a different version of the heavy isobaric aminoxyTMTsixplex reagent, and after a quenching and clean-up, the individual samples were combined to yield a single sixplex sample consisting of three separate samples in a duplicate. The sample was then analyzed by direct infusion MS to reveal that two out of three different antibodies analyzed were identical with respect to glycosylation profiles of the three main glycoforms, with the third antibody having substantially higher abundance of the G1F and G2F glycoforms.
Relative quantitation of the three main glycoforms, G0F, G1F, and G2F, was performed by comparing relative peak intensities of the mass reporter peaks in the MS/MS spectra for each glycoform. After signal normalization, we found that the antibody produced in the cell culture contained higher amounts of the G1F and G2F glycoforms than the antibodies obtained from the mouse.
PO64133-EN 0614S

4 Carbonyl-Reactive Tandem Mass Tag (TMT) Reagents for Mass Spectrometry-Based Quantitative Glycomics
Carbonyl-Reactive Tandem Mass Tag (TMT) Reagents for Mass Spectrometry-Based Quantitative Glycomics Sergei I. Snovida1, Rosa Viner2, John C. Rogers1 1Thermo Fisher Scientific, Rockford, IL; 2Thermo Fisher Scientific, San Jose, CA
Conclusion Increase sample analysis throughput with aminoxyTMT reagents
Overall improvement in MS sensitivity with aminoxyTMT label approach
Structural elements are preserved in labeled glycans
LC-UV/fluorescence and TMT-based quantitation can be complementary
Ideal for analysis of biotherapeutics and biomarker discovery
Acknowledgements We would like to thank the following colleagues and collaborators for critical advice and helpful discussions: Dr. Ryan Bomgarden, Dr. Chris Etienne, Dr. Kay Opperman, Dr. Venky Shivalingappa, and Dr. Julian Saba (Thermo Fisher Scientific); Dr. Kay-Hooi Khoo, Dr. Ming-Yi Ho, Dr. Shui-Hua Wang, and Dr. Chia-Wei Lin (Academia Sinica, Taipei, Taiwan); Dr. Ian Pike and Dr. Karsten Kuhn (Proteome Sciences); Dr. Bernhard Küster, Dr. Hannes Hahne, and Dr. Patrick Neubert (Technische Universität München, Munich, Germany); Dr. Lingjun Li, Dr. Xuefei Zhong, and Dr. Yan Liu (University of Wisconsin, Madison, WI, USA); Dr. Yehia Mechref, Shiyue Zhou, and Yunli Hu (Texas Tech University, Lubbock, TX, USA); Dr. Shonali Paul and Dr. Sanjib Meitei (Premier Biosoft).
Overview Purpose: To demonstrate applications of the new carbonyl-reactive aminoxyTMT reagent in quantitative analysis of carbohydrates by direct infusion and liquid chromatography-coupled mass spectrometry.
Methods: N-glycans released from standard glycoproteins, including several monoclonal antibodies, were individually labeled with the isobaric aminoxyTMT reagents, and combined together for quantitative analysis by mass spectrometry.
Results: Relative quantitation of the labeled glycans from different samples was done by measuring relative peak intensities of the TMT® reporter ions at MS2 or MS3 levels.
Introduction Aberrant glycosylation profiles may reflect abnormal physiological state of a cell, an organ, or an organism as a whole, and may be indicative of a disease state or cancer. Thus, glycans may be used as biomarkers. Additionally, many biotherapeutic drugs are glycoproteins and their activity and efficacy greatly depends on the type and extent of glycosylation. These compounds must be characterized in terms of their glycosylation profiles in both the development and quality control phases of drug development and manufacture.
Accurate quantitation of glycans remains elusive due to the lack of a comprehensive selection of available standards, poor ionization efficiency of carbohydrates relative to other classes of biomolecules, and broad structural heterogeneity of glycomic samples. Recently, we introduced a set of isobaric carbonyl-reactive TMT reagents, Thermo Scientific™ aminoxyTMT™ (Tandem Mass Tag®) Label Reagents (Figure 1), which can react with the reducing end of glycans to form a stable oxime product. The six compounds of the Thermo Scientific™ aminoxyTMTsixplex™ Reagent Set have the same mass (i.e., isobaric) and chemical structure (carbonyl-reactive aminoxy group, spacer arm, and mass reporter). However, the specific distribution of 13C and 15N isotopes on either side of the MS/MS fragmentation site in each reagent results in a unique reporter mass (126–131 Da) in the low m/z region of MS2 spectra. This set of reporter ions is used to measure the relative abundance of labeled molecules in a combined (multiplexed) MS sample representing six different treatment conditions, time points, or replicates. For glycobiology MS applications, the reagents enable quantitative profiling of glycoforms and discovery of glycan biomarkers; they provide improved ionization of glycans for increased sensitivity and increased analytical throughput by sample multiplexing.
In this work, we showcase the use of these reagents for quantitative glycomics by combining our multiplexed TMT-based approach with HILIC LC-MS technique to enable more-sensitive analysis with improved glycome coverage.
Methods Sample Preparation
Bovine thyroglobulin (Sigma-Aldrich) and several monoclonal antibodies (Thermo Fisher Scientific) were reduced, alkylated, and digested with MS-grade trypsin (Thermo Fisher Scientific). Digest mixture was then treated with PNGase F (New England Biolabs) to release N-linked glycans. Following deglycosylation, released glycans were separated from peptides using Oasis® HLB (Waters) solid phase extraction columns. After drying, glycan samples were labeled with aminoxyTMT reagents (Thermo Fisher Scientific) according to manufacturer’s protocol.
Liquid Chromatography
LC-MS experiments were performed in HILIC mode on a Thermo Scientific™ Accucore™ Amide column (2.6µm, 150Å; 75µm×150mm). Mobile phases were 0.1% formic acid in water (A) and 0.1% formic acid in acetonitrile (B). Separation was carried out with a 400 nL/min flowrate using different, sample-dependent gradients.
Mass Spectrometry
For direct infusion experiments, labeled glycan samples were dissolved in 50% acetonitrile solution containing 50 µM NaOH. Samples were analyzed on Thermo Scientific™ Orbitrap Velos Pro™ ion trap and Thermo Scientific™ Orbitrap Fusion™ Tribrid™ mass spectrometers in the positive ion mode.
Data Analysis
All data was processed manually.
FIGURE 1. Chemical structure of aminoxyTMT reagents and labeling reaction scheme.
Results General Features of aminoxyTMT-labeled Glycans
Two types of the reagent are available, Thermo Scientific™ aminoxyTMTzero™ Label Reagents, the light version of the reagent recommended for method development work, and the heavy, isobaric aminoxyTMT sixplex set (Figure 1). When a labeled glycan is subjected to MS/MS fragmentation by HCD, mass reporter region of the label molecule is cleaved, leading to an intense peak in the low m/z region of MS/MS spectrum. For the aminoxyTMTsixplex set, each member of the set produces a mass reporter ion with a unique m/z, thus allowing for relative quantitation of glycoforms across up to six different samples (Figure 3). The carbonyl-reactive alkoxyamine group reacts rapidly with aldehydes and ketones to yield a stable oxime product, which is resistant to hydrolysis over a broad range of experimental conditions.
Comparison of the fragmentation spectra of the sodiated precursors of unlabeled and aminoxyTMT-labeled glycans (Figure 2) shows that the same structurally relevant product ions are produced for both the labeled and the unlabeled glycans, suggesting that structural information is not lost or diminished after labeling with the aminoxyTMT reagent. Therefore, in addition to the mass reporter ions relevant for quantitation, information which can be derived from the MS/MS spectra of the unlabeled glycans is still present here.
Multiplexing Glycomic Samples - Overview
In a typical experiment, up to six separate samples may be analyzed together, which allows lower overall analysis time and minimizes the variations in quantitative reproducibility, as the number of independent sample handling steps is reduced in this workflow (Figure 3). After labeling with aminoxyTMT reagents, unreacted reagents are quenched with acetone and samples are combined. An additional clean-up step using HILIC solid phase extraction material is used to separate the quenched reagent from the labeled glycans. During MS analysis, precursor ions corresponding to the glycoforms of interest are identified and are subjected to MS/MS analysis by HCD fragmentation. Relative peak intensities of the reporter ions observed in the MS/MS spectra are proportional to the relative abundance levels of the selected glycoform in different samples in the set.
Several peaks observed in the low m/z region of MS/MS spectra of the labeled glycans may interfere with accurate quantitative analysis if a low resolution mass spectrometer is used (Figure 3). These peaks are some of the product ions of HexNAc fragmentation, and are thus present in MS/MS spectra of most glycoforms.
Although this may be an issue for low resolution instruments, these interferences are easily resolved and do not pose a problem for accurate quantitation at the lowest resolution settings of a Thermo Scientific™ Orbitrap™ mass spectrometer.
If a Velos Pro ion trap mass spectrometer is used for the analysis, application of a targeted MS3 method (Figure 4) solves this interference problem. First, precursor of interest is isolated and fragmented using CID or HCD fragmentation mode. In the second step, abundant Y1 ions, which still contain intact aminoxyTMT label, are isolated for MS3 HCD. MS3 spectra contain “clean” mass reporter ions and their ratios are now as expected for the sample set.
Multiplexing Glycomic Samples - Examples
Several experiments showcasing the use of these reagents for quantitative analysis of glycans were performed using antibodies as glycan sources. In the first experiment (Figure 5), 100 µg of two anti c-Myc monoclonal antibodies, each coming from a different source, were separately deglycosylated using PNGase F glycosidase, glycans were isolated and each sample was labeled with a different heavy version of the isotopic aminoxyTMT reagent. After quenching and clean-up, the samples were combined and analyzed by direct infusion using a Velos Pro mass spectrometer.
Tandem Mass Tag and TMT are registered trademarks of Proteome Sciences plc. Sigma-Aldrich is a registered trademark of Sigma-Aldrich Co. LLC. Oasis is a registered trademark of Waters Corporation. All other trademarks are the property of Thermo Fisher Scientific and its subsidiaries.
This information is not intended to encourage use of these products in any manners that might infringe the intellectual property rights of others.
FIGURE 4. Targeted MS3 acquisition approach using a Velos Pro ion trap instrument.
FIGURE 5. Comparing glycosylation profiles of two monoclonal antibodies from different sources.
AminoxyTMT Reagent Structure AminoxyTMTsixplex Isobaric Reagents
HCD
+ glycan aminoxyTMT reagent Stable oxime product
Reaction:
122 124 126 128 130 132 134 136m/z
0
10
20
30
40
50
60
70
80
90
1000
10
20
30
40
50
60
70
80
90
100
Rela
tive
Abun
danc
e
126.00
128.00129.00
127.00
130.00131.00122.92121.92 124.00 124.92 135.92131.92 134.00132.92
128.00 129.00
127.00
130.00
131.00126.08
132.00 133.08125.00 134.00123.08 135.17 136.08122.00
NL: 1.30E4btg_ng_native_oxytmt_1_2_5_hilic_50acnsample_1_1ul#6214-6809 RT: 75.02-80.62 AV: 42 F: ITMS + p NSI d Full ms2 [email protected] [100.00-2000.00]
NL: 3.88E2bTg_NG_native_oxyTMT_1_2_5_HILIC_50ACNsample_1_1uL_140219224437#11906-12461 RT: 75.02-80.96 AV: 147 F: ITMS + p NSI d Full ms3 [email protected] [email protected] [100.00-2000.00]
200 400 600 800 1000 1200 1400 1600 1800 2000m/z
0
20
40
60
80
1000
20
40
60
80
100
Rela
tive
Abun
danc
e
0
20
40
60
80
100 891.44
909.08
1336.681024.16682.36 775.08523.40445.20 1145.88 1535.72 1723.92 1916.80523.34
137.92
204.00726.52274.09
669.43 888.52366.17 1050.611723.881212.70872.52 1358.78505.34 1577.87606.43 1852.96930.52
128.00
303.17668.85 891.44 1246.53595.26 1009.61 1422.54367.09 1669.88 1922.80
NL: 1.93E6bTg_NG_native_oxyTMT_1_2_5_HILIC_50ACNsample_1_1uL_140219224437#11906-12461 RT: 75.00-81.00 AV: 148 T: ITMS + p NSI E Full ms [400.00-2000.00]
NL: 7.54E4btg_ng_native_oxytmt_1_2_5_hilic_50acnsample_1_1ul#6214-6809 RT: 75.02-80.62 AV: 42 F: ITMS + p NSI d Full ms2 [email protected] [100.00-2000.00]
NL: 3.88E2bTg_NG_native_oxyTMT_1_2_5_HILIC_50ACNsample_1_1uL_140219224437#11906-12461 RT: 75.02-80.96 AV: 147 F: ITMS + p NSI d Full ms3 [email protected] [email protected] [100.00-2000.00]
MS2 (HCD or CID)
MS3 (HCD)
[M+3H]3+
Y1-ion
“clean” reporter
ions
DDA/targeted
1.4E4
3.9E2 Actual ratios 1:2:5:5:2:1
RT: 25.39 - 99.74
30 35 40 45 50 55 60 65 70 75 80 85 90 95Time (min)
0
5
10
15
20
25
30
35
40
45
50
55
60
65
70
75
80
85
90
95
100
Rela
tive
Abun
danc
e
47.85
76.94
47.92
76.49
77.09
69.73
69.39
63.62 77.2863.49 69.87
69.27
77.67
66.18 77.9261.0578.0076.02
57.0360.04 78.5748.73 56.85
78.9748.8979.6575.50
88.4183.6874.3098.0097.5025.66 84.94 89.2246.4934.5127.87 38.50 43.87
NL: 9.19E6Base Peak MS bTg_NG_native_oxyTMT_1_2_5_HILIC_50ACNsample_1_1uL_140219224437
200 400 600 800 1000 1200 1400 1600 1800 2000m/z
0
20
40
60
80
1000
20
40
60
80
100
Rel
ativ
e A
bund
ance
0
20
40
60
80
100 1118.44915.36
550.24128.12931.36
1136.44
989.40712.28 1309.52532.20
1384.561238.48786.32566.24388.16303.24 1482.64 1630.721743.52 1959.16
1280.52
915.36712.281077.44128.12
550.24
1151.44388.16 931.36728.28 1471.60694.28
786.32 1400.56532.24 1546.60568.24 1644.68168.04 303.24 406.16 1792.80 1927.48712.28
1077.44131.121442.60
915.361239.48550.24 874.32
388.16 1313.521055.76694.28 933.36728.28 1633.641181.48568.24168.08 327.24 1562.64 1806.76
532.20 1952.88
NL: 7.76E2native_TMT128_131_pos_894#5 RT: 0.10 AV: 1 T: ITMS + p ESI E Full ms2 [email protected] [50.00-2000.00]
NL: 2.25E2native_tmt128_131_pos_975#5 RT: 0.11 AV: 1 T: ITMS + p ESI E Full ms2 [email protected] [50.00-2000.00]
NL: 1.79E1native_tmt128_131_pos_1056#4 RT: 0.09 AV: 1 T: ITMS + p ESI E Full ms2 [email protected] [50.00-2000.00]
Reporter ions
HCD
0
20
40
60
80
100
1 2 3
Extracted glycan MS profiles
0
20
40
60
80
100
1 2 3
Reporter ion relative intensities
Culture Mouse
1to1_mix_native_TMT_pos #18 RT: 0.11 AV: 1 NL: 1.82E5T: ITMS + p ESI E Full ms [50.00-2000.00]
840 860 880 900 920 940 960 980 1000 1020 1040 1060 1080 1100 1120m/z
0
5
10
15
20
25
30
35
40
45
50
55
60
65
70
75
80
85
90
95
100
Rel
ativ
e A
bund
ance
893.92
974.92
901.88
904.92882.92 1055.96982.92
963.96913.40 1063.92993.92 1137.44946.92873.44 1044.92 1122.00933.88 1028.40 1076.52860.92831.56 1103.841014.92
Deglycosylate, label, mix, clean
1/10
1/10
Anti-c-Myc hybridoma
IgGs
G0F
G1F
G2F
[M+H+Na]2+
N-glycans N-glycans N-glycans
TMT129 TMT126 TMT127 TMT130 TMT128 TMT131
MS
Combined Sample
3_mAbs_123123 #54 RT: 0.11 AV: 1 NL: 2.41E6T: ITMS + p ESI Full ms [700.00-1500.00]
800 850 900 950 1000 1050 1100 1150 1200m/z
0
5
10
15
20
25
30
35
40
45
50
55
60
65
70
75
80
85
90
95
100
Rel
ativ
e Ab
unda
nce
893.84
974.92
882.84 901.841055.93
904.84 982.84963.92820.84 873.34
792.34 1040.18910.76 954.34 1063.84829.75 1140.10991.84855.67 1198.101098.09 1226.011168.18
G0F
G1F
G2F
3_mAbs_123123_894 #10 RT: 0.10 AV: 1 NL: 5.69E3T: ITMS + p ESI Full ms2 [email protected] [50.00-1500.00]
122 123 124 125 126 127 128 129 130 131 132 133 134 135m/z
0
5
10
15
20
25
30
35
40
45
50
55
60
65
70
75
80
85
90
95
100
Rel
ativ
e A
bund
ance
126.25 131.34128.34130.34
127.34129.34
124.25
132.25125.25 133.25123.25122.25 134.25 135.173_mabs_123123_975 #21 RT: 0.24 AV: 1 NL: 5.48E3T: ITMS + p ESI Full ms2 [email protected] [50.00-1500.00]
122 123 124 125 126 127 128 129 130 131 132 133 134 135 136m/z
0
5
10
15
20
25
30
35
40
45
50
55
60
65
70
75
80
85
90
95
100
Rel
ativ
e A
bund
ance
126.25
129.34
128.34 130.34127.34 131.34
124.17125.25 132.25123.25 133.25122.25 134.25 135.17
3_mabs_123123_1056 #8 RT: 0.10 AV: 1 NL: 1.22E3T: ITMS + p ESI Full ms2 [email protected] [50.00-1500.00]
122 123 124 125 126 127 128 129 130 131 132 133 134 135 136m/z
0
5
10
15
20
25
30
35
40
45
50
55
60
65
70
75
80
85
90
95
100
Re
lativ
e A
bu
nd
an
ce
126.25
129.34
127.25130.34128.34
131.34
124.17 125.25 132.25123.25 133.25122.25 134.17 135.17 136.25
HCD
HCD
HCD
Reporter Ions
Reporter Ions
Reporter Ions
FIGURE 6. Quantitative comparison of glycosylation of several monoclonal antibodies with replicates.
FIGURE 2. Positive ion mode HCD fragmentation of native unlabeled and aminoxyTMT-labeled high-mannose glycans.
100 200 300 400 500 600 700 800 900 1000 1100 1200 1300 1400m/z
0
10
20
30
40
50
60
70
80
90
1000
10
20
30
40
50
60
70
80
90
100
Rel
ativ
e Ab
unda
nce
1036.61
1257.69
874.52671.43
833.521095.61
447.34
907.52550.34 1156.61771.52640.68347.26 994.61599.35226.25 329.26138.17 1300.70 1415.70
1036.44
1054.44671.28131.12851.36
833.32 907.36653.28
979.40625.28 689.28527.20 1156.48817.36347.12 550.24 1211.52401.20303.24203.20 463.20 1400.681272.52
NL: 1.16E4RNAseB_NG_200ug_prot_eq_mL_641#9 RT: 0.10 AV: 1 T: ITMS + p ESI Full ms2 [email protected] [50.00-2000.00]
NL: 5.17E3blf_rnaseb_btg_tmt_pos_780#5 RT: 0.09 AV: 1 T: ITMS + p ESI E Full ms2 [email protected] [50.00-2000.00]
Reporter ions
Y (Na+)
Y (Na+)
Y (Na+)
[M+Na]+B (Na+)
B (Na+)B (Na+)
B (Na+)
0,2AB (Na+)B (Na+)
[M+ Na-reporter-CO]+
C (Na+)
unlabeled
aminoxyTMT Reagent-labeled
Trap-HCD 640.5 m/z [M+2Na]2+
Trap-HCD 779.9 m/z [M+H+Na]2+
0,2A
*
FIGURE 3. Workflow for quantitative glycomics multiplexed experiment.
3_mAbs_123123 #54 RT: 0.11 AV: 1 NL: 2.41E6T: ITMS + p ESI Full ms [700.00-1500.00]
800 850 900 950 1000 1050 1100 1150 1200m/z
0
5
10
15
20
25
30
35
40
45
50
55
60
65
70
75
80
85
90
95
100
Relat
ive Ab
unda
nce
893.84
974.92
882.84 901.841055.93
904.84 982.84963.92820.84 873.34
792.34 1040.18910.76 954.34 1063.84829.75 1140.10991.84855.67 1198.101098.09 1226.011168.18
Unknown Samples
#2 #1 #3 #4 #5
TMT126 TMT127 TMT128 TMT129 TMT130 TMT131 + + + + +
Sixplex Sample
MS
MS/MS
Std
bLf_NG_TMT6_20_1_infusion_OT_HCD45_1093_60000res #1-36 RT: 0.00-0.13 AV: 36 NL: 5.58E5T: FTMS + p ESI Full ms2 [email protected] [50.00-2000.00]
125.5 126.0 126.5 127.0 127.5 128.0 128.5 129.0 129.5 130.0 130.5 131.0 131.5m/z
0
5
10
15
20
25
30
35
40
45
50
55
60
65
70
75
80
85
90
95
100
Rel
ativ
e A
bund
ance
Std
#1
#2
#3
#4
#5
Lc-fluorescence Data
Reporter Ions
+
Standard Reference Sample
126 127 128 129 130 131 m/z
TMT Reporter Ion Channels
In another example (Figure 6), 100 µg of three different monoclonal antibodies were deglycosylated using PNGase F glycosidase, glycans were isolated, and each sample pool was divided into two equal parts. Each part was labeled with a different version of the heavy isobaric aminoxyTMTsixplex reagent, and after a quenching and clean-up, the individual samples were combined to yield a single sixplex sample consisting of three separate samples in a duplicate. The sample was then analyzed by direct infusion MS to reveal that two out of three different antibodies analyzed were identical with respect to glycosylation profiles of the three main glycoforms, with the third antibody having substantially higher abundance of the G1F and G2F glycoforms.
Relative quantitation of the three main glycoforms, G0F, G1F, and G2F, was performed by comparing relative peak intensities of the mass reporter peaks in the MS/MS spectra for each glycoform. After signal normalization, we found that the antibody produced in the cell culture contained higher amounts of the G1F and G2F glycoforms than the antibodies obtained from the mouse.
PO64133-EN 0614S
5Thermo Scientific Poster Note • PN-64133-ASMS-EN-0614S
Carbonyl-Reactive Tandem Mass Tag (TMT) Reagents for Mass Spectrometry-Based Quantitative Glycomics Sergei I. Snovida1, Rosa Viner2, John C. Rogers1 1Thermo Fisher Scientific, Rockford, IL; 2Thermo Fisher Scientific, San Jose, CA
Conclusion Increase sample analysis throughput with aminoxyTMT reagents
Overall improvement in MS sensitivity with aminoxyTMT label approach
Structural elements are preserved in labeled glycans
LC-UV/fluorescence and TMT-based quantitation can be complementary
Ideal for analysis of biotherapeutics and biomarker discovery
Acknowledgements We would like to thank the following colleagues and collaborators for critical advice and helpful discussions: Dr. Ryan Bomgarden, Dr. Chris Etienne, Dr. Kay Opperman, Dr. Venky Shivalingappa, and Dr. Julian Saba (Thermo Fisher Scientific); Dr. Kay-Hooi Khoo, Dr. Ming-Yi Ho, Dr. Shui-Hua Wang, and Dr. Chia-Wei Lin (Academia Sinica, Taipei, Taiwan); Dr. Ian Pike and Dr. Karsten Kuhn (Proteome Sciences); Dr. Bernhard Küster, Dr. Hannes Hahne, and Dr. Patrick Neubert (Technische Universität München, Munich, Germany); Dr. Lingjun Li, Dr. Xuefei Zhong, and Dr. Yan Liu (University of Wisconsin, Madison, WI, USA); Dr. Yehia Mechref, Shiyue Zhou, and Yunli Hu (Texas Tech University, Lubbock, TX, USA); Dr. Shonali Paul and Dr. Sanjib Meitei (Premier Biosoft).
Overview Purpose: To demonstrate applications of the new carbonyl-reactive aminoxyTMT reagent in quantitative analysis of carbohydrates by direct infusion and liquid chromatography-coupled mass spectrometry.
Methods: N-glycans released from standard glycoproteins, including several monoclonal antibodies, were individually labeled with the isobaric aminoxyTMT reagents, and combined together for quantitative analysis by mass spectrometry.
Results: Relative quantitation of the labeled glycans from different samples was done by measuring relative peak intensities of the TMT® reporter ions at MS2 or MS3 levels.
Introduction Aberrant glycosylation profiles may reflect abnormal physiological state of a cell, an organ, or an organism as a whole, and may be indicative of a disease state or cancer. Thus, glycans may be used as biomarkers. Additionally, many biotherapeutic drugs are glycoproteins and their activity and efficacy greatly depends on the type and extent of glycosylation. These compounds must be characterized in terms of their glycosylation profiles in both the development and quality control phases of drug development and manufacture.
Accurate quantitation of glycans remains elusive due to the lack of a comprehensive selection of available standards, poor ionization efficiency of carbohydrates relative to other classes of biomolecules, and broad structural heterogeneity of glycomic samples. Recently, we introduced a set of isobaric carbonyl-reactive TMT reagents, Thermo Scientific™ aminoxyTMT™ (Tandem Mass Tag®) Label Reagents (Figure 1), which can react with the reducing end of glycans to form a stable oxime product. The six compounds of the Thermo Scientific™ aminoxyTMTsixplex™ Reagent Set have the same mass (i.e., isobaric) and chemical structure (carbonyl-reactive aminoxy group, spacer arm, and mass reporter). However, the specific distribution of 13C and 15N isotopes on either side of the MS/MS fragmentation site in each reagent results in a unique reporter mass (126–131 Da) in the low m/z region of MS2 spectra. This set of reporter ions is used to measure the relative abundance of labeled molecules in a combined (multiplexed) MS sample representing six different treatment conditions, time points, or replicates. For glycobiology MS applications, the reagents enable quantitative profiling of glycoforms and discovery of glycan biomarkers; they provide improved ionization of glycans for increased sensitivity and increased analytical throughput by sample multiplexing.
In this work, we showcase the use of these reagents for quantitative glycomics by combining our multiplexed TMT-based approach with HILIC LC-MS technique to enable more-sensitive analysis with improved glycome coverage.
Methods Sample Preparation
Bovine thyroglobulin (Sigma-Aldrich) and several monoclonal antibodies (Thermo Fisher Scientific) were reduced, alkylated, and digested with MS-grade trypsin (Thermo Fisher Scientific). Digest mixture was then treated with PNGase F (New England Biolabs) to release N-linked glycans. Following deglycosylation, released glycans were separated from peptides using Oasis® HLB (Waters) solid phase extraction columns. After drying, glycan samples were labeled with aminoxyTMT reagents (Thermo Fisher Scientific) according to manufacturer’s protocol.
Liquid Chromatography
LC-MS experiments were performed in HILIC mode on a Thermo Scientific™ Accucore™ Amide column (2.6µm, 150Å; 75µm×150mm). Mobile phases were 0.1% formic acid in water (A) and 0.1% formic acid in acetonitrile (B). Separation was carried out with a 400 nL/min flowrate using different, sample-dependent gradients.
Mass Spectrometry
For direct infusion experiments, labeled glycan samples were dissolved in 50% acetonitrile solution containing 50 µM NaOH. Samples were analyzed on Thermo Scientific™ Orbitrap Velos Pro™ ion trap and Thermo Scientific™ Orbitrap Fusion™ Tribrid™ mass spectrometers in the positive ion mode.
Data Analysis
All data was processed manually.
FIGURE 1. Chemical structure of aminoxyTMT reagents and labeling reaction scheme.
Results General Features of aminoxyTMT-labeled Glycans
Two types of the reagent are available, Thermo Scientific™ aminoxyTMTzero™ Label Reagents, the light version of the reagent recommended for method development work, and the heavy, isobaric aminoxyTMT sixplex set (Figure 1). When a labeled glycan is subjected to MS/MS fragmentation by HCD, mass reporter region of the label molecule is cleaved, leading to an intense peak in the low m/z region of MS/MS spectrum. For the aminoxyTMTsixplex set, each member of the set produces a mass reporter ion with a unique m/z, thus allowing for relative quantitation of glycoforms across up to six different samples (Figure 3). The carbonyl-reactive alkoxyamine group reacts rapidly with aldehydes and ketones to yield a stable oxime product, which is resistant to hydrolysis over a broad range of experimental conditions.
Comparison of the fragmentation spectra of the sodiated precursors of unlabeled and aminoxyTMT-labeled glycans (Figure 2) shows that the same structurally relevant product ions are produced for both the labeled and the unlabeled glycans, suggesting that structural information is not lost or diminished after labeling with the aminoxyTMT reagent. Therefore, in addition to the mass reporter ions relevant for quantitation, information which can be derived from the MS/MS spectra of the unlabeled glycans is still present here.
Multiplexing Glycomic Samples - Overview
In a typical experiment, up to six separate samples may be analyzed together, which allows lower overall analysis time and minimizes the variations in quantitative reproducibility, as the number of independent sample handling steps is reduced in this workflow (Figure 3). After labeling with aminoxyTMT reagents, unreacted reagents are quenched with acetone and samples are combined. An additional clean-up step using HILIC solid phase extraction material is used to separate the quenched reagent from the labeled glycans. During MS analysis, precursor ions corresponding to the glycoforms of interest are identified and are subjected to MS/MS analysis by HCD fragmentation. Relative peak intensities of the reporter ions observed in the MS/MS spectra are proportional to the relative abundance levels of the selected glycoform in different samples in the set.
Several peaks observed in the low m/z region of MS/MS spectra of the labeled glycans may interfere with accurate quantitative analysis if a low resolution mass spectrometer is used (Figure 3). These peaks are some of the product ions of HexNAc fragmentation, and are thus present in MS/MS spectra of most glycoforms.
Although this may be an issue for low resolution instruments, these interferences are easily resolved and do not pose a problem for accurate quantitation at the lowest resolution settings of a Thermo Scientific™ Orbitrap™ mass spectrometer.
If a Velos Pro ion trap mass spectrometer is used for the analysis, application of a targeted MS3 method (Figure 4) solves this interference problem. First, precursor of interest is isolated and fragmented using CID or HCD fragmentation mode. In the second step, abundant Y1 ions, which still contain intact aminoxyTMT label, are isolated for MS3 HCD. MS3 spectra contain “clean” mass reporter ions and their ratios are now as expected for the sample set.
Multiplexing Glycomic Samples - Examples
Several experiments showcasing the use of these reagents for quantitative analysis of glycans were performed using antibodies as glycan sources. In the first experiment (Figure 5), 100 µg of two anti c-Myc monoclonal antibodies, each coming from a different source, were separately deglycosylated using PNGase F glycosidase, glycans were isolated and each sample was labeled with a different heavy version of the isotopic aminoxyTMT reagent. After quenching and clean-up, the samples were combined and analyzed by direct infusion using a Velos Pro mass spectrometer.
Tandem Mass Tag and TMT are registered trademarks of Proteome Sciences plc. Sigma-Aldrich is a registered trademark of Sigma-Aldrich Co. LLC. Oasis is a registered trademark of Waters Corporation. All other trademarks are the property of Thermo Fisher Scientific and its subsidiaries.
This information is not intended to encourage use of these products in any manners that might infringe the intellectual property rights of others.
FIGURE 4. Targeted MS3 acquisition approach using a Velos Pro ion trap instrument.
FIGURE 5. Comparing glycosylation profiles of two monoclonal antibodies from different sources.
AminoxyTMT Reagent Structure AminoxyTMTsixplex Isobaric Reagents
HCD
+ glycan aminoxyTMT reagent Stable oxime product
Reaction:
122 124 126 128 130 132 134 136m/z
0
10
20
30
40
50
60
70
80
90
1000
10
20
30
40
50
60
70
80
90
100
Rela
tive
Abun
danc
e
126.00
128.00129.00
127.00
130.00131.00122.92121.92 124.00 124.92 135.92131.92 134.00132.92
128.00 129.00
127.00
130.00
131.00126.08
132.00 133.08125.00 134.00123.08 135.17 136.08122.00
NL: 1.30E4btg_ng_native_oxytmt_1_2_5_hilic_50acnsample_1_1ul#6214-6809 RT: 75.02-80.62 AV: 42 F: ITMS + p NSI d Full ms2 [email protected] [100.00-2000.00]
NL: 3.88E2bTg_NG_native_oxyTMT_1_2_5_HILIC_50ACNsample_1_1uL_140219224437#11906-12461 RT: 75.02-80.96 AV: 147 F: ITMS + p NSI d Full ms3 [email protected] [email protected] [100.00-2000.00]
200 400 600 800 1000 1200 1400 1600 1800 2000m/z
0
20
40
60
80
1000
20
40
60
80
100
Rela
tive
Abun
danc
e
0
20
40
60
80
100 891.44
909.08
1336.681024.16682.36 775.08523.40445.20 1145.88 1535.72 1723.92 1916.80523.34
137.92
204.00726.52274.09
669.43 888.52366.17 1050.611723.881212.70872.52 1358.78505.34 1577.87606.43 1852.96930.52
128.00
303.17668.85 891.44 1246.53595.26 1009.61 1422.54367.09 1669.88 1922.80
NL: 1.93E6bTg_NG_native_oxyTMT_1_2_5_HILIC_50ACNsample_1_1uL_140219224437#11906-12461 RT: 75.00-81.00 AV: 148 T: ITMS + p NSI E Full ms [400.00-2000.00]
NL: 7.54E4btg_ng_native_oxytmt_1_2_5_hilic_50acnsample_1_1ul#6214-6809 RT: 75.02-80.62 AV: 42 F: ITMS + p NSI d Full ms2 [email protected] [100.00-2000.00]
NL: 3.88E2bTg_NG_native_oxyTMT_1_2_5_HILIC_50ACNsample_1_1uL_140219224437#11906-12461 RT: 75.02-80.96 AV: 147 F: ITMS + p NSI d Full ms3 [email protected] [email protected] [100.00-2000.00]
MS2 (HCD or CID)
MS3 (HCD)
[M+3H]3+
Y1-ion
“clean” reporter
ions
DDA/targeted
1.4E4
3.9E2 Actual ratios 1:2:5:5:2:1
RT: 25.39 - 99.74
30 35 40 45 50 55 60 65 70 75 80 85 90 95Time (min)
0
5
10
15
20
25
30
35
40
45
50
55
60
65
70
75
80
85
90
95
100
Rela
tive
Abun
danc
e
47.85
76.94
47.92
76.49
77.09
69.73
69.39
63.62 77.2863.49 69.87
69.27
77.67
66.18 77.9261.0578.0076.02
57.0360.04 78.5748.73 56.85
78.9748.8979.6575.50
88.4183.6874.3098.0097.5025.66 84.94 89.2246.4934.5127.87 38.50 43.87
NL: 9.19E6Base Peak MS bTg_NG_native_oxyTMT_1_2_5_HILIC_50ACNsample_1_1uL_140219224437
200 400 600 800 1000 1200 1400 1600 1800 2000m/z
0
20
40
60
80
1000
20
40
60
80
100
Rel
ativ
e A
bund
ance
0
20
40
60
80
100 1118.44915.36
550.24128.12931.36
1136.44
989.40712.28 1309.52532.20
1384.561238.48786.32566.24388.16303.24 1482.64 1630.721743.52 1959.16
1280.52
915.36712.281077.44128.12
550.24
1151.44388.16 931.36728.28 1471.60694.28
786.32 1400.56532.24 1546.60568.24 1644.68168.04 303.24 406.16 1792.80 1927.48712.28
1077.44131.121442.60
915.361239.48550.24 874.32
388.16 1313.521055.76694.28 933.36728.28 1633.641181.48568.24168.08 327.24 1562.64 1806.76
532.20 1952.88
NL: 7.76E2native_TMT128_131_pos_894#5 RT: 0.10 AV: 1 T: ITMS + p ESI E Full ms2 [email protected] [50.00-2000.00]
NL: 2.25E2native_tmt128_131_pos_975#5 RT: 0.11 AV: 1 T: ITMS + p ESI E Full ms2 [email protected] [50.00-2000.00]
NL: 1.79E1native_tmt128_131_pos_1056#4 RT: 0.09 AV: 1 T: ITMS + p ESI E Full ms2 [email protected] [50.00-2000.00]
Reporter ions
HCD
0
20
40
60
80
100
1 2 3
Extracted glycan MS profiles
0
20
40
60
80
100
1 2 3
Reporter ion relative intensities
Culture Mouse
1to1_mix_native_TMT_pos #18 RT: 0.11 AV: 1 NL: 1.82E5T: ITMS + p ESI E Full ms [50.00-2000.00]
840 860 880 900 920 940 960 980 1000 1020 1040 1060 1080 1100 1120m/z
0
5
10
15
20
25
30
35
40
45
50
55
60
65
70
75
80
85
90
95
100
Rel
ativ
e A
bund
ance
893.92
974.92
901.88
904.92882.92 1055.96982.92
963.96913.40 1063.92993.92 1137.44946.92873.44 1044.92 1122.00933.88 1028.40 1076.52860.92831.56 1103.841014.92
Deglycosylate, label, mix, clean
1/10
1/10
Anti-c-Myc hybridoma
IgGs
G0F
G1F
G2F
[M+H+Na]2+
N-glycans N-glycans N-glycans
TMT129 TMT126 TMT127 TMT130 TMT128 TMT131
MS
Combined Sample
3_mAbs_123123 #54 RT: 0.11 AV: 1 NL: 2.41E6T: ITMS + p ESI Full ms [700.00-1500.00]
800 850 900 950 1000 1050 1100 1150 1200m/z
0
5
10
15
20
25
30
35
40
45
50
55
60
65
70
75
80
85
90
95
100
Rel
ativ
e Ab
unda
nce
893.84
974.92
882.84 901.841055.93
904.84 982.84963.92820.84 873.34
792.34 1040.18910.76 954.34 1063.84829.75 1140.10991.84855.67 1198.101098.09 1226.011168.18
G0F
G1F
G2F
3_mAbs_123123_894 #10 RT: 0.10 AV: 1 NL: 5.69E3T: ITMS + p ESI Full ms2 [email protected] [50.00-1500.00]
122 123 124 125 126 127 128 129 130 131 132 133 134 135m/z
0
5
10
15
20
25
30
35
40
45
50
55
60
65
70
75
80
85
90
95
100
Rel
ativ
e A
bund
ance
126.25 131.34128.34130.34
127.34129.34
124.25
132.25125.25 133.25123.25122.25 134.25 135.173_mabs_123123_975 #21 RT: 0.24 AV: 1 NL: 5.48E3T: ITMS + p ESI Full ms2 [email protected] [50.00-1500.00]
122 123 124 125 126 127 128 129 130 131 132 133 134 135 136m/z
0
5
10
15
20
25
30
35
40
45
50
55
60
65
70
75
80
85
90
95
100
Rel
ativ
e A
bund
ance
126.25
129.34
128.34 130.34127.34 131.34
124.17125.25 132.25123.25 133.25122.25 134.25 135.17
3_mabs_123123_1056 #8 RT: 0.10 AV: 1 NL: 1.22E3T: ITMS + p ESI Full ms2 [email protected] [50.00-1500.00]
122 123 124 125 126 127 128 129 130 131 132 133 134 135 136m/z
0
5
10
15
20
25
30
35
40
45
50
55
60
65
70
75
80
85
90
95
100
Re
lativ
e A
bu
nd
an
ce
126.25
129.34
127.25130.34128.34
131.34
124.17 125.25 132.25123.25 133.25122.25 134.17 135.17 136.25
HCD
HCD
HCD
Reporter Ions
Reporter Ions
Reporter Ions
FIGURE 6. Quantitative comparison of glycosylation of several monoclonal antibodies with replicates.
FIGURE 2. Positive ion mode HCD fragmentation of native unlabeled and aminoxyTMT-labeled high-mannose glycans.
100 200 300 400 500 600 700 800 900 1000 1100 1200 1300 1400m/z
0
10
20
30
40
50
60
70
80
90
1000
10
20
30
40
50
60
70
80
90
100
Rel
ativ
e Ab
unda
nce
1036.61
1257.69
874.52671.43
833.521095.61
447.34
907.52550.34 1156.61771.52640.68347.26 994.61599.35226.25 329.26138.17 1300.70 1415.70
1036.44
1054.44671.28131.12851.36
833.32 907.36653.28
979.40625.28 689.28527.20 1156.48817.36347.12 550.24 1211.52401.20303.24203.20 463.20 1400.681272.52
NL: 1.16E4RNAseB_NG_200ug_prot_eq_mL_641#9 RT: 0.10 AV: 1 T: ITMS + p ESI Full ms2 [email protected] [50.00-2000.00]
NL: 5.17E3blf_rnaseb_btg_tmt_pos_780#5 RT: 0.09 AV: 1 T: ITMS + p ESI E Full ms2 [email protected] [50.00-2000.00]
Reporter ions
Y (Na+)
Y (Na+)
Y (Na+)
[M+Na]+B (Na+)
B (Na+)B (Na+)
B (Na+)
0,2AB (Na+)B (Na+)
[M+ Na-reporter-CO]+
C (Na+)
unlabeled
aminoxyTMT Reagent-labeled
Trap-HCD 640.5 m/z [M+2Na]2+
Trap-HCD 779.9 m/z [M+H+Na]2+
0,2A
*
FIGURE 3. Workflow for quantitative glycomics multiplexed experiment.
3_mAbs_123123 #54 RT: 0.11 AV: 1 NL: 2.41E6T: ITMS + p ESI Full ms [700.00-1500.00]
800 850 900 950 1000 1050 1100 1150 1200m/z
0
5
10
15
20
25
30
35
40
45
50
55
60
65
70
75
80
85
90
95
100
Relat
ive Ab
unda
nce
893.84
974.92
882.84 901.841055.93
904.84 982.84963.92820.84 873.34
792.34 1040.18910.76 954.34 1063.84829.75 1140.10991.84855.67 1198.101098.09 1226.011168.18
Unknown Samples
#2 #1 #3 #4 #5
TMT126 TMT127 TMT128 TMT129 TMT130 TMT131 + + + + +
Sixplex Sample
MS
MS/MS
Std
bLf_NG_TMT6_20_1_infusion_OT_HCD45_1093_60000res #1-36 RT: 0.00-0.13 AV: 36 NL: 5.58E5T: FTMS + p ESI Full ms2 [email protected] [50.00-2000.00]
125.5 126.0 126.5 127.0 127.5 128.0 128.5 129.0 129.5 130.0 130.5 131.0 131.5m/z
0
5
10
15
20
25
30
35
40
45
50
55
60
65
70
75
80
85
90
95
100
Rel
ativ
e A
bund
ance
Std
#1
#2
#3
#4
#5
Lc-fluorescence Data
Reporter Ions
+
Standard Reference Sample
126 127 128 129 130 131 m/z
TMT Reporter Ion Channels
In another example (Figure 6), 100 µg of three different monoclonal antibodies were deglycosylated using PNGase F glycosidase, glycans were isolated, and each sample pool was divided into two equal parts. Each part was labeled with a different version of the heavy isobaric aminoxyTMTsixplex reagent, and after a quenching and clean-up, the individual samples were combined to yield a single sixplex sample consisting of three separate samples in a duplicate. The sample was then analyzed by direct infusion MS to reveal that two out of three different antibodies analyzed were identical with respect to glycosylation profiles of the three main glycoforms, with the third antibody having substantially higher abundance of the G1F and G2F glycoforms.
Relative quantitation of the three main glycoforms, G0F, G1F, and G2F, was performed by comparing relative peak intensities of the mass reporter peaks in the MS/MS spectra for each glycoform. After signal normalization, we found that the antibody produced in the cell culture contained higher amounts of the G1F and G2F glycoforms than the antibodies obtained from the mouse.
PO64133-EN 0614S

6 Carbonyl-Reactive Tandem Mass Tag (TMT) Reagents for Mass Spectrometry-Based Quantitative Glycomics
Carbonyl-Reactive Tandem Mass Tag (TMT) Reagents for Mass Spectrometry-Based Quantitative Glycomics Sergei I. Snovida1, Rosa Viner2, John C. Rogers1 1Thermo Fisher Scientific, Rockford, IL; 2Thermo Fisher Scientific, San Jose, CA
Conclusion Increase sample analysis throughput with aminoxyTMT reagents
Overall improvement in MS sensitivity with aminoxyTMT label approach
Structural elements are preserved in labeled glycans
LC-UV/fluorescence and TMT-based quantitation can be complementary
Ideal for analysis of biotherapeutics and biomarker discovery
Acknowledgements We would like to thank the following colleagues and collaborators for critical advice and helpful discussions: Dr. Ryan Bomgarden, Dr. Chris Etienne, Dr. Kay Opperman, Dr. Venky Shivalingappa, and Dr. Julian Saba (Thermo Fisher Scientific); Dr. Kay-Hooi Khoo, Dr. Ming-Yi Ho, Dr. Shui-Hua Wang, and Dr. Chia-Wei Lin (Academia Sinica, Taipei, Taiwan); Dr. Ian Pike and Dr. Karsten Kuhn (Proteome Sciences); Dr. Bernhard Küster, Dr. Hannes Hahne, and Dr. Patrick Neubert (Technische Universität München, Munich, Germany); Dr. Lingjun Li, Dr. Xuefei Zhong, and Dr. Yan Liu (University of Wisconsin, Madison, WI, USA); Dr. Yehia Mechref, Shiyue Zhou, and Yunli Hu (Texas Tech University, Lubbock, TX, USA); Dr. Shonali Paul and Dr. Sanjib Meitei (Premier Biosoft).
Overview Purpose: To demonstrate applications of the new carbonyl-reactive aminoxyTMT reagent in quantitative analysis of carbohydrates by direct infusion and liquid chromatography-coupled mass spectrometry.
Methods: N-glycans released from standard glycoproteins, including several monoclonal antibodies, were individually labeled with the isobaric aminoxyTMT reagents, and combined together for quantitative analysis by mass spectrometry.
Results: Relative quantitation of the labeled glycans from different samples was done by measuring relative peak intensities of the TMT® reporter ions at MS2 or MS3 levels.
Introduction Aberrant glycosylation profiles may reflect abnormal physiological state of a cell, an organ, or an organism as a whole, and may be indicative of a disease state or cancer. Thus, glycans may be used as biomarkers. Additionally, many biotherapeutic drugs are glycoproteins and their activity and efficacy greatly depends on the type and extent of glycosylation. These compounds must be characterized in terms of their glycosylation profiles in both the development and quality control phases of drug development and manufacture.
Accurate quantitation of glycans remains elusive due to the lack of a comprehensive selection of available standards, poor ionization efficiency of carbohydrates relative to other classes of biomolecules, and broad structural heterogeneity of glycomic samples. Recently, we introduced a set of isobaric carbonyl-reactive TMT reagents, Thermo Scientific™ aminoxyTMT™ (Tandem Mass Tag®) Label Reagents (Figure 1), which can react with the reducing end of glycans to form a stable oxime product. The six compounds of the Thermo Scientific™ aminoxyTMTsixplex™ Reagent Set have the same mass (i.e., isobaric) and chemical structure (carbonyl-reactive aminoxy group, spacer arm, and mass reporter). However, the specific distribution of 13C and 15N isotopes on either side of the MS/MS fragmentation site in each reagent results in a unique reporter mass (126–131 Da) in the low m/z region of MS2 spectra. This set of reporter ions is used to measure the relative abundance of labeled molecules in a combined (multiplexed) MS sample representing six different treatment conditions, time points, or replicates. For glycobiology MS applications, the reagents enable quantitative profiling of glycoforms and discovery of glycan biomarkers; they provide improved ionization of glycans for increased sensitivity and increased analytical throughput by sample multiplexing.
In this work, we showcase the use of these reagents for quantitative glycomics by combining our multiplexed TMT-based approach with HILIC LC-MS technique to enable more-sensitive analysis with improved glycome coverage.
Methods Sample Preparation
Bovine thyroglobulin (Sigma-Aldrich) and several monoclonal antibodies (Thermo Fisher Scientific) were reduced, alkylated, and digested with MS-grade trypsin (Thermo Fisher Scientific). Digest mixture was then treated with PNGase F (New England Biolabs) to release N-linked glycans. Following deglycosylation, released glycans were separated from peptides using Oasis® HLB (Waters) solid phase extraction columns. After drying, glycan samples were labeled with aminoxyTMT reagents (Thermo Fisher Scientific) according to manufacturer’s protocol.
Liquid Chromatography
LC-MS experiments were performed in HILIC mode on a Thermo Scientific™ Accucore™ Amide column (2.6µm, 150Å; 75µm×150mm). Mobile phases were 0.1% formic acid in water (A) and 0.1% formic acid in acetonitrile (B). Separation was carried out with a 400 nL/min flowrate using different, sample-dependent gradients.
Mass Spectrometry
For direct infusion experiments, labeled glycan samples were dissolved in 50% acetonitrile solution containing 50 µM NaOH. Samples were analyzed on Thermo Scientific™ Orbitrap Velos Pro™ ion trap and Thermo Scientific™ Orbitrap Fusion™ Tribrid™ mass spectrometers in the positive ion mode.
Data Analysis
All data was processed manually.
FIGURE 1. Chemical structure of aminoxyTMT reagents and labeling reaction scheme.
Results General Features of aminoxyTMT-labeled Glycans
Two types of the reagent are available, Thermo Scientific™ aminoxyTMTzero™ Label Reagents, the light version of the reagent recommended for method development work, and the heavy, isobaric aminoxyTMT sixplex set (Figure 1). When a labeled glycan is subjected to MS/MS fragmentation by HCD, mass reporter region of the label molecule is cleaved, leading to an intense peak in the low m/z region of MS/MS spectrum. For the aminoxyTMTsixplex set, each member of the set produces a mass reporter ion with a unique m/z, thus allowing for relative quantitation of glycoforms across up to six different samples (Figure 3). The carbonyl-reactive alkoxyamine group reacts rapidly with aldehydes and ketones to yield a stable oxime product, which is resistant to hydrolysis over a broad range of experimental conditions.
Comparison of the fragmentation spectra of the sodiated precursors of unlabeled and aminoxyTMT-labeled glycans (Figure 2) shows that the same structurally relevant product ions are produced for both the labeled and the unlabeled glycans, suggesting that structural information is not lost or diminished after labeling with the aminoxyTMT reagent. Therefore, in addition to the mass reporter ions relevant for quantitation, information which can be derived from the MS/MS spectra of the unlabeled glycans is still present here.
Multiplexing Glycomic Samples - Overview
In a typical experiment, up to six separate samples may be analyzed together, which allows lower overall analysis time and minimizes the variations in quantitative reproducibility, as the number of independent sample handling steps is reduced in this workflow (Figure 3). After labeling with aminoxyTMT reagents, unreacted reagents are quenched with acetone and samples are combined. An additional clean-up step using HILIC solid phase extraction material is used to separate the quenched reagent from the labeled glycans. During MS analysis, precursor ions corresponding to the glycoforms of interest are identified and are subjected to MS/MS analysis by HCD fragmentation. Relative peak intensities of the reporter ions observed in the MS/MS spectra are proportional to the relative abundance levels of the selected glycoform in different samples in the set.
Several peaks observed in the low m/z region of MS/MS spectra of the labeled glycans may interfere with accurate quantitative analysis if a low resolution mass spectrometer is used (Figure 3). These peaks are some of the product ions of HexNAc fragmentation, and are thus present in MS/MS spectra of most glycoforms.
Although this may be an issue for low resolution instruments, these interferences are easily resolved and do not pose a problem for accurate quantitation at the lowest resolution settings of a Thermo Scientific™ Orbitrap™ mass spectrometer.
If a Velos Pro ion trap mass spectrometer is used for the analysis, application of a targeted MS3 method (Figure 4) solves this interference problem. First, precursor of interest is isolated and fragmented using CID or HCD fragmentation mode. In the second step, abundant Y1 ions, which still contain intact aminoxyTMT label, are isolated for MS3 HCD. MS3 spectra contain “clean” mass reporter ions and their ratios are now as expected for the sample set.
Multiplexing Glycomic Samples - Examples
Several experiments showcasing the use of these reagents for quantitative analysis of glycans were performed using antibodies as glycan sources. In the first experiment (Figure 5), 100 µg of two anti c-Myc monoclonal antibodies, each coming from a different source, were separately deglycosylated using PNGase F glycosidase, glycans were isolated and each sample was labeled with a different heavy version of the isotopic aminoxyTMT reagent. After quenching and clean-up, the samples were combined and analyzed by direct infusion using a Velos Pro mass spectrometer.
Tandem Mass Tag and TMT are registered trademarks of Proteome Sciences plc. Sigma-Aldrich is a registered trademark of Sigma-Aldrich Co. LLC. Oasis is a registered trademark of Waters Corporation. All other trademarks are the property of Thermo Fisher Scientific and its subsidiaries.
This information is not intended to encourage use of these products in any manners that might infringe the intellectual property rights of others.
FIGURE 4. Targeted MS3 acquisition approach using a Velos Pro ion trap instrument.
FIGURE 5. Comparing glycosylation profiles of two monoclonal antibodies from different sources.
AminoxyTMT Reagent Structure AminoxyTMTsixplex Isobaric Reagents
HCD
+ glycan aminoxyTMT reagent Stable oxime product
Reaction:
122 124 126 128 130 132 134 136m/z
0
10
20
30
40
50
60
70
80
90
1000
10
20
30
40
50
60
70
80
90
100
Rela
tive
Abun
danc
e
126.00
128.00129.00
127.00
130.00131.00122.92121.92 124.00 124.92 135.92131.92 134.00132.92
128.00 129.00
127.00
130.00
131.00126.08
132.00 133.08125.00 134.00123.08 135.17 136.08122.00
NL: 1.30E4btg_ng_native_oxytmt_1_2_5_hilic_50acnsample_1_1ul#6214-6809 RT: 75.02-80.62 AV: 42 F: ITMS + p NSI d Full ms2 [email protected] [100.00-2000.00]
NL: 3.88E2bTg_NG_native_oxyTMT_1_2_5_HILIC_50ACNsample_1_1uL_140219224437#11906-12461 RT: 75.02-80.96 AV: 147 F: ITMS + p NSI d Full ms3 [email protected] [email protected] [100.00-2000.00]
200 400 600 800 1000 1200 1400 1600 1800 2000m/z
0
20
40
60
80
1000
20
40
60
80
100
Rela
tive
Abun
danc
e
0
20
40
60
80
100 891.44
909.08
1336.681024.16682.36 775.08523.40445.20 1145.88 1535.72 1723.92 1916.80523.34
137.92
204.00726.52274.09
669.43 888.52366.17 1050.611723.881212.70872.52 1358.78505.34 1577.87606.43 1852.96930.52
128.00
303.17668.85 891.44 1246.53595.26 1009.61 1422.54367.09 1669.88 1922.80
NL: 1.93E6bTg_NG_native_oxyTMT_1_2_5_HILIC_50ACNsample_1_1uL_140219224437#11906-12461 RT: 75.00-81.00 AV: 148 T: ITMS + p NSI E Full ms [400.00-2000.00]
NL: 7.54E4btg_ng_native_oxytmt_1_2_5_hilic_50acnsample_1_1ul#6214-6809 RT: 75.02-80.62 AV: 42 F: ITMS + p NSI d Full ms2 [email protected] [100.00-2000.00]
NL: 3.88E2bTg_NG_native_oxyTMT_1_2_5_HILIC_50ACNsample_1_1uL_140219224437#11906-12461 RT: 75.02-80.96 AV: 147 F: ITMS + p NSI d Full ms3 [email protected] [email protected] [100.00-2000.00]
MS2 (HCD or CID)
MS3 (HCD)
[M+3H]3+
Y1-ion
“clean” reporter
ions
DDA/targeted
1.4E4
3.9E2 Actual ratios 1:2:5:5:2:1
RT: 25.39 - 99.74
30 35 40 45 50 55 60 65 70 75 80 85 90 95Time (min)
0
5
10
15
20
25
30
35
40
45
50
55
60
65
70
75
80
85
90
95
100
Rela
tive
Abun
danc
e
47.85
76.94
47.92
76.49
77.09
69.73
69.39
63.62 77.2863.49 69.87
69.27
77.67
66.18 77.9261.0578.0076.02
57.0360.04 78.5748.73 56.85
78.9748.8979.6575.50
88.4183.6874.3098.0097.5025.66 84.94 89.2246.4934.5127.87 38.50 43.87
NL: 9.19E6Base Peak MS bTg_NG_native_oxyTMT_1_2_5_HILIC_50ACNsample_1_1uL_140219224437
200 400 600 800 1000 1200 1400 1600 1800 2000m/z
0
20
40
60
80
1000
20
40
60
80
100
Rel
ativ
e A
bund
ance
0
20
40
60
80
100 1118.44915.36
550.24128.12931.36
1136.44
989.40712.28 1309.52532.20
1384.561238.48786.32566.24388.16303.24 1482.64 1630.721743.52 1959.16
1280.52
915.36712.281077.44128.12
550.24
1151.44388.16 931.36728.28 1471.60694.28
786.32 1400.56532.24 1546.60568.24 1644.68168.04 303.24 406.16 1792.80 1927.48712.28
1077.44131.121442.60
915.361239.48550.24 874.32
388.16 1313.521055.76694.28 933.36728.28 1633.641181.48568.24168.08 327.24 1562.64 1806.76
532.20 1952.88
NL: 7.76E2native_TMT128_131_pos_894#5 RT: 0.10 AV: 1 T: ITMS + p ESI E Full ms2 [email protected] [50.00-2000.00]
NL: 2.25E2native_tmt128_131_pos_975#5 RT: 0.11 AV: 1 T: ITMS + p ESI E Full ms2 [email protected] [50.00-2000.00]
NL: 1.79E1native_tmt128_131_pos_1056#4 RT: 0.09 AV: 1 T: ITMS + p ESI E Full ms2 [email protected] [50.00-2000.00]
Reporter ions
HCD
0
20
40
60
80
100
1 2 3
Extracted glycan MS profiles
0
20
40
60
80
100
1 2 3
Reporter ion relative intensities
Culture Mouse
1to1_mix_native_TMT_pos #18 RT: 0.11 AV: 1 NL: 1.82E5T: ITMS + p ESI E Full ms [50.00-2000.00]
840 860 880 900 920 940 960 980 1000 1020 1040 1060 1080 1100 1120m/z
0
5
10
15
20
25
30
35
40
45
50
55
60
65
70
75
80
85
90
95
100
Rel
ativ
e A
bund
ance
893.92
974.92
901.88
904.92882.92 1055.96982.92
963.96913.40 1063.92993.92 1137.44946.92873.44 1044.92 1122.00933.88 1028.40 1076.52860.92831.56 1103.841014.92
Deglycosylate, label, mix, clean
1/10
1/10
Anti-c-Myc hybridoma
IgGs
G0F
G1F
G2F
[M+H+Na]2+
N-glycans N-glycans N-glycans
TMT129 TMT126 TMT127 TMT130 TMT128 TMT131
MS
Combined Sample
3_mAbs_123123 #54 RT: 0.11 AV: 1 NL: 2.41E6T: ITMS + p ESI Full ms [700.00-1500.00]
800 850 900 950 1000 1050 1100 1150 1200m/z
0
5
10
15
20
25
30
35
40
45
50
55
60
65
70
75
80
85
90
95
100
Rel
ativ
e Ab
unda
nce
893.84
974.92
882.84 901.841055.93
904.84 982.84963.92820.84 873.34
792.34 1040.18910.76 954.34 1063.84829.75 1140.10991.84855.67 1198.101098.09 1226.011168.18
G0F
G1F
G2F
3_mAbs_123123_894 #10 RT: 0.10 AV: 1 NL: 5.69E3T: ITMS + p ESI Full ms2 [email protected] [50.00-1500.00]
122 123 124 125 126 127 128 129 130 131 132 133 134 135m/z
0
5
10
15
20
25
30
35
40
45
50
55
60
65
70
75
80
85
90
95
100
Rel
ativ
e A
bund
ance
126.25 131.34128.34130.34
127.34129.34
124.25
132.25125.25 133.25123.25122.25 134.25 135.173_mabs_123123_975 #21 RT: 0.24 AV: 1 NL: 5.48E3T: ITMS + p ESI Full ms2 [email protected] [50.00-1500.00]
122 123 124 125 126 127 128 129 130 131 132 133 134 135 136m/z
0
5
10
15
20
25
30
35
40
45
50
55
60
65
70
75
80
85
90
95
100
Rel
ativ
e A
bund
ance
126.25
129.34
128.34 130.34127.34 131.34
124.17125.25 132.25123.25 133.25122.25 134.25 135.17
3_mabs_123123_1056 #8 RT: 0.10 AV: 1 NL: 1.22E3T: ITMS + p ESI Full ms2 [email protected] [50.00-1500.00]
122 123 124 125 126 127 128 129 130 131 132 133 134 135 136m/z
0
5
10
15
20
25
30
35
40
45
50
55
60
65
70
75
80
85
90
95
100
Re
lativ
e A
bu
nd
an
ce
126.25
129.34
127.25130.34128.34
131.34
124.17 125.25 132.25123.25 133.25122.25 134.17 135.17 136.25
HCD
HCD
HCD
Reporter Ions
Reporter Ions
Reporter Ions
FIGURE 6. Quantitative comparison of glycosylation of several monoclonal antibodies with replicates.
FIGURE 2. Positive ion mode HCD fragmentation of native unlabeled and aminoxyTMT-labeled high-mannose glycans.
100 200 300 400 500 600 700 800 900 1000 1100 1200 1300 1400m/z
0
10
20
30
40
50
60
70
80
90
1000
10
20
30
40
50
60
70
80
90
100
Rel
ativ
e Ab
unda
nce
1036.61
1257.69
874.52671.43
833.521095.61
447.34
907.52550.34 1156.61771.52640.68347.26 994.61599.35226.25 329.26138.17 1300.70 1415.70
1036.44
1054.44671.28131.12851.36
833.32 907.36653.28
979.40625.28 689.28527.20 1156.48817.36347.12 550.24 1211.52401.20303.24203.20 463.20 1400.681272.52
NL: 1.16E4RNAseB_NG_200ug_prot_eq_mL_641#9 RT: 0.10 AV: 1 T: ITMS + p ESI Full ms2 [email protected] [50.00-2000.00]
NL: 5.17E3blf_rnaseb_btg_tmt_pos_780#5 RT: 0.09 AV: 1 T: ITMS + p ESI E Full ms2 [email protected] [50.00-2000.00]
Reporter ions
Y (Na+)
Y (Na+)
Y (Na+)
[M+Na]+B (Na+)
B (Na+)B (Na+)
B (Na+)
0,2AB (Na+)B (Na+)
[M+ Na-reporter-CO]+
C (Na+)
unlabeled
aminoxyTMT Reagent-labeled
Trap-HCD 640.5 m/z [M+2Na]2+
Trap-HCD 779.9 m/z [M+H+Na]2+
0,2A
*
FIGURE 3. Workflow for quantitative glycomics multiplexed experiment.
3_mAbs_123123 #54 RT: 0.11 AV: 1 NL: 2.41E6T: ITMS + p ESI Full ms [700.00-1500.00]
800 850 900 950 1000 1050 1100 1150 1200m/z
0
5
10
15
20
25
30
35
40
45
50
55
60
65
70
75
80
85
90
95
100
Relat
ive Ab
unda
nce
893.84
974.92
882.84 901.841055.93
904.84 982.84963.92820.84 873.34
792.34 1040.18910.76 954.34 1063.84829.75 1140.10991.84855.67 1198.101098.09 1226.011168.18
Unknown Samples
#2 #1 #3 #4 #5
TMT126 TMT127 TMT128 TMT129 TMT130 TMT131 + + + + +
Sixplex Sample
MS
MS/MS
Std
bLf_NG_TMT6_20_1_infusion_OT_HCD45_1093_60000res #1-36 RT: 0.00-0.13 AV: 36 NL: 5.58E5T: FTMS + p ESI Full ms2 [email protected] [50.00-2000.00]
125.5 126.0 126.5 127.0 127.5 128.0 128.5 129.0 129.5 130.0 130.5 131.0 131.5m/z
0
5
10
15
20
25
30
35
40
45
50
55
60
65
70
75
80
85
90
95
100
Rel
ativ
e A
bund
ance
Std
#1
#2
#3
#4
#5
Lc-fluorescence Data
Reporter Ions
+
Standard Reference Sample
126 127 128 129 130 131 m/z
TMT Reporter Ion Channels
In another example (Figure 6), 100 µg of three different monoclonal antibodies were deglycosylated using PNGase F glycosidase, glycans were isolated, and each sample pool was divided into two equal parts. Each part was labeled with a different version of the heavy isobaric aminoxyTMTsixplex reagent, and after a quenching and clean-up, the individual samples were combined to yield a single sixplex sample consisting of three separate samples in a duplicate. The sample was then analyzed by direct infusion MS to reveal that two out of three different antibodies analyzed were identical with respect to glycosylation profiles of the three main glycoforms, with the third antibody having substantially higher abundance of the G1F and G2F glycoforms.
Relative quantitation of the three main glycoforms, G0F, G1F, and G2F, was performed by comparing relative peak intensities of the mass reporter peaks in the MS/MS spectra for each glycoform. After signal normalization, we found that the antibody produced in the cell culture contained higher amounts of the G1F and G2F glycoforms than the antibodies obtained from the mouse.
PO64133-EN 0614S

Thermo Fisher Scientific, San Jose, CA USA is ISO 9001:2008 Certified.
www.thermoscientific.com©2014 Thermo Fisher Scientific Inc. All rights reserved. ISO is a trademark of the International Standards Organization. Tandem Mass Tag and TMT are registered trademarks of Proteome Sciences plc. Sigma-Aldrich is a registeredtrademark of Sigma-Aldrich Co. LLC. All other trademarks are the property of Thermo Fisher Scientific and its subsidiaries. This information is presented as an example of the capabilities of Thermo Fisher Scientific products. It is not intended to encourage use of these products in any manners that might infringe the intellectual property rights of others. Specifications, terms and pricing are subject to change. Not all products are available in all countries. Please consult your local sales representative for details.
PN-64133-EN-0614S
Africa +43 1 333 50 34 0Australia +61 3 9757 4300Austria +43 810 282 206Belgium +32 53 73 42 41Canada +1 800 530 8447China 800 810 5118 (free call domestic)
400 650 5118
Denmark +45 70 23 62 60Europe-Other +43 1 333 50 34 0Finland +358 9 3291 0200France +33 1 60 92 48 00Germany +49 6103 408 1014India +91 22 6742 9494Italy +39 02 950 591
Japan +81 45 453 9100Latin America +1 561 688 8700Middle East +43 1 333 50 34 0Netherlands +31 76 579 55 55New Zealand +64 9 980 6700Norway +46 8 556 468 00Russia/CIS +43 1 333 50 34 0
Singapore +65 6289 1190Spain +34 914 845 965Sweden +46 8 556 468 00Switzerland +41 61 716 77 00UK +44 1442 233555USA +1 800 532 4752