Embed Size (px)
Citation preview
Social Statistics: Difference
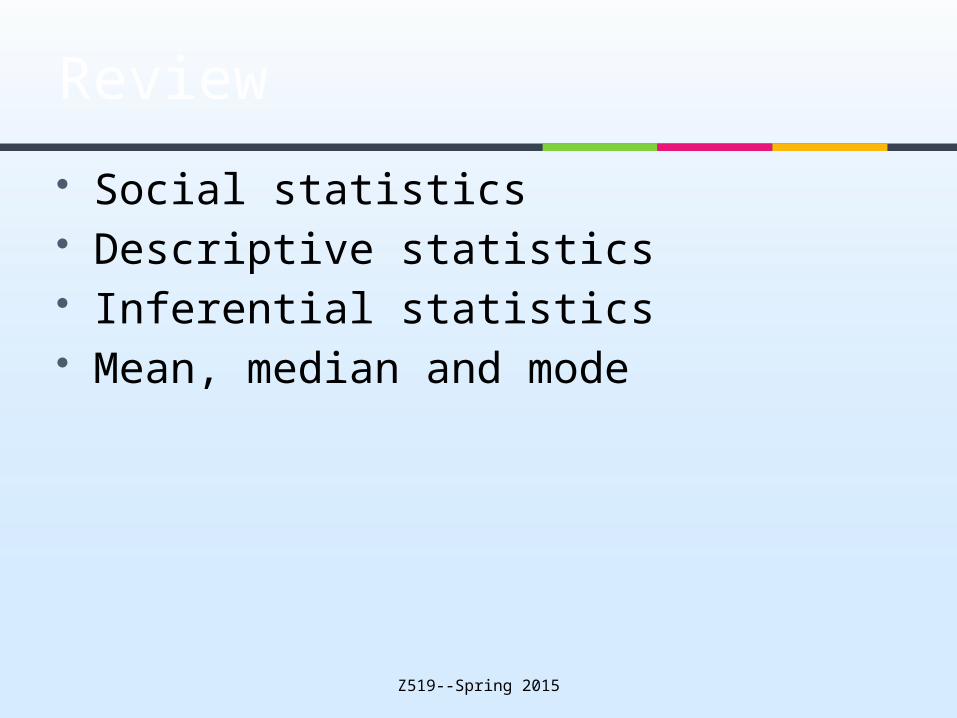
Social statistics Descriptive statistics Inferential statistics Mean, median and mode
Review
Z519--Spring 2015
Range Variance Standard deviation Using Excel and SPSS to calculate
them
Outline
Descriptive statistics Centrality tendency (average) Measurement of variability (variability)
Average+Variability = describe the characteristics of a set of data
The whole story
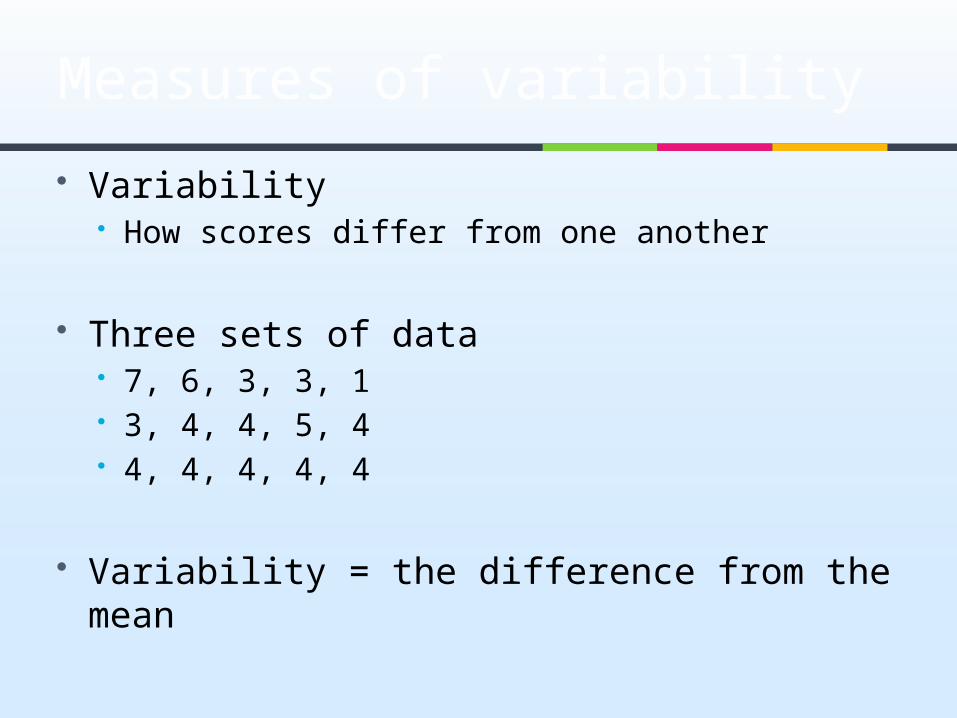
Variability How scores differ from one another
Three sets of data 7, 6, 3, 3, 1 3, 4, 4, 5, 4 4, 4, 4, 4, 4
Variability = the difference from the mean
Measures of variability
Three ways Range Variance Standard deviation
Measures of variability
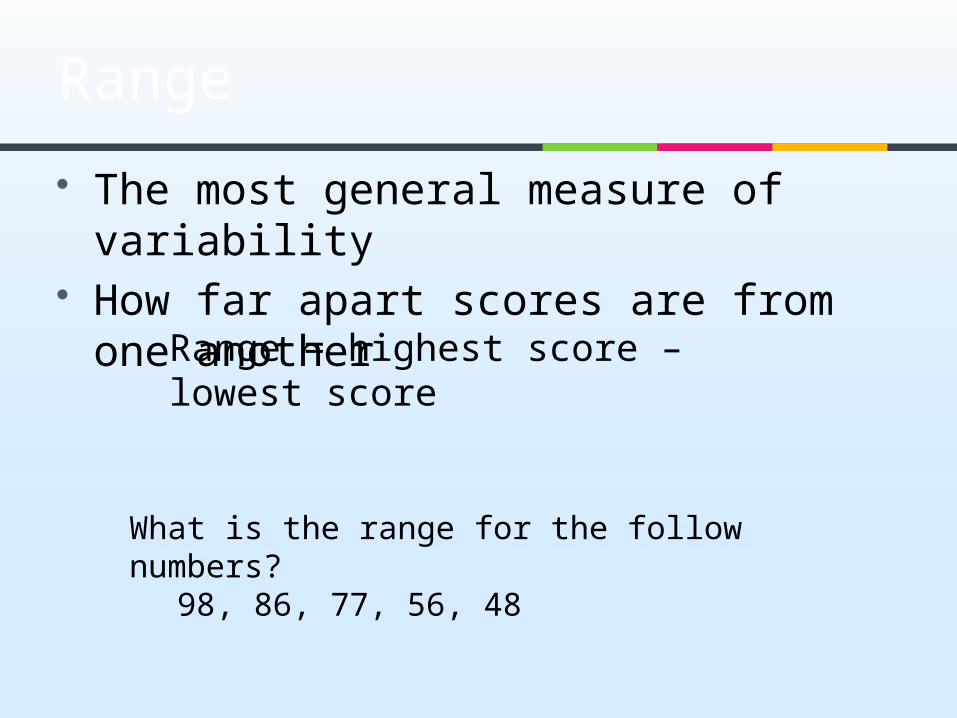
The most general measure of variability
How far apart scores are from one another
Range
Range = highest score – lowest score
What is the range for the follow numbers? 98, 86, 77, 56, 48
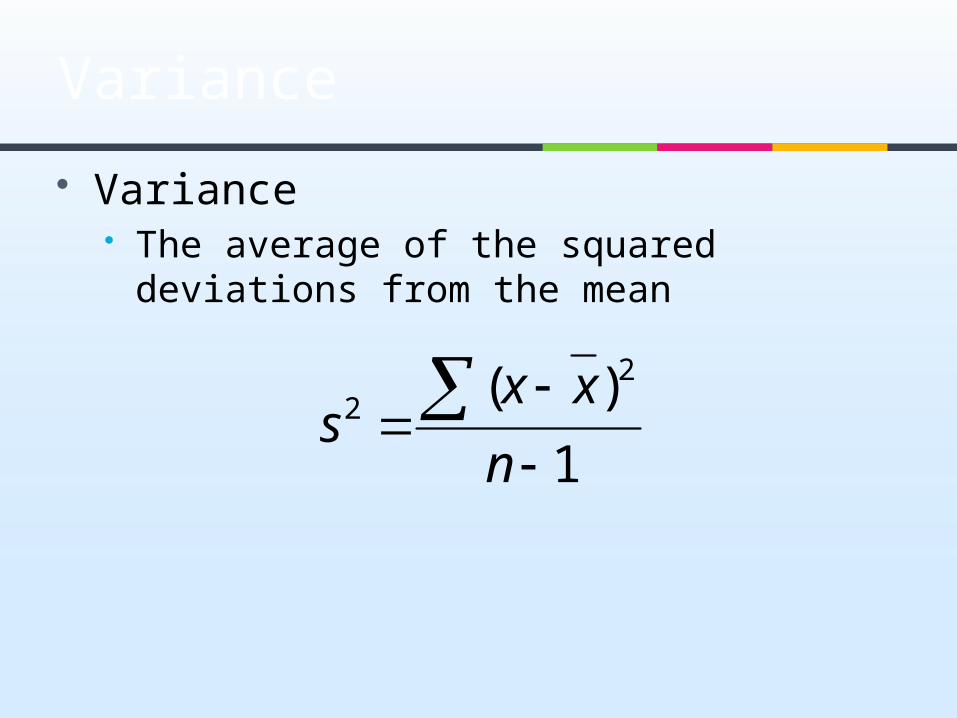
Variance The average of the squared deviations
from the mean
Variance
1
)( 22
n
xxs
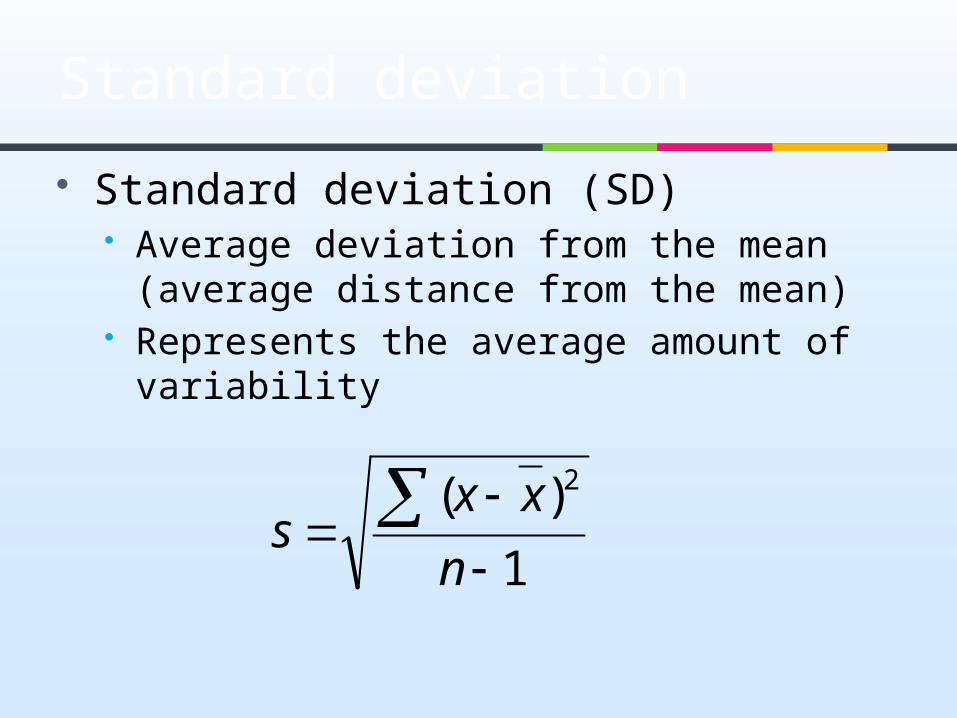
Standard deviation (SD) Average deviation from the mean
(average distance from the mean) Represents the average amount of
variability
Standard deviation
1
)( 2
n
xxs
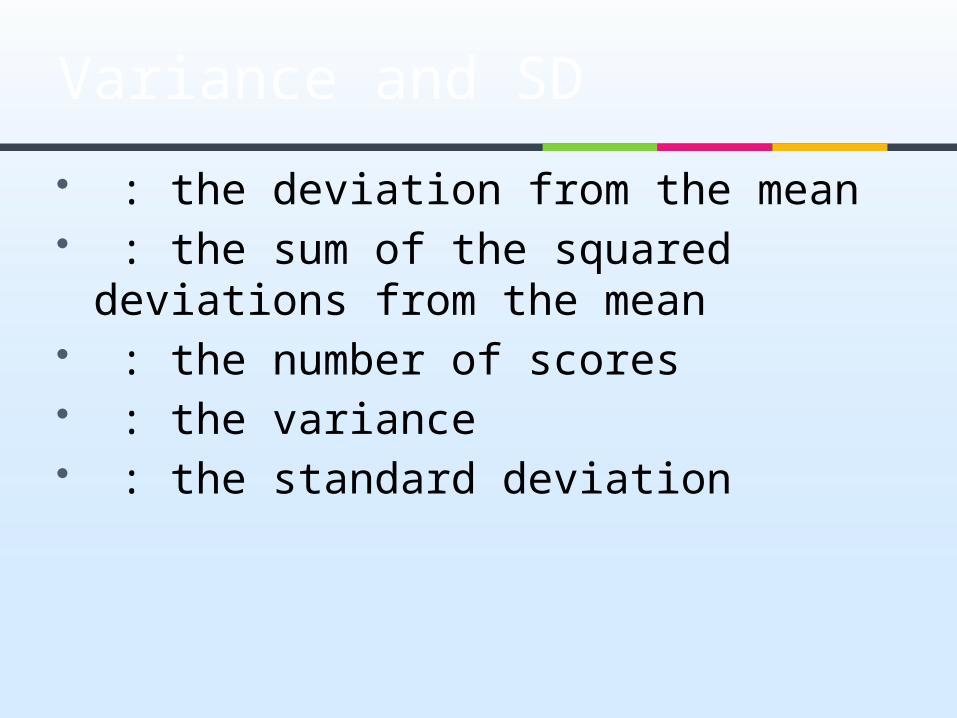
: the deviation from the mean : the sum of the squared deviations
from the mean : the number of scores : the variance : the standard deviation
Variance and SD
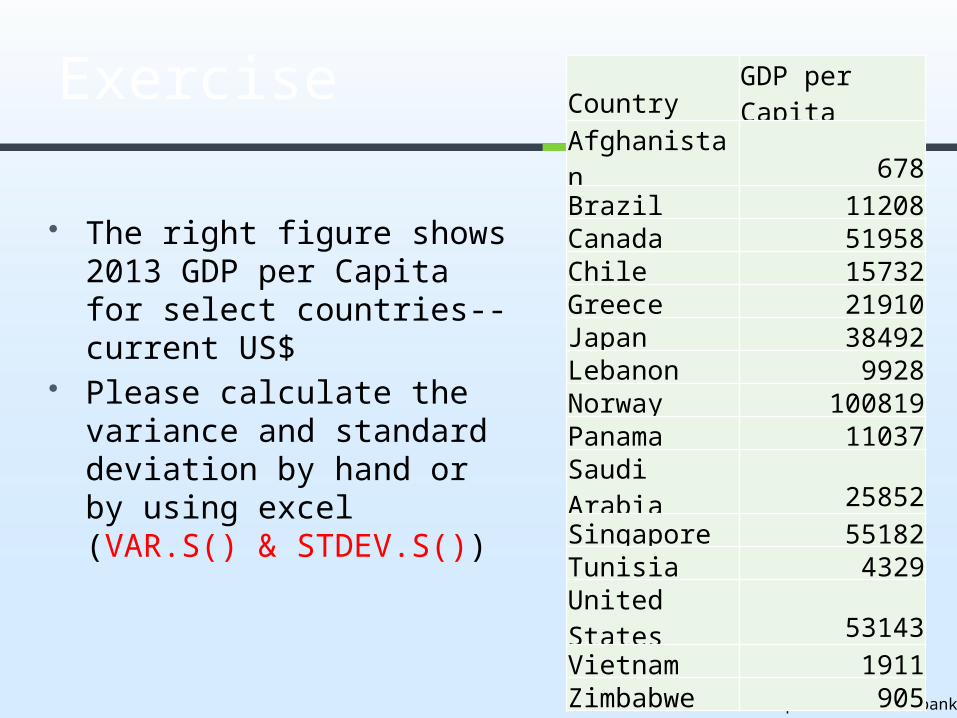
The right figure shows 2013 GDP per Capita for select countries--current US$
Please calculate the variance and standard deviation by hand or by using excel (VAR.S() & STDEV.S())
Exercise
Data collected from http://data.worldbank.org/
CountryGDP per Capita
Afghanistan 678Brazil 11208Canada 51958Chile 15732Greece 21910Japan 38492Lebanon 9928Norway 100819Panama 11037Saudi Arabia 25852Singapore 55182Tunisia 4329United States 53143Vietnam 1911Zimbabwe 905
1
)( 2
n
xxs
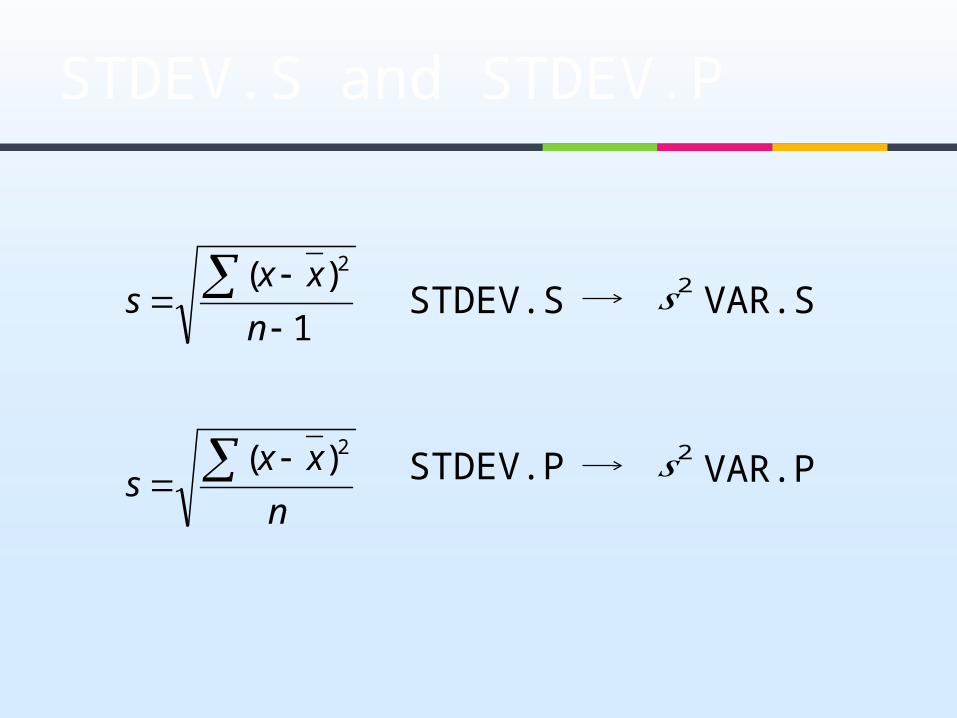
STDEV.S and STDEV.P
n
xxs
2)(
STDEV.S
STDEV.P
𝑠2
𝑠2
VAR.S
VAR.P
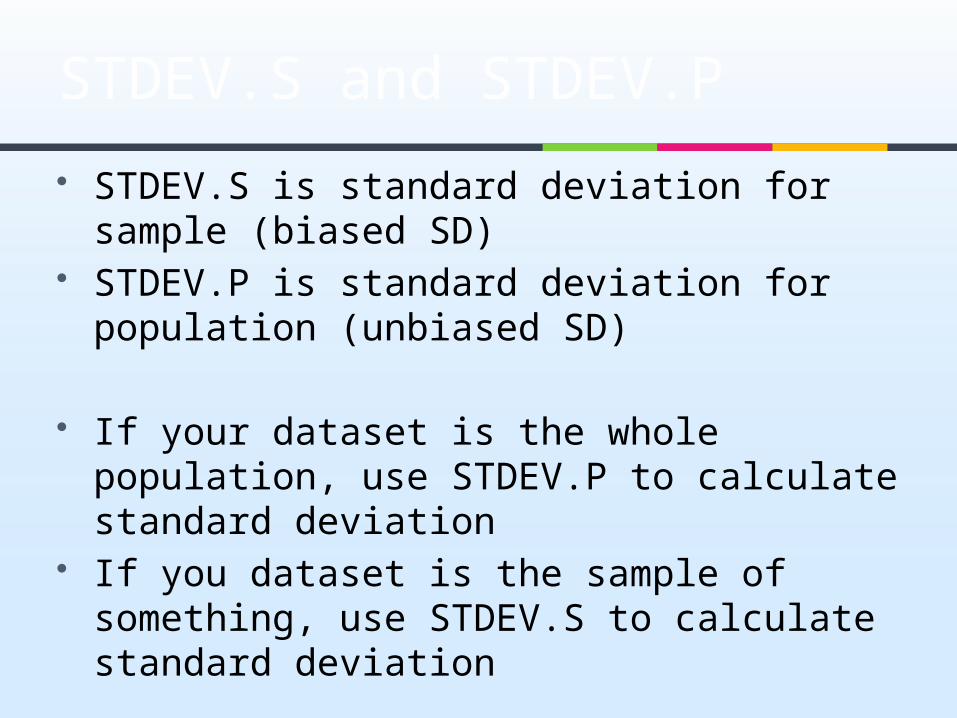
STDEV.S is standard deviation for sample (biased SD)
STDEV.P is standard deviation for population (unbiased SD)
If your dataset is the whole population, use STDEV.P to calculate standard deviation
If you dataset is the sample of something, use STDEV.S to calculate standard deviation
STDEV.S and STDEV.P
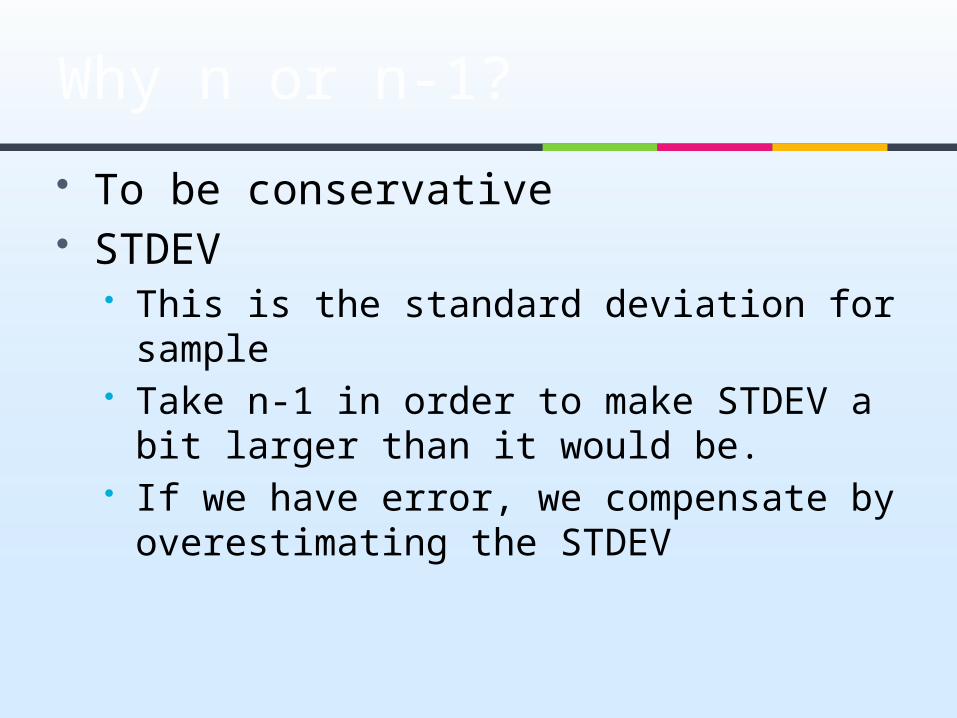
To be conservative STDEV
This is the standard deviation for sample Take n-1 in order to make STDEV a bit
larger than it would be. If we have error, we compensate by
overestimating the STDEV
Why n or n-1?
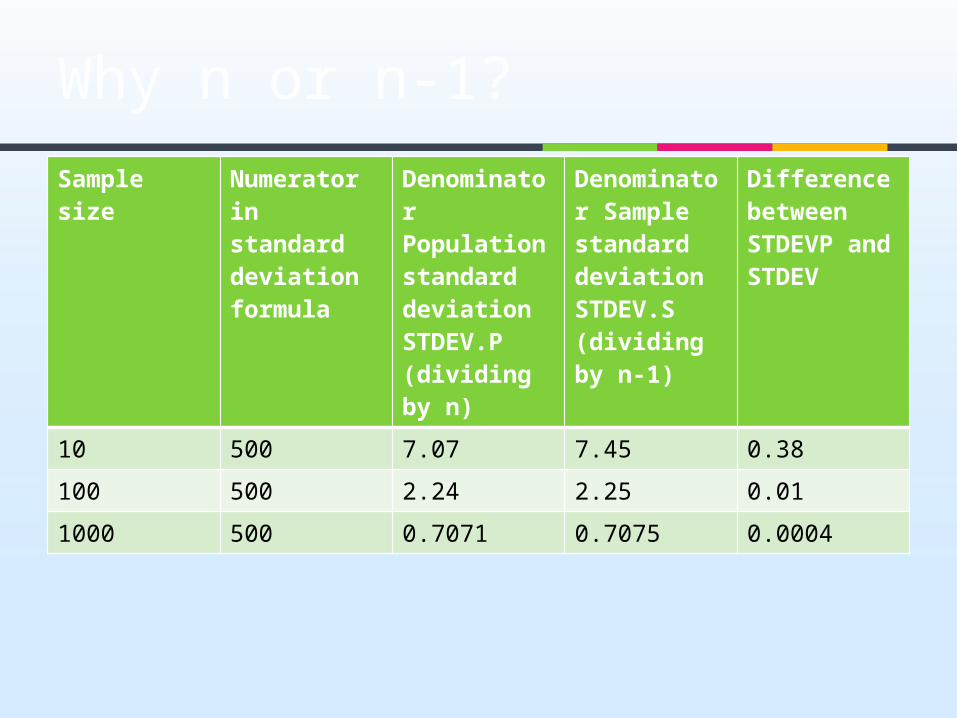
Sample size
Numerator in standard deviation formula
Denominator Population standard deviationSTDEV.P(dividing by n)
Denominator Sample standard deviationSTDEV.S(dividing by n-1)
Difference between STDEVP and STDEV
10 500 7.07 7.45 0.38
100 500 2.24 2.25 0.01
1000 500 0.7071 0.7075 0.0004
Why n or n-1?
Often appears in the “Results” sections of journals
They are quite different Variance is squared SD
SD vs. Variance
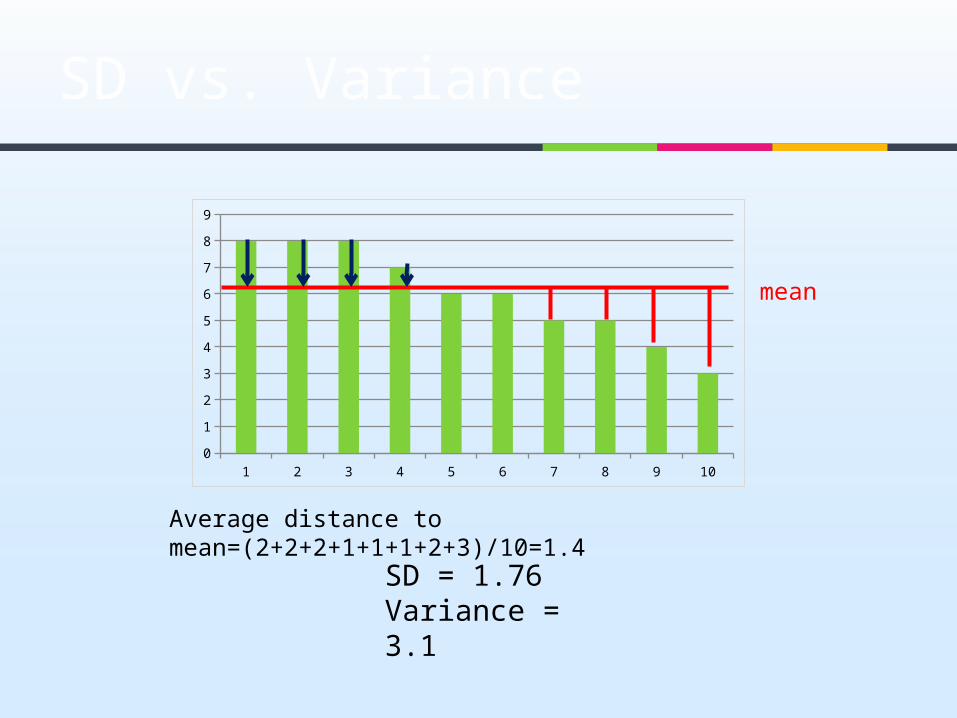
SD vs. Variance
1 2 3 4 5 6 7 8 9 100
1
2
3
4
5
6
7
8
9
mean
SD = 1.76Variance = 3.1
Average distance to mean=(2+2+2+1+1+1+2+3)/10=1.4
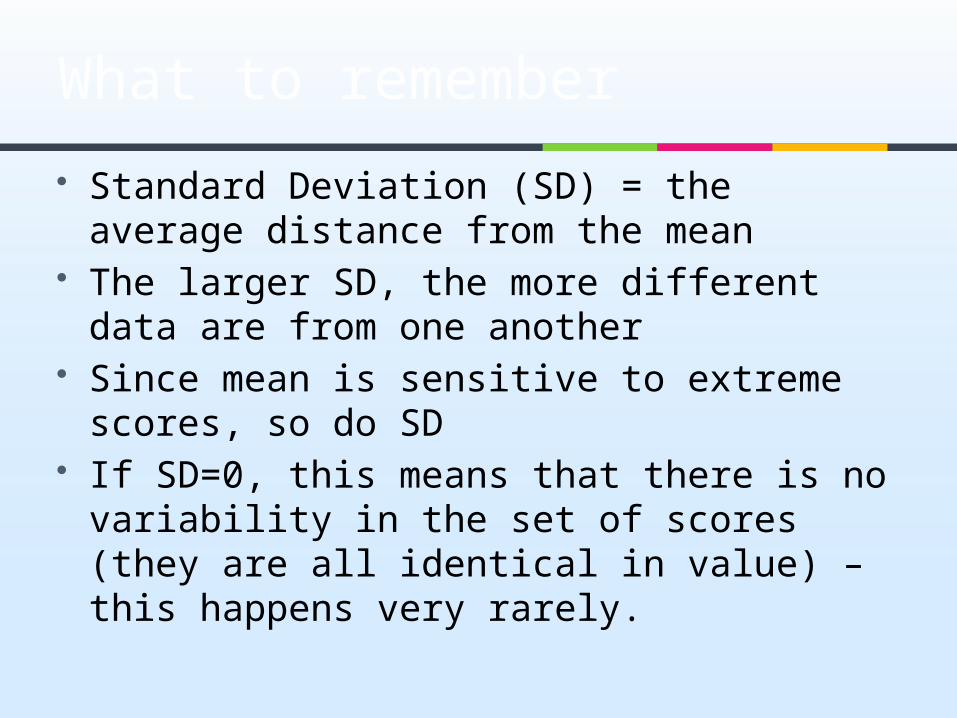
Standard Deviation (SD) = the average distance from the mean
The larger SD, the more different data are from one another
Since mean is sensitive to extreme scores, so do SD
If SD=0, this means that there is no variability in the set of scores (they are all identical in value) – this happens very rarely.
What to remember
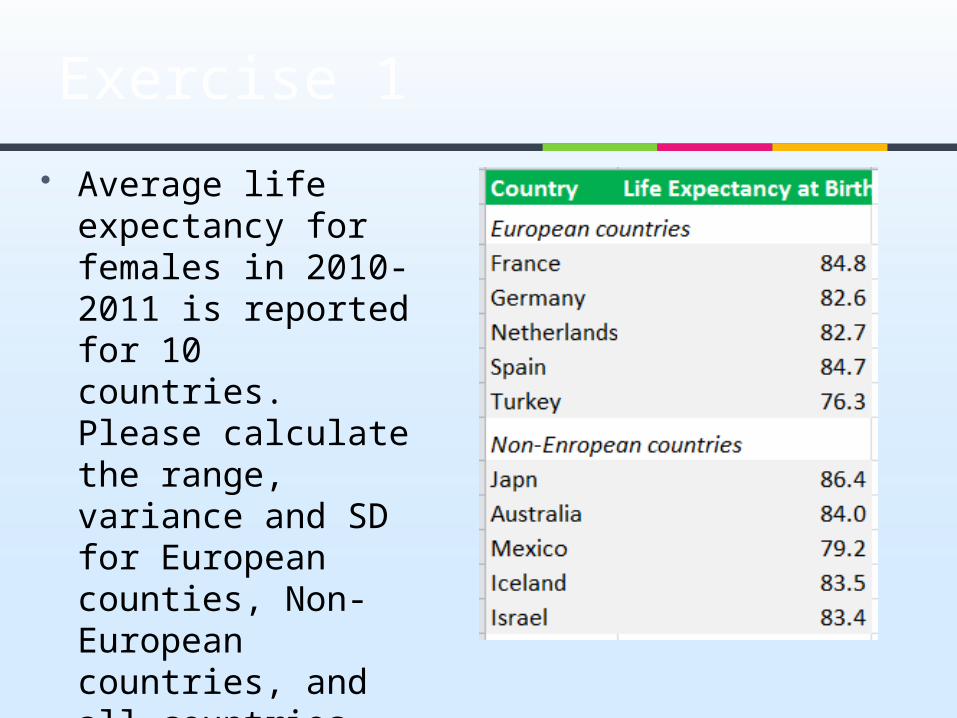
Average life expectancy for females in 2010-2011 is reported for 10 countries. Please calculate the range, variance and SD for European counties, Non-European countries, and all countries.
Exercise 1
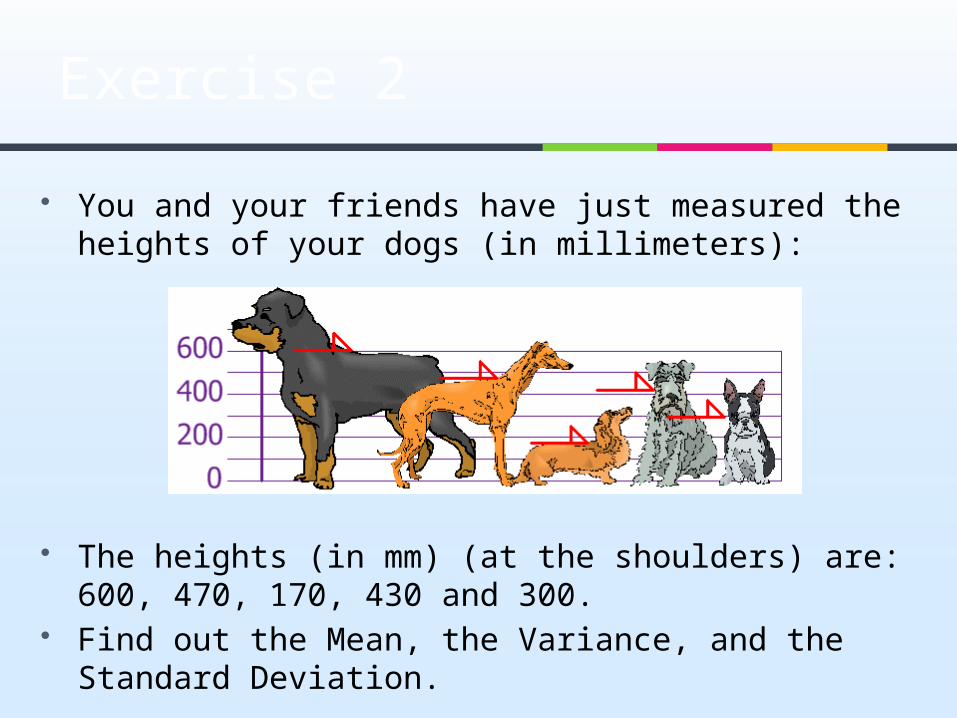
You and your friends have just measured the heights of your dogs (in millimeters):
The heights (in mm) (at the shoulders) are: 600, 470, 170, 430 and 300.
Find out the Mean, the Variance, and the Standard Deviation.
Exercise 2
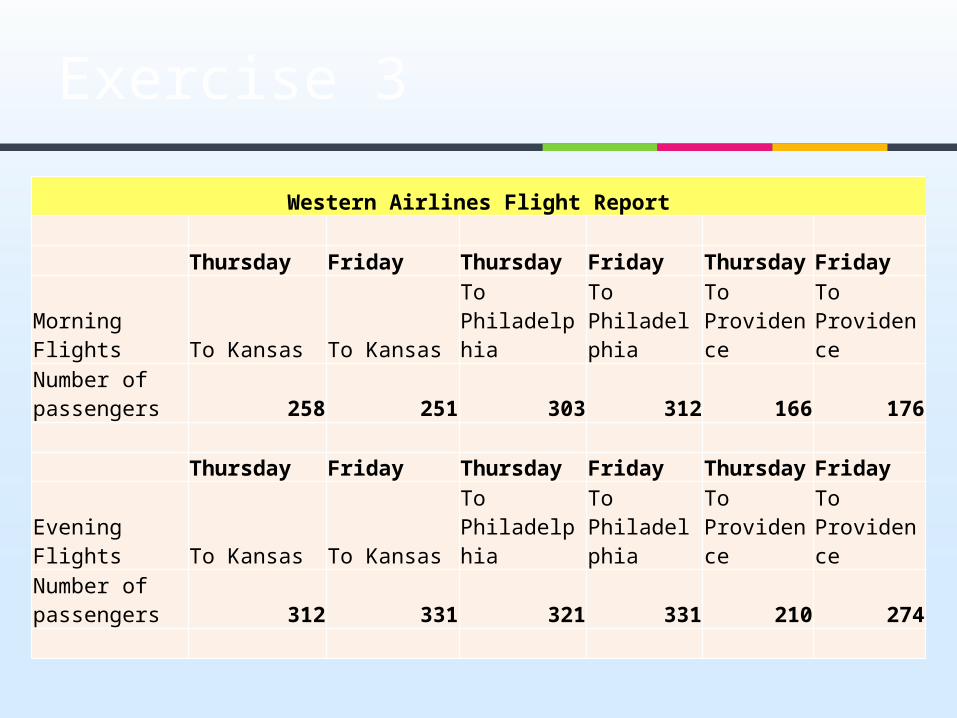
Western Airlines Flight Report
Thursday Friday Thursday FridayThursday Friday
Morning Flights To Kansas To Kansas
To Philadelphia
To Philadelphia
To Providence
To Providence
Number of passengers 258 251 303 312 166 176
Thursday Friday Thursday FridayThursday Friday
Evening Flights To Kansas To Kansas
To Philadelphia
To Philadelphia
To Providence
To Providence
Number of passengers 312 331 321 331 210 274
Exercise 3
Write a half page summary report to your boss
Form a group to discuss it
Exercise 3