Embed Size (px)
Citation preview
Global Calculator
Global Calculator Iron & Steel Workshop Products & Manufacturing of the Global Calculator Workshop of April 24th 2014 (version of July 17th)
1
Brussels
Legend:
Key slide
Key feedback
asked Question…
Data Model input
Clare April 22
2. 19.6 GJ / t Crude steel and 1.77 of CO2
/ t crude steel (EAF and BOF). The energy
consumption and CO2 emissions for BOF
is higher than that for EAF (EAF being
approx. one third of BOF, as a very rough
estimate). The ratio of EAF to Ore-based
process has a significant effect on the
global total CO2 emissions and intensity
for the Iron and Steel component of the
global CO2 emission level (6.5%).
3. It is possible to use 100% DRI in the
EAF process (i.e. no scrap). DRI creates
more slag than scrap so it makes it a bit
less effective as an alternative to the BF-
BOF route. If it is charged hot (above 500
degrees C) you can save quite a bit of
energy naturally from hot DRI charging but
it still consumes more energy than the BF-
BOF process. The CO2 emissions are less
in the DRI - EAF process due to natural
gas being used for the reduction process
compared to coal and coke in a BF- BOF.
4. It is possible to put DRI into the BOF in
place of scrap but still need some steel
scrap and Hot metal of course.
5. 50% of demand may be able to supplied
from scrap via the two main process routes
by 2050 - is a reasonable scenario, but
dependent on many factors (e.g.
economics for energy, raw materials and
scrap prices and cost and overall demand
region or country by country etc.)
Consultation
feedback Consultation
feedback still to
take into account

Global Calculator
• This document
– Supported workshop discussions of April 24th 2014
– Addresses steel assumptions to refine the model
– Other materials assumptions are addressed through sector specific
consultations which are available through these links (cement, chemicals)
– There is also a cross-sector analysis here
• The model was subsequently updated however it is still a work in progress as of
July 2014. Some non processed expert feedback is noted within the document
• You are more than welcome to share feedback and we will try to include it in
future version of the analysis. For this reason, this document will continuously
update itself until September 1st
• All this documentation is open source
2
Preliminary information on this preread

Global Calculator
• Introduction to the Global Calculator 9-10h
• Iron & steel demand prospective 10-11
• Iron & steel manufacturing with lower 11h30-13h
energy intensity
3
Agenda
Content
Global Calculator
4
Agenda
Introduction to the Global Calculator
Background
Expert & Literature review

Global Calculator
• Background of the global calculator project
• Purpose of the workshop
• Team & model structure
The cross sectoral document is available here
5
Most introduction material is described in the cross sector document

Global Calculator
6
Agenda
Introduction to the Global Calculator
Background
Expert & Literature review

Global Calculator
7
Worldsteel Association
• Clare Broadbent, Eldar Askerov
European Steel Technology Platform
• Jean-Pierre Birat
Eurofer
• Jean Theo Ghenda
Steel Institute VDEh
• Marten Sprecher
Fraunhofer institute
• Marlene Arens
ArcelorMittal
• Jean-Sebastien Thomas, Karl Buttiens
Tata Steel
Iron & steel specific
The following stakeholders will be provided with an
opportunity to review the steel assumptions (1)
All sectors (interaction planned later)
Think tanks
• WBCSD
• GIZ
Academic
• Tsinghua University • UK Engineering and Physical Sciences
Research Council (EPSRC), author of With
both eyes open, Jonathan M Cullen
• LBNL (China Energy Group) NGOs
• Greenpeace
• WWF
Legend
Workshop presence
The following additional stakeholders should be provided with an
opportunity to review during the call for evidence
• Dr Daniel Mueller (NTNU)
• Dr Peter Hodgson (Tata)
• Hiroki Hatayama , Ichiro Daigo (Uni of Tokyo)
• Tao Wang (NTNU / Japan)
• Ernst Worrell (Utrecht)
• Tata :“Pepan Prong” and/or “Paul Brooks” through Martin
NOTE: (1) The stakeholders do not validate or endorse the assumptions described in this document, the assumptions are
the sole choice of the Global Calculator team
Global Calculator
8
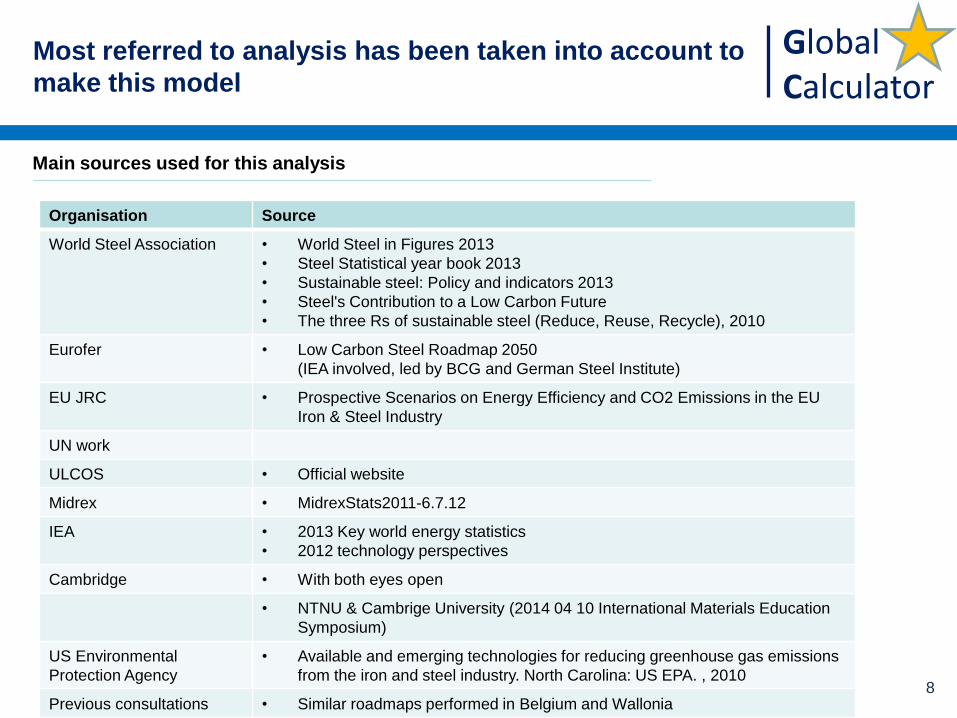
Most referred to analysis has been taken into account to
make this model
Main sources used for this analysis
Organisation Source
World Steel Association
• World Steel in Figures 2013
• Steel Statistical year book 2013
• Sustainable steel: Policy and indicators 2013
• Steel's Contribution to a Low Carbon Future
• The three Rs of sustainable steel (Reduce, Reuse, Recycle), 2010
Eurofer • Low Carbon Steel Roadmap 2050
(IEA involved, led by BCG and German Steel Institute)
EU JRC • Prospective Scenarios on Energy Efficiency and CO2 Emissions in the EU
Iron & Steel Industry
UN work
ULCOS • Official website
Midrex • MidrexStats2011-6.7.12
IEA • 2013 Key world energy statistics
• 2012 technology perspectives
Cambridge • With both eyes open
• NTNU & Cambrige University (2014 04 10 International Materials Education
Symposium)
US Environmental
Protection Agency
• Available and emerging technologies for reducing greenhouse gas emissions
from the iron and steel industry. North Carolina: US EPA. , 2010
Previous consultations • Similar roadmaps performed in Belgium and Wallonia
A study released in september 2013, involving
ULCOS, was providing costs on several
technologies adressed in the model
Global Calculator
• Introduction to the Global Calculator 9-10h
• Iron & steel demand prospective 10-11
• Iron & steel manufacturing with lower 11h30-13h
energy intensity
10
Agenda
Content

Global Calculator
11
Agenda
Steel demand perspectives
Current situation
Steel demand drivers
Resulting steel demand at constant technology

Global Calculator
Industry is ~35% of final energy use,
it mainly relies on fossil fuels
SOURCE: ETP 2012, IEA
NOTES: (1) Worldsteel recently raised the steel specific energy consumptions, this is not yet reflected by this picture
(2) Energy consumption is dominated by fossil fuels in all sectors
Energy Sankey in 2009, (EJ)
Total final
energy use
358 EJ
12

Global Calculator
Steel currently represents ~20% of the industry energy
use, and mainly relies on coal
Energy Sankey in 2009 for the industry , (EJ)
Final energy use
466 EJ
14 SOURCE: ETP 2012, IEA
NOTES: (1) Worldsteel recently raised the steel specific energy consumptions, this is not yet taken into account in this picture
(2) Energy consumption is dominated by fossil fuels in all sectors
Global Calculator
15
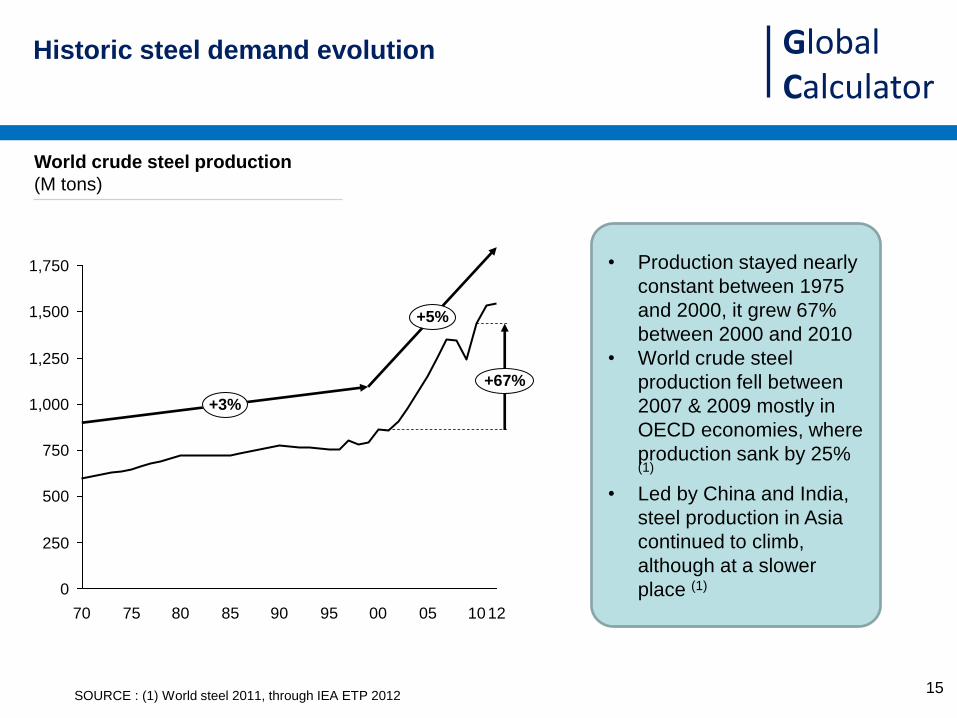
Historic steel demand evolution
World crude steel production
(M tons)
• Production stayed nearly
constant between 1975
and 2000, it grew 67%
between 2000 and 2010
• World crude steel
production fell between
2007 & 2009 mostly in
OECD economies, where
production sank by 25% (1)
• Led by China and India,
steel production in Asia
continued to climb,
although at a slower
place (1)
SOURCE : (1) World steel 2011, through IEA ETP 2012
1,500
1,750
1,250
1,000
750
500
250
0
00 95 90 85 80 75 70
+67%
+5%
+3%
12 10 05

Global Calculator
At global level, steel production is correlated to GDP
16
• Historical correlation
between steel
production and GDP
suggest a long term
1-1 relationship
• Global demand
growth is driven by
emerging markets
SOURCE : World steel association and World Bank
World steel production and world GDP evolution
(units production, GDP indexed on 1980 steel production level)
0.8
1
1.2
1.4
1.6
1.8
2
2.2
2.4
2.6
2.8
19
80
19
82
19
84
19
86
19
88
19
90
19
92
19
94
19
96
19
98
20
00
20
02
20
04
20
06
20
08
20
10
Ind
ex
in b
ase
19
80
GDP
Steel
BACKUP
Global Calculator
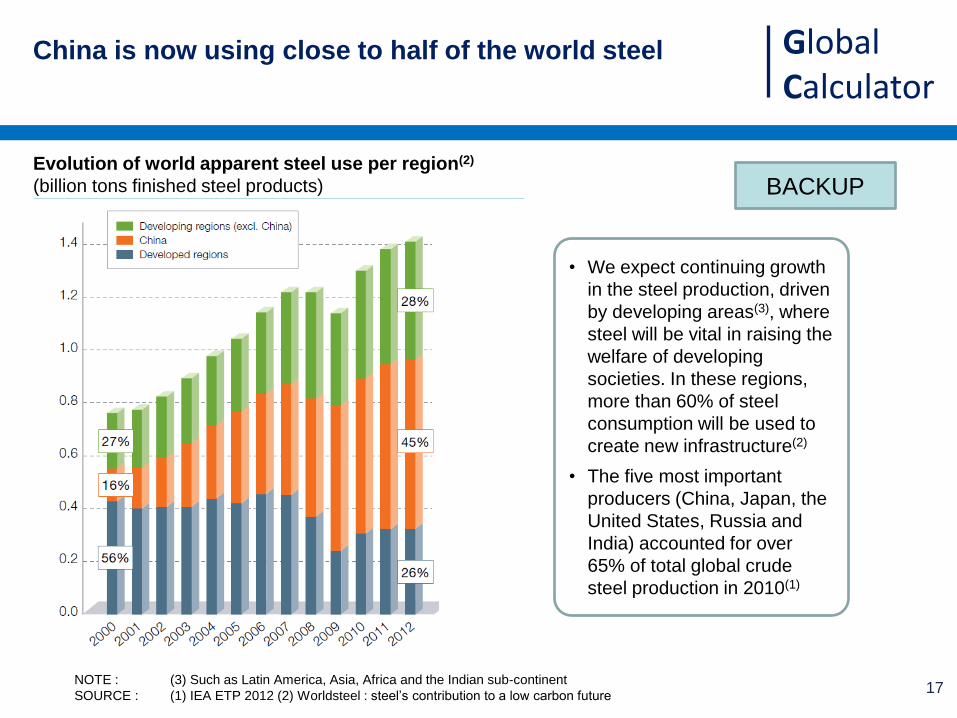
China is now using close to half of the world steel
17 NOTE : (3) Such as Latin America, Asia, Africa and the Indian sub-continent
SOURCE : (1) IEA ETP 2012 (2) Worldsteel : steel’s contribution to a low carbon future
• We expect continuing growth
in the steel production, driven
by developing areas(3), where
steel will be vital in raising the
welfare of developing
societies. In these regions,
more than 60% of steel
consumption will be used to
create new infrastructure(2)
• The five most important
producers (China, Japan, the
United States, Russia and
India) accounted for over
65% of total global crude
steel production in 2010(1)
• If not found, use steel
in figure of different
years
Evolution of world apparent steel use per region(2)
(billion tons finished steel products) BACKUP

Global Calculator
18
Agenda
Steel demand perspectives
Current situation
Steel demand drivers
Resulting steel demand at constant technology

Global Calculator
19
• Taking advantage
of the global
scope, the
materials analysis
can include
embedded
emissions and
resources impact
• Part of the product
demand is a model
input, another is
generated by the
requirements of
other sectors Products
Materials
Resources
Value chain Illustrations
Steel Cement Aluminium Chemicals Pulp
& paper
Biomass
Fossil
hydro-
carbons
Energy analysis
Rare
materials Uranium Sand
Iron
ore
Materials analysis
1 The analysis starts from the demand for products and
derives material production and resource use

Global Calculator
20
Steel materials characteristics (including various alloys and treatments)
SOURCE: with both eyes open
Half the construction
steel is for rebar with
cement, the 2
materials
complement each
other (cement
protects from
corrosion and steel
is strong in traction)
Solid Steel is often used to make strong stiff (non-flexible)
structures
It is tough and crack don’t appear easily (vs ceramics)
It can also be used to make cables (only resistant in
traction)
Stable Low thermal expansion (similar to cement)
Durable High melting temperature and can be protected from
corrosion
Ductile/
Recyclable
Steel can be made to change shape without cracking.
Through melting, steel can theoretically be recycled an
infinite number of times
Affordable/
Available
Steel is relatively cheap, and there are large reserves
of iron ore. It tends to be more expensive than some
other durable materials (e.g. cement and timber)
Conductor Can be used to conduct heat and electricity (less than
several other metals such as aluminium or copper)
1 Steel offers unique combination of characteristics:
Toughness, Thermal expansion, Corrosion resistance,
Electrical resistance, Ductility, and Availability

Global Calculator
21
1 Iron & steel demand driving products
July 16
Steel
1518 Mt steel
2991 M tCO2e
1,97 tCO2e/t steel
Transport
Industrial equipment
Construction
Metal products
Cars & light trucks
Trucks
Electrical equipment
Mechanical equipment
Infrastructure
Residential Buildings
Metal goods
Consumer packaging
Domestic appliances
8%: 123 Mt steel
2%: 28 Mt steel
3%: 46 Mt steel
10%: 153 Mt steel
22%: 332 Mt steel
28%: 422 Mt steel
13%: 193 Mt steel
1%: 11 Mt steel
3%: 43 Mt steel
16%: 247 Mt steel
55%: 832 Mt steel
16%: 246 Mt steel
13%: 194 Mt steel
Steel driving products
(2011)
NOTES: (1)There are other products, these have been diluted amongst the existing categories
(2) Half the “Construction” steel is used for rebar with cement
SOURCES: With both eyes open, Copyright 2012 UIT Cambridge Ltd, adapted by Climact to 2011 figures
Ships 2%: 23 Mt steel
Other Buildings 5%: 77 Mt steel
Windmills
PV Panels
Pipes
0,4%: 6 Mt steel
0,02%: 0,3 Mt steel
3%: 40 Mt steel
Energy
0,6%: 10Mt steel
Rail 1%: 20 Mt steel

Global Calculator
22
(World steel estimate approximately 71 million cars in
2008, based on ‘Determination of Weight Elasticity of
Fuel Economy for Conventional ICE Vehicles, Hybrid
Vehicles and Fuel Cell Vehicles’, fka, June 2007
Worldsteel estimate almost 200 billion cans of food are produced each year
Zhang : it is just the ground surface, not
including the public area and road area.
JPE
Selon les données IEA, il y a un stock de 1454
Millions de voitures, avec un lifetime moyen de
12,5, donc 116 Mios par an de nouvelles
MC
Ah, alors, il faudra mettre à jour la section
transport du modèle ;-)
JPE
Ou sont les trains d’aillerus ?
MC
On les neglige car c’est pas une grande partie
du total (contrairement à l’alu)
31.1 GW of new PV installations were
added in 2012 (EPIA)
35.2 GW of new Wind installations were
added in 2012 (http://www.gwec.net/)
(World steel estimate approximately 71 million cars in
2008, based on ‘Determination of Weight Elasticity of
Fuel Economy for Conventional ICE Vehicles, Hybrid
Vehicles and Fuel Cell Vehicles’, fka, June 2007
photovoltaic panels came out to 15,8
kg/m^2.
Assumption 2kg is steel
1 Today, this is the model generated demand, it will
evolve based on Product demand defined by the other
sectors
Technologies &
Products
Annual Steel production
(M tons, 2011)(2)
Intensity
(t steel/product)
Amounts
(units, 2011)
Total 1518 Mton
(100%) NOTE: (2) Linking product to material demand for a same year is a modelling simplification; in reality, the
material production can happen several years before the product delivery
(4) Of ground surface
SOURCE: (1) Muiris Moynihan thesis obtains 20kg/m² for residential buildings and 100 kg/m² for commercial
(2) With both eyes open (3) Worldsteel Wind energy case study
Transport
Cars & light truck 113 (M Vehicles) 1100 kg/vehicle 123
Trucks 5,7 (M Vehicles) 4900 kg/vehicle 28
Ships 1 (k units) 20 000 23
Rail 5 (k units) 4000 20
Buildings
Buildings Residential 3 930 (km² (4)) 107 kg/m² (1) 422
Buildings Others 830 (km² (4)) 93 kg/m² (1) 77
Infrastructure 1750 (km² (4)) 187 kg/m² 332
Mechanic al equipment 160 (M tons) 0,97 153
Appliance 253 (M tons) 0,17 43
Consumer
goods
Metal goods 257 (M tons) 0,75 193
Consumer packaging 530 (M tons) 0,02kg/kg packaging 11
Energy
Windmills 17,500 2MW turbines 350 tons/2MW
turbine(3) 6,1
PV panels 160 M m² 2kg /m² 0,320
Electrical equipment 61,1 (M tons) 0,75 46
CCS + oil pipes 100 000 km 0,4 ton/m 40
Other Other Steel ~0M (tons) 1 ~0
Model demand
drivers
Update July 16
Global Calculator
23
Agenda
Steel demand perspectives
Current situation
Steel demand drivers
Resulting steel demand at constant technology

Global Calculator
24
Evolution of steel per capita consumption as function of GDP per capita
(ton/person, 1990 International $/person)(1)
SOURCES: (1) With both eyes open, Copyright 2012 UIT Cambridge Ltd.
(2) NTNU & Cambrige University (2014 04 10 International Materials Education Symposium)
• Steel Demand can be
correlated to national
incomes, up to ~$20-000
/person, but then the
increase declines, when
demand for new products,
buildings & infrastructure
has been satisfied
• Steel stocks appear to
saturate between 8 & 12
tons /person (2)(1)
• This indicates we will
reduce our consumption to
a level were we will
consume what needs to be
replaced
• Per capita consumption of crude steel
amounted to 201 kilograms (kg) in 2010
• the consumption rate is expected to
increase to between 270 kg/capita and
319 kg/capita by 2050
1 As income /person increases, steel demand
increases, an upper boundary is experienced in some
countries

Global Calculator
25 SOURCE: (1) IEA ETP 2012 (2) With both eyes open (3) UN projection scenarios (4) WorldSteel
Population
evolution
7 billion people in 2010(3)
8-10 billion people in 2050 (3)
Demand per capita
evolution
Per capita
• 201 kg/capita in 2010
• 225-270 kg/capita in 2050 (4)
• 270-319 kg/capita in 2050 (1)
Regional changes We expect continuing growth in the steel production, driven by developing areas(3), where
steel will be vital in raising the welfare of developing societies. In these regions, more than
60% of steel consumption will be used to create new infrastructure(2)
Market segment
changes
• Increasing share of manufactured steel goods vs buildings & infrastructure
(building and infrastructure construction slows in China into 2050, and China's demand
for steel containing goods such as cars & domestic appliances increases) (4)
Total range • Based on the above indicative range between 1608 to 3190 M tons in 2050
• IEA ETP 2012 has 2438 to 2943 M tons in 2050
Rationale for assessing future steel production
1 Rationale for expected 2050 Iron & steel demand (1/2)

Global Calculator
26
Technologies &
Products
Evolution driven by
SOURCE: (1) Global Calculator team assumptions
Buildings Residential Building model /
Buildings Others Building model /
Infrastructure Transport demand (pass. & freight) linked to transport demand
Electrical equipment Product demand lever 100-175% evolution by 2050
Mechanic equipment Building model /
Consumer packaging Product demand lever 80-110% evolution by 2050
Appliance Building model /
Metal goods Product demand lever 80-120% evolution by 2050
Cars & light truck Transport model /
Trucks Transport model /
Ships Transport model /
Rail Transport model /
Windmills Supply model /
PV panels Supply model /
CCS + oil pipes Not linked in this version of the model /
Other Steel Product demand lever 100%-175% evolution by 2050
1 Rationale for expected 2050 Iron & steel demand (2/2)
Assumptions (if by product demand)
July 17
Global Calculator
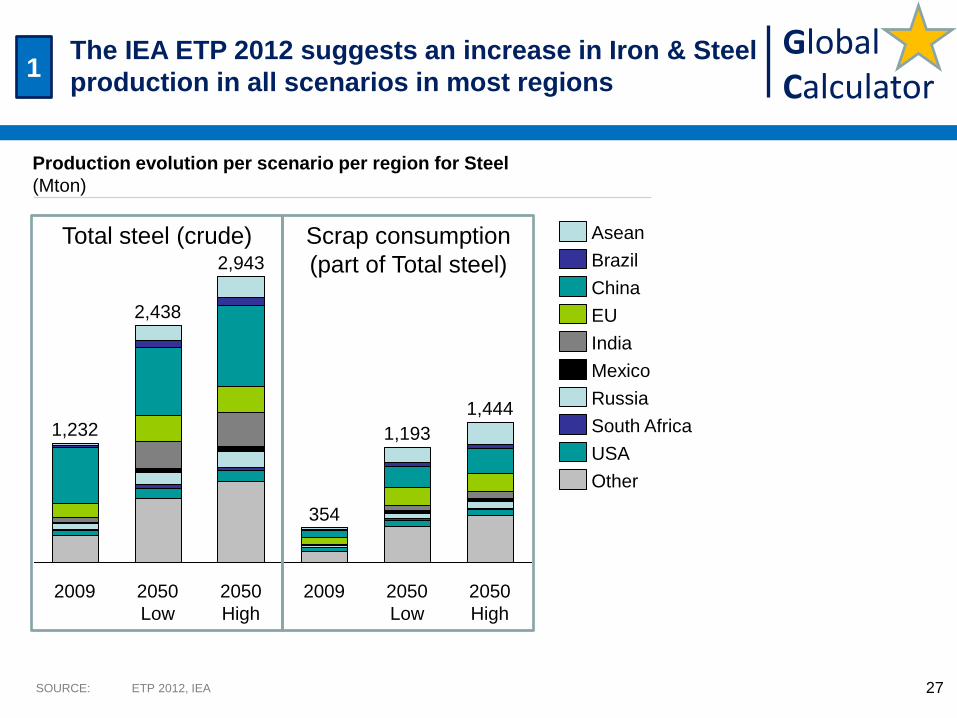
SOURCE: ETP 2012, IEA 27
Production evolution per scenario per region for Steel
(Mton)
2050
Low
1,444
2009
1,193
2050
Low
2009 2050
High
2,438
354
1,232
2050
High
2,943
Asean
Brazil
Mexico
USA
Other
South Africa
Russia
China
EU
India
Total steel (crude) Scrap consumption
(part of Total steel)
JPE
Production? Je préfèrerais parler de demand
What is low, what is high?
World steel comment:
the global figures for 2030 are as follows:
Total crude steel production:
2030 range: 1980-2450 Mt
Global scrap demand for steelmaking:
2030 range: 750 - 950 Mt
The numbers are taken from the book "Sustainable
materials. With both eyes open", Worldsteel is using
another methodology and sector definition. We will
need to find a common ground to compare the
numbers.
1 The IEA ETP 2012 suggests an increase in Iron & Steel
production in all scenarios in most regions

Global Calculator
29
2010 2015 2020 2025 2030 2035 2040 2045 2050
0
1
2
3
4
5
6
7
8
9
10
11
Medium variant
High variant
Low variant
World population
(billions)
+57%
+38%
+21%
2010-2050 growth
(%)
SOURCE: http://esa.un.org/unpd/wpp/unpp/panel_population.htm 2012 revision
1 By 2050, the world population is expected by the UN
to grow by ~20 to ~55%
Global Calculator
30
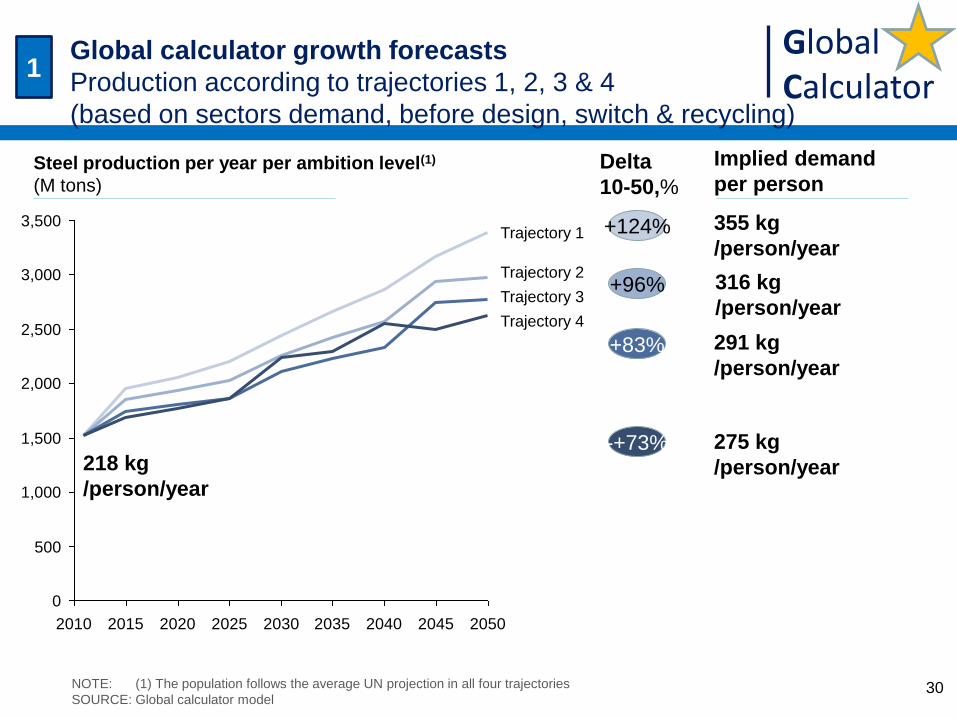
Steel production per year per ambition level(1)
(M tons)
+124%
+96%
Delta
10-50,%
2010 2015 2020 2025 2030 2035 2040 2045 2050
2,000
3,500
3,000
2,500
1,500
1,000
500
0
Trajectory 4
Trajectory 3
Trajectory 2
Trajectory 1
-+73%
+83%
Implied demand
per person
355 kg
/person/year
316 kg
/person/year
291 kg
/person/year
275 kg
/person/year 218 kg
/person/year
NOTE: (1) The population follows the average UN projection in all four trajectories
SOURCE: Global calculator model
1 Global calculator growth forecasts
Production according to trajectories 1, 2, 3 & 4
(based on sectors demand, before design, switch & recycling) Jonathan has 1150 in level
4
July 17, 1,2,3, 4
updated

Global Calculator
31
Steel production per year per ambition level(1)
(M tons)
4
2,626
3
2,777
2
2,976
1
3,393
2011
1,518
Appliance
Mechanical equipments
Other buildings
Residential buildings
Rail
Ships
Trucks
Cars & light truck EV
Cars & light truck
PV panels
Wind turbines
Consumer packaging
Metal goods
Electrical equipment
Pipes
Other steel
Infrastructure
Trajectories in 2050
NOTE: (1) The population follows the average UN projection in all four trajectories
SOURCE: IEA ETP 2012, Global calculator model
1 Global calculator growth forecasts
Key driving demand sectors in trajectories 1, 2 and 3
July 17, 1,2,3,4
updated

Global Calculator
• Introduction to the Global Calculator 9-10h
• Iron & steel demand prospective 10-11
• Iron & steel manufacturing with lower 11h30-13h
energy intensity
32
Agenda
Content

Global Calculator
33
Agenda
Steel manufacturing with lower energy intensity
Steel manufacturing process
Estimation of the reduction potentials
Resulting scenarios

Global Calculator
Raw materials extraction
Preparation Iron/ iron
cast production
Steel production
Intermediary
treatments Shaping Products
Blast furnace Oxygen steel
production
Hot rolling
Final products
Electric arc
furnace
Scrap
3 technologies are currently used to make most of the
steel
34
Electric Arc Furnaces
(scrap based)
Integrated steel production
NOTE: (1) DRI is illustrated here with the Electric arc furnaces. It can also be performed with Blast furnaces
SOURCE: GSV, World Steel, Climact
Coal Coke
Coke
Iron ore
Sinter
Sintering
Cokes production
Steel
Hot rolling mill
Steel
Electricity
Iron
Oxygen
Tubes
Bills
Coils
Direct reduction iron (1)
Coal/Natural gas
Pellets
Technology
Scrap
Iron ore
Scrap
Pelletizing
Pellets Iron ore
Direct reduction
Pelletizing
Iron ore
Hot metal
(variable)
Treatments
Reheating,
Galvanising,
…

Global Calculator
SOURCES: Climact
Steel
Production
Energy Intensity
Production
Energy Intensity
Production
Energy Intensity
Electric steel
Oxygen steel
BOF
DRI EAF
Top Gas /HIsarna
Production
Energy Intensity
Process intensity
Process intensity
Process intensity
Steel emissions are being modelled
Steel emission tree
35
Global Calculator
37
Agenda
Steel manufacturing with lower energy intensity
Steel manufacturing process
Estimation of the reduction potentials
Resulting scenarios
Global Calculator
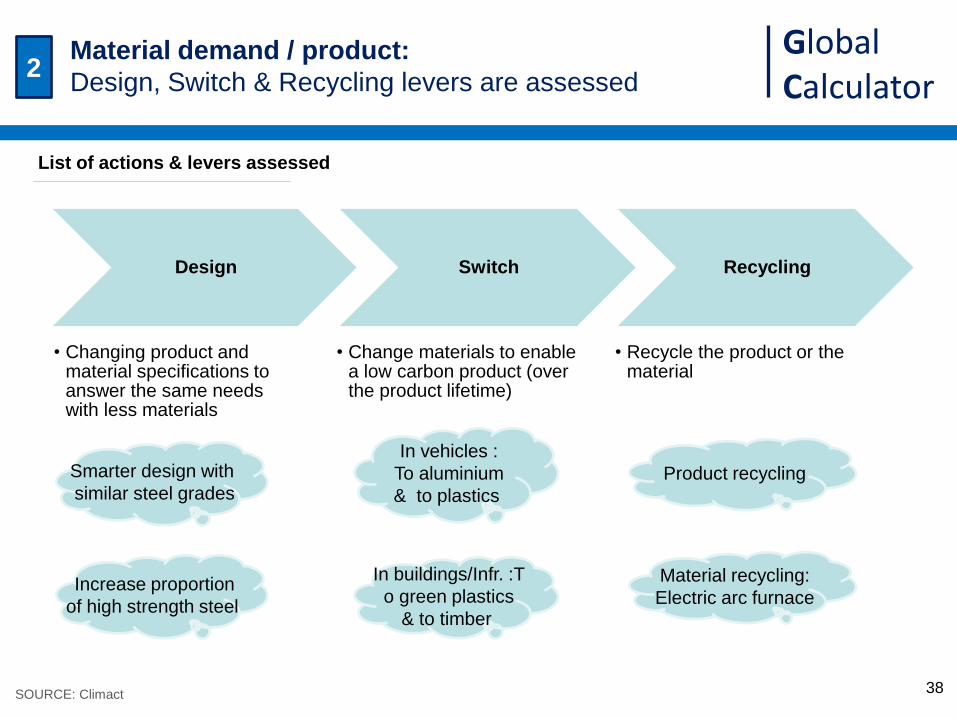
38
List of actions & levers assessed
SOURCE: Climact
2
Design
• Changing product and material specifications to answer the same needs with less materials
Switch
• Change materials to enable a low carbon product (over the product lifetime)
Recycling
• Recycle the product or the material
Material recycling:
Electric arc furnace Increase proportion
of high strength steel
In vehicles :
To aluminium
& to plastics
In buildings/Infr. :T
o green plastics
& to timber
Product recycling
Material demand / product:
Design, Switch & Recycling levers are assessed
Smarter design with
similar steel grades
Global Calculator
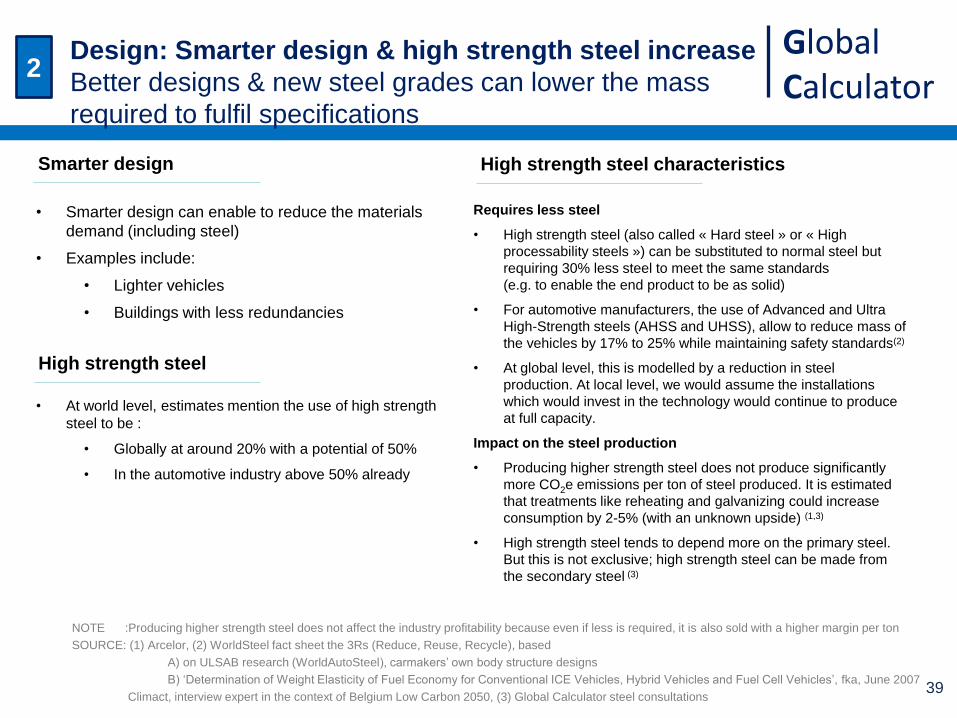
39
Requires less steel
• High strength steel (also called « Hard steel » or « High
processability steels ») can be substituted to normal steel but
requiring 30% less steel to meet the same standards
(e.g. to enable the end product to be as solid)
• For automotive manufacturers, the use of Advanced and Ultra
High-Strength steels (AHSS and UHSS), allow to reduce mass of
the vehicles by 17% to 25% while maintaining safety standards(2)
• At global level, this is modelled by a reduction in steel
production. At local level, we would assume the installations
which would invest in the technology would continue to produce
at full capacity.
Impact on the steel production
• Producing higher strength steel does not produce significantly
more CO2e emissions per ton of steel produced. It is estimated
that treatments like reheating and galvanizing could increase
consumption by 2-5% (with an unknown upside) (1,3)
• High strength steel tends to depend more on the primary steel.
But this is not exclusive; high strength steel can be made from
the secondary steel (3)
NOTE :Producing higher strength steel does not affect the industry profitability because even if less is required, it is also sold with a higher margin per ton
SOURCE: (1) Arcelor, (2) WorldSteel fact sheet the 3Rs (Reduce, Reuse, Recycle), based
A) on ULSAB research (WorldAutoSteel), carmakers’ own body structure designs
B) ‘Determination of Weight Elasticity of Fuel Economy for Conventional ICE Vehicles, Hybrid Vehicles and Fuel Cell Vehicles’, fka, June 2007
Climact, interview expert in the context of Belgium Low Carbon 2050, (3) Global Calculator steel consultations
Smarter design
2 Design: Smarter design & high strength steel increase
Better designs & new steel grades can lower the mass
required to fulfil specifications
High strength steel characteristics
• Smarter design can enable to reduce the materials
demand (including steel)
• Examples include:
• Lighter vehicles
• Buildings with less redundancies
High strength steel
• At world level, estimates mention the use of high strength
steel to be :
• Globally at around 20% with a potential of 50%
• In the automotive industry above 50% already

Global Calculator
40 NOTE:(2) Assuming the additional capex is balanced by the input reduction
SOURCE: Climact national consultations
Lever cost (2)
€/t crude steel
Input (fuel & material) -x
Other opex 0
Capex +x
0
5
10
15
20
25
30
35
40
45
50
1990 2000 2010 2020 2030 2040 2050
50%
40%
30%
20% 20%
Share of high strength steel
(%)
• High strength steel is modelled
requiring 30% less steel
• Upside on smart design and
downside on additional specific
consumption of high strength
steel not modelled and
assumed to balance one
another
Ambition 1
Ambition 4
Ambition 3
Ambition 2
Modelled
May 6 2
Design: Smarter design & high strength steel increase
Proposed lever ambitions

Global Calculator
41 NOTE : (1) Refer to “With both eyes open” for more details on the definition of useful costs
SOURCE: (1) With both eyes open
0
50
100
150
200
Wood
Sto
ne
Pla
stics
Concre
te
Ste
el
Alu
min
ium
Embodied energy
(Gj/t)
20%10%
Wo
od
Sto
ne
Pla
stics
Co
ncre
te
Ste
el
Alu
min
ium
180% 217%
100%
350%
Relative useful costs (1)
(relative to steel at 100%)
Embodied energy to
convert the material in
useful form
Relative cost per tonne to
convert the materials in
useful form
• Compared to other
metals, steel has
lower embodies
energy and costs
• Concrete and stone
are not substitutes as
they are weak in
tension
• Aluminium does not
score well but
enables lighter
products
2 Material switch
Steel is a relatively cheap material

Global Calculator
42
Materials which can replace /be replaced by steel
SOURCE: With both eyes open
(1) With both eyes open (Orr et Al. (2010), research of efficient concrete shapes
Aluminium Density
Less strong, less
recyclable
Higher cost & embodied
energy
Up to 20% steel can be
replaced by aluminium
Not applicable
Concrete Steel compatibility (rebar),
Low cost & embodied
energy, no corrosion
Weak in tension
Non recyclable
Not applicable Would be modelled by
smart design
Plastics (Composite materials,
glass/ carbon fibres
reinforced epoxies)
Density, Strength per
density (of some plastic
types)
Lower recyclability
Less reparable (e.g.
carbon fibre cars)
Higher embodied energy
Difficult manufacturing
Up to 20% steel can be
replaced by carbon
fibre (HVC)
Not applicable
Stone & Masonry Lower embodied
emissions
Must be reinforced with
mortar (from cement)
Cannot be reinforced or
moulded into shapes
Not applicable Not applicable
Timber Strength and stiffness per
density (1)
Less durable, requires
protection against fire and
rot, less stable
Lower, uniformity
Not applicable Up to 20% steel can be
replaced by timber in
buildings
Characteristics
Vehicles (8%) Buildings/
Infrastructure (38%)
Steel replacement assumption
Advantages Weaknesses
2 Material switch
Steel can be substituted to enable less CO2 emissions
along product life cycles
Global Calculator
43
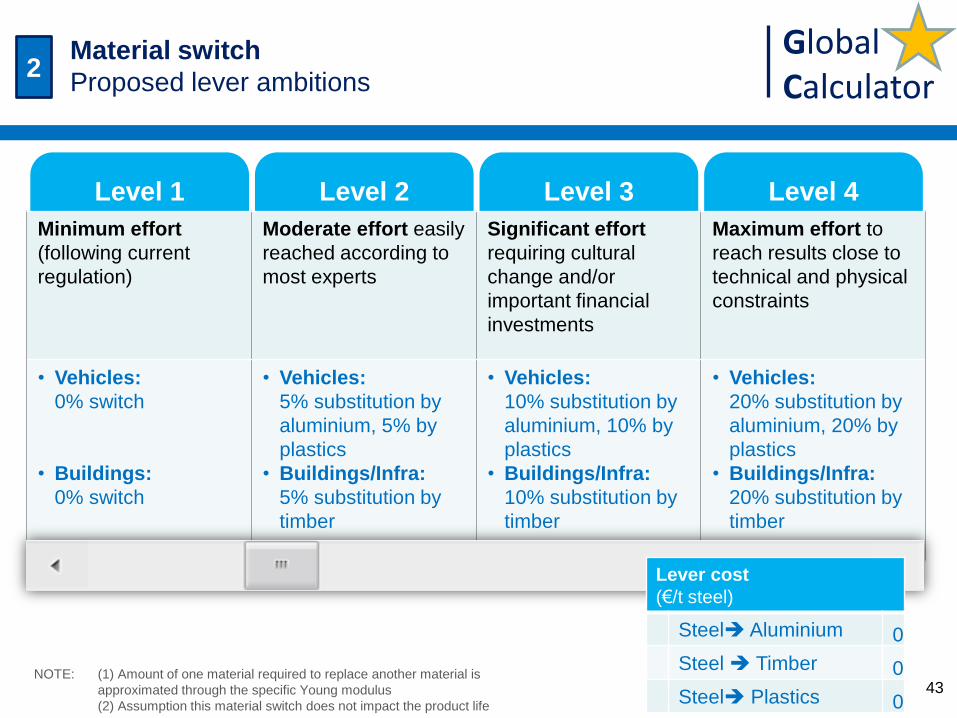
Level 1 Level 2 Level 3 Level 4
Minimum effort
(following current
regulation)
Moderate effort easily
reached according to
most experts
Significant effort
requiring cultural
change and/or
important financial
investments
Maximum effort to
reach results close to
technical and physical
constraints
• Vehicles:
0% switch
• Buildings:
0% switch
• Vehicles:
5% substitution by
aluminium, 5% by
plastics
• Buildings/Infra:
5% substitution by
timber
• Vehicles:
10% substitution by
aluminium, 10% by
plastics
• Buildings/Infra:
10% substitution by
timber
• Vehicles:
20% substitution by
aluminium, 20% by
plastics
• Buildings/Infra:
20% substitution by
timber
Lever cost
(€/t steel)
Steel Aluminium 0
Steel Timber 0
Steel Plastics 0
Modelled
May 5 cfr
cross sector
analysis
2 Material switch
Proposed lever ambitions
NOTE: (1) Amount of one material required to replace another material is
approximated through the specific Young modulus
(2) Assumption this material switch does not impact the product life
Global Calculator
44
• When using steel based products,
both the products (cars,
appliances, etc.) and the materials
(scrap steel) can be reused
• The products reusing lever is
currently not modelled, this is due
to lack of data, and perception this
lever has a lower impact
SOURCE: (1) Worldsteel factsheet on the 3Rs (Reduce, Reuse, Recycle)
Illustrations on Products
• In North America
approximately 33% of
the straight railway
track sections
purchased comes
from used rail that is
disassembled at
redevelopment sites (1)
Rationale on reusing the products
2 Reusing the products
The steel product reusing lever is not modelled

Global Calculator
45
• Steel is the world’s most recycled
material (3)
• We are still a long way from collecting all
our discarded metals for recycling
• Steel reinforcement bars in sub
surface concrete (e.g. foundations
and tunnels) are currently not
extracted at end of life (2)
• Deep sea line pipes are not
removed at the end of their lives
• 100-150$/ton scrap is required in order to
have economically viable recovery of
scrap (high scrap prices will drive up the
scrap collection price) (4)
• Maximum recycling rates for steel might
be at 90%(1)
SOURCE: (1) Professor Robert Ayres (INSEAD) (2) (with both eyes open) (3) Worldsteel fact sheet, the 3 Rs(Reduce, Reuse,
Recycle) (4) Global Calculator consultations
Rationale on steel recycling Worldsteel recycling rate targets (3)
(2007 est. and 2050 objectives, %)
Total
Construction
Automotive
Machinery
90% 85%
95% 85%
95% 90%
50% 75%
75%
90%
Appliances
Containers 69%
83%
2050 Worldsteel objective
2007 est.
2 Materials recycling : Scrap based steel
Up to 90% of steel could come from be recycled streams
by 2050
Global Calculator
46
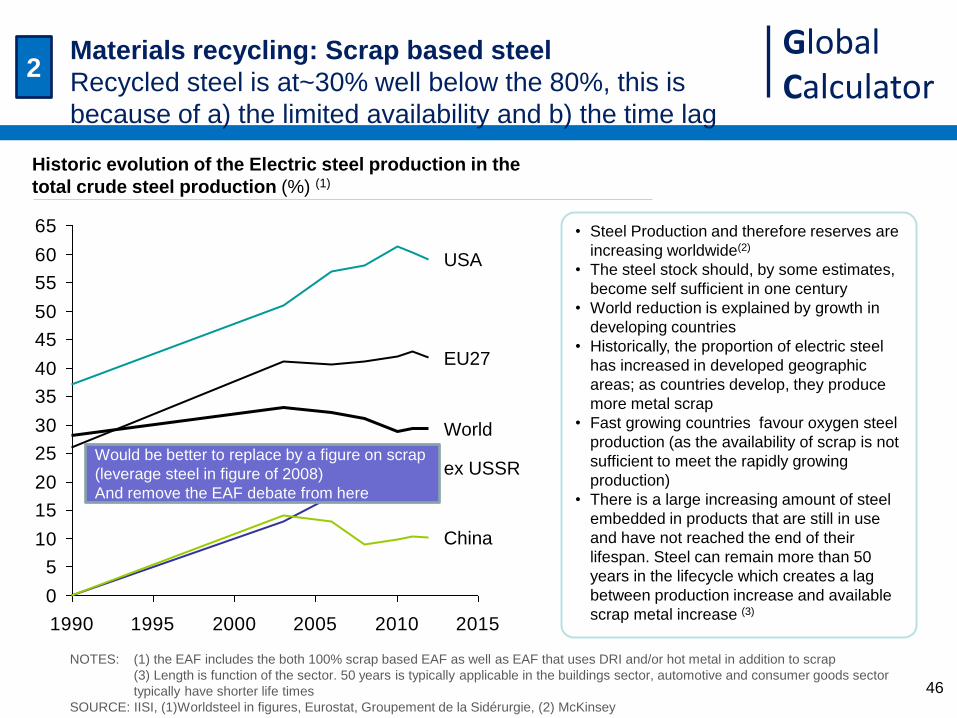
Historic evolution of the Electric steel production in the
total crude steel production (%) (1)
NOTES: (1) the EAF includes the both 100% scrap based EAF as well as EAF that uses DRI and/or hot metal in addition to scrap
(3) Length is function of the sector. 50 years is typically applicable in the buildings sector, automotive and consumer goods sector
typically have shorter life times
SOURCE: IISI, (1)Worldsteel in figures, Eurostat, Groupement de la Sidérurgie, (2) McKinsey
• Steel Production and therefore reserves are
increasing worldwide(2)
• The steel stock should, by some estimates,
become self sufficient in one century
• World reduction is explained by growth in
developing countries
• Historically, the proportion of electric steel
has increased in developed geographic
areas; as countries develop, they produce
more metal scrap
• Fast growing countries favour oxygen steel
production (as the availability of scrap is not
sufficient to meet the rapidly growing
production)
• There is a large increasing amount of steel
embedded in products that are still in use
and have not reached the end of their
lifespan. Steel can remain more than 50
years in the lifecycle which creates a lag
between production increase and available
scrap metal increase (3)
Iron and steel manufacturing switches
away from coal-based direct reduced iron
(DRI),mostly in India and South Africa,
while Russia, the Middle East, Latin
America and Africa increase their use of
gas-based DRI.
ETP 2012
0
5
10
15
20
25
30
35
40
45
50
55
60
65
1990 1995 2000 2005 2010 2015
World
China
USA
ex USSR
EU27
2 Materials recycling: Scrap based steel
Recycled steel is at~30% well below the 80%, this is
because of a) the limited availability and b) the time lag
Would be better to replace by a figure on scrap
(leverage steel in figure of 2008)
And remove the EAF debate from here

Global Calculator
47
2010 2020 2030 2040 2050
0
2,000
4,000
184%
-51%
141%
Steel High
Steel Low
Scrap High
Scrap Low
-53%
IEA
Confidential data
until S
epte
mber
IEA estimates on the availability of scrap in the 2-4-6DS scenarios
(Mt)
• Steel scrap is expected to increase by
140-180%
• In future versions of the model, the
scrap availability will be fixed directly
in the model
• Worldsteel forecasts 40% recycled
steel in 2050. 50% supply from scrap
is a reasonable scenario, but
dependent on many factors
(e.g. economics for energy, raw
materials and scrap prices and cost
and overall demand region or country
by country etc.)(2)
• Higher scrap estimates (up to 75%),
assuming 25% additional by including
industrial scrap (3)
• Scrap availability rate could go much
higher by 2100 (3)
SOURCE: IEA ETP 2012, (2) Worldsteel, (3) With Both Eyes open
2 Materials recycling: Scrap based steel
Scrap availability is limited

Global Calculator
48
Primary steel flows (from ore)
(Mt/year) Secondary steel making (from scrap)
(Mt/year)
SOURCE: NTNU & Cambrige University (2014 04 10 International Materials Education Symposium)
2 Materials recycling: Scrap based steel
In lower demand scenario, NTNU & Cambridge scenarios
forecast earlier market saturation and higher scrap%

Global Calculator
49 SOURCES: (1) Wallonia Steel consultation (2) Wallonia cement consultation, (3) GSV, (4) Ulcos, (5) McKinsey , (6) Duferco, (7)
Worldsteel
EAF increase implications
• The cost /ton of EAF steel is higher (1,3,4) because of the energy consumption (6)
• EAF enables to produce the steel for all applications(7). However, BOF production
produces higher quality steel for some applications (e.g. automotive sector) (3)
• High EAF scenarios require higher quality Scrap metals collection
• The reduction of BOF has a negative impact on other industries (e.g. cement
uses blast furnaces slag to produce composed/metallurgic cements which emit
less CO2 (2))
• In a world with overcapacity, EAF ovens offer more flexibility to be turned on or off
2 Materials recycling: Scrap based steel
Transition to EAF has impacts in terms of product quality
and price
Global Calculator
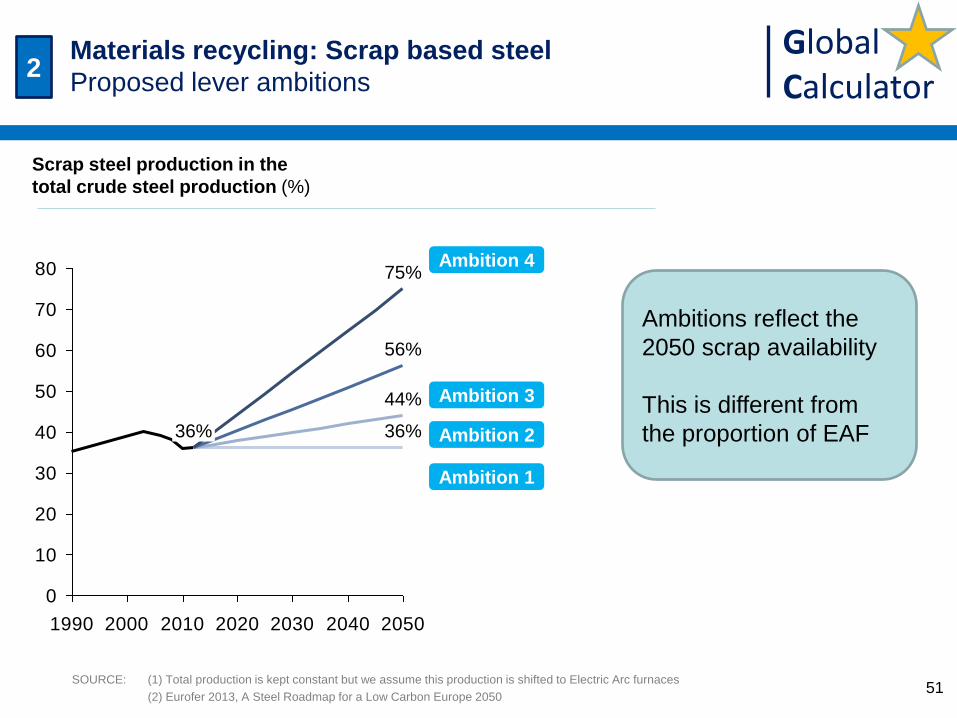
51 SOURCE: (1) Total production is kept constant but we assume this production is shifted to Electric Arc furnaces
(2) Eurofer 2013, A Steel Roadmap for a Low Carbon Europe 2050
0
10
20
30
40
50
60
70
80
1990 2000 2010 2020 2030 2040 2050
75%
56%
44%
36% 36%
Scrap steel production in the
total crude steel production (%)
Ambitions reflect the
2050 scrap availability
This is different from
the proportion of EAF
Ambition 4
Ambition 3
Ambition 2
Ambition 1
Modelled
May 5th
If the cap is not on on scrap availability,
you would only need ~20% non recycled
steel
A refined model would set a rather fixed
srap availability, to account for the long
time steel is embedded in products, and
then calculate the max% recycled as
function of the demand
2 Materials recycling: Scrap based steel
Proposed lever ambitions

Global Calculator
52
List of actions & levers assessed
3
Process improvement
• Towards fuels which emit less CO2
Fuel substitution
• Modification of processes
Energy efficiency
• Reduce mechanical and thermal losses
• Recuperate thermal energy (CHP)
End of pipe technologies
• Carbon capture and storage
Improvements in
current process
Portion of Classic
/Top gas recycling
& Hisarna in oxygen
Coal PCI
substitution by
biomass
CCS
implementation
Smelt reduction
potential(1)
Electrolysis
Portion of DRI
/scrap in EAF
CHP
Coke subsitution
by gas injection
Hydrogen
NOTE: Process choice has consequences on applicability of other levers Some combinations are exclusive whilst others can be added in sequential order
SOURCE: (1) (redundant with Ulcored while we represent HIsarna in this analysis
Carbon intensity of material production
Process improvements, fuel mixes, energy efficiency &
CCS are then assessed
Reduction of
carboniferous
materials
There is a slide from
world steel CO2 project
I should obtain through
Clare
CCU
Global Calculator
53 SOURCE: (1)ULCOS VDEh Germany, (2) WorldSteel Fact sheet, the 3Rs (reduce, reuse, recycle), Steel consultation Belgium Low Carbon 2050
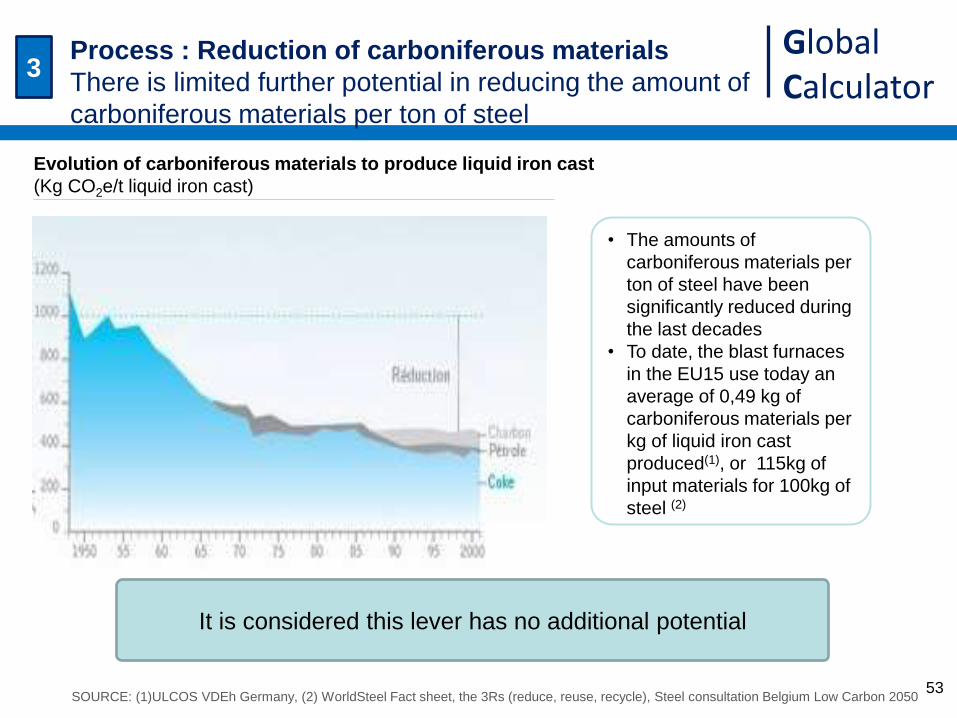
Evolution of carboniferous materials to produce liquid iron cast
(Kg CO2e/t liquid iron cast)
• The amounts of
carboniferous materials per
ton of steel have been
significantly reduced during
the last decades
• To date, the blast furnaces
in the EU15 use today an
average of 0,49 kg of
carboniferous materials per
kg of liquid iron cast
produced(1), or 115kg of
input materials for 100kg of
steel (2)
It is considered this lever has no additional potential
3 Process : Reduction of carboniferous materials
There is limited further potential in reducing the amount of
carboniferous materials per ton of steel
Global Calculator
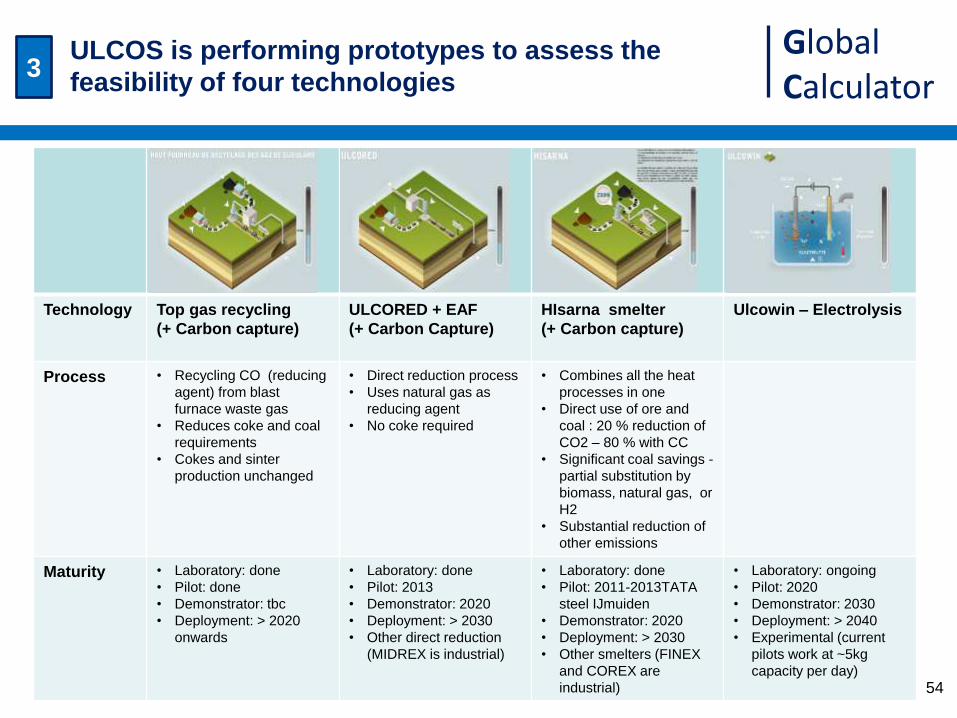
Technology Top gas recycling
(+ Carbon capture)
ULCORED + EAF
(+ Carbon Capture)
HIsarna smelter
(+ Carbon capture)
Ulcowin – Electrolysis
Process • Recycling CO (reducing
agent) from blast
furnace waste gas
• Reduces coke and coal
requirements
• Cokes and sinter
production unchanged
• Direct reduction process
• Uses natural gas as
reducing agent
• No coke required
• Combines all the heat
processes in one
• Direct use of ore and
coal : 20 % reduction of
CO2 – 80 % with CC
• Significant coal savings -
partial substitution by
biomass, natural gas, or
H2
• Substantial reduction of
other emissions
Maturity • Laboratory: done
• Pilot: done
• Demonstrator: tbc
• Deployment: > 2020
onwards
• Laboratory: done
• Pilot: 2013
• Demonstrator: 2020
• Deployment: > 2030
• Other direct reduction
(MIDREX is industrial)
• Laboratory: done
• Pilot: 2011-2013TATA
steel IJmuiden
• Demonstrator: 2020
• Deployment: > 2030
• Other smelters (FINEX
and COREX are
industrial)
• Laboratory: ongoing
• Pilot: 2020
• Demonstrator: 2030
• Deployment: > 2040
• Experimental (current
pilots work at ~5kg
capacity per day)
54
3 ULCOS is performing prototypes to assess the
feasibility of four technologies

Global Calculator
55
Ambition
Oxygen steel Electric steel
Electrolysis Classic
Top Gas
Recyling (HIsarna, not
ULCORED)
Hydrogen
based
reduction
DRI EAF EAF (Scrap)
1 70%
(7,7% scrap)
0% (-scrap)
- 5%
(3,3% scrap)
25% (25% scrap)
-
2 61%
(8,5% scrap)
2% (0,1% scrap)
- 6%
(4,2% scrap)
31% (31% scrap)
-
3 48%
(9,8% scrap)
5% (0,5% scrap)
- 8%
(5,2% scrap)
40% (40% scrap)
-
4 25%
(10,0%scrap)
10% (3% scrap)
- 10% (7% scrap)
55% (55% scrap)
-
Technology applicability along the different ambitions
(% of total steel production, (allocation available of scrap))
NOTES: Assumption all scrap is used
This lever should be used jointly with the scrap availability lever, specific consumption of the various routes is tailored, assuming
100% scrap based to be 3 times less energy intensive.
To limit economic damage, classic oxygen plants are not all decommissions by 2050, and some are converted to Top gas.
Steel overcapacity context will be adverse to change and investments
SOURCE: Global Calculator consultation & analysis
3 Process changes
For each ambition level, a combination of the various
technologies is proposed
Proportion
of scrap in
steel
production
(36%)
(44%)
(56%)
(75%)

Global Calculator
56
3 Process changes
For each process route, costs are applied
Scrap based EAF cost assumptions (2)
€/t crude steel
Input (fuel & material) 58,68
Other opex 430,32
Capex 184
Blast Oxygen furnace cost assumptions (1)
€/t crude steel Retrofit New
Input 117,36 117,36
Other opex 371,64 371,64
Capex 171 441
DRI based EAF cost assumptions (2)
€/t crude steel
Input (fuel & material) 74,36
Other opex 497,64
Capex 414
Global Calculator
58
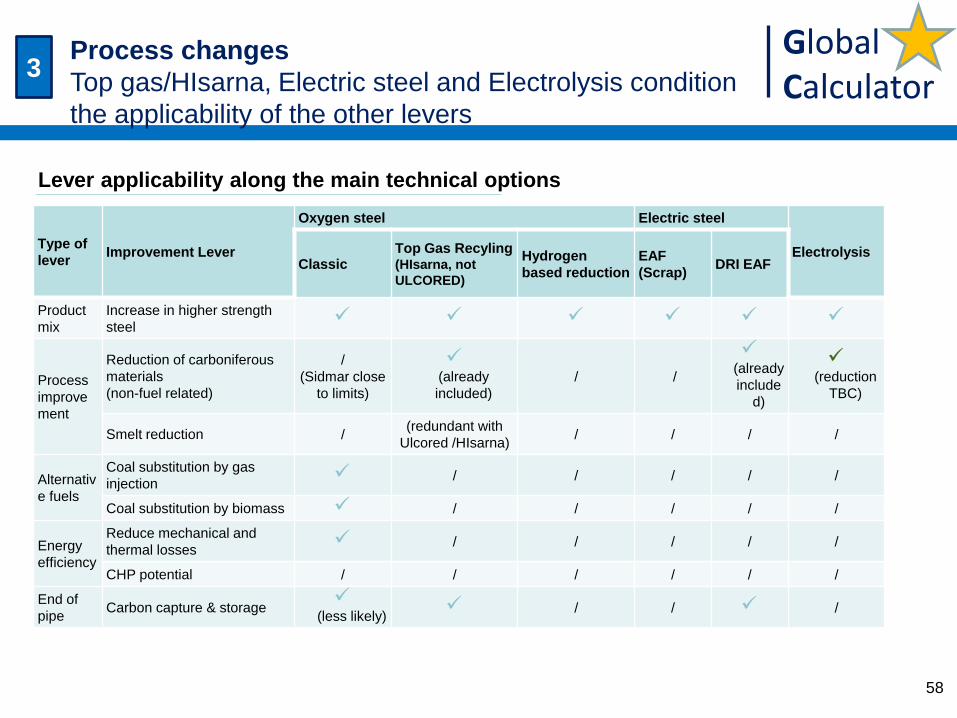
Type of
lever Improvement Lever
Oxygen steel Electric steel
Electrolysis Classic
Top Gas Recyling (HIsarna, not
ULCORED)
Hydrogen
based reduction
EAF
(Scrap) DRI EAF
Product
mix
Increase in higher strength
steel
Process
improve
ment
Reduction of carboniferous
materials
(non-fuel related)
/
(Sidmar close
to limits)
(already
included)
/ /
(already
include
d)
(reduction
TBC)
Smelt reduction / (redundant with
Ulcored /HIsarna) / / / /
Alternativ
e fuels
Coal substitution by gas
injection / / / / /
Coal substitution by biomass / / / / /
Energy
efficiency
Reduce mechanical and
thermal losses / / / / /
CHP potential / / / / / /
End of
pipe Carbon capture & storage
(less likely) / / /
Lever applicability along the main technical options
3 Process changes
Top gas/HIsarna, Electric steel and Electrolysis condition
the applicability of the other levers

Global Calculator
61
• The recent rapid expansion of crude steel production and the resulting additional
capacity positively affected the energy efficiency of the industry (1)
• Additional capacity has reduced the average age of the capital stock, and the new
plants tend to be more energy efficient, although not all have introduced BATs
• In several countries, existing furnaces have been retrofitted with energy efficient
equipment, and energy efficiency policies have led to the early closure of
inefficient plants
• The sector still has the technical potential to further reduce energy consumption
by approximately 20% (2)
• There is a multitude of process improvements such as the Near net shape casting
which can still be implemented
Insights applicable along Process improvements,
fuel substitution and energy efficiency
Source: (1) World Steel, 2011, (2) IEA ETP 2012
3 General comments
Clare will want to review this slide

Global Calculator
63 SOURCE: (1) Eurofer Steel Roadmap towards a low carbon economy 2050 (2013)
NOTES (2) Excluding decommissioning costs
Comments on EAF DRI technology
• With the data used, EAF DRI has a
specific consumption close to 4 times
the Scrap EAF and close to the BOF
• It is to note that some sources mention
that DRI enables a 20% energy
consumption reduction vs BOF(1)
• DRI based EAF production is expected
to gain share in total crude steel
production
• Assumption DRI will be used in the
future unless we don’t have any more
fracking
• In level 4, this will be 0% (no scrap left)
Modelled
3 Process improvements: Penetration of DRI EAF
Proposed lever ambitions
Worldsteel
The chart on this slide is difficult to interpret
as there was DRI production also before
2010. However, it is true that the DRI based
EAF production is expected to gain share in
total crude steel production. We can
provide more details upon receipt of
clarification on the definition of
"penetration".

Global Calculator
NOTES
(1) Eurofer Steel Roadmap towards a low carbon economy 2050 (2013)
(2) Assuming the additional capex,is balanced by the input reduction
(3) Belgian consultation
Maturity
Trial of existing experimental furnace was
successful
Commercial-scale demonstration of a small
blast furnace is operational by 2014.
Full-scale demonstration plant is
operational by 2016
Deploys in 2020.
Contributes to a 20% decrease in coke
needs by 2050 • Retrofits enable a 20%(1) consumption reduction
• Greenfield full HIsarna implementation are modelled,
these enable a 35% consumption reduction(3)
• Carbon capture is modelled by the CCS lever (not
here)
Comments on Top-gas and HIsarna technology
Modelled
3 Process improvements: Top-gas recirculation/HIsarna
Proposed lever ambitions
65
Global Calculator
SOURCE: Steel consultation Wallonia Low Carbon 2050
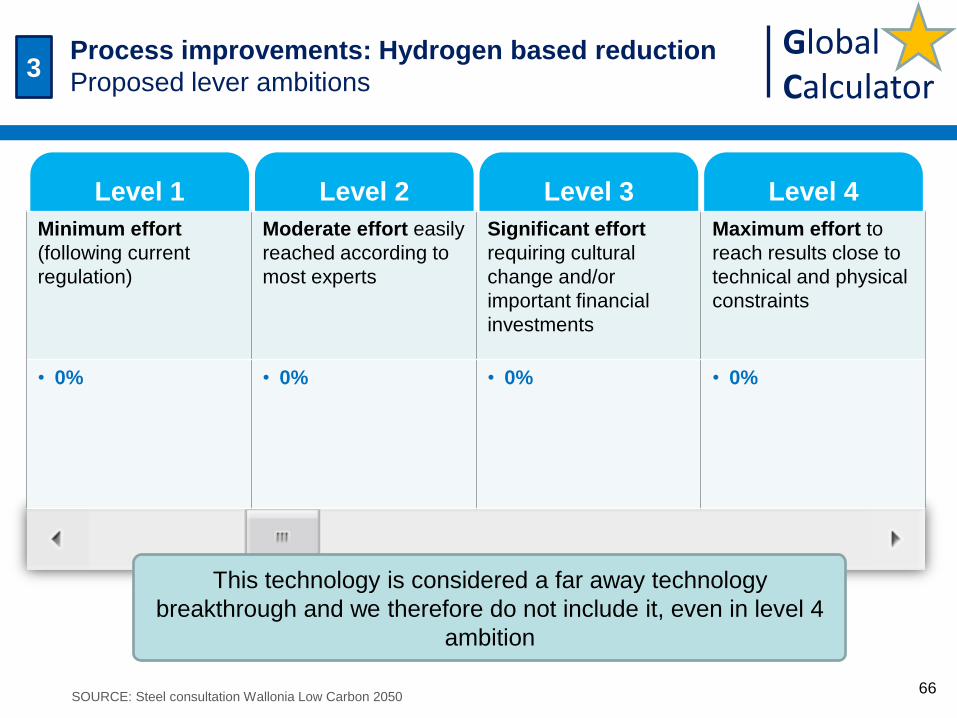
Level 1 Level 2 Level 3 Level 4
Minimum effort
(following current
regulation)
Moderate effort easily
reached according to
most experts
Significant effort
requiring cultural
change and/or
important financial
investments
Maximum effort to
reach results close to
technical and physical
constraints
• 0% • 0% • 0% • 0%
Electrolysis and hydrogen reach
only marginal levels by 2050 (ETP 2012)
Modelled
This technology is considered a far away technology
breakthrough and we therefore do not include it, even in level 4
ambition
3 Process improvements: Hydrogen based reduction
Proposed lever ambitions
66

Global Calculator
SOURCE: Steel consultation Wallonia Low Carbon 2050
Level 1 Level 2 Level 3 Level 4
Minimum effort
(following current
regulation)
Moderate effort easily
reached according to
most experts
Significant effort
requiring cultural
change and/or
important financial
investments
Maximum effort to
reach results close to
technical and physical
constraints
• 0% • 0% • 0% • 0%
Electrolysis and hydrogen reach
only marginal levels by 2050 (ETP 2012)
Modelled
This technology is considered a far away breakthrough (current
pilots work at ~5kg capacity per day(1)) and we therefore still do
not include it in level 4 ambition
3 Process improvements: Electrolysis
Proposed lever ambitions
67
Global Calculator
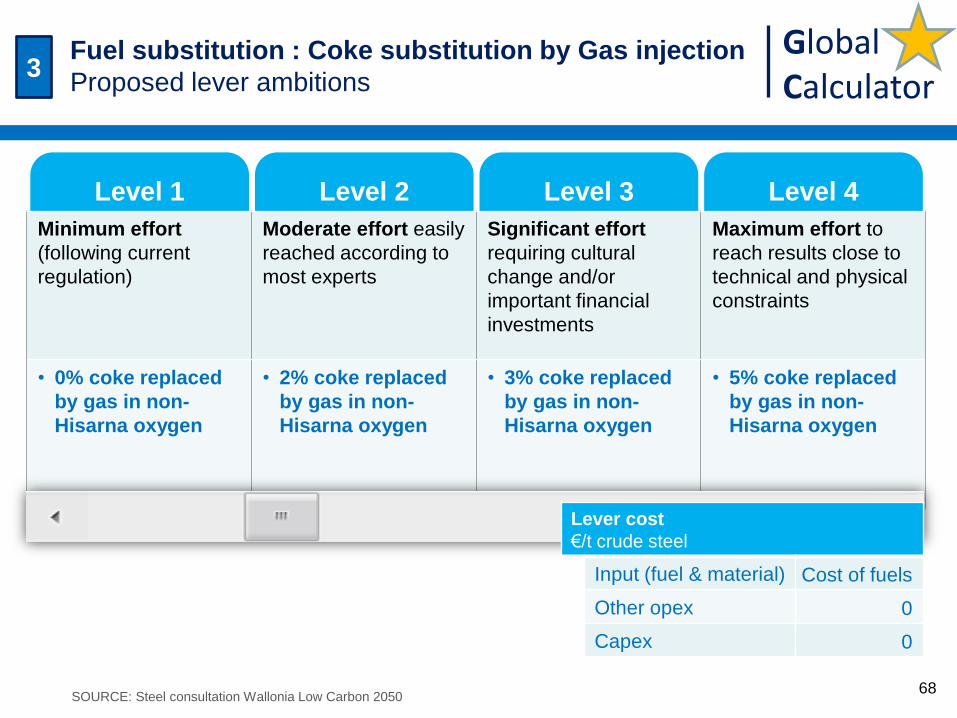
Level 1 Level 2 Level 3 Level 4
Minimum effort
(following current
regulation)
Moderate effort easily
reached according to
most experts
Significant effort
requiring cultural
change and/or
important financial
investments
Maximum effort to
reach results close to
technical and physical
constraints
• 0% coke replaced
by gas in non-
Hisarna oxygen
• 2% coke replaced
by gas in non-
Hisarna oxygen
• 3% coke replaced
by gas in non-
Hisarna oxygen
• 5% coke replaced
by gas in non-
Hisarna oxygen
SOURCE: Steel consultation Wallonia Low Carbon 2050
Lever cost
€/t crude steel
Input (fuel & material) Cost of fuels
Other opex 0
Capex 0
Modelled
May 6 3
Fuel substitution : Coke substitution by Gas injection
Proposed lever ambitions
68

Global Calculator
SOURCE: SERPECCC study
Level 1 Level 2 Level 3 Level 4
Minimum effort
(following current
regulation)
Moderate effort easily
reached according to
most experts
Significant effort
requiring cultural
change and/or
important financial
investments
Maximum effort to
reach results close to
technical and physical
constraints
• / • Substitution of 15%
coal PCI by
biomass in non
Hisarna oxygen
• idem level 2 • idem level 2
Lever cost
€/t crude steel
Input (fuel & material) Cost of fuels
Other opex 0
Capex 0
Modelled
May 6
This technology has limited
impact after HIsarna
3 Fuel substitution : Coal substitution by biomass
Proposed lever ambitions
69

Global Calculator
70
Energy intensity (1) (2)
(GJ/ton crude steel)
SOURCE: (1) Worldsteel sustainable steel policy & indicators 2013
(2) Worldsteel: Steel’s contribution to a low carbon future
(4) Global Calculator consultation
NOTE: (3) Assuming the additional capex is balanced by the input reduction
0
5
10
15
20
25
30
35
40
2050 2040 2030 2020 2010 2000 1990 1980
~-50%
Ambition 4 (-10%)
Ambition 3 (-7%)
Ambition 2 (-5%)
Ambition 1 (-0%)
• With strong historical improvement in
energy efficiency, we assume limited
further improvement (with same
technologies)
• There is ~25% scrap through the
chain which can be reused (this is
accounted through additional scrap
availability in level 4 and not here)
• Downstream processes also reveal
significant improvement potential; In
the EU, through downstream
improvements, total energy efficiency
could be improved by 5% (4)
• However, replacing all existing plants
by BaT will enable a certain reduction
• Efficiency improvements are only
applied on non-Hisarna BOF
Over a 30-year period, the steel industry
has reduced its energy consumption per
tonne of steel produced by 50%.
Worldsteel: Steel’s contribution to a low
carbon future
Lever cost (3)
€/t crude steel
Input (fuel & material) -x
Other opex 0
Capex +x
Ambition 1 (-0%)
Ambition 2 (-5%)
Ambition 3 (-7%)
Ambition 4 (-10%)
Modelled
In the production processes, 25% of steel
is cut off and sent to internal recycling,
this could be reduced
3 Energy (and material) efficiency
Energy efficiency has drastically improved over the last 30
years, leaving limited improvement on existing technology

Global Calculator
NOTE: (1) Includes the behavioural, the energy audits
Level 1 Level 2 Level 3 Level 4
Minimum effort
(following current
regulation)
Moderate effort easily
reached according to
most experts
Significant effort
requiring cultural
change and/or
important financial
investments
Maximum effort to
reach results close to
technical and physical
constraints
• No additional
potential
• No additional
potential
• No additional
potential
• No additional
potential
Modelled
No potential remains after all
energy efficiency measures
have been implemented
3 Energy efficiency : CHP potential
Proposed lever ambitions
71

Global Calculator
Capture rate
(MtCO2/year)
SOURCE: IEA ETP 2012
3 Carbon Capture & Storage
Projections from the IEA ETP 2012 by region
73
Global Calculator
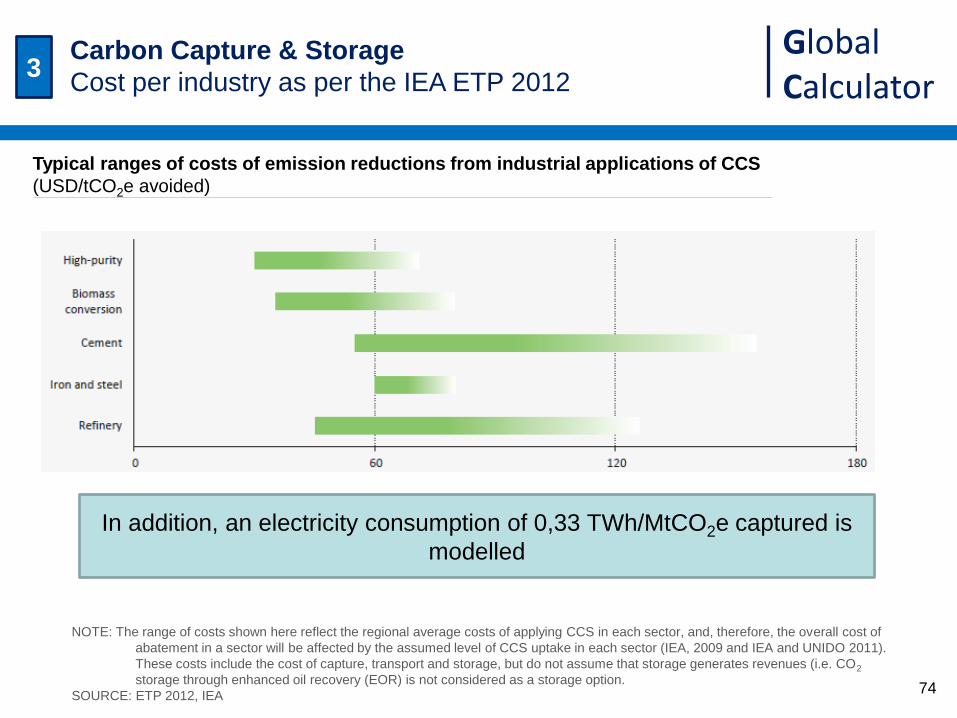
Typical ranges of costs of emission reductions from industrial applications of CCS
(USD/tCO2e avoided)
NOTE: The range of costs shown here reflect the regional average costs of applying CCS in each sector, and, therefore, the overall cost of
abatement in a sector will be affected by the assumed level of CCS uptake in each sector (IEA, 2009 and IEA and UNIDO 2011).
These costs include the cost of capture, transport and storage, but do not assume that storage generates revenues (i.e. CO2
storage through enhanced oil recovery (EOR) is not considered as a storage option.
SOURCE: ETP 2012, IEA
In addition, an electricity consumption of 0,33 TWh/MtCO2e captured is
modelled
3 Carbon Capture & Storage
Cost per industry as per the IEA ETP 2012
74

Global Calculator
75
Lever cost (2)
Input (fuel & material) 0,33 TWh Elec/Mt captured
Other opex $20 USD/ton captured
Capex $40 USD/ton captured
SOURCE: (1) Eurofer Steel Roadmap towards a low
carbon economy 2050 (2013), on HIsarna
and Ulcored technologies
(2) (Carpenter, 2012, through ETP 2012).
0
10
20
30
40
50
60
70
80
90
100
1990 2000 2010 2020 2030 2040 2050
100%
45%
25%
0% 0%
Penetration of CCS
(% of plants equipped) • Several pilots available but
industrial scale not rolled out
before 2030
• Could be cheaper than top-gas
recycling to reduce emissions (2)
• Ambition 3 aligned to ETP 2012
ambition of 40-45% plants
• 80% capture rate (1)
• Only applied on oxygen steel &
DRI in levels 1,2,3 & 4
• The specificities of CCS in the
steel sector (e.g. energy
consumption) should be refined
in a later version of the model
Ambition 4
Ambition 3
Ambition 2
Ambition 1
Modelled
3 Carbon Capture & Storage
Proposed lever ambitions

Global Calculator
Agenda
Iron & steel manufacturing with lower energy intensity
Steel manufacturing process
Estimation of the reduction potentials
Resulting scenarios
76

Global Calculator
Steel production per year per ambition (1,2)
(M tons)
Model growth forecasts
Production according to trajectories 1, 2 and 3
(after design, switch & recycling)
2010 2015 2020 2025 2030 2035 2040 2045 2050
3,000
2,000
1,000
0
2,500
500
3,500
1,500
Trajectory 1
Trajectory 3
Trajectory 2
Trajectory 4
+124%
+72%
Delta
10-50,%
+9%
+39%
Implied demand
per person
355 kg steel
/person
273 kg steel
/person
221 kg steel
/person
174 kg steel
/person
NOTE: (1) The population follows the average UN projection in all four trajectories
(2) Other sectors are impacted by these transitions (e.g. additional productions are created in the aluminium and plastics sectors)
SOURCE: IEA ETP 2012, Global calculator model
77
July 16, 1,2,3, 4
updated
218 kg steel
/person

Global Calculator
Reduction potential
Details for ambition level 3(1)
78
1.073
889
306
369
366
-2.112
+39%
Remaining
-183
-879
-1.051
Recycling
0
76
-441
Switch
-110
2011
1.518
77
-28
-392
Original
1.259
64
-555
Design
-27 -6
-135
-37% -7% +83%
Steel production for ambition level 3
(M tons, % of 2011)
EAF DRI
EAF Scrap
Oxygen
NOTE: (1) The population follows the average UN projection in all four trajectories
(2)Assuming biomass emits, not including electricity related emissions
SOURCE: IEA ETP 2012, Global calculator model
0%
Trajectories(1) in 2050
July 16

Global Calculator
GHG emissions for different ambition levels (1,2,3)
(MtonCO2e)
0
1.000
2.000
3.000
4.000
5.000
6.000
7.000
2035 2050 2045 2010 2025 2020 2030 2040 2015
4
2
3
1
Reduction potential
Emissions according to different trajectories
+123%
+35%
-6%
-84%
NOTE: (1) The population follows the average UN projection in all four trajectories
(2) Excluding biomass related reductions & electricity related emissions
(3) Other sectors are impacted by these transitions (e.g. additional emissions are created in the aluminium and plastics sectors)
SOURCE: IEA ETP 2012, Global calculator model
79
Specific
emissions Delta
10-50,%
July 16 1, 2, 3, 4
1,3 tCO2e
/tsteel
2,0 tCO2e
/tsteel
1,6 tCO2e
/tsteel
0,3 tCO2e
/tsteel

Global Calculator
Reduction potential
Details for ambition level 3 (1)
80
July 16
Steel GHG emissions in 2050, for ambition level 3(1,2), using different levers(3)
(MtCO2e, % of 2010)
0
500
1.000
1.500
2.000
2.500
3.000
3.500
4.000
4.500
5.000
5.500
6.000
CCS Recycling
& process
Remaining
-800
-7%
EE Switch
-508
-220
Design
-1.112
2050
Demand
2.519
2011
3.039 -2.841
Fuel
-37%
-7%
-17%
NOTES: (1) The population follows the average UN projection in all four trajectories
(2) Excluding biomass related reductions & electricity related emissions
(3) Other sectors are impacted by these transitions (e.g. additional emissions are created in the aluminium and plastics sectors)
Percentage reductions are calculated vs the 2010 baseline
SOURCE: IEA ETP 2012, Global calculator model
+0%
+83%
Oxygen
EAF DRI
OxygenHisarna
EAF Scrap
-2% -26%

Global Calculator
Cost
Marginal cost and abatement potential for different levers
under trajectory 2 with ambition level 4
GHG abatement curve for the year 2050 (trajectory 2, ambition 4)
€/tCO2e, % emission abatement in 2050 (% of 2010 level)
NOTE: Hypothesis of cost neutral energy efficiency measures , cost of biomass generic across all sectors
SOURCE: Global calculator model
100
80
60
40
20
0
95 90 85 80 75 70 55 50 45 65 60 40 35 30 25 20 15 10 5
120
140
160
180
200
€/tCO2e
Energy
efficienc
y
Hard steel
% emission
abatement in
2050 (% of 2010
level)
EAF mix
Scrap price is
not taken into
account
CCS
Illustration JPE:
Pourquoi illustration?
On a montré les chiffres avant, non?
MC: Les couts sont pas encore bien lié
dans le modèle, ceci c’est du Belge
Illustration
84

Global Calculator
Thank you.
Michel Cornet – +32 486 92 06 37 – [email protected]
Julien Pestiaux – +32 471 96 13 90 – [email protected]
Global Calculator
Agenda
Backup
Existing studies
Other informations on the sector
Industry overview
87

Global Calculator
With both eyes open is a key analysis on the flows from
resources to end products
SOURCE : With both eyes open
Sankey of global steel flows
(Mt 2008)
88

Global Calculator
Eurofer 2013 roadmap
89
Global Calculator
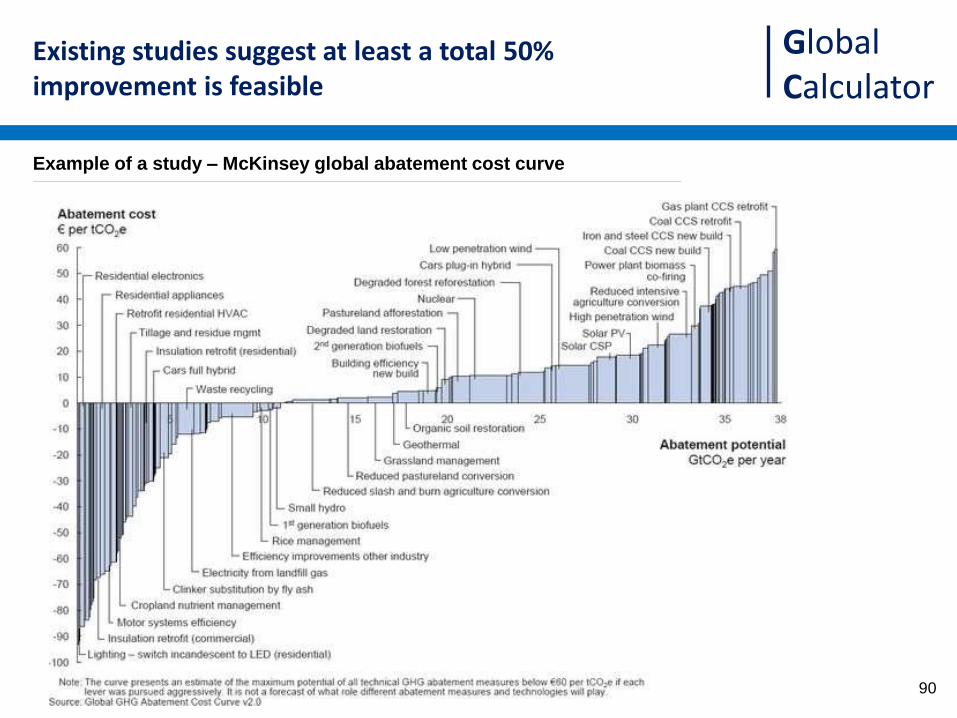
Existing studies suggest at least a total 50% improvement is feasible
Example of a study – McKinsey global abatement cost curve
90
Global Calculator
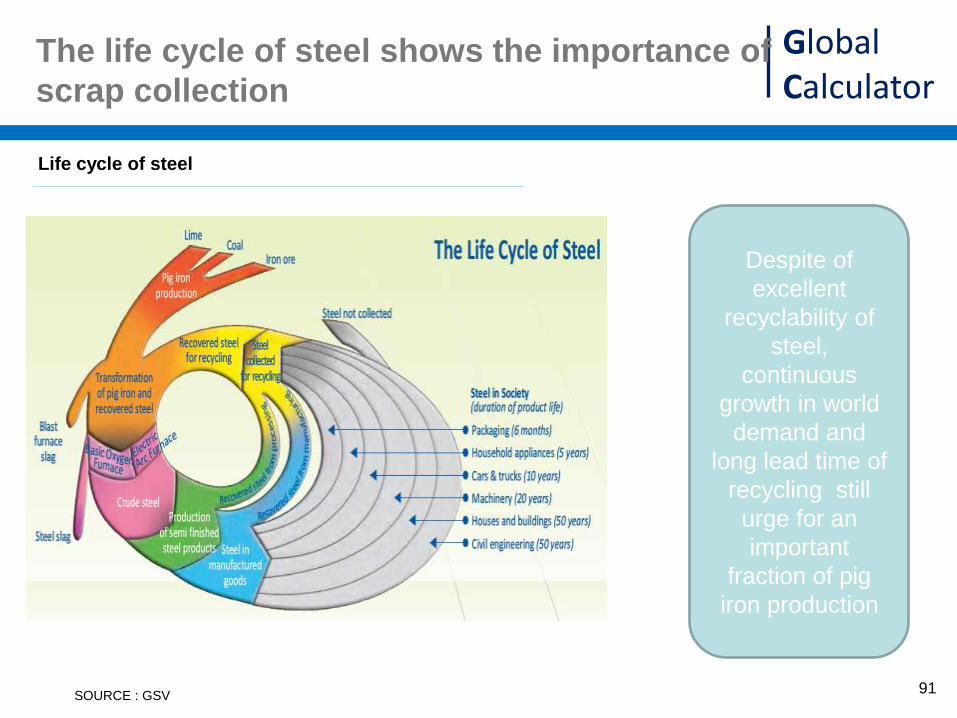
The life cycle of steel shows the importance of
scrap collection
SOURCE : GSV
Life cycle of steel
Despite of
excellent
recyclability of
steel,
continuous
growth in world
demand and
long lead time of
recycling still
urge for an
important
fraction of pig
iron production
91

Global Calculator
ETP 2012
93

Global Calculator
Agenda
Backup
Existing studies
Other informations on the sector
Industry overview
96
Global Calculator
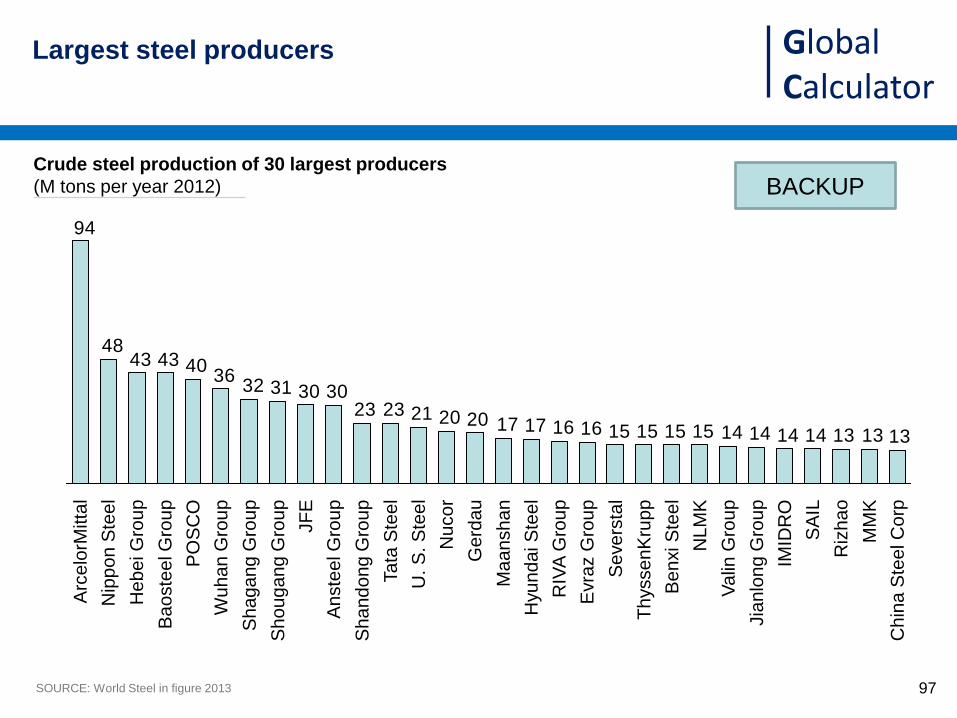
Largest steel producers
Crude steel production of 30 largest producers
(M tons per year 2012)
SOURCE: World Steel in figure 2013
131313141414141515151516161717202021232330303132
36404343
48
94
Ta
ta S
tee
l
U.
S.
Ste
el
Wu
ha
n G
rou
p
Ba
oste
el G
rou
p
PO
SC
O
Shagang G
roup
Shougang G
roup
JF
E
An
ste
el G
rou
p
Shandong G
roup
Nu
co
r
Gerd
au
Ma
an
sh
an
Hyu
nd
ai S
tee
l
RIV
A G
rou
p
Evra
z G
rou
p
Se
ve
rsta
l
Th
ysse
nK
rup
p
Be
nxi S
tee
l
NL
MK
Va
lin G
rou
p
Jia
nlo
ng
Gro
up
IMID
RO
SA
IL
Riz
ha
o
MM
K
Nip
po
n S
tee
l
Arc
elo
rMitta
l
Ch
ina
Ste
el C
orp
He
be
i G
rou
p
97
BACKUP

Global Calculator
Historically steel production has tended to reach a
plateau level with respect to population
98
Steel production per person
(kg/person/year)
SOURCE : With both eyes open (research by Professor Daniel Mueller at the Nowegian University of Science and Technology (NTNU)
and Tao Weng
• The plateau effect
comes from the fact
that as of a certain
level of GDP, steel
demand does not grow
further (e.g. does not
require more houses
or cars)
• This is not
representative of the
consumption per
capita
BACKUP
JPE
Production seems less
relevant vs demand, no?
I would hide
Global Calculator
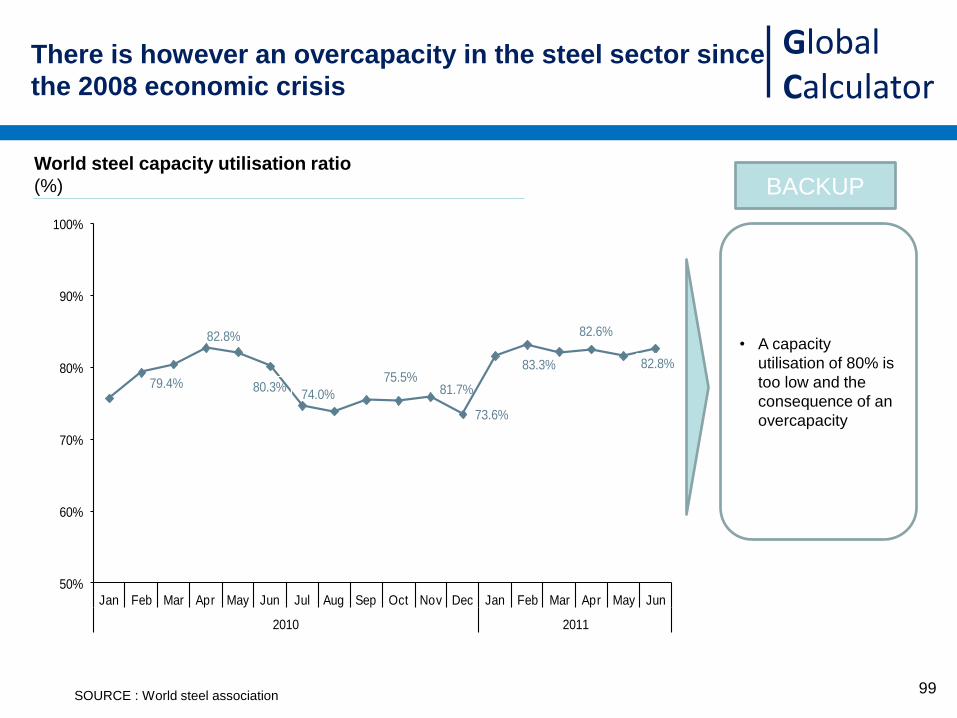
There is however an overcapacity in the steel sector since
the 2008 economic crisis
79.4%
82.8%
80.3%74.0%
75.5%
73.6%
81.7%
83.3%
82.6%
82.8%
50%
60%
70%
80%
90%
100%
Jan Feb Mar Apr May Jun Jul Aug Sep Oct Nov Dec Jan Feb Mar Apr May Jun
2010 2011
World steel capacity utilisation ratio
World steel capacity utilisation ratio
(%)
SOURCE : World steel association
• A capacity
utilisation of 80% is
too low and the
consequence of an
overcapacity
BACKUP
99

Global Calculator
Agenda
Backup
Existing studies
Other informations on the sector
Industry overview
100

Global Calculator
Industry represents 22 % of total emissions
and is made up of 5 main industries
SOURCE: IEA 2008 on year 2005
Global anthropogenic GHG emissions in 2005
(GtCO2e)
100% 28 10
Industry GHG emissions Energy & process GHG emissions
Others 45%
3% 4%
4%
Cement 19%
Steel 25%
Global GHG emissions
44
Plastic
Aluminium
LULUCF 36%
Energy & process 64%
Other 7%
Buildings 31%
Transport 27%
Industry 35%
Paper
101

Global Calculator
These 5 sectors are representative of the whole industry.
Assembly from materials to finished products is not a
major energy or emissions segment
SOURCE: China government statistics: Linwei, 2011 for year
China anthropogenic GHG emissions in 2005
(%)
100%
Industry emissions
(% 2005)
Others 1% Chemicals & plastics 17%
Wood 1%
Manufacturing,
industries & construction
67%
Textile 4% Food 3%
Cement 26%
Paper 2% Metal manufacturing 7%
Aluminium 6%
Steel 33%
Energy & process emissions
(%2005)
Other energy industries 6%
Other 9%
Residential 11%
Transport 7%
102

Global Calculator
Large developing economies are moving up in global
manufacturing
Top 15 manufacturers by share of global nominal manufacturing gross value added
103

Global Calculator
Manufacturing’s share of total employment fall as the
economy grows wealthier, following an inverted U pattern
Manufacturing employment
(% of total employment)
104

Global Calculator
International prices strongly differ between regions
NOTE: This view does not reflect the recent shale gas developments
SOURCE : With both eyes open p91
BACKUP Price of crude steel per region
(US$/ton crude steel)
105

Global Calculator
Europe is major importer of Iron ore,
Central and South America are major Exporters
Important export of iron ore
(2012, million tons actual weight)
SOURCE : World steel in figures 2013
Africa & Mid.East
91
Centre & South Am.
353
NAFTA
51 65 73
EU
51 522
Asia Oceania CIS
• Oceania, Central
and South America
are major exporters
• China is the largest
importer, followed
by the EU and
Japan
to Oceania
to Other asia
to China
to Africa & Mid. East
to Centr. & South Am.
to NAFTA
to CIS
to EU
to Japan
BACKUP
106