Embed Size (px)
Citation preview
.\
t j
f National Criminal Justice Reference Service II
-------------~----------~------------------------------------------I
nCJrs I
This microfiche was produced frem decuments received fer inclusion in the NCJRS data base. Since NCJRS cannet exercise centrel ever the physical cenditien ef the decuments submitted, the individual frame quality will vary. The reselutien chart en this frame may be used to. evaluate the decument quality.
1.0
1111.1
111111.25 111111.4 111111.6
~ICROCOPY RESOLUTION TEST CHART NATIONAL BUREAU OF STANDARDS-1963-A
Microfilming procedures used to. create this fiche cemply with the standards set f:orth in 41CFR 101-11.504.
/1 \'
/1
Peints ef view 0.4 epinien~ stated in this decument are these ef the author(s) and de net represent the efficial pesitien er pelicies ef the U. S. Department ef Justice.
,.. .. ' If (L.
National Institute of JusttCe United States Department of Justice Washington, D. C. 20531
o
I )
j
; 0
a
o
'U
~
'" 1978
, IN
"" UTH CAROLINA ~
Released By South Carolina
I law Enforcement Division
If you have issues viewing or accessing this file contact us at NCJRS.gov.
r {i,\
" "j '!
: i I {
: 1 'I
I !
~ -------~------ -----------r-- -------~
U.S. Oepa\1ment of Jusllr.e Natlonallnstltute of Justice
This docum'4nt has been reproduced exactly as received from, the pers~;m or organization originating iI. Points of view or opinions stated in this document are those of tha authors and do not necessarily represent the officlai position or poliCies of the National Institute of Justice. q" ,
Permission to reproduce this copyrighted material has been granted b~_
SOUTH CAROLINA LAW ENFORCEMENT DIVISION
to the National Criminai Justice Reference Service (NCJRS).
Furl!;r,er reproduction outside of the NCJRS system requires permission of the copyright owner.
o
,.'~'--
o
, r:·'·';···
"
.1/
1,1
.~. '* ~
,,'
I I
, t
, I
I
t
:I
II )1' { { I , III I 1\
II 11
I fl 1 II
II 11
tl d !1 q :)
) j
,I
~ fl
I
.. .'
RICHARD W. RILEY
Governor
~tnte of ~outh ClInrolinn
1fittfu 31inforremeni ~ibi5ion
1 ~.~;t:;:
;;; .. .';,".
P. O. Box 21398 Phone 758-~~61 r< COLUMBIA, S. C. ~\221 : ;
March 20, 197~l
J . PRESTON STROM Chief
-"') 'C::'
Crima in South Carolina continues to plague our paople with death, injury and property loss. The statistics compiled in this report do not begin to portray the human suffering resulting from the activities of vicious and unlawful parsons in our state. As criminal events daily disrupt the lives of our citizens we parcsiva a nesd for more specialized law enforcement aHom. Crime prevention toams, major crime strike foroas and other new approaches to crima problems will have positive effects. Criminal information sysmms, ,as more law enforcemant R{lsncies become pi"Ofessionai enough to oontribute and extract information, will continue to aid in the war against crima.
Ths polica, however, can only perform specific functions in the criminal justice field, just as courts and corrections must work Vifithin certain bounds. The only paople who can mally heve a Issting, long-rangs impru:t on the alarming activities of criminals, both juvanile and &!tutt, are the citizens of our state-families, schools, religious orglllni~ations. Society itl!3!f must bagin to \~raat this problam which is presently so misunderstood or ignored. The direction in which ws need to move is toward developing a society in which criminals, adult and juvenile, are neither excused nor emulated. That is not to suggsst, however, that they b3 forgotten, but we can not continue to sea parsons who commit violent crimes as being themselves the victims of injustice.
Finally, I would like to express my appreciation and admiration to tho$3 lawenforcemsnt aganci85 in South Carolina who realize that criminal information is as important and useful as any other technique in combatting crime and to encourage all agencies to participate in this fine system of cooperative information exchange.
1rstrUIY,
IA/:~ South Carolina Law Enforcement Division
"

r TABLE OF CONTENTS
'\ \
ii.
\'
Page 1\
Introduction ................. : . , ........•.................................. 1
National UCR Program ................ , •........ , .....•.•. , . , .....•.. ', ........ 1
South Carolina UCR Program ., ......... ~ ......•............•.....•..•......•.... 1
Objectives ......................... , ................•...•..... , •.•......... 2
Reporting -and Classification ...............•.... : .......•........•........•..... 2
Crime Factors ..............•........••....••.••......•..•.•...••........... 3
South Carolina Crime Index .-, ..•........•.....•..•...•................•...•..•. 4
Violent Crime ..........•.............•........•.. : ." ..............•.. , •...•. 5
Non-violent Crime .......•....•.......••.....••........ , ............. _, •...•... 5
Value of Property Stolen and Recovered ........•••..•......... '.' .•..........•...... 5
Clearance Rates ....•.•...........•.•................•..•..•••...•.•..•...... 7
Murder •...........••........•..•.........•........•..•..........•..•... 11
Rape ....•...........................................•.................. 19
'1f8bbery •. , .•.•••••.•..•...•....•.........•.........•..•................ 22
Aggravated Assault .•....................•.....•..• ,,-~,,/:" ....•..•....•. , .....•. 26
Breaking or Entering/Burglary ..•....••...•.•.•.......••...•........•.....•..... 28
Larceny ....•.•............................. , .••........•...•...•.•.•...• 32
Motor Vehicle Theft .....•.•.......•.......•......•.•.•....••..•...•.•...... 35
Assaults on Law Enforcement Officers •.•..........•....................••.•.••... 37
Arrest .Data " . . . • . • . . • • . . . . . . . • • . . . . . . . • . • . . . • . . . . . • • • . • . . • . '.' • • . . . . . . . • . 43
S. C. Arrest Data By County -1978 ....................................•....... 50-54
Crime By Regions .•........•...•...•...•....•...•.•..•.......•..•••.•...• 56·60
Crime Rates .. , ... , . , ........•...............•..... , .•...•....•• : .•....... 61
County Crime Rates Per 10,000 Population •••••........••..•.•..••..•••.•.••...• 61-62
Index Totals By County and Agency. , ...•. '~ ..•........•.. -:' ......•.•.. : ....•.. ' •. 63·69
Agency Participation ••....•..... : '. '. ;;. ..•. ' •.••.....•....••.•.•.....••.•..•• 63·69
, ' .. ' . ',:. ~. ~ ; .
-----;---(
t J
I I.
I
\ ; !
! I ; I
I t l I,
{- :
2
3
4
5
6
7
8
9
10
11
12
13
14
15
16
17
18
19
20
21
22
23
24
25
26
27
28
29 "
30
31
32
33
-- -- ------~--- -~--------
LIST OF TABLES
Page
Index Crime Trends ..•..•........•....•.............•...•............... 5
Clearance Data ...••...................... _ ... ' ..........••.............. 7
Stolen and recovered Property Trends, 1976-1978 •............................... 8
Murder Victims By Age, Sex, Race, 1978 ...................................... 13
Murder Distribution By Circumstance and Weapon Type, 1978 ...•..............•.... 14 1:.1,"
Murder Circumstance Trehds, 1976-1978 ... ', .............................•... 17
Murder Weapon Trends, 1976-1978 ......................................... 17
-Murdei Distribution By Day of Week, 1976-1978 ........................•....... 18
Relationship of Rape Victims to Offender(s) •...............•......•......•.... 20
Rape By Premise Type ..•...•.••......•...•.......•.•.....•............. 20
Forcible and Attempted Rapes •... ; ....... , .•.•....•..•.• , ........•.......• 20
Rape Distribution By Day of Week, 1978 ..........................•........... 20
Rape Victims By Age, Race, 1978 .......................................... 21
Robbery Values of Property Stolen, 1976-1978 ................................. 24
Robbery By Weapon Type, 1976-1978 .•... , .....•.............•............ 24
Robbery By Premise and Time of Day, 1978 ................................... 25
Aggravated Assault By Weapon Type, 1976-1978 .......•........................ 27
Breaking or Entering/Burglary By Type Entry, 1976-1978 .........................• 30
Breaking or Entering/Burglary, 1976-1978 .........•........•................. 31
Larceny Trends, 1976-1978 ... ',' ......................................... 33 "\\
Larceny Distribution By Value Group 1976-1978 ............................... 34
Motor Vehicle Theft, 1976-1978 .••........................................ 36
Police Assaults By Activity and Weapon Type, 1976-1978 ....•.............•....... 38
Type Of Assignment •••..•..•.•..•••••......•..•...•.••.....••......... 40
Injuries to Law Enforcement Officers ••.•....•.••..•.....•...••.•.•.....•.•.• 40
Time of Assault ..•...•...••...••......•••...•....•...•..•.•.•......... 40 II • •
South Carolina Arrest Trends, 1976-1978 .....••. :-........•........•...... : ... 44
Total Arrests By Race and Sex, 1978 ........................................ 45
Total Arrests By Age, 1978 .•........................•...............•. 46-48
Drug Law Arrests-Under Age 17, 197~ .•..................... , ........•...... 49
Drug Law Arrests-Age 17 and Over, 1978 ....................•.........•...... 49
Agencies Covered By County Law Enforcement Crime Reports •.•.•.••............••. 70
Agencies Not Participating in Uniform Crime Reports Program •....•••••...•......... 70
ii
1
o

."""
r 1
2
3
LIST OF GRAPHS
Page
Index Crimes, 1976-1978 , .....................................•....•....• 6
Violent Crimes ....................... , •.......•..................•..... 6
Nonviolent Crimes ...............•..•............•••...•.....•......•.... 6
4 Distribution of Property Stolen By Offense Type, 1976-1978 ......•..•.•.....•...•.•.. 9
5 Distribution of Property Stolen, 1978 ......•.......••.. ' .....••..... ; •......... 10
6 Murder ...............•.•......•..•.....•.....•......•.............. 11
7 Murder By Circumstance, 1978 ....•......................................•. 15
8 Murder Distribution By Weapon Type, 1978 ...............•.•..................• 16
9. Rape ............ , .......•......................•....•.•...•...•...• 19
10 Robbery ..•.........•... , .....•.........•...........•••.•.•...•..••. 22
11 Aggravated AssaUlt ...•.••••..•••....•..•.•.....••......•.•...•...•....• 26
12 Breaking or Entering/Burglary ..•.•..•...........•...... , . , •.......•..•..•.. 28
13 Breaking or Entering By Premise and Time of Day, 1978 ....................•.....•. 30 • -I
14 Larceny ......•... , ........•.•..•. : ... ',' ..•......•....••... , .• , .•..•. 32
15 Motor Vehicle Theft .....•.• , , , • , .. , .. " : •.. , , .........................•. 35
16 Law Enforcement O~ficers Assaulted By Weapon Type, 1976-19/8 • ..••. ~ , ...••.•.•.•.. 39
17 South Carolina law ,Enforcement Officers Killed By Year 1962-1978 ••... : ... , .....•... , .42
2
MAPS Page
S,C. Law Enforcement Officers Killed By County .....•.......... , .•.•..........•. 41 .
South Carolina Regional Planning Units .••.....• , •......•. , •.••.....•..•...•..• 55
iii
..
1 i
! J
. '}
,(., SOUTH CAROLINA UNIFORM CRIME:R':EPORTJNG PROGRAM·
INTRODUCTION
Development of the current nationwide Unifor'm Crime Reporting (UCR) Program began more than fdrty years ago. In 1930, crime counts were first requested from local police departments with the Federal Bureau of Investigation designated by Congress to collect, compile and analyze the statistics, The committee on Uniform Crime Records of the International Association of Chiefs of Police played a primary role in the Qrigin and development of the UCR program and today serves in a strong advisory capacity, Standardized offense classifications and scoring procedures to insure uniformity and consistency of data are the basis of UCR reports,
NAT/ONAl UCR PROGRAM
In recent years, the FBI has actively assisted individual states in the development 0'( state-wide programs of law enforcement statistics compatible with the national system. The state system now in effect can provide a more direct and frequent service to local law enforcement agencies. This assures completeness and finer quality of information than was available in the past. The National Uniform Crime Reports program, under th~ administration of the Federal Bureau of Investigation, 'is the outgrowth of a need and comprehensive study of crime statistics in the United States. The publication, "Crime in the United States," is the annual report by the FBI dealing with national crime statistics,
SOUTH CAROLINA UCR PROGRAM
South Carolina was one of the first states to implement an operational state UCR program. The South Carolina Law Enforcement Division is the agency administering the program. The information collected and the uniform classifications under which it is collected are based directly upon the guidelines of IACP and FBI. :;-
~
Upon initiation of the South Carolina UCR pr~gram in July 1973, SLED in conjunction with the FBI, held work· shops around the state to instruct or refresh"tlie'.county anti city law enforcement agencies on the scope of the program and the mechanics of completing the forms.
Since that time, SLED, along with the local law'enforcement agencies, has instituted an incident-based records management system which has greatly enhanced -and improved the quality of information gathered under the Uniform Crime Reports system. Under this new procedure, crime data and other information gathered by municipal and county law enforcement agencies is collected and submitted to SLED on a daily, monthly and annual basis. This neW system lends itself to a more complete and accurate crime reporting system which in most instances alleviates some of the paperwork with which many departments are now burdened. An additional advantage of using standard incident and booking reports' will be realized from the uniformity of forms. Standardized reports facilitate the exchange of information between law enforcement agencies within the state. The forms have' been included in the report writing classes taught at the South Carolina Criminal Justice Academy, reducing the need for individual departments to train every new employee in the use of local offense reports and booking reports.
1
1
r OBJECTIVES
The fundamental objectives of the South Carolina Uniform Crime Reporting Program are:
(1) To inform the Governor, Legislature, other governmental officials and the public as to the nature of the crime problem in South Carolina.
(2) To provide law enforcement administrators with criminal statistics for administrative and other operational use.
(3) To determine who commits crimes by age, sex, race and other attributes in order to find the proper focus for crime prevention and enforcement. •
(4) To provide base data and statistics to help measure the workload and effectiveness of the criminal justice system.
(5) To provide base data and statistics for research to iniprove the efficiency, effectiveness and performance of criminal justice agencies.
A particularly importan, goal of the state UCR state program is to return statistical information back to its contributors. With the implementation of the new Incident Reporting System, participating police agencies fu~nish data that i~ verifit:!, analyzed and then returned to each jurisdiction in the form of a monthly printout. With the completion of th~ ~nnual report, contributing agencies possess detailed information showing crime trends within their jurisdiction. This enables them to make important decisions in budgeting, manpower alloca. tions and the identification of high crime areas.
This information is also forwarded by SLED to the FBI on a monthly and annual basis' this is for in'clusion in national crime reports and the FBI's annual UCR publication. '
fiF,PORTING AND CLASSIFICATION
While thc,e is no doubt that crime in South Carolina is increasing, care should be exercised when viawing the ~umber of offenses reported to the UCR program. It should be noted that methods of crime reporting hove been Improved. Consequently, the volume of crime actually reported in the state has increased.
~n. ~eportj~g o~enses to the Uniform Crime Reports program, offenses are classified according to standard defInlt!ons (glv:n In a later section of the report) that are used throughout the natio'll. The UCR definitions are deSigned to Insure that offenses with different titles under state and local law are appropriately counted under the UCR program without regard to the findings of courts or juries, since the statistics are gathered primarily to assist in identifying areas of concern to law enforcement officers, and not meal1t to reflect the outcomes of inquests, hearings or trials. .
2
(J
-~~- -~ -~ ... -~ -------
---------------.....-------------~----
,j
CRIME FACTORS
Data gathered under the Uniform Crime Reporting Program lire SUbmitted by the law enforcement agencies of South Carolina and project a state-wide view of crime. Examination of some of the underlying factors which influence the volume and type of statistics presented, are necessary if fair, equitable, and enlightened conclusions are to be drawn from the statistical data which follows.
No attempt will be made In this report to examine theories of criminal behavior. The reader is simply encouraged to bear in mind that crime is a complex, many-faceted phenomenon. There are no simple explanations and no easy answers to the problem. However, crime is subject to study; it can be understood and dealt with. Set forth below are some factors w~ich will affect the crime that occurs from place to place.
Density and size of the community population and the metropolitan area of which it is a part. Economic status of the population. . Relative stability of the population including commuters, seasonal and other transients. Climate, including seasonal weather conditions. Educational, recreational, and religious characteristics. Effective strength of the police force. Attitudes and policies of the courts and corrections. The public's attitude toward law enforcement problems. Effectiveness of law enforcement agencies in accurately reporting and interpreting crime data.
These and other crime influencing factors are present, to some degree, in every community, and their presence affects, in varying degrees, the crime experience of that community. Attempts at comparison of crime figures between communities should not be made without first considering the individual factors present in each community.
Police cannot shoulder the entire burden of fighting crime. The slime is true of the courts, correction agencies, and any other elements of the criminal justice system. Real progress against crime can be attained only when each individual recognizes that crime prevention is his personal responsibility, and acts accordingly.
3
o
=
r
4.
-~--- ---- ~---
SOUTH CAROLINA CRIME INDEX ..,.
The tabulations presented in the tables, graphs, and charts in this publication indicate the volume fluct. uation, and distribution of crime in South Carolina on the basis of a crime index. The crime figures a;e cate. gorized by agency, county, state and planning regions on the basis of information submitted by police agencies from these areas. The seven offenses comprising the Crime Index and their definitions are:
1. Murder: The willful killing of a human being (inc/udes voluntary or non. negligent manslaughter).
2. Forcible Rape: The carnal knowledge of a female through the use or threat of force (does not include statutory tape).
3. Robbery: Unlawfully obtaining the property of another by force or the threat of force. Robbery occurs only in the presence of a victim.
4. Aggravated A5sault: An unlawful attack upon a person for the purpose of inflicting severe bodily injury.
5. Breaking Or Entering/Burglary: The unlawful entry of a structure to commit a felony or theft.
6. L.:rceny: The unlawful taking of the property of another without the u'c of force or fraud.
7. MOL~r Vehicle Theft: The unlawful taking of a motor vehicfe. Motor VehIcle Theft includes alleged joy·rides.
The: Cri~e .'nde~ is used as a ba~ic measure of crime. The crimes were selected for use as an index on the basIS of t.,e,r SflrJOUS natu.re, their frequency of occurrence and the reliability of reporting from citizens to law .enforce~enLru!e~cles. The offenses of murder, forcible rape, robbery and aggravated assault are categorized as vloh:nt cnmes. Offenses of breaking or entering/burglary, larceny and motor vehicle theft are classed as nlJnvlolent crimes. The crime index is the total of actual offenses that come to the attention of law enforc:ment agencies. During the year 1978, a total of 141,652 index offenses were reported. This represents an Increase of 4,036 offenses, or a 2.9 percent increase over the year 1977.
In. r.eviewing crime index figure? the reader should keep in mind that there is currently no way of deter. Inlnl!,,9 & the total n.umber ~f crimes committed. The crime index has been established to measure only the rns~a~ces ~f ~nme whIch come to the attention of law enforcement agencies. It is important to reo n;e!11b~r I~ reYlewmg the tables and graphs in this report that the volume of crime in a given area or muniCipality IS dIrectly related to the crime factors previously listed in this report.
Data published here concerning prior years supersedes those in any previous reports.
-..... -'~"'-..------"---~.-..
I.
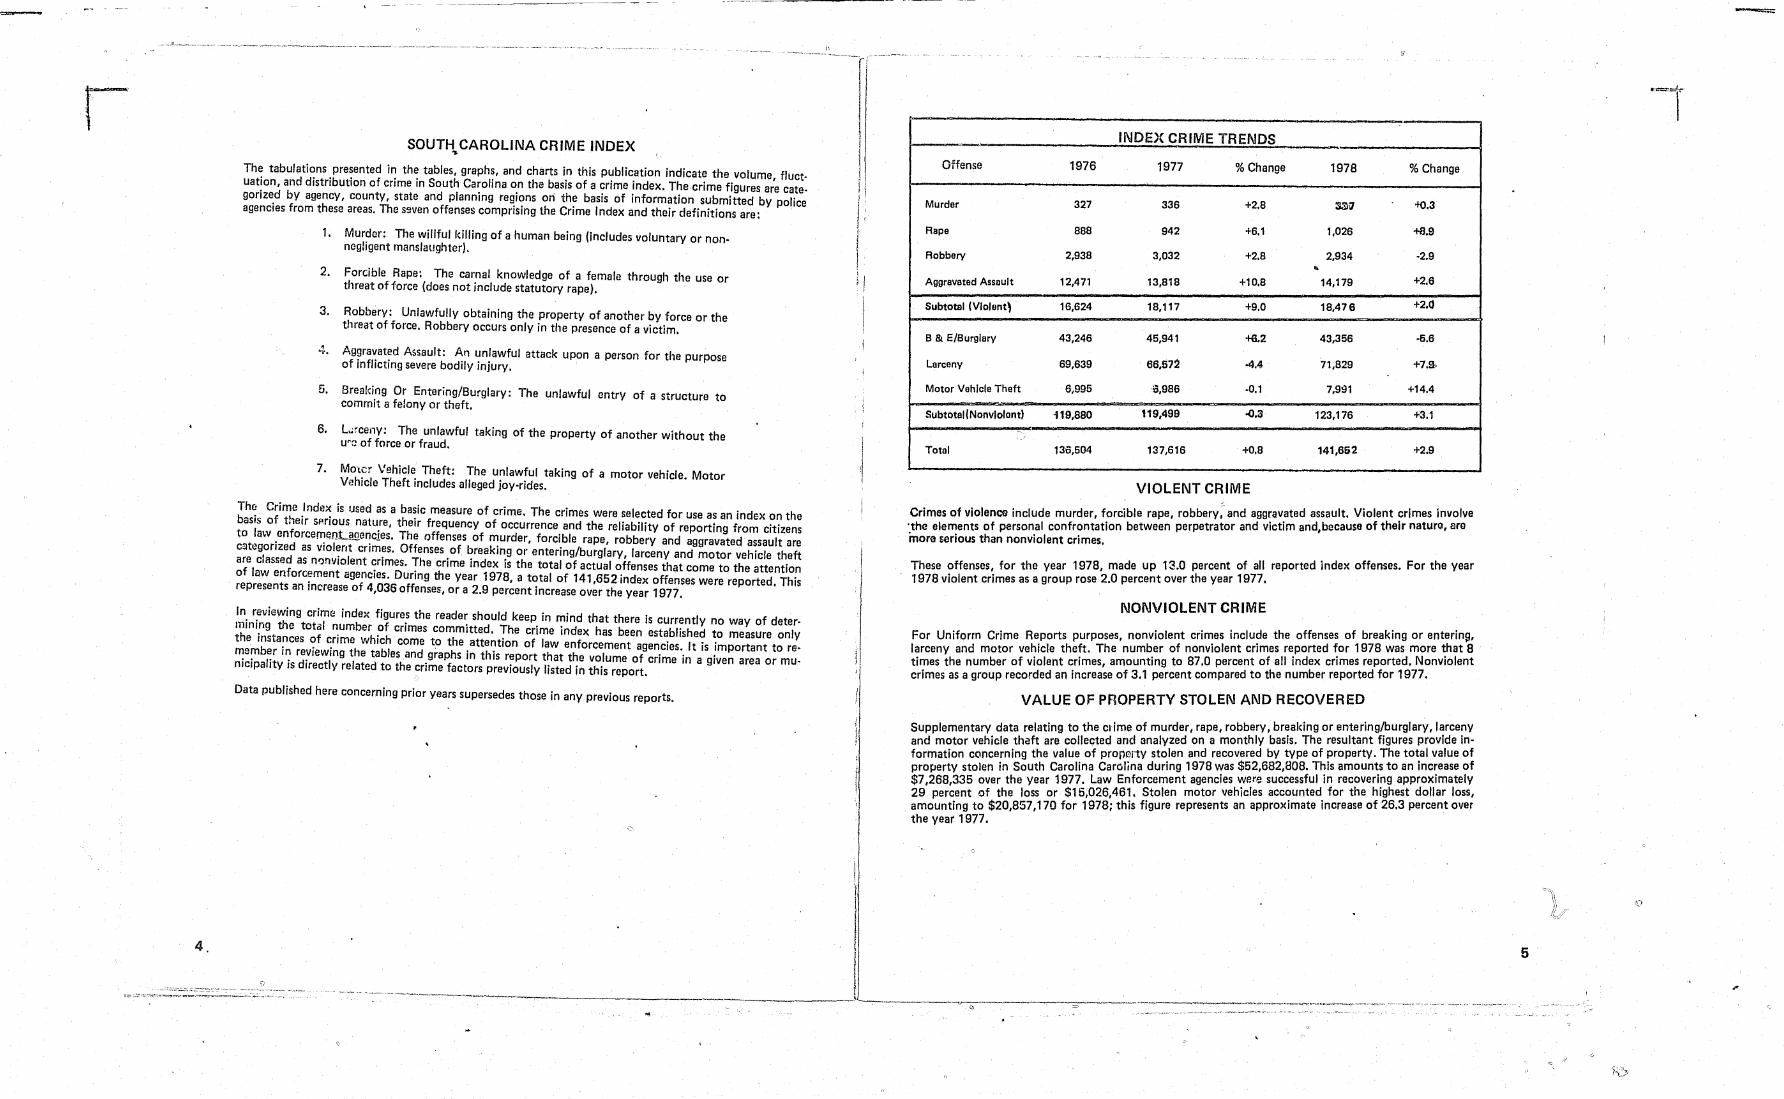
"- INDEX CRIME TRENDS
Offense 1976 1977 % Change 1978 % Change
Murder 327 336 +2.8 3:lla "0.3
Rape 888 942 +6.1 1,026 +B.9
Robbery 2,938 3,032 +2.8 2,934 ·2.9 .. Aggreveted Assault 12,471 13,818 +10.8 14,179 +2.6
Subtotal (Violent' 16,624 18,117 +9.0 18,476 +2.0
B & E/Burglary 43,246 45,941 +iL2 43,356 -5.6
Larceny 69,639 66,572 4.4 71,829 +7.9>
Motor Vehicle Theft 6,995 13,986 ·0.1 7,991 +14.4
SubtotallNonviolont) i19,880 119,499 -0.3 123,176 +3.1 ~
Total 136,504 137,616 +0.8 141,662 +2.9
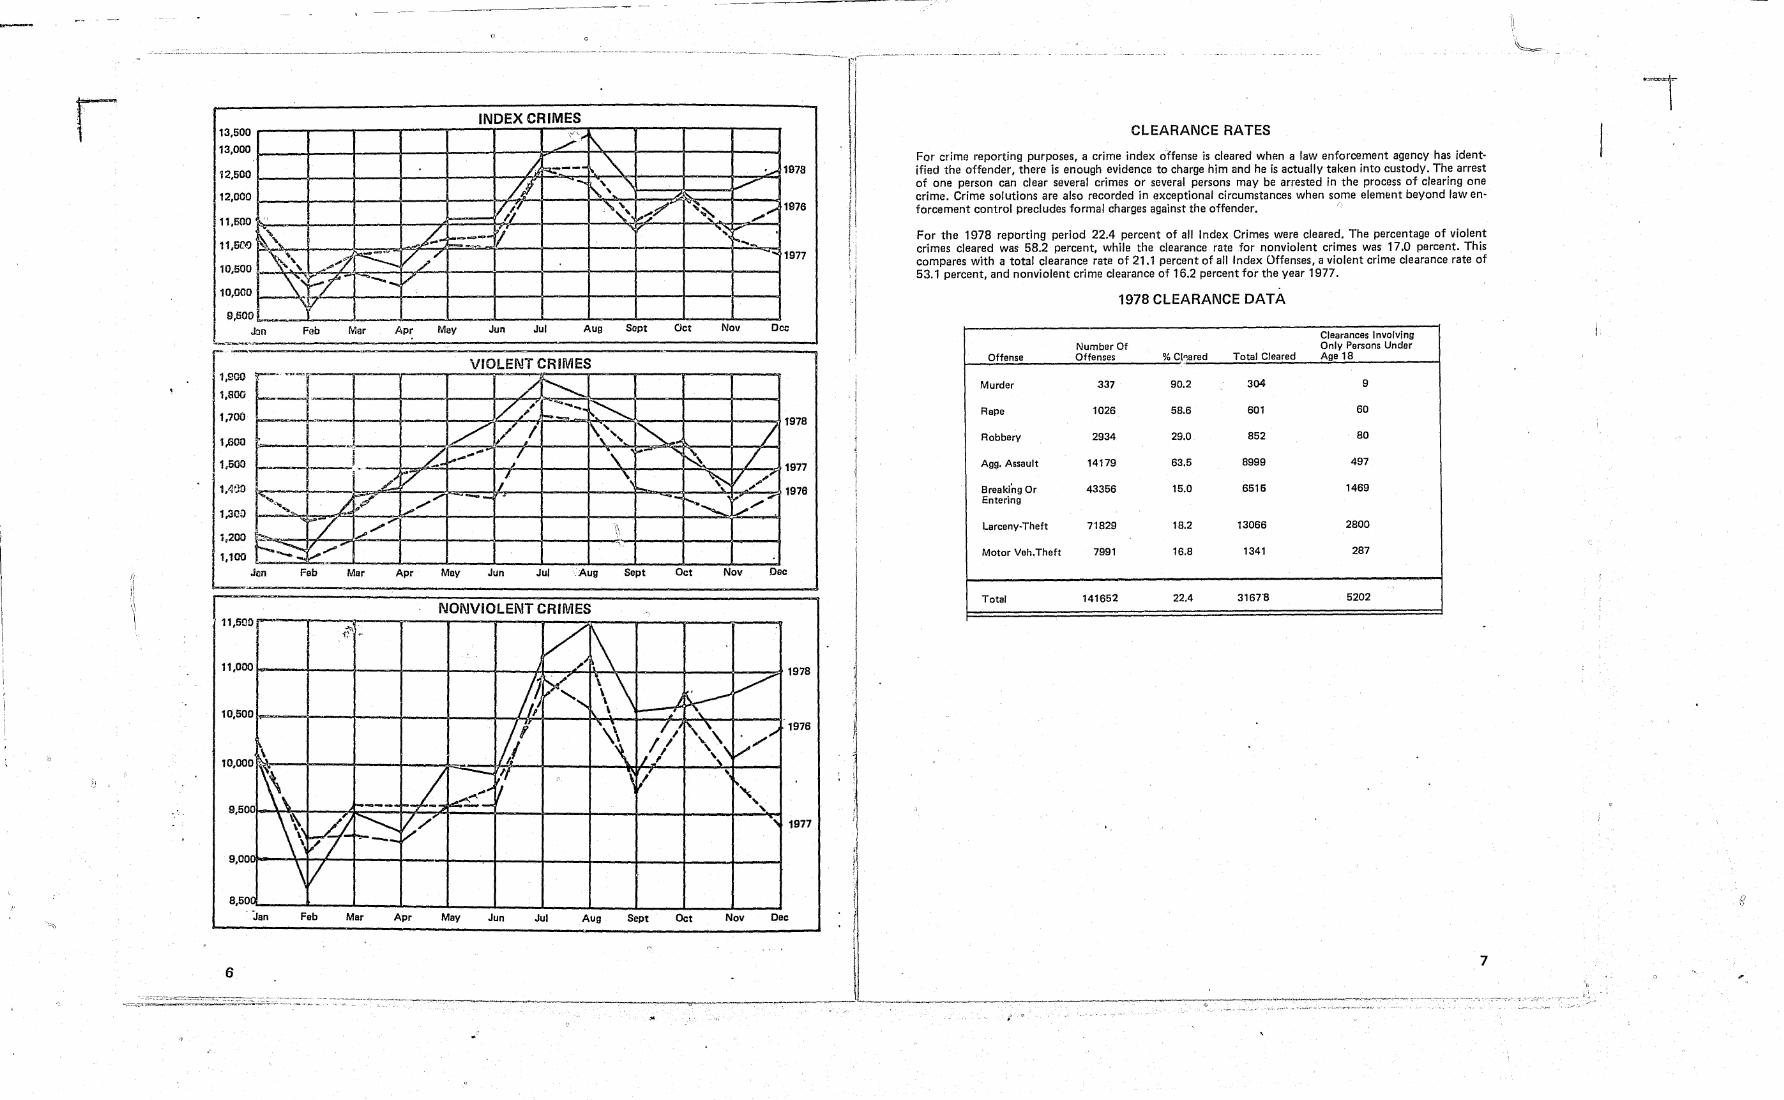
VIOLENT CRIME
Crimes of violence include murder, forcible rape, robbery: and aggravated assaUlt. Violent crimes involve 'the elements of personal confrontation between perpetrator and victim and,btlcause of their naturo, am mora serious than nonviolent crimes.
These offenses, for the year 1978, made up 13.0 percent of all reported index offenses. For the year 1978 violent crimes as a group rose 2.0 percent over the year 1977.
NONVIOLENT CRIME
For Uniform Crime Reports purposes, nonviolent crimes include the offenses of breaking or enterin~, larceny and motor vehicle theft. The number of nonviolent crimes reported for 1978 was more that 8 times the number of violent crimes, amounting to 87.0 percent of all index crimes reported. Nonviolent crimes as a group recorded an increase of 3.1 percent compared to the number reported for 1977.
VALUE OF PROPERTY STOLEN AND RECOVERED
Supplementary data relating to the Clime of murder, rape, robbery, breaking or entering/burglary, larceny and motor vehicle thaft are collected arJd analyzed on a monthly basis. The resultant figures provide in· formation concerning the value of property stolen and recovered by type of property. The to~al value of property stolen in South Carolina Carolina during 1978 was $52,682,808. This amounts to an Increase of $7268335 over the year 1977. Law Enforcement agencies were successful in recovering approximately 29' per~ent of the loss or $15,026,461. Stolen motor vehicles accounted for the highest dollar loss, amounting to $20,857,170 for 1978; this figure represents an approximate increase of 26.3 percent over the year 1977.
5
r
';.",
_--------~.--c----~-------~--.-.-.----.
13,500
13,000
12,500
12,000
o
INDEX CRIMES
/'''' ~ ~---
// '-"-\. " '..",. 1978
1\.' '\ ............. ,~
~.
11,600
11,500
10.500
10,000
1/,1' ~" ~~:?' ~::..... "....,."" "', 1976
~'\ ... ~ /--- V 'tI' ,..----\ .. " ... , -t ",,'" ~ v//
\, ~L_- ---V "\ V
9,600
J:m Feb Mar Apr May Jun Jul Aug Sept
r:.900
.1,800
VIOLENT CRIMES r-"~'~i -
~ t--l::- / V~/ '- ~ -.... f-_ 1,700
'~ " :--.... -'.., 1977
Oct Nov Dcc
./ ,/ I 1'\" ... ""--~ / ' . 1978
1,600 -~",
L- I' J ...
\. :.-- " ~ / ~ ....... . .
I ~ t7 / \ ~ / /' ~ ... r,
.L '1""',/ /",. -- - -... ''' ............. "....,. .... . . ...... ~ If" ;P' / .
~/ /" '\ ;.,., L,..o
~~ V ....... ' .;
[..,..
1976
1,500 1977
1.3120
1,200
1,100 Fob Mar Apr May Jun Jul .Aug Sept Oct Nov Dec
9,00 \V 8,50n~_ ---:!-.-_J-_-l.--l-_-l. __ L_-1 __ ..L_--1L_-L_-l
Jan Feb Mar Apr May Nov Doc Jun Jul Aug Sept Oct
6
, ! j
1
1 1 i J
i
IJ··
~
i ,
I
J II tl
\ -~-. -~------... :---'-------
CLEARANCE RATES
For crime reporting purposes, a crime index offense is cleared whIm a law enforcement agency has identified the offender, there is enough evidence to charge him and he is actuallY taken into custody. The arrest of one person can clear several crimes or several persons may be arrested in the process of clearing one crime. Crime solutions are also recorded in exceptional circumstances when some element beyond lawen-forcement control precludes formal charges against the offender. .
For the 1978 reporting period 22.4 percent of all Index Crimes were cleared. The percentage of violent crimes cleared was 58.2 percent, while the clearance rate for nonviolent crimes was 17.0 percent. This compares with a total clearance rate of 21.1 percent of all Index Offenses, a violent crime clearance rate of 53.1 percent, and nonviolent crime clearance of 16.2 percent for the year 1977.
1978 CLEARANCE DATA
Clearances Involving Number Of Only Persons Under
Offense Offenses % CI~ared Total Cleared Age 18
Murder 337 90.2 304 9
Rape 1026 58.6 601 60
Robbery 2934 29.0 852 80
Agg. Assault 14179 63.5 8999 497
8reaki'ng Or 43356 15.0 6516 1469 Entering
Larceny-Theft 71829 18.2 13066 2800
Motor Veh.Theft 7991 16.8 1341 287
Total 141652 22.4 3167'8 5202
7
~----~--- - --~--------~----------~--
..
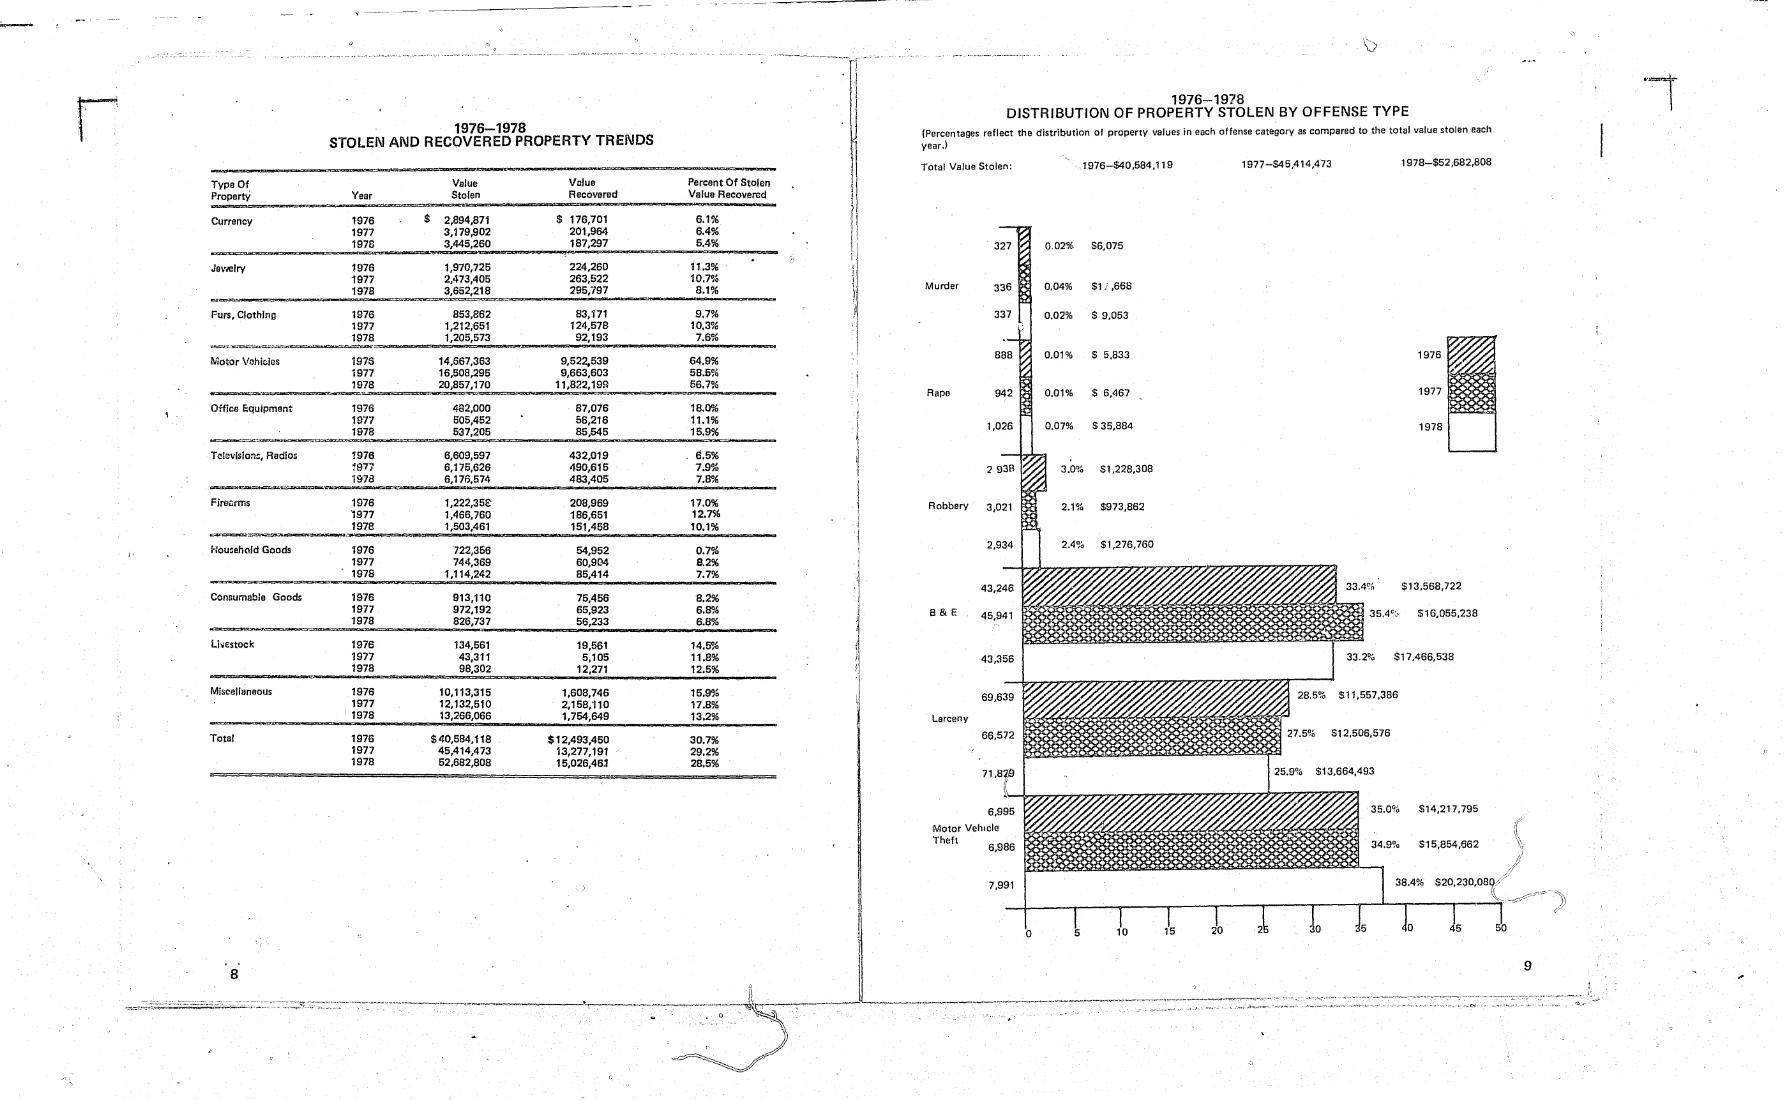
r 1976-1978 STOLEN AND RECOVERED PROPERTY TRENDS
::;~"""$
Type Of Value Value Percant Of Stolen Property Year Stolen Recovered Value Recovered
Currency 1976 $ 2,894,871 $ 176,701 6.1% 1977 3,179,902 201,964 6.4% 1978 3,445,260 187,297 5.4%
~""e~'" ~ =
JeV'J8lry 1976 1,970,725 224,260 11.3% 1977 2,473,405 263,522 10.7% 1978 3,652,218 295,797 8.1%
c:.un:",::;:~,,~~;;;;:
Furs, Clothing 1976 853,862 83,171 9.7% 1977 1,212,651 124,578 10.3% 1978 1,205,573 92,193 7.6%
~_-':-""'l::~---.=. ·~"""'n'~
Motor Vahk;les 1975 14,667.363 9,522,539 64.9% 1977 16,508,295 9,663,603 58.5% 1978 20,~,170 11,822,199 56.7%
~~ ....
Office Equipment 1976 482,000 87,076 18.0% 1917 505,452 56,216 11.1% 1978 537,205 85,545 15.9%
p-
Tclsvls!on=, Radios 1976 6,609,597 432,019 6.5% ~977 6,175,626 490,615 7.9% 1978 6,176,574 483,405 7.8%
~!Ct:::
Fireorm$ 1976 l,222,35e 208,969 17.0% 1977 1,466,760 186,651 12.7% 1978 1,503,461 151,458 10.1%
~~~:;:a'
I' Bouse/wId Goods 1976 722,356 54,952 0.7%
1977 744,369 60,904 8.2% 1978 1,114,242 85,414 7.7%
::a:a ............ u""""""""
Consumllble Goods 1976 913,110 75,456 8.2% 1977 972,192 65,923 6.8% 1978 826,737 56,233 6.8%
LiliEstock 1976 134,561 19,561 14.5% 1977 43,311 5,105 11.8% 1978 98,302 12,271 12.5%
Miscellaneous 1976 10,113,315 1,608,746 15.9% 1977 12,132,510 2,158,'110 17.8% 1978 13,266,066 1,754,649 13.2%
Total 1976 $40,584,118 $12,493,450 30.7% 1977 45,414,473 13,277,191 29.2% 1978 52,682,808 15,026,46:2 28.5%
8.
'.+ '"~- ,-" -~,-,
~~~ -== • "'~-'-,;-' .-- --. ~.;.:,.-_:"'-.'-,--::-.::;5~ ~t; -::'~~'~,'" .. = .. :--~.~,.:--:-~---.-~---------. ... -~, ... ------
+~--->--------~-,-~-~--..... , ~'~
1'1 . j I
II 'I t! ! ; II , j t 1
'1 , I,
j
,
i 11
I
--- -- .--,..--~~-
1976-1978 DISTRIBUTION OF PROPERTY STOLEN BY OFFENSE TYPE
(Percentages reflect the distribution of property values in each offense category as compared to the total value stolen each year.)
Total Value Stolen: 1976-$40,584,119 1977-$45,414,473 1978-$52,682,808
327 O. 02% $6,075
Murder 336 0.0 4% $1 j ,668
337 0.0 2% S 9,053
888 0.0 1% S 5,833 1976
Rape 942 0.0 1% $ 6,467 1977
1,026 0.0 7% $ 35,884 1978
'293B 3.0% $1,228,308
Robbery 3,021 2.1% $973,862
2.934 2.4% $1,276,760
$13,568,722
B&E 45,941
$17.466,538
28.5% 511,557,386
Larceny
512,506,576
513,664,493
35.0% $14,217,795
Motor Vehu.':le Theft $15.854,662
7,991 38.4%
o
9
-----~-~-
_ .. " ,...,-,";---- - ,., .. ,,~ .- '.'-"--~~~'-----~.'-'-~-:-'---; -'''-'~''- -'7-:-'::;:-":~ ~-,,;"'--'r-----" _;.._ • _~._~_, •• , .. __ " ... , .... ,,,~_ ~ __ ' .. _ ':"I •• ,
Zt::JiCSI!:
'1
r 1
'-~ )
Currency, Notes Etc.
Jelh'!!lry,Precious Metals
Clothing, Furs
Motor Vehicles
Office Equipment
Televisions, Radios, Etc.
Firearms
~ousehold Goods
Consumable Goods
Livestock
Miscellaneous
10
1.0%
'---_ ..
2.9%
1.6%
r--
0.2%
o I 5
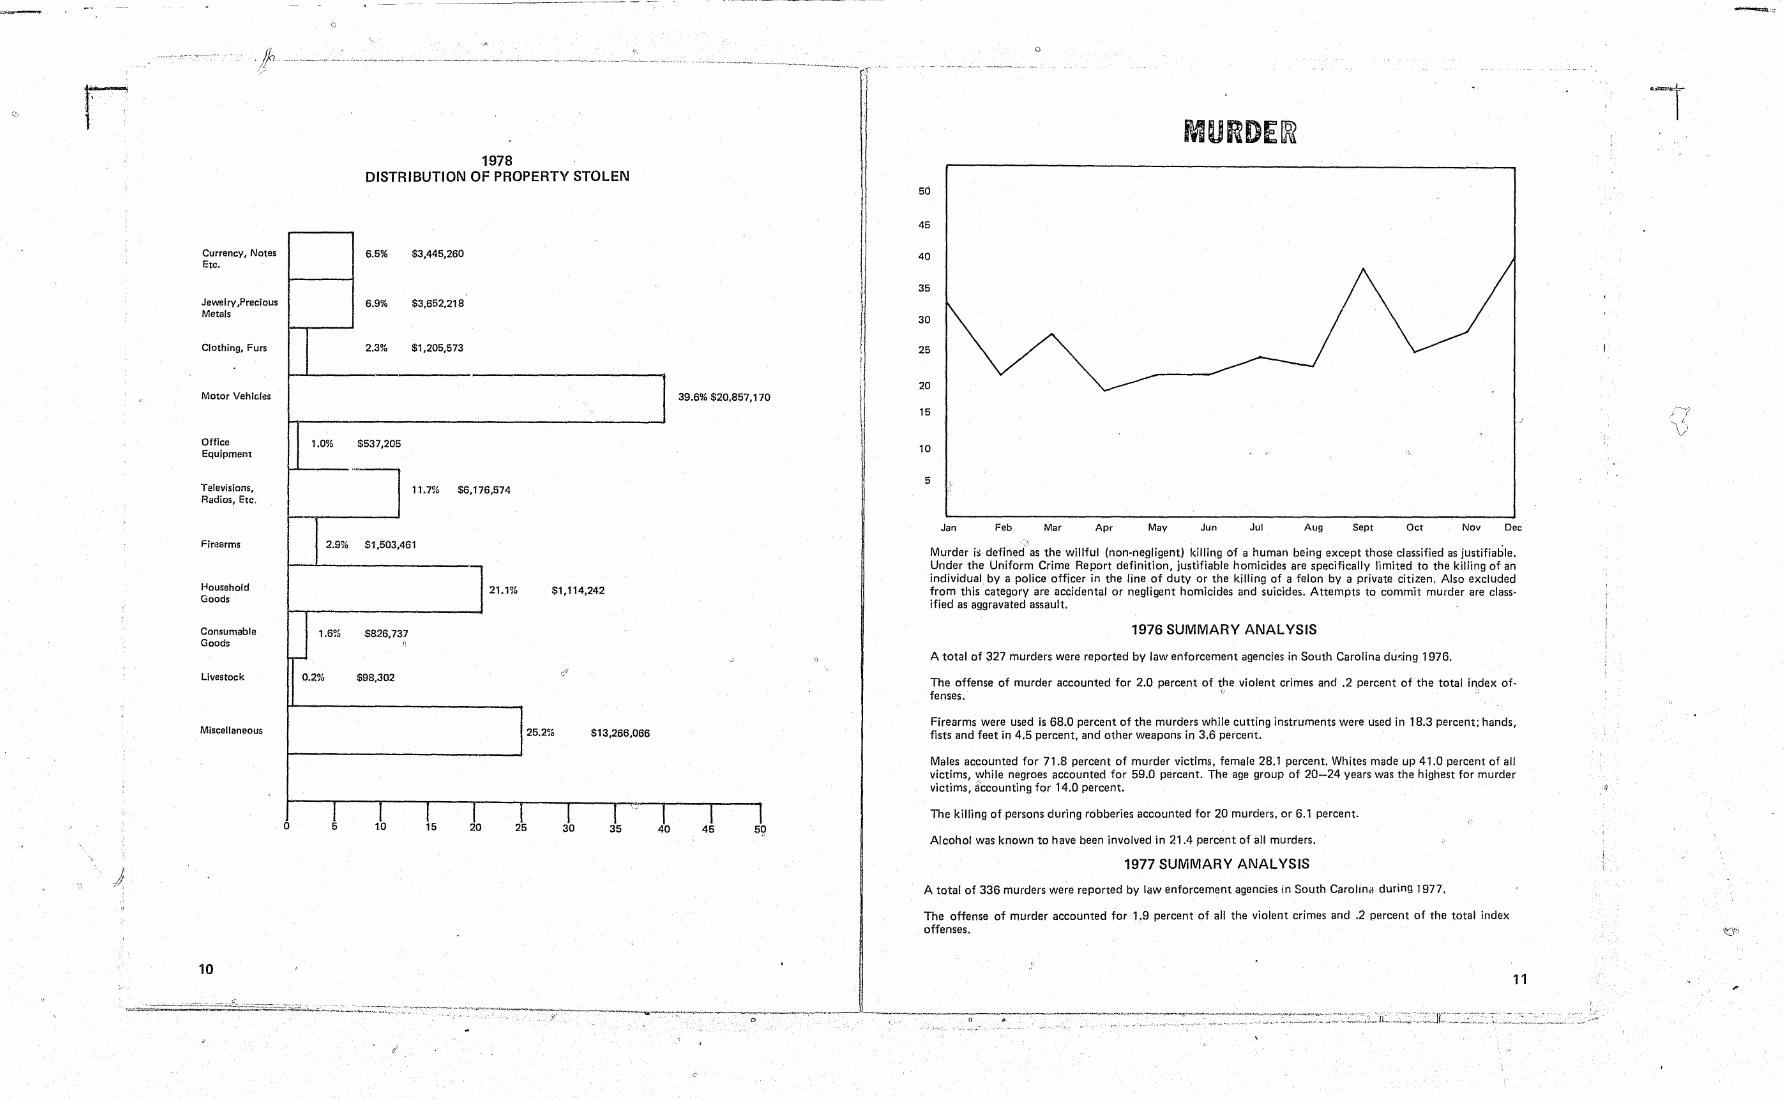
1978 DISTRIBUTION OF PROPERTY STOLEN
6.5% $3,445,260
6.9% $3,652,218
2.3% $1,205,573
$537,205
11.7% $6.176,574
$1,503,461
21.1% $1,114,242
5826,737 ii
$98,302 /,1
25.2% $13,266,066
J. I J 1 I I .,
10 15 20 25 30 35
39.6% $20,857,170
I I I 40 45 139
"
c
----~-... -~ ------
Q
50
45
40
35
30
25
20
15
10
5
Jan Feb Mar Apr May Jun Jut Aug Sept Oct Nov Dec
~ . Murder is defined as the willful (non-negligent) killing of a human being except those classified as justifiable. Under the Uniform Crime Report definition, justifiable homicides are specifically limited to the killing of an individual by a police officer in the line of duty or the killing of a felon by a private citizen. Also excluded from this category are accidental or negligent homicides and suicides. Attempts to commit murder are class· ified as aggravated assault.
1976 SUMMARY ANALYSIS
A total of 327 murders were reported by law enforcement agencies in South Carolina du,~ing 1976.
The offense of murder accounted for 2.0 percent of the violent crimes and .2 percent of the total index of-fenses. c' '
Firearms were used is 68.0 percent of the murders while cutting instruments were used in 18.3 percent; hands, fists and feet in 4.5 percent, and other weapons in 3,6 percent.
Males accounted for 71.8 percent of murder victims. female 28.1 percent. Whites made up 41.0 percent of all victims, while negroes accounted for 59.0 percent. The age group of 20-24 years was the highest for murder victims, accounting for 14.0 percent.
The killing of persons during robberies accounted for 20 murders, or 6.1 percent.
Alcohol was known to have been involved in 21.4 percent of all murders.
1977 SUMMARY ANALYSIS
A total of 336 murders were reported by law enforcement agencies in South Carolina during 1977.
The offense of murder accounted for 1.9 percent of all the violent crimes and .2 percent of the total index offenses.
11
'-,"
,II
~~------~- - ----- ---------...----~~-----~-----
rirearms were used in 75.2 percent of the murders while cutting instruments were used 13.1 percent, hands or feet in 2.9 percent and other weapons in 8.3 percent.
Males accounted for 78.9 percent of murder victims, females 21.1 percent. Whites made up 44.9 percent of all victims while Negroes accounted for 54.8 percent. The age group 25-29 years was the highest for murder Victims, accounting for 17.0 percent.
The killing of persons during robberies accounted for 28 murders or 8.3 percent.
Alcohol was}-~own to have been involved in 25.3 percent of all murders.
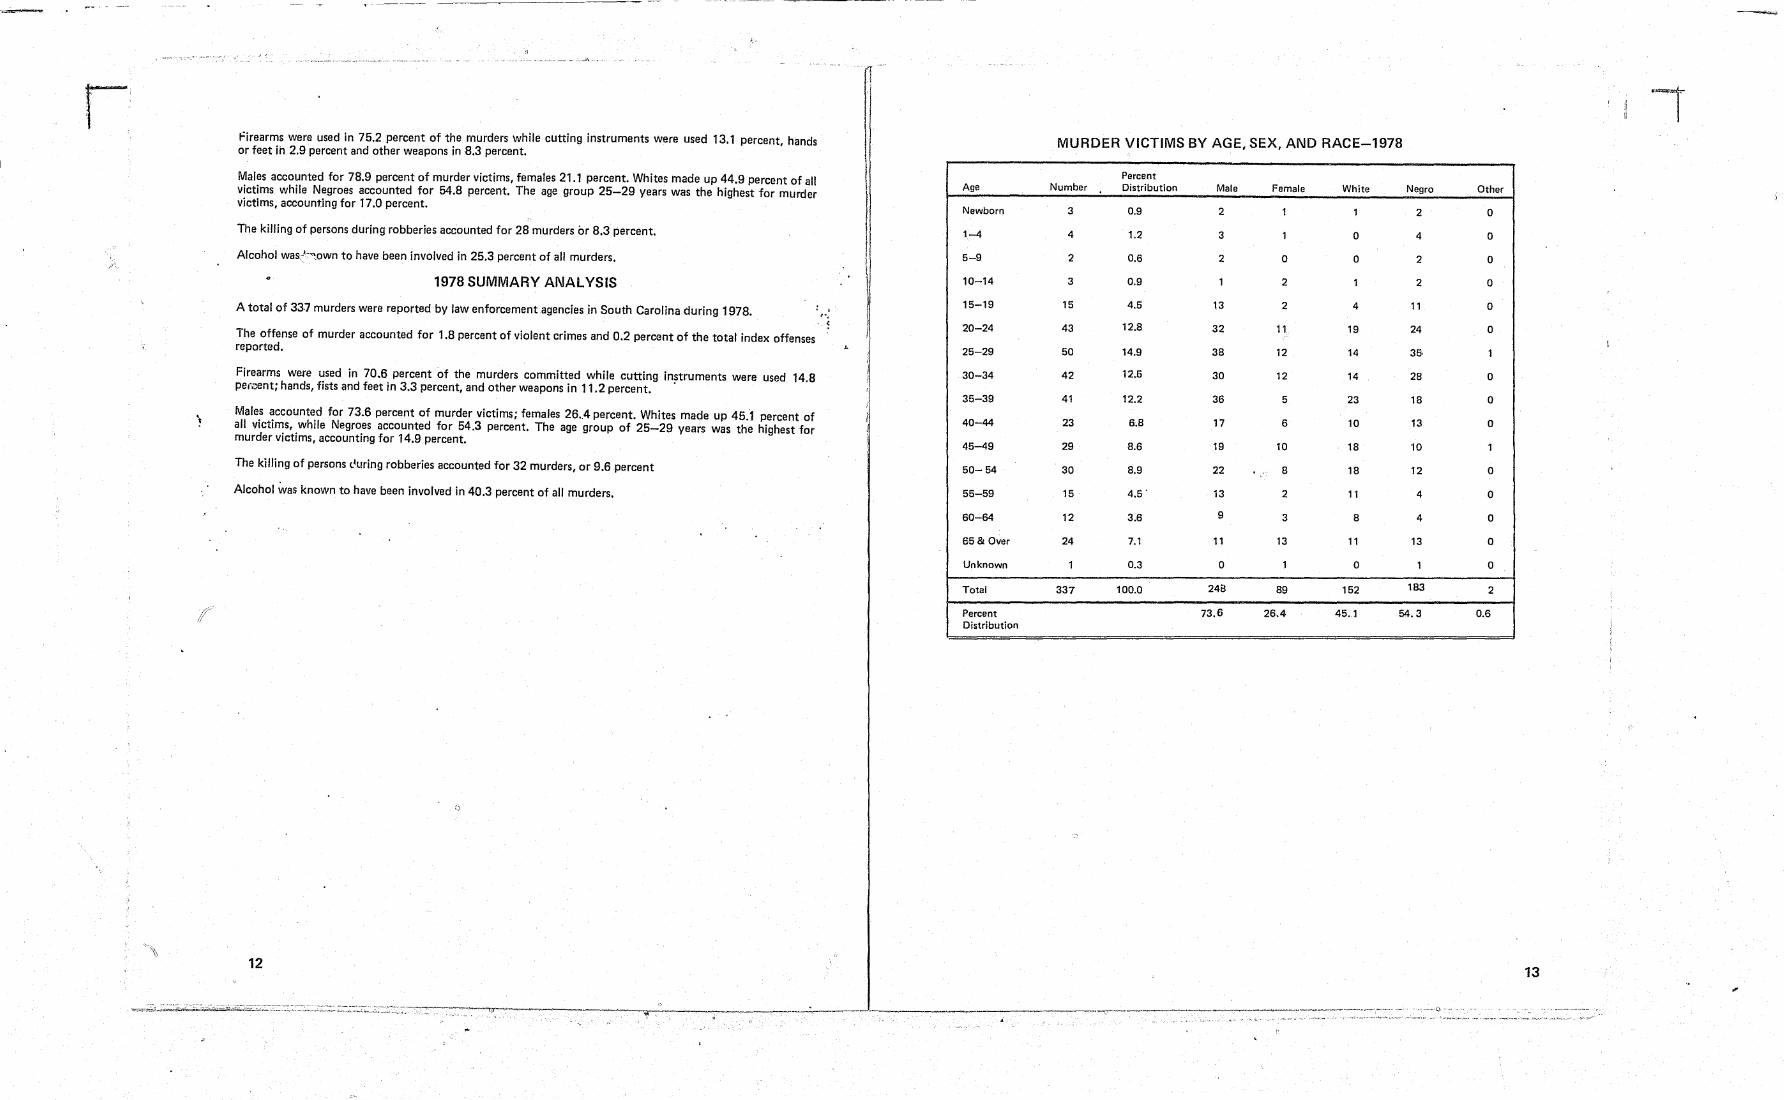
1978 SUMMARY ANALYSIS
A total of 33.7 murders were reported by law enforcement agencies in South Carolina during 1978.
The offense of murder accounted for 1.8 percent of violent crimes and 0.2 percent of the total index offenses reported.
Firearms were used in 70.6 percent of the murders committed while cutting instruments were used 14.8 pe .... ,ent; hands, fists and feet in 3.3 percent, and other weapons in 11.2 percent. .
Males accounted for 73.6 percent of murder victims; females 26.4 percent. Whites made up 45.1 percent of all victims, while Negroes accounted for 54.3 percent. The age group of 25-29 years was the highest for murder victims, accounting for 14.9 percent.
The killing of persons l1uring robberies accounted for 32 murders, or 9.6 percent
Alcohol was known to have been involved in 40.3 percent of all murders.
12
, ",
T j
Age
Newborn
1-4
5-9
10-14
15-19
20-24
25-29
30-34
35-39
40-44
45-49
50-54
55-59
60-64
65 & Over
Unknown
Total
Percent Distribution
MURDER VICTIMS BY AGE, SEX, AND RACE-1978
Percent Number Distribution Male Female White Negro
3 0.9 2 1 1 2
4 1.2 3 1 0 4
2 0.6 2 0 0 2
3 0.9 1 2 1 2
15 4.5 13 2 4 11
43 12.8 32 11 19 24
50 14.9 38 12 14 35,
42 12.6 30 12 14 28
41 12.2 36 5 23 18
23 6.8 17 6 10 13
29 8.6 19 10 18 10
30 8.9 22 8 18 12
15 4.5 . 13 2 11 4
12 3.6 9 3 8 4
24 7.1 11 13 11 13
1 0.3 0 1 0 1
337 100.0 248 89 152 183
73.6 26.4 45 . .1 54.3
-------~--~-
Other
0
0
0
0
0
0
1
0
0
0
1
0
0
0
0
0
2
0.6
13
-.. ~-."'.- .~<-~ - .... ,--_. ,'~.-... _--<
r' . .
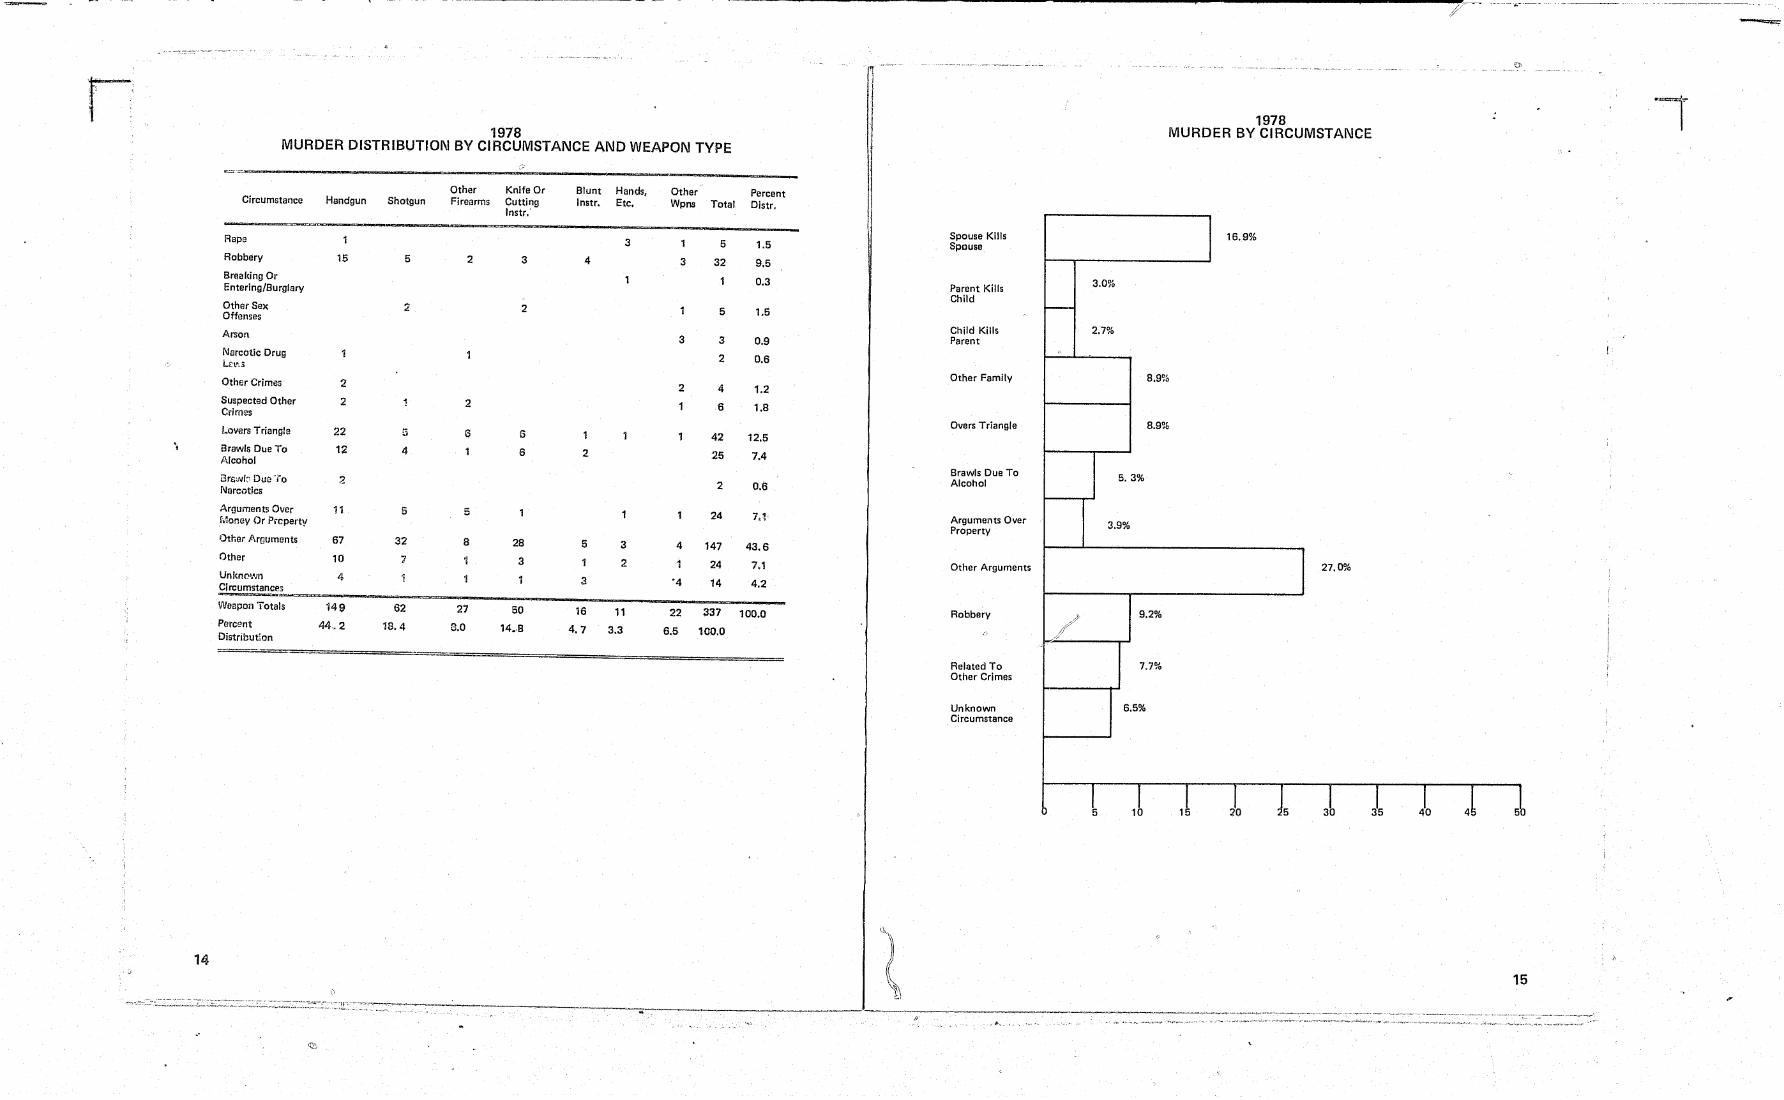
1978 MURDER DISTRIBUTION BY CIRCUMSTANCE AND WEAPON TYPE
.'
Other Knife Or Blunt Hands, Other Circumstance Handgun Shotgun Firearms Cutting Instr. Etc. Wpns Total
Instr:
Rape 3 5 Robbery 15 5 2 3 4 3 32 Breaking Or Entering/Burglary
Other Sex 2 2 5 Offenses
Arson 3 3 Narcotic Drug
2 L2V'.S
Other Crimes 2 2 4 Suspected Other 2 2 6 Crimes
Lovers Triangle 22 (3 6 6 42 " Brawls Dlle To 12 4 6 2 25 /-'\Icohol
arew!" Due ·to 2 2 Narcotics
Arguments Over 11 5 5 24 Money Or Prcperty
Other Arguments 67 32 8 28 5 3 4 147 Other 10 7 1 3 1 2 24 Unknown 4 1 3 '4 14 Circumstances
0
Weapon 'Iotals 149 62 27 50 16 11 22 337 Percent 44.2 18.4 8.0 DistributIon
14 •. 8 4. 7 3.3 6.5 100.0
=---=------
14
Percent Distr.
1.5
9.5
0.3
1.5
0.9
0.6
1.2
1.8
12.5
7.4
0.6
7.1
43.6
7.1
4.2
100.0
."
I 1
Spouse Kills Spouse
Parent Kills Child
Child Kills Parent
Other Family
Overs Triangle
Brawls Due To Alcohol
Arguments Over Property
Other Arguments
Robbery
Related To Other Crimes
Unknown Circumstance
1978 MURDER BY CIRCUMSTANCE
16.9%
3.0%
r---
2.7%
8.9%
8.9%
5.3%
3.9%
27.0%
/} 9.2% ;;7
//
7.7%
6.5%
l ,t 11 }o J5 3l }5 )0 4l 5
II •
Handgun
Rifle
Unknovvn Firearms
'~tj!fo, Cuttino Instr.
Blunt Object
Hands, Fists Feet
Other Wsspons
J
16
"" -7Y
1 I j
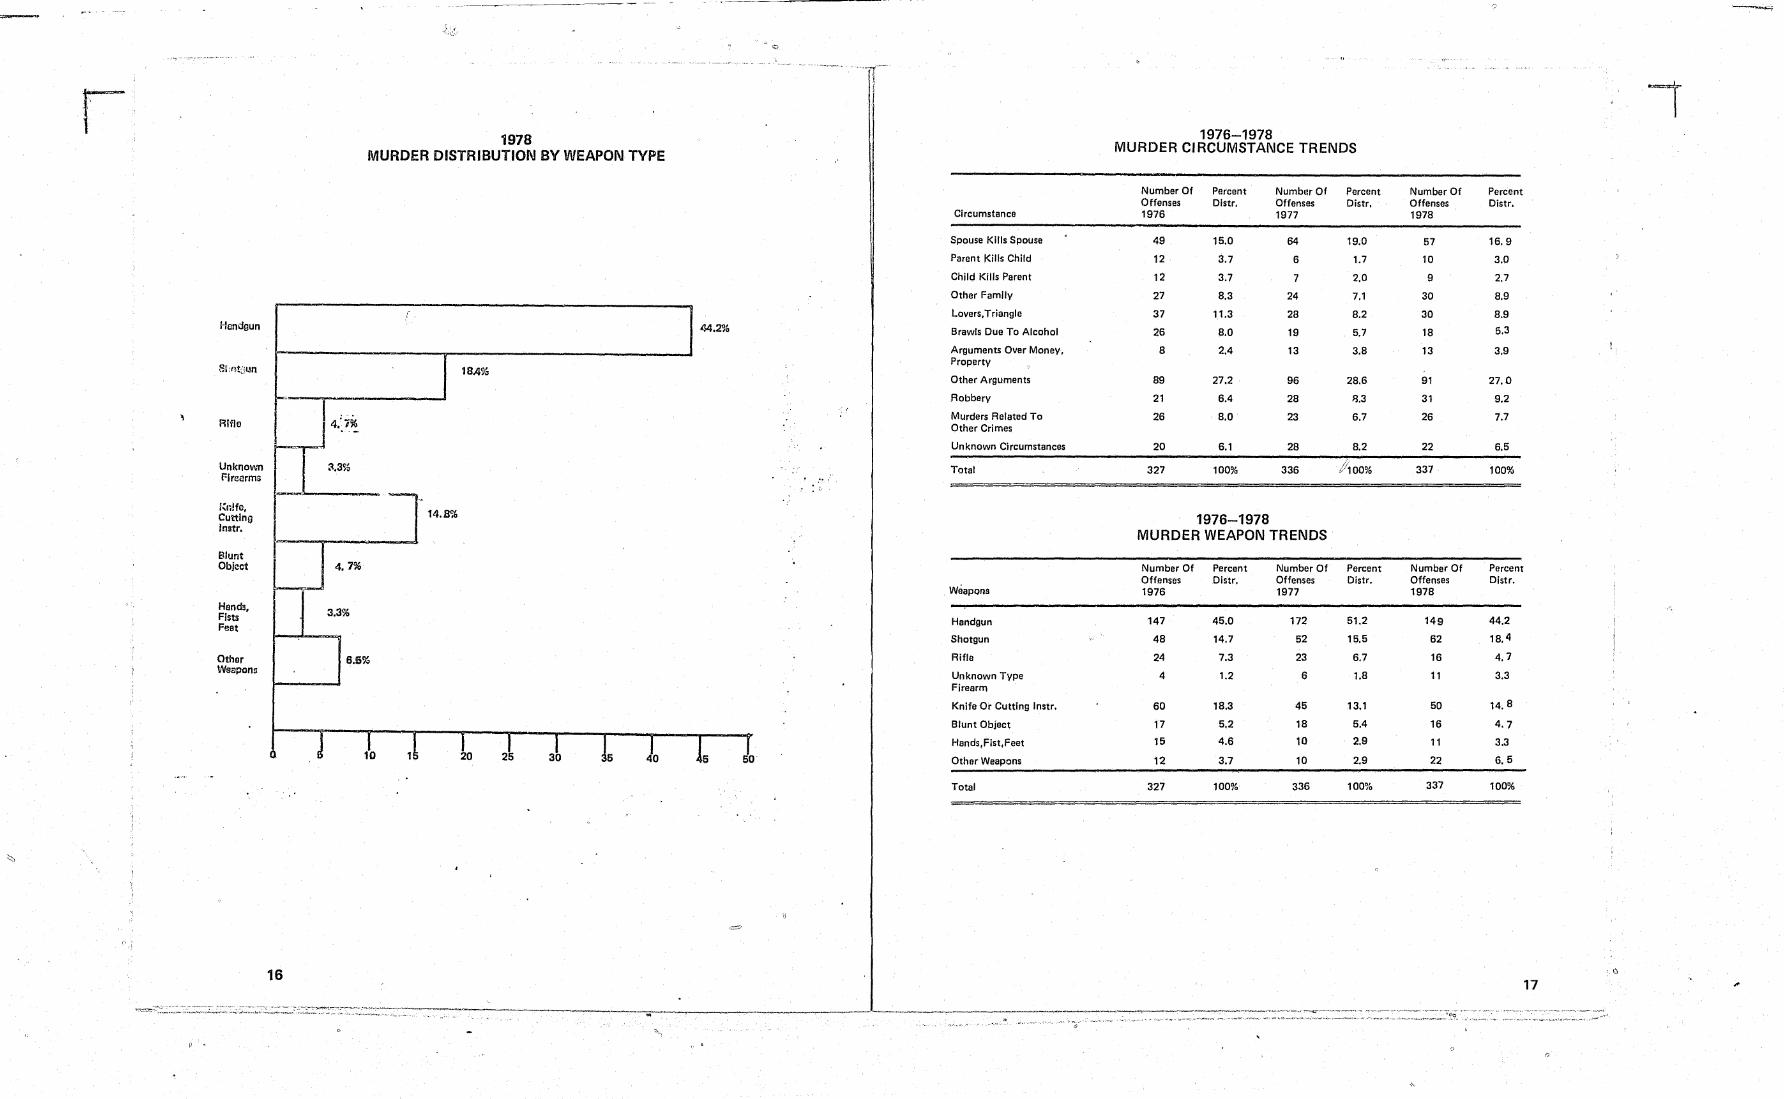
1978 MURDER DISTRIBUTION BY WEAPON TYPE
(
44.2%
18,4%
4.';% . -
::l.3~b
- .. 14.8%
4.1%
3.3%
6.5%
110 11 10 2l 3t J5 10 15 ]0
=
-----~-~-- ----~-----------~ --~-------
~
I 1976-1978
MURDER CIRCUMSTANCE TRENDS
Number Of Percent Number Of Percent Number Of Percent Offenses Distr. Offenses Distr. Offenses Distr.
Circumstance 1976 1977 1978
Spouse Kills Spouse 49 15.0 64 19.0 57 16.9
Parent Kills Child 12 3.7 6 1.7 10 3.0
Child Kills Parent 12 3.7 7 2.0 9 2.7
Other Family 27 8.3 24 7.1 30 8.9
Lovers. Triangle 37 11.3 28 8.2 30 8.9
Brawls Due To Alcohol 26 8.0 19 5.7 18 5.3
Arguments OVer Money. 8 2.4 13 3.8 13 3.9 Property
Other Arguments 89 27.2 96 28.6 91 27.0
Robbery 21 6.4 28 B.3 31 9.2
Murders Related To 26 8.0 23 6.7 26 7.7 Other Crimes
Unknown Circumstances 20 6.1 28 8.2 22 6.5
Total 327 100% 336 1,00% 337 100%
1976-1978 MURDER WEAPON TRENDS
Number Of Percent Number Of Percent Number Of Percent Offenses Dlstr. Offenses Distr. Offenses Dlstr.
Weapons 1976 1977 1978
Handgun 147 45.0 172 51.2 149 44.2
Shotgun 48 14.7 52 15.5 62 18.4
Rifle 24 7.3 23 6.7 16 4.7
Unknown Type 4 1.2 6 1.8 11 3.3 Firearm
Knife Or Cutting Instr. 60 18.3 45 13.1 50 14. 8
Blunt Object 17 5.2 18 5.4 16 4.7
Hands,Flst.Feet 15 4.6 10 2.9 11 3.3
Othflr Weap,:llls 12 3.7 10 2.9 22 6.5
Total 327 100% 336 100% 337 100%
D
17
.-__ ~._...-.. ..... -..-,._ .......... __ ~_. ____ ....-_ ... ,_.",,~ __ ~ __ .-.-< ~...r'-'-'--' --~.,~ ~ ~'.~'- ,<, ,,--~~-, .---- •• -;;(j'; ~-~'''' c, __ , _.~ .,..._"., ""', ".,., ,",'f '"~~'<O''''''~.'~ ""'~~". --,,,,,-,.,_ ., ~ ... ,~" ,~.~_ ,·.><"~_~~ ..... f-.,.-',,,,~ ~ ~
'-'
()
r 1976-1978
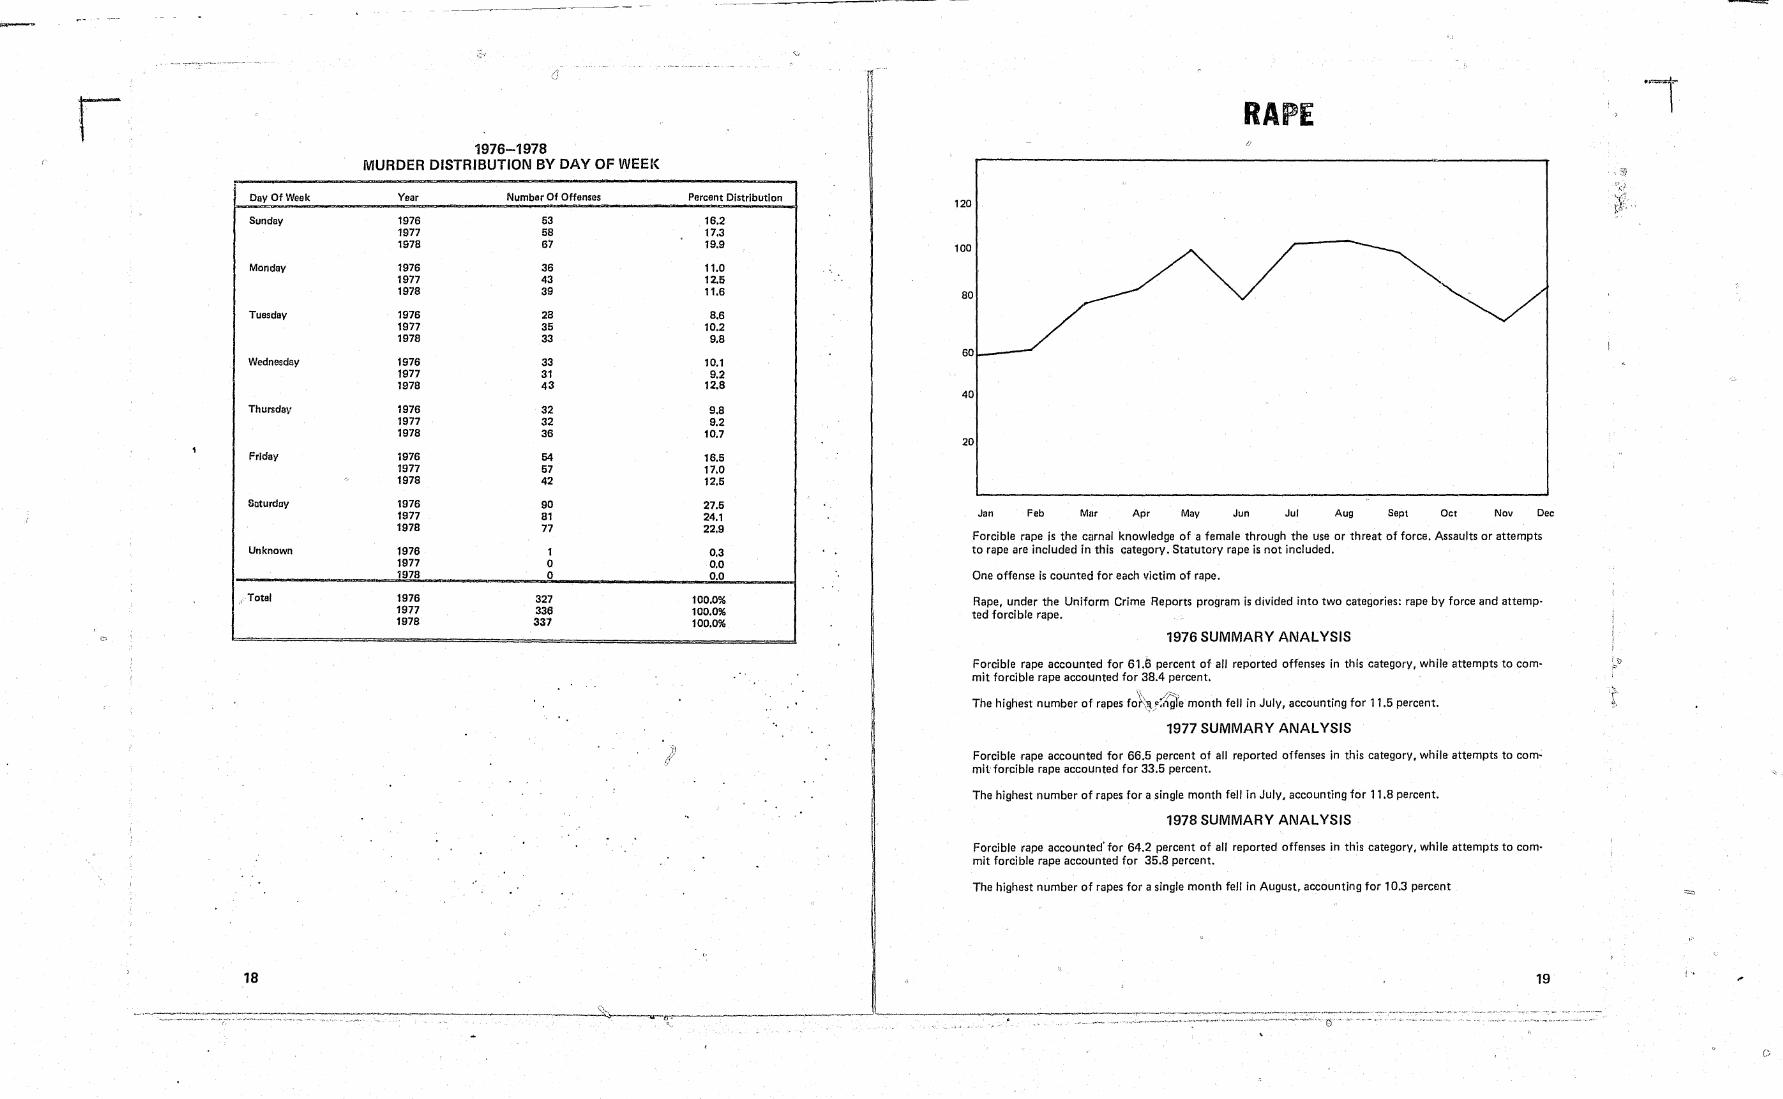
MURDER DISTRIBUTION BY DAY OF WEEK ft
Day Of Week Year Number Of Offenses
Sunday 1976 53 1977 58 . 1978 67
Monday 1976 36 1977 43 1978 39
Tuesday 1976 28 1977 35 1978 33
Wednesday 1976 33 1977 31 1978 43
Thursda\' 1976 32 1977 32 1978 36
Friday 1976 54 1977 57 1978 42
Saturday 1976 90 1977 81 1978 77
Unknown 1976 1 1977 0
~~ :::t:==I 1978 0
<' Total 1976 327 1977 336 1978 331
18
--------~~----
Percent Distribution
16.2 17.3 19.9
11.0 12.5 11.6
8.6 10.2 9.8
10.1 9.2
12.8
9.8 9.2
10.7
16.5 17.0 12.5
27.5 24.1 22.9
0.3 0.0 0.0
100.0% 100.0% 100.0%
'.
RAPE I)
120
100
80
601----
40
20
Jan Feb Mar Apr May Jun Jul Aug Sept Oct Nov Dec
Forcible rape is the carnal knowledge of a female through the use or threat of force. Assaults or attempts to rape are included in this category. Statutory rape is not included.
One offense is counted for each victim of rape.
Rape, under the UnifClrm Crime Reports program is divided into two categories: rape by force and attemp' ted forcible rape.
1976 SUMMARY ANALYSIS
Forcible rape accounted for 61.6 percent of all reported offenses in this category, while attempts to commit forcible rape accounted for 38.4 percent.
The highest number of rapes fO~~_l';;~~;e month fell in July. accounting for 11.5 percent.
1977 SUMMARY ANALYSIS
Forcible rape accounted for 66.5 percent of all reported offenses in this category. while attempts to commit forcible rape accounted for 33.5 percent.
The highest number of rapes for a single month fell in July. accounting for 11.8 percent.
1978 SUMMARY ANALYSIS
Forcible tape accounted' for 64.2 percent of all reported offenses in this category. while attempts to com· mit forcible rape accounted for 35.8 percent.
The highest number of rapes for a single month fell in August, accounting for 10,3 percent
19
=
C" -,
i1 1/
r
o
. .,
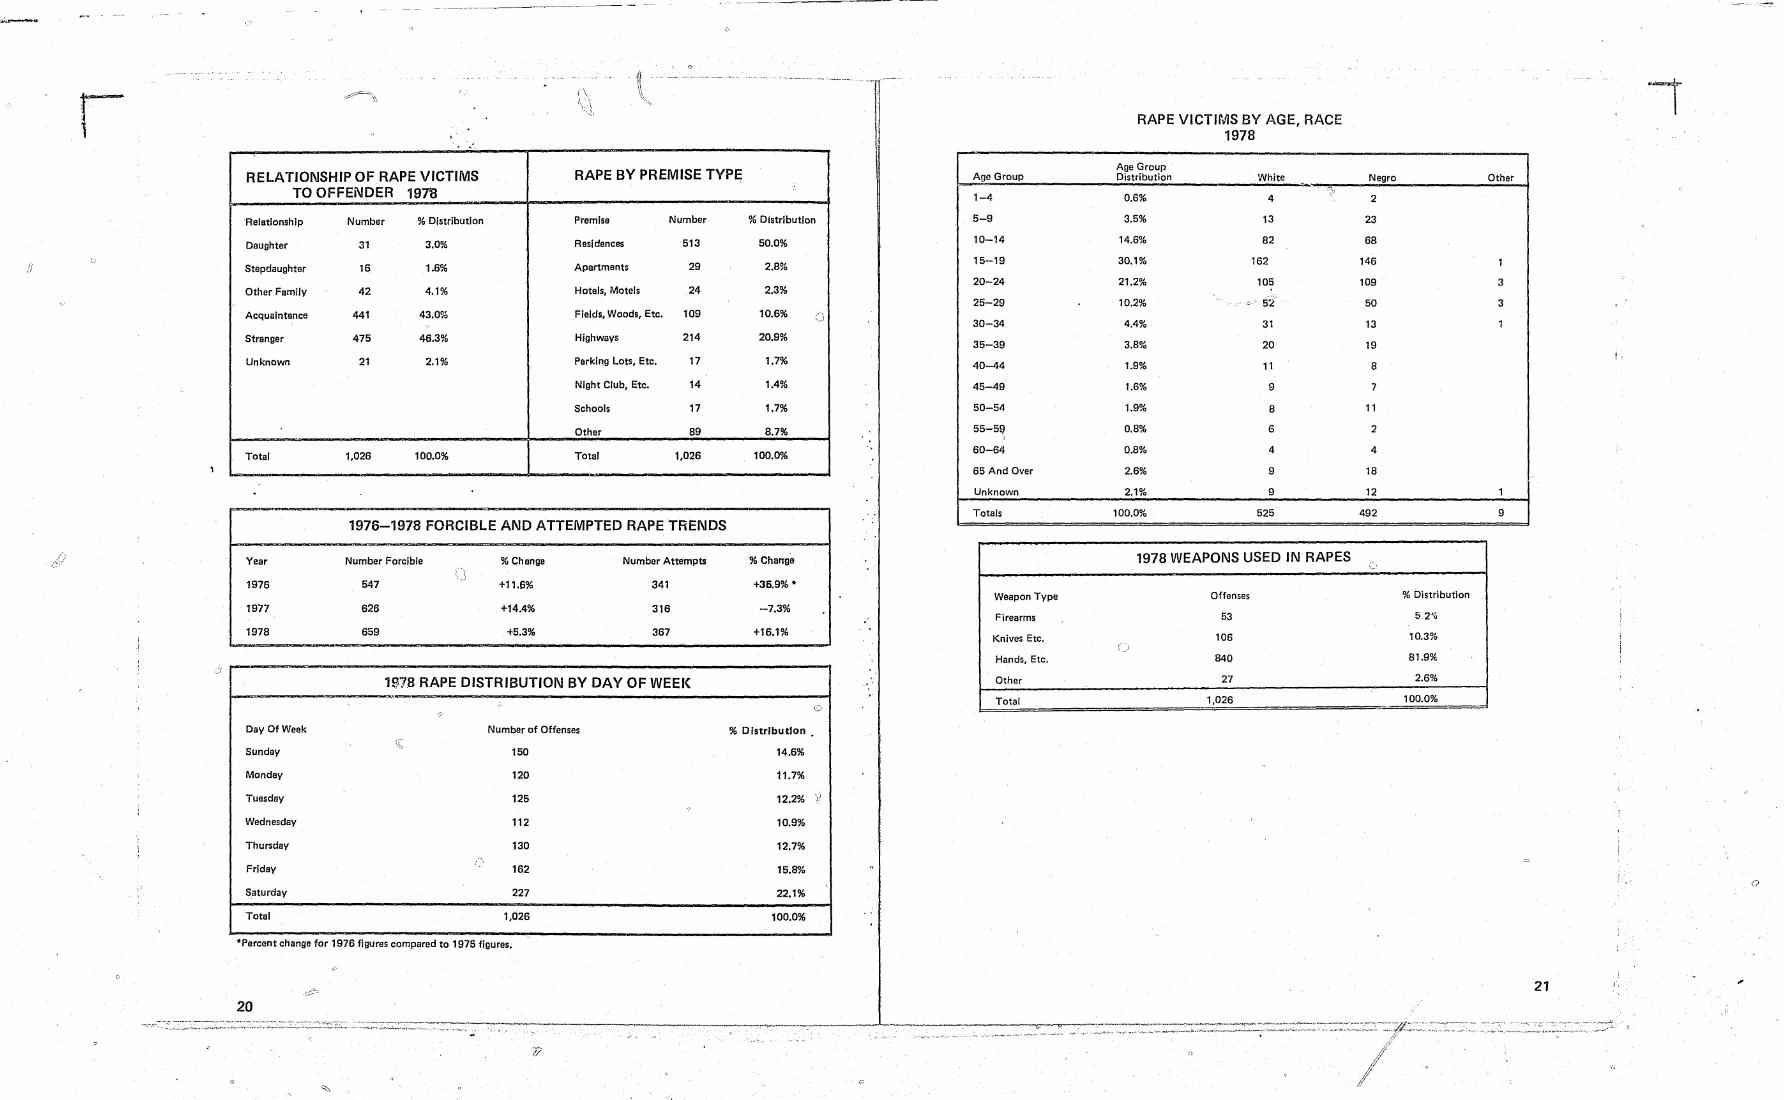
RELATIONSHIP OF RAPE VICTIMS RAPE BY PREMISE TYPE TO OFFENDER 1918
Relationship
Daughter
Stepdaughter
Other Family
Acquaintance
Stranger
Unknown
Total
Year
1976
19'77
1978
Day Of Week
Sunday
Monday
Tuesday
Wednesday
Thursday
Friday
Saturday
Total
Number % Distribution Premise Number
31 3.0% Residences 513
16 1.6% Apartments 29
42 4.1% Hotels, Motels 24
441 43.0% Fields, Woods, Etc. 109
475 46.3% Highways 214
21 2.1% Parking Lots, Etc. 17
Night Club, Etc. 14
Schools 17
Other 89
1,026 100.0% Total 1,026
1976-1978 FORCIBLE AND ATTEMPTED RAPE TRENDS
Number Forcible % Change Numbar Attempts
547 +11.6% 341
625 +14.4% 316
659 +5.3% 357
lS78 RAPE DISTRIBUTION BY DAY OF WEEK
Number of Offenses
150
120
125
112
130
162
227
1,026
"Percent change for 1976 figures compared to 1975 figures.
20
% Distribution
50.0%
2.8%
2.3%
10.6%
20.9%
1.7%
1.4%
1.7%
8.7%
l00.00A,
% Changa
+35.9% *
-7.3%
+16.1%
% Distribution
14.6%
11.7%
:J
(0
12.2% V
10.9%
12.7%
15.8%
22.1%
100.0%
;
,
Age Group
1-4
5-9
10-14
15-19
20-24
25-29
30-34
35-39
40-44
45-49
50-54
55-5Q
60-64
65 And Over
Unknown
, . Totals
Weapon Type
Firearms
Knives Etc.
Hands, Etc.
" Other
.' Total
.,
RAPE VICTIMS B Y AGE, RACE
Age Group Distribution
0.5%
3.5%
14.6%
30.1%
21.2%
10.2%
4.4%
3.8%
1.9%
1.6%
1.9%
0.8%
0.8%
2.6%
2.1%
100.0%
197 8
' ~
White
4
13
82
162
105 .~-.
'. 52
31
20
11
9
8
6
4
9
9
525
1978 WEAPONS U SED IN RAPES
Offenses
53
106 (".J
840
27
1,026
Negro
2
23
68
146
109
50
13
19
8
7
11
2
4
18
12
492
% Distribution
52'{'
10.3%
81.9%
2.6%
100.0%
Other
3
3
9
o
21 /,
r i
.------------------------~--------------------------~------------------------------------~---------------------------
., .. _ ~~_. __ ~~.__ ..•. ~_., _ ,_ ... _____ .. ~,~, __ ,,<,~ __ ._.-~,._~,. '0 __ ~ __ ". _.. _'~"" __ g, _ __ .(.._ .. _ ~. _._.L __ ... ~ __ :. ~ _~" .. ~ .. _.~" ___ ~. .... •. __ ~ __ __'-_~_._~_ ,j' ,-,_. __ •. ~ . ____ ~,'_~. ___ , ______ . ~ __ • __________ .. "_
ROBBERY
325
30Q
22
Jan Feb Mar Apr May Jun Jut Aug Sept Oct Nuv Dec
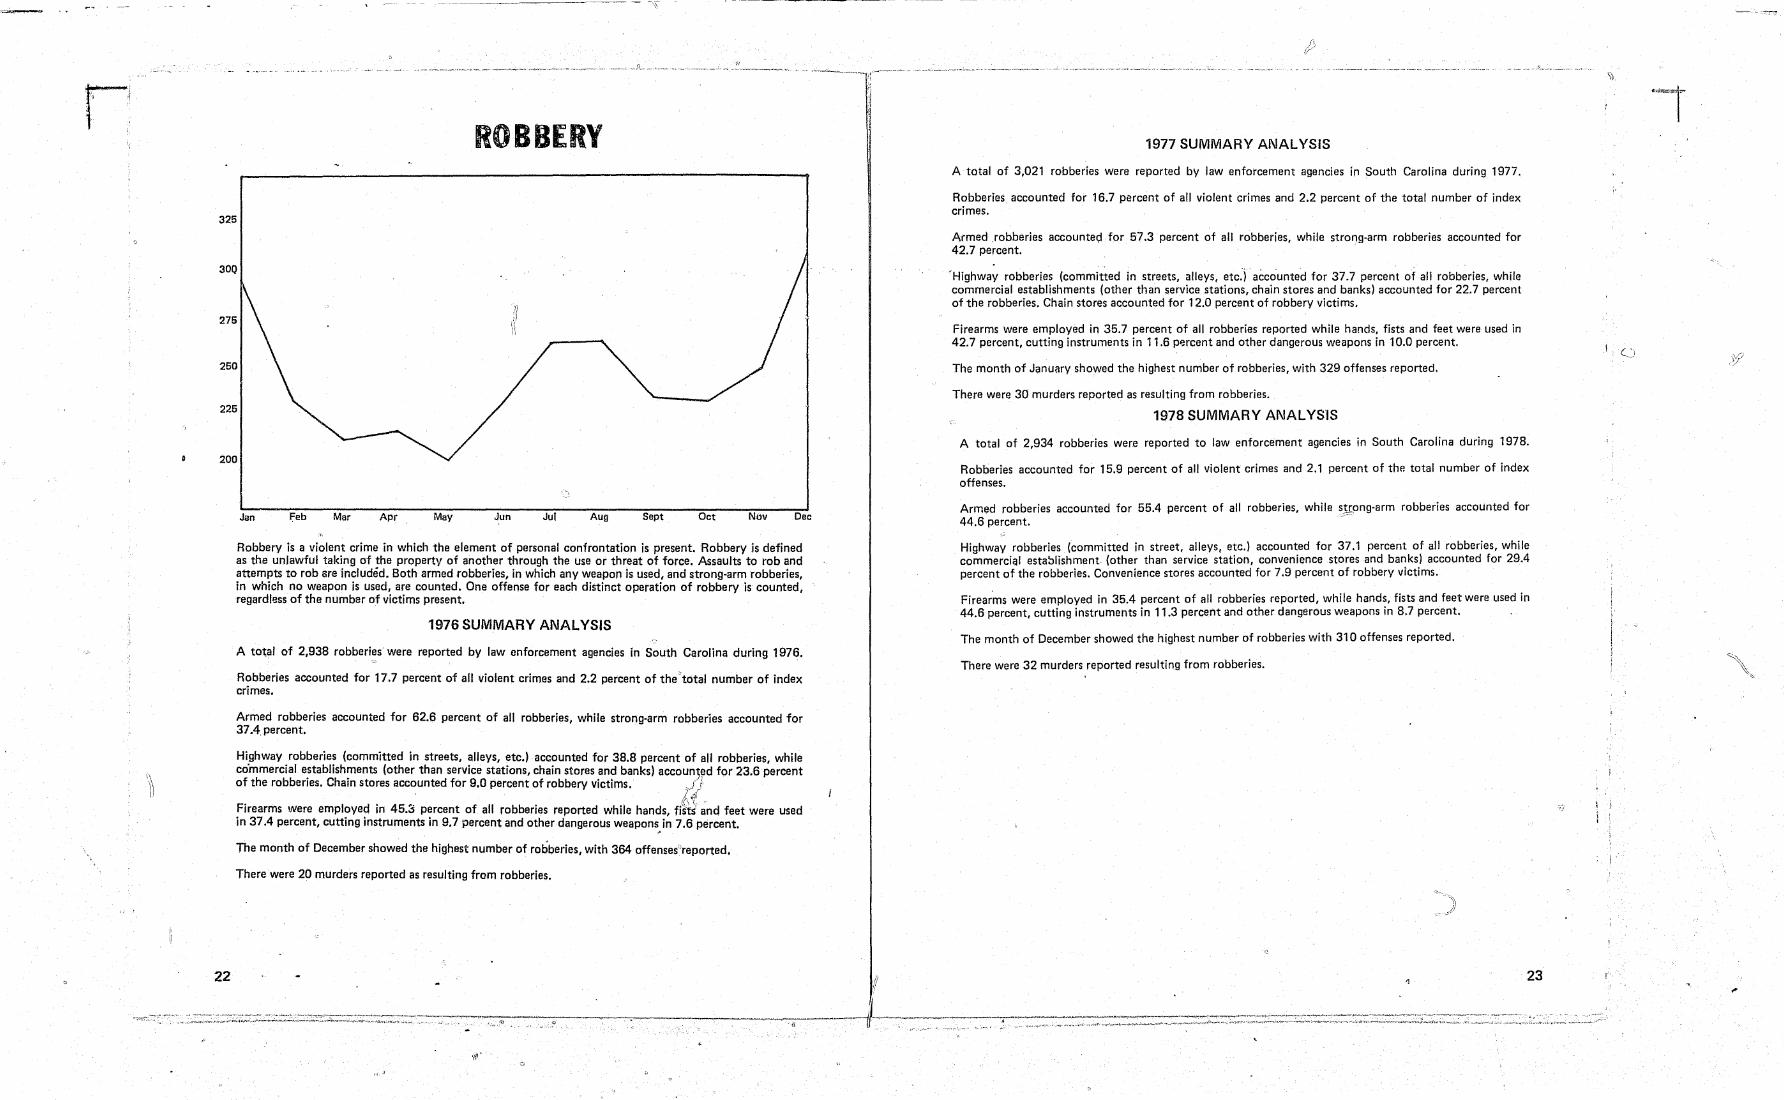
Robbery is a violent crime in which the element of personal confrontation is present. Robbery is defined as the unlawful taking of the property of another through the use or threat of force. Assaults to rob and attempts to rob are included. Both armed robberies, in which any weapon is used, and strong-arm robberies, in which no weapon is used, are counted. One offense for each distinct operation of robbery is counted, regardless of the number of victims present.
1976 SUMMARY ANALYSIS
A total of 2,938 robberies were reported by law enforcement agencies in South Carolina during 1976.
Robberies accounted for 17.7 percent of all violent crimes and 2.2 percent of the 'total number of index crimes.
Armed robberies accounted for 62.6 percent of all robberies, while strong·arm robberies accounted for 37.4. percent.
Highway robberies (committed in streets, alleys, etc.) accounted for 38.8 percent of all robberies, while cdmmercial establishments (other than service stations, chain stores and banks) accoun~f.ld for 23.6 percent of the robberies. Chain stores accounted for 9.0 percent of robbery victims..J !,
Firearms were employed in 45.3 percent of all robberies reported while hands, fi~f ~nd feet were used in 37.4 percent, cutting instruments in 9.7 percent and other dangerous weapons}n 7.6 percent.
The month of December showed the highest number of robberies, with 364 offenses"reported.
There were 20 murders reported as resulting from robberies.
,,' :1
"
1977 SUMMARY ANALYSIS
A total of 3,021 robberies were reported by law enforcement agencies in South Carolina during 1977.
Robberies accounted for 16.7 percent of all violent crimes and 2.2 percent of the total number of index crimes.
Armed .robberies accounteo for 57.3 percent of all robberies, while strong-arm robberies accounted for 42.7 percent.
'Highway robberies (committed in streets, alleys, etc:i accounted for 37.7 percent of all robberies, while commercial establishments (other than service stations, chain stores and banks) accounted for 22.7 percent of the robberies. Chain stores accounted for 12.0 percent of robbery victims.
Firearms were employed in 35.7 percent of all robberies reported while hands, fists and feet were used in 42.7 percent, cutting instruments in 11.6 pl:lrcent and other dangerous weapons in 10.0 percent.
The month of January showed the highest number of robberies, with 329 offenses reported.
There were 30 murders reported as resulting from robberies.
1978 SUMMARY ANALYSIS
A total of 2,934 robberies were reported to law enforcement agencies in South Carolina during 1978.
Robberies accounted for 15.9 percent of all violent crimes and 2.1 percent of thp. total number of index offenses.
Armed robberies accounted for 55.4 percent of all robberies, while s!r.ong-arm robberies accounted for 44.6 percent. ~-
Highway robberies (committed in street, alleys, etc,) accounted for 37.1 percent of all robberies, while commercial establishment (other than service station, convenience stores and banks) accounted for 29.4 percent of the robberies. Convenience stores accounted for 7.9 percent of robbery victims.
Firear'ms were employed in 35.4 percent of all robberies reported, While hands, fists and feet were Llsed in 44.6 percent, cutting instruments in 11.3 percent and other dangerous weapons in 8.7 percent.
The month of December showed the highest number of robberies with 310 offenses reported.
There were 32 murders reported resulting from robberies.
23
I C:.:
: I
r . ,
Classification
Highway
Commercial Establishment
Service Station
Convenience Store
Residence
Bank
Miscellaneous
Total For S. C.
Weapon
Firearm
Knives, Etc.
Other Weapons
Hands, Etc.
Total
24
o
-v------
(\1
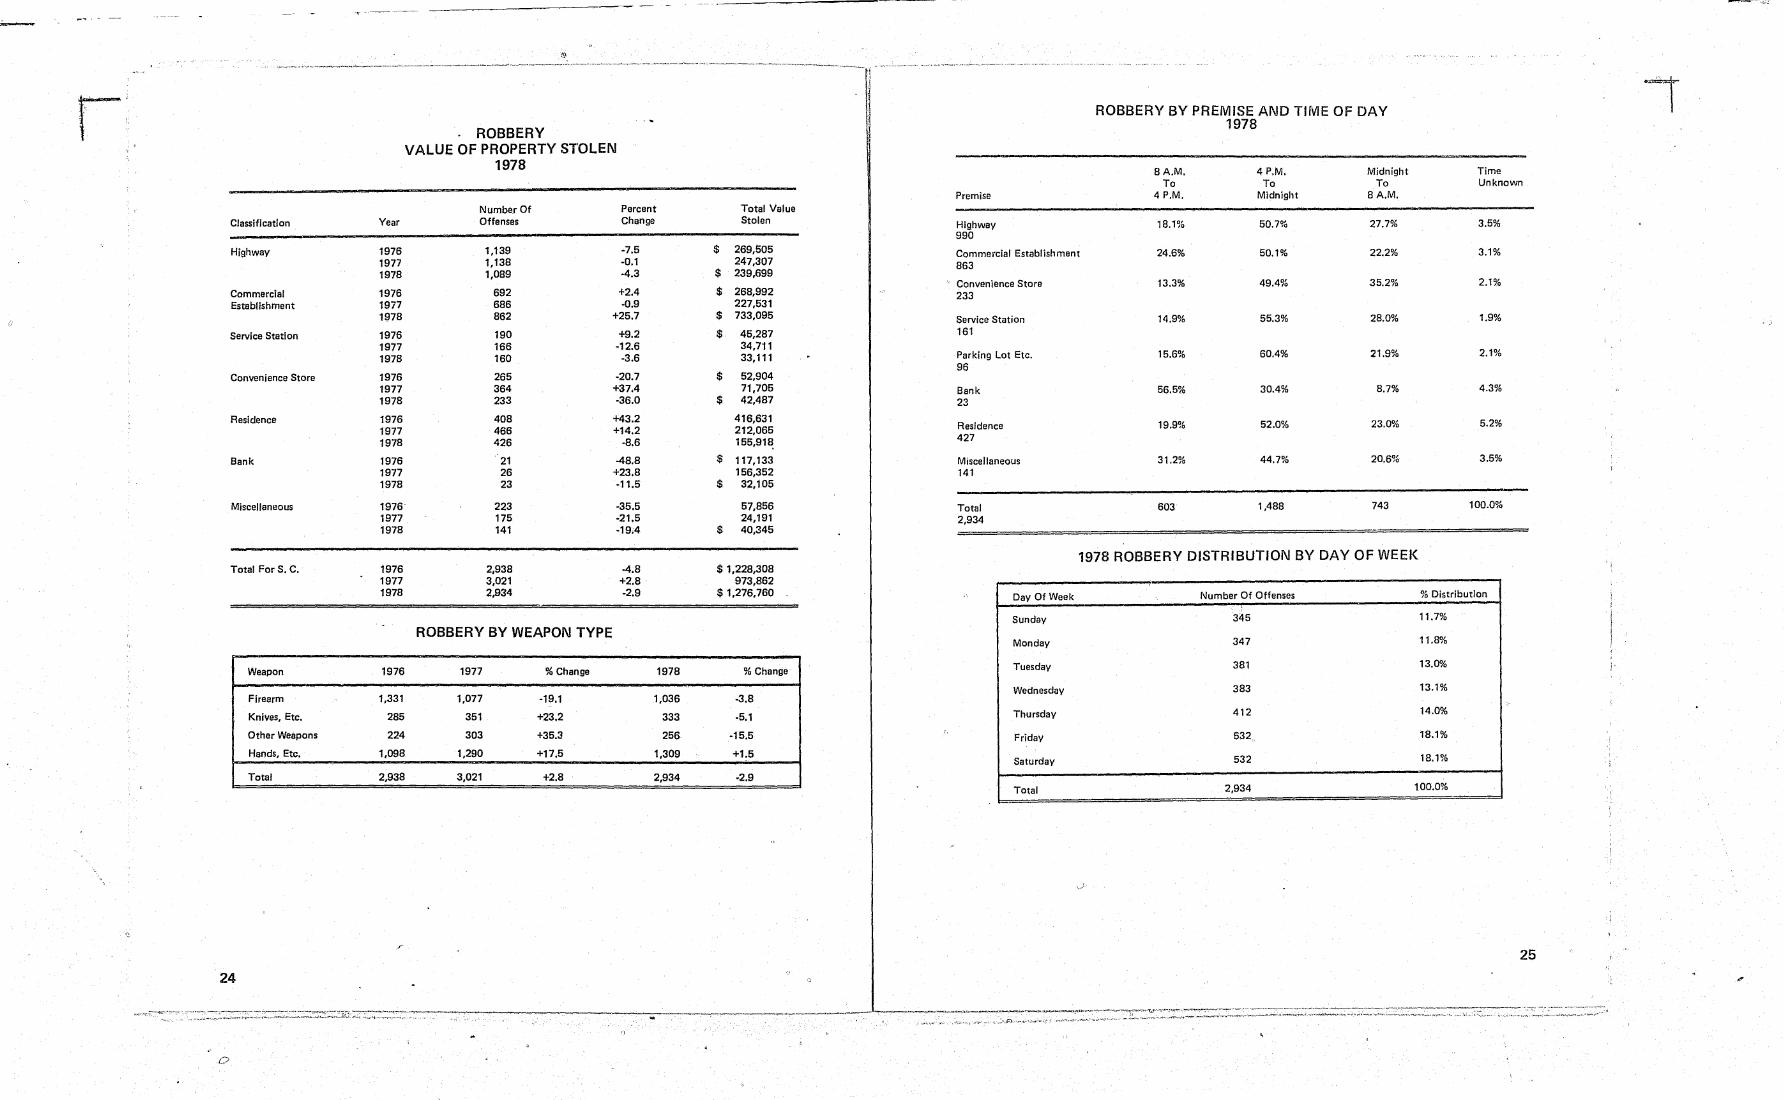
ROBBERY VALUE OF PROPERTY STOLEN
1978
Number Of Percent Year Offenses Change
1976 1,139 -7.5 1977 1,138 -0.1 1978 1,089 -4.3
1976 692 +2.4 1977 686 -0.9 1978 862 +25.7
1976 190 +9.2 1977 166 -12.6 1978 160 -3.6
1976 265 -20.7 1977 364 +37.4 1978 233 -36.0
1976 408 +43.2 1977 466 +14.2 1978 426 -8.6
1976 21 -48.8 1977 26 +23.8 1978 23 -11.5
1976 223 -35.5 1977 175 -21.5 1978 141 -19A
1976 2,938 -4.8 1977 3,021 +2.8 1978 2,934 -2.9
ROBBERY BY WEAPON TYPE
1976 1977 % Change 1978
1,331 1,077 -19.1 1,036
285 351 +23.2 333
224 303 +35.3 256
1,098 1,290 +17.5 1,309
2,938 3,021 +2.8 2,934
Total Value Stolen
$ 269,505 247,307
$ 239,699
$ 268,992 227,531
$ 733,095
$ 45,287 34,711 33,111
$ 52,904 71,705
$ 42,487
416,631 212,065 155,91~
$ 117,133 156,352
$ 32,105
57,856 24,191
$ 40,345
$1,228,308 973,862
$ 1,276,760
% Change
-3.8
-5.1
-15.5
+1.5
-2.9
-- .--- -- --iOF-- -----
ROBBERY BY PREMISE AND TIME OF DAY 1978
BA.M. 4 P.M. Midnight Time To To To Unknown
Premise 4 P.M. Midnight BA.M.
Highway 18.1% 50.7% 27.7% 3.5% 990
Commercial Establishment 24.6% 50.1% 22.2% 3.1% 863
, Convenience Store 13.3% 49.4% 35.2% 2.1% 233
Service Station 14.9% 55.3% 28.0% 1.9% 161
Parking Lot Etc. 15.6% 60.4% 21.9% 2.1% 96
Bank 56.5% 30.4% 8.7% 4.3% 23
Residence 19.9% 52.0% 23.0% 5.2% 427
Miscellaneous 31.2% 44.7% 20.6% 3.5% 141
Total 603 1,488 743 100.0% 2,934
1978 ROBBERY DISTRIBUTION BY DAY OF WEEK
Day Of Week Number Of Offenses % Distribution
Sunday 345 11.7%
Monday 347 11.8%
Tuesday 381 13.0% l'
Wednesday 383 13.1%
Thursday 412 14.0%
Friday 532" 18.1%
Saturday 532 18.1%
Total 2,934 100.0%
25
".0< ...
r 1500
1400
1300
1200
1100
1000
900
800
26
-------------------------.--------------1 '; J
AGGRAVATED ASSAULT
j"~
Jan Mar Apr May
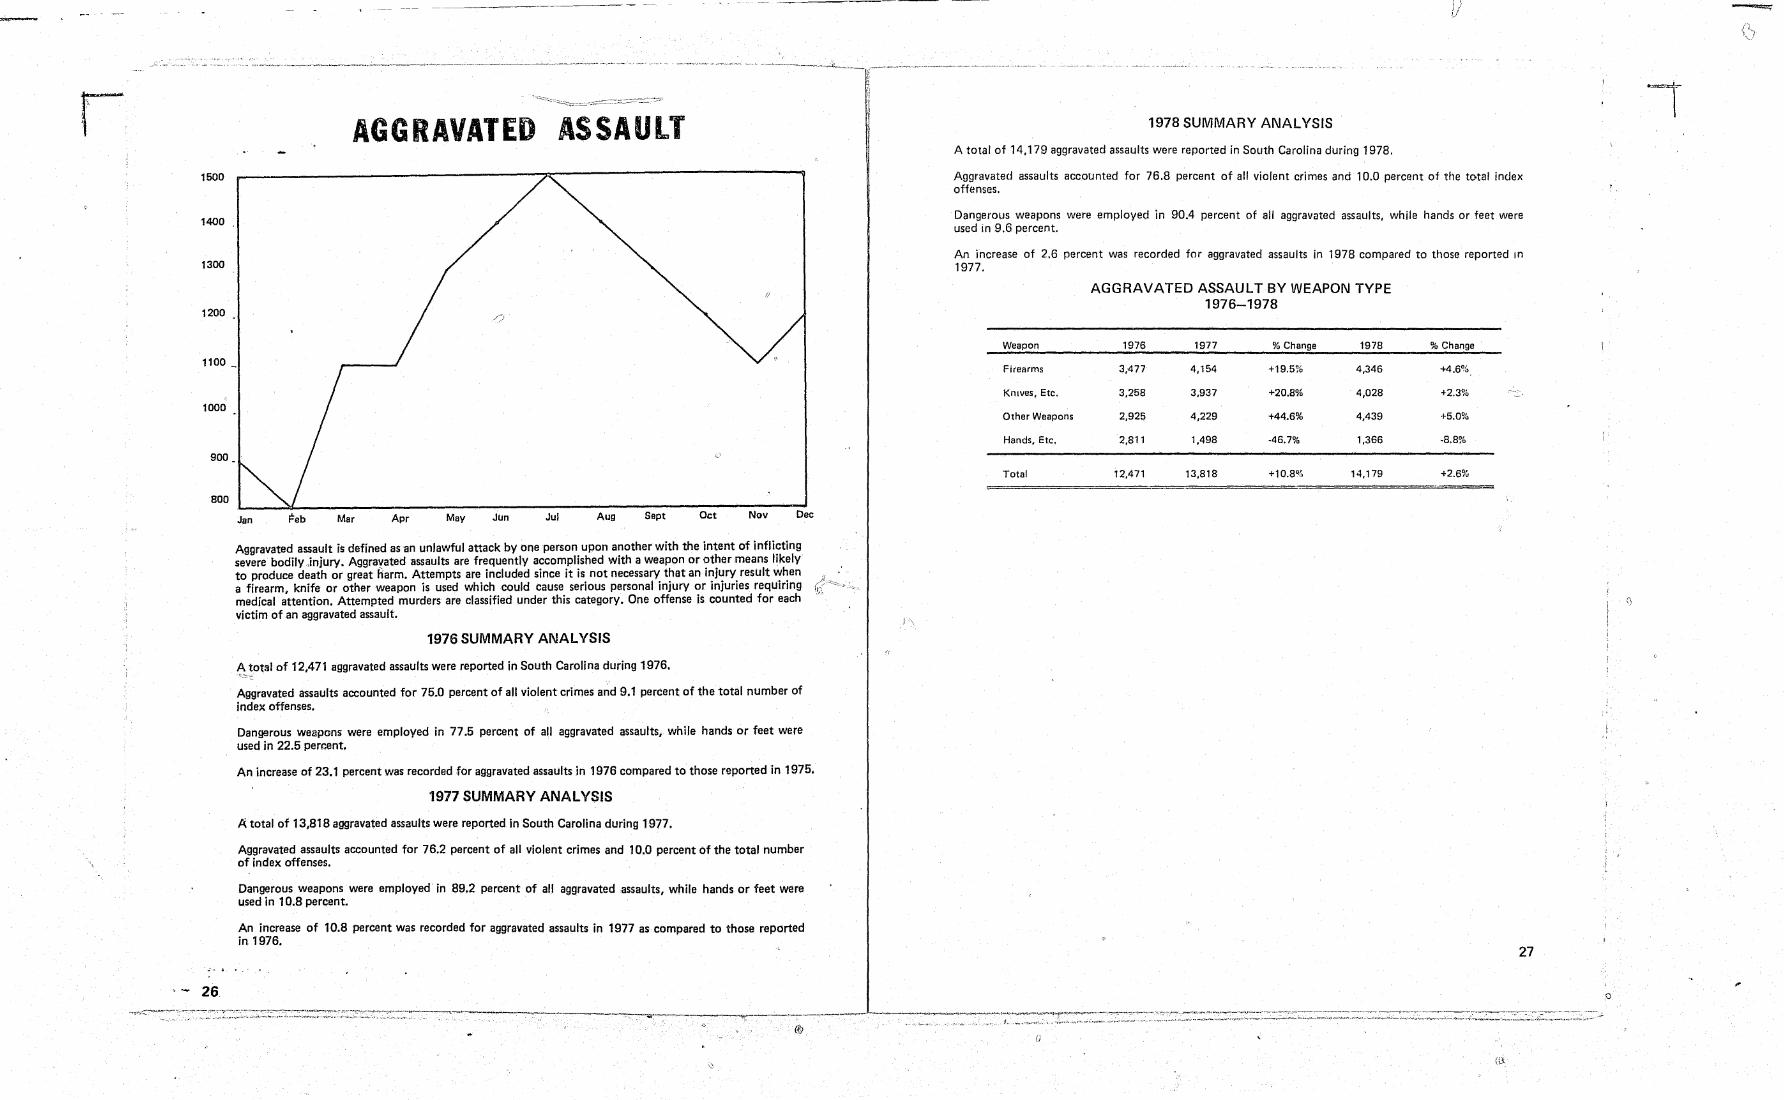
Aggravated assault is defined asan unlawful attack by one person upon another with the intent of inflicting severe bodily .injury. Aggravated assaults are frequently accomplished with a weapon or other means likely to produce death or great harm. Attempts are included since it is not necessary that an injury result when a firearm, knife or other weapon is used which could cause serious personal injury or injuries requiring medical attention. Attempted murders are classified under this category. One offense is counted for each victim of an aggravated assault.
1976 SUMMARY ANAL VSIS
A total of 12,471 aggravated assaults were reported in South Carolina during 1976. ~"':::::-::.
Aggravated assaults accounted for 75.0 percent of all violent crimes a~d 9.1 percent of the total number of index offenses.
Dangerous weapons were employed in 77.5 percent of all aggravated assaUlts, while hands or feet were used in 22.5 perr:ent.
An increase of 23.1 percent was recorded for aggravated assaults in 1976 compared to those r.eported in 1975.
1977 SUMMARY ANAL VSIS
Ii. total of 13,818 aggravated assaults were reported in South Carolina during 1977.
Aggravated assaults accounted for 76.2 percent of all violent crimes and 10.0 percent of the total number of index offenses.
Dangerous weapons were employed in 89,2 percent of all aggravated assaults, while hands or feet were used in 10.8 percent.
An increase of 10.8 percent was recorded for aggravated assaults in 1977 as compared to those reported in 1976.
J\
1978 SUMMARY ANALYSIS
A total of 14,179 aggravated assaults were reported in South Carolina during 1978.
Aggravated assaults accounted for 76.8 percent of all violent crimes and 10.0 percent of the total index offenses.
Dangerous weapons were employed in 9004 percent of all aggravated assaults, while hands or feet were used In 9.6 percent.
An increase of 2.6 percent was recorded for aggravated assaults in 1978 compared to those reported In
1977.
AGGRAVATED ASSAULT BY WEAPON TYPE 1976-1978
Weapon 1976 1977 % Change 1978 % Change
Firearms 3,477 4,154 +19.5% 4,346 +4.6%
Knives, Etc. 3,258 3,937 +20.8% 4,028 +2.3%
Other Weapons 2,925 4,229 +44.6% 4,439 +5.0%
Hands, Etc. 2,811 1,498 ·46.7% 1,366 -8.8%
Total 12,471 13,818 +10.8% 14,179 +2.6%
27
()
o

r · - -----~------ ---- . ---------------~- _. -'---'--'-
4400 r----------------------------------------------------------------,
4200. ;.
4000
3800
3600
3400
3200
3000
Mar Apr May Jun Jul Aug Sept Oct Nov Dec
The category of brllaking or entering/burglary includes any unlawful entry of a structure to commit a felon or theft. It is not necessary that force be used to gain entry in order for the offense to be classified as an unlawful entry. Neither is it necessary for a property loss to occur'in an unlawful entry or breakin for the event to be classified under this category. Attempts to commit the above offenses are counted. One offense is counted for each di$tinct operation of breaking or entering/burglary.
1976 SUMMARY ANALYSIS
There were 43,246 offenses of breaking or entering/burglary reported in 1976. .~
Breaking or entering/burglary accounted for 36.1 percent of nonviolent crimes and 31.7 percent of all index offenses.
Of the three categories of breaking or entering/burglaries, forcible entry accounted for 73.5 percent of the total offenses in this category while unlawful entry accounted for 18.4 percent and attempted forcible entry accounted for 8.1 percent.
Residences accounted for 63 percent of the targets in this category.
Night operations accounted for 45.4 percent of all breaking or enterings while 41.4 percent were committed during daylight hours and 13.2 percent were committed at undetermined times.
The month of October showed the largest number of reported offenses, accounting for 4,037 or 9.3 percent of the total.
1977 SUMMARY ANALYSIS
There were 45,941 offenses of breaking or entering/burglary reported in 1977.
Breaking or entering/burglary accounted for 38.5 percent of nonviolent crimes and 33.4 percent of all index offenses.
Of the three categories of breaking or entering/burglary, forcible entry accounte-d for 10.1 percent of the total offenses, unlawful entry accounted for 21.2 percent and attempted forcible entry accounted for 8.1 percent. -
In this category, reSidences accounted for 62.8 percent of the targets.
N~ght ope~ations ~ccounted for 40.2 percent of all breakings or enterings, while 42.1 percent were committed dunng dayltght hours and 17.6 percent were committed at undetermined times.
The month of July showed the largest number of reported offenses, accounting for 4,319 offenses or 9.4 percent of the total.
1978 SUMMARY ANALYSIS
There were 43,356 offenses of breaking or entering/burglary reported in 1978.
Breaking or entering/burglary accounted for 35.2 percent of nonviolent crimes and 30.1 percent of all" index offenses.
Of the three categories of breaking or entering/burglary, forcible entry accounted for 77.2 percent of the total offenses, unlawful entry accounted for 14.6 percent and attempted forcible entry accounted for 8.2 percent.
In this category, residences accounted for 60.9 percent of the targets.
Night operations accounted for.,34.4 percent of all breakings or entering, while 34.9 percent were committed during daylight hours and-3D.7 percent committed at undetermined times.
The month of August showed the largest number of reported offenses, accounting for 4,089 or 9.4 percent of the total.
29
.. a::u
-~----~------------------------,=-------.~.~~~~~.-.~-- ~-~~-~ """""
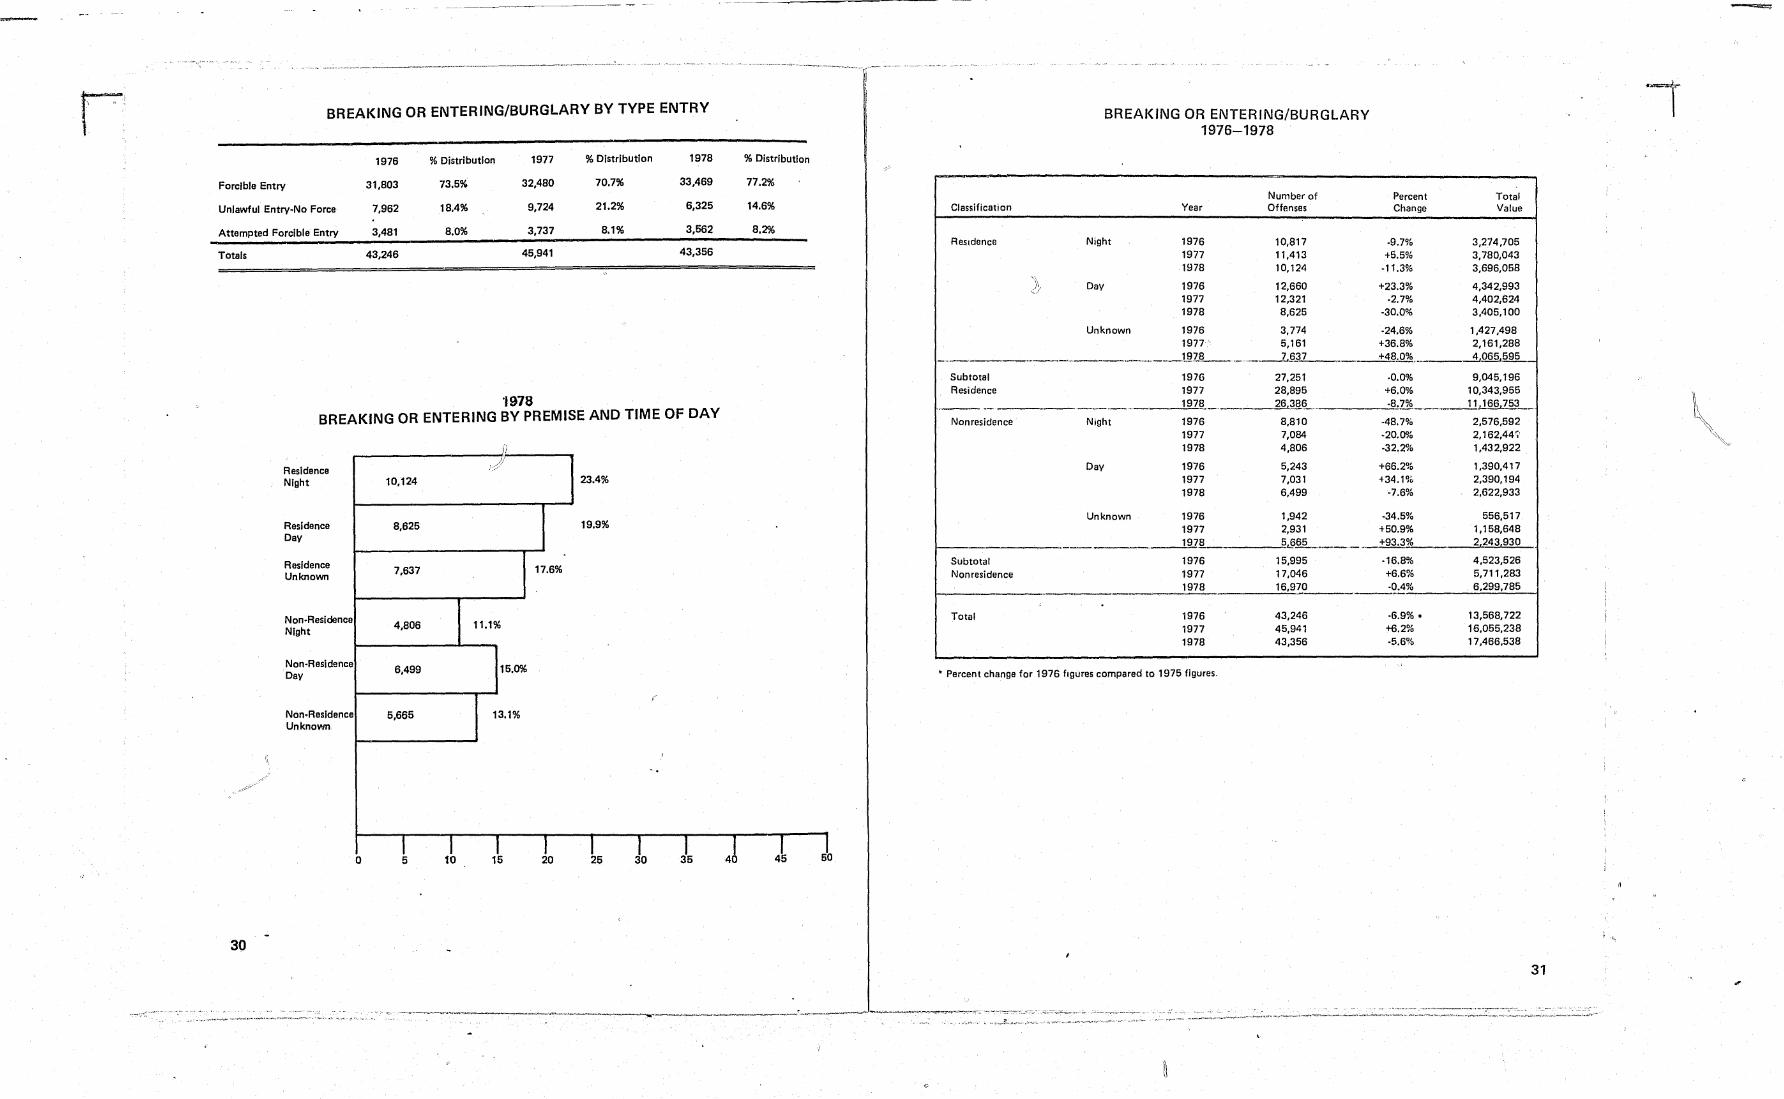
BREAKING OR ENTERING/BURGLARY BY TYPE ENTRY
1976 % Distribution 1977 % Distribution 1978
Forcible Entry 31,803 73.5% 32,480 70.7% 33A69
Unlawful Entry·No Force 7,962 18.4% 9,724 21.2% 6,325
Attempted Forcible Entry 3,481 8.0% 3,737 8.1% 3,562
Totals 43,246 45,941 43,356
'1978 BREAKING OR ENTERING BY PREMISE AND TIME OF DAY
30
Residence Night
Residence Dev
Residence Unknown
Non·Residence Night
Non·Residenc Dav
Non·Resldenc Unknown
e
e
10,124
8,625
7,637
4,806
6,499
5,665
r I o 5 10
i! .j/
23.4%
19.9%
17.6%
11.1%
15.0%
(f
13.1%
,
-.
I I I I J 35 15 30 20 25
% Distribution
77.2%
14.6%
8.2%
J I J 45 50 40
Classification
Residence
'~\ )' ,j
Subtotal Residence
--Nonresidence
Subtotal Nonresidence
Total
BREAKING OR ENTERING/BURGLARY 1976-1978
Number of Year Offenses
Night 1976 10/817 1977 11,413 1978 10/124
Day 1976 12,660 1977 12/321 1978 8/625
Unknown 1976 3.774 1977' 5,161
.. _ ... __ UE..8 ___ ~.,. 7/637
1976 27.251 1977 28,895
- 1978 26,386
Night 1976 8.810 1977 7,084 1978 4,806
Day 1976 5,243 1977 7,031 1978 6,499
Unknown 1976 1,942 1977 2/931 1978 5.§mL ____ ,.
1976 15,995 1977 17,046 1978 16.97_0
1976 43,246 1977 45,941 1978 43,356
• Percent change for 1976 figures compared to 1975 figures.
~"-_-...... ~.--........... , ....... ,.."..., .... _~, __ ..,--...... .. '""-'-'-,.. ............... _v ... _-:-._. _,---...-....y..,.,_~"'-"._ ..... _ .... ~ _____ ........ _w .... "; __ . ___ ...." ~......-.......... -.-........... ~..,'-~~.-~;:;"-~ -~~-.-~-;--.~:_':-_7'~~ . ....:~::;:""_=-.-___ ,~ -- ••. ~,-~_._.~_ ..... _
. , ~ <.,.<~t.,,~,,_".,q"'. ' "_", .. ~",,,,,,,,,,,,,."""""'~' ,,_'l-"'_
Percent Total Change Value
·9.7% 3/214,705 +5.5% 3/180/043
-11.3% 3,696,058
+23.3% 4,342/993 ·2.7% 4,402,624
-30.0% 3,405,100
-24.6% 1/427,498 +36.8% 2,161,288 +48.0% .. 4.065.595
·0.0% 9,045.196 +6.0% 10,343,955 -8.7% , ____ 11,166.753_
-48.7% 2/576,592 ·20.0% 2,162,44~
·32.2% 1,432,922
+66.2% 1,390,417 +34.1% 2,390/194
·7.6% 2,622,933
-34.5% 556,517 +50.9% 1/158,648 +93.3% 2,243,930
·16.8% 4,523,526 +6.6% 5,711,283 -0.4% 6.299,785
-6.9% • 13,568,722 +6.2% 16.055.238 -5.6% 17,466,538
; ':-'"
31

' ... ::;u
~----~~-~----------------~------~--~
7,000
4,500 ,)
LARCENY o
Jan !Teb Mar Apr May Jun Jul Aug Sept act Nov Dec
Larceny is defined as the unlawful taking or stealing of property without the use of force, violence or fraud. It includes offenses such as shoplifting, pocket-picking, purse-snatching, theft of items from vehicles or of vehicle parts and accessories, bicycle thefts# and the like. Thefts from tents, campers, houseboats and similar recreation vehicles are incillped undejthe category of larceny. For purposes of uniform crime reports, this category does not includ~ embe~ement, fraud, unlawful conversions, forgery, worthless checks, or similar offenses. Motor vehicls,togfis are not included under larceny; they fall into 'a separate index category. Attempts to commit larcenies are included. One offense of larceny is counted for each distinct operation.
1976 SUMMARY ANAL Y~IS
A total of 69,639 offenses of larceny were reported in 1976.
Larceny accounted for 58.1 percent of nonviolent crimes and 51.0 percent of all index offenses.
Individual offenses of larceny in which property stolen amounted to $200 or more accounted for 22.1 percent of this category, while offenses in which the value of property stolen was less than $50 accounted for 38.5 percent.
1977 SUMMARY ANALYSIS
A total of 66,572 o-ffenses IOf larceny were reported in 1977.
Larceny accounted for 55.7 percent of nonviolent crimes and 48.4 percent of all index offenses.
Individual offenses of larceny in which property stolen amounted to $200 or more accounted for 21.5 percent of this category, while offenses in which the value of property stolen was less than $50 accounted for 45.1 percent..
32
1978 SUMMARY ANALYSIS '. '
A total of 71,829 offenses of larceny were reported in 1978.
Larceny accounted for 58.3 percent of nonviolent crimes and 51.0 percent of all index offenses.
33
,\
h
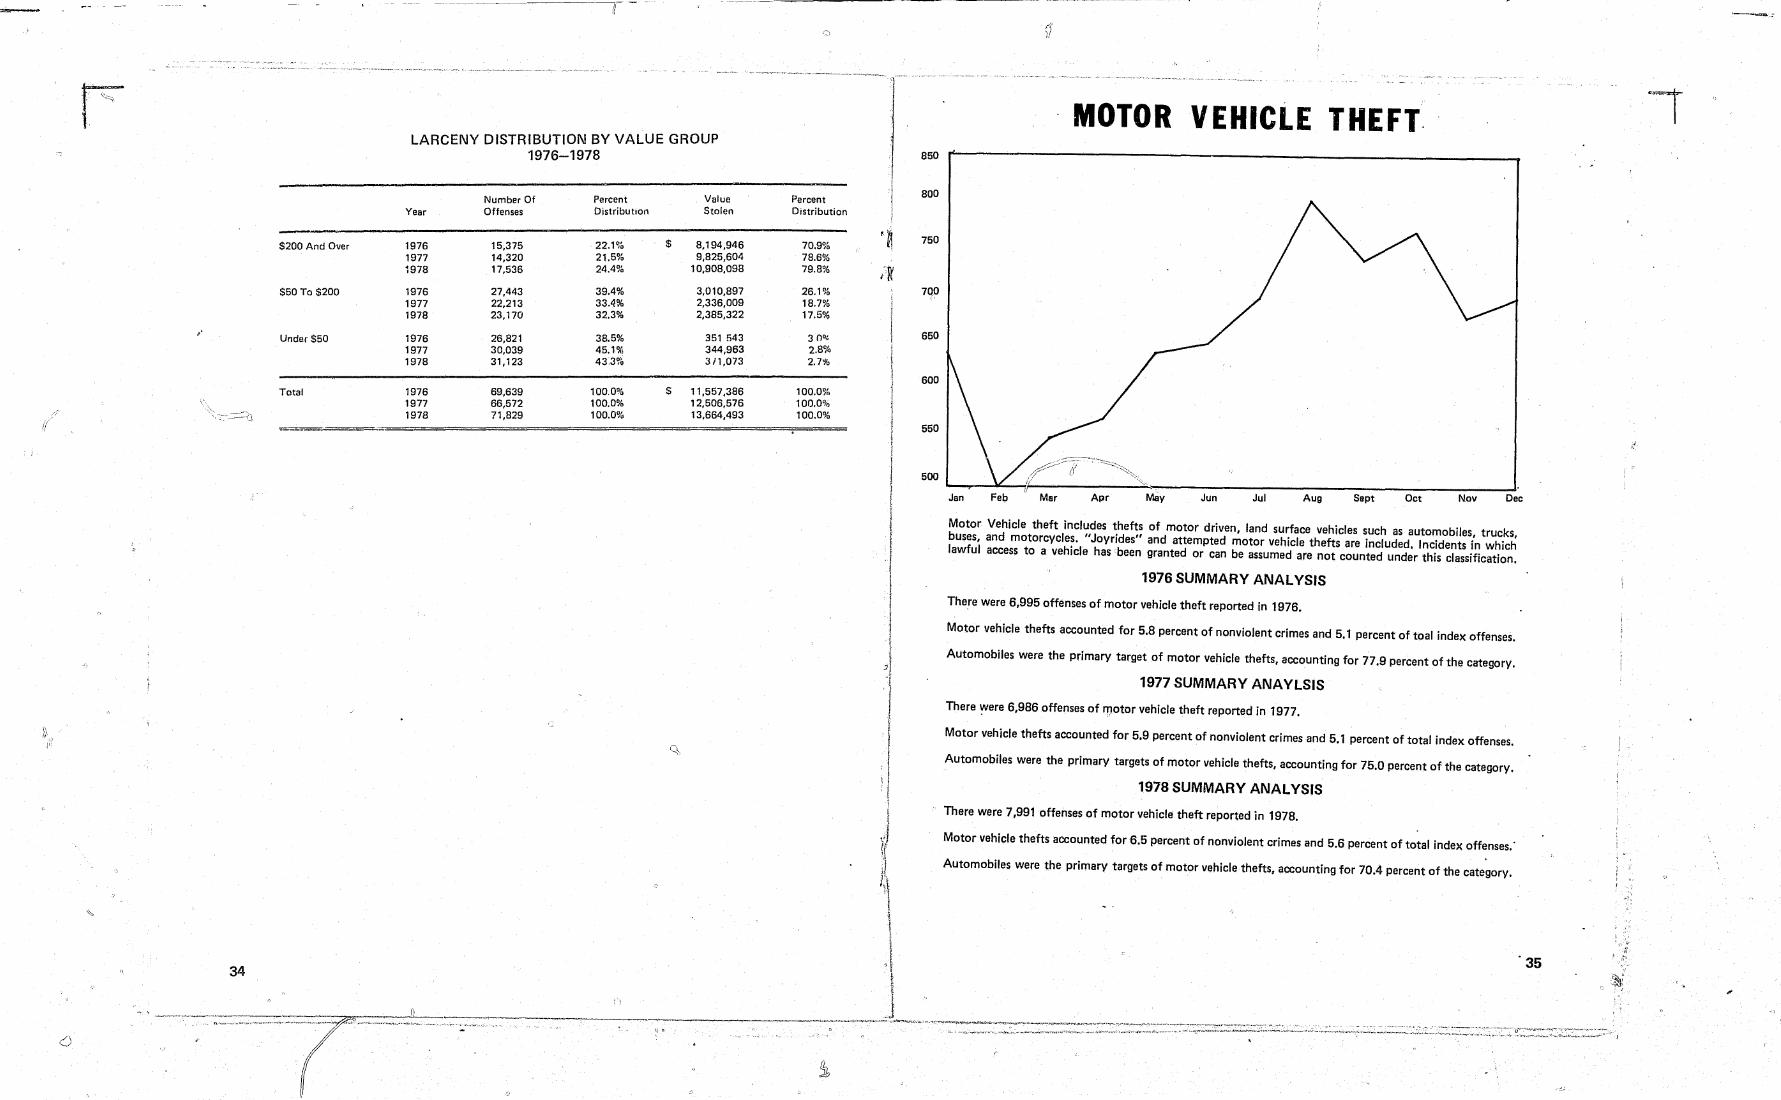
LARCENY DISTRIBUTION BY VALUE GROUP 1976-1978
Number Of Percent Value Year Offenses Distribution Stolen
$200 And Over 1976 15,375 22.1% $ 8,194,946 1977 14,320 21.5% 9,825,604 ~978 17,536 24.4% 10,908,098
$50 To $200 1976 27,443 39.4% 3,010,897 1977 22,213 33.4% 2,336,009 1978 23,170 32.3% 2,385,322
Under $50 1976 26,821 38.5% 351 543 1977 30,039 45.1% 344,963 1978 31,123 43,3% 3/1,073
Total 1976 69,639 100.0% S 11,557,386 1977 66,572 100.0% 12,506,576 1978 71,829 100.0% 13,664,493
Q.
34
: ';
lj ,.
Percent Distribution
70.9% 78.6% 79.8%
26.1% 18.7% 17.5%
3 o~ 2.8% 2.7%
100.0% 100.0% 100.0%
t~
I~R
\
I I
I I
! I
MOTOR VEHICLE THEFT. 850
800
750
790
650
600
550
~~:-~-.~ (:r:::- i( ~~~, 500 L-__ --~~~Iti--------------~~~'~------------____________ ~~----~~----~~--~
Ii Mar Apr May Jun Jul Aug Sept Oct N.ov Dec Jan Feb
Motor Vehicle theft includes thefts of motor driven, land surface vehicles such as automobiles, trucks, buses, and motorcycles. "Joyrides" and attempted motor vehicle thefts are included. Incidents in which lawful access to a vehicle has been granted or can be assumed are not counted under this classification.
1976 SUMMARY ANALYSIS
There were 6,995 offenses of motor vehicle theft reported in 1976.
Motor vehicle thefts accounted for 5.8 percent of nonviolent crimes and 5.1 percent of toal index offenses.
Automobiles were the primary target of motor vehicle thefts, accounting for 77.9 percent ofthe category.
1977 SUMMARY ANAYLSIS
There ~ere 6,986 offenses of llJotor vehicle theft reported in 1977.
Motor vehicle thefts accounted for 5.9 percent of nonviolent crimes and 5.1 percent of total index offenses.
Automobiles were the primary targets of motor vehicle thefts, accounting for 75.0 percent of the category.
1978 SUMMARY ANALYSIS
There were 7,991 offenses of motor vehicle theft reported in 1978.
Motor vehicle thefts accounted for 6.5 percent of nonviolent crimes and 5.6 percent of total index offenses.'
Automobiles were the primary targets of motor vehicle thefts, accounting for 70.4 percent of the category. I f
u"'·'·--Ir"'- "~,,,._ 'I. ~"-'---"--' -'::." ., "'"',,,.-.• ....,. .. <-~,;:...~."" ... "-,,..--.... - 1
J I.

r
---- -~-----
MOTOR VEHICLE THEFT TREND
1976 1977 % Change 1978 % Change
Total Motor Vehicle Thefts: 6,995 6,986 -0.1% 7,991 +14.4%
Automobiles: 5,451 5,238 -3.9% 5,622 +7.3% I"")
Trucks And Buses: 669 793 +18.5% 1,015 +28.0%
Other Vehicles : 875 955 +9.1% 1,354 +41.8%
Values: $ 14,217,795 $ 15,854,662 + 11.5% $ 20.230,080 +27.6%
Out of 7,991 motor vehicles stolen in South Carolina during 1978, there were 4,668 motor vehicles recovered, accounting for 58.4 percent of the total stolen.
36
---- - ----- --------~--~~--
ASSAULTS ON LAW ENFORCEMENT OFFICERS
The assault of a law enforcement officer is an increasingly serious problem faced by those who have chosen careers in law enforcement. Such acts directly affect the functioning of proparlaw enforcement operations· and reduce the ability of law enforcement agencies to combat crime and maintain law and order. Lawenforcement administrators as well as the public at large will continue to view this problem with concern.
1976 SUMMARY ANALYSIS
In 1976, the South Carolina Uniform Crime Report showed 680 law enforcement officers assaulted with 135 or 19.9 percent sustaining some degree of personal injury.
Data available on police assaults indicate that in 1976 officers responding to disturbance calls accounted for 38.8 percent of all police assaults. The most prevalent weapons used were the subject's hands, fists, and feet, which accounted for 74.3 percent of all weapons used.
1977 SUMMARY ANALYSIS
In 1977, the South Carolina Uniform Crime Report showed 763 law enforcement officers assaulted with 103 or 13.5 percent sustaining some degree of personal injury.
Data available on police assaults indicate that in 1977, officers responding to disturbance calls accounted for 39.7 percent of all police assaults. The most prevalent weapons used were the subject's hands, fists, and feet, which accounted for 73.7 percent of all weapons used.
1978 SUMMARY ANALYSIS
In 1978, the South Carolina Uniform Crime Report showed 963 law enforcement officers assaulted with 160 or 16.6 percent sUstaining some degree of personal injury.
Data available on police assaults indicate that in 1978 officers responding to disturbance calls accounted for 32.7 percent of all police assaults. The most prevalent weapons used were the subject's hands, fists, and feet, which accounted for 74.7 percent of all weapons used.
---,.------
37
r
,--- -~-----~' ---- ,------
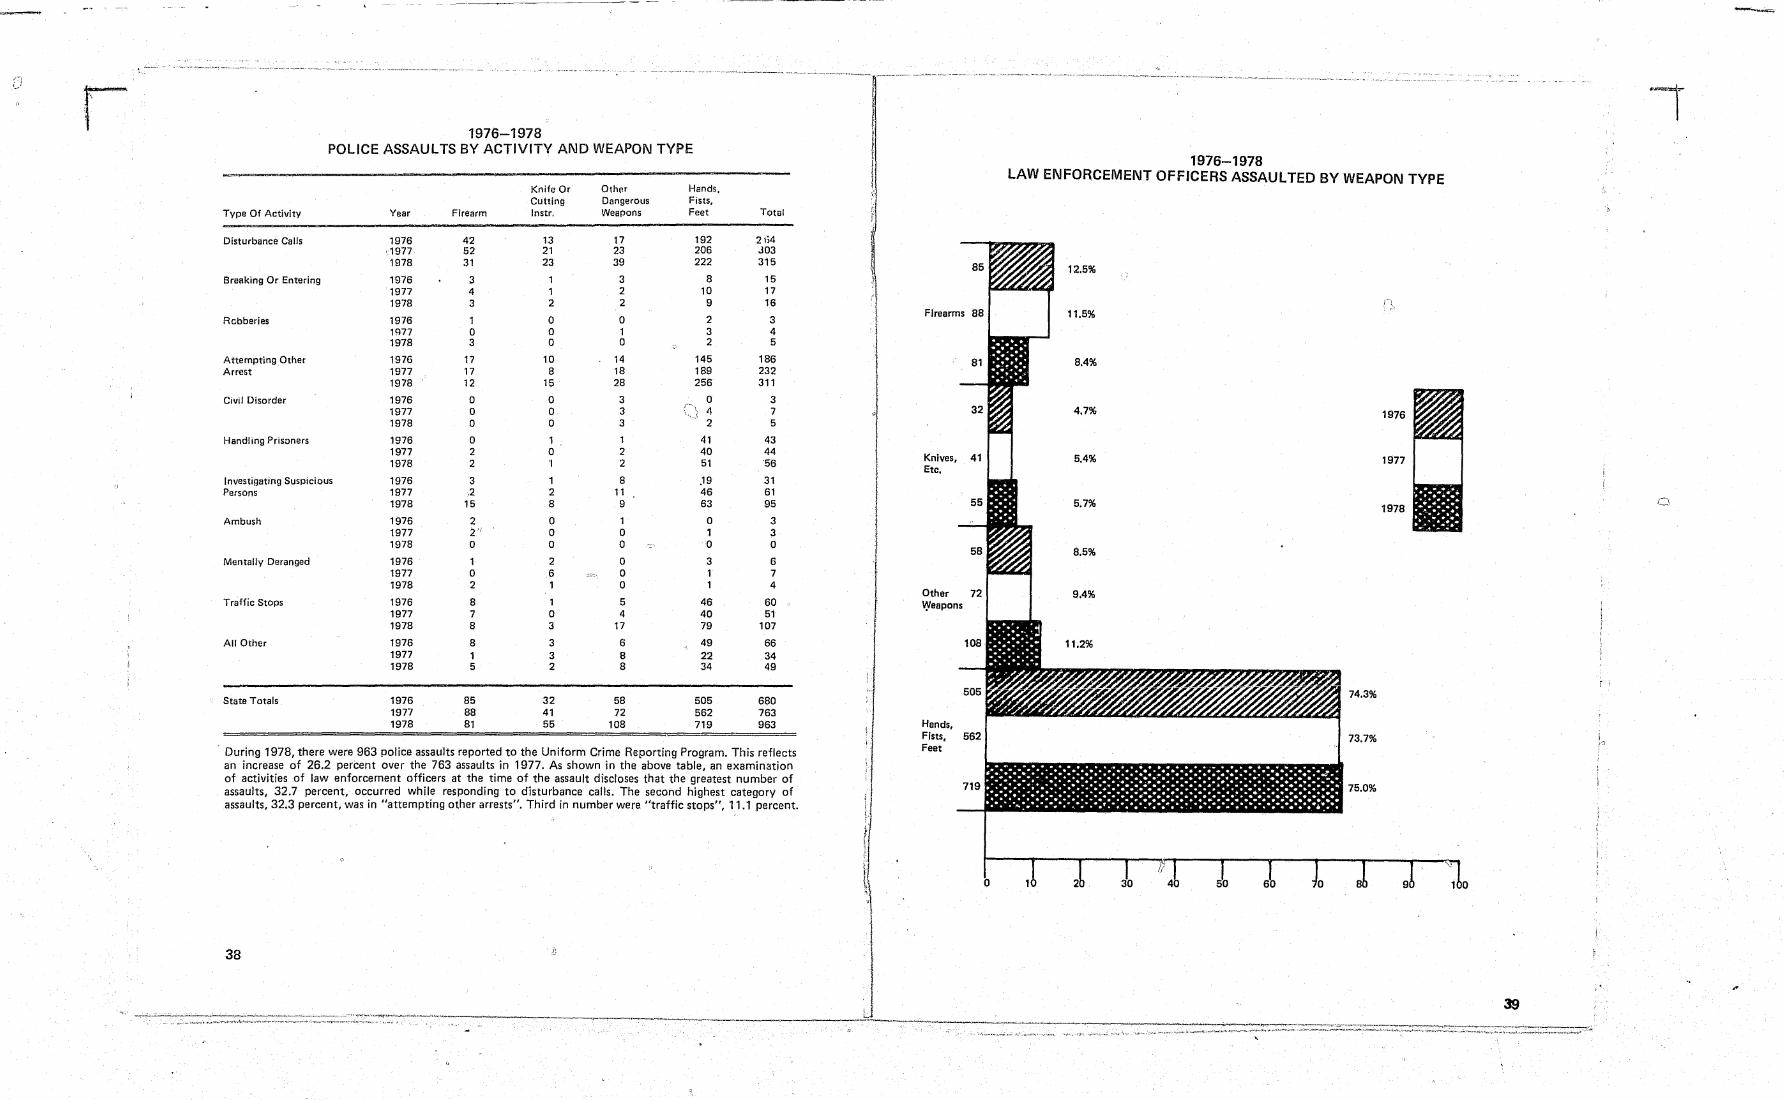
1976-1978 POLICE ASSAULTS BY ACTIVITY AND WEAPON TYPE
Knife Or Othp.r Hands, Cutting Dangerolls Fists,
Type Of Activity Year Firearm Instr, WeaPons Feet Total
--===-----------------------------------------------------------Disturbance Calls
Breaking Or Entering
Rcbberies
Attempting Other Arrest
Civil Disorder
Handling Prisoners
Investigating Suspicious Persons
Ambush
Mentally Deranged
Traffic Stops
All Other
State Totals
1976 ·,1977 1978
1976 1977 1978
1976 1977 1978
1976 1977 1978
1976 1977 1978
1976 1977 1978
1976 1977 1978
1976 1977 1978
1976 1977 1978
1976 1977 1978
1976 1977 1978
1976 1977 1978
42 13 52 21 31 23
3 1 4 1 3 2
1 0 0 0 3 0
17 10 17 8 12 15
0 0 0 0 0 0
0 1 2 0 2 'I
3 1 .2 2
15 8
2 0 :2 // 0 0 0
1 2 0 6 2 1
8 1 7 0 8 3
8 3 1 3 5 2
85 32 88 41 81 55
17 192 264 23 206 303 39 222 315
3 8 15 2 10 17 2 9 16
0 2 3 1 3 4 0 2 5
14 145 186 18 189 232 28 256 311
3 0 3 3 4 7 3 2 5
1 41 43 2 40 44 2 51 '56
8 .19 31 11 46 61 9 63 95
1 0 3 0 1 3 0 0 0
0 3 6 0 1 7 0 1 4
5 46 60 4 40 51
17 79 107
6 49 66 8 22 34 8 34 49
58 505 680 72 562 763
108 719 963
. During 1978, there were 963 police assaults reported to the Uniform Crime Reporting Program. This reflects an increase of 26.2 percent over the 763 assaults in 1977. As shown in the above table, an examination of activities of law enforcement officers at the time of the assault discloses that the greatest number of assaults, 32.7 percent, occurred while responding to disturbance calls. The second highest category of assaults, 32.3 percent, was in "attempting other arrests". Third in number were "traffic stops", 11.1 percent.
38
,~
-., .. ~ - .. -~--..,-~--------' '-~"---~ --~-~-~"--'-.- -"-~ -"--.. ~-- ... ,-.. -----.-~, - ~~- .. -~~ .... ~-,~ .-.~. ~-,. .. ~-+.-- -_.-." .. -
1976-1978 LAW ENFORCEMENT OFFICERS ASSAULTED BY WEAPON TYPE
Knives, Etc •
Other ~eapons
Hands, Fists, 562 Feet
12.5%
11.5%
8.4%
4.7%
5.4%
5.7%
8.5%
9.4%
11.2%
74.3%
73.7%
_':71:9JIIIIIIIIIIIIIIIIIIIIII175.0%
1976
1977
1978
f -
I !O
r::::
( \ TYPE OF ASSIGNMENT
During 1978, 48.5 percent of all assaults on officers occurred while the officer was assigned to a one man vehicle, while 33.4 percent of the assaults occurred vvhile officers were assigned to two man vehicles.
Type Of Assi!lnment 1976 Offenses % Dist. 1977 Offenses "" Dist. 1978 Offenses % Dist.
Two Man Vehicle 280 41.2 295 38.7 322
On(! Man Vehicle Alone 205 30.1 217 28.4 300
Assisted 105 15.4 127 16.6 167
Special Assignment Alone 6 0.9 0 0.0
Assisted 13 1.9 0 0.0 2
Other Alone 27 4.0 14 1.8 21
Assisted 44 6.5 110 14.4 150
INJURIES TO LAW ENFORCEMENT OFFICERS
In 1978, assaults on law enforcement officers resulted in injuries to 16.6 percent of the victims.
Injuries
No Injuries
1976 Offenses
135
'545
% Dist.
19.9
80.1
1977 Offenm
103
660
TIME OF ASSAULT
% Dist.
13.5
86.5
1978 Offenses
160
803
33.4
31.2
17.3
0.1
.2
2.2
15.6
% Dist.
16.6
83.4
More than one·half of the assaults on officers occurred during the hours from 4 P.M. to 12 midnight. The period with greatest incidence was from 10 P.M. to 12 A.M. Sixteen percent of all the assaults occurred during this two hour period.
I I t
I
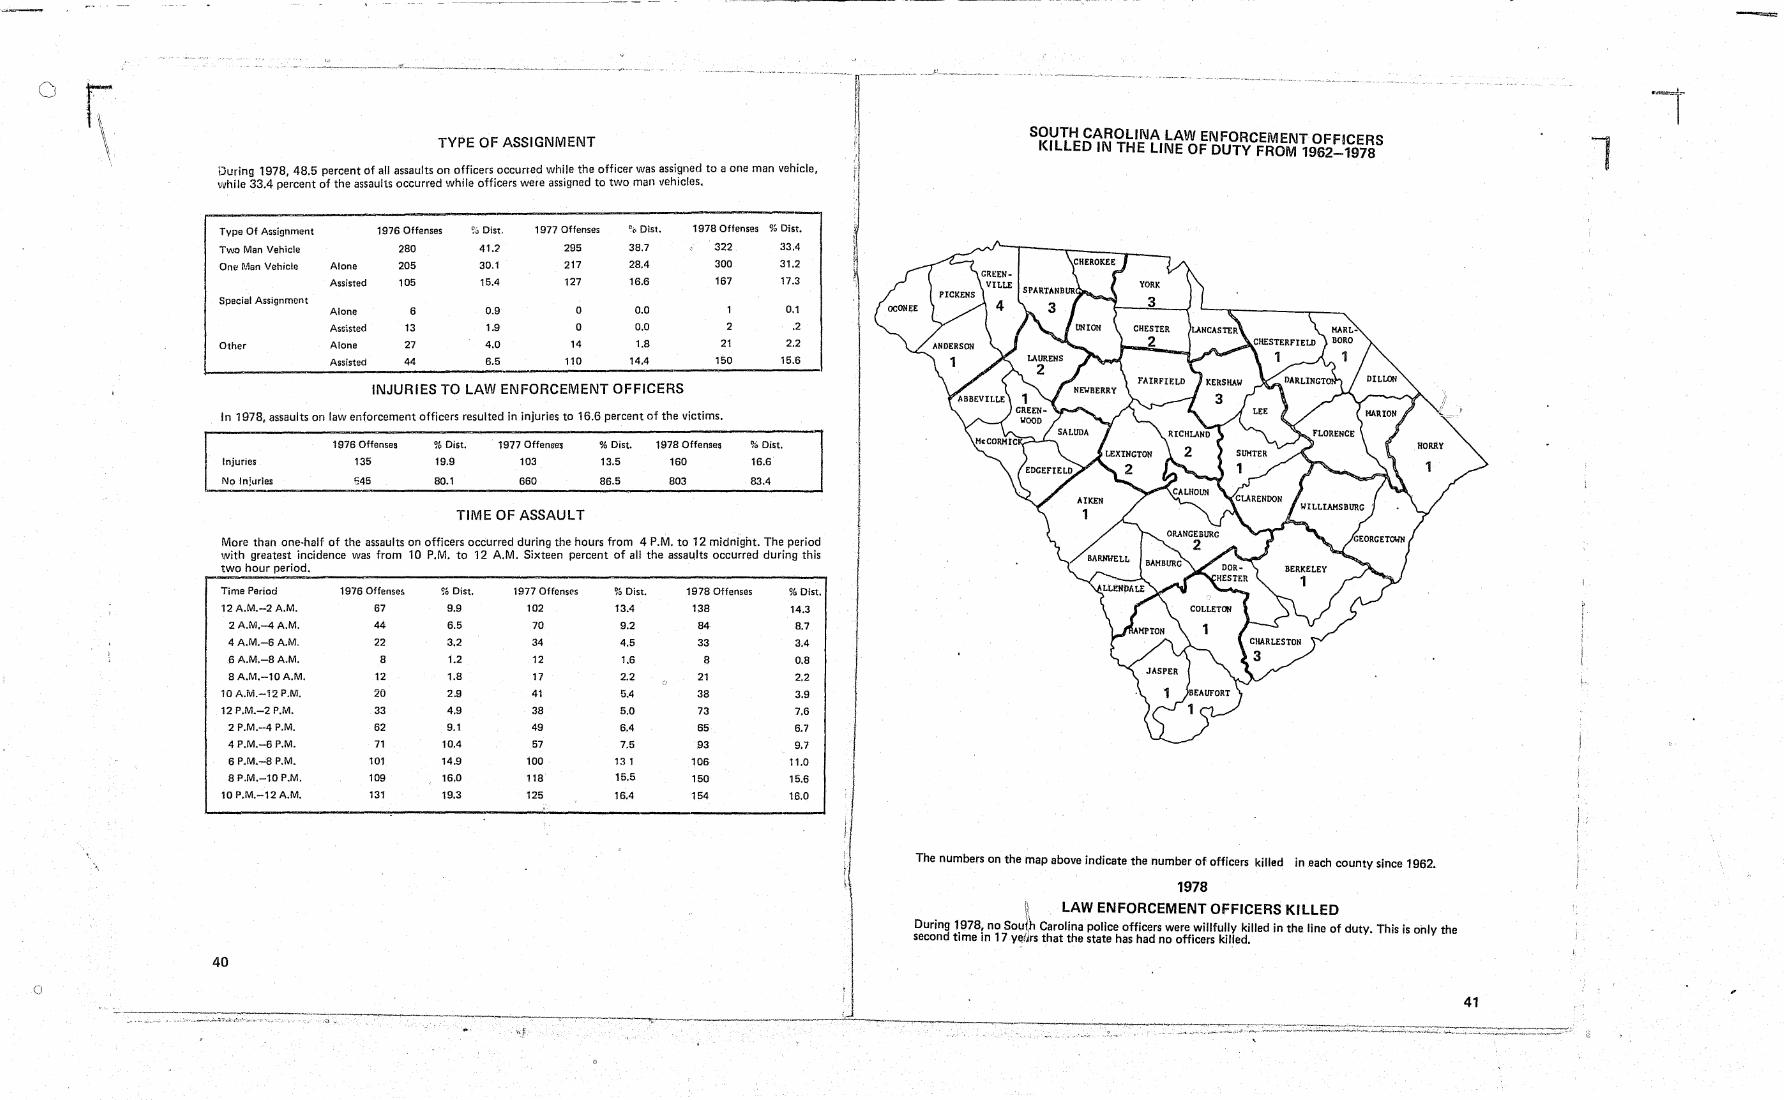
SOUTH CAROLINA LAW ENFORCEMENT OFFICERS KILLED IN THE LINE OF DUTY FROM 1962-1978
The numbers on the map above indicate the number of officers killed in each county since 1962.
1978
\\ LAW ENFORCEMENT OFFICERS KILLED DUring 1.978! no SOlll~ Carolina police officers were willfully killed in the line of duty. This is only the second time In 17 yefJrs that the state has had no officers killed.
1
41
8
7
6
5
4
3
2
o
-~--------- ~ ~ .- ~---~ ~-------.---
------~~-- - -- --"~-- -~-~--~-.------ ----- --.-
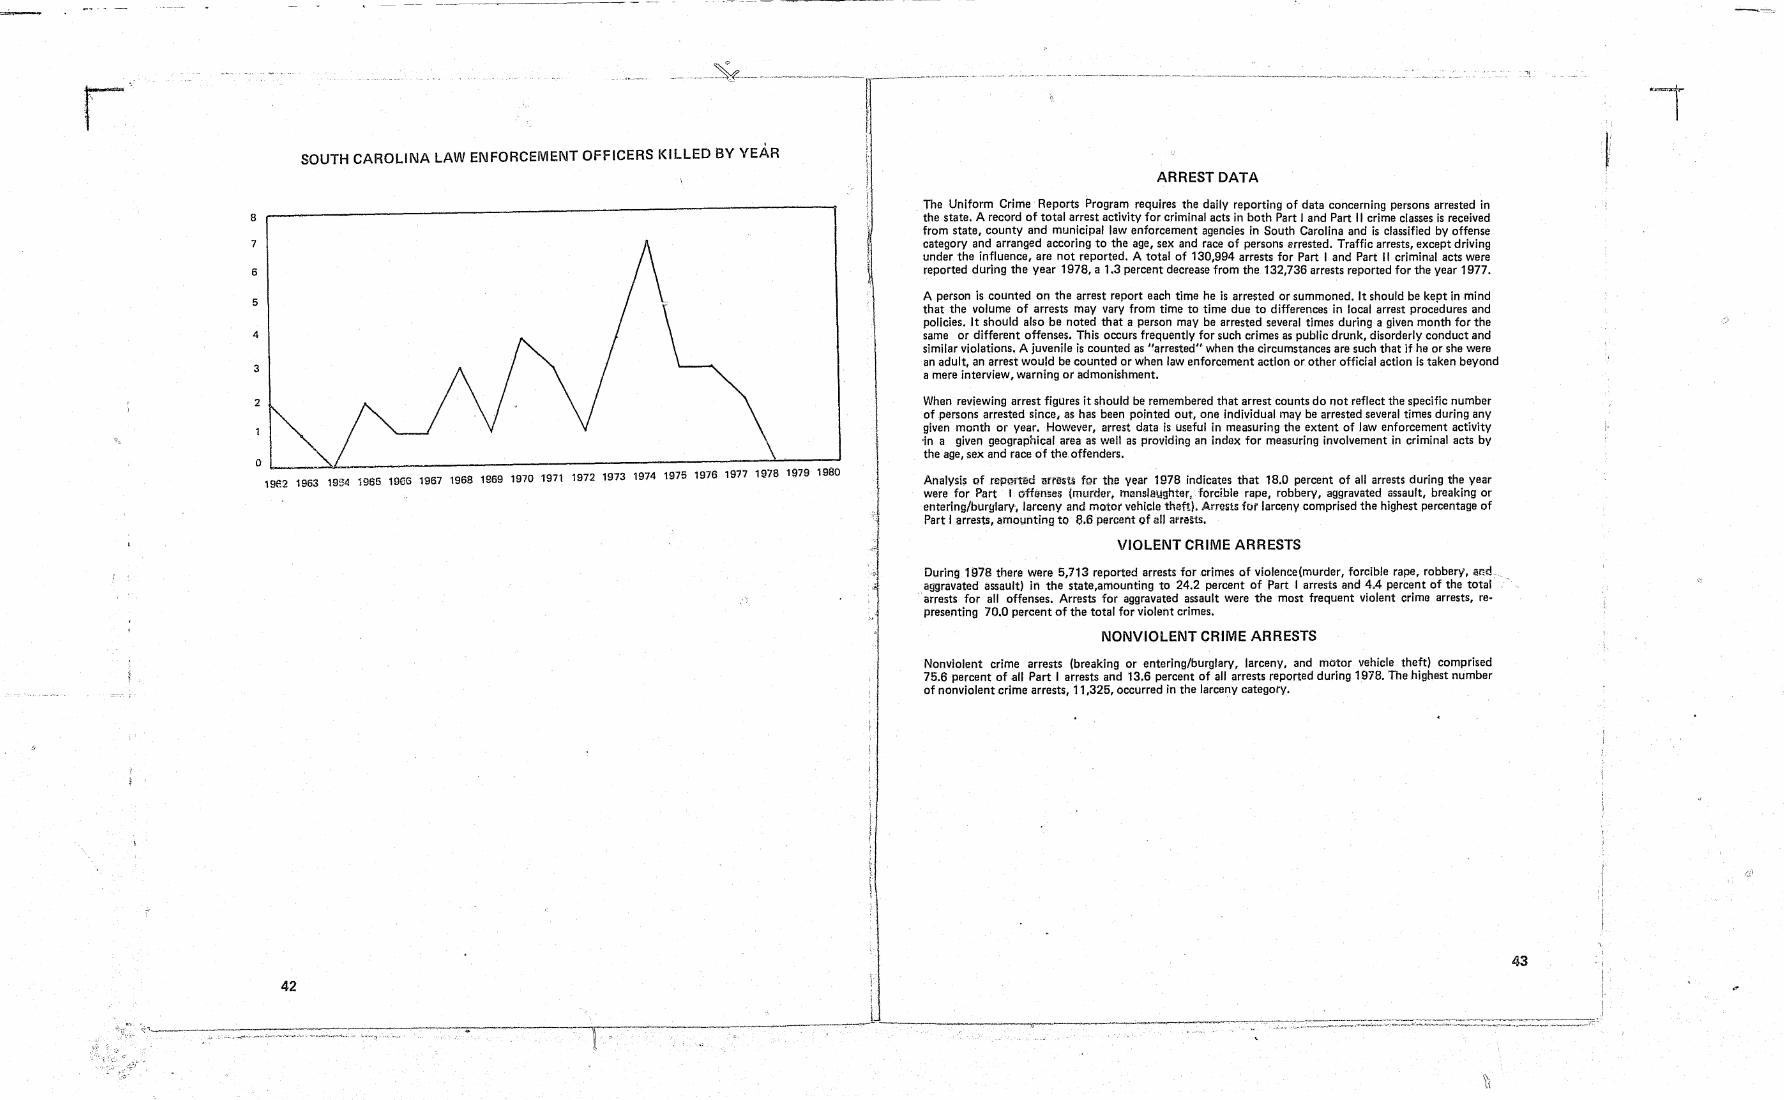
, SOUTH CAROLINA LAW ENFORCEMENT OFFICERS KILLED BY YEAR
19E:2 1963 1954 1965 19GG 1967 1968 1969 19701971 1972 1973 1974 1975 1976 1977 1978 1979 1980
42
ARREST DATA
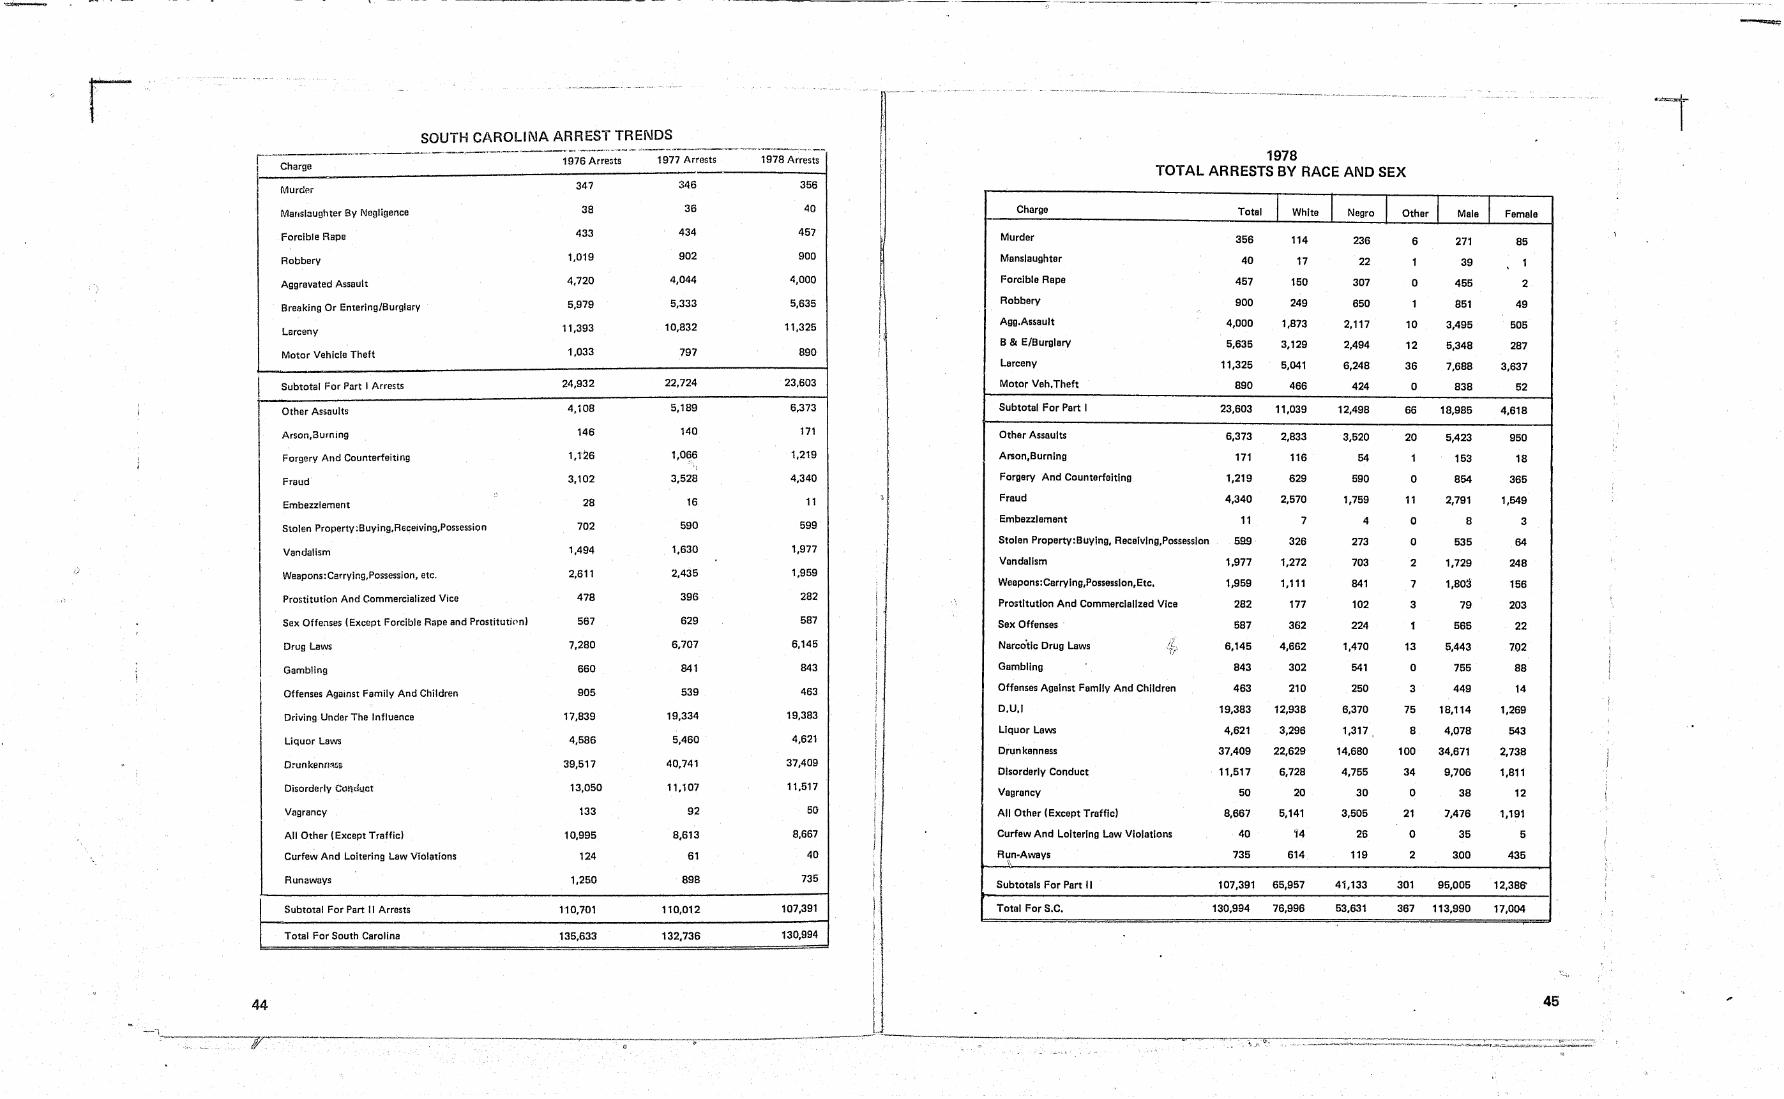
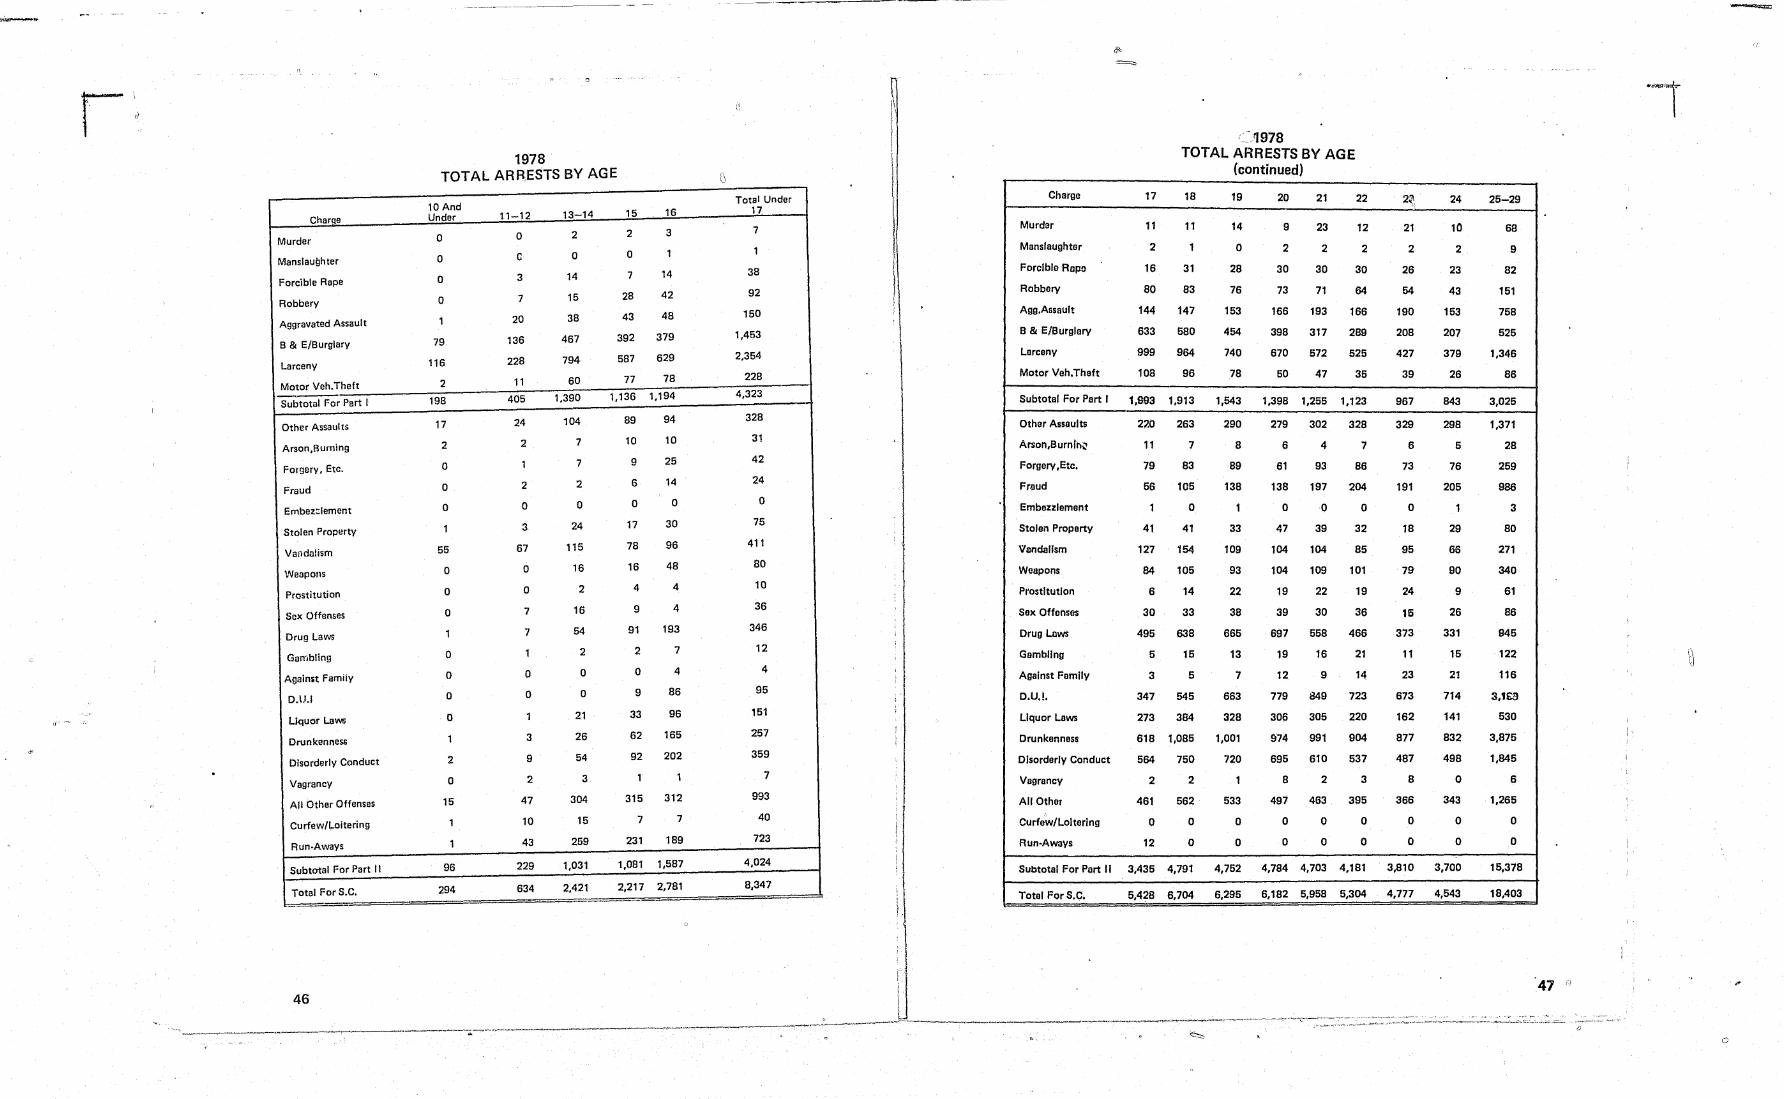
_ The Uniform Crime Reports Program requires the daily reporting of data concerning persons arrested in the state. A record of total arrest activity for criminal acts in both Part I and Part II crime classes is received from state, county and municipal law enforcement agencies in South Carolina and is classified by offense category and arranged accoring to the age, sex and race of persons arrested. Traffic arrests, except driving under the influence, are not reported. A total of 130,994 arrests for Part I and Part II criminal acts were reported during the year 1978, a 1.3 percent decrease from the 132,736 arrests reported for the year 1977.
A person is counted on the arrest report each time he is arrested or summoned. It should be kept in mind that the volume of arrests may vary from time to time due to differences in local arrest procedures and policies. It should also be noted that a person may be arrested several times during a given month for the same or different offenses. This occurs frequently for such crimes as public drunk, disorderly conduct and similar violations. A juvenile is counted as "arrested" when the circumstances are such that if he or she were an adult, an arrest would be counted or when law enforcement action or other official action is taken beyond a mere interview, warning or admonishment.
When reviewing arrest figures it should be remembered that arrest counts do not reflect the specific number of persons arrested since, as has been pointed out, one individual may be arrested several times during any given month or year. However, arrest data is useful in measuring the extent of law enforcement activity -in a given geographical area as well as providing an index for measuring involvement in criminal acts by the age, sex and race of the offenders.
Analysi~ of repmtecl arrests fQr the year 1978 indicates that 18.0 percent of all arrests during the year were for Part i offenses (murder. manslayghter,fQrcible rape, robbery, aggravated assault, breaking or entering/burglary, larceny and motor vehicle theft). Arrests for larceny comprised the highest percentage of Part I arrests, amounting to a.6 percent 9f all arrests.
VIOLENT CRIME ARRESTS
During 1978 there w~re 5,713 reported arrests for crimes of violence(murder, forcible rape, robbery, and_ aggravated assault) in the state,amounting to 24.2 percent of Part I arrests and 4.4 percent of the total arrests for all offenses. Arrests for aggravated assault were the most frequent violent crime arrests, representing 70.0 percent of the total for violent crimes.
NONVIOLENT CRIME ARRESTS
Nonviolent crime arrests (breaking or entering/burglary, larceny, and motor vehicle theft) comprised 75.6 percent of all Part I arrests and 13.6 percent of all arrests reported during 1978. The highest number of nonviolent crime arrests, 11,325, occurred in the larceny category.
43
---------------- - -
r SOUTH CAROLINA ARREST TRENDS
--. >-------------------_ .... -....... - ~....-~ r-- Charge 1976 Arre~ts 1977 Arrests
Murder 347 a46
Manslaughter By Negligence 38 36
forcible Rape 433 434
Robbery 1,019 902
Aggravated Assault 4,720 4,044
Breaking Or Entering/Burglary 5,979 5,333
Larceny 11,393 10,832
Motor Vehicle Theft 1,033 797
I Subtotal For Part I Arrests 24,932 22,724
Other Assaults 4,108 5,189
Arson,Burning 146 140
Forgery And Counterfeiting 1,126 1,0~6 ",
Fraud 3,102 3,528
Embezzlement 28 16
Stolen Property:8uying,Receiving,Possession 702 590
Vandalism 1,494 1,630
I) Weapons: Carrying,Possession, etc. 2,611 2,435
Prostitution And Commercialized Vice 478 396
Sex Offenses (Except Forcible Rape and Prostitution) 567 629
Drug Laws 7,280 6,707
Gambling 660 841
I Offenses Against Family And Children 905 539
I Driving Under The Influence 17,839 19,334
Liquor Laws 4,586 5,460
Drunkennf!G$ 39,517 40,741
Disorderly conduct 13,050 11.107
Vagrancy 133 92
All Other (Except Trafficl 10,995 8,613
Curfew And Loitering Law Violations 124 61
Runaways 1,250 898
Subtotal For Part II Arrests 110,7D1 110,012
Total For South Carolina 135,633 132.736
44
------------------------- -----------~
1978 Arrests
I I
-~~------------ ._- '-- -~--~-------
1978 I TOTAL ARRESTS BY RACE AND SEX
356
40 Charge Total I White I Negro I Other I Mele I Female
457 Murder 356 114 236 6 271 85 900 Manslaughter 40 17 22 1 39 . 1
4,000 Forcible Rape 457 150 307 0 455 2
5,635 Robbery 900 249 650 1 851 49
11,325 Agg.As$ault 4,000 1,873 2,117 10 3,495 505
890 B & E/Burglary 5,635 3,129 2,494 12 5,348 287
Larceny 11,325 5,041 6,248 36 7,688 3,637
23,603 Motor Vah.Theft 890 466 424 0 838 52
6,373 Subtotal For Part I 23,603 11,039 12,498 66 18,985 4,618
171 Other Assaults 6,373 2,833 3,520 20 5,423 950
1,219 Arson,Burnlng 171 116 54 1 153 18
4,340 Forgery And Counterfeiting 1,219 629 590 0 854 365
11 Fraud 4,340 2,570 1,759 11 2,791 1,549
599 Embezzlement 11 7 4 0 8 3
1,977 Stolen Property:Buylng, Recelvlng,Possession 59.9 326 273 0 535 64
Vandalism 1,977 1,272 703 2 1,729 248 1,959
Weapons:Carrylng,Possasslon,Etc, 1,959 1,111 841 7 1,80:3 156 282
Prostitution And Commarclallzed Vice 282 177 102 3 79 203 587 Sax Offenses 587 362 224 1 565 22
6,145 Narco'tlc Drug Laws 6,145 4,662 1,470 13 5,443 702
843 Gambling 843 302 541 0 755 88
463 Offenses Against Family And Children 463 210 250 3 449 14
19,383 D.U.I 19,383 12,938 6,370 75 18,114 1,269
4,621 Liquor Laws 4,621 3,296 1,317 8 4,078 543
Drun kenness 37,409 22,629 14,680 100 34,671 2,738 37,409
Disorderly Conduct 11,517 6,728 4,755 34 9,706 1,811 11,517 Vagrency 50 20 30 0 38 12
50 All Other (Except Traffic) 8,667 5,141 3,505 21 7,476 1,191
8,667 CUrfew And Loitering Law Violations 40 i4 26 0 35 5
40 R~\n-Aways 735 614 119 2 3.00 435
735 Subtotals For Part II 107,391 65,957 41,133 301 95,005 12,38B'
107,391 Total For S.C. 130,994 76,996 53,631 367 113,990 17,004
130,994
45
1978 TOTAL ARHESTS BY AGE
10 And 15 16 Charge Under 11-12 13 14
Murder 0 0 2 2 3
Manslaughter 0 G 0 0 1
Forcible Rape 0 3 14 7 14
0 7 15 28 42 Robbery
Aggravated Assault 1 20 38 43 48
B & E/Burglary 79 136 467 392 379
Larceny 116 228 794 587 629
Motor Veh.Theft 2 11 60 77 78
Subtotal For Part I 198 405 1.390 1,136 1.194
Other Assaults 17 24 104 89 94
Arson,Burning 2 2 7 10 10
Forgery, Etc. 0 1 7 9 25
Fraud 0 2 2 6 14
0 0 0 0 0 Ernbez::lement
Stolen Property 1 3 24 17 30
Vandalism 55 67 115 78 96
0 0 16 16 48 Weapons
Prostitution 0 0 2 4 4
Sex Offenses 0 7 16 9 4
Drug Laws 1 7 54 91 193
Gambling 0 1 2 2 7
Auain5t Family 0 0 0 0 4
D.U.I 0 0 0 9 86
Liquor Laws 0 1 21 33 96
Drunkenness 1 3 26 62 165
Disorderly Conduct 2 9 54 92 202
Vagrancy 0 2 3 1 1
All Other Offenses 15 47 304 315 312
Curfew/Loitering 1 10 15 7 7
Run·AwaYs 1 43 259 231 189
Subtotal For Part II 96 229 1,031 1,081 ',587
Total For S.C. 294 634 2,421 2,217 2,781 ---
46
· - -_._------
Total Under 17
7
1
38
92
150
1,453
2,354
228
4,323
328
31
42
24
0
75
411
80
10
36
346
12
4
95
151
257
359
7
993
40
723
4,024
8,347
~ I I
I
=
Charge 17
Murder 11
Manslaughter 2
Forcible Rsps 16
Robbery 80
Agg.Assault 144
B & E/Burglery 633
Larceny 999
Motor Veh.Theft 108
Subtotel For Part I 1.993
Other Assaults 220
Arson,Burnlr.~ 11
Forgery ,Etc. 79
Frllud 56
Embezzlement 1
Stolen Property 41
'V'lllndalism 127
Weapons 84
ProstitutIon 6
Sex Offenses 30
Drug Lllws 495
Gambling 5
Against Family 3
D.U.!. 347
Liquor Laws 273
Drunkenness 618
Disorderly Conduct 564
Vagrancy 2
All Other 461
Curfew/Loitering 0
Run·Aways 12
Subtotal For Part II 3,435
Totel For S.C. 5,428
-~978 TOTAL ARRESTS BY AGE
(continued)
18 19 20 21 22
11 14 9 23 12
1 0 2 2 2
31 28 30 30 30
83 76 73 71 64
147 153 166 193 166
580 454 398 317 289
964 740 670 572 525
96 78 50 47 35
1.913 1,543 1.398 1.255 1.123
263 290 279 302 328
7 8 6 4 7
83 89 61 93 86
105 138 138 197 204
0 1 0 0 0
41 33 47 39 32
i54 109 104 104 85
105 93 104 109 101
14 22 19 22 19
33 38 39 30 36
638 665 697 558 466
15 13 19 16 21
5 7 12 9 14
545 663 779 849 723
384 328 306 305 220
1.085 1,001 fJ74 991 904
750 720 695 610 537
2 1 8 2 3
562 533 497 463 395
0 0 0 0 0
0 0 0 0 0
4,791 4,752 4,784 4.703 4.181
6,704 6,295 6,182 5,958 5,304
._---------
2~, li
24 25-29
21 10 68
2 2 9
26 23 82
54 43 151
190 153 758
208 207 525
427 379 1.346
39 26 86
967 843 3,025
329 298 1,371
6 5 28
73 76 259
191 205 986
0 1 3
18 29 80
95 66 271
79 90 340
24 9 61
16 26 86
373 331 945
11 15 122
23 21 116
673 714 3,1£9
162 141 530
877 832 3,875
487 498 1,845
8 0 6
366 343 1.265
0 0 0
0 0 0
3,810 3,700 15,378
4,777 4.543 18,403
41
__ '"_~,-_" ____ . __ '"_" ___ ..:.-.-_-___ . ___ -__ -"-;;;. __ . ___ . __ . ____ ""' ___ " ____ .. _ .. ~ ___________ ,~ __ .,_,: ____ . _____ .~ . .,. ___ ~_. ____ . __ . _______ .. _' ___ '"". ___ ~-__ .... ~_ .. ~-----.. "-,..----··-·"-·· .... ·,c·-~·~:.~.·:~~: .. ~ ... ~- .. ".--. -._,-- ' .. '"'" .. --.~--,-.-" " .. -~-,-... '"---.-.~-,.--.. -""~-" ..... ,-~--"'-~
o
o
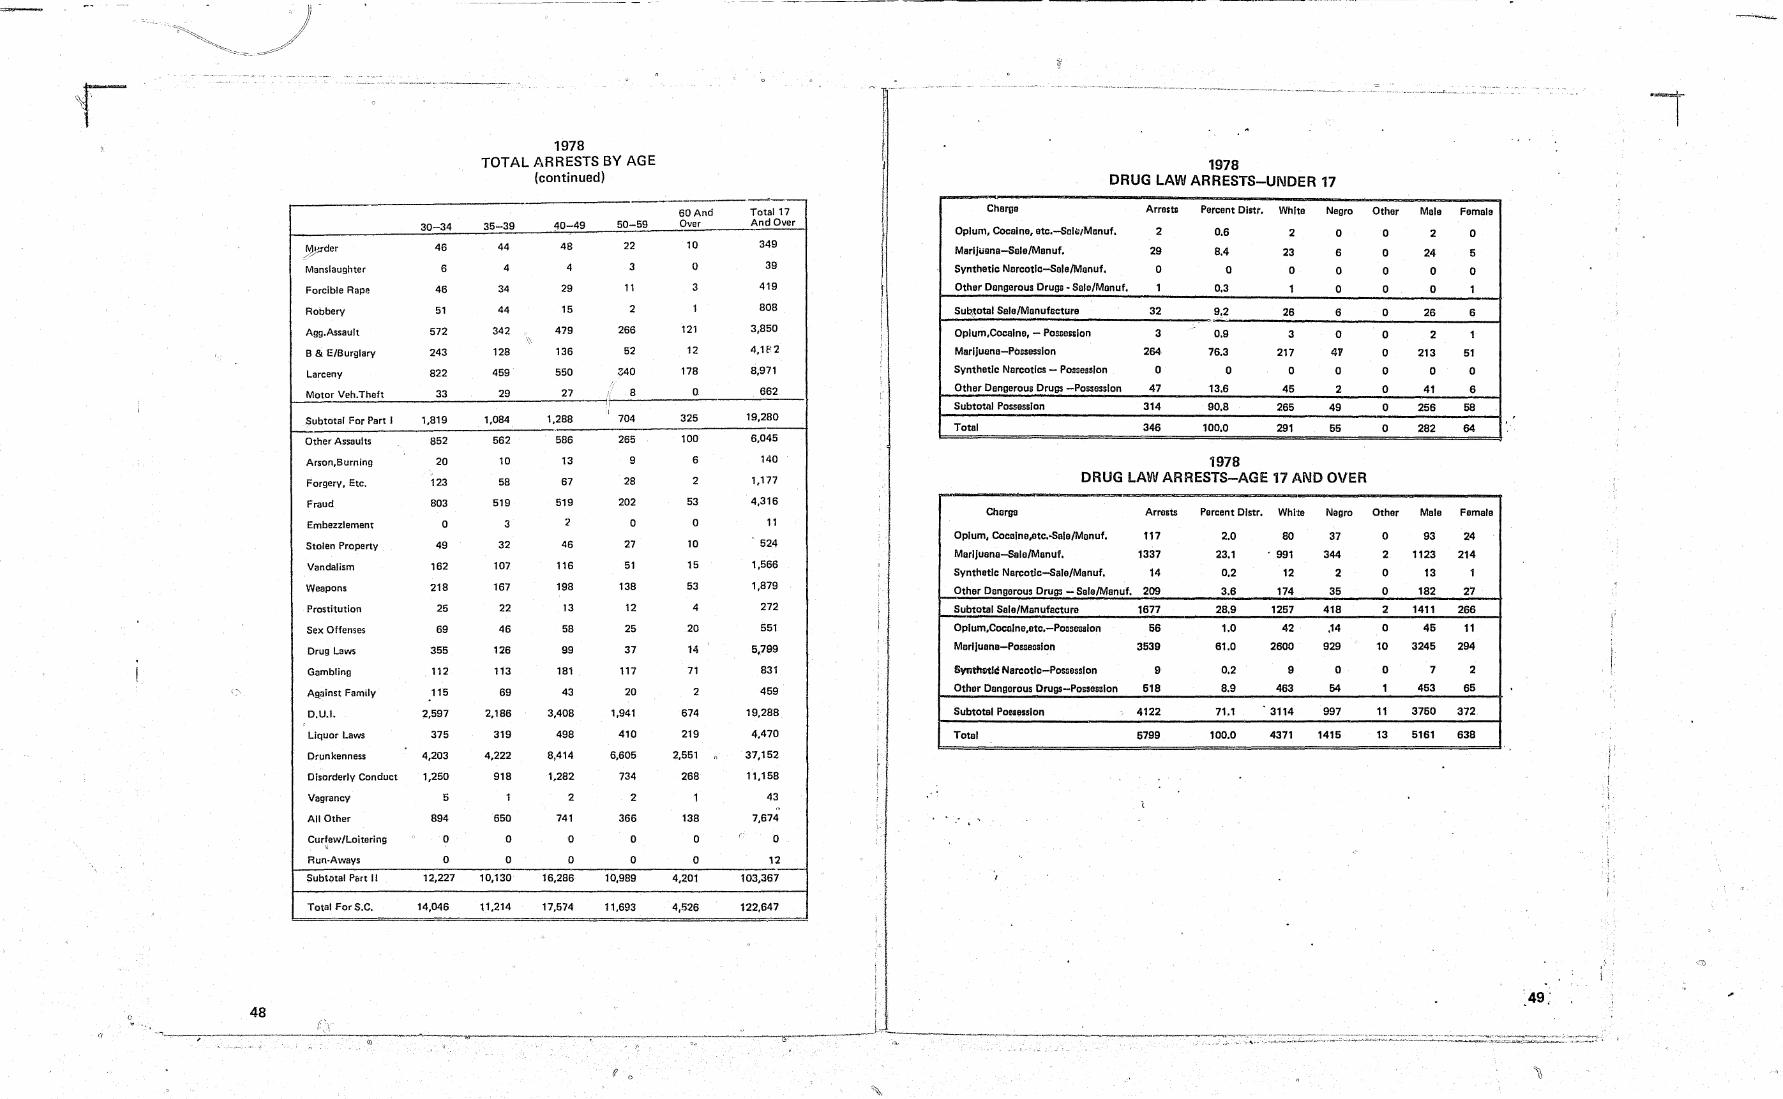
30 34
~yrder 46
Manslaughter 6
Forcible Rape 46
Robbery 51
Agg.Assault 572
B & E/Burglary 243
Larceny 822
Motor Veh.Theft 33
Subtotal For Part I 1,819
Other Assaults 852
Arson,Burning 20
Forgery, Etc. 123
Fraud 803
Embezzlement 0
Stolen Property 49
Vandalism 162
Weapons 218
Prostitution 25
Sex Offenses 69
Drug Laws 355
Gambling 112
\> Against Family 115
D.U.I. 2,597
Liquor Laws 375
Drunkenness 4,203
Disorderly Conduct 1,250
Vagrancy 5
All Other 894
Curfew/Loitering II
0
Run·Aways 0
SubtDtal Pert II 12,227
Total For S.C. 14,046
1978 TOTAL ARRESTS BY AGE
(continued)
35 39 '10 49 50-59
44 48 22
4 4 3
34 29 11
44 15 2
342 479 266 \~,
128 136 52
459 550 .7-40
" 29 27 8
"
I 1,084 1,288 704
562 586 265
10 13 9
58 67 28
519 519 202
3 2 0
32 46 27
107 116 51
167 198 138
22 13 12
46 58 25
126 99 37
113 181 117
69 43 20
2,186 3,408 1,941
319 498 410
4,222 8,414 6,605
918 1,282 734
1 2 2
650 741 366
0 0 0
0 0 0
10,130 16,286 10,989
11,214 17,574 11,693
il 0
--------------"--.'--60And Total 17 Over And Over
10 349
0 39
3 419
1 808
121 3,850
12 4,182
178 8,971
0 662
325 19,280
100 6,045
6 140
2 1,177
53 4,316
0 11
10 524
15 1,566
53 1,879
4 272
20 551
14 6,799
71 831
2 459
674 19,288
219 4,470
2,551 " 37,152
268 11,158
1 43 ,'.
138 7,674
0 c' 0
0 12
4,201 103,367
4,526 122,647
t
l I
1978 DRUG LAW ARRESTS-UNDER 17
Charge Arresu Percent Dlrtr. White Negro
I !
Opium, CocaIne, etc.-5fll.::/Manuf. 2 0.6 2 0
MarljUlma-5tlle/Menuf. 29 8.4 23 6
Synthetic Narcotlc-5ala/Manuf. 0 0 0 0
Other Dangerous Drugs - Sale/Manuf. 1 0.3 1 0
SUI:!$otal Sale/Manufllcture 32 9.2 26 6
Oplum,Cocalne, - POSllesslon 3 0.9 3 0
Marijuana-Possession 264 76.3 217 4V
Synthetic Narcotics - Possession 0 0 0 0
Other Dangerous Drugs -Possasslon 41 13.6 45 2
Subtotal Possession 314 90.8 265 49
Total 346 100.0 291 56
1978 DRUG LAW ARRESTS-AGE 17 AND OVER
Chorga Arrests Percent Dlstr. White Negro
Opium. Cocaina,otc.-5ala/Manuf. 111 2.0 80 37
Marljuana-5ale/Manuf. 1337 23.1 991 344
Synthatlc Narcotlc-5ala/Manuf. 14 0.2 12 2
Othar Dangerous Drugs - Sale/Manuf. 209 3.6 174 35
Subtotal Sele/Manufacture 1617 28.9 1267 418
Oplum,Cocelne,etc.-PosseaBlon 66 1.0 42 .14
Marljuena-PoSllBaslon 3539 61.0 2600 929
ISvntfHltlC NarcotIc-PossessIon 9 0.2 9 0
Other Dangerous Drugs-Possession 618 8.9 463 64
Subtotal Po~esslon 4122 11.1 3114 997
Total 6799 100.0 4371 1416
Other
0
0
0
0
0
0
0
0
0
0
0
Other
0
2
0
0
2
0
10
0
1
11
13
"-~--- ---~p-~~----
Male Female
2 0
24 6
0 0
0 1
26 6
2 1
213 61
0 0
41 6
266 68
" 282 64
Male Femala
93 24
1123 214
13 1
182 21
1411 266
46 11
3246 294
1 2
453 65
3760 372
6161 638
I I
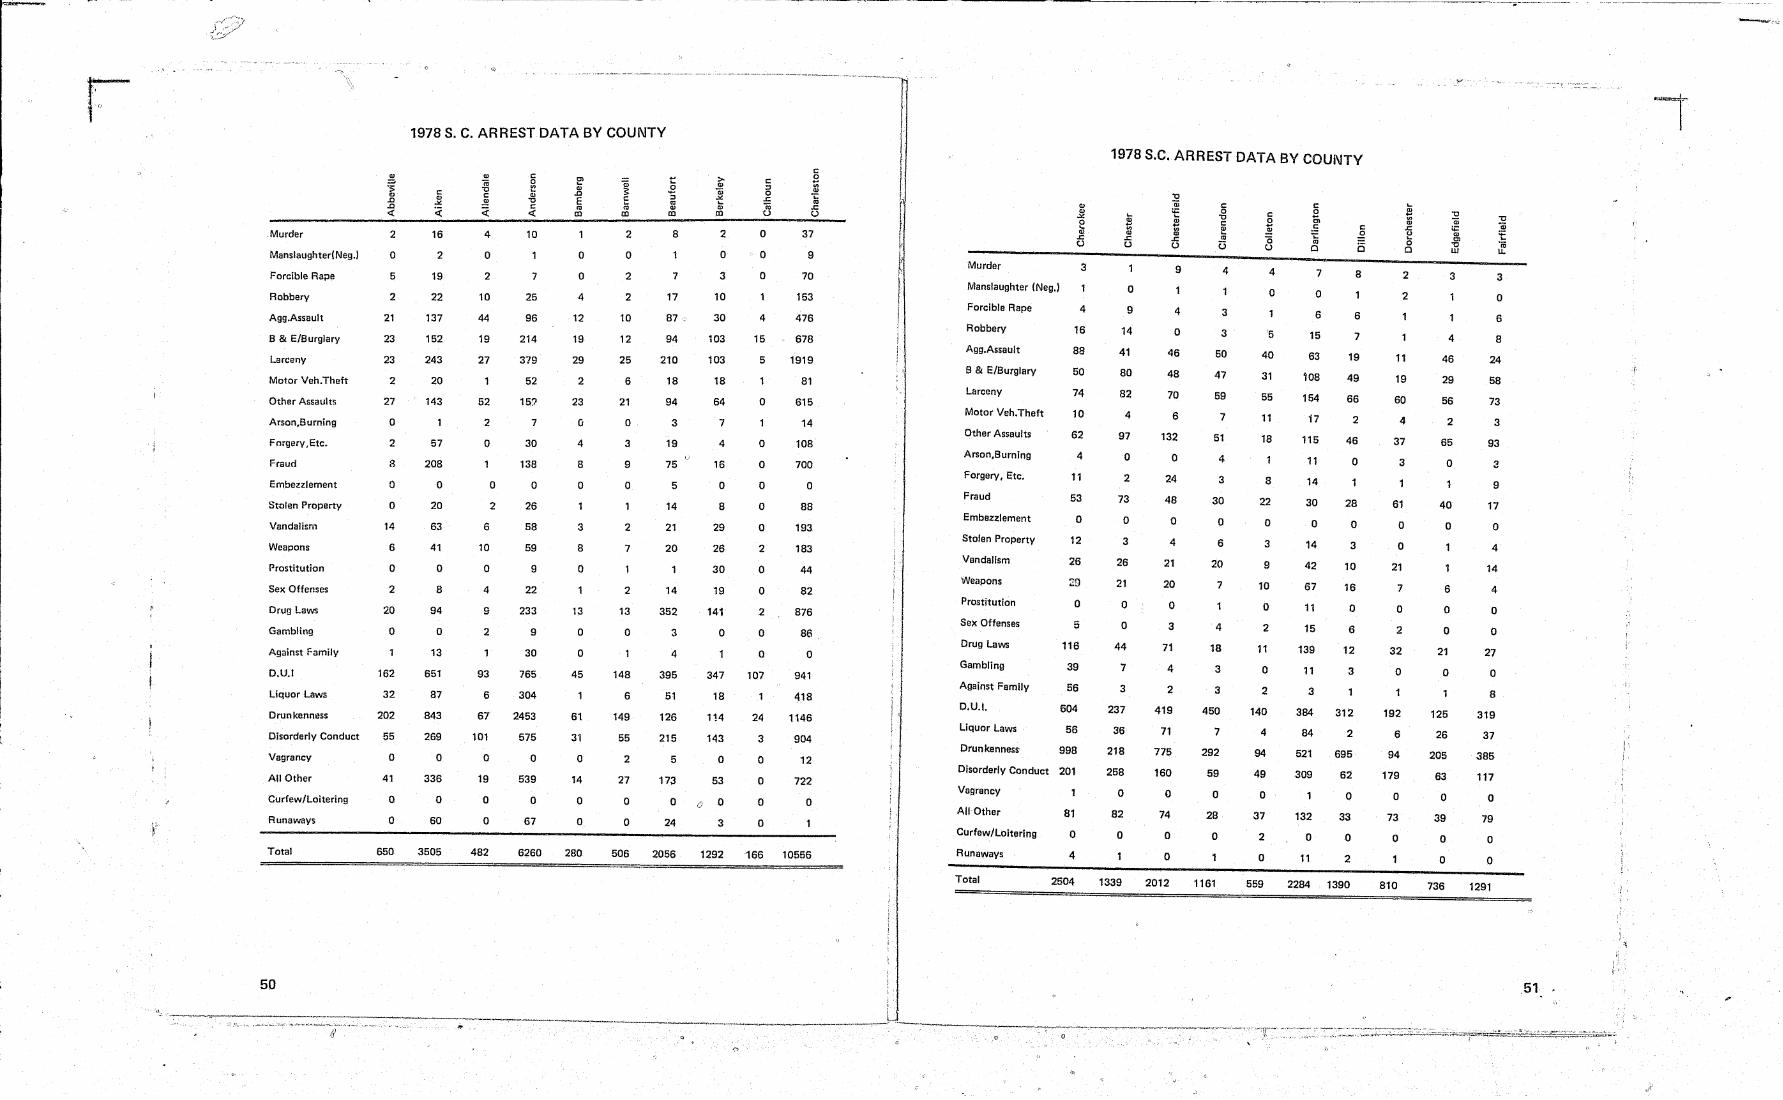
r· :' I)
.Murder
Manslaughter!Neg.J
Forcible Rape
Robbery
Agg.Assault
B & E/Burglary
Larceny
Motor Veh.Theft
Other Assaults
Arson,Burning
ForgerY,Etc.
Fraud
Embezzlement
Sttllen Property
Vandalism
Weapons
Prostitution
Sex Offenses
Drug Laws
Gambling
Against Family
D.U.I
Liquor Laws
2
o
5
2
21
23
23
2
27
o 2
8
o o
14
6
o
2
20
o
162
32
Drunkenness 202
Disorderly Conduct 55
Vagrancy
All Other
Curfew/Loitering
Runaways
Total
o 41
o o
650
1978 S. C. ARREST DATA BY COUNTY
16
2
19
22
137
152
243
20
143
57
208
o 20
63
41
o
8
94
o
13
651
87
843
269
o
336
o
60
3505
4
o 2
10
44
19
27
52
2
o
6
10
o
4
9
2
93
6
67
101
o
19
o
o
482
o
2
c o ~ OJ
"0 C <l:
10
7
25
96
214
379
52
15?
7
30
138
o
26
58
59
9
22
233
9
30
765
304
2453
575
o 539
o
67
6260
E' OJ .0
E '" CD
o o
4
12
19
29
2
23
(j
4
8
o
3
8
o
13
o
o
45
61
31
o
14
o o
280
a; s c '-'" CD
2
o
2
2
10
12
25
6
21
o 3
9
o
2
7
2
13
o
148
6
149
55
2
27
o
o
506
8
7
17
87 :
94
210
18
94
3
19
75
5
14
21
20
14
352
3
4
395
51
126
215
5
173
o
24
2056
> OJ a; ~ .... Q)
CD
2
o
3
10
30
103
103
18
64
7
4
16
o
8
29
26
30
19
141
o
347
18
114
143
o
53
o .0
3
1292
C :l o ..c a; U
o
o
o
4
15
5
o
o
o
o
o
o
2
o o 2
o
o
107
24
3
o
Q
o
o
c B ~ '" ..c
U
37
9
70
153
476
678
1919
81
615
14
108
700
o
88
193
183
44
82
876
86
o
941
418
1146
904
12
722
o
166 10556
I I I· [J t
~ I I'
Murder
Manslaughter (Neg.)
Forcible Rape
Robbery
Agg.Assault
B & E/Burglary
Larceny
Motor Veh.Theft
Other Assaults
Arson,Burnlng
Forgery. Etc.
Fraud
Embez2:lement
Stofen Property
Vandalism
Weapons
Prostitution
Sex Offenses
Drug Laws
Gambling
Against Family
D.U.1.
Liquor Laws
Drunkenness:
Q) OJ ~
~ .c U
3
4
16
88
50
74
10
62
4
11
53
Q
12
26
o 5
116
39
56
604
56
998
Disorderly Conduct 201
Vagrancy
All Other
Curfew/Loitering
Runaways
Total
81
Q
4
2504
-----~- ----------------... -~-----
1978 S.C. ARREST DATA BY COUNTY
.... l!l '" Q)
.c u
o
9
14
41
80
82
4
97
o
2
73
o
3
26
21
o
o
44
7
3
237
36
218
258
o
82
o
1339
9
4
o
46
48
70
6
132
o
24
48
o 4
21
20
o 3
71
4
2
419
71
775
160
o
74
o
o
2012
c: o "0 C ~ '" C3
4
3
3
50
47
59
7
51
4
3
30
o
6
20
7
4
18
3
3
450
7
292
59
o
.28
o
1161
c B 2:! (5 u
4
o
'5
40
31
55
11
18
8
22
o
3
9
10
o
2
11
o
2
140
4
94
49
o
37
2
o
559
c B Cl
.!: -;:
'" o
7
o
6
15
63
~08
154
17
115
11
14
30
o
14
42
67
11
15
139
11
3
384
84
521
309
132
o
11
c o
i5
8
6
7
19
49
66
2
46
o
28
o
3
10
16
o
6
12
3
312
2
695
62
o
33
o 2
2284 1390
.... t: Q)
..c u 5 o
2
2
11
19
60
4
37
3
61
o
o
21
7
o 2
32
o
192
6
94
179
o
73
o
810
3
4
46
29
56
2
65
o
40
o
6
o
o
21
o
125
26
205
63
o 39
o
o
736
3
o
6
8
24
58
73
3
93
3
9
17
o
4
14
4
o
o
27
o
8
319
37
38S
117
o
79
o
o
1291
.51
. r,
!
. I'
-.
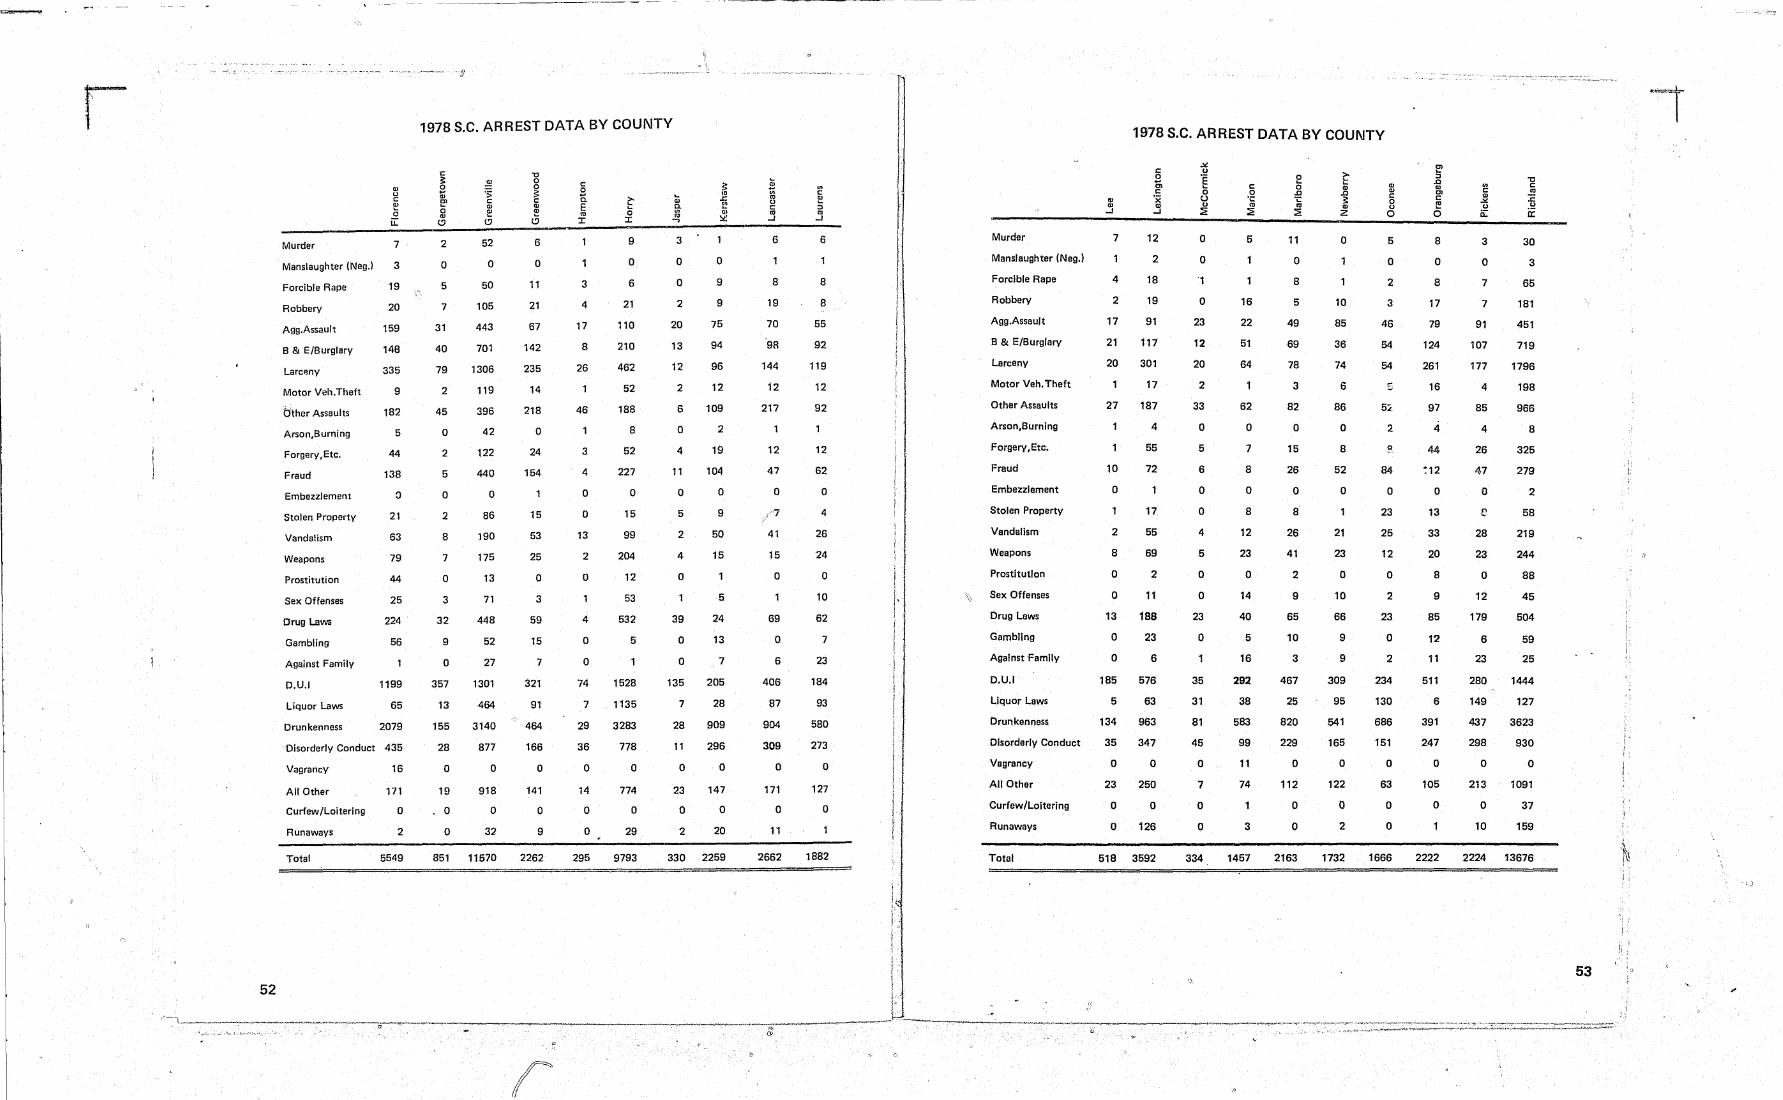
\
r·
52
Q) (J
" ~ o u:
Murder 7
Manslaughter (Neg.) 3
Forcible Rape 19
Robbery 20
Agg.Assault 159
B & E/8urglary 148
Larcp.ny
Motor Vllh.Theft
dther Assaults
Arson,Burning
ForgerY,Etc.
Fraud
Embezzlement
Stolen Property
Vandalism
Weapons
Prostitution
Sex Offenses
Drug Laws
Gambling
Against Family
P.U.I
Liquor Laws
Drunkenness
335
9
182
5
44
138
:>
21
63
79
44
25
224
56
1199
65
2079
DisorderlY Conduct 435
Vagrancy
All Other
Curfew ILoitering
Runaways
Total
16
171
o
2
5549
----------- - -
1978 S.C. ARREST DATA BY COUNTY
" 3: o t E' o ., t?
2
o 5
7
31
40
79
2
45
o 2
5
o
2
8
7
o
3
32
9
o
357
13
155
28
o
19
o
o
52
o
50
105
443
701
1306
119
396
42
122
440
o
86
190
175
13
71
448
52
27
1301
464
3140
877
o
918
o
32
"0 o ~ " III III
~
6
o 11
21
67
142
235
14
218
o 24
154
15
53
25
o
3
59
15
7
321
91
464
166
o
141
o 9
" o il. E m :r:
3
4
17
8
26
46
3
4
o
o 13
2
o
4
a
a 74
7
29
36
a
14
o
o
9
o
6
21
110
210
462
52
188
8
52
227
o
15
99
204
12
53
532
5
1528
1135
3283
778
a
774
o
29
... III 0. on m ...,
3
o
o
2
20
13
12
2
6
o
4
11
o
5
2
4
o
39
o
a
135
7
28
11
o
23
o
2
o
9
9
75
94
96
12
109
2
19
104
o
9
50
15
5
24
13
7
205
28
909
296
o
147
o
20
851 11570 2262 295 9793 330 2259
a
r
--- ~-------- ---- ------~----------~--~-~-----------
6
8
19
70
98
144
12
217
12
47
o
41
15
o
69
a 6
406
87
904
309
o
171
o 11
2662
on
" ~ :l j
6
8
8
55
92
119
12
92
12
62
o
4
26
24
o
10
62
7
23
184
93
580
273
o
127
o
1882
! I I f
I 1
I
Murder
Manslaughter (Neg.)
Forcible Rape
Robbery
Agg.Assault
B & E/Burglary
Larceny
Motor Veh. Theft
Other Assaults
Arson,8urnlng
Forgery, Etc.
Fraud
Embezzlement
Stolen Property
Vandalism
Weapons
Prostitution
\. Sex Offenses
Drug Laws
Gambling
Against Family
D.U.I
Liquor Laws
Drunkenness
Disorderly Conduct
Vagrancy
All Other
CUrfew/Loitering
Runaways
Total
1978 S.C. ARREST DATA BY COUNTY
III j
7
4
2
17
21
20
27
10
o
2
8
o
o 13
o
o
185
5
134
35
o
23
o o
c: o ... Cl
" ·X j
12
2
18
19
91
117
301
17
187
4
55
72
17
55
69
2
11
188
23
6
576
63
963
347
o
250
o
126
518 3592
.>l (J
§ o
CJ u ~
o
o '1
o
23
12
20
2
33
o
5
6
o
o
4
5
o
o
23
o
35
31
81
45
o
7
o
o
334
\\
" o ·C m ~
5
16
22
51
64
62
o
7
8
o
8
12
23
o
14
40
5
16
292
38
583
99
11
74
3
1457
h
11
o
8
5
49
69
78
3
82
o
15
26
o
8
26
41
2
9
65
10
3
467
25
820
229
o
112
o o
2163
~ Q)
.0 3: Q)
2
o
10
85
36
74
6
86
o
8
52
o
21
23
o
10
66
9
9
309
95
541
165
o
122
o 2
1732
Q) Ql
" o (J
o
5
o
2
3
46
54
54
5:<
2
84
o
23
25
12
o
2
23
o
2
234
130
686
151
o
63
o
o
1666
E' :l .0 III Cl
" E o
8
o 8
17
79
124
261
16
97
4
44
~ 12
o
13
33
20
8
9
85
12
11
511
6
391
247
o 105
o
2222
In
" ., ~ (J
a::
3
o
7
7
91
107
177
4
85
4
26
47
o C
28
23
o
12
179
6
23
280
149
437
298
o
213
o
10
30
3
65
181
451
719
1796
198
966
8
325
279
2
58
219
244
88
45
504
59
25
1444
127
3623
930
o
1091
37
159
2224 13676
"--_._'-"'-' ~-- _. . --- .-- ... -.--~--.
53
.~. r~
ii'
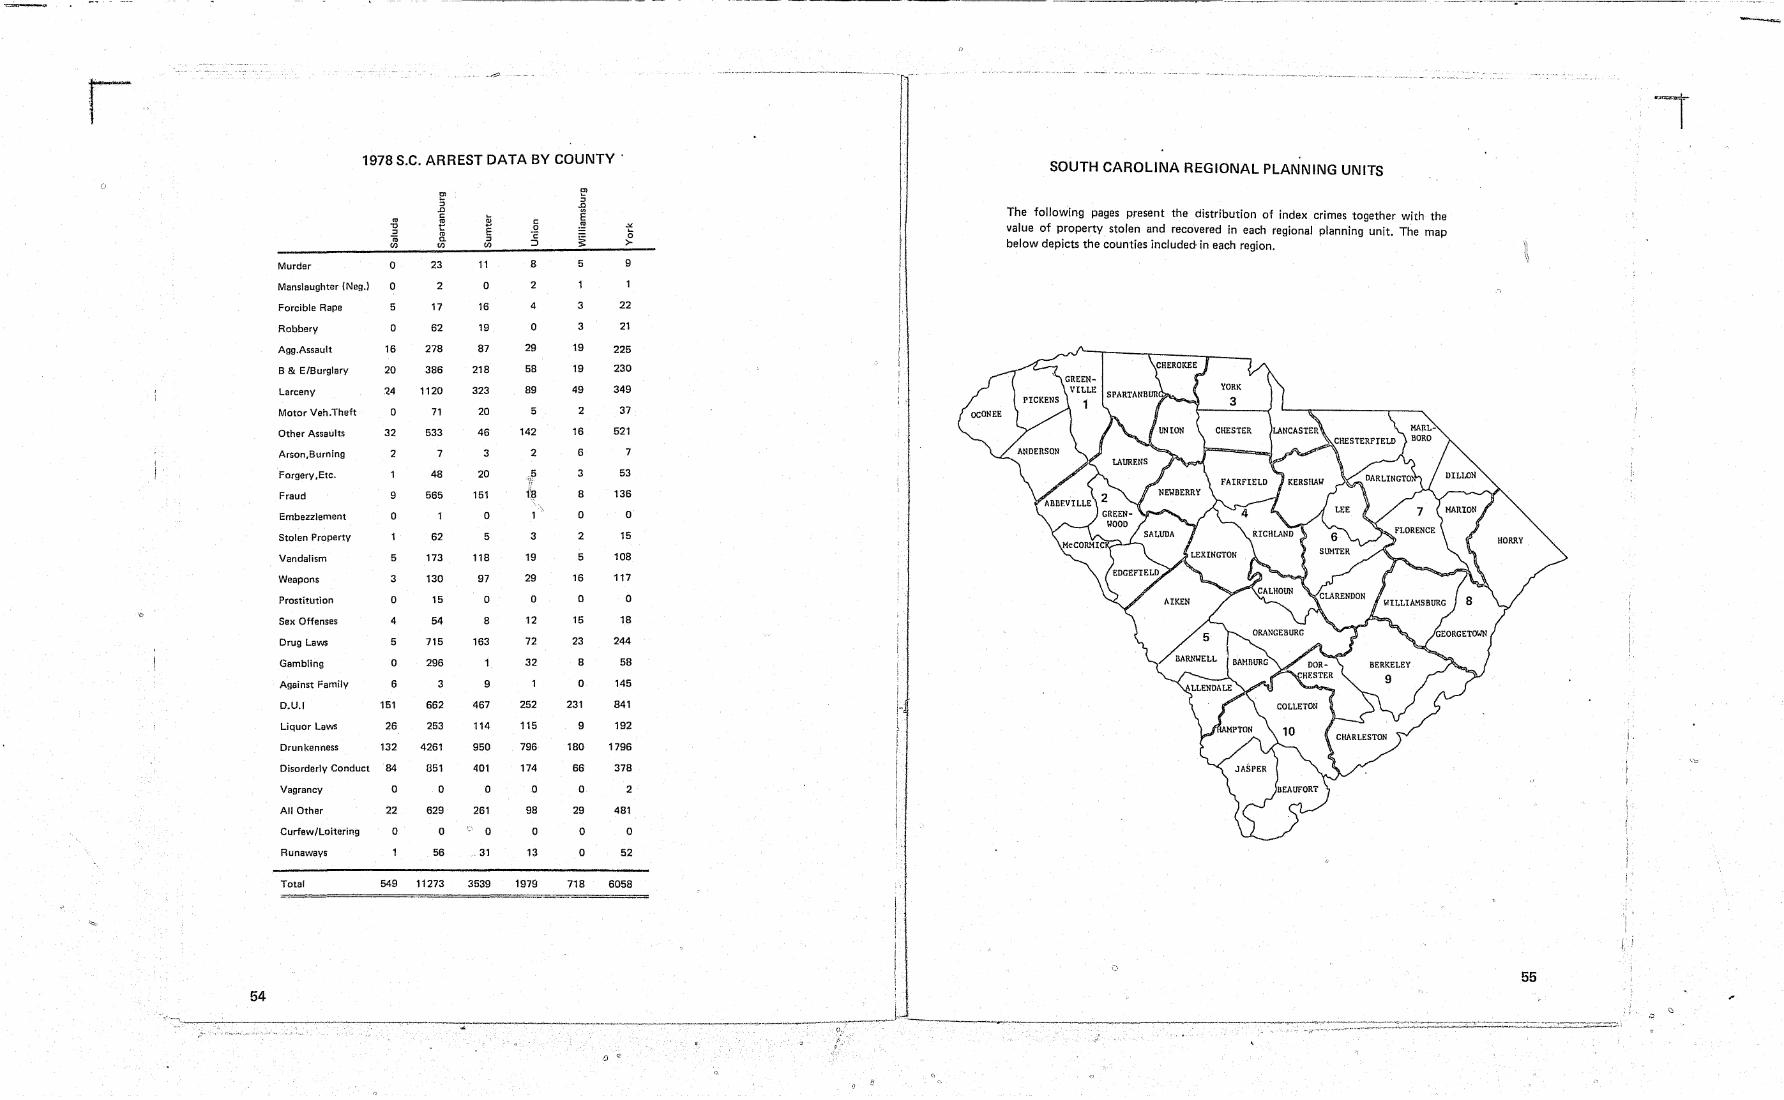
.. ~ r 1978 s.c. ARREST DATA BY COUNTY
0 Cl
C) :; :; .0 .0 E c ~
'" '" OJ C ~ "'" "0 ... E 0 ~ '-::J m 'c ~
0 "iij a. ::J ::J >-U) U) U)
Murder 0 23 11 8 5 9
Manslaughter (Neg.) 0 2 0 2
Forcible Rape 5 17 16 4 3 22
Robbery 0 62 19 0 3 21
Agg.Assauit 16 278 87 29 19 225
B & E/Burglary 20 386 218 58 19 230
Larceny 24 1120 323 89 49 349
Motor Veh.Theft 0 71 20 5 2 37
Other Assaults 32 533 46 142 16 521
Arson,Burning 2 7 3 2 6 7
Forgery.Etc. 48 20 .. 5 3 53 o!
Fraud 9 565 151 Ii~ 8 136
Embezzlement 0 0 1\ 0 0
Stolen Property 62 5 3 2 15
Vandalism 5 173 118 19 5 108
Weapons 3 130 97 29 16 117
Prostitution 0 15 0 0 0 0
'" Sex Offenses 4 54 8 12 15 18
Drug Laws 5 715 163 72 23 244
Gambling 0 296 32 8 58
Against Family 6 3 9 0 145
D.U.I 151 662 467 252 231 841
Liquor Laws 26 253 114 115 9 192
Drunkenness 132 4261 950 796 180 1796
Disorderly Conduct 84 351 401 174 66 378
Vagrancy 0 0 0 0 0 2
All Other 22 629 261 98 29 481
Curfew/Loitering 0 0 0 0 0 0
Runaways 56 31 13 0 52
Total 549 11273 3539 1979 718 6058
""
54
0" Ii ,"
u
I
1 I
.~--.--~~--------------------
SOUTH CAROLINA REGIONAL PLANNING UNITS
The following pages present the distribution of index crimes together with the value of property stolen and recovered in each regional planning unit. The map below depicts the counties included in each region.
i.
55
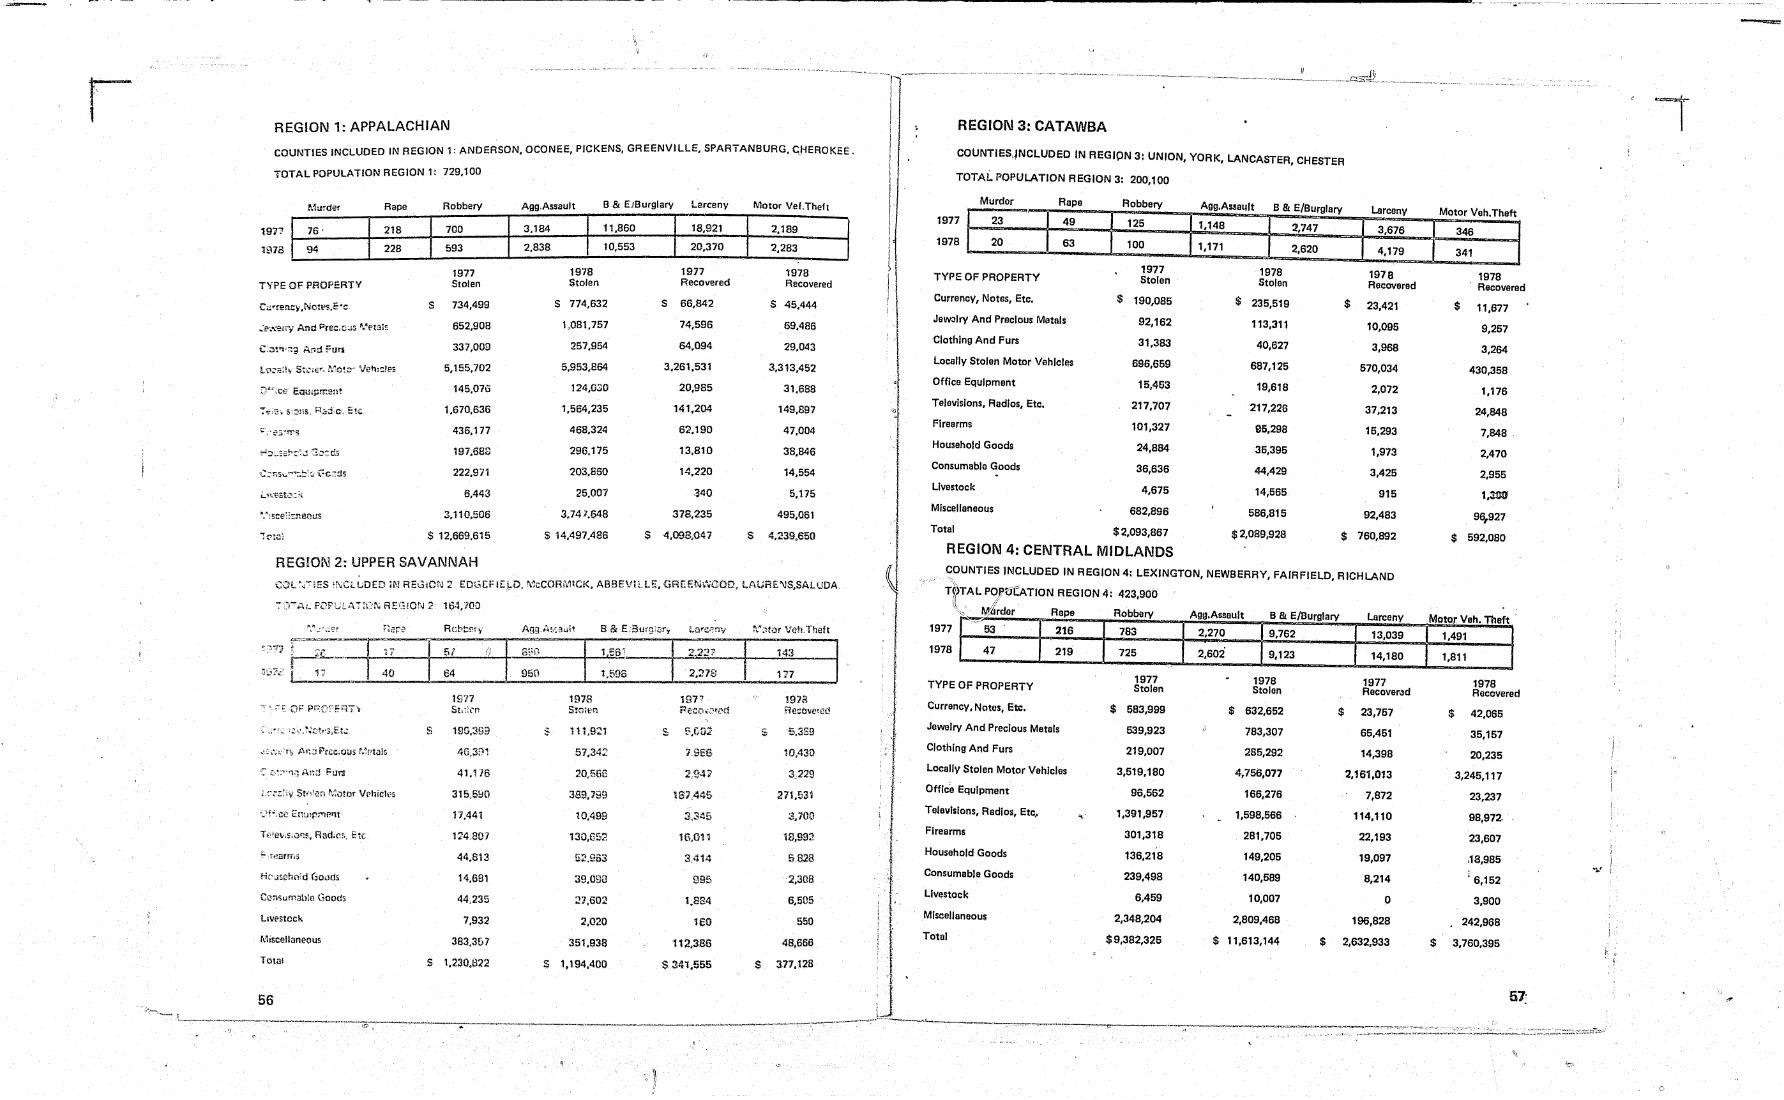
r REGION 1: APPALACHIAN
COUNTIES INCLUDED IN REGION 1: ANDERSON, OCONEE, PICKENS, GREENVILLE, SPARTANBURG, ~flEROKEE.
TOTAL POPULATION REGION 1: 729,100
.. Rape
1917 76 . 218
1978 94 228
TYPE OF PROPERTY
~&"'!sc€!!snenus
Robbery
700
593
1977 Stolen
S 734,499
652,908
337,009
5,155,702
145,076
1,670,636
436,177
197,68S
222,971
6,443
3,110,506
$ 12,669.615
REmON 2: UPPER SAVANNAH
t 51' (j
I 40 64
1917
s 19G.399
4G.3!!1
41.116
315,5~O
17.44 t
124.807
44,813
14,681
44,235
Llvestcck 7,932
Miscellaneous 383.357
Total S 1.230,822
56
Agg.Assault B & E!Burglary Larceny
3.184 11,860
2,838 10,553
95n
1978 Stolen
S 714,632
1,081,757
257,954
5,953,864
124.030
1,564,235
468.324
296,175
203,850
25,007
3.741.648
S 14,497;186
1978
51,34:;
20,566
389.799
10,499
130.652
39.0£)8
:n.602
2,020
351.938
S 1,194,400
18,921
20,370
1977 Recovered
S 66.842
74,596
64,094
3.261.531
20.985
141,204
6:2.190
13,810
14.220
340
378,235
54,098,047
3.414
160
112.386
$341,555
Motor VEI.Theft
2,189
2,283
1978 Recovered
S 45.444
69,486
29,043
3,313,452
31,688
149,897
47,004
38,846
14,554
5,175
495.06.1
S 4,~39,650
$
1978 ReeOVeli)C
5.389
10,430
271,531
3.700
18,992
5.828
2,308
6,505
550
48,666
377,128
REGION 3: CATAWBA
COUNTIES,INCLUDED IN REGION 3: UNION, YORK, LANCASTER, CHESTER
TOTAL. POPI::JLATION REGION 3: 200~100
1977
1978
Murdor
23
20
TYPE OF PROPERTY
Rape
49
63
Currency, Notes, Etc,
JeW3lry And Precious Metals
Clothing And Furs
Locally Stolen Motor Vehlclf!$
Office Equipment
Televisions, Radios, Etc.
Firearms
Household Goods
Consumable Goods
Livestock
Robbery
125
100
1977 Stolen
$ 190,085
92,162
31,383
696,659
15,453
217,707
101,327
24,884
36,636
4,675
Miscellaneous 682,896
Total $ 2,093,867
REGION 4: CENTRAL MIDLANDS
Agg A It B & E/ • ssau Burglary Larceny 1,148
1,171
1978 Stolan
$ 235,519
113,311
40,627
687,125
19,618
217,226
95,298
36,395
44,429
14,565
586,815
$2,089,928
'2,747
2,620
3,676
4,179
1978 Recovered
$ 23,421
10,095
3,988
570,034
2,072
37,213
15,293
1,973
3,425
915
92,483
$ 760,892
~OUNTIES INCLUDED IN REGION 4: LEXINGTON, NEW8ERRY, FAIRFIELD, RICHLAND -\:'
TPTAL PO,Pi1CATION REGION 4: 423900 \\ ;/ , ,,,,,' M&'rdor Rape Robbery "'.........,
1977
1978
53
47
TYPE OF PROPERTY
216
219
Currency, Notes, Etc.
Jewelry And Precious Metals
Clothing And Furs
Locally Stolen Motor Vehicles
Office EquIpment
Telovlslons, Radios, Etc,.
Flreerms
Household Goods
Consumable Goods
Livestock
Miscellaneous
Total
783
725
1977 Stolen
$ 583,999
539,923
219,007
3,519,180
96,562
1,391,957
301,318
136,218
239,498
6,459
2,348,204
$9,382,325
AgO A!lllault B & E/Burglary La rceny
2,270
2,602'
9,762
9,123
1978 Stolen
$ 632,652
783,307
285,292
4,756,077
166,276
1,598,566
281,705
149,205
140,689
10,007
2,809,468
$ 11,613,144
13,039
14,180
1977 Recovered
$ 23,757
65,451
14,398
2,161,013
7,872
114,110
22,193
19,097
8,214
o 196,828
$ 2,632,933
M
~--~~.--- -----
Motor Veh.Theft
348
341
1978 Recovered
$ 11,677
9,257
3,264
430,358
1,176
24,848
7,848 .
2,470
2,955
1,:wtJ
96,927
$ 592,080
otor Veh. Theft
1,491
1,811
1978 Recovered
$ 42,065
35,157
20,235
3,245,117
23,237
98,972.
23,607
,18,985
i 6,152
3,900
242,968
$ 3,760,395
~\
--

r
------ ----------------- -------~- --- ---- ------
REGION 7: PEE DEE REGION 5: LOWER SAVANNAH COUNTIES INCLUDED IN REGION 5: ALLENDALE, BARNWELL, AIKEN, CALHOUN, ORANGEBURG, BAMBERG.
COUNTIES INCLUDED IN REGION 7: FLORENCE,DAR LINGTON,CHESTERFIELD,MARL80RO,DILLON,MAR ION . TOTAL POPULATION RFGION 7: 281,500
TOTAL POPULATION REGION 5: 229,700
Muc",(lr Rape
1977 33 67
1978 28 72
TYPE OF PROPERTY
Currency, Notes, Etc.
Jewelry And Prec:ous Metals
Clothing And Furs
Locally Stolen Motor Vehicles
Office Equipment
Televisions, Rrdios, Etc.
Flreorms
Household Goods
Consumable Goods
Livestock
Miscellaneous
R bb Y a or
135
158
1977 Stolen
$ 174,302
120,301
33,746
693,559.
32,393
260,724
82,971
41,454
68,629
3,399
603,560
Total $ 2, 115~038
REGION 6: SANTEE-WATEREE
AgO As"ault , B&E IBurglary . 805
1,133
1978 Stolen
$ 182,139
132,451
44,605
826,811
25,309
318,209
92,714
51,711
62,993
13,299
676,740
$ 2,426,981
2;~59 2,686
.
COUNTIES INCLUDED IN REGION 6: KERSHAW, LEE, SUMTER, CLARENDON.
TOTAL POPULATION REGION 6: 164,200
1977
1978
Murder
20
21
TYPE OF PROPERTY
Rape
49
50
Currency Notes, Etc.
Jewelry And Precious Metals
Clothing Artd Furs
Locally Stolen Motor Vehicles
Office Equipment
TeleVisions, Radios, Etc.
Firearms
Household Goods
Consumable Goods
Livestock
Miscellaneous
Total
Robbery
86
77
1977 Stolen
$ 128,645
61,302
156,486
508,993
12,858
210,822
60,818
33,083
76,329
2,141
563,623
$ 1,815,100
Agg Assault B & E/Burglary
642
552
1978 Stolen
2,241
2,146
$ 130,105
53,931
41,982
696,472
22,054
222,581
63,178
70,467
60,708
1,627
508,204
$ 1,871,309
Larceny ~,j1otor Ve:l Theft
I 3,232 ::r 260
T 355 I 3,652
1977 Recovered
$ 10,526
15,774
2,212
414,392
5,867
17,270
5,503
1,758
3,934
250
81,129
$ 558,615
Lorcany
2,871
2,902
1977 Recovered
$ 6,135
5,2S2
6,848
319,302
270
21,236
16,893
4,114
3,412
·60
100,240
$483,762
. 1978 Recovered
$ 9,613
16,006
4,885
469,944
2,360
20,030
12,542
130
3,254
625
124,048
$ 663,437
Motor Vah.Theft
217
.233
1978 Recovered
$ 7,503
7,447
3,218
376,782
2,165
31,330
9,565
3,395
5,355
50
71,685
$ 518,495
I ) I , t
Murder
TYPE OF PROPERTY
Curroncy ,Notes, Etc.
Jewelry And Precious Marois
Clothing And Furs
Locally Stolon Motor Vehicles
Office Equipment
Televisions, RaDlos, Etc.
Flroermg
Household Goods
Consumablo Goods
Livestock
Mlncelleneous
1977 Stolen
$ 277,467
19B,003
65!341
1,167,911
35,036
405,730
99,620
48,509
55,285
4,640
782,239
Total $ 3,139,786 REGION 8:WACCAMAW
1978 Stolen
1977 Recovered
$ 317,464 $ 24,852
302,569
107,779
1,521,823
33,578
327,659
106,692
60,396
65,695
14,175
1,249,204
$ 4,107,634
34,170
7,358
616,208
5,007
40,008
17,446
1,440
6,5S8
695
162,851
$ 916,603
1978 Recovered
$ 31,958
11,178
8,217
743,362
6,376
35,568
14,464
2,504
4,398
111
351,152
$ 1,209,286
COUNTIES INCLUDED IN REGION 8: WILLIAMSBURG, GEORGETOWN, HORRY,
TOTAL POPULATION REGION 8: 159,700
Murder Rope
1977
·1978
20
17
TYPE OF PROPERTY
Curroncy, Netes, Etc.
Jewelry And "Precious Metals
Clothing And Furs
30
39
Locelly Stolen Motor Vehlclll!!
Office Equipment
TeleVisions, RediaS, Etc.
Flroerms
Household Goods
Consumllble Goods
Livestock
Miscellllneous
Total
Robbery
98
77
1977 Stolen
$ 284,392
165,919
112,715
882,027
13,838
305,946
74,684
76,596
33,342
1,480
670,433
$ 2,521,371
Agg.Asseult S & E/Burglary Larceny Motor Veh Theft
599
632
1978 Stolen
2299
2,027
$ 221,732
235,468
62,883
1,076,371
29,029
257,940
70,353
(.'64,108
35,449
9,598
653,023
$ 2,706,952
3319
3,395
1977 Rocoverod
$ 17,336
8,372
5,030
442,888
1,032
20,226
11,018
5,763
1,366
150
65,889
$ 679,070
255
378
1978 Recovered
$ 17,593
52,977
1,401
617,687
3,669
22,258
13,314
3,619
2,234
200
~,060
$ 818,012
--
I
! ;
(J ,
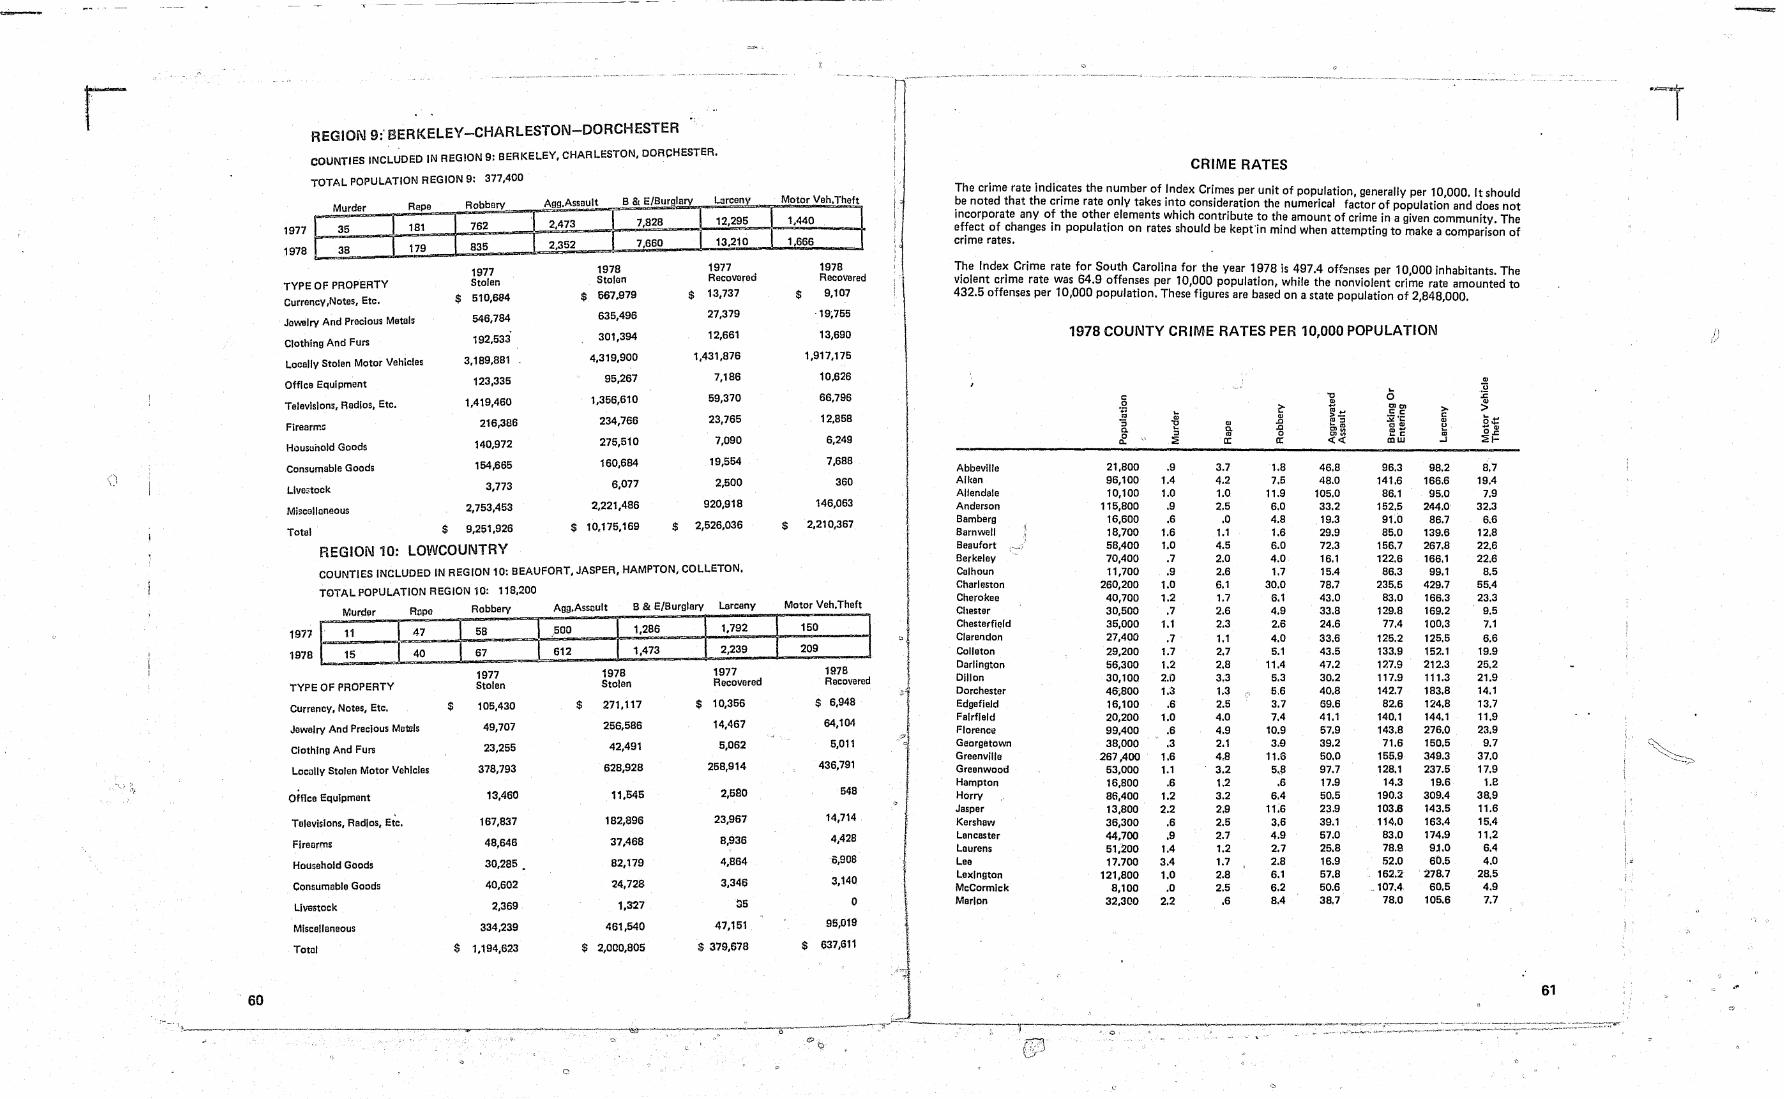
r
/1 \-'
-'i ';,
60
REGiON 9:' BERKELEY-CHARLESTON-DORCHESTER
COUNTIES INCLUDED IN REGION 9: BERKELEY, CHARLESTON, DORCHESTER.
TOTAL POPULATION REGION 9: 377,400
1977
1978
Murder
35
38
TYPE OF PROPERTY
Currency,Notas, Etc.
Rape
181
179
Jewelry And Precious Metals
Clothing And Furs
Locelly Stolen Motor Vehicles
Office Equipment
Televisions, Redlos, Etc.
Flrearm~
Housllnold Goods
Consumable Goods
Llvo:;tock
Miscallllneous
Totel
Robbery
762
835
1977 Stolen
$ 510,684
546,784
192,533
3,189,881
123,335
1,419,460
216,386
140,972
154,665
3,773
2,753,453
$ 9,251,926
REGION 10: lOWCOUNTRY
Agg.Assllult B &E /B urg cry La rceny
2,473 7,828 12,295
2,352 7,660 13,210
1978 1977 Stolen Recovered
$ 667.979 $ 13,737
635,496 27,379
301,394 12,661
4,319,900 1,431,876
96,267 7,186
1,366,610 59,370
234,766 23,765
275,510 7,090
160,684 19,554
6,077 2,500
2,221,486 920,918
$ 10,175,169 $ 2,526,036
COUNTIES INCLUDED IN REGION 10: BEAUFORT, JASPER, HAMPTON, COLLETON.
TOTAL POPULATION REGION 10: 118,200
1977
1978
Murder
11
15
TYPE OF PROPERTY
Currency, Notes, Etc.
Rope
47
40
Jewelry And PreciOUS Mel!lls
Clothing And Furs
LOClllly Stolen Motor Vehicles
Office Equipment
TeleVisions, Radios, Etc.
Firearms
Household Goods
Consumable Goods
LivGstock
Miscellaneous
TotD!
$
Robbery
58
67
1977 Stolen
105,430
49,707
23,255
378,793
13,460
167,837
48,646
30,285.
40,602
2,369
334,239
$ 1,194,623
"
Agg.Assllult B & EjBurglary Larceny
.,500 1,286 1,792
612 1,473 2,239
1978 1977 Stolen Recovered
$ 271,117 $ 10,356
256,586 14,467
42,491 5,062
628,928 258,914
11,545 2,5aO
182,896 23,967
37,468 8,936
82,179 4,864
~4,728 3,346
1,327 05
461,540 47,151
$ 2,000,805 $ 379,678
'"
0
M otor Veh.Theft I-
1,440 i 1,666
1978 Recovered ,
$ 9,107 !
-19;765
13,690
1,917,175
10,626
66,796
12,858
6,249
7,688
360
146,063
$ 2.210,367
Motor Veh.Theft
150
209
1978 Recovered
$ 6,948
64,104
5,011
436,791
548
14,714
4,428
~ I 1
0,e08
3,140
0
95,019
$ 637,611
(9
9
~-~--------~~--~~~~--~ ~-~------~---- - ~----
CRIME RATES
The crime rate indicates the number of Index C . . . ~e noted that the crime rate only takes into con~i~::a~~nU;~! ~~~p~lafl0t' generally per ~O,OOO. It should Incorporate any of the other elements which contribute to the enca f ac~or ~f po~ulatlon and does not effect of changes in population on rates shOUld be kept'in min~:ohunt 0 cnm~ In a given community. The crime rates. en attempting to make a comparison of
The Index Crime rate for South Carolina for the year 1978' 497 4 f~ violent crime rate was 64.9 offenses per 10,000 population ~h'l th 0 )!!ns~ster 1~,000 inhabitants. The 432.5 offenses per 10,000 population. These figures are based on I a
e sta:e ~~~v~fa~~~ ~~~~8~a~~~~ounted to
1978 COUNTY CRIME RATES PER 10,000 POPULATION
., .. u C 'tl 0 :c .2 ~
!!l en en .,
... ... ~~ > > III
C C
:; ., .,
~'C r::
5~ 'tl ., .0 E::J CD
a. .. a. .0 en'" ",CD u ::J CD'" ... "CD
0 :a '" 0 tn~ .. r:: III 0.<:
a. a: a: «« CDW -I :at-
Abbeville 21,800 .9 3.7 1.8 46.8 96.3 98.2 8.7 Aiken 96,100 1.4 4.2 7.5 48.0 141.6 166.6 19.4 Allendale 10,100 1.0 1.0 11.9 105.0 86.1 95.0 7.9 Anderson 115,800 .9 2.5 6.0 33.2 152.5 244.0 32.3 Bamberg 16,600 .6 .0 4.8 19.3 91.0 86.7 6.6 Barnwell 18,700 1.6 1.1 1.6 29.9 85.0 139.6 12.8 Beaufort 58,400 1.0 4.5 6.0 72.3 156.7 267.8 22.6 Berkeley 70,400 .7 2.0 4.0 16.1 122.6 166.1 22.6 Calhoun 11,700 .9 2.6 1.7 15.4 86.3 99.1 8.5 Charleston 260,200 1.0 6.1 30.0 78.7 235.5 429.7 55.4 Cherokee 40,700 1.2 1.7 6.1 43.0 83.0 166.3 23.3 Chester 30,500 .7 2.6 4.9 33.8 129.8 169.2 9.5 Chesterfil)ld 35,000 1.1 2.3 2.6 24.6 77.4 100.3 7.1 Clarendon 27,400 ,7 1.1 4.0 33.6 125.2 125.5 6.6 Colleton 29,200 1.7 2.7 5.1 43.5 133.9 152.1 19.9 Darlington 56,300 1.2 2.8 11.4 47.2 127.9 212.3 25.2 Dillon 30,100 2.0 3.3 5.3 30.2 117.9 111.3 21.9 Dorchester 40;800 1.3 1.3 5,6 40.8 142.7 183.8 14.1 Edgefield 16,100 .6 2.5 3.7 69.6 82.6 124.8 13.7 Fairfield 20,200 1.0 4.0 7.4 41.1 140.1 144.1 11.9 Florence 99,400 .6 4.9 10.9 57.9 143.8 276.0 23.9 Georgetown 38,000 .3 2.1 3.e 39.2 71.6 150.5 9.7 GreenVille 267,400 1.6 4,8 11.6 50.0 155.9 349.3 37.0 Greenwood 53,000 1.1 3.2 5.,8 97.7 128.1 237.5 17.9 Hampton 16,800 .6 1.2 .6 17.9 14.3 19.6 1.B Horry 86,400 1.2 3.2 6.4 50.5 190.3 309.4 38.9 Jasper 13,800 2.2 2.9 11.6 23.9 103.6 143.5 11.6 Kershaw 36,300 .6 2.5 3.6 39.1 114.0 163.4 15.4 Lancaster 44,700 .9 2.7 4.9 57.0 83.0 174.9 11.2 Laurens 51.200 1.4 1.2 2.7 25.8 78.9 9l.0 6.4 Lee 17.700 3.4 1.7 2.8 16.9 52.0 60.5 4.0 Lexington 121,800 1.0 2.8 6.1 57.8 162.2 278.7 28.5 McCormick 8,100 ,0 2.5 6.2 50.6 ,.107.4 60.5 4.9 Merion 32,300 2.2 .6 8.4 38.7 78.0 105.6 7.7
(.
61
i.
,"
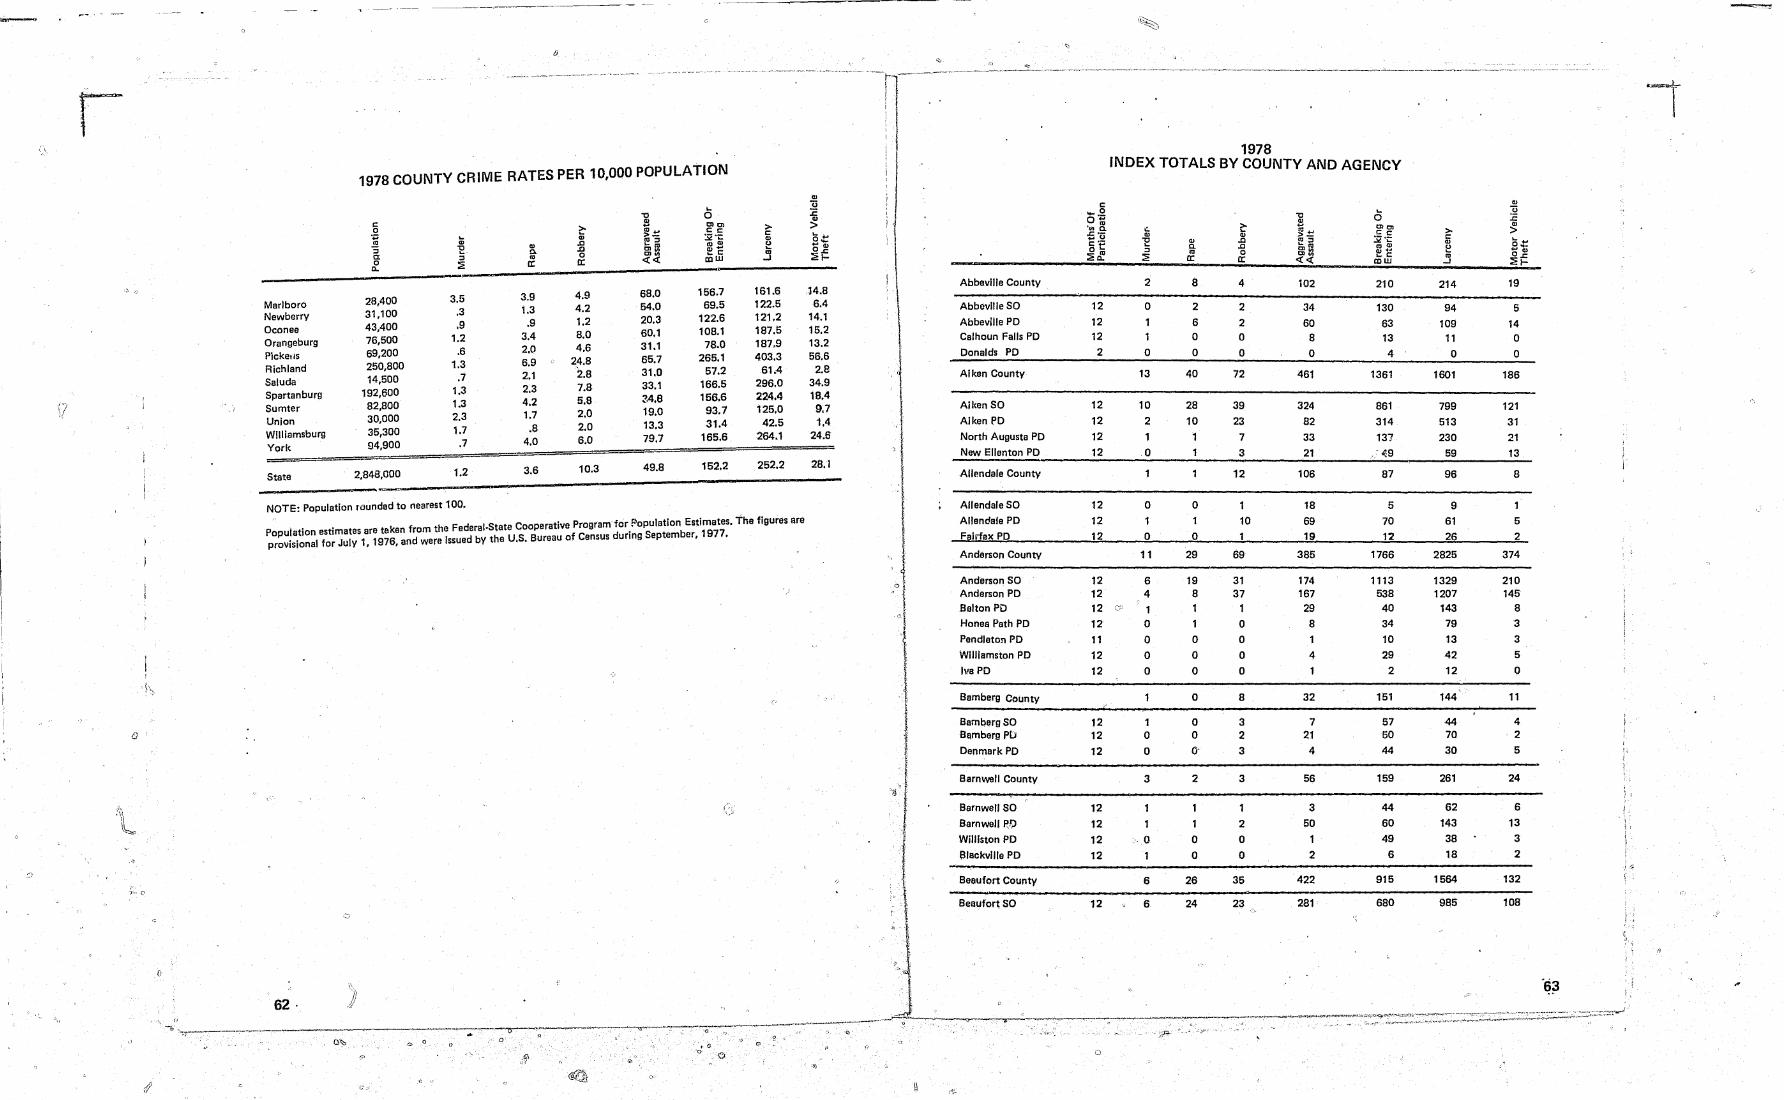
r
o
J':' (:\
o
1978 COUNTY CRIME RATES PER 10,000 POPULATION
Marlboro Newberry Oconee Orangeburg Picke,ls Richland Saluda Spartanburg Sumter Union Williamsburg York
State
28,400 31,100 43,400 76,500 69,200 250,800 14,500
192,600 82,800 30,000 35,300 94,900
2,848,000
3.5 .3 ,9
1.2 .6
1.3 .7
1.3 1.3 2.3 1.7
.7
1.2
NOTE: Population rounded to nearest 100.
CI> C.
'" " 3.9 1.3
.9 3.4 2.0 6.9 2.1 2.3 4.2 1.7
.8 4.0
3.6
~ ., .c .c o
" 4.9 4.2 1.2 8.0 4.6 2~.8 2.8 7.8 5.8 2.0 2.0 6.0
10.3
68.0 54.0 20.3 60.1 31.1 65.7 31.0 33.1 24.8 19.0 13.3 79.7
49.8
... o CICI C:c:
:s2 .;: lOCI>
ei: [OW
156.7 69.5
122.6 108.1
78.0 265.1
57.2 166.5 166.6
93.7 31.4
165.6
152.2
>c: e j
161.6 122.5 121.2 187.5 187,9 403.3
61,4 296.0 224.4 125.0
42.5 264.1
252.2
Population estimates are taken from the Federal·State Cooperative Program for P'opulatlon Estimates. Tha figures ara provisional for July 1,1976, and were issued by the U.S. Buraau of Cansus during September, 1977.
14.8 6.4
14.1 15.2 13.2 56.6 2.a
34.9 18,4
9.7 1.4
24.6
28.1
1\
j
, t I
c
o·
Abbeville County
Abbeville SO
Abbeville PO Calhoun Falls PO
Donalds PO
Aiken County
Aiken SO
Aiken f'O
North Augusta PO
New Ellenton PO
Allendale County
Allendale SO
Allendale PO
Fairfax PO
Anderson County
Anderson SO Anderson PO Balton PD
Honea Path PO
Pandleton PO
Williamston PO
Iva PO
Bamberg County
Bamberg SO Bambarg PD
Denmark PO
Barnwell County
Barnwell SO
Barnwell P'!,)
Williston PO
Blackville PO
Beaufort County
Beaufort SO
'~,
1978 INDEX TOTALS BY COUNTY AND AGENCY
12
12 12
2
12
12
12 12
12
12 12
2
o 1 1 o
13
10
2
o
o 1 o
11
12 6 12 4 12 c:;, 1
12 0 11 0 12 0 12 0
12 12 12
12
12 12
12
12
o o
3
o
6
6
CI> a. '" " 8
2
6 o o
40
28
10
1
o
o 29
19 8 1
1 o o o
o
o o 0'
2
o o
26
24
~ CI> .c .c o
" 4
2
2 o o
72
39 23
7
3
12
10
69
31 37
1
o o o o
8
3 2
3
3
2
o o
35
23
102
34
60 8
o
461
324
82
33 21
106
18
69 19
385
174 167 29
8
4
1
32
7 21
4
56
3
50
1 2
422
281
210
130
63 13 4
1361
861 314
137 '",9
87
5
70
12
1766
1113 538 40
34 10
29 2
151
57 50
44
159
44
60
49
6
915
680
>c: CI> E j
214
94
109 11
o
1601
799
513 230
59
96
9
61 26
2825
1329 1207
143 79
13
42
12
44 70
30
261
62
143
38
18
1564
985
19
5
14 o o
186
121 31 21 13
8
5
2
374
210 145
8
3
3
5
o
11
4 2
5
24
6
13 3
2
132
108
! ;
\

r
.-----.
I,'
c .-.~-,-.-.-.-.
1978 INDEX TOTALS BY COUNTY AND AGENCY
Beaufor~ PD
Port Royal PD
Yemassee PD
Berkeley County
12
12
2
Berkeley SO 12
Moncks Corner PD 12
Goose Creek PD 12
St. Stephens PD 12
Hanahan PO 12
Calhoun County
Calhoun SO St. Matthews PO
Charleston County
12 8
5
5
o o o o
o
27
Charleston City PD 12 12
Charleston Co.PO 12 9
Mount Pleasant PO 12 3
Folly Beach PD 12 0
Isle Of Palms PO 12 0
Lincolnville .PO 6 0 Su:Jjv~n Island PO 12 0
North. Charleston PD 12 3
Ravi'rlel PD
Cherokee CountY
Cherokee SO
Blacksburg PO
Gaffney PO
Chester CountY
Chester SO
Chester PD
Great Falls PD
9
12
12
12
12
12 12
o
5
4
o 1
2
2
o o
o
14
7
o 4
o 3
3
2
159
54 66
1
o o
36
o
7
6
o
8
7
o
10 2 o
28
11 6
5
1
5
2
2 o
7Bl
386
lB6 6
o o o
202 o
25
17
o B
15
11
3
109 31
1
113
34
5
1B
10 46
14 4
2048
6BB
855 39 26
10 Q
2
423 4
175
79 7
89
103
74 16 13
172
62
863
456 34
162
2B
lB3
101
78 23
6129
1719
2680
173 87
35 4
11 1410
10
338
205 16
117
396
218 143
35
457 122
o
1169
511
50
254
39 315
116
90 26
11181
4375 3801
334
139
78 1\
19 2426
8
677
328 26
323
516
243
190
83
'" u :c Q)
>
15 9
o
159
87
4 1B
6
44
10
7 3
1441
402
526 29 10 10 o 5
458
1
95
56 3
36
29
17 8
4
25 Chesterfield Counl,~\ 4 8 9 86 271 351
------------.~.~~~------------------------------------------------------------\~''O 2 4 5 50 165 135
64
Chesterfield SO
Cheraw PD
Chesterfield Po
\t~~\ 1'£":,:~ 2 4 3 23 73 130 12 0 0 0 3 12 20
-----_._---
/1
14 6
1
McBee PO
Pageland PO
Patrick PD
Clarendon County
Clarendon SO
Manning PO
Summerton PD
Turbeville PO
Colleton County
Colleton SO
Walterboro PD
Darlington CountY
Darlington SO
Darlington PO
Hartsville PD
Lamar Po Society Hili PD
I Dillon CountY
Dillon SO
Dillon PO
LakeView PD
Latta PO
Dorchester County
Dorchester SO
St.George PO
SUmmerville PD
Edgefield County
Edgefield SO
Edgefield PO
Johnston PO
Trenton PO
8
12 8
12 12
11
3
12
12
12
12 12 2
6
12
12
12
12
12
10 12 ."
12
12 12
6
1978 INDEX TOTALS BY COUNTY AND AGENCY
o o o
2
o
o
5
4
7
7
o o o o
6
6
o o o
6
6 o o
o o o
'" a. '" 0:
o o o
3
2
1
o o
8
3
5
16
11 2
3
o o
10
10 o o o
6
6
o o
4
4
o o o
~ Q)
JJ JJ o 0:
o 1
o
11
6
5
o o
16
9
6
64
17 13
34
o o
16
8
5
2
26
20 o 6
6
3
2
o
o 9
o
92
65 23
4
o
127
48
79
266
50
91 125
o o
91
49 32
1
9
191
157 5
29
112
53
31
28 o
.. o OlOl c c
32 ·c ",,,, eE IIlW
6 14 o
343
262
63
17
391
231
160
720
316 217
lBl
5
355
212
lOB 3
32
668
522 14
132
133
96 22
15
o
5 60
o
344
201
119 21
3
444
219 225
1195
381
327 483
o 4
335
144
147 3
41
860
610 28
222
201
97 52 52 o
r:'1
Ql
U :c '" >
o 3
o
18
14 3
o
58
24
34
142
82 17 42
o I
66
35 23 o 8
66
53
1
12
22
15 5
2
o
65
,.
I, i
, ' " , I, I
'I I
-T· "
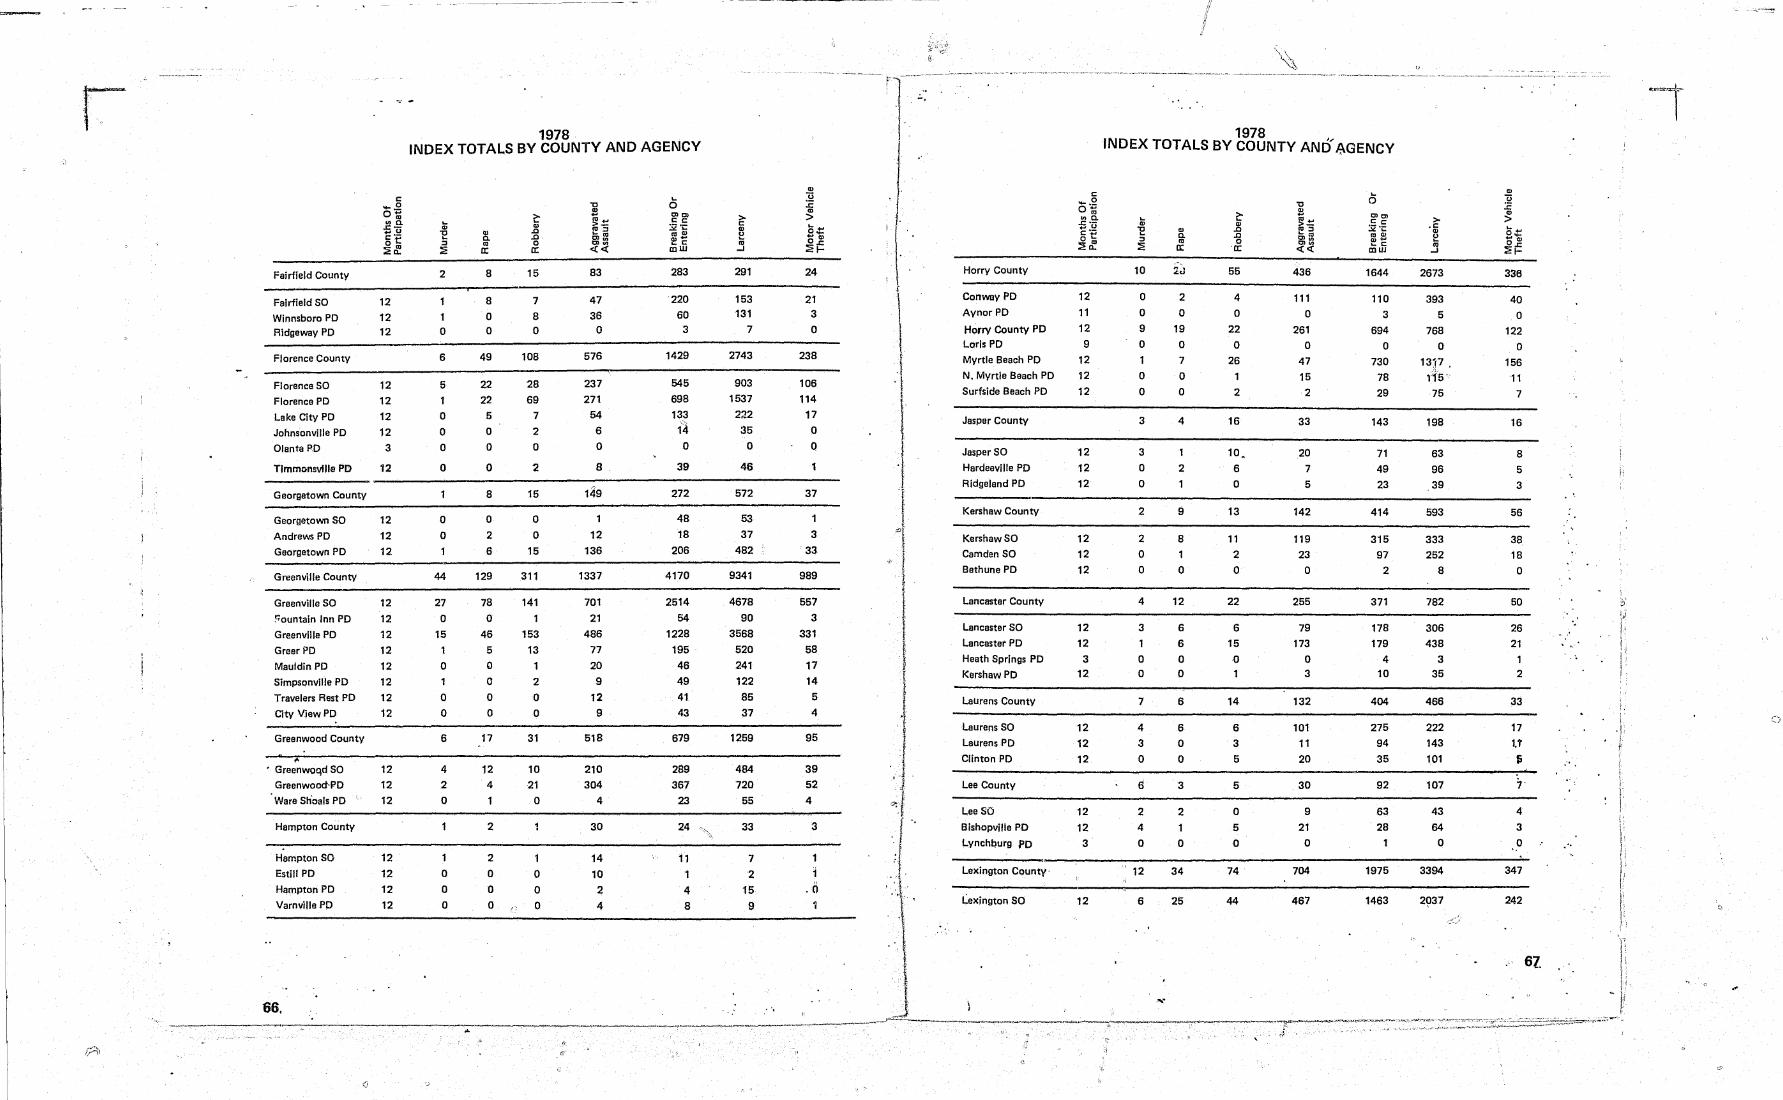
r
Fairfield County
Fairfield SO
Winnsboro PO Ridgeway PO
Florence County
Florence SO
Florence PO
Lake City PO
Johnsonville PO
Olanta PO
Timmonsville PO
Georgetown County
Georgetown SO
Andrews PO
Georgetown PO
Greenville County
Greenville SO
!:;ountain Inn PO
Greenville PO
Greer PO
Mauldin PO
Simpsonville PO
Travelers Rest PO
City View PO
Greenwood County
" • Greenwoqd SO
Greenwood-PO
Ware Shoals PO
Hampton County
Hampton SO
Estill PO
H!!mPton PO
Varnville PO
66,
c 'f-.2 01;; .. a. .c .-+,U c·ot: :2~
12 12 12
12 12 12 12
3
12
12
12 12
12 12 12 12 12 12 12 12
12 12 12
12 12 12 12
1978 INDEX TOTALS BY COUNTY AND AGENCY
2
o
6
5
o o o o
o o
44
27 o
15
1 o 1
o o
6
4
2
o
o o o
OJ a. '" II:
8
8
o o
49
22 22
5
o o
o
8
o 2
6
129
78 o
46 5
o o o o
17
12 4
1
2
2
o o o
c:-Ol .c .c o II:
15
7
8 o
108
28 69
7
2
o 2
15
o
83
47 36 o
576
237 271
54
6 o 8
o 12 15 136
311 1337
141 701 1 21
153 486 13 77
20 2 9
o 12 o 9
31 518
10 210 21 304 o 4
30
1 14 o 10 o 2 o 4
283
220 60
3
1429
545
698 133 1~ o
39
272
48 18
206
4170
2514 54
1228 195 46 49 41 43
679
289 367
23
24
11 1
4 8
- -~----------------------------"""-;'I(-- -----~---~--~---~---- -- ~ - ----~-~-- ~
>c Ol e j
291
153 131
7
2743
903 1537
2:22
;35
o 46
572
53 37
482
9341
4678
90 3568
520
241 122
85 37
1259
484 720
55
33
7
2 15
9
,",
:i 'l 1
..... -.. -.. -~~ ".--.--.- t l-:-~'- ~ --- ---- -. -------- .. -- --- ------~- ---- -.. -------.. ~ .- .. --.. --.. ---.---. -... -----.. -.. --.. -... --- ....... ----- .. --, .... -
1978 , INDEX TOTALS BY COUNTY AND AGENCY
24
21 3
o
238
106 114
17 o Q
37
3
33
989
557 3
331 58
17 14
5
4
95
39 52 4
3
.0
Harry County
Conway PO
Aynor PO
Horry County PO
Loris PO
Myrtle Beach PO
N. Myrtle Beach PO
Surfside Beach PO
Jasper County
Jesper SO
Hardeeville PO
Ridgelend PO
Kershaw County
Kershaw SO
Camden SO
Bethune PO
Lancaster County
Lancaster SO
Lancaster PO
Heath Springs PO
Kershaw PO
Laurens County
Laurens SO
Laurens PO
Clinton PO
Lee County
Lee SO
Bishopville PO
Lynchburg PO
Lexington County·
Lexington SO
12 11 12 9
12 12 12
12 12 12
12 12 12
12 12
3 12
12 12 12
12 12
3
12
10
o o 9
o
o o
3
3
o o
2
2
o o
4
3
o o
7
4
3
o
2
4
o
12
6
,,'
OJ a. '" II:
2 o
19 o 7
o o
4
1
2
1
9
8
o
12
6
6
o o
6
6
o o
3
2
o
34
25
c:-Ol .c .c o II:
55
4 o
22 o
26 1
2
16
10~
6 o
13
11
2
o
22
6
15 o 1
14
6
3
5
5
o 5
o
74
44
436
111 o
261 o
47 15
2
33
20 7
5
142
119 23 o
255
79 173
o 3
132
101
11 20
30
9
21 o
704
467
.... o OlOl Cc
32 'i: '" OJ Ol'" .... c lD UJ
1644
110 3
694 o
730 78 29
143
71 49 23
414
315 97
2
371
178 179
4 10
404
275 94 35
92
63 28
1975
1463
>-.C
OJ e '" ..J
2673
393 5
768 o
1317 ' 115-
75
198
63 96 39
593
333 252
8
782
306 438
3 35
466
222 143 101
107
43 64
o
3394
2037
336
40 o
122 o
156 11
7
16
8
5
3
56
38 18 o
50
26 21
1 2
33
17
1.1
S;
4
3
o
347
242
...
61.
i 'I ;.
c)
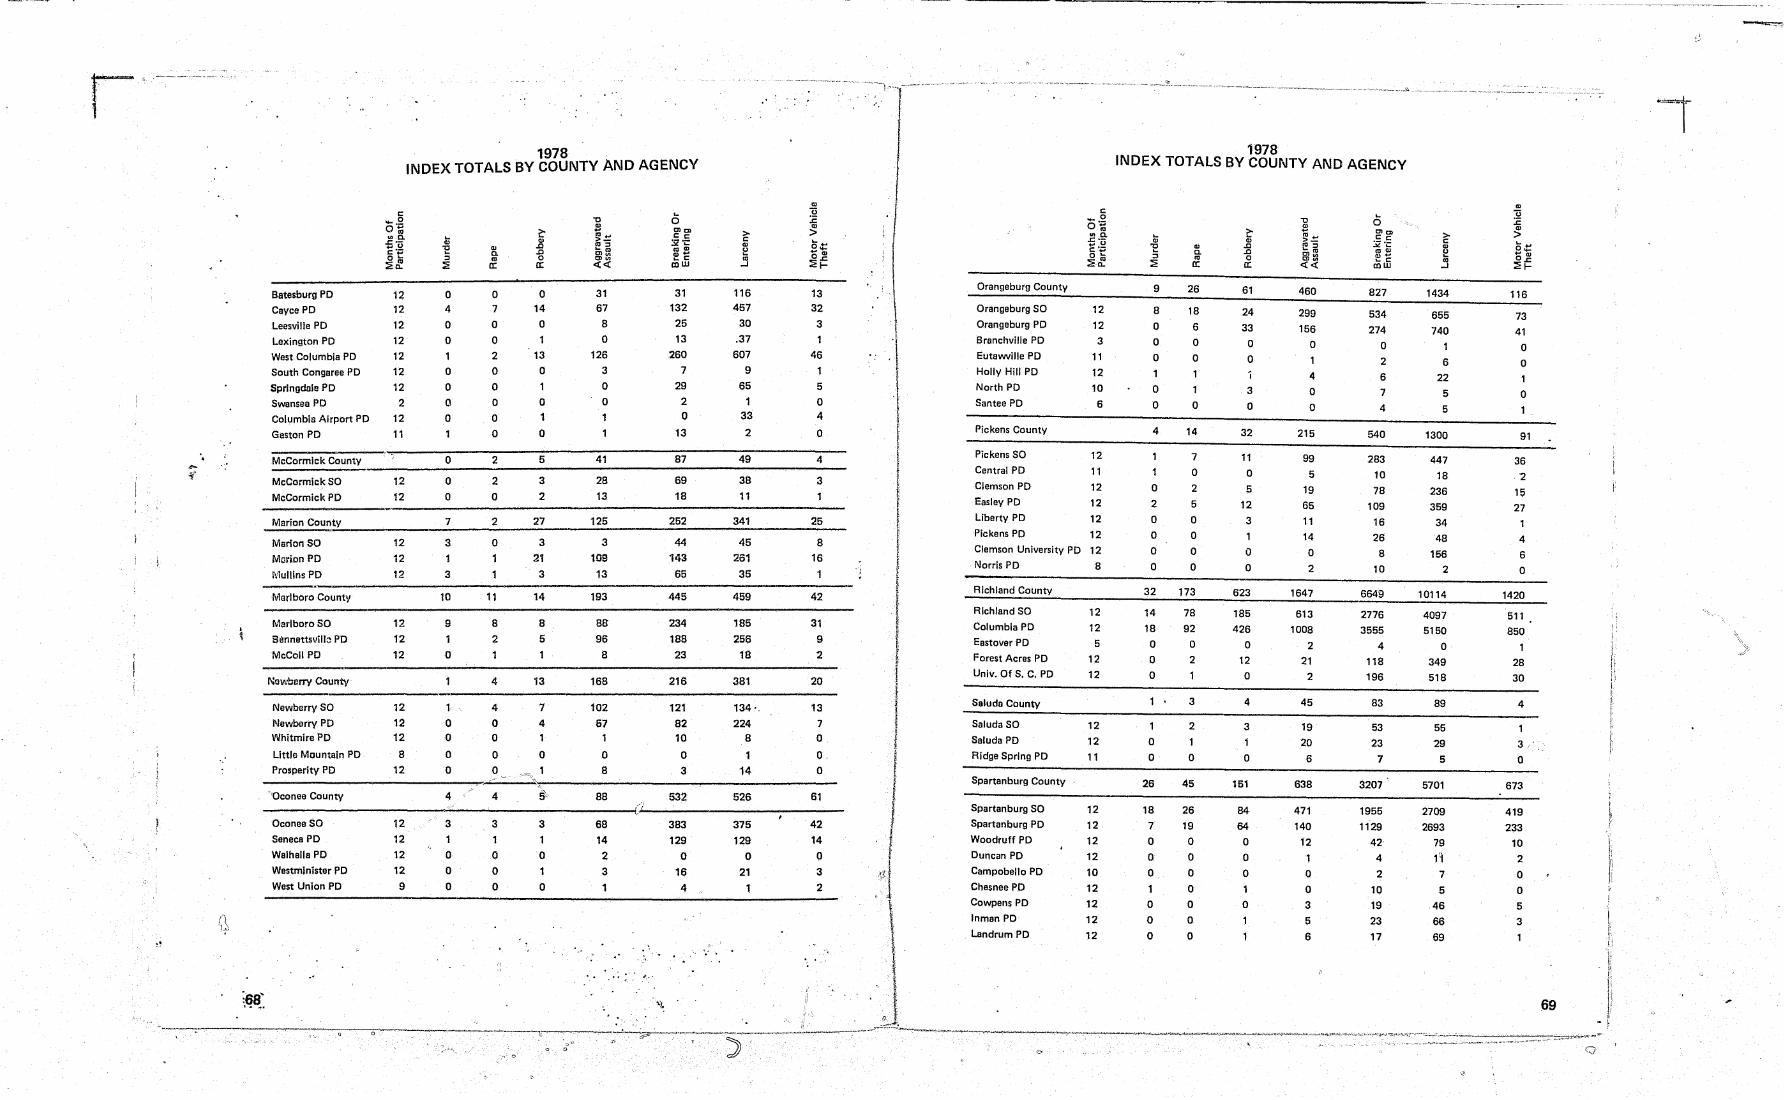
" r
"
. - --- ------_._------------------.-------------- -~ ~.-.~-- -~-
Batesburg PO
Cayce PO
Leesville PO
Lexington PO
West Columbia PO
South Congaree PO
Springdale PO
Swansea PO
Columbia Airport PO
Gaston PO
McCormick County
McCormick SO
McCormick PO
Marion County
Marlon SO
MoriDn PO
Mullins PO
Marlboro County
Marlboro SO
Sennettsvilh PO
McColl PO
NIl\>1.'oerry County
Newberry SO
Newberry PO Whitmire Po
Little Mountain PO
Prosperity PO
"Oconee County
12 12
12
12 12
12 12
2
12 11
12
12
12 12 12
12
12 12
12 12 12
8
12
1978 INDEX TOTALS BY COUNTY AND AGENCY
o 4
o o
o o o o
o
o o
7
3
1
3
10
9
o
o o o o
4
'" 0.
'" a:
~ '" .0
.0 o a:
o 0 7 14 o 0
o 2 13 o 0
o 1
o 0 o 1
o 0
2 5
2 3 o 2
2 27
o 3
1 21
1 3
11 14
8 8 2 5
1
4 13
4 7 o 4 o 1
o 0 o
"0 ~ "' ... >-"'=' "'", Ol", 0>", ««
31 67
8
o 126
3
o o 1
41
28 13
125
3 109 13
193
8S 96
8
168
102
67
o 8
88
... o 0l0l C:c:
3Z -i:: ",CD f!e tOW
31 132
25 13
260 7
29 2
o 13
87
69 18
252
44 143
65
445
234 188 23
216
121 82 10
o 3
532
> c: '" ~ '" ..J
116 457
30 .37
607
9 65
1 33
2
49
38 11
341
45 261
35
459
1S5 256 18
381
134-,
224 8
1
14
526
,,' .
13 32
3
1
46
5
o 4
o
4
3
25
8 16
1
42
31
9
2
20
13 7
o 0,
o
61 /~
--------------------------~------------------------~~~(----------------------------Oconee SO
Senece PO
Walhalla PO
Westmlnlster PO
West Union PO
12 12 12
12
9
3
1 o o o
3 3
1 1
o 0 o o 0
68 14
2
3
1
~,.'
383
129 o
16 4
375
129 o
21
1
42 14 o 3
2
I ,~ ... - ----
.' '
Orangeburg County
Orangeburg SO
Orangeburg PO
Branchville PO
Eutawville PO
Holly Hill PO
North PO
Santee Po
Pickens County
Pickens SO
Central PO
Clemson PO
Easley PO
Liberty PO
Pickens PO
c: -.....2 010 "'0. .c.... u c: ".;:; 0'" ~.~
12 12 3
11
12 10
6
12 11 12 12 12 12
Clemson University PO 12
Norris PO
Richland County
Richland SO
Columbia PO
Eastover PO
Forest Acres PO
Unlv. Of S. C. PO
Saluda County
Saluda SO
Saluda PO
Ridge Spring PO
Spartanburg County
Spartanburg SO
Spartanburg PO
Woodruff PO
Duncan PO
Campobello PO
Chesnee PO
Cowpens PO
Inman PO
8
12 12
5
12 12
12 12 11
12 12 12 12
10
12 12
1978 INDEX TOTALS BY COUNTY AND AGENCY
9
8 o o o 1
o o
4
o 2
o o o o
32
14
18
o o o
o o
26
18 7
o o o 1 o
'" 0.
'" a:
26
18 6
o o
o
14
7
o 2
5
o o o o
173
78 92
o 2
1
3
2
o
45
26
19 o o o o o
~ '" .0 .0 o a:
61
24 33 o o
3
o
32
11
o 5
12
3
o o
623
185 426
o 12
o
4
3
1
o
151
84 64
o o o
o
460
299 156
o 1
4
o o
215
99
5
19 65 11 14
o 2
1647
613 1008
2
21
2
45
19 20
6
638
471 140
12
1
o o 3
o Olo> C:c: ~.~ ",,,, ~c roW
827
534 274
o 2 6
7
4
540
283 10 78
109
16
26 8
10
6649
2776 3555
4
118 196
83
53
23
7
3207 '
1955
1129
42
4
2
10 19
> c: ., ~ '" ..J
1434
655 740
1
6
22 5
5
1300
447 18
236
359
34 48
156
2
10114
4097 5150
o 349
518
89
55
29
5
5701
2709 2693
79 11
7
5 46
66
'" (j :c '" > ...... 0 .... "'", O.c ::!1-
116
73
41 o o 1 o
91
36
16 27
4
6
o
1420
511 850
28 30
4
3/'
o
673
419 233
10
2
o o 5

r' -.-
i F
Lyman PO
Sumter County
Sumter SO
Sumter PO
Union County
Union SO
Union PO
Jonesville PO
WIlIlomnburg County
Williamsburg SO
Hemingway PO
Kingstree PO
Greeleyville PO
York County
York SO
Clover PO
Fort Mill PO
Rock Hill PO
York PO
State Total
10
12 12
12 12 12
12 5
12 1
12 12 12 12 12
1978 INDEX TOTALS BY COUNTY AND AGENCY
L.
'" "C L. ::l :E
. 0
11
9
2
7
5 2
o
6
4
o 2
o
7
4 1 o 2
o
337
'" C-Ol
0::
o
35
27 8
5
2 3
o
3
3
o o o
38
22 o o
16 o
1026
i!" '" ..c
..c o 0::
o
48
-19 29
6
3
3
o
7
3
o 4
o
57
23 1 1
31
2934
o
288
184 104
57
11 44
2
47
29 o
18 o
756
272 10 32
360 82
14179
6
1297
742 555
281
127 148 _
6
111
51 o
60 o
1572
688 42 41
708 93
43356
> c e !l
16
1858
858 1000
375
142 212
21
150
54 o
96 o
2506
840 S8
136 1258 204
71829
--~-- -------
o
152
85 67
29
18 11 o
5
3
o 233
96 6
9 105
18
7991
AGENCIES COVERED BY COUNTY LAW ENFORCEMENT CRIME REPORTS
Bluffton PO Cordova PO Bowman PO Cross Hill PO Brunson PO Oue West PO Burnettown PO Ehrhardt PO Cameron PO Elloree PO Chapin PD Enoree PO Chappells PO Fort Lawn PO Clio PO Gifford PO Coward PQ. Harle ville PO
Hodges PO Jackson PO Jamestown PD Jefferson PO Mayesville PO Nichols PO Norway PO Olar PO
Pamplico PO Pelion PO Pelzer PO Piedmont PO Pinewood PD Quinby PO Ridgeville PO Salley PO
Scranton PO Sellers PO Silverstreet PO Springfield PO Starr PO Stuckey PO Wellford PO Yemassee'pO
AGENCIES NOT PARTICIPATING IN UNIFORM CRIME REPORTS PROGRAM Atlahtic Beal~h PO Bonneau PO
70
Carlisle PO Gnay Court PO
Irmo PO Ninety Six PO
Pacolet PO Pine Ridge PO
Wagener PO West Pelzer PO
--- ----.--- ----~-~------~~- - --,
",'
---~-----------------~--
r r
" ~. ! \
!
I
I! ' J
I I 11 H , i
n I.
i. ' j I
1 j 11
H n t i II 11
II
j::;
j " j!
j
!:, ''''
I: '" " .... I ~
ll."o=,======~~="====~=== __ ~~~~ H 1 !
Ll
! , ?