Embed Size (px)
Citation preview

Table of ContentsTransportation
Agency Profile . . . . . . . . . . . . . . . . . . . . . . . . . . . . . . . . . . . . . . . . . . . . . . . . . . . . . . . . . . . . . . . . . . . . . . . . . . . . . . . . . 1Agency Expenditure Overview . . . . . . . . . . . . . . . . . . . . . . . . . . . . . . . . . . . . . . . . . . . . . . . . . . . . . . . . . . . . . . . . . . . . 4Agency Financing by Fund . . . . . . . . . . . . . . . . . . . . . . . . . . . . . . . . . . . . . . . . . . . . . . . . . . . . . . . . . . . . . . . . . . . . . . . 6Agency Change Summary . . . . . . . . . . . . . . . . . . . . . . . . . . . . . . . . . . . . . . . . . . . . . . . . . . . . . . . . . . . . . . . . . . . . . . . . 12
Program . . . . . . . . . . . . . . . . . . . . . . . . . . . . . . . . . . . . . . . . . . . . . . . . . . . . . . . . . . . . . . . . . . . . . . . . . . . . . . . . . . . 16Multimodal Systems . . . . . . . . . . . . . . . . . . . . . . . . . . . . . . . . . . . . . . . . . . . . . . . . . . . . . . . . . . . . . . . . . . . . . . . . . 16
Activity . . . . . . . . . . . . . . . . . . . . . . . . . . . . . . . . . . . . . . . . . . . . . . . . . . . . . . . . . . . . . . . . . . . . . . . . . . . . . . . . . 16Aeronautics . . . . . . . . . . . . . . . . . . . . . . . . . . . . . . . . . . . . . . . . . . . . . . . . . . . . . . . . . . . . . . . . . . . . . . . . . . . . . . 16
Activity Narrative . . . . . . . . . . . . . . . . . . . . . . . . . . . . . . . . . . . . . . . . . . . . . . . . . . . . . . . . . . . . . . . . . . . . . . 16Activity Expenditure Overview . . . . . . . . . . . . . . . . . . . . . . . . . . . . . . . . . . . . . . . . . . . . . . . . . . . . . . . . . . . 19Activity Financing by Fund . . . . . . . . . . . . . . . . . . . . . . . . . . . . . . . . . . . . . . . . . . . . . . . . . . . . . . . . . . . . . . . 20
Transit and Active Transportation . . . . . . . . . . . . . . . . . . . . . . . . . . . . . . . . . . . . . . . . . . . . . . . . . . . . . . . . . . . 22Activity Narrative . . . . . . . . . . . . . . . . . . . . . . . . . . . . . . . . . . . . . . . . . . . . . . . . . . . . . . . . . . . . . . . . . . . . . . 22Activity Expenditure Overview . . . . . . . . . . . . . . . . . . . . . . . . . . . . . . . . . . . . . . . . . . . . . . . . . . . . . . . . . . . 26Activity Financing by Fund . . . . . . . . . . . . . . . . . . . . . . . . . . . . . . . . . . . . . . . . . . . . . . . . . . . . . . . . . . . . . . . 27
Freight and Rail Safety . . . . . . . . . . . . . . . . . . . . . . . . . . . . . . . . . . . . . . . . . . . . . . . . . . . . . . . . . . . . . . . . . . . . . 29Activity Narrative . . . . . . . . . . . . . . . . . . . . . . . . . . . . . . . . . . . . . . . . . . . . . . . . . . . . . . . . . . . . . . . . . . . . . . 29Activity Expenditure Overview . . . . . . . . . . . . . . . . . . . . . . . . . . . . . . . . . . . . . . . . . . . . . . . . . . . . . . . . . . . 33Activity Financing by Fund . . . . . . . . . . . . . . . . . . . . . . . . . . . . . . . . . . . . . . . . . . . . . . . . . . . . . . . . . . . . . . . 34
Program . . . . . . . . . . . . . . . . . . . . . . . . . . . . . . . . . . . . . . . . . . . . . . . . . . . . . . . . . . . . . . . . . . . . . . . . . . . . . . . . . . . 36State Roads . . . . . . . . . . . . . . . . . . . . . . . . . . . . . . . . . . . . . . . . . . . . . . . . . . . . . . . . . . . . . . . . . . . . . . . . . . . . . . . . . 36
Activity . . . . . . . . . . . . . . . . . . . . . . . . . . . . . . . . . . . . . . . . . . . . . . . . . . . . . . . . . . . . . . . . . . . . . . . . . . . . . . . . . 36Program Planning and Delivery . . . . . . . . . . . . . . . . . . . . . . . . . . . . . . . . . . . . . . . . . . . . . . . . . . . . . . . . . . . . . 36
Activity Narrative . . . . . . . . . . . . . . . . . . . . . . . . . . . . . . . . . . . . . . . . . . . . . . . . . . . . . . . . . . . . . . . . . . . . . . 36Activity Expenditure Overview . . . . . . . . . . . . . . . . . . . . . . . . . . . . . . . . . . . . . . . . . . . . . . . . . . . . . . . . . . . 40Activity Financing by Fund . . . . . . . . . . . . . . . . . . . . . . . . . . . . . . . . . . . . . . . . . . . . . . . . . . . . . . . . . . . . . . . 41
State Road Construction . . . . . . . . . . . . . . . . . . . . . . . . . . . . . . . . . . . . . . . . . . . . . . . . . . . . . . . . . . . . . . . . . . . 43Activity Narrative . . . . . . . . . . . . . . . . . . . . . . . . . . . . . . . . . . . . . . . . . . . . . . . . . . . . . . . . . . . . . . . . . . . . . . 43Activity Expenditure Overview . . . . . . . . . . . . . . . . . . . . . . . . . . . . . . . . . . . . . . . . . . . . . . . . . . . . . . . . . . . 48Activity Financing by Fund . . . . . . . . . . . . . . . . . . . . . . . . . . . . . . . . . . . . . . . . . . . . . . . . . . . . . . . . . . . . . . . 49
Debt Service . . . . . . . . . . . . . . . . . . . . . . . . . . . . . . . . . . . . . . . . . . . . . . . . . . . . . . . . . . . . . . . . . . . . . . . . . . . . . 50Activity Narrative . . . . . . . . . . . . . . . . . . . . . . . . . . . . . . . . . . . . . . . . . . . . . . . . . . . . . . . . . . . . . . . . . . . . . . 50Activity Expenditure Overview . . . . . . . . . . . . . . . . . . . . . . . . . . . . . . . . . . . . . . . . . . . . . . . . . . . . . . . . . . . 53Activity Financing by Fund . . . . . . . . . . . . . . . . . . . . . . . . . . . . . . . . . . . . . . . . . . . . . . . . . . . . . . . . . . . . . . . 54
Operations and Maintenance . . . . . . . . . . . . . . . . . . . . . . . . . . . . . . . . . . . . . . . . . . . . . . . . . . . . . . . . . . . . . . . 55Activity Narrative . . . . . . . . . . . . . . . . . . . . . . . . . . . . . . . . . . . . . . . . . . . . . . . . . . . . . . . . . . . . . . . . . . . . . . 55Activity Expenditure Overview . . . . . . . . . . . . . . . . . . . . . . . . . . . . . . . . . . . . . . . . . . . . . . . . . . . . . . . . . . . 60Activity Financing by Fund . . . . . . . . . . . . . . . . . . . . . . . . . . . . . . . . . . . . . . . . . . . . . . . . . . . . . . . . . . . . . . . 61
Statewide Radio Communications . . . . . . . . . . . . . . . . . . . . . . . . . . . . . . . . . . . . . . . . . . . . . . . . . . . . . . . . . . . 63Activity Narrative . . . . . . . . . . . . . . . . . . . . . . . . . . . . . . . . . . . . . . . . . . . . . . . . . . . . . . . . . . . . . . . . . . . . . . 63Activity Expenditure Overview . . . . . . . . . . . . . . . . . . . . . . . . . . . . . . . . . . . . . . . . . . . . . . . . . . . . . . . . . . . 65Activity Financing by Fund . . . . . . . . . . . . . . . . . . . . . . . . . . . . . . . . . . . . . . . . . . . . . . . . . . . . . . . . . . . . . . . 66
Program . . . . . . . . . . . . . . . . . . . . . . . . . . . . . . . . . . . . . . . . . . . . . . . . . . . . . . . . . . . . . . . . . . . . . . . . . . . . . . . . . . . 68

Local Roads . . . . . . . . . . . . . . . . . . . . . . . . . . . . . . . . . . . . . . . . . . . . . . . . . . . . . . . . . . . . . . . . . . . . . . . . . . . . . . . . . 68Activity . . . . . . . . . . . . . . . . . . . . . . . . . . . . . . . . . . . . . . . . . . . . . . . . . . . . . . . . . . . . . . . . . . . . . . . . . . . . . . . . . 68County State Aid Roads . . . . . . . . . . . . . . . . . . . . . . . . . . . . . . . . . . . . . . . . . . . . . . . . . . . . . . . . . . . . . . . . . . . . 68
Activity Narrative . . . . . . . . . . . . . . . . . . . . . . . . . . . . . . . . . . . . . . . . . . . . . . . . . . . . . . . . . . . . . . . . . . . . . . 68Activity Expenditure Overview . . . . . . . . . . . . . . . . . . . . . . . . . . . . . . . . . . . . . . . . . . . . . . . . . . . . . . . . . . . 71Activity Financing by Fund . . . . . . . . . . . . . . . . . . . . . . . . . . . . . . . . . . . . . . . . . . . . . . . . . . . . . . . . . . . . . . . 72
Municipal State Aid Roads . . . . . . . . . . . . . . . . . . . . . . . . . . . . . . . . . . . . . . . . . . . . . . . . . . . . . . . . . . . . . . . . . 74Activity Narrative . . . . . . . . . . . . . . . . . . . . . . . . . . . . . . . . . . . . . . . . . . . . . . . . . . . . . . . . . . . . . . . . . . . . . . 74Activity Expenditure Overview . . . . . . . . . . . . . . . . . . . . . . . . . . . . . . . . . . . . . . . . . . . . . . . . . . . . . . . . . . . 77Activity Financing by Fund . . . . . . . . . . . . . . . . . . . . . . . . . . . . . . . . . . . . . . . . . . . . . . . . . . . . . . . . . . . . . . . 78
Program . . . . . . . . . . . . . . . . . . . . . . . . . . . . . . . . . . . . . . . . . . . . . . . . . . . . . . . . . . . . . . . . . . . . . . . . . . . . . . . . . . . 79Agency Management . . . . . . . . . . . . . . . . . . . . . . . . . . . . . . . . . . . . . . . . . . . . . . . . . . . . . . . . . . . . . . . . . . . . . . . . 79
Activity . . . . . . . . . . . . . . . . . . . . . . . . . . . . . . . . . . . . . . . . . . . . . . . . . . . . . . . . . . . . . . . . . . . . . . . . . . . . . . . . . 79Agency Services . . . . . . . . . . . . . . . . . . . . . . . . . . . . . . . . . . . . . . . . . . . . . . . . . . . . . . . . . . . . . . . . . . . . . . . . . . 79
Activity Narrative . . . . . . . . . . . . . . . . . . . . . . . . . . . . . . . . . . . . . . . . . . . . . . . . . . . . . . . . . . . . . . . . . . . . . . 79Activity Expenditure Overview . . . . . . . . . . . . . . . . . . . . . . . . . . . . . . . . . . . . . . . . . . . . . . . . . . . . . . . . . . . 83Activity Financing by Fund . . . . . . . . . . . . . . . . . . . . . . . . . . . . . . . . . . . . . . . . . . . . . . . . . . . . . . . . . . . . . . . 84
Building Services . . . . . . . . . . . . . . . . . . . . . . . . . . . . . . . . . . . . . . . . . . . . . . . . . . . . . . . . . . . . . . . . . . . . . . . . . 86Activity Narrative . . . . . . . . . . . . . . . . . . . . . . . . . . . . . . . . . . . . . . . . . . . . . . . . . . . . . . . . . . . . . . . . . . . . . . 86Activity Expenditure Overview . . . . . . . . . . . . . . . . . . . . . . . . . . . . . . . . . . . . . . . . . . . . . . . . . . . . . . . . . . . 89Activity Financing by Fund . . . . . . . . . . . . . . . . . . . . . . . . . . . . . . . . . . . . . . . . . . . . . . . . . . . . . . . . . . . . . . . 90
Additional Documents . . . . . . . . . . . . . . . . . . . . . . . . . . . . . . . . . . . . . . . . . . . . . . . . . . . . . . . . . . . . . . . . . . . . . . . . . . 91MnDOT District Overviews . . . . . . . . . . . . . . . . . . . . . . . . . . . . . . . . . . . . . . . . . . . . . . . . . . . . . . . . . . . . . . . . . . . . 91

Transportation Agency Profile dot.state.mn.us/
AT A GLANCE
• Over 145,000 centerline miles (single roadway, regardless of the number of lanes) including trunk highways and local roads
• 5th largest state highway system in the nation • 4,901 bridges greater than 10 feet in length on Trunk Highway routes (including railroad, pedestrian
and other structures) • More than 95 million vehicle miles driven every day on the state highway system • 50% of state highways and 35% of state bridges are more than 50 years old • 398 construction projects planned in the 20-21 biennium • $21 billion in planned investments for state highways over the next 20 years (MnSHIP) • 5,211 full time equivalent employees as of FY19 • Truck freight traffic projected to increase 30% by 2030 • Greater MN transit ridership needs are projected to increase 45% by 2025
We work with our partners to support: • 3 active Lake Superior and 4 Mississippi River system ports • Transit services in all 80 non-metro counties • 133 publicly owned state-funded airports • 4,420 track miles serving 21 railroad companies, Northstar commuter, and Amtrak passenger service
PURPOSE
Transportation today is about providing access to critical connections for all Minnesotans through managing an efficient, safe, reliable, and accessible system of interconnected modes. Transportation supports a robust quality of life through various modes working together to link people to education, healthcare, jobs, and recreation. Transportation supports a healthy economy, providing for the efficient shipping of raw and finished goods as well as access to jobs. Transportation also plays an important role in the stewardship of our environment by ensuring compliance with environmental laws and policies. The Minnesota Department of Transportation’s (MnDOT’s) work with connected and automated vehicle technology is also helping the agency gain experience and knowledge of new technologies to prepare for the future of transportation. Therefore, MnDOT has adopted the following:
Vision: Minnesota’s multimodal transportation system maximizes the health of people, the environment, and the economy.
Mission: To plan, build, operate, and maintain a safe, accessible, efficient, and reliable multimodal transportation system that connects people to destinations and markets throughout the state, regionally, and around the world.
Funding is provided in four programs with 12 budget activities:
Multimodal Systems Aeronautics Transit Freight and Rail Safety
State Roads Program Planning & Delivery State Road Construction Debt Service Operations and Maintenance Statewide Radio Communications
Local Roads County State Aid Roads Municipal State Aid Roads
Agency Management Agency Services Building Services
State of Minnesota 1 2022-23 Biennial BudgetNovember 2020

BUDGET
Spending includes Trunk Highway fund debt service transfer
Source: Budget Planning & Analysis System (BPAS)
Spending includes Trunk Highway fund debt service transfer
Source: Budget Planning & Analysis System (BPAS)
The primary source of financing for state-owned highways is the trunk highway fund, which is supported by motor fuel taxes, motor vehicle registration fees, and motor vehicle sales taxes. Other sources of transportation funding include federal, transit assistance, county state aid highway, municipal state aid street, state airport, and special revenue funds. In total, less than one percent of the agency’s operating budget prior to FY2018 was directly from the general fund, which supports non-highway modes such as greater Minnesota transit, ports, and rail. Beginning in FY 2018 a portion of transportation-related revenues, historically deposited in the general fund, are now dedicated to fund transportation purposes.
STRATEGIES
MnDOT’s strategic initiatives demonstrate our agency’s critical role in creating a safe, accessible, efficient and reliable transportation system. MnDOT strives to advance statewide strategic priorities and continue to build and maintain a comprehensive transportation system that serves Minnesotans now and into the future - including enhancing pedestrian safety, reducing transportation’s impact on greenhouse gas emissions, and cultivating a more diverse transportation industry and workforce. As stewards of the transportation system, we’re committed to the following objectives:
1. Open Decision-Making: Make transportation system decisions through processes that are inclusive, engaging, and supported by data and analysis. Provide for and support coordination, collaboration, and innovation. Ensure efficient and effective use of resources.
2. Transportation Safety: Safeguard transportation users as well as the communities the systems travel through. Apply proven strategies to reduce fatalities and serious injuries for all modes. Foster a culture of transportation safety in Minnesota (http://www.minnesotatzd.org/).
3. Critical Connections: Maintain and improve multimodal transportation connections essential for Minnesotans’ prosperity and quality of life. Strategically consider new connections that help meet performance targets and maximize social, economic, and environmental benefits.
4. System Stewardship: Strategically build, manage, maintain, and operate all transportation assets. Rely on system data and analysis, performance measures and targets, agency and partners’ needs, and public expectations to inform decisions. Use technology and innovation to get the most out of investments and
State of Minnesota 2 2022-23 Biennial BudgetNovember 2020

maintain system performance. Increase the resiliency of the transportation system and adapt to changing needs.
5. Healthy Communities: Make fiscally responsible decisions that respect and complement the natural, cultural, social, and economic context. Integrate land uses and transportation systems to leverage public and private investments.
MnDOT seeks to advance three goal areas identified in the MnDOT Strategic Operating Plan:
1. Operational Excellence: Ensure the safety and security of MnDOT employees and assets. Make forward-looking, customer-driven improvements. Be nimble and response. Maximize existing resources.
2. Customer Trust: Strengthen relationships. Make investments through open decision-making processes. Expand access to contracting and employment opportunities.
3. Workforce Excellence: Plan MnDOT’s future workforce Development, engage and retain MnDOT employees. Improve the experience of prospective and new employees.
The Minnesota Department of Transportation requires that the principles of “Complete Streets” be considered at all phases of planning and project development in the establishment, development, operation, and maintenance of a comprehensive, integrated, and connected multimodal transportation system (http://www.dot.state.mn.us/policy/operations/op004.html).
The Department of Transportation’s legal authority comes from: Minnesota Constitution, Article XIV, Public Highway System (https://www.revisor.mn.gov/constitution) Powers of Road Authorities, M.S. 160 (https://www.revisor.mn.gov/statutes/?id=160) Trunk Highways, M.S. 161 (https://www.revisor.mn.gov/statutes/?id=161) Administration of State Aid Road Systems, M.S. 162 (https://www.revisor.mn.gov/statutes/?id=162) Responsibilities Related to Bridges, M.S. 165 (https://www.revisor.mn.gov/statutes/?id=165) Trunk Highway Bonds, M.S. 167 (https://www.revisor.mn.gov/statutes/?id=167) Traffic Regulation, M.S. 169 (https://www.revisor.mn.gov/statutes/?id=169) Signs and Billboards Along Highways, M.S. 173 (https://www.revisor.mn.gov/statutes/?id=173) Department of Transportation, M.S. 174 (https://www.revisor.mn.gov/statutes/?id=174) Enforcement of Prevailing Wage, M.S. 177.44 (https://www.revisor.mn.gov/statutes/?id=177.44) Rail Transportation, M.S. 218 (https://www.revisor.mn.gov/statutes/?id=218) Railroad Safety, M.S. 219 (https://www.revisor.mn.gov/statutes/?id=219) Regulation of Motor Carriers, M.S. 221 (https://www.revisor.mn.gov/statutes/?id=221) Rail Service Improvement and Rail Bank, M.S. 222 (https://www.revisor.mn.gov/statutes/?id=222) Aeronautics, M.S. 360 (https://www.revisor.mn.gov/statutes/?id=360)
State of Minnesota 3 2022-23 Biennial BudgetNovember 2020

Transportation Agency Expenditure Overview
(Dollars in Thousands)
Actual
FY18
Actual
FY19
Actual
FY20
Estimate
FY21
Forecas
FY22
t Base
FY23
Expenditures by Fund
1000 - General 7,875 27,032 20,167 21,884 19,317 19,317
1050 - Transit Assistance 88,389 77,703 71,192 81,553 71,046 73,546
2000 - Restrict Misc Special Revenue 98,801 108,200 127,508 78,056 76,685 71,081
2001 - Other Misc Special Revenue 4,444 7,150 5,950 6,862 6,753 6,557
2050 - Environment & Natural Resources 46 97 65 137
2500 - Municipal State Aid Street 193,623 198,383 237,270 205,812 217,867 222,538
2600 - County State Aid Highway 731,088 781,514 795,902 817,997 865,222 883,277
2700 - Trunk Highway 1,640,971 1,796,050 1,652,140 1,862,382 1,734,453 1,732,542
2710 - Highway Users Tax Distribution 117 135 115 132 132 132
2720 - State Airports 30,079 25,085 21,607 37,965 27,378 25,378
2721 - Hanger Loan Revolving 800 1,126 1,126
2722 - Air Transportation Revolving 888 536 1,197 1,095 1,102 941
3000 - Federal 253,279 244,156 289,472 978,461 951,791 923,560
3010 - Coronavirus Relief 750
3520 - Transportation-Loc Bridge&Road 779 6,436 17,232 18,896 19,351
4900 - 911 Emergency 9,359 9,987 9,309 10,041 9,675 9,675
Total 3,059,760 3,277,932 3,239,454 4,120,359 4,000,317 3,987,895
Biennial Change 1,022,120 628,399
Biennial % Change 16 9
Expenditures by Program
Multimodal Systems 258,333 248,761 252,642 680,275 739,681 698,669
State Roads 1,660,284 1,792,837 1,673,774 1,917,524 1,763,348 1,768,265
Local Roads 1,071,990 1,138,030 1,217,467 1,396,413 1,392,932 1,416,612
Agency Management 69,153 98,304 95,571 126,147 104,356 104,349
Total 3,059,760 3,277,932 3,239,454 4,120,359 4,000,317 3,987,895
Expenditures by Category
Compensation 440,853 465,981 489,436 514,770 516,979 517,191
Operating Expenses 378,434 465,276 452,340 585,961 542,028 534,595
Grants, Aids and Subsidies 1,252,873 1,297,331 1,385,436 1,933,888 1,951,104 1,942,087
Capital Outlay-Real Property 978,461 1,032,796 902,792 1,065,281 974,500 980,066
State of Minnesota 4 2022-23 Biennial BudgetNovember 2020

Transportation Agency Expenditure Overview
(Dollars in Thousands)
Actual
FY18
Actual
FY19
Actual
FY20
Estimate
FY21
Forecas
FY22
t Base
FY23
Other Financial Transaction 9,139 16,548 9,449 20,459 15,706 13,956
Total 3,059,760 3,277,932 3,239,454 4,120,359 4,000,317 3,987,895
Total Agency Expenditures 3,059,760 3,277,932 3,239,454 4,120,359 4,000,317 3,987,895
Internal Billing Expenditures 8
Expenditures Less Internal Billing 3,059,760 3,277,924 3,239,454 4,120,359 4,000,317 3,987,895
Full-Time Equivalents 4,965.04 5,136.97 5,206.62 5,242.60 5,215.63 5,212.58
State of Minnesota 5 2022-23 Biennial BudgetNovember 2020

Transportation Agency Financing by Fund
(Dollars in Thousands)
Actual
FY18
Actual
FY19
Actual
FY20
Estimate
FY21
Forecas
FY22
t Base
FY23
1000 - GeneralBalance Forward In 1,892 4,042 1,404 2,751 500 500
Direct Appropriation 19,783 34,516 21,558 19,691 19,375 19,375
Transfers In 4,038 1,367 1,367 1,200 930 930
Transfers Out 14,104 11,416 1,414 1,258 988 988
Cancellations 216
Balance Forward Out 3,734 1,261 2,749 500 500 500
Expenditures 7,875 27,032 20,167 21,884 19,317 19,317
Biennial Change in Expenditures 7,144 (3,417)
Biennial % Change in Expenditures 20 (8)
Full-Time Equivalents 11.72 13.47 15.18 15.72 14.12 14.12
1050 - Transit AssistanceBalance Forward In 73,495 54,829 51,401 45,308 33,537 34,829
Receipts 67,650 69,610 65,106 69,790 72,346 73,820
Transfers In 416 416 416 416 416 416
Transfers Out 449 433 423 424 424 424
Balance Forward Out 52,723 46,720 45,308 33,537 34,829 35,095
Expenditures 88,389 77,703 71,192 81,553 71,046 73,546
Biennial Change in Expenditures (13,347) (8,153)
Biennial % Change in Expenditures (8) (5)
Full-Time Equivalents 3.55 3.20 3.56 3.56 3.00 3.00
2000 - Restrict Misc Special RevenueBalance Forward In 57,392 78,824 77,324 45,026 26,376 20,208
Receipts 99,972 85,083 94,917 59,058 70,217 64,993
Transfers In 611 1,600 4,706 1
Transfers Out 10 1,000 4,706 1
Net Loan Activity 591 (202) 296 348 300 300
Balance Forward Out 59,757 56,105 45,030 26,376 20,208 14,420
Expenditures 98,801 108,200 127,508 78,056 76,685 71,081
Biennial Change in Expenditures (1,438) (57,798)
Biennial % Change in Expenditures (1) (28)
Full-Time Equivalents 52.50 43.56 42.21 40.32 38.22 36.42
State of Minnesota 6 2022-23 Biennial BudgetNovember 2020

Transportation Agency Financing by Fund
(Dollars in Thousands)
Actual
FY18
Actual
FY19
Actual
FY20
Estimate
FY21
Forecas
FY22
t Base
FY23
2001 - Other Misc Special RevenueBalance Forward In 3,167 2,578 8,791 8,962 8,574 8,458
Receipts 3,859 5,391 6,119 6,474 6,637 6,536
Balance Forward Out 2,582 819 8,961 8,574 8,458 8,437
Expenditures 4,444 7,150 5,950 6,862 6,753 6,557
Biennial Change in Expenditures 1,217 498
Biennial % Change in Expenditures 11 4
Full-Time Equivalents 2.34 6.71 9.33 10.05 10.05 10.05
2050 - Environment & Natural ResourcesBalance Forward In 299 202 137
Direct Appropriation 345
Balance Forward Out 299 202 137
Expenditures 46 97 65 137
Biennial Change in Expenditures 59 (202)
Biennial % Change in Expenditures 41 (100)
Full-Time Equivalents 0.37 1.05 0.68 0.82
2400 - EndowmentBalance Forward In 7,654 7,771
Receipts 116 182
Balance Forward Out 7,771 7,953
2500 - Municipal State Aid StreetBalance Forward In 182,918 184,636 182,395 159,205 159,205 159,205
Direct Appropriation 196,866 197,445 216,063 205,836 217,891 222,562
Transfers Out 16 24 19 24 24 24
Cancellations 1,552 1,361 1,964
Balance Forward Out 184,593 182,313 159,205 159,205 159,205 159,205
Expenditures 193,623 198,383 237,270 205,812 217,867 222,538
Biennial Change in Expenditures 51,076 (2,677)
Biennial % Change in Expenditures 13 (1)
State of Minnesota 7 2022-23 Biennial BudgetNovember 2020

Transportation Agency Financing by Fund
(Dollars in Thousands)
Actual
FY18
Actual
FY19
Actual
FY20
Estimate
FY21
Forecas
FY22
t Base
FY23
Full-Time Equivalents 17.11 16.80 15.53 15.53 15.53 15.53
2600 - County State Aid HighwayBalance Forward In 621,979 674,519 678,068 735,034 735,034 735,034
Direct Appropriation 786,424 787,198 858,698 818,073 865,298 883,353
Transfers In 2,000 2,000
Transfers Out 51 76 61 76 76 76
Cancellations 4,885 4,321 5,769
Balance Forward Out 674,380 677,807 735,034 735,034 735,034 735,034
Expenditures 731,088 781,514 795,902 817,997 865,222 883,277
Biennial Change in Expenditures 101,297 134,600
Biennial % Change in Expenditures 7 8
Full-Time Equivalents 47.97 50.91 52.03 52.03 52.03 52.03
2700 - Trunk HighwayBalance Forward In 49,025 220,993 64,221 184,942 35,309 31,623
Direct Appropriation 1,973,481 1,839,213 1,930,422 1,943,136 1,905,767 1,938,235
Open Appropriation 8,632 9,360 8,409 9,866 9,866 9,866
Receipts 43,681 37,450 43,849 38,507 37,907 37,907
Transfers In 375,402 432,916 418,545 329,035 336,331 336,955
Transfers Out 584,262 646,515 627,053 505,307 557,796 592,382
Cancellations 45,710 36,367 1,314 102,488 1,308 1,932
Balance Forward Out 179,276 61,000 184,938 35,309 31,623 27,730
Expenditures 1,640,971 1,796,050 1,652,140 1,862,382 1,734,453 1,732,542
Biennial Change in Expenditures 77,500 (47,527)
Biennial % Change in Expenditures 2 (1)
Full-Time Equivalents 4,704.98 4,880.22 4,887.47 4,907.80 4,893.57 4,893.28
2710 - Highway Users Tax DistributionOpen Appropriation 2,225,194 2,288,263 2,346,805 2,394,469 2,534,972 2,589,612
Transfers Out 2,225,077 2,288,128 2,346,690 2,394,338 2,534,840 2,589,481
Expenditures 117 135 115 132 132 132
Biennial Change in Expenditures (4) 17
State of Minnesota 8 2022-23 Biennial BudgetNovember 2020

Transportation Agency Financing by Fund
(Dollars in Thousands)
Actual
FY18
Actual
FY19
Actual
FY20
Estimate
FY21
Forecas
FY22
t Base
FY23
Biennial % Change in Expenditures (2) 7
2720 - State AirportsBalance Forward In 1,075 7,958 7,321 11,087 2,000
Direct Appropriation 35,812 22,921 25,332 28,832 25,332 25,332
Open Appropriation 45 48 42 46 46 46
Transfers In 12,703 366
Transfers Out 12,703 397
Cancellations 78
Balance Forward Out 6,852 5,732 11,088 2,000
Expenditures 30,079 25,085 21,607 37,965 27,378 25,378
Biennial Change in Expenditures 4,407 (6,816)
Biennial % Change in Expenditures 8 (11)
Full-Time Equivalents 32.56 32.82 34.62 34.62 34.62 34.62
2721 - Hanger Loan RevolvingBalance Forward In 2,728 3,072 2,311 1,572 1,872 2,172
Net Loan Activity 344 (761) 387 300 300 300
Balance Forward Out 2,272 1,185 1,572 1,872 2,172 2,472
Expenditures 800 1,126 1,126
Biennial Change in Expenditures (800) (1,126)
Biennial % Change in Expenditures (42)
2722 - Air Transportation RevolvingBalance Forward In 573 677 1,136 680 335 335
Receipts 912 949 742 750 1,102 1,104
Balance Forward Out 597 1,090 681 335 335 498
Expenditures 888 536 1,197 1,095 1,102 941
Biennial Change in Expenditures 868 (249)
Biennial % Change in Expenditures 61 (11)
3000 - FederalBalance Forward In 2,454 1,495 2,165 293
State of Minnesota 9 2022-23 Biennial BudgetNovember 2020

Transportation Agency Financing by Fund
(Dollars in Thousands)
Actual
FY18
Actual
FY19
Actual
FY20
Estimate
FY21
Forecas
FY22
t Base
FY23
Receipts 251,844 243,261 287,608 978,168 951,791 923,560
Internal Billing Receipts 351 396 486 394 394 394
Transfers Out 845 0 8
Balance Forward Out 172 600 292
Expenditures 253,279 244,156 289,472 978,461 951,791 923,560
Biennial Change in Expenditures 770,499 607,418
Biennial % Change in Expenditures 155 48
Full-Time Equivalents 44.16 39.80 100.79 116.93 109.27 108.31
3010 - Coronavirus ReliefDirect Appropriation 750 0 0
Expenditures 750
Biennial Change in Expenditures 750 (750)
Biennial % Change in Expenditures
3520 - Transportation-Loc Bridge&RoadBalance Forward In 12,576 24,528 29,281 23,281 17,281
Receipts 12,576 12,730 11,188 11,232 12,896 13,351
Balance Forward Out 12,576 24,528 29,281 23,281 17,281 11,281
Expenditures 779 6,436 17,232 18,896 19,351
Biennial Change in Expenditures 22,889 14,579
Biennial % Change in Expenditures 62
4900 - 911 EmergencyBalance Forward In 345 366
Transfers In 9,650 9,662 9,675 9,675 9,675 9,675
Transfers Out 16
Cancellations 5
Balance Forward Out 291 366
Expenditures 9,359 9,987 9,309 10,041 9,675 9,675
Biennial Change in Expenditures 4 0
Biennial % Change in Expenditures 0 0
Full-Time Equivalents 47.78 48.43 45.22 45.22 45.22 45.22
State of Minnesota 10 2022-23 Biennial BudgetNovember 2020

Transportation Agency Financing by Fund
(Dollars in Thousands)
Actual
FY18
Actual
FY19
Actual
FY20
Estimate
FY21
Forecas
FY22
t Base
FY23
6000 - Miscellaneous AgencyBalance Forward In 1
Receipts 0 0
Transfers Out 1 0
State of Minnesota 11 2022-23 Biennial BudgetNovember 2020

Transportation Agency Change Summary
(Dollars in Thousands)
FY21 FY22 FY23Biennium2022-23
Direct
Fund: 1000 - GeneralFY2021 Appropriations 19,691 19,691 19,691 39,382
Base Adjustments
All Other One-Time Appropriations (316) (316) (632)
Forecast Base 19,691 19,375 19,375 38,750
Fund: 2500 - Municipal State Aid StreetFY2021 Appropriations 216,671 216,671 216,671 433,342
Base Adjustments
Forecast Open Appropriation Adjustment (10,835) 1,220 5,891 7,111
Forecast Base 205,836 217,891 222,562 440,453
Fund: 2600 - County State Aid HighwayFY2021 Appropriations 862,708 862,708 862,708 1,725,416
Base Adjustments
Forecast Open Appropriation Adjustment (44,635) 2,590 20,645 23,235
Forecast Base 818,073 865,298 883,353 1,748,651
Fund: 2700 - Trunk HighwayFY2021 Appropriations 1,943,136 1,943,136 1,943,136 3,886,272
Base Adjustments
All Other One-Time Appropriations (12,376) (13,870) (26,246)
November Forecast Adjustment (24,993) 8,969 (16,024)
Forecast Base 1,943,136 1,905,767 1,938,235 3,844,002
Fund: 2720 - State AirportsFY2021 Appropriations 28,832 28,832 28,832 57,664
Base Adjustments
All Other One-Time Appropriations (3,500) (3,500) (7,000)
Forecast Base 28,832 25,332 25,332 50,664
Fund: 3010 - Coronavirus ReliefFY2021 Appropriations 750 750 750 1,500
Base Adjustments
All Other One-Time Appropriations (750) (750) (1,500)
Forecast Base 750 0 0 0
Open
State of Minnesota 12 2022-23 Biennial BudgetNovember 2020

Transportation Agency Change Summary
(Dollars in Thousands)
FY21 FY22 FY23Biennium2022-23
Fund: 2700 - Trunk HighwayBase Adjustments
Forecast Open Appropriation Adjustment 9,866 9,866 9,866 19,732
Forecast Base 9,866 9,866 9,866 19,732
Fund: 2710 - Highway Users Tax DistributionFY2021 Appropriations 2,310,197 2,310,197 2,310,197 4,620,394
Base Adjustments
Forecast Open Appropriation Adjustment 84,272 224,775 279,415 504,190
Forecast Base 2,394,469 2,534,972 2,589,612 5,124,584
Fund: 2720 - State AirportsBase Adjustments
Forecast Open Appropriation Adjustment 46 46 46 92
Forecast Base 46 46 46 92
Dedicated
Fund: 1050 - Transit AssistancePlanned Spending 81,553 71,046 73,546 144,592
Forecast Base 81,553 71,046 73,546 144,592
Fund: 2000 - Restrict Misc Special RevenuePlanned Spending 77,856 76,485 70,881 147,366
Forecast Base 77,856 76,485 70,881 147,366
Fund: 2001 - Other Misc Special RevenuePlanned Spending 6,862 6,753 6,557 13,310
Forecast Base 6,862 6,753 6,557 13,310
Fund: 2700 - Trunk HighwayPlanned Spending 14,934 14,157 14,176 28,333
Forecast Base 14,934 14,157 14,176 28,333
Fund: 2722 - Air Transportation RevolvingPlanned Spending 1,095 1,102 941 2,043
Forecast Base 1,095 1,102 941 2,043
Fund: 3000 - FederalPlanned Spending 978,461 951,791 923,560 1,875,351
State of Minnesota 13 2022-23 Biennial BudgetNovember 2020

Transportation Agency Change Summary
(Dollars in Thousands)
FY21 FY22 FY23Biennium2022-23
Forecast Base 978,461 951,791 923,560 1,875,351
Fund: 3520 - Transportation-Loc Bridge&RoadPlanned Spending 17,232 18,896 19,351 38,247
Forecast Base 17,232 18,896 19,351 38,247
Revenue Change Summary
Dedicated
Fund: 1050 - Transit AssistanceForecast Revenues 69,790 72,346 73,820 146,166
Fund: 2000 - Restrict Misc Special RevenueForecast Revenues 59,058 70,217 64,993 135,210
Fund: 2001 - Other Misc Special RevenueForecast Revenues 6,474 6,637 6,536 13,173
Fund: 2700 - Trunk HighwayForecast Revenues 38,507 37,907 37,907 75,814
Fund: 2722 - Air Transportation RevolvingForecast Revenues 750 1,102 1,104 2,206
Fund: 3000 - FederalForecast Revenues 978,168 951,791 923,560 1,875,351
Fund: 3520 - Transportation-Loc Bridge&RoadForecast Revenues 11,232 12,896 13,351 26,247
Non-Dedicated
Fund: 2500 - Municipal State Aid StreetForecast Revenues 1,120 1,162 1,162 2,324
Fund: 2600 - County State Aid HighwayForecast Revenues 38,640 40,132 40,401 80,533
Fund: 2700 - Trunk HighwayForecast Revenues 386,523 529,340 622,294 1,151,634
State of Minnesota 14 2022-23 Biennial BudgetNovember 2020

Transportation Agency Change Summary
(Dollars in Thousands)
FY21 FY22 FY23Biennium2022-23
Fund: 2710 - Highway Users Tax DistributionForecast Revenues 2,738 2,806 2,807 5,613
Fund: 2720 - State AirportsForecast Revenues 9,724 9,334 9,584 18,918
State of Minnesota 15 2022-23 Biennial BudgetNovember 2020

Transportation Budget Activity Narrative
Program: Multimodal Systems Activity: Aeronautics dot.state.mn.us/aero/
AT A GLANCE
• More than 375 airports in Minnesota: o 133 publicly owned airports that receive state funds o 6 privately owned airports for public use, 67 privately owned for private use o 30 key airports capable of supporting business jets, airfreight and airlines o Nine airports provide scheduled airline service: Minneapolis-St. Paul, Rochester, Duluth, St.
Cloud, Brainerd, International Falls, Thief River Falls, Bemidji, and Hibbing o Numerous seaplane bases and heliports, including hospital heliports
• General aviation results in $1.6 billion in annual economic activity and 13,147 jobs (excludes Minneapolis-St. Paul)
• More than 70 percent of Minnesota public airports receive Federal Aviation Administration Airport Improvement Program funds
• 55 percent of public airports are owned by a city with a population less than 5,000 people • More than 7,000 Minnesota-registered aircraft • More than 12,000 licensed pilots • The number of unmanned aircraft systems (UAS, commonly known as drones) is increasing rapidly • More than 350 commercial operators provide: agricultural spraying, aerial photography, UAS services,
flight instruction, aircraft maintenance and emergency response • Statewide navigational systems maintained by MnDOT include:
o 40 Instrument Landing Systems (ILS) o 36 Very High Frequency Omni-Directional Radio-Range Systems and Distance Measuring
Equipment (VOR/DME) o 80 automated weather observation stations (AWOS)
PURPOSE & CONTEXT
Aviation and the associated infrastructure (airports, weather stations, navigational tools, air highways) touches every corner of the state every day. Aviation infrastructure allows time-critical connections to destinations for people, products, and businesses of Minnesota. It is a key component of our multimodal transportation system within the state, region, and around the world. From local weather forecasting to critical lifesaving medical services, Minnesotans rely on aviation in unexpected ways.
Passenger travel is just the beginning of how Minnesotans use aviation. Farmers reap benefits from agricultural spraying, increasing crop yields through more efficient fertilizing, and aerial firefighting, mapping, and patrolling of utility lines help protect forested regions. Mail and package deliveries move goods to every corner of the state. Drones provide a cost-effective way to conduct a variety of tasks, from bridge inspections to search and rescue. Emergency response and patient transport services utilize heliports and runways at hospitals as well as airfields. Weather data collected by aviation infrastructure is relied on by anyone who needs a forecast specific to their community. Aviation infrastructure is a benefit to every Minnesotan and a tool people and businesses rely on.
In addition to being an essential asset to communities and businesses throughout the state, the aviation system is a significant economic generator. The Statewide Airport Economic Impact Study (http://www.dot.state.mn.us/airport-economic-study/index.html) highlights how each airport influences the
State of Minnesota 16 2022-23 Biennial BudgetNovember 2020

economics of its community from Ada to Worthington. The study includes a detailed analysis for 126 of the 133 airports in Minnesota and provides voluminous data to validate local airport financial contributions beyond the immeasurable benefit to overall economic vitality to every type of community supporting the full diversity of Minnesota.
SERVICES PROVIDED
As the state aviation agency, MnDOT: • Enforces state and federal safety standards through inspection and licensure of airports as well as
commercial operators. Every airport and sea base require inspection every 3 years, tall towers require permits, and commercial activity requires authorization to ensure the safety of the public.
• Provides training to aircraft mechanics, seaplane pilots, and the diverse range of airport professionals. • Registers drones and monitors the rapidly exploding development of people movers, unmanned aircraft,
and commercial applications of remote technology. • Collects aircraft registration and aircraft sales taxes to help ensure the long term viability of the State
Airport Fund. • Plans and promotes the statewide system of airports as well as providing technical resources and
expertise to communities. • Owns, operates, and maintains a statewide system of weather, navigational equipment, and
instrumentation to increase the safety and efficiency of our airspace. • Supports state government in need of efficient, cost effective travel, through the use of passenger
aircraft.
In addition, MnDOT is the ambassador and messenger for aviation across Minnesota. The State Aviation System Plan (SASP) (http://www.dot.state.mn.us/aero/planning/sasp.html) benchmarks the state of aviation in Minnesota, establishes the current condition of the airport system, and provides investment guidance by identifying performance gaps, quantifying needs, and promoting efficiency in operations. In September 2020, MnDOT will begin the next phase of the SASP, which will focus on data collection, development of a new online dashboard to clearly identify the current status of planning data, and generate reports based on the data collected.
MnDOT also Distributes State Airport and Federal Funds to local governments to ensure we are maximizing federal monies in support of development, maintenance, and operations of local airports. Each year MnDOT oversees the distribution of approximately $20 million in state funding and $55 million in federal funding to local communities for construction, maintenance, and operations of local airports.
RESULTS
MnDOT conducted 53 airport/heliport inspections over the last year and averages over 50 per year for the last decade. There were 656 Commercial Operators who were approved to provide for-hire aviation services. A single tall tower permit was issued which has seen a decreasing trend since the peak of 163 permits in 2009. Each of these activities requires a review of the location, purpose, and impact on surrounding area and the safety of the public.
MnDOT has a commitment to the ongoing safe operations within aviation as well as the promotion of the many careers within the airport community. We strive to leverage the skills and knowledge of professionals who can share best practices and lessons learned. Our staff supports the mission of three major conferences a year.
• Our maintenance conference trains 400 mechanics and vendors up to licensure standard every year. The conference allows technicians to comply with their license requirements while learning about new technology that is otherwise more difficult to find.
• The annual 3-day seaplane safety seminar brings 150 pilots to central Minnesota for skill-building to hone their safety knowledge and practice.
State of Minnesota 17 2022-23 Biennial BudgetNovember 2020

• The Minnesota Airports Conference provides an annual opportunity for 300 industry and government officials to exchange ideas on funding, trends, airport management, operations, maintenance, and best practices. The program also sponsors year round activities to highlight careers in the industry.
MnDOT has seen a significant expansion of drones across a multitude of applications. There are now 225 businesses operating drones, 1,000 drones have been properly registered, and MnDOT alone has about 700 mission hours flying drone aircraft. Minnesota statutes require aircraft used in the airspace over Minnesota to be registered with MnDOT.
Navigational Aids (Nav Aids) and Automated Weather Observing Systems (AWOS) may be the most impactful component of the aviation system to the everyday lives of Minnesotans. The 450 Nav Aids and 80 AWOS are the back bone of being able to move across the state and they impact us well beyond aviation. In addition to providing the tools required to take off, fly and land, these are the very tools that allow weather forecasting in local communities.
The figure on the left shows the coverage of both state and federal AWOS, and the image on the right shows just the federal AWOS coverage.
Chapter 360 Airports and Aeronautics M.S. 360.011-360.93 (https://www.revisor.mn.gov/statutes/?id=360) provides the legal authority for this activity.
State of Minnesota 18 2022-23 Biennial BudgetNovember 2020

Aeronautics Activity Expenditure Overview
(Dollars in Thousands)
Actual
FY18
Actual
FY19
Actual
FY20
Estimate
FY21
Forecas
FY22
t Base
FY23
Expenditures by Fund
2700 - Trunk Highway 1,463 1,494 1,039 1,235 1,650 1,650
2720 - State Airports 30,035 25,038 21,565 37,919 27,332 25,332
2721 - Hanger Loan Revolving 800 1,126 1,126
2722 - Air Transportation Revolving 888 536 1,197 1,095 1,102 941
3000 - Federal 52,719 43,230 58,425 341,575 450,000 450,000
Total 85,905 71,424 83,351 381,824 480,084 477,923
Biennial Change 307,846 492,832
Biennial % Change 196 106
Expenditures by Category
Compensation 3,768 3,919 4,258 4,429 4,491 4,497
Operating Expenses 4,819 5,882 5,139 7,992 7,046 6,881
Grants, Aids and Subsidies 76,290 61,096 73,201 368,239 467,383 465,381
Capital Outlay-Real Property 942 525 753 1,061 1,061 1,061
Other Financial Transaction 87 2 0 103 103 103
Total 85,905 71,424 83,351 381,824 480,084 477,923
Full-Time Equivalents 36.24 36.29 38.75 38.75 38.75 38.75
State of Minnesota 19 2022-23 Biennial BudgetNovember 2020

Aeronautics Activity Financing by Fund
(Dollars in Thousands)
Actual
FY18
Actual
FY19
Actual
FY20
Estimate
FY21
Forecas
FY22
t Base
FY23
2700 - Trunk HighwayBalance Forward In 51 596
Direct Appropriation 1,479 1,623 1,635 1,650 1,650 1,650
Transfers Out 111
Cancellations 69 1,011
Balance Forward Out 16 596
Expenditures 1,463 1,494 1,039 1,235 1,650 1,650
Biennial Change in Expenditures (683) 1,026
Biennial % Change in Expenditures (23) 45
Full-Time Equivalents 3.68 3.47 4.13 4.13 4.13 4.13
2720 - State AirportsBalance Forward In 1,075 7,958 7,321 11,087 2,000
Direct Appropriation 35,812 22,921 25,332 28,832 25,332 25,332
Transfers In 12,703 366
Transfers Out 12,703 397
Cancellations 78
Balance Forward Out 6,852 5,732 11,088 2,000
Expenditures 30,035 25,038 21,565 37,919 27,332 25,332
Biennial Change in Expenditures 4,412 (6,820)
Biennial % Change in Expenditures 8 (11)
Full-Time Equivalents 32.56 32.82 34.62 34.62 34.62 34.62
2721 - Hanger Loan RevolvingBalance Forward In 2,728 3,072 2,311 1,572 1,872 2,172
Net Loan Activity 344 (761) 387 300 300 300
Balance Forward Out 2,272 1,185 1,572 1,872 2,172 2,472
Expenditures 800 1,126 1,126
Biennial Change in Expenditures (800) (1,126)
Biennial % Change in Expenditures (42)
2722 - Air Transportation RevolvingBalance Forward In 573 677 1,136 680 335 335
Receipts 912 949 742 750 1,102 1,104
State of Minnesota 20 2022-23 Biennial BudgetNovember 2020

Aeronautics Activity Financing by Fund
(Dollars in Thousands)
Actual
FY18
Actual
FY19
Actual
FY20
Estimate
FY21
Forecas
FY22
t Base
FY23
Balance Forward Out 597 1,090 681 335 335 498
Expenditures 888 536 1,197 1,095 1,102 941
Biennial Change in Expenditures 868 (249)
Biennial % Change in Expenditures 61 (11)
3000 - FederalReceipts 52,719 43,230 58,425 341,575 450,000 450,000
Expenditures 52,719 43,230 58,425 341,575 450,000 450,000
Biennial Change in Expenditures 304,050 500,000
Biennial % Change in Expenditures 317 125
State of Minnesota 21 2022-23 Biennial BudgetNovember 2020
Transportation Budget Activity Narrative
Program: Multimodal Systems Activity: Transit and Active Transportation dot.state.mn.us/transit/ dot.state.mn.us/saferoutes/index.html dot.state.mn.us/bike/ dot.state.mn.us/peds/
AT A GLANCE
• All 80 counties in Greater Minnesota served by public transit • 37 Greater Minnesota public bus systems funded in FY19 • 147 wheelchair-accessible buses funded for public and nonprofit-run systems in FY19 • 9 Regional Transportation Coordinating Council project development grants funded in FY19 • Completed MnDOT Pedestrian and Bicycle Data Program: Strategic Plan for Counting People Walking
and Bicycling in FY19 and developed the MnDOT Bicycle Facility Design Manual in FY20
PURPOSE & CONTEXT
The Office of Transit and Active Transportation (OTAT) supports transit services to all 80 non-metro counties to meet the needs of transit users and support walking and bicycling statewide. MnDOT continues to work to increase the use of transit, bicycling, and walking as a percentage of all trips statewide. OTAT also works closely with the Metropolitan Council on the planning, development, design, and construction of major transit projects in the Twin Cities metro area.
MnDOT engages our customers to provide planning and policy direction for transit, walking, and bicycling routes on a statewide basis. This includes the needs of our partners and implementing best practices in planning for and investing in transit facilities and pedestrian and bicycle infrastructure.
SERVICES PROVIDED
Transit Planning and Grants
OTAT provides grants, planning support, and technical assistance to: • Public bus service outside the Twin Cities metro area, including grants to purchase buses and bus facilities:
Public Transit Participation Program (http://www.dot.state.mn.us/transit/grants/5311/index.html). Grants are issued to: public, private, and nonprofit operators, as well as local, state, and tribal governments.
• Programs for travel options focused on seniors and persons with disabilities: Enhanced Mobility of Seniors and Individuals with Disabilities Program (http://www.dot.state.mn.us/transit/grants/5310/index.html).
• InterCity Bus services: Section 5311f Minnesota Intercity Bus Program (http://www.dot.state.mn.us/transit/grants/5311f/index.html), including State and Federal funding to support intercity bus transportation service to non-urbanized communities within Minnesota.
• Regional Transportation Coordinating Council (http://www.dot.state.mn.us/transit/grants/RTCC/index.html), coordinates transportation providers, service agents, and the private sector with the goal to fill transportation gaps, streamline access to transportation, and provide individuals more options of where and when to travel.
State of Minnesota 22 2022-23 Biennial BudgetNovember 2020
Bicycle and Pedestrian Planning and Grants
OTAT walking and bicycling services and programs include: • Providing planning for bicycle transportation and pedestrian infrastructure that promotes bicycling as an
energy-efficient and healthy transportation alternative. The Statewide Bicycle System Plan and district bicycle plans outlines the vision and goals for bicycle transportation (http://www.dot.state.mn.us/bike/planning-research.html).
• Creating guidance to implement bicycle facilities with the MnDOT Bicycle Facility Design Guide (http://www.dot.state.mn.us/bike/bicycle-facility-design-manual.html).
• Delivering programs and resources that encourage walking and bicycling as a part of the Trunk Highway and local transportation network (e.g., Watch for Me, State Bicycle Map, Minnesota Walks Plan (http://www.dot.state.mn.us/peds/plan/).
• Creating a Statewide Pedestrian System Plan that identifies goals and strategies for creating spaces that are safe, comfortable, and convenient for people walking. This includes opportunities to implement pedestrian safety countermeasures, and scoping projects with pedestrian needs.
• Coordinating the statewide Non-Motorized Traffic Monitoring Program (https://www.dot.state.mn.us/bike-ped-counting/index.html).
• Providing strategic direction for the MnDOT-owned ABC parking ramps in downtown Minneapolis to encourage carpooling, transit, and bicycle commuting. The parking ramps serve as bridges over Interstate 394 which surrounds Target Field. The ramps are managed by the City of Minneapolis on behalf of MnDOT.
Light and Commuter Rail
OTAT assists the Metropolitan Council with planning, design, and construction of light rail transit and commuter rail. This includes operating the Northstar commuter rail and Blue Line and Green Line light rail. Work continues on the Green Line Extension and Blue Line Extension light rail projects under development.
RESULTS
Public Transit in Greater Minnesota
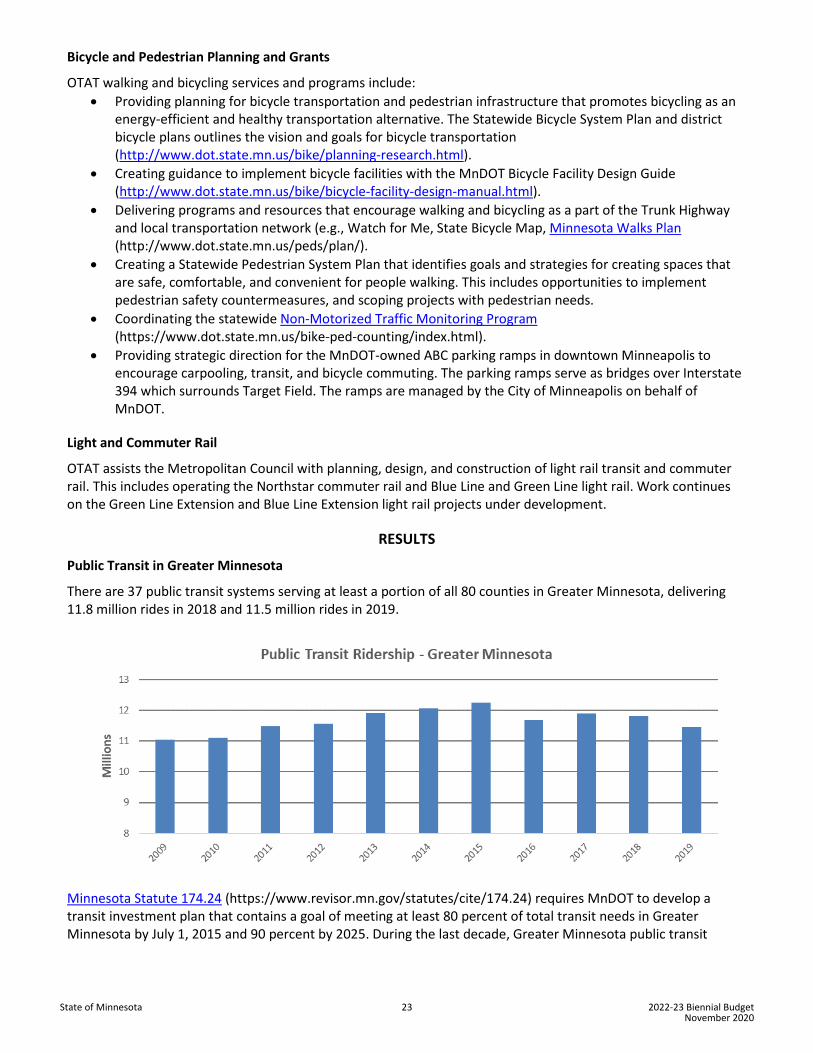
There are 37 public transit systems serving at least a portion of all 80 counties in Greater Minnesota, delivering 11.8 million rides in 2018 and 11.5 million rides in 2019.
Minnesota Statute 174.24 (https://www.revisor.mn.gov/statutes/cite/174.24) requires MnDOT to develop a transit investment plan that contains a goal of meeting at least 80 percent of total transit needs in Greater Minnesota by July 1, 2015 and 90 percent by 2025. During the last decade, Greater Minnesota public transit
State of Minnesota 23 2022-23 Biennial BudgetNovember 2020

ridership has increased 12 percent. Service has expanded so that every non-metro county (80 counties) has at least some public bus service. After having increased steadily for the past decade, transit ridership has plateaued over the last three years.
The immediate challenge facing public transit in Greater Minnesota is the COVID 19 pandemic and its impact on demand. Year-over-year ridership dropped by as much as 90 percent in the spring of 2020. Recovery has been slow but steady. In response, state and federal investment will prioritize sustaining transit service throughout Greater Minnesota during the COVID 19 pandemic.
Bicycle and Pedestrian Programs
In 2019, Minnesota was named the third most bike-friendly state in the United States by the League of American Cyclists. As bicycling has increased in Minnesota, the rate of bicycle crashes has been steady. However, data in 2017 shows that although participation in walking as a form of transportation has remained relatively flat, pedestrian fatalities have begun to increase.
MnDOT is in the process of developing a Statewide Pedestrian System Plan, which will demonstrate the importance of pedestrian networks to the transportation system, prioritize investments, and develop policy and implementation guidance to create walkable communities that are safe, convenient, and desirable for all. After completion of the Statewide Bicycle System Plan, MnDOT developed a Bicycle Facility Design Manual (http://www.dot.state.mn.us/bike/bicycle-facility-design-manual.html) to support implementation of context-appropriate bicycle facilities within MnDOT right-of-way. To continue tracking how and where people walk and bike, MnDOT staff and partners created the Strategic Plan for Counting People Walking and Bicycling (http://www.dot.state.mn.us/bike/documents/planning-research/strategic-plan.pdf).
Since 2005, MnDOT has awarded more than $46 million to Minnesota communities for Safe Routes to School (SRTS) projects. These projects have reached more than 780 schools. In FY 2020 and 2021, the MnDOT SRTS program continues to offer statewide programs and grants for local projects including Safe Routes to School planning assistance, curriculum implementation, bike fleets, demonstration projects, local coordinators, infrastructure, and mini-grants.
These priorities are identified and implemented with ongoing feedback from the statewide SRTS Steering Committee, the SRTS State Network and regional, and local partners. Additional funding from the Federal Highway Administration for Safe Routes projects made the expansion of these programs possible through state fiscal year 2022. The SRTS program facilitated the development of Demonstration Project Implementation Guide (http://www.dot.state.mn.us/saferoutes/documents/mndot-demonstration-project-implementation-guide-final.pdf) as a resource for short-term, low-cost, temporary roadway projects to promote and advance walking
State of Minnesota 24 2022-23 Biennial BudgetNovember 2020

and bicycling. Additionally, Minnesota’s SRTS program will undergo a strategic planning process to develop a new plan for the next five years of the program with engagement from stakeholders, school partners, and local communities.
The legal authority for the Transit activity comes from: Public Transit Participation Program, M.S. 174.24 (https://www.revisor.mn.gov/statutes/?id=174.24) Construction of Light Rail, M.S. 174.35 (https://www.revisor.mn.gov/statutes/?id=174.35) Transportation Alternatives Projects, M.S. 174.42 (https://www.revisor.mn.gov/statutes/?id=174.42) Safe Routes to School Programs, M.S. 174.40 (https://www.revisor.mn.gov/statutes/?id=174.40) Minnesota Council on Transportation Access, M.S. 174.285 (https://www.revisor.mn.gov/statutes/?id=174.285) Construction of Commuter Rail, M.S. 174.82 (https://www.revisor.mn.gov/statutes/?id=174.82) Metropolitan Council authority on light rail transit and commuter rail, M.S. 473.3993-4057 (https://www.revisor.mn.gov/statutes/?id=473.3993)
State of Minnesota 25 2022-23 Biennial BudgetNovember 2020

Transit and Active Transportation Activity Expenditure Overview
(Dollars in Thousands)
Actual
FY18
Actual
FY19
Actual
FY20
Estimate
FY21
Forecas
FY22
t Base
FY23
Expenditures by Fund
1000 - General 880 18,211 17,588 18,561 17,749 17,749
1050 - Transit Assistance 88,389 77,703 71,192 81,553 71,046 73,546
2000 - Restrict Misc Special Revenue 35,620 36,112 38,640 7,406 21,503 19,738
2001 - Other Misc Special Revenue 23 24 24 49 49 49
2700 - Trunk Highway 725 1,002 864 970 932 932
3000 - Federal 32,025 25,269 26,643 121,950 61,331 42,350
3010 - Coronavirus Relief 750
Total 157,662 158,320 154,950 231,239 172,610 154,364
Biennial Change 70,207 (59,215)
Biennial % Change 22 (15)
Expenditures by Category
Compensation 6,218 5,801 6,328 7,179 6,344 6,256
Operating Expenses 34,265 36,732 39,174 10,688 23,904 20,293
Grants, Aids and Subsidies 116,694 114,990 109,090 211,312 140,302 125,755
Capital Outlay-Real Property 125 438 1,700 1,700 1,700
Other Financial Transaction 358 359 358 360 360 360
Total 157,662 158,320 154,950 231,239 172,610 154,364
Full-Time Equivalents 59.83 53.00 55.81 59.68 52.84 51.88
State of Minnesota 26 2022-23 Biennial BudgetNovember 2020

Transit and Active Transportation Activity Financing by Fund
(Dollars in Thousands)
Actual
FY18
Actual
FY19
Actual
FY20
Estimate
FY21
Forecas
FY22
t Base
FY23
1000 - GeneralBalance Forward In 314 812
Direct Appropriation 1,070 17,897 18,399 17,749 17,749 17,749
Transfers In 918 595 650 449 450 450
Transfers Out 918 595 650 449 450 450
Balance Forward Out 190 811
Expenditures 880 18,211 17,588 18,561 17,749 17,749
Biennial Change in Expenditures 17,057 (651)
Biennial % Change in Expenditures 89 (2)
Full-Time Equivalents 2.32 3.90 4.38 4.14 4.04 4.04
1050 - Transit AssistanceBalance Forward In 73,495 54,829 51,401 45,308 33,537 34,829
Receipts 67,650 69,610 65,106 69,790 72,346 73,820
Transfers In 416 416 416 416 416 416
Transfers Out 449 433 423 424 424 424
Balance Forward Out 52,723 46,720 45,308 33,537 34,829 35,095
Expenditures 88,389 77,703 71,192 81,553 71,046 73,546
Biennial Change in Expenditures (13,347) (8,153)
Biennial % Change in Expenditures (8) (5)
Full-Time Equivalents 3.55 3.20 3.56 3.56 3.00 3.00
2000 - Restrict Misc Special RevenueBalance Forward In 23,163 23,643 25,517 2,824 4,178 2,135
Receipts 18,908 19,515 15,948 8,760 19,460 19,560
Balance Forward Out 6,452 7,046 2,825 4,178 2,135 1,957
Expenditures 35,620 36,112 38,640 7,406 21,503 19,738
Biennial Change in Expenditures (25,686) (4,805)
Biennial % Change in Expenditures (36) (10)
Full-Time Equivalents 24.29 16.16 16.27 16.27 16.27 16.27
2001 - Other Misc Special RevenueReceipts 23 24 24 49 49 49
Expenditures 23 24 24 49 49 49
State of Minnesota 27 2022-23 Biennial BudgetNovember 2020

Transit and Active Transportation Activity Financing by Fund
(Dollars in Thousands)
Actual
FY18
Actual
FY19
Actual
FY20
Estimate
FY21
Forecas
FY22
t Base
FY23
Biennial Change in Expenditures 26 25
Biennial % Change in Expenditures 55 34
2700 - Trunk HighwayBalance Forward In 127 38
Direct Appropriation 846 875 902 932 932 932
Transfers In 982 1,379
Transfers Out 979 1,379
Cancellations 4
Balance Forward Out 121 38
Expenditures 725 1,002 864 970 932 932
Biennial Change in Expenditures 108 30
Biennial % Change in Expenditures 6 2
Full-Time Equivalents 6.39 6.82 7.41 7.41 7.41 7.41
3000 - FederalBalance Forward In 1,063 661 657 196
Receipts 31,053 24,781 26,181 121,754 61,331 42,350
Internal Billing Receipts 217 261 347 254 254 254
Transfers Out 4
Balance Forward Out 87 174 195
Expenditures 32,025 25,269 26,643 121,950 61,331 42,350
Biennial Change in Expenditures 91,300 (44,912)
Biennial % Change in Expenditures 159 (30)
Full-Time Equivalents 23.28 22.92 24.19 28.30 22.12 21.16
3010 - Coronavirus ReliefDirect Appropriation 750 0 0
Expenditures 750
Biennial Change in Expenditures 750 (750)
Biennial % Change in Expenditures
State of Minnesota 28 2022-23 Biennial BudgetNovember 2020

Transportation Budget Activity Narrative
Program: Multimodal Systems Activity: Freight and Rail Safety www.dot.state.mn.us/cvo www.dot.state.mn.us/ofrw
AT A GLANCE
In Calendar Year 2019: • $1 million in state-funded Port Development Assistance Program grants were provided to improve port
infrastructure • $100 million in federally-funded Minnesota Highway Freight Program funds were allotted to
construction projects statewide for highway and intermodal freight improvements • $7 million in federal funds were programmed for 40 highway/rail grade crossing safety improvements,
and 11 outdated equipment replacements • 639 business operating credentials issued to for-hire limousine operators, Special Transportation
Service (STS) transporters of the elderly and disabled, general freight carriers, household goods movers, and large building/house movers
• 11,000 interstate motor carriers, brokers, and freight forwarders registered in the Unified Carrier Registration Program (UCR)
• 4,200 safety inspections and 550 safety audits conducted on STS and for-hire limousine vehicles • 900 safety audits/investigations on new and existing interstate freight and passenger carrier operations • 600 medical waivers issued to intrastate Commercial Motor Vehicle (CMV) drivers who have allowable
physical impairments • 80,500 permits issued to move over-legal sized and/or overweight loads
PURPOSE & CONTEXT
The purpose of the Office of Freight and Commercial Vehicle Operations (OFCVO) is to improve the safety and performance of the state’s multimodal freight transportation system through:
• Confirming railroad companies’ compliance with state and federal safety standards • Developing statewide and district freight plans that address mobility bottlenecks and safety gaps • Improving public safety at highway-rail grade crossings by advancing infrastructure improvements • Training on regulations and technical assistance • Identifying and prioritizing freight infrastructure improvement projects • Enforcing laws and rules governing motor carriers and other transportation service providers • Auditing freight carriers and passenger services to confirm sound transportation safety management
practices
OFCVO programs enhance Minnesota’s freight mobility, safety, and economic competitiveness by improving access to regional, national, and global markets through the safe and efficient transportation of goods and people. MnDOT plans and invests in all the ways people and goods move throughout Minnesota—individually for each mode and collectively as a multimodal system. We help build and maintain the infrastructure that supports our economy and local communities. To ensure all Minnesotans thrive now and into the future, OFCVO will understand business-specific transportation requirements and identify opportunities to provide a more responsive transportation system.
State of Minnesota 29 2022-23 Biennial BudgetNovember 2020

SERVICES PROVIDED
Oversize and Overweight Load Permits: Issue permits for trucks moving over-legal sized or overweight loads on MnDOT roads, and assign routes that are suitable to protect road infrastructure and ensure traveler safety.
Operating Credentials: Register and license freight operators that transport goods and passenger service providers who transport people. These include interstate and intrastate property carriers, household goods movers, building/house movers, Motor Carrier of Passenger (e.g. motor coaches), for-hire limousine services, Special Transportation Services (STS) for the elderly and disabled, and Non-Emergency Medical Transportation (NEMT).
Safety Audits, Complaint Investigations, and Vehicle Inspections: Conduct audits (annual and random) on property carriers and passenger services to ensure companies are operating and maintaining records as required by statutes, laws, and rules; have properly qualified drivers; and have safe operating vehicles. OFCVO investigates complaints about unsafe equipment or improper operating practices by these companies.
Hazardous Materials Incident Response: Assist local authorities, when requested, by providing technical guidance to first responders when a commercial vehicle incident happens involving hazardous materials.
Commercial Driver Medical Waiver: Within the guidelines provided by MN statute, determine whether to approve a waiver for a person who has a physical impairment that would otherwise disqualify them from driving a commercial motor vehicle. This program is not the same as the MN Department of Public Safety driver waiver program.
Technical Assistance, Training and Outreach: Conduct presentations and outreach sessions, and provide technical guidance, on federal and State laws, rules, and regulations that govern motor carriers related to the safe transportation of people and goods.
Truck Weigh Stations: Build and maintain facilities operated by the Minnesota State Patrol’s Commercial Vehicle Enforcement Division. OFCVO provides funding, technical support, and collaboration with the State Patrol and MnDOT districts in maintaining and improving weigh station technologies and facilities infrastructure.
Rail Safety Inspection Program: Inspect rail track, rail cars, locomotives, and hazardous materials shipments to ensure railroad compliance with federal and State safety standards.
Rail Crossing Safety Program: Monitor the safety performance of more than 4,100 rail grade crossings along Minnesota’s public road system. Develop and implement MnDOT’s Railroad Highway Grade Crossing Safety Improvement Program, a risk-based assessment used to identify at-risk crossing locations and appropriate levels of warning devices needed.
Freight System Planning: Develop plans that improve Minnesota’s freight transportation system. Plans include the Statewide Freight System and Investment Plan (http://www.dot.state.mn.us/planning/freightplan/index.html) and the State Rail Plan (http://www.dot.state.mn.us/planning/railplan/).
Minnesota Highway Freight Program (MHFP): Identify and secure funding opportunities for eligible statewide highway and intermodal construction projects that provide measurable freight transportation benefits.
Port Development Assistance Program (PDAP): Provide port infrastructure grants to promote effective freight movement through Great Lakes and Mississippi River port terminals.
Minnesota Rail Service Improvement Program (MRSI): Provide grants for freight rail economic development projects and loans for infrastructure that improve freight rail service.
State of Minnesota 30 2022-23 Biennial BudgetNovember 2020

Passenger Rail: Partner with local governments, regional rail authorities, neighboring state DOT’s, community groups and advocates to identify and prioritize passenger rail corridors for development and deliver passenger rail services that are federally compliant, environmentally friendly, and sustainable.
Minnesota Freight Advisory Committee (MFAC): Provide a forum for the exchange of ideas and address issues between MnDOT and the private sector to develop and promote a safe, reliable, and sustainable freight transportation system in Minnesota.
State Interagency Rail Group and State Rail Director: Serve as the primary strategist, expert and point of contact for the management of cross-agency railroad issues in Minnesota and advises the Governor’s Office, state agency Commissioners, Minnesota Congressional delegates, and the Legislature on rail issues. The Rail Director leads interagency rail work with state agencies including Met Council, Department of Public Safety, Pollution Control Agency, Department Employment and Economic Development, Iron Range Resources and Rehabilitation Board, Department of Commerce, Department of Agriculture, Department of Revenue, and MnDOT; supports the Governor’s Council on Freight Rail; and serves as liaison to the Federal Railroad Administration, the rail industry, and other rail stakeholders.
RESULTS
Rail Crossing Safety Program: Through improvements in infrastructure and public education, grade crossing incidents have declined substantially. Approximately one-third of Minnesota’s 4,100 public road grade crossings have gates and/or flashing lights.
State of Minnesota 31 2022-23 Biennial BudgetNovember 2020

Oversize and Overweight Vehicle Permitting: Customer use of MnDOT’s online oversize/overweight permitting system continues to increase each year. Currently, a new system replacement is being designed and expected to be implemented by December 2021.
Motor Carrier Credentialing, Vehicle Inspections, Safety Reviews: M.S. 174.29, 174.30; MN Rules, Chapters 8840, 8880; and M.S. 221 Special Permits to Exceed Legal Size and Weight: M.S. 169.86 Port Development Assistance Program: M.S. 457A Minnesota Rail Service Improvement (MRSI) Program and Rail Bank Program: M.S. 222 Railroad Safety: M.S. 219 Passenger Rail: M.S. 174.632
State of Minnesota 32 2022-23 Biennial BudgetNovember 2020

Freight and Rail Safety Activity Expenditure Overview
(Dollars in Thousands)
Actual
FY18
Actual
FY19
Actual
FY20
Estimate
FY21
Forecas
FY22
t Base
FY23
Expenditures by Fund
1000 - General 1,937 3,764 2,229 1,599 1,511 1,511
2000 - Restrict Misc Special Revenue 3,058 3,581 1,855 2,669 2,693 4,688
2001 - Other Misc Special Revenue 25 41 200 150 150
2700 - Trunk Highway 4,678 5,129 5,438 6,328 5,963 5,963
3000 - Federal 5,068 6,544 4,776 56,145 76,670 54,070
Total 14,766 19,017 14,340 66,941 86,987 66,382
Biennial Change 47,498 72,088
Biennial % Change 141 89
Expenditures by Category
Compensation 6,717 6,836 7,835 9,985 9,008 9,005
Operating Expenses 2,904 2,502 1,633 34,272 54,265 43,663
Grants, Aids and Subsidies 3,610 192 10,785 17,100 5,100
Capital Outlay-Real Property 5,141 6,060 4,647 11,866 6,594 8,594
Other Financial Transaction 4 9 34 33 20 20
Total 14,766 19,017 14,340 66,941 86,987 66,382
Full-Time Equivalents 69.13 69.53 78.35 79.23 77.68 77.67
State of Minnesota 33 2022-23 Biennial BudgetNovember 2020

Freight and Rail Safety Activity Financing by Fund
(Dollars in Thousands)
Actual
FY18
Actual
FY19
Actual
FY20
Estimate
FY21
Forecas
FY22
t Base
FY23
1000 - GeneralBalance Forward In 1,892 3,728 1,404 859 500 500
Direct Appropriation 3,656 1,562 1,729 1,569 1,569 1,569
Transfers In 3,120 772 717 480 480 480
Transfers Out 3,186 821 764 809 538 538
Cancellations 216
Balance Forward Out 3,544 1,261 857 500 500 500
Expenditures 1,937 3,764 2,229 1,599 1,511 1,511
Biennial Change in Expenditures (1,873) (806)
Biennial % Change in Expenditures (33) (21)
Full-Time Equivalents 9.40 9.57 9.81 10.08 10.08 10.08
2000 - Restrict Misc Special RevenueBalance Forward In 7,054 6,809 6,924 6,905 6,643 6,309
Receipts 1,294 2,204 1,541 2,059 2,059 2,059
Transfers In 600 1,600
Transfers Out 1,000
Net Loan Activity 591 211 296 348 300 300
Balance Forward Out 6,482 6,243 6,906 6,643 6,309 3,980
Expenditures 3,058 3,581 1,855 2,669 2,693 4,688
Biennial Change in Expenditures (2,115) 2,857
Biennial % Change in Expenditures (32) 63
Full-Time Equivalents 5.66 5.35 5.52 5.52 5.52 5.52
2001 - Other Misc Special RevenueBalance Forward In 12 125 250 271 71
Receipts 138 125 63 79 150
Balance Forward Out 125 250 271 71
Expenditures 25 41 200 150 150
Biennial Change in Expenditures 217 59
Biennial % Change in Expenditures 24
Full-Time Equivalents 0.27 0.28 1.00 1.00 1.00
2700 - Trunk Highway
State of Minnesota 34 2022-23 Biennial BudgetNovember 2020

Freight and Rail Safety Activity Financing by Fund
(Dollars in Thousands)
Actual
FY18
Actual
FY19
Actual
FY20
Estimate
FY21
Forecas
FY22
t Base
FY23
Balance Forward In 82 1,183 120 505 110 110
Direct Appropriation 5,350 5,534 5,654 5,788 5,788 5,788
Receipts 207 191 169 175 175 175
Transfers In 5,223 3,010 3,237 2,643 2,643 2,643
Transfers Out 4,381 4,469 3,237 2,643 2,643 2,643
Cancellations 841 206 30
Balance Forward Out 961 113 504 110 110 110
Expenditures 4,678 5,129 5,438 6,328 5,963 5,963
Biennial Change in Expenditures 1,959 160
Biennial % Change in Expenditures 20 1
Full-Time Equivalents 48.49 50.85 58.72 57.13 57.06 57.05
3000 - FederalBalance Forward In 545 65 13 6
Receipts 5,400 6,492 4,770 56,139 76,670 54,070
Internal Billing Receipts 134 134 139 140 140 140
Transfers Out 841
Balance Forward Out 36 13 6
Expenditures 5,068 6,544 4,776 56,145 76,670 54,070
Biennial Change in Expenditures 49,310 69,819
Biennial % Change in Expenditures 425 115
Full-Time Equivalents 5.31 3.76 4.02 5.50 4.02 4.02
State of Minnesota 35 2022-23 Biennial BudgetNovember 2020

Transportation Budget Activity Narrative
Program: State Roads Activity: Program Planning and Delivery dot.state.mn.us/planning/program/plans.html
AT A GLANCE
• $21 billion in planned investments for state highways over the next 20 years • The 20-year Minnesota State Highway Investment Plan (MnSHIP) is updated every five years, and the
next update is scheduled for release in January 2022 • The 10-year Capital Highway Investment Plan (CHIP) and four year State Transportation Improvement
Program (STIP) are updated every year • 50 or more research projects start each year with about 200 in progress at any given time
PURPOSE & CONTEXT
MnDOT’s transportation infrastructure is continuing to age. To address the systems shortcomings, MnDOT has adopted an asset management philosophy. This philosophy times the right fix at the right time in attempt to optimize system performance versus the cost to operate. The result is a comprehensive program of projects that rehabilitate/preserve the infrastructure to acceptable levels.
Program Planning and Delivery of the Trunk Highway system requires thoughtful and efficient short, mid-and long-range plans to fit the diverse needs of system stakeholders. This activity includes: developing investment plans, conducting data analysis, reviewing performance outcomes, managing the capital program, designing construction plans, goal setting, construction project oversight, and inspection, as well as research and development.
We must efficiently use the resources available to plan and preserve infrastructure, while also providing oversight for the replacement and limited expansion of the system. In addition, we must meet the need for safety, mobility, reliable freight movement, and bicyclists and pedestrian improvements.
In the planning of the Trunk Highway system, MnDOT’s objective is to enhance our customer’s trust by listening to their needs, engaging them in creating plans, and communicating effectively about our programs and projects. By doing so, we plan and deliver projects to get the most out of our investments and optimize system performance.
In addition, by eliminating barriers to equitable contracting and employment opportunities, MnDOT is helping to cultivate a transportation sector that reflects the diverse communities of Minnesota. To advance inclusion and equity in our workforce and in the transportation community, MnDOT will continue to increase the number of women-and minority-owned businesses participating in highway construction contracts and promote participation of underrepresented groups in the transportation industry through training, small business advising programs, and other strategies tailored to the needs of targeted communities.
SERVICES PROVIDED
Highway System Planning
Highway planning includes assessing statewide infrastructure conditions; determining future needs for all highway users, including automobiles as well as trucks, buses, bicycles and pedestrians; and then making planning decisions based on projected available funding. We strive to make policy and planning decisions that provide the greatest return on Minnesota’s transportation system investment.
State of Minnesota 36 2022-23 Biennial BudgetNovember 2020

The Minnesota State Highway Investment Plan (MnSHIP) (http://www.dot.state.mn.us/planning/mnship/) is completed every five years and establishes capital investment priorities for the next 20 years. MnSHIP draws on public and stakeholder input performance management systems to establish investment scenarios which optimize the highway system performance based on projected available funding. MnSHIP ensures that performance targets set by the federal government for interstate pavements and National Highway System bridges are met.
The Capital Highway Investment Plan (CHIP) (http://www.dot.state.mn.us/planning/10yearplan/) is a ten year list of financially constrained projects that are selected to meet the investment priorities and performance targets established by MnSHIP. Pavement and bridge reservation projects are selected based upon the projected condition detail from the pavement and bridge management systems. The CHIP is updated annually.
The State Transportation Improvement Program (STIP) (http://www.dot.state.mn.us/planning/program/stip.html) includes the first four years of the CHIP. These projects are considered funded and committed for delivery. The last six years of the CHIP are priorities based upon the MnSHIP investment criteria, but may change as project scope matures and updated revenue forecasts become available.
Develop Highway Improvement Projects
Development of highway improvement projects involves several steps: • Scoping determines the elements of a project that are needed to meet project goals and sets preliminary
cost estimates and schedules. • Environmental Review considers impacts of proposed projects to ensure compliance with environmental
laws and policies to avoid, minimize, or mitigate environmental impacts. • Public Involvement and Engagement includes public participation through meetings, media, local
government input, and social media. The public is involved throughout the entire life of the project, including planning, design, scoping, environmental review, and construction.
• Design includes engineering studies and analysis, preparing construction plans, using performance based practical design and flexible design standards to ensure road designs meet project goals while minimizing costs.
Highway Construction Management Oversight
MnDOT monitors construction projects to ensure that the final product meets all specifications by doing the following:
• Managing the overall progress of State Highway projects from project letting through construction completion and final project documentation.
• Coordinating the early stages of projects with unique features. • Creating opportunities for small business participation and employment opportunities for minorities and
women to work on MnDOT contracts. • Overseeing quality management, material testing, project scheduling, and compliance with specifications. • Providing sound fiscal management, financial tracking, and regulatory compliance. • Ensuring that construction traffic control provides the most efficient and safest movement possible
through work zones.
Research and Development
MnDOT develops and utilizes new technologies for Trunk Highway projects, such as newer, more cost-effective pavement designs, accelerated bridge construction techniques, and methods to improve highway safety. The program finds ways to make roads last longer, perform better, cost less to build and maintain, be built faster, and have minimal impact on the environment. Research Services manages research projects that serve as a resource for staff as well as city and county engineers.
State of Minnesota 37 2022-23 Biennial BudgetNovember 2020
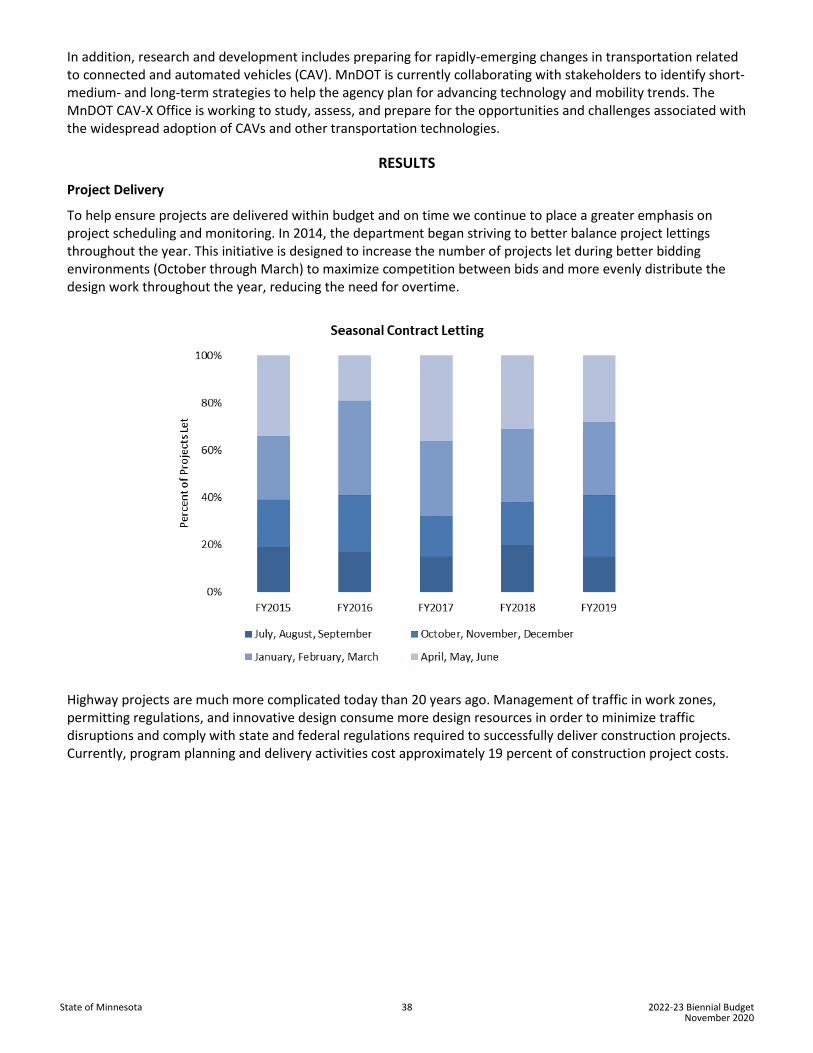
In addition, research and development includes preparing for rapidly-emerging changes in transportation related to connected and automated vehicles (CAV). MnDOT is currently collaborating with stakeholders to identify short- medium- and long-term strategies to help the agency plan for advancing technology and mobility trends. The MnDOT CAV-X Office is working to study, assess, and prepare for the opportunities and challenges associated with the widespread adoption of CAVs and other transportation technologies.
RESULTS
Project Delivery
To help ensure projects are delivered within budget and on time we continue to place a greater emphasis on project scheduling and monitoring. In 2014, the department began striving to better balance project lettings throughout the year. This initiative is designed to increase the number of projects let during better bidding environments (October through March) to maximize competition between bids and more evenly distribute the design work throughout the year, reducing the need for overtime.
Highway projects are much more complicated today than 20 years ago. Management of traffic in work zones, permitting regulations, and innovative design consume more design resources in order to minimize traffic disruptions and comply with state and federal regulations required to successfully deliver construction projects. Currently, program planning and delivery activities cost approximately 19 percent of construction project costs.
State of Minnesota 38 2022-23 Biennial BudgetNovember 2020

* Throughout this measure, expenditures reflect budgetary commitments (expenditures and encumbrances) and include consultant-led program planning and delivery.
The Department of Transportation’s Program Planning and Delivery legal authority comes from: Roads General Provisions M.S.160 (https://www.revisor.mn.gov/statutes/?id=160) Trunk Highway M.S.161 (https://www.revisor.mn.gov/statutes/?id=161) Department of Transportation M.S.174 (https://www.revisor.mn.gov/statutes/?id=174)
State of Minnesota 39 2022-23 Biennial BudgetNovember 2020

Program Planning and Delivery Activity Expenditure Overview
(Dollars in Thousands)
Actual
FY18
Actual
FY19
Actual
FY20
Estimate
FY21
Forecas
FY22
t Base
FY23
Expenditures by Fund
1000 - General 68 994
2000 - Restrict Misc Special Revenue 9,538 16,625 15,667 12,971 11,650 5,082
2001 - Other Misc Special Revenue 81 2,523 1,278 1,696 1,655 1,651
2700 - Trunk Highway 234,734 271,030 236,700 280,863 259,998 260,010
3000 - Federal 16,932 15,231 21,748 88,260 68,960 75,310
Total 261,284 305,409 275,461 384,784 342,263 342,053
Biennial Change 93,552 24,071
Biennial % Change 17 4
Expenditures by Category
Compensation 174,618 190,802 190,261 199,035 201,505 201,493
Operating Expenses 69,328 83,256 64,571 149,853 111,669 118,264
Grants, Aids and Subsidies 9,240 9,079 7,736 18,334 17,272 16,271
Capital Outlay-Real Property 6,832 18,656 11,916 13,787 8,545 2,877
Other Financial Transaction 1,266 3,617 977 3,775 3,272 3,148
Total 261,284 305,409 275,461 384,784 342,263 342,053
Full-Time Equivalents 1,847.15 1,949.12 1,912.33 1,922.08 1,919.96 1,918.14
State of Minnesota 40 2022-23 Biennial BudgetNovember 2020

Program Planning and Delivery Activity Financing by Fund
(Dollars in Thousands)
Actual
FY18
Actual
FY19
Actual
FY20
Estimate
FY21
Forecas
FY22
t Base
FY23
1000 - GeneralBalance Forward In 994
Direct Appropriation 1,062
Balance Forward Out 994
Expenditures 68 994
Biennial Change in Expenditures 1,062 (1,062)
Biennial % Change in Expenditures (100)
2000 - Restrict Misc Special RevenueBalance Forward In 8,163 5,674 3,721 2,859 1,643 1,151
Receipts 6,855 15,609 14,806 11,755 11,158 4,707
Transfers In 1 0
Transfers Out 10
Net Loan Activity (413)
Balance Forward Out 5,472 4,245 2,859 1,643 1,151 776
Expenditures 9,538 16,625 15,667 12,971 11,650 5,082
Biennial Change in Expenditures 2,476 (11,906)
Biennial % Change in Expenditures 9 (42)
Full-Time Equivalents 4.67 4.47 4.75 4.77 2.67 0.87
2001 - Other Misc Special RevenueBalance Forward In 1,816 1,940 57 56 9 4
Receipts 197 650 1,277 1,649 1,650 1,647
Balance Forward Out 1,932 67 56 9 4
Expenditures 81 2,523 1,278 1,696 1,655 1,651
Biennial Change in Expenditures 371 332
Biennial % Change in Expenditures 14 11
Full-Time Equivalents 0.35 4.09 6.21 6.21 6.21 6.21
2700 - Trunk HighwayBalance Forward In 4,788 40,304 7,309 29,681 6,697 6,920
Direct Appropriation 263,255 255,740 255,906 258,518 258,518 258,518
Receipts 3,260 4,207 3,164 1,703 1,703 1,703
Transfers In 151,207 181,021 168,903 129,470 126,905 127,529
State of Minnesota 41 2022-23 Biennial BudgetNovember 2020
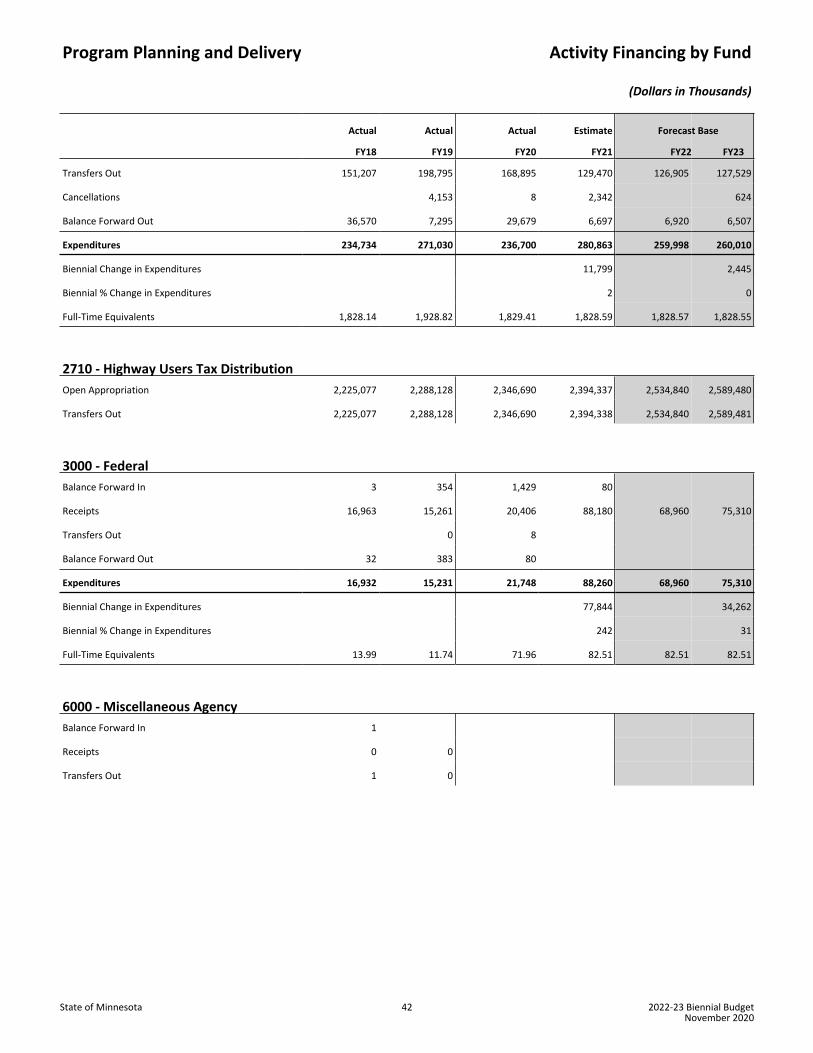
Program Planning and Delivery Activity Financing by Fund
(Dollars in Thousands)
Actual
FY18
Actual
FY19
Actual
FY20
Estimate
FY21
Forecas
FY22
t Base
FY23
Transfers Out 151,207 198,795 168,895 129,470 126,905 127,529
Cancellations 4,153 8 2,342 624
Balance Forward Out 36,570 7,295 29,679 6,697 6,920 6,507
Expenditures 234,734 271,030 236,700 280,863 259,998 260,010
Biennial Change in Expenditures 11,799 2,445
Biennial % Change in Expenditures 2 0
Full-Time Equivalents 1,828.14 1,928.82 1,829.41 1,828.59 1,828.57 1,828.55
2710 - Highway Users Tax DistributionOpen Appropriation 2,225,077 2,288,128 2,346,690 2,394,337 2,534,840 2,589,480
Transfers Out 2,225,077 2,288,128 2,346,690 2,394,338 2,534,840 2,589,481
3000 - FederalBalance Forward In 3 354 1,429 80
Receipts 16,963 15,261 20,406 88,180 68,960 75,310
Transfers Out 0 8
Balance Forward Out 32 383 80
Expenditures 16,932 15,231 21,748 88,260 68,960 75,310
Biennial Change in Expenditures 77,844 34,262
Biennial % Change in Expenditures 242 31
Full-Time Equivalents 13.99 11.74 71.96 82.51 82.51 82.51
6000 - Miscellaneous AgencyBalance Forward In 1
Receipts 0 0
Transfers Out 1 0
State of Minnesota 42 2022-23 Biennial BudgetNovember 2020

Transportation Budget Activity Narrative
Program: State Roads Activity: State Road Construction minnesotago.org/ dot.state.mn.us/planning/program/stip.html dot.state.mn.us/planning/mnship/ dot.state.mn.us/planning/10yearplan/index.html dot.state.mn.us/projectselection/
AT A GLANCE
• State Road Construction is funded through direct appropriations from the Trunk Highway Fund, Federal Highway Trust Funds, and Trunk Highway Bond proceeds
• 388 construction projects were started in the 2018-19 biennium • 398 construction projects are planned in the 2020-21 biennium • 7 Corridors of Commerce projects received funding in 2017 and 2018 (for construction between 2019
and 2025)
PURPOSE & CONTEXT
The State Road Construction budget activity is the Trunk Highway System capital investment program for the construction, reconstruction, and improvement on the 12,000 miles of state managed roads and bridges. State managed roads include the National Highway System (NHS), along with 7,600 miles of non-NHS Trunk Highways.
Investments on these roads are primarily in the areas of system preservation, improvements, and expansion. MnDOT staff administers and provides oversight to hundreds of projects each season. Investment decisions reflect the priorities and policies identified in the planning documents developed by the agency based on state and federal goals and input from the public and transportation stakeholders.
MnDOT’s objective is to deliver measurable results through effective and efficient stewardship of state road construction resources. These investments build and maintain the infrastructure that supports our economy and ensures communities thrive throughout the state.
SERVICES PROVIDED
MnDOT selects, designs, and manages construction projects to advance the objectives and performance measures in the Statewide Multimodal Transportation Plan. The investment priorities and direction are set in the 20-year Minnesota State Highway Investment Plan (MnSHIP) (http://www.dot.state.mn.us/planning/mnship). Individual construction projects are prioritized and selected within categories and programs using an objective and transparent scoring process based on the legislatively required Project Selection Policy. The annual construction program provides work for contractors across the state and opportunities for small business participation and employment to minorities and women to work on MnDOT contracts.
Trunk Highway System Preservation Construction
Trunk Highway preservation construction includes: • Repairing and reconstructing highways and bridges to maintain the existing transportation system. • Planning for the preservation of highway and bridge investments in a timely and cost-effective manner,
allowing MnDOT to maintain existing vital connections throughout the state. • Selecting preservation projects that provide a safe and reliable ride surface for travelers while minimizing
life-cycle costs.
State of Minnesota 43 2022-23 Biennial BudgetNovember 2020

Trunk Highway System Expansion
Trunk Highway expansion includes: • Adding capacity to the transportation system with new lanes, bridges, interchanges, and in rare cases
adding additional centerline miles. • Creating safer roadways with new turn lanes, wider shoulders, and roundabouts. • Completing critical connections through special legislation and bonding programs, such as the Corridors of
Commerce program.
Other Trunk Highway System Improvements
Investing in areas within the right of way but outside of the traditional highway footprint, including: • Multimodal investments, including bike paths and pedestrian bridges • Intelligent Traffic Systems, including ramp meters and changeable message signs • Truck weigh stations and scales • Travel center and safety rest areas
RESULTS
MnSHIP Outcomes (2018 to 2037)
MnSHIP identifies the investment priorities for the State Road and Bridge Construction Program and the outcomes of those investments. Based upon the estimated available funding during this time period, MnDOT will focus on the following outcomes:
• System Stewardship: o Strengths: MnDOT focuses a majority of investment on maintaining the condition of roads,
bridges, and roadside infrastructure. Federal pavement and bridge minimum condition requirements are likely to be met.
o Drawbacks: Conditions of roads, bridges and roadside infrastructure decline on NHS and non-NHS routes.
• Transportation Safety: o Strengths: MnDOT will continue to focus on lower cost, proactive treatments aimed at preventing
fatalities and serious injuries. o Drawbacks: Only a limited number of locations with a sustained crash history will be addressed.
• Critical Connections: o Strengths: MnDOT commits to achieving substantial compliance with the Americans with
Disabilities Act (ADA) no later than 2037. o Drawbacks: The number and scope of mobility improvements decreases substantially, potentially
reducing the ability to maintain reliable travel times in the Twin Cities area and Greater Minnesota. Resources are not available to address growing areas of the state.
• Healthy Communities: o Strengths: Through the Transportation and Economic Development (TED) program, investments
will be made to address local concerns through partnerships, design add-ons and a few stand-alone projects to support economic competitiveness and quality of life.
o Drawbacks: The investment direction limits MnDOT’s ability to address local concerns.
Efficiencies
While MnDOT has always worked to be good stewards of public funds, the department continues to take a more targeted approach to systematically identify and quantify efficiencies as well as find new areas for greater efficiencies. When MnDOT identifies savings on current projects, we release those funds to advance additional projects. MnDOT uses a best practice case-analysis approach to evaluate and measure efficiency. Best practice
State of Minnesota 44 2022-23 Biennial BudgetNovember 2020

evaluation reviews dimensions of efficiency in quality, time, and cost. MnDOT analyzes each case for implementation of cost saving strategies, designs, and processes. Efficiencies identified in fiscal year 2019 came throughout the project development process for each project with an estimated construction cost greater than $10 million, as well as any regionally significant project let in FY 2019. In FY 2019 there was approximately $90 million in savings identified on major projects. There was also an estimated $13 million in efficiencies identified in other areas of the department such as administration, maintenance, and operations. MnDOT efficiencies are reported in the Major Highway Projects Report (http://www.dot.state.mn.us/govrel/reports/2019/2019-mhpr.pdf).
Performance Indicators
MnDOT tracks the performance of the Trunk Highway system with a number of different measures, many of which are published on the transportation performance website (https://performance.minnesotago.org/).
MnDOT prioritizes infrastructure improvements on National Highway System (NHS) routes and holds these roads to a higher performance standard than non-NHS routes. This approach allows MnDOT to comply with federal law and manage risks related to statewide travel.
Pavement condition is measured by the percent of miles of highway in poor condition. The system condition on the NHS is projected to be worsening after 2020, though Interstate condition improves slightly in 2023 compared to 2022.
Bridge condition is measured by percent of bridge deck area in poor condition. NHS bridge condition is projected to improve by 2023, but then significantly decline into the future, with approximately 6 percent of total bridge deck area being in poor condition by 2029.
State of Minnesota 45 2022-23 Biennial BudgetNovember 2020

MnDOT’s Complete Street Policy considers the needs of pedestrians, bicyclists, transit, motorists, and commercial and emergency vehicles in all phases of planning, project development, operation, and maintenance activities. MnDOT documents how each user group (e.g. pedestrian, bicycle, transit, freight) has been considered using both categories defined in MnDOT’s Complete Streets Policy. MnDOT then provides a written explanation for each type of use. We are making improvements in most projects where we identified needs. However, in some cases the desired improvements are not feasible or cost effective so are not included in the final plan. Percentages in the graph below exclude projects where the use is legally prohibited according to Minnesota Statutes 169.305 (https://www.revisor.mn.gov/statutes/cite/169.305) or where there is no evidence of a current need to provide for the user group, no plans identify the project corridor for future use, or land use trends suggest an absence of future need over the life of the project.
For FY2020-21, overall approximately 75 percent of projects have documented considerations for each type of use. All projects are required to complete the documentation during the project scoping process, though some projects are not yet fully scoped or have yet to complete their analysis.
MnDOT defines metro area freeway congestion as traffic traveling at speeds less than 45 mph. Freeway system performance was stable from 2015 through 2018 (annual data for 2019 is not yet available). 23-24 percent of metro freeway miles were traveled below 45 mph during peak morning or evening hours. However, that percentage of congested miles is expected to increase in the future as traffic volumes continue to grow. From mid-March to late-June 2020, there was very little recurring congestion on the system – any congestion was due to incidents or roadwork. Beginning in late June 2020 some locations of congestion have been appearing on the system in the afternoon.
State of Minnesota 46 2022-23 Biennial BudgetNovember 2020

In addition to freeway congestion, MnDOT also monitors the reliability of travel times. Travel time reliability is a measure of the consistency or dependability in travel times from day to day. MnDOT tracks the percent of all person-miles traveled on the interstate system and other NHS highways that are reliable. Since 2017, the reliability of Minnesota's interstate and other NHS systems has remained relatively consistent at both the metro and statewide levels. Statewide travel tends to be more reliable than the metro area since the metro area experiences higher traffic volumes and congestion levels.
The Department of Transportation’s State Road Construction legal authority comes from: Roads, General Provisions M.S.160 (https://www.revisor.mn.gov/statutes/?id=160) Trunk Highways M.S.161 (https://www.revisor.mn.gov/statutes/?id=161) Complete Streets M.S. 174.75 (https://www.revisor.mn.gov/statutes/?id=174.75) TED M.S. 174.12 (https://www.revisor.mn.gov/statutes/cite/174.12) Corridors of Commerce M.S. (https://www.revisor.mn.gov/statutes/cite/161.088)
State of Minnesota 47 2022-23 Biennial BudgetNovember 2020

State Road Construction Activity Expenditure Overview
(Dollars in Thousands)
Actual
FY18
Actual
FY19
Actual
FY20
Estimate
FY21
Forecas
FY22
t Base
FY23
Expenditures by Fund
2000 - Restrict Misc Special Revenue 33,129 33,275 53,472 34,987 22,258 22,259
2700 - Trunk Highway 1,010,590 1,022,985 952,342 1,039,638 976,718 976,282
3000 - Federal 4,036 1,128 114 12,249 3,530 10,530
Total 1,047,755 1,057,388 1,005,928 1,086,874 1,002,506 1,009,071
Biennial Change (12,341) (81,225)
Biennial % Change (1) (4)
Expenditures by Category
Compensation 13,223 12,298 20,404 23,168 22,185 22,185
Operating Expenses 102,582 102,205 135,352 120,803 115,728 115,393
Capital Outlay-Real Property 931,259 942,211 848,723 942,903 864,593 871,493
Other Financial Transaction 691 674 1,449
Total 1,047,755 1,057,388 1,005,928 1,086,874 1,002,506 1,009,071
Full-Time Equivalents 141.67 139.99 205.07 224.30 211.80 211.60
State of Minnesota 48 2022-23 Biennial BudgetNovember 2020

State Road Construction Activity Financing by Fund
(Dollars in Thousands)
Actual
FY18
Actual
FY19
Actual
FY20
Estimate
FY21
Forecas
FY22
t Base
FY23
2000 - Restrict Misc Special RevenueBalance Forward In 3,783 24,755 19,486 12,777 39 30
Receipts 54,101 28,079 46,764 22,249 22,249 22,249
Balance Forward Out 24,755 19,560 12,778 39 30 20
Expenditures 33,129 33,275 53,472 34,987 22,258 22,259
Biennial Change in Expenditures 22,055 (43,942)
Biennial % Change in Expenditures 33 (50)
2700 - Trunk HighwayBalance Forward In 36,131 117,027 44,501 87,796 21,644 19,208
Direct Appropriation 1,028,010 909,101 964,295 949,282 949,282 949,282
Receipts 28,912 22,105 31,341 25,600 25,000 25,000
Transfers In 59,828 60,970 81,892 57,185 57,185 57,185
Transfers Out 59,828 40,502 81,892 57,185 57,185 57,185
Cancellations 1,903 1,396
Balance Forward Out 82,463 43,814 87,795 21,644 19,208 17,208
Expenditures 1,010,590 1,022,985 952,342 1,039,638 976,718 976,282
Biennial Change in Expenditures (41,595) (38,980)
Biennial % Change in Expenditures (2) (2)
Full-Time Equivalents 141.67 139.99 205.07 224.30 211.80 211.60
3000 - FederalBalance Forward In 84 134
Receipts 3,952 995 114 12,249 3,530 10,530
Expenditures 4,036 1,128 114 12,249 3,530 10,530
Biennial Change in Expenditures 7,199 1,697
Biennial % Change in Expenditures 139 14
State of Minnesota 49 2022-23 Biennial BudgetNovember 2020

Transportation Budget Activity Narrative
Program: State Roads Activity: Debt Service dot.state.mn.us/policy/financial/fm007.html
AT A GLANCE
Trunk Highway General Obligation Bonds: • $4.3 billion authorized since 2000 • $3.3 billion sold since 2000 • $154 million in three-year average annual expenditures of bond-funded projects • Debt service payments have grown from 7.4% of state revenues in Trunk Highway Fund in FY 2009 to
16.6% in FY 2021 • $4.2 billion in remaining debt service payments on all current bond authorizations
PURPOSE & CONTEXT
The state of Minnesota is authorized to issue General Obligation bonds for trunk highway purposes under Article XIV, section 11 of the constitution. Bonds are purchased to advance construction projects beyond what the State Road Construction and Federal funding programs can support in a given period. The Minnesota Department of Transportation is also authorized to enter into loan agreements using the Transportation Revolving Loan Fund and to enter into local government advance agreements. The debt service activity is funded by a direct appropriation from the Trunk Highway Fund. The Trunk Highway Fund, rather than the State’s General Fund, pays all of the debt service for Trunk Highway bonds.
SERVICES PROVIDED
This activity encompasses repayment of all debt related to the Trunk Highway System. This includes the required annual payment of the principal and interest on Trunk Highway bonds to the State Debt Service Fund from the Trunk Highway Fund, as well as payments to the Transportation Revolving Loan Fund for Trunk Highway loan agreements and repayments of advances from local governments. MnDOT works closely with Minnesota Management and Budget to coordinate activities related to selling bonds and forecasting both debt cash flow and debt service payments.
This activity also includes significant funding for the Corridors of Commerce program, established in Minnesota Statute 161.088 (https://www.revisor.mn.gov/statutes/cite/161.088), to be used for projects focused on capacity development or freight improvement that meet specific criteria. Since 2013, $1.0 billion in Trunk Highway bonds have been authorized for the Corridors of Commerce program.
Trunk Highway bonds have become an increasingly common financing tool in recent years, especially since the $1.8 billion approved in Minnesota Laws of 2008, Chapter 152. The total cost of repaying the bonds generally ranges between $1.30 and $1.50 for every $1.00 of bonds authorized (depending on prevailing interest rates), and are repaid over 20 years.
The current gas tax rate of 28.5 cents per gallon includes 3.5 cents dedicated to the debt service on the $1.8 billion of trunk highway bonds authorized in Laws of Minnesota 2008, Chapter 152. The $1.8 billion authorized in 2008 represents 42 percent of the bonds authorized since 2000. MnDOT prepares an annual analysis of the gas tax debt service surcharge required in Minnesota Statute 296A.083 (https://www.revisor.mn.gov/statutes/cite/296A.083). From FY 2009 to 2017, the debt surcharge revenue was greater than the debt service amounts – resulting in a positive amount transferred to the Trunk Highway Fund. Beginning in FY 2018 and thereafter, the debt service payments become larger than the surcharge revenues, which will reduce the Trunk Highway Fund balance. In total, this imbalance is projected to result in a
State of Minnesota 50 2022-23 Biennial BudgetNovember 2020

cumulative reduction to the Trunk Highway Fund balance of $354 million by the end of the FY 2022-23 biennium. This imbalance grows to $409 million by FY 2039. The full 3.5 cent tax will continue to be collected but falls short of recovering the debt service forecast amount of $2.2 billion from FY 2009 through FY 2039.
RESULTS
Minnesota’s goals for the transportation system are established in the Minnesota State Highway Investment Plan (MnSHIP). Bond financing, particularly when interest rates are low, is an important strategy for funding transportation projects. The key goal for the debt service activity is to balance the needs of the transportation system by maximizing the funding resources available within a financially sound debt management policy. In 2010, statutory language was enacted that required MnDOT to develop a debt management policy, Minnesota Statute 167.60 (https://www.revisor.mn.gov/statutes/cite/167.60). The policy is important to ensure that debt obligations do not materially impact funding levels for other budget activities. MnDOT policy states that debt service cannot exceed 20 percent of annual projected state revenues to the Trunk Highway Fund. The graph below depicts the most current debt service estimates compared with the policy limit. The current projected debt service peaks at 16.6 percent in FY 2021.
State of Minnesota 51 2022-23 Biennial BudgetNovember 2020

The Department of Transportation’s Debt Service activity legal authority comes from: Minnesota Constitution Article XIV, Section 6 and 11 (https://www.revisor.leg.state.mn.us/constitution/#article_14) Trunk Highway Revolving Loan Account, M.S. 161.04, Subd. 3 and 4 (https://www.revisor.leg.state.mn.us/statutes/?id=161.04) Advance Funding for Trunk Highway Projects, M.S. 161.361 (https://www.revisor.leg.state.mn.us/statutes/?id=161.361) Trunk Highway Bond Account, M.S. 167.51 (https://www.revisor.mn.gov/statutes/cite/167.51)
State of Minnesota 52 2022-23 Biennial BudgetNovember 2020

Debt Service Activity Expenditure Overview
(Dollars in Thousands)
Actual
FY18
Actual
FY19
Actual
FY20
Estimate
FY21
Forecas
FY22
t Base
FY23
Expenditures by Fund
2700 - Trunk Highway 403 403 403 3,000 3,000 3,000
Total 403 403 403 3,000 3,000 3,000
Biennial Change 2,597 2,597
Biennial % Change 322 76
Expenditures by Category
Other Financial Transaction 403 403 403 3,000 3,000 3,000
Total 403 403 403 3,000 3,000 3,000
State of Minnesota 53 2022-23 Biennial BudgetNovember 2020

Debt Service Activity Financing by Fund
(Dollars in Thousands)
Actual
FY18
Actual
FY19
Actual
FY20
Estimate
FY21
Forecas
FY22
t Base
FY23
2700 - Trunk HighwayBalance Forward In 26,215
Direct Appropriation 254,974 242,325 236,439 250,766 225,773 259,735
Transfers Out 211,009 214,903 209,821 177,571 222,773 256,735
Cancellations 43,561 27,019 96,410
Balance Forward Out 26,215
Expenditures 403 403 403 3,000 3,000 3,000
Biennial Change in Expenditures 2,597 2,597
Biennial % Change in Expenditures 322 76
State of Minnesota 54 2022-23 Biennial BudgetNovember 2020

Transportation Budget Activity Narrative
Program: State Roads Activity: Operations and Maintenance dot.state.mn.us/ dot.state.mn.us/maintenance/
AT A GLANCE
MnDOT maintains: • 12,000 certified centerline state highway miles (29,000 lane miles), including the state owned portion
of the National Highway System (NHS) • 4,218 traffic management systems (signals, ramp meters, changeable message signs, cameras, and road
weather information stations) • 726 miles of cable median barrier • 29,450 highway lighting fixtures • 4,796 bridges greater than 10 feet in length on Trunk Highway routes (including rail road, pedestrian
and other structures) • 39,130 highway culverts • 256,678 acres of highway right of way (including wetlands and ponds) • 854 snowplows • 1,075 individual buildings (including 187 radio equipment shelters)
PURPOSE & CONTEXT
State managed roads make up only 8.3 percent of Minnesota’s roads, but carry nearly 60 percent of total traffic volume with more than 95 million vehicle miles driven every day. Safety and efficiency is integral to the work we perform daily.
MnDOT maintenance: • Clears snow and debris from Minnesota roadways • Repairs and improves highways, bridges, shoulders, safety devices, and traffic management systems • Maintains the fleet, equipment, and buildings necessary to perform maintenance activities • Performs striping, signage, and roadway lighting structure activities • Preserves and optimizes investments while delivering faster, smoother, and more reliable trips • Responds to emergencies 24 hours per day, 365 days per year and provides services regardless of snow,
rain, floods, construction, or emergencies
MnDOT prepares for and adapts to the challenges and opportunities that enable us to advance our objective of operational excellence by getting the best performance out of the roadways. Our operations address changing traffic and environmental conditions in a cost effective manner, providing effective stewardship of public resources.
SERVICES PROVIDED
Bridges and Structures Maintenance
MnDOT inspects 4,901 state highway bridges in accordance with state and federal requirements, as well as additional inspections due to unforeseen events. Federal rules require that all bridges are inspected on a one or two year cycle. See the Bridge Office website (http://www.dot.state.mn.us/bridge/inspection.html) for more information on bridge inspection.
State of Minnesota 55 2022-23 Biennial BudgetNovember 2020

MnDOT performs preventive maintenance to extend the service life of state managed bridges by protecting these assets from exposure to moisture and corrosive agents like salt. Preventive routine maintenance includes sealing cracks, joints, and railings, spot painting, lubrication of expansion bearings, and flushing of the bridge deck and superstructure and substructure elements with water to remove winter residue to reduce the frequency and scope of future repairs.
Reactive maintenance repairs are prioritized as high, medium or low priority and is a response to a condition discovered during an inspection or maintenance or when a vehicle damages a bridge. High priority includes deficiencies that could affect safe function of the bridge or result in deterioration to a critical condition. See our Bridge Office website for more information on Bridge Construction and Maintenance (http://www.dot.state.mn.us/bridge/maintenance.html).
Traffic Devices Operation and Maintenance
To increase freeway and arterial efficiency, reduce crashes and provide travelers with information we operate the Regional Transportation Management Center (RTMC) (http://www.dot.state.mn.us/rtmc), support the Southern Regional Communication Center (SRCC), operate a central traffic signal control system, staff district traffic engineering offices, and provide an Electrical Services section and the Freeway Incident Response Safety Team. These activities provide travelers with current travel times and critical roadway information, including Amber Alerts and road condition information from our Roadway Weather Information System. We relay this information using changeable message signs, the Internet and telephones. We also operate and maintain traffic signals statewide, install and repair signs and roadway lighting, stripe roads, install and repair guardrails, and maintain cable median barriers. See our websites for more information on MnDOT Traffic Engineering (http://www.dot.state.mn.us/trafficeng) and MN 511 (http://www.511mn.org).
In order to gain the best outcomes from the existing transportation infrastructure we implement Transportation System Management and Operations (TSMO) strategies. These are operational strategies that increase safety by reducing the frequency, severity and clearance times of crashes that improve reliability, mobility, and efficiency by maximizing the existing roadway capacity and reducing recurring and non-recurring congestion. Examples of TSMO strategies include traffic incident management, traveler information, safety service patrols, ramp metering, optimizing traffic signal timing, work zone management, and road weather management.
Road and Roadside Maintenance
To keep roads safe and in good operating condition, we patch potholes, seal cracks, pave road surfaces, remove debris (including the Adopt-a-Highway program), repair or replace culverts, maintain roadway shoulders, and respond to flooding. Inspection programs help in reducing infrastructure risk as well as improved planning. We also measure highway smoothness and remaining pavement life to inform and prioritize our work. This information helps us make timely investments to prolong pavement life.
Maintenance crews mow, control noxious weeds, remove trees and brush, issue permits for public roadway activities like utility work, and maintain rest areas and weigh stations. See our websites for more information on roadway vegetation management (http://www.dot.state.mn.us/roadsides/vegetation/index.html) and rest areas (http://www.dot.state.mn.us/restareas/). The state also owns more than 256,000 acres of right of way that is managed within the operations and maintenance activity.
In FY2019, MnDOT submitted a required Transportation Asset Management Plan (TAMP) (http://www.dot.state.mn.us/assetmanagement/tamp.html) to the FHWA. The plan describes asset inventory and condition information, performance measures and targets, risks, financial plans, and life cycle cost assessments. These assessments help MnDOT evaluate the cost effectiveness of existing management and investment practices, and identify areas where process improvements can be made. The plan also acts as a vehicle for better
State of Minnesota 56 2022-23 Biennial BudgetNovember 2020

integration between MnDOT’s Capital Investment and Maintenance programs. MnDOT is currently working across the agency to fully implement the TAMP through a “Strategic Implementation” planning process.
MnDOT collects operations and maintenance cost data and a broader range of asset inventory and condition information with the implementation of a statewide Transportation Asset Management System (TAMS). The software has been implemented for several of MnDOT’s asset classes and operational activities and is functioning as expected. In the fall of 2017, MnDOT performed a statewide asset survey. The automated data collection and subsequent processing resulted in additional asset inventory information for numerous asset classes and will allow us to more actively manage a fuller range of assets; reducing risks, prioritizing high return services, and fully reflecting costs. The benefits of TAMS are seen in areas such as storing information on asset inventories, condition assessments or capturing labor, equipment and material quantities, and costs via work orders for maintenance and operations work activities. The system is nearing full maturity with over a million assets in inventory, and numerous integrations and functions to support items such as field creation of work orders, damage restitution billing, uploads to the timesheet system, GIS mapping integrations and outputs, performance measurement etc.
Snow and Ice
MnDOT’s snow and ice activities include pre-storm preparation (including stockpile set up, equipment preparations and pre-treatment of roads and bridges), snow plowing and ice removal during storm events and post storm clean-up of snow and ice. For snow events, snowfighters are deployed across all areas of the storm.
Snow plowing on Minnesota’s 12,000 centerline miles of roads is both resource and labor intensive, and extremely tough on equipment. MnDOT maintains a flexible and responsive workforce to fight winter storms. During the winter, some employees may be reassigned from other areas of the department (such as construction or program planning and delivery) to plowing duties, or serve in a back-up snowfighter status.
MnDOT has statutory language (originally authorized in 2017 and modified in 2019) that allows using up to 50 percent of unappropriated Trunk Highway fund balance, instead of reducing other maintenance activities, for additional snow and ice needs in a fiscal year where expenditures exceed 100 percent of the established annual snow and ice expenditure level (Minnesota Statute 174.57 (https://www.revisor.mn.gov/statutes/cite/174.57). In compliance with this statute, MnDOT developed estimated annual expenditure levels for snow and ice management for the current FY 2020-21 biennium of $80 million/year. These estimates were based on historical average snow and ice management expenditures. In FY 2020, MnDOT expended approximately $85 million on snow and ice management activities. For the upcoming FY 2022-23 biennium, the estimated annual expenditure level will increase to an estimated $85 million/year.
MnDOT maximizes its winter resources through proactive implementation of new technology. Snow plows are equipped with automated vehicle location (AVL) technologies, as well as a decision support tool which helps snowfighters make optimal decisions related to the plowing process and chemical usage. MnDOT’s snow and ice performance measures are customer driven and based on extensive customer market research. See our website for more information on snow and ice (http://www.dot.state.mn.us/maintenance/) which includes the most current “Annual At-a-Glance Winter report 2019-2020.”
RESULTS
Bridges and Structures Maintenance Performance
MnDOT measures the timeliness of bridge inspections and of completing high priority reactive maintenance. The bridge fracture critical inspection goal is to complete 100 percent of inspections on time (98 percent for routine inspections). This goal exceeds the 95 percent target established in the National Bridge Inspection Standards.
The bridge maintenance goal is to complete 100 percent of high priority reactive maintenance on time. MnDOT has met this goal the last four years. Achieving this performance measure on time will ensure the safe function
State of Minnesota 57 2022-23 Biennial BudgetNovember 2020

and structural health of the bridge, along with extending the service life of the bridge, saving time and money in the long run, and enhancing safety for the traveling public. Additional performance measures are in development to track preventive maintenance activities such as flushing, bridge deck crack sealing, and expansion joint condition.
Traffic Devices Operation and Maintenance
MnDOT is a partner in the Toward Zero Deaths Initiative (http://www.minnesotatzd.org/) to help reduce injuries and deaths on the highway.
Recurring congestion is minimized through a sophisticated traffic management system, while non-recurring congestion (crashes, stalls) is reduced through quick clearance response. MnDOT expects congestion to remain the same or increase as the region continues to grow. Since 2010, MnDOT’s strategy has shifted away from reducing congestion toward providing alternatives to congested travel. MnPASS Express Lanes provide for cost-effectively improving the efficiency and sustainability of the region’s highway and transit systems. MnPASS uses market-based, congestion pricing principles to manage travel demand during peak-travel times and provide a congestion-free option for transit, carpools, motorcycles and a fee-based option to solo motorists. Eighty percent of MnPASS users are either riding on buses or in a carpool. The typical MnPASS lane operates as a regular lane open to all traffic nearly 90 percent of the time.
Traffic incidents, like crashes, cause major congestion on the Twin Cities Metro area freeway system. Incident clearance time is measured on the system between 6 a.m. and 7 p.m. on weekdays. The target is incident clearance within 35 minutes to minimize delays. MnDOT has met this target for the past seven years.
Road and Roadside Maintenance Performance
MnDOT is committed to protecting, maintaining, and preserving our roads. In doing so, we maximize taxpayers’ investments in better, longer-lasting roads for smoother, safer, and more efficient travel. MnDOT measures pavement cracking based on a surface ranking index that has a zero to four scale, with a four meaning no cracks. Typically, a rating of less than 3.2 receives some sort of patching.
State of Minnesota 58 2022-23 Biennial BudgetNovember 2020
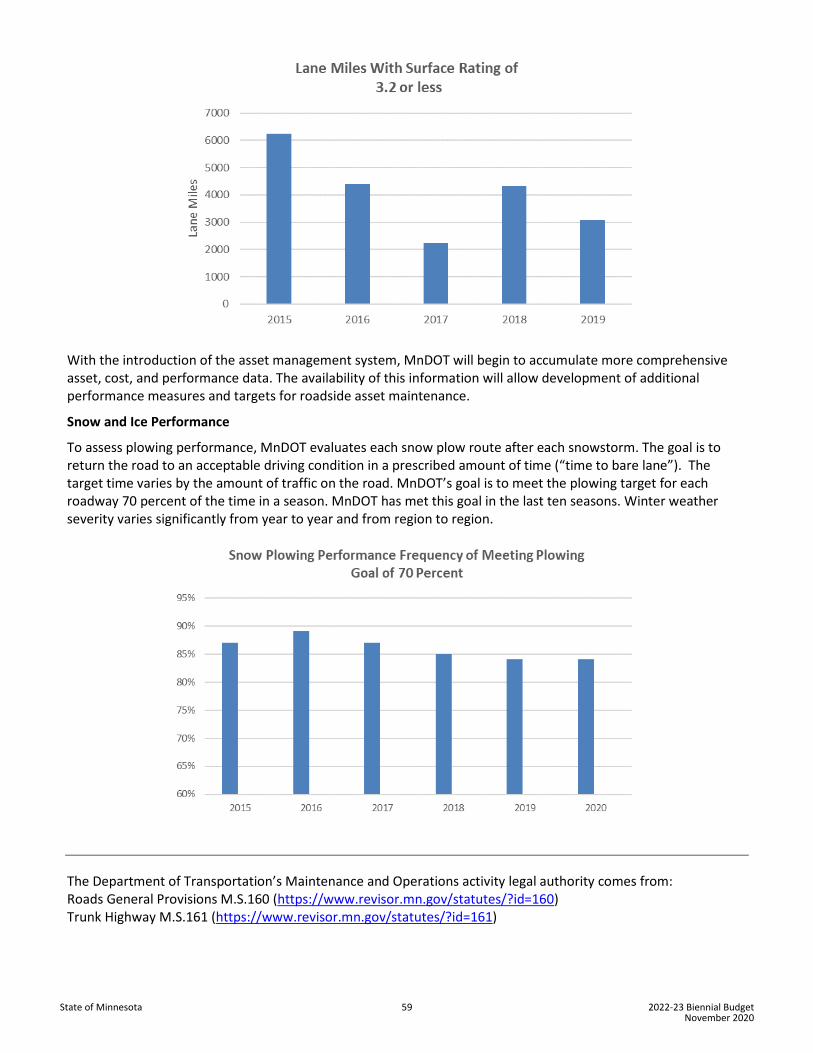
With the introduction of the asset management system, MnDOT will begin to accumulate more comprehensive asset, cost, and performance data. The availability of this information will allow development of additional performance measures and targets for roadside asset maintenance.
Snow and Ice Performance
To assess plowing performance, MnDOT evaluates each snow plow route after each snowstorm. The goal is to return the road to an acceptable driving condition in a prescribed amount of time (“time to bare lane”). The target time varies by the amount of traffic on the road. MnDOT’s goal is to meet the plowing target for each roadway 70 percent of the time in a season. MnDOT has met this goal in the last ten seasons. Winter weather severity varies significantly from year to year and from region to region.
The Department of Transportation’s Maintenance and Operations activity legal authority comes from: Roads General Provisions M.S.160 (https://www.revisor.mn.gov/statutes/?id=160) Trunk Highway M.S.161 (https://www.revisor.mn.gov/statutes/?id=161)
State of Minnesota 59 2022-23 Biennial BudgetNovember 2020

Operations and Maintenance Activity Expenditure Overview
(Dollars in Thousands)
Actual
FY18
Actual
FY19
Actual
FY20
Estimate
FY21
Forecas
FY22
t Base
FY23
Expenditures by Fund
2000 - Restrict Misc Special Revenue 13,061 14,377 13,315 15,043 12,304 13,038
2001 - Other Misc Special Revenue 391 386 442 642 632 447
2050 - Environment & Natural Resources 46 97 65 137
2700 - Trunk Highway 314,183 389,460 353,091 397,743 375,413 373,926
3000 - Federal 567 574 359 4,110 2,850 2,350
Total 328,248 404,895 367,272 417,675 391,199 389,761
Biennial Change 51,804 (3,987)
Biennial % Change 7 (1)
Expenditures by Category
Compensation 188,049 195,878 206,552 214,869 216,736 216,961
Operating Expenses 110,396 150,318 130,056 158,954 138,438 138,369
Grants, Aids and Subsidies 11 411 9 10 10 10
Capital Outlay-Real Property 23,790 48,218 25,010 32,247 28,073 28,073
Other Financial Transaction 6,001 10,069 5,644 11,595 7,942 6,348
Total 328,248 404,895 367,272 417,675 391,199 389,761
Total Agency Expenditures 328,248 404,895 367,272 417,675 391,199 389,761
Internal Billing Expenditures 8
Expenditures Less Internal Billing 328,248 404,887 367,272 417,675 391,199 389,761
Full-Time Equivalents 2,354.40 2,419.40 2,434.64 2,435.44 2,432.98 2,432.92
State of Minnesota 60 2022-23 Biennial BudgetNovember 2020

Operations and Maintenance Activity Financing by Fund
(Dollars in Thousands)
Actual
FY18
Actual
FY19
Actual
FY20
Estimate
FY21
Forecas
FY22
t Base
FY23
2000 - Restrict Misc Special RevenueBalance Forward In 8,883 10,616 13,111 10,226 5,188 3,945
Receipts 13,480 14,207 10,430 10,005 11,061 12,188
Transfers In 6 4,706 1
Transfers Out 4,706 1
Balance Forward Out 9,308 10,446 10,226 5,188 3,945 3,095
Expenditures 13,061 14,377 13,315 15,043 12,304 13,038
Biennial Change in Expenditures 920 (3,016)
Biennial % Change in Expenditures 3 (11)
Full-Time Equivalents 17.77 17.34 15.55 13.65 13.65 13.65
2001 - Other Misc Special RevenueBalance Forward In 112 115 8,143 8,180 8,103 8,119
Receipts 406 433 478 565 648 484
Balance Forward Out 127 161 8,179 8,103 8,119 8,156
Expenditures 391 386 442 642 632 447
Biennial Change in Expenditures 307 (5)
Biennial % Change in Expenditures 39 (0)
Full-Time Equivalents 0.13 0.87 0.98 0.98 0.98 0.98
2050 - Environment & Natural ResourcesBalance Forward In 299 202 137
Direct Appropriation 345
Balance Forward Out 299 202 137
Expenditures 46 97 65 137
Biennial Change in Expenditures 59 (202)
Biennial % Change in Expenditures 41 (100)
Full-Time Equivalents 0.37 1.05 0.68 0.82
2400 - EndowmentBalance Forward In 7,654 7,771
Receipts 116 182
Balance Forward Out 7,771 7,953
State of Minnesota 61 2022-23 Biennial BudgetNovember 2020

Operations and Maintenance Activity Financing by Fund
(Dollars in Thousands)
Actual
FY18
Actual
FY19
Actual
FY20
Estimate
FY21
Forecas
FY22
t Base
FY23
2700 - Trunk HighwayBalance Forward In 7,161 45,975 10,888 27,357 6,497 5,107
Direct Appropriation 340,475 342,856 361,811 367,165 364,305 362,811
Receipts 10,275 9,753 7,750 9,718 9,718 9,718
Transfers In 156,857 185,231 163,208 138,438 148,290 148,290
Transfers Out 156,857 185,231 163,208 138,438 148,290 148,290
Cancellations 725
Balance Forward Out 43,728 8,398 27,358 6,497 5,107 3,710
Expenditures 314,183 389,460 353,091 397,743 375,413 373,926
Biennial Change in Expenditures 47,191 (1,495)
Biennial % Change in Expenditures 7 (0)
Full-Time Equivalents 2,336.13 2,400.14 2,417.43 2,419.99 2,418.35 2,418.29
3000 - FederalBalance Forward In 15 17 16 11
Receipts 569 571 354 4,099 2,850 2,350
Balance Forward Out 17 14 11
Expenditures 567 574 359 4,110 2,850 2,350
Biennial Change in Expenditures 3,327 731
Biennial % Change in Expenditures 292 16
State of Minnesota 62 2022-23 Biennial BudgetNovember 2020

Transportation Budget Activity Narrative
Program: State Roads Activity: Statewide Radio Communications dot.state.mn.us/oec dps.mn.gov/divisions/ecn/programs/armer/
AT A GLANCE
• ARMER System o More than 84,000 subscribers to the Allied Radio Matrix for Emergency Response (ARMER) o 334 of the planned 335 ARMER towers constructed and on the air o Systems availability is 97% (percent of time all sites are on the air and in service) o 595 tower leases with partners
• Radio/Electronic System Maintenance o 17 radio repair facilities statewide o 9,900 mobile and portable radios maintained for state agencies o 3,708 base station radios maintained for state agencies o 87 Road Weather Information System sites maintained across the state
PURPOSE & CONTEXT
Statewide Radio Communications builds, maintains, owns, and operates the Allied Radio Matrix for Emergency Response (ARMER) backbone. This is Minnesota’s shared public safety radio communication system that provides around the clock interoperable radio communication service to multiple federal, tribal, state, and local agencies.
ARMER serves the day-to-day and emergency two-way radio communication needs of MnDOT, the Department of Public Safety (DPS) and other state agencies, as well as the majority of local and regional law enforcement agencies. This includes fire, emergency medical, and public works services.
The system is a network of radio towers, equipment shelters, and radio transmission equipment which is shared by network users throughout the state. This is identified in the Statewide Radio Communication Plan maintained by the Statewide Emergency Communications Board (SECB).
Statewide Radio Communications strengthens relationships with all operating entities and stakeholders, including all 87 counties and their emergency services through meetings with the Regional Advisory Committees. We strive for operational excellence by providing wide area network coverage of the Interoperable system to its customers, of which there are more than 84,000 active users/subscribers on ARMER.
SERVICES PROVIDED
Part of Statewide Radio Communications’ investment and planning function is to provide overall electrical engineering direction for the strategic and tactical planning of wireless, voice and data systems for ARMER and other public safety or transportation applications (Road and Weather Information System (RWIS), automatic vehicle location (AVL), dispatcher console systems, audio loggers, remote site data connections, and camera systems). This includes electronic communication system engineering, design and construction expertise to offices and districts and other state and local agencies. Statewide Radio Communications also serves as the public safety radio spectrum frequency advisor for the state of Minnesota.
Management of the system requires us to monitor, repair, upgrade and replace the radio communications infrastructure, facilities, base stations, and mobile and portable radios. The agency also provides maintenance for
State of Minnesota 63 2022-23 Biennial BudgetNovember 2020

electronic equipment, such as road weather information systems. We manage private and public tower lease/rental space for antenna use statewide.
In working with other state and local agencies, including the Department of Public Safety and the Department of Natural Resources, we provide emergency service response for public safety electronic communications systems and shared expertise and technical services. As the lead agency, we provide Minnesota with the infrastructure and resources to allow its emergency responders to communicate with each other at any time regardless of the nature or scope of an event.
The ARMER system build-out is on schedule and on budget. Of 335 planned towers, 334 are complete. The final site has been acquired and construction is in progress and is to be completed in calendar year 2020. With construction of the ARMER system nearing completion the focus is now on system maintenance, lifecycle planning and upgrades. Lifecycle planning includes all elements of the system: radio system, microwave radio connectivity, radio towers, equipment buildings and backup power systems.
RESULTS
* Prior to 2015 system was under construction
The legal authority for the Statewide Radio Communications activity comes from: Public Safety Radio Communications, M.S. 174.70 (https://www.revisor.mn.gov/statutes/?id=174.70) M.S. 403 (https://www.revisor.mn.gov/statutes/?id=403)
State of Minnesota 64 2022-23 Biennial BudgetNovember 2020

Statewide Radio Communications Activity Expenditure Overview
(Dollars in Thousands)
Actual
FY18
Actual
FY19
Actual
FY20
Estimate
FY21
Forecas
FY22
t Base
FY23
Expenditures by Fund
1000 - General 3 3 3 3 3 3
2000 - Restrict Misc Special Revenue 4,048 4,056 4,107 3,780 3,780 3,780
2001 - Other Misc Special Revenue 3,332 3,343 3,361 3,380 3,373 3,373
2700 - Trunk Highway 5,851 7,355 7,931 7,987 7,549 7,549
4900 - 911 Emergency 9,359 9,987 9,309 10,041 9,675 9,675
Total 22,594 24,743 24,710 25,191 24,380 24,380
Biennial Change 2,564 (1,141)
Biennial % Change 5 (2)
Expenditures by Category
Compensation 8,665 8,778 8,635 9,089 9,226 9,258
Operating Expenses 7,771 14,026 13,658 13,727 13,515 13,515
Grants, Aids and Subsidies 1
Capital Outlay-Real Property 5,947 903 2,280 832 680 680
Other Financial Transaction 212 1,035 137 1,543 959 927
Total 22,594 24,743 24,710 25,191 24,380 24,380
Full-Time Equivalents 90.06 89.46 85.26 85.67 85.67 85.67
State of Minnesota 65 2022-23 Biennial BudgetNovember 2020
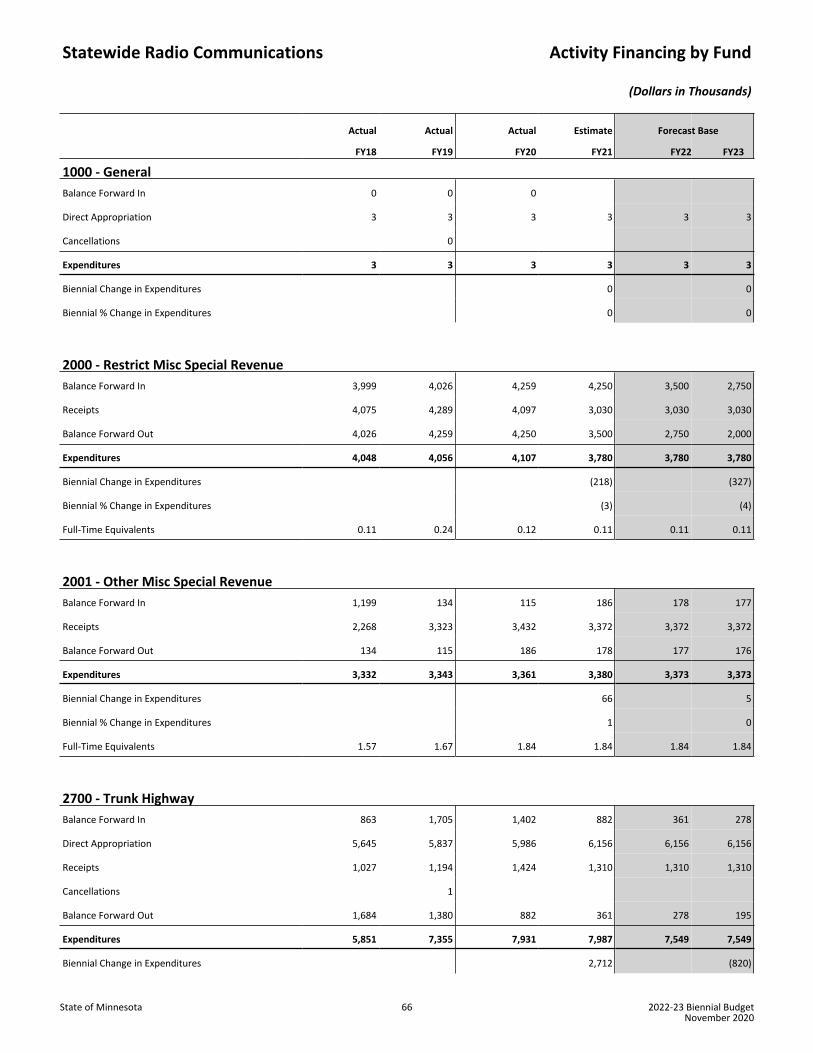
Statewide Radio Communications Activity Financing by Fund
(Dollars in Thousands)
Actual
FY18
Actual
FY19
Actual
FY20
Estimate
FY21
Forecas
FY22
t Base
FY23
1000 - GeneralBalance Forward In 0 0 0
Direct Appropriation 3 3 3 3 3 3
Cancellations 0
Expenditures 3 3 3 3 3 3
Biennial Change in Expenditures 0 0
Biennial % Change in Expenditures 0 0
2000 - Restrict Misc Special RevenueBalance Forward In 3,999 4,026 4,259 4,250 3,500 2,750
Receipts 4,075 4,289 4,097 3,030 3,030 3,030
Balance Forward Out 4,026 4,259 4,250 3,500 2,750 2,000
Expenditures 4,048 4,056 4,107 3,780 3,780 3,780
Biennial Change in Expenditures (218) (327)
Biennial % Change in Expenditures (3) (4)
Full-Time Equivalents 0.11 0.24 0.12 0.11 0.11 0.11
2001 - Other Misc Special RevenueBalance Forward In 1,199 134 115 186 178 177
Receipts 2,268 3,323 3,432 3,372 3,372 3,372
Balance Forward Out 134 115 186 178 177 176
Expenditures 3,332 3,343 3,361 3,380 3,373 3,373
Biennial Change in Expenditures 66 5
Biennial % Change in Expenditures 1 0
Full-Time Equivalents 1.57 1.67 1.84 1.84 1.84 1.84
2700 - Trunk HighwayBalance Forward In 863 1,705 1,402 882 361 278
Direct Appropriation 5,645 5,837 5,986 6,156 6,156 6,156
Receipts 1,027 1,194 1,424 1,310 1,310 1,310
Cancellations 1
Balance Forward Out 1,684 1,380 882 361 278 195
Expenditures 5,851 7,355 7,931 7,987 7,549 7,549
Biennial Change in Expenditures 2,712 (820)
State of Minnesota 66 2022-23 Biennial BudgetNovember 2020
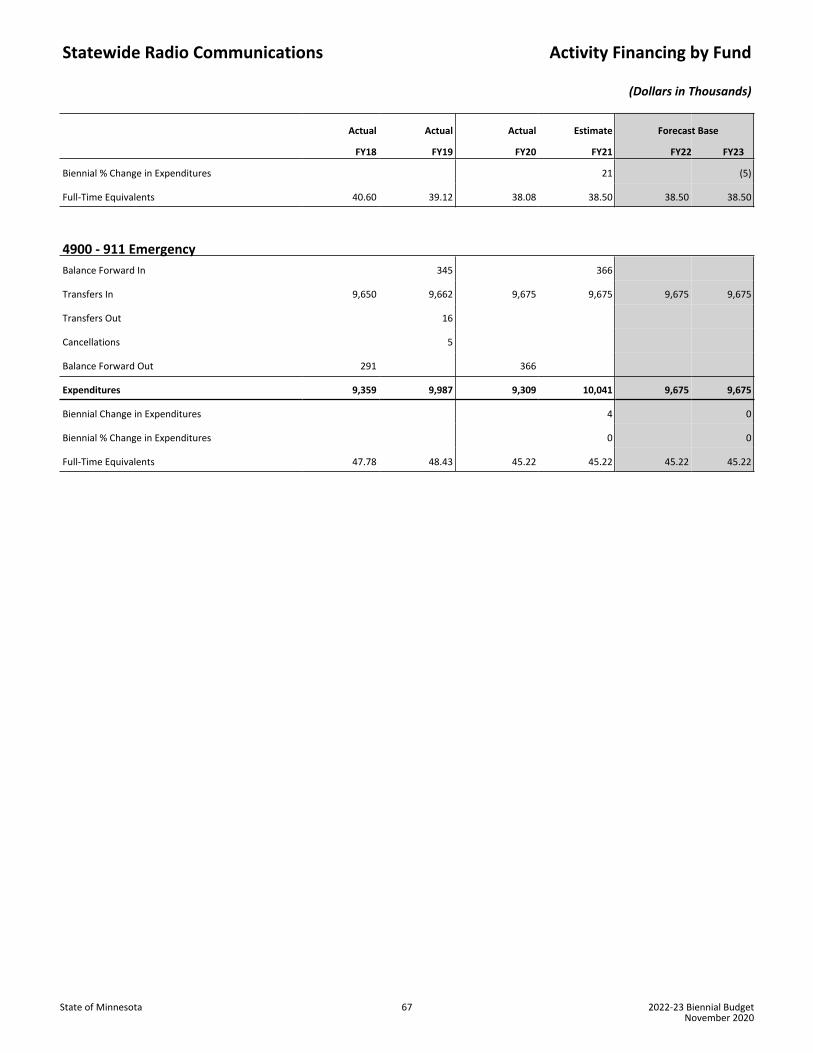
Statewide Radio Communications Activity Financing by Fund
(Dollars in Thousands)
Actual
FY18
Actual
FY19
Actual
FY20
Estimate
FY21
Forecas
FY22
t Base
FY23
Biennial % Change in Expenditures 21 (5)
Full-Time Equivalents 40.60 39.12 38.08 38.50 38.50 38.50
4900 - 911 EmergencyBalance Forward In 345 366
Transfers In 9,650 9,662 9,675 9,675 9,675 9,675
Transfers Out 16
Cancellations 5
Balance Forward Out 291 366
Expenditures 9,359 9,987 9,309 10,041 9,675 9,675
Biennial Change in Expenditures 4 0
Biennial % Change in Expenditures 0 0
Full-Time Equivalents 47.78 48.43 45.22 45.22 45.22 45.22
State of Minnesota 67 2022-23 Biennial BudgetNovember 2020

Transportation Budget Activity Narrative
Program: Local Roads Activity: County State Aid Roads dot.state.mn.us/stateaid/
AT A GLANCE
• 87 counties • 30,760 miles of County State Aid Highways (CSAH) make up approximately 20% of all Minnesota
roadways • 5,800 bridges on the CSAH system • 55,527 township road miles • 6,220 township bridges • Annually approved on average:
o 586 CSAH projects o 151 federal aid projects o 32 Local Road Improvement Program projects (county/township) o 44 Local Bridge Replacement Program projects (county) o 66 township bridge projects
PURPOSE & CONTEXT
State Aid for Local Transportation (SALT) provides customer service to Minnesota counties through distribution of the annual allocation from the Highway User Tax Distribution Fund (HUTD), general obligation bonding for local bridges and road improvements, and Federal Highway Administration funds.
A portion of funds from the HUTD are for construction and system maintenance on the County State Aid Highways (CSAH) system, with a small portion available to townships for maintenance and bridge replacement. The other funding sources are primarily for construction on the CSAH system.
Counties select construction projects and perform maintenance activities within their jurisdictions, which include identified roads within cities with a population of less than 5,000. SALT reviews and approves local individual construction plans for compliance with state and federal laws, standards, and rules.
In engaging our customers, we assist in planning for, constructing, and maintaining the CSAH system. Through this work we ensure the effective and efficient use of public resources for long-term investments that respond to the evolving needs of counties throughout the state.
SERVICES PROVIDED
Customer Service:
SALT builds relationships with county highway departments to plan, build, operate and maintain Minnesota’s multimodal transportation system to maximize investments and optimize system performance. SALT administers local bridge and road improvement bond funds on a priority basis to supplement costly bridge replacement and improve safety and mobility on local roads. We also provide counties with technical resources and materials, such as crash record data. Financial customer service includes processing payments for construction projects, annual maintenance allotments, providing training, and procedural guidance. SALT maximizes resources by collaborating across jurisdictional boundaries and connecting agencies on common issues and improvements.
State of Minnesota 68 2022-23 Biennial BudgetNovember 2020

SALT reviews and approves construction plans along with project funding requests to ensure consistency with rules for State Aid operation. We collaborate with counties on construction, maintenance, and project delivery costs, as well as project activities to provide the best value with limited resources. A small portion of the HUTD is used to support a research board made up of county engineers and State Aid employees. This board researches methods and materials for innovation and economical improvements for maintenance and construction.
Federal Aid:
SALT also acts as an agent for the local authorities in the administration of their federal construction contracts to fulfill the state’s obligations for federal oversight of all local federal aid projects. We assist local agencies in completing the requirements for federal aid, including public involvement, small business participation, and documentation to comply with environmental and historic preservation requirements.
Other HUTD Funding:
• Administration functions are funded from an allocation from the HUTD Fund established in statute at two percent of available funds.
• One percent of available funds are set aside for a disaster account to assist counties with extraordinary disaster costs when they arise.
• The State Park Road Account is an account that provides funding for access roads to state parks and recreational areas. These projects are selected by the Department of Natural Resources.
• The Town Road Account identified in statute is distributed from the HUTD Fund through the counties to township governments for maintenance of township roads.
• The Town Bridge Account is distributed to counties for the replacement of deficient township bridges through the five percent set aside from the HUTD Fund.
RESULTS
Safety
Safety on the CSAH system is measured in both the total number of crashes that occur and the number of serious crashes (fatalities and life changing crashes).
Note: In 2016, Minnesota revised the crash reporting system. The new system modified the classifications and definitions of injury severity bringing the State of Minnesota in compliance with the Federal Standards. As a result the 2016 Crash Facts saw a spike in the number of serious injuries. Due to the change in injury severity definitions, direct comparisons to historical data cannot be made.
State of Minnesota 69 2022-23 Biennial BudgetNovember 2020

Pavement Condition
Over the past six years, Pavement Condition – Ride Quality Index (RQI) has been on a downward trend in the percentage of pavement on the CSAH system that is rated in “Poor” condition based on the RQI.
* Values for each year are based on that year or the previous most recent year for all counties.
Bridge Condition
The percentage of bridges rated in “Poor” condition has increased slightly since 2015.
The legal authority for the County State Aid Highways activity comes from: Distribution of State Aid funds to counties and cities, Constitution of MN, Article XIV (https://www.revisor.mn.gov/constitution/#article_14) Legal authority for the State Aid system, M.S. 162 (https://www.revisor.mn.gov/statutes/?id=162)
State of Minnesota 70 2022-23 Biennial BudgetNovember 2020

County State Aid Roads Activity Expenditure Overview
(Dollars in Thousands)
Actual
FY18
Actual
FY19
Actual
FY20
Estimate
FY21
Forecas
FY22
t Base
FY23
Expenditures by Fund
1000 - General 5,000 5,000
2000 - Restrict Misc Special Revenue 347 175 452 1,200 2,497 2,496
2600 - County State Aid Highway 731,088 781,514 795,902 817,997 865,222 883,277
3000 - Federal 141,932 152,180 177,407 353,172 287,450 287,950
3520 - Transportation-Loc Bridge&Road 779 6,436 17,232 18,896 19,351
Total 878,367 939,647 980,197 1,189,601 1,174,065 1,193,074
Biennial Change 351,784 197,341
Biennial % Change 19 9
Expenditures by Category
Compensation 7,249 7,312 7,671 7,978 8,090 8,098
Operating Expenses 6,877 7,324 6,586 17,594 17,092 17,578
Grants, Aids and Subsidies 860,255 913,265 961,230 1,123,536 1,095,529 1,111,544
Capital Outlay-Real Property 3,984 11,743 4,709 40,489 53,350 55,850
Other Financial Transaction 2 3 1 4 4 4
Total 878,367 939,647 980,197 1,189,601 1,174,065 1,193,074
Full-Time Equivalents 49.55 52.29 52.65 52.65 52.65 52.65
State of Minnesota 71 2022-23 Biennial BudgetNovember 2020
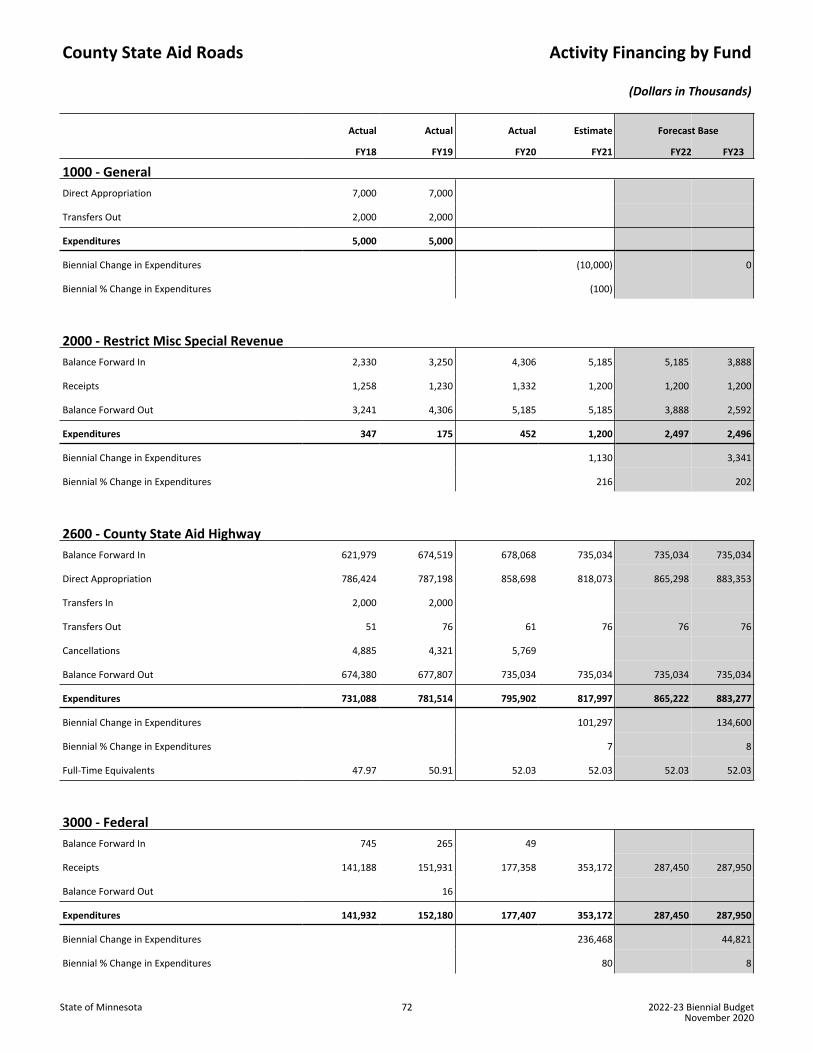
County State Aid Roads Activity Financing by Fund
(Dollars in Thousands)
Actual
FY18
Actual
FY19
Actual
FY20
Estimate
FY21
Forecas
FY22
t Base
FY23
1000 - GeneralDirect Appropriation 7,000 7,000
Transfers Out 2,000 2,000
Expenditures 5,000 5,000
Biennial Change in Expenditures (10,000) 0
Biennial % Change in Expenditures (100)
2000 - Restrict Misc Special RevenueBalance Forward In 2,330 3,250 4,306 5,185 5,185 3,888
Receipts 1,258 1,230 1,332 1,200 1,200 1,200
Balance Forward Out 3,241 4,306 5,185 5,185 3,888 2,592
Expenditures 347 175 452 1,200 2,497 2,496
Biennial Change in Expenditures 1,130 3,341
Biennial % Change in Expenditures 216 202
2600 - County State Aid HighwayBalance Forward In 621,979 674,519 678,068 735,034 735,034 735,034
Direct Appropriation 786,424 787,198 858,698 818,073 865,298 883,353
Transfers In 2,000 2,000
Transfers Out 51 76 61 76 76 76
Cancellations 4,885 4,321 5,769
Balance Forward Out 674,380 677,807 735,034 735,034 735,034 735,034
Expenditures 731,088 781,514 795,902 817,997 865,222 883,277
Biennial Change in Expenditures 101,297 134,600
Biennial % Change in Expenditures 7 8
Full-Time Equivalents 47.97 50.91 52.03 52.03 52.03 52.03
3000 - FederalBalance Forward In 745 265 49
Receipts 141,188 151,931 177,358 353,172 287,450 287,950
Balance Forward Out 16
Expenditures 141,932 152,180 177,407 353,172 287,450 287,950
Biennial Change in Expenditures 236,468 44,821
Biennial % Change in Expenditures 80 8
State of Minnesota 72 2022-23 Biennial BudgetNovember 2020

County State Aid Roads Activity Financing by Fund
(Dollars in Thousands)
Actual
FY18
Actual
FY19
Actual
FY20
Estimate
FY21
Forecas
FY22
t Base
FY23
Full-Time Equivalents 1.58 1.38 0.62 0.62 0.62 0.62
3520 - Transportation-Loc Bridge&RoadBalance Forward In 12,576 24,528 29,281 23,281 17,281
Receipts 12,576 12,730 11,188 11,232 12,896 13,351
Balance Forward Out 12,576 24,528 29,281 23,281 17,281 11,281
Expenditures 779 6,436 17,232 18,896 19,351
Biennial Change in Expenditures 22,889 14,579
Biennial % Change in Expenditures 62
State of Minnesota 73 2022-23 Biennial BudgetNovember 2020

Transportation Budget Activity Narrative
Program: Local Roads Activity: Municipal State Aid Roads dot.state.mn.us/stateaid/
AT A GLANCE
• 148 cities with a population greater than 5,000 • 3,795 miles of Municipal State Aid Streets (MSAS) • 540 bridges on the MSAS system • Annually approved on average:
o 220 MSAS projects o 12 Local Road Improvement Program projects o 4 Local Bridge Replacement Program projects
PURPOSE & CONTEXT
State Aid for Local Transportation (SALT) provides customer service to Minnesota cities with populations greater than 5,000 through distribution of the annual allocation from the Highway User Tax Distribution Fund (HUTD), general obligation bond proceeds for local bridges, and Federal Highway Administration funds. Primarily, HUTD funds are used for construction and system maintenance on the Municipal State Aid Street (MSAS) system.
Cities select construction projects and perform maintenance activities. SALT reviews and approves individual local agency construction plans for compliance with state and federal laws, standards, and rules.
In engaging our customers we assist in planning for, constructing, and maintaining the MSAS system. Through this work we ensure the effective and efficient use of public resources for long-term investments that respond to the evolving needs of cities throughout the state.
SERVICES PROVIDED
Customer Service
SALT builds strong relationships with municipalities to plan, build, operate, and maintain Minnesota’s multimodal transportation system to maximize investment and optimize system performance. Minnesota’s transportation system is vital for moving people and freight throughout the state. We administer local bridge bond funds on a priority basis to supplement costly bridge replacement on local roads.
SALT provides cities with technical resources and materials to deliver effective and efficient system improvements. Financial customer service includes processing payments for construction projects, annual maintenance allotments, providing training, and procedural guidance. We provide customer service through collaboration of agencies on common transportation system questions, concerns, and improvements.
Construction plans along with project funding requests are reviewed and approved to ensure consistency with the rules for State Aid Operation. State Aid collaborates with cities on their construction, maintenance, and project delivery costs, as well as project activities to provide the best value with limited resources. We assist in identifying innovative and economical methods and materials to improve the transportation system.
Federal Aid
State Aid acts as an agent for the local authorities to administer the local federal construction contracts to fulfill the state’s obligations for federal oversight of all local federal aid projects. We assist local agencies in completing
State of Minnesota 74 2022-23 Biennial BudgetNovember 2020

the requirements for federal aid, including public involvement, small business participation, and documentation to comply with environmental and historic preservation requirements.
Other HUTD Funding:
• Administrative functions are funded from an allocation from the HUTD Fund established in statute at two percent of available funds.
• Two percent of available funds are set aside for a disaster account to assist cities with extraordinary disaster costs when they arise.
RESULTS
Safety
Safety on the MSAS system is measured in both the total number of crashes that occur and the number of serious crashes (fatalities and life changing crashes).
Note: In 2016, the Department of Public Safety revised the crash reporting system. The new system modified the classifications and definitions of injury severity bringing Minnesota in compliance with the Federal Standards. As a result the 2016 Crash Facts saw a spike in the number of serious injuries. Due to the change in injury severity definitions, direct comparisons to historical data cannot be made.
Bridges
The percentage of bridges rated in “Poor” condition has decreased since 2015.
State of Minnesota 75 2022-23 Biennial BudgetNovember 2020

The legal authority for the Municipal State Aid Streets activity comes from: Distribution of State Aid funds to counties and cities, Constitution of MN, Article XIV (https://www.revisor.mn.gov/constitution/#article_14) Legal authority for the State Aid system, M.S. 162 (https://www.revisor.mn.gov/statutes/?id=162)
State of Minnesota 76 2022-23 Biennial BudgetNovember 2020

Municipal State Aid Roads Activity Expenditure Overview
(Dollars in Thousands)
Actual
FY18
Actual
FY19
Actual
FY20
Estimate
FY21
Forecas
FY22
t Base
FY23
Expenditures by Fund
2500 - Municipal State Aid Street 193,623 198,383 237,270 205,812 217,867 222,538
3000 - Federal 1,000 1,000 1,000
Total 193,623 198,383 237,270 206,812 218,867 223,538
Biennial Change 52,076 (1,677)
Biennial % Change 13 (0)
Expenditures by Category
Compensation 2,324 2,366 2,316 2,409 2,442 2,445
Operating Expenses 921 1,138 963 2,712 2,898 3,048
Grants, Aids and Subsidies 190,378 194,879 233,976 201,668 213,504 218,022
Capital Outlay-Real Property 14 22 22 22
Other Financial Transaction 1 1 0 1 1 1
Total 193,623 198,383 237,270 206,812 218,867 223,538
Full-Time Equivalents 17.11 16.80 15.53 15.53 15.53 15.53
State of Minnesota 77 2022-23 Biennial BudgetNovember 2020

Municipal State Aid Roads Activity Financing by Fund
(Dollars in Thousands)
Actual
FY18
Actual
FY19
Actual
FY20
Estimate
FY21
Forecas
FY22
t Base
FY23
1000 - GeneralDirect Appropriation 8,000 8,000
Transfers Out 8,000 8,000
2500 - Municipal State Aid StreetBalance Forward In 182,918 184,636 182,395 159,205 159,205 159,205
Direct Appropriation 196,866 197,445 216,063 205,836 217,891 222,562
Transfers Out 16 24 19 24 24 24
Cancellations 1,552 1,361 1,964
Balance Forward Out 184,593 182,313 159,205 159,205 159,205 159,205
Expenditures 193,623 198,383 237,270 205,812 217,867 222,538
Biennial Change in Expenditures 51,076 (2,677)
Biennial % Change in Expenditures 13 (1)
Full-Time Equivalents 17.11 16.80 15.53 15.53 15.53 15.53
3000 - FederalReceipts 1,000 1,000 1,000
Expenditures 1,000 1,000 1,000
Biennial Change in Expenditures 1,000 1,000
Biennial % Change in Expenditures
State of Minnesota 78 2022-23 Biennial BudgetNovember 2020

Transportation Budget Activity Narrative
Program: Agency Management Activity: Agency Services dot.state.mn.us/funding/index.html dot.state.mn.us/about/index.html dot.state.mn.us/jobs/students.html
AT A GLANCE
• Accounts for 3% of MnDOT’s direct appropriated operating budget in FY20 • MnDOT workforce is 10% persons of color, 23% females, 6% persons who have declared disabilities,
and 8% veterans in FY20 • Recent activities include:
o Processed 154,434 payments to agency vendors in FY19 o Processed nearly 974 million in Construction & Right of Way payments in FY19 o Completed 750 data practice requests in FY19 o Completed 545 contract audits (totaling $246 million), 219 pre-award audits (totaling $83
million), and 81 internal audits and reviews in FY19 o Administered 2,675 contract documents, including contracts and amendments, in FY20
• The MnDOT website received more than 2.7 million unique visitors and 14.4 million page views (9.3 million unique), and had more than 158,000 email subscribers in FY20
• More than 108,000 Facebook followers and 51,000 followers of agency’s primary Twitter account (@mndot) in FY20
PURPOSE & CONTEXT
Agency Services directs the department’s administrative, financial, technology, human and capital resources, audit, public engagement, policy, and legal compliance and counsel for the agency. Agency Services ensures that activities are based on sound policy, federal and state compliance measures are in place, and proper accounting procedures are used in handling federal, state, and local funds. This activity also includes all aspects of planning for, employing, and servicing a diverse and talented workforce of 5,211 full time equivalent employees as of FY20.
SERVICES PROVIDED
Human Resources/Workforce Development services provide a full range of human resource management and staffing services, workforce development and training, recruitment and retention, labor relations, policy development, employee insurance and benefits, consultation, planning, and oversight of human resources services.
General Administrative Support provides a wide range of services to direct, support and assist the agency and its employees with compliance and regulatory requirements that demonstrate MnDOT’s commitment to customer-centered business solutions. These services are managed across the state and include: emergency management response and preparedness, business continuity, occupational safety and health services, business process analysis and improvement, materials management, print and electronic media services, purchasing and payables, mobile device management and project management leadership support, vendor management, mail, inventory, information desk, fleet management, building and facility operations, and coordination of statewide security initiatives.
State of Minnesota 79 2022-23 Biennial BudgetNovember 2020

Financial services include statewide financial planning, accounting, payroll services, forecasting, analysis, budgeting, and management of federal, state, local, and bond funds. Financial services also include management of our internal control program: Safeguarding MnDOT.
Technology Investment Management provides leadership and management of agency wide information technology plans, resources and investments, in addition to assuring collaboration with the Chief Business Technology Officer (CBTO) for IT staff and services at MnDOT.
Organizational Planning and Management (OPM) provides leaders with tools and practices that advance the strategic management of operating resources. OPM is focused on delivering and supporting implementation of the 5-Year Strategic Operating Plan and district and office business plans.
Audit provides both internal and external audit services to ensure costs are allowable, paid in compliance with laws, rules, and regulations, and that contracts and highway construction projects are administered properly and efficiently. MnDOT also coordinates with the Office of the Legislative Auditor, Office of the State Auditor, Federal Highway Administration (FHWA), and Office of the Inspector General on audits and investigations.
Legal services includes providing legal counsel to the commissioner, transactional legal assistance to all offices and districts, and coordinating legal support from the Office of the Attorney General. Legal Services manages agency compliance with the data practices act, the official records act and the open meeting law. It is also assists with producing documents for litigation, and reviewing and approving MnDOT contracts.
Communications and Public Engagement provides clear, reliable, and timely information to diverse audiences about transportation projects, initiatives, and policies. This office also promotes continuity across the department’s statewide public participation efforts by monitoring engagement practices, cultivating partnerships, capturing customer feedback and aligning resources to ensure a positive customer experience. This allows those served and impacted by MnDOT’s work to have a participatory role in shaping decisions and identifying priorities to advance transportation policies and projects. The Office of Communications and Public Engagement manages a variety of communication channels, including traditional news media, email, social media, websites, events, surveys, video, and print publications to ensure usage of plain language and a consistent MnDOT brand.
Diversity & Inclusion includes compliance with non-discrimination laws, affirmative action programming, organizational development, building inclusive work environments, and training for increased cultural competence.
Government Affairs facilitates communication between the department and elected officials, ensuring policy changes and legal authority are enacted to enable efficient operation of the department and the transportation system. This also includes close coordination with tribal governments and training for state officials in tribal/state relations.
RESULTS
MnDOT leadership is in the process of implementing our Strategic Operating Plan (SOP), which will translate long-term policy plan objectives into actionable strategies. These strategies reflect our highest priority goals, align our long-range vision with near-term actions and identify performance metrics to monitor progress. The SOP will also guide resource decisions and better align efforts across the agency to achieve our vision and mission. Priorities identified in the Strategic Operating Plan are intended to advance three broad goal areas:
• Customer Trust • Operational Excellence • Workforce Excellence
State of Minnesota 80 2022-23 Biennial BudgetNovember 2020

We continue to work on strategic staffing and workforce development plans to identify skills and competencies needed for our future workforce. With a 7.3 percent turnover rate for fulltime permanent employees, we are far below the industry standard of 10 percent. Some of our strategies for building a more diverse workforce include targeted recruitment efforts, internships and student worker positions, Employee Resource Groups, and an agency-wide unified diversity and inclusion plan.
Safeguarding MnDOT, the agency’s internal control program, ensures agency goals are achieved while avoiding fraud, waste, and abuse of resources. Minnesota Management and Budget has approved our internal control certification annually since FY10.
In FY19, MnDOT’s highway construction audit section audited 22 projects totaling $124 million in total project costs, helping to ensure the agency’s goals are achieved by ensuring that highway construction projects are completed in accordance with federal performance and safety requirements, with financial accuracy, agency contract administration and compliance processes are met, supporting community level transportation infrastructure, fostering safe highway design, and ensuring system stewardship benefits all Minnesotans.
The Office of Communications and Public Engagement provides market research services for MnDOT to capture the voice of the customer and share insights with policymakers and technical staff to better understand:
• The experiences and perceptions of MnDOT’s customers and stakeholders • Community members’ perceptions of agency communication, engagement, and project management
efforts during large construction projects • Public opinions about MnDOT’s performance in delivering key transportation services such as building and
maintaining roads and bridges, removing snow and ice from roads, making roadways safe, and communicating reliable and accurate information about transportation planning and projects
Results from MnDOT’s most recent statewide public opinion tracking study in 2019 of over 1,400 Minnesotans indicates that almost seven in ten Minnesotans rate MnDOT’s performance of delivering our mission favorably. Trust in MnDOT for prioritizing roadway users’ safety and delivering Minnesota’s transportation system has returned to 2015 levels after peaking in 2017 - with 83 percent and 83 percent (respectively) agreeing that MnDOT prioritizes roadway users’ safety and can be relied upon to deliver Minnesota’s transportation system; however, most remain confident MnDOT can deliver on these measures.
State of Minnesota 81 2022-23 Biennial BudgetNovember 2020

In addition to the public opinion tracking study, MnDOT’s customer experience survey is also given to those who have requested general information from MnDOT and/or specific assistance from the Ombudsman program. In 2019, 85 percent of customer experience survey respondents rated MnDOT’s time for initially responding to their inquiry as meeting or exceeding their expectations for timeliness. In addition, 78 percent rated the responses from MnDOT as meeting or exceeding their expectations for quality.
Since the function was enacted in statute in 2013, Ombudsman staff have consistently gathered and provided information to the general public while also facilitating discussions and mediating conflicts when appropriate. Common topics for investigation include construction, access, maintenance, traffic signals, signage, and noise.
One of the ways we build public trust and confidence is through sound financial management practices. Our Office of Financial Management ensures adherence to legislatively approved budget and financial management policies that promote effective stewardship of transportation dollars. These policies relate to:
Advance construction (http://www.dot.state.mn.us/policy/financial/fm008.html) Trunk Highway Fund balance (http://www.dot.state.mn.us/policy/financial/fm006.html) Trunk Highway Fund cash balance (http://www.dot.state.mn.us/policy/financial/fm005.html) State Airport Fund balance (http://www.dot.state.mn.us/policy/financial/fm012.html) Debt service (http://www.dot.state.mn.us/policy/financial/fm007.html) Greater Minnesota Transit Account Balance (http://www.dot.state.mn.us/policy/financial/fm022.html)
The legal authority for the Agency Services activity comes from: Article XIV of the Minnesota Constitution (https://www.revisor.leg.state.mn.us/constitution/#article_14) Duties of Commissioner, M.S. 174.03 (https://www.revisor.mn.gov/statutes/?id=174.03) Commissioner’s Powers and Duties, M.S. 174.02, subd. 2a (https://www.revisor.mn.gov/statutes/?id=174.02) Internal Controls and Internal Auditing, M.S. 16A.057 (https://www.revisor.mn.gov/statutes/?id=16A.057) Contract Management; Validity and Review, M.S. 16C.05, subd 5 (https://www.revisor.mn.gov/statutes/?id=16C.05)
State of Minnesota 82 2022-23 Biennial BudgetNovember 2020

Agency Services Activity Expenditure Overview
(Dollars in Thousands)
Actual
FY18
Actual
FY19
Actual
FY20
Estimate
FY21
Forecas
FY22
t Base
FY23
Expenditures by Fund
1000 - General 225 402
2000 - Restrict Misc Special Revenue 1
2001 - Other Misc Special Revenue 5 8 7
2700 - Trunk Highway 48,234 59,451 56,075 71,667 63,536 63,536
2710 - Highway Users Tax Distribution 117 135 115 132 132 132
2720 - State Airports 45 48 42 46 46 46
Total 48,396 59,634 56,461 72,255 63,721 63,714
Biennial Change 20,687 (1,281)
Biennial % Change 19 (1)
Expenditures by Category
Compensation 26,355 27,988 30,590 31,858 32,114 32,150
Operating Expenses 22,008 31,463 25,853 40,355 31,565 31,522
Grants, Aids and Subsidies 2 2 2 2
Capital Outlay-Real Property 0 0 0
Other Financial Transaction 32 183 18 40 40 40
Total 48,396 59,634 56,461 72,255 63,721 63,714
Full-Time Equivalents 264.59 272.97 286.15 287.19 285.69 285.69
State of Minnesota 83 2022-23 Biennial BudgetNovember 2020

Agency Services Activity Financing by Fund
(Dollars in Thousands)
Actual
FY18
Actual
FY19
Actual
FY20
Estimate
FY21
Forecas
FY22
t Base
FY23
1000 - GeneralBalance Forward In 86
Direct Appropriation 311 316 0 0
Balance Forward Out 86
Expenditures 225 402
Biennial Change in Expenditures 627 (627)
Biennial % Change in Expenditures (100)
Full-Time Equivalents 0.99 1.50
2000 - Restrict Misc Special RevenueBalance Forward In 16 51
Receipts 2 (51)
Transfers In 3
Balance Forward Out 21
Expenditures 1
Biennial Change in Expenditures (1) 0
Biennial % Change in Expenditures
2001 - Other Misc Special RevenueBalance Forward In 3 6 5 2
Receipts 3 3 4 5 5
Balance Forward Out 3 6 5 2
Expenditures 5 8 7
Biennial Change in Expenditures 13 (6)
Biennial % Change in Expenditures (44)
2700 - Trunk HighwayBalance Forward In 5,916 0 6,815
Direct Appropriation 44,916 45,926 54,479 54,985 53,669 53,669
Open Appropriation 8,632 9,360 8,409 9,866 9,866 9,866
Receipts 0 0 1 1 1 1
Transfers Out 1,124
Cancellations 627
Balance Forward Out 5,314 0 6,814
State of Minnesota 84 2022-23 Biennial BudgetNovember 2020

Agency Services Activity Financing by Fund
(Dollars in Thousands)
Actual
FY18
Actual
FY19
Actual
FY20
Estimate
FY21
Forecas
FY22
t Base
FY23
Expenditures 48,234 59,451 56,075 71,667 63,536 63,536
Biennial Change in Expenditures 20,057 (670)
Biennial % Change in Expenditures 19 (1)
Full-Time Equivalents 264.59 272.97 285.16 285.69 285.69 285.69
2710 - Highway Users Tax DistributionOpen Appropriation 117 135 115 132 132 132
Expenditures 117 135 115 132 132 132
Biennial Change in Expenditures (4) 17
Biennial % Change in Expenditures (2) 7
2720 - State AirportsOpen Appropriation 45 48 42 46 46 46
Expenditures 45 48 42 46 46 46
Biennial Change in Expenditures (4) 4
Biennial % Change in Expenditures (5) 4
State of Minnesota 85 2022-23 Biennial BudgetNovember 2020

Transportation Budget Activity Narrative
Program: Agency Management Activity: Building Services dot.state.mn.us/maintenance/facilities.html
AT A GLANCE
MnDOT owns and operates 1,075 individual buildings (of which 187 are radio equipment shelters) at 269 sites with the total area of buildings measuring over 6.6 million square feet, including:
• 133 truck station sites (4 additional truck station sites are leased) • 18 regional headquarters and maintenance sites • 5 special service sites: MnROAD Research Facility, Arden Hills Training Center, Central Shop,
Maplewood Materials Lab, and the Aeronautics building • 193 salt and sand delivery sites (4 additional salt and delivery sites are leased) • 68 rest area buildings • 6 weigh stations
MnDOT leases the Central Office headquarters building managed by MnDOT’s Office of Administration, Facility Operations Section
PURPOSE & CONTEXT
MnDOT facilities are located throughout the state to enable prompt and efficient service to the traveling public. MnDOT District and Special Service Site Facility Management staff oversee operations and maintenance of these buildings. MnDOT Building Services provides planning, design, and construction contract administration for building repairs, improvements, additions, and new construction for these facilities.
The efforts of both groups support the core mission of the department, as well as the other state agencies and local partners that are co-located at MnDOT facilities. The objective is to plan, build, and operate facilities effectively and efficiently. We continue to manage our resources strategically in an effort to ensure that our facilities provide safety and security of our assets, employees, and the travelling public.
In addition, the MnDOT Office of Administration oversees the operations of the central office headquarters building. This includes coordinating with the Department of Administration and consultants and contractors to provide planning, design, and construction management for central office building repairs and improvements.
SERVICES PROVIDED
Long-range program planning and scoping, such as: • Building programming and pre-design services for new and renovated buildings and sites • Scheduling new facility projects • Hiring and overseeing consultants for large capital and specialty projects • Preparing designs, construction documents, bid lettings, and administering building construction
contracts • Program planning and management for emergency building repairs • Managing and tracking building energy use • Maintaining building data to track building conditions and deferred maintenance • Researching water use and wastewater treatment • Ensuring facilities are safe for staff, accessible, and strategically located throughout the state to efficiently
deploy services • Providing centralized planning and coordination of space management and physical security programs
State of Minnesota 86 2022-23 Biennial BudgetNovember 2020

The truck station network is the center of MnDOT’s maintenance and operations program. Agency facilities are strategically located across the state so customer needs, especially snow and ice operations and system emergencies, can be addressed promptly. These facilities provide building space for staff, equipment, and materials, including snow plows and salt. MnDOT often shares space with other state agencies or local governments to take advantage of opportunities to reduce costs.
MnDOT Building Services is financed by a direct appropriation from the Trunk Highway Fund which is used for salaries, consultant contracts, asset preservation, and small capital projects. Large capital projects are typically funded by Trunk Highway bonds. Building Services staff deliver 120 - 150 projects and manage approximately 50 consultant contracts annually.
Planning, scoping, and budget development services: During the annual building budget process, MnDOT reviews and plans for future building space requirements. The Facilities Investment Plan provides the framework for project delivery for the next four years. In addition, 10 and 20 year plans offer a longer range view. These timelines align with concurrent highway planning efforts.
The Facilities Investment Plan is driven by operational deficiency evaluations and data captured in the Enterprise Real Property Facilities Condition Assessment (FCA). This information is used to assist decision makers in prioritizing capital projects of all sizes, including district headquarters, truck stations, and specialty buildings. Other processes identify annual maintenance and repair projects, which require licensed architects and engineers to develop plans and specifications.
Professional architecture and engineering services: MnDOT architects and engineers perform or oversee all aspects of building design and construction. This includes conceptual design through preparation of contract documents, bidding and construction contract administration. Building Services is adopting the same project scheduling tool that MnDOT uses to manage bridge and highway projects. This tool should improve project delivery in multiple ways; lettings will occur at the most favorable time of the year, construction will commence as soon as weather permits, and district customers will be able to track project start dates and schedules.
Building Operations and Maintenance: MnDOT Building Services develops facility standards in compliance with building codes and regulatory requirements, evaluates building and building system conditions, and provides direction for the maintenance of major building systems. Districts and Special Service Sites spend operating dollars for building/facility operations and maintenance activities.
Results
During the FY 2020-21 biennium, the design or construction of the following building projects will be completed: • Regional Headquarters: Willmar brine building, storage buildings, and fuel island renovation; Bemidji
office area remodeling • Central Office Headquarters: Lobby/tunnel security improvement project • Truck Stations: Walker Truck Station replacement; Sleepy Eye Truck Station replacement; Moose Lake
Truck Station replacement; Northfield Truck Station replacement; Thief River Falls unheated storage building; Brine buildings at five sites statewide; Salt storage shelters at six sites statewide
• Safety Rest Areas: Clear Lake; Des Moines River • Single Occupant Restrooms: at eight locations statewide
Facility Condition Assessments (FCA)
MnDOT is one of 19 state agencies implementing a program of periodic FCAs. The FCAs, combined with operational functionality assessments of buildings and sites, allow MnDOT to make data-driven building investment decisions and inform the development of the 4, 10, and 20 year plans. The continuous assessment and evaluation of our building stock allows us to target asset preservation dollars where they will maximize the value of our existing resources.
State of Minnesota 87 2022-23 Biennial BudgetNovember 2020

The initial assessment of 884 MnDOT owned buildings established a baseline condition for each building which will allow us to track building condition changes over time. The assessments are updated every three years on a rolling basis. As of September 2019, 151 buildings are rated excellent, 407 are rated good, 252 are rated fair, 55 are rated poor, and 19 are rated crisis/emergency.
The current replacement value of all our buildings is approximately $1.29 billion and deferred maintenance is approximately $187 million. Both numbers are generated using the Department of Administration’s standardized FCA Program. Deferred maintenance is the total of essential, but unfunded, facilities maintenance work necessary to bring facilities and collateral equipment to the required acceptable facilities maintenance standards. This is the total work that should be accomplished in order to maintain the facilities but that cannot be achieved within available resources. It does not include new construction, additions, or modifications. Deferred maintenance does include unfunded maintenance requirements, repairs, and replacement of obsolete items.
Aging Infrastructure
The expected service life of a MnDOT truck station facility is 50 years. At the current replacement rate of two truck stations per year, we are operating on a replacement cycle of approximately 70 years. As the graph below indicates, many of our buildings have already exceeded their expected service life. Over half of the 133 existing truck stations are more than 30 years old and will be candidates for replacement within the next 20 years.
Building Energy Management
MnDOT continues to utilize the State’s B3 (Buildings, Benchmarks, and Beyond) Energy Benchmarking Tool, which contains utility consumption data from 98 percent of MnDOT sites. This data is analyzed on an ongoing basis to ensure that our buildings use energy in the most efficient way possible. In calendar year 2019 building energy use per square foot was 23 percent lower than in the baseline year of 2008 (weather normalized). The MnDOT Sustainability Report (http://www.dot.state.mn.us/sustainability/docs/2019-sustainability-report.pdf) outlines our sustainability efforts and performance targets. It is used to support strategic direction and oversight for sustainability activities.
MnDOT Building Services also identifies and implements energy efficiency improvement opportunities and renewable energy measures. Specific initiatives include web-connecting building automation systems to monitor facility operational trends and adjust statewide mechanical systems from any remote location. Other efforts include assessment and recommissioning of existing equipment based on data provided by the automation systems and replacement of outdated and over-sized equipment with energy efficient upgrades.
The legal authority for the Buildings Services activity comes from: Duties of Commissioner, Other duties, Construct and maintain transportation facilities, M.S. 174.03 (https://www.revisor.mn.gov/statutes/?id=174.03) General Powers of the Commissioner, M.S. 161.20 (https://www.revisor.mn.gov/statutes/?id=161.20)
State of Minnesota 88 2022-23 Biennial BudgetNovember 2020

Building Services Activity Expenditure Overview
(Dollars in Thousands)
Actual
FY18
Actual
FY19
Actual
FY20
Estimate
FY21
Forecas
FY22
t Base
FY23
Expenditures by Fund
1000 - General 54 54 54 54 54 54
2001 - Other Misc Special Revenue 592 875 798 887 887 887
2700 - Trunk Highway 20,112 37,741 38,258 52,951 39,694 39,694
Total 20,757 38,670 39,110 53,892 40,635 40,635
Biennial Change 33,574 (11,732)
Biennial % Change 57 (13)
Expenditures by Category
Compensation 3,667 4,004 4,587 4,771 4,838 4,843
Operating Expenses 16,563 30,430 29,356 28,740 25,908 26,069
Grants, Aids and Subsidies 4 2 2 2
Capital Outlay-Real Property 441 4,043 4,739 20,374 9,882 9,716
Other Financial Transaction 82 193 428 5 5 5
Total 20,757 38,670 39,110 53,892 40,635 40,635
Full-Time Equivalents 35.31 38.12 42.08 42.08 42.08 42.08
State of Minnesota 89 2022-23 Biennial BudgetNovember 2020

Building Services Activity Financing by Fund
(Dollars in Thousands)
Actual
FY18
Actual
FY19
Actual
FY20
Estimate
FY21
Forecas
FY22
t Base
FY23
1000 - GeneralDirect Appropriation 54 54 54 54 54 54
Expenditures 54 54 54 54 54 54
Biennial Change in Expenditures 0 0
Biennial % Change in Expenditures 0 0
2001 - Other Misc Special RevenueBalance Forward In 27 261 220 264 211 158
Receipts 825 834 842 834 834 834
Balance Forward Out 261 220 264 211 158 105
Expenditures 592 875 798 887 887 887
Biennial Change in Expenditures 218 89
Biennial % Change in Expenditures 15 5
Full-Time Equivalents 0.02 0.08 0.02 0.02 0.02 0.02
2700 - Trunk HighwayBalance Forward In 8,706 5,057
Direct Appropriation 28,531 29,396 43,315 47,894 39,694 39,694
Transfers In 1,304 1,304 1,306 1,299 1,308 1,308
Cancellations 1,304 1,664 1,306 1,299 1,308 1,308
Balance Forward Out 8,419 5,057
Expenditures 20,112 37,741 38,258 52,951 39,694 39,694
Biennial Change in Expenditures 33,356 (11,821)
Biennial % Change in Expenditures 58 (13)
Full-Time Equivalents 35.29 38.04 42.06 42.06 42.06 42.06
State of Minnesota 90 2022-23 Biennial BudgetNovember 2020

Transportation District Overview
District 1
SERVICES PROVIDED
Located in Northeastern Minnesota, District 1 represents one-fourth of the state’s total land area. Services provided by District 1 include the planning, design, construction, and maintenance of the state and federal highway system and aid/assistance to the county and city systems qualified for state and federal dollars. District 1 also provides transit, trail, and rail coordination. Through many partnerships with local governments, agencies, and the public, District 1 provides the citizens of Minnesota with a transportation system that meets their needs.
District 1 is unique in many ways. It shares two of Minnesota’s longest bridges with the State of Wisconsin, the Blatnik and Bong bridges. The district has two international border crossings. The Port of Duluth-Superior is one of the District’s key partners, it is the largest freshwater port in the world and has access to four class one railroads and is a full-service, multi-modal hub for domestic and international trade. The district is home to hundreds of miles of paved trails, including the Mesabi trail which, when complete, will stretch from Grand Rapids to Ely and will be one of the nation’s longest trail systems at 155 miles. Nearly half of Minnesota’s scenic byways are located in District 1, including four national scenic byways and six state scenic byways.
District 1’s Operations program strives to maintain, operate, and preserve our transportation assets so that they are safe, structurally sound, and aesthetically pleasing. These assets include highways, bridges, drainage structures, safety devices, facilities, rest areas, and equipment. Staff and equipment are located at 19 truck stations across the District, allowing efficient and independent mobilization for maintenance operations. District 1 has harsh winter conditions and is committed to providing 24/7 service coverage for snow & ice condition response. Summer maintenance performed includes pavement repair, bridge inspection and repair, drainage, vegetation control, traffic services, guardrail maintenance, and natural disaster response.
District 1 will average 26 projects annually between 2020-2023, costing approximately $150 million per year, including the Twin Ports Interchange Project in Duluth in FY 2021. This district accounts for about 10 percent of state construction project spending annually.
Counties
Aitkin Carlton
Cook Itasca
Koochiching Lake Pine
St. Louis
Supports
• 355,371 people (6.3% of state population, 2018 estimate) • Covers 19,446 square miles (24% of state land area) • 1,554 miles (3,375 lane miles) of state, U.S., and interstate
highways (13% of state centerline miles, 13% of lane miles) • 565 bridges 10 feet or longer (12% of state bridges) • 862 miles of rail line (18% of state rail line miles) • 22 public airports (16% of state airports) • 9 public Class 1 rest areas (18% of state rest areas)
Resources
• 385 full time employees in FY 2020 • 2 regional offices with 711,873 square feet of space (11% of
MnDOT building area) • 99 snow removal trucks in FY 2020
State of Minnesota 91 2022-23 Biennial BudgetNovember 2020

PERFORMANCE INDICATORS
MnDOT tracks the performance of the Trunk Highway system with a number of different measures, many of which are published on the transportation performance website (https://performance.minnesotago.org/). MnDOT prioritizes infrastructure improvements on National Highway System (NHS) routes and holds these roads to a higher performance standard than non-NHS routes. This approach allows MnDOT to comply with federal law and manage risks related to statewide travel.
Pavement condition is measured by the percent of miles of highway in poor condition. The system condition is projected to worsen after 2024, though Interstate condition improves significantly before worsening in 2030.
Bridge condition is measured by percent of bridge deck area in poor condition. NHS bridge condition is projected to remain steady through 2024, but then significantly decline by 2030, with approximately 16 percent of bridge deck area in poor condition.
MnDOT has the goal to return the road to an acceptable driving condition in a prescribed amount of time (“time to bare lane”). The target time varies by the amount of traffic on the road. MnDOT’s goal is to meet the plowing target for each roadway 70 percent of the time in a season.
State of Minnesota 92 2022-23 Biennial BudgetNovember 2020

Transportation District Overview
District 2
Counties
Beltrami Clearwater Hubbard Kittson
Lake of the Woods Marshall Norman
Pennington Polk
Red Lake Roseau
And parts of Cass, Itasca, and
Koochiching
Supports
• 166,159 people (3% of state population, 2018 estimate)
• Covers 14,158 square miles (18% of state land area)
• 1,804 miles (3,906 lane miles) of state, and U.S. highways (15% of state centerline miles, 13% of lane miles)
• 357 bridges 10 feet or longer (7% of state bridges) • 636 miles of rail line (14% of state rail line miles) • 19 public airports (14% of state airports) • 3 public Class 1 rest areas (6% of state rest areas)
Resources • 259 full time employees in FY 2020 • 3 regional offices with 509,684 square feet of
space (8% of MnDOT building area) • 73 snow removal trucks in FY 2020
SERVICES PROVIDED
District 2 is located in the Northwest area of the state, bordered by North Dakota on the west and Canada to the north. The MnDOT team in District 2 plans, designs, constructs, and maintains the state and federal trunk highways within the district. They also manage the aid and assistance provided to local governments that qualify for state and federal transportation funding for roadways, bridges, trails, and transit systems. The top priorities in District 2’s construction program are to preserve the existing system, make cost-effective safety improvements, and improve accessibility for all modes of transportation. The District continues to prioritize safety and mobility needs of its customers while continuously looking for partnership opportunities to maximize budgets.
District 2 serves a large geographic area that is predominately rural with mainly farmland and prairie in the west and lakes and forests in the east. The area is characterized by the Red River valley and the Northwoods. The Red River valley is known for agriculture and prone to flooding. The Northwoods is known for timber, lakes, and recreational opportunities. There are many small communities and four cities with a population of more than 5,000 within the District. All the lands of the Red Lake Nation and portions of the Leech Lake and White Earth reservations lie within the boundaries of District 2. There is a diverse economy in the District, with major industries including agriculture, automotive vehicles, forestry, and manufacturing.
District 2 will average 13 projects annually between 2020-2023, costing approximately $43 million per year. This district accounts for about 5 percent of state construction project spending annually.
PERFORMANCE INDICATORS
MnDOT tracks the performance of the Trunk Highway system with a number of different measures, many of which are published on the transportation performance website (https://performance.minnesotago.org/). MnDOT prioritizes infrastructure improvements on National Highway System (NHS) routes and holds these roads
State of Minnesota 93 2022-23 Biennial BudgetNovember 2020

to a higher performance standard than non-NHS routes. This approach allows MnDOT to comply with federal law and manage risks related to statewide travel.
Pavement condition is measured by the percent of miles of highway in poor condition. The system condition is projected to worsen after 2024.
Bridge condition is measured by percent of bridge deck area in poor condition. District 2 bridges on the NHS were no longer in poor condition in 2018. NHS bridge condition is projected to remain steady through 2030.
For snowplowing, MnDOT has the goal to return the road to an acceptable driving condition in a prescribed amount of time (“time to bare lane”). The target time varies by the amount of traffic on the road. MnDOT’s goal is to meet the plowing target for each roadway 70 percent of the time in a season.
State of Minnesota 94 2022-23 Biennial BudgetNovember 2020

Transportation District Overview
District 3
Counties
Aitkin Benton
Cass Crow Wing
Isanti Kanabec
Mille Lacs Morrison
Sherburne Stearns
Todd Wright
Wadena
Supports
• 680,650 people (12% of state population, 2018 estimate) • Covers 10,209 square miles (13% of state land area) • 1,590 miles (4,015 lane miles) of state, U.S., and interstate
highways (14% of state centerline miles, 14% of lane miles) • 426 bridges 10 feet or longer (9% of state bridges) • 378 miles of rail line (8% of state rail line miles) • 21 public airports (16% of state airports) • 7 public Class 1 rest areas (14% of state rest areas)
Resources • 416 full time employees in FY 2020 • 2 regional offices with 740,788 square feet of space (11% of
MnDOT building area) • 118 snow removal trucks in FY 2020
SERVICES PROVIDED
Located in Central Minnesota, District 3 has the largest population base outside the Minneapolis/St. Paul metro area. The district covers 13 counties in the central part of the state and is home to 19 cities that have a population of over 5,000. This includes Baxter, where District 3 is headquartered, and St. Cloud which has a second MnDOT office. There is a strong manufacturing presence in District 3 and several major corridors vital to freight movement cross the district. The tourism industry is also a key driver within the district’s economy and contributes to traffic volumes. The southern boundary of District 3 is located adjacent to the metro area and is rapidly becoming part of the greater urbanized area, with a strong commuter demand currently served by highways, buses, and park-and-ride lots.
The MnDOT team in District 3 plans, designs, constructs, and maintains the state and federal trunk highways within the district. Staff also manages the aid and assistance provided to local governments that qualify for state and federal transportation funding for roadways, bridges, trails, and transit systems. There are several corridors from the metro area coming into the district with high traffic volumes where safety and mobility needs are top priorities. District 3 traffic volumes increase in the summer due to weekend traffic, but the volumes are also a concern during the week.
The district is more urban in Wright, Sherburne, and Stearns counties due to the proximity to the metro area. Traffic is heavier in these areas and there is more economic activity with businesses and commuters. The northern part of District 3 is home to the Brainerd Lakes Area, Lake Mille Lacs, and many other popular tourist destinations where traffic volumes increase seasonally and on weekends. The district also has a diverse population of traditionally underserved communities, including the Mille Lacs Band of Ojibwa, Hispanic, and Somali communities in the St. Cloud area, Long Prairie, and the Amish community in rural areas, such as Todd County.
District 3 will average 18 projects annually between 2020-2023, costing approximately $116 million per year. This district accounts for about 14 percent of state construction project spending annually.
State of Minnesota 95 2022-23 Biennial BudgetNovember 2020

PERFORMANCE INDICATORS
MnDOT tracks the performance of the Trunk Highway system with a number of different measures, many of which are published on the transportation performance website (https://performance.minnesotago.org/). MnDOT prioritizes infrastructure improvements on National Highway System (NHS) routes and holds these roads to a higher performance standard than non-NHS routes. This approach allows MnDOT to comply with federal law and manage risks related to statewide travel.
Pavement condition is measured by the percent of miles of highway in poor condition. The system condition is projected to worsen after 2024, though Interstate condition improves significantly before worsening in 2024.
Bridge condition is measured by percent of bridge deck area in poor condition. In District 3, NHS bridge condition is better than target but will worsen significantly in 2029 with approximately 6 percent of bridge deck in poor condition.
For snowplowing, MnDOT has the goal to return the road to an acceptable driving condition in a prescribed amount of time (“time to bare lane”). The target time varies by the amount of traffic on the road. MnDOT’s goal is to meet the plowing target for each roadway 70 percent of the time in a season.
State of Minnesota 96 2022-23 Biennial BudgetNovember 2020

Transportation District Overview
District 4
Counties
Becker Big Stone
Clay Douglas
Grant Mahnomen Otter Tail
Pope Stevens
Swift Traverse Wilkin
Supports
• 251,369 people (4% of state population, 2018 estimate) • Covers 9,865 square miles (12% of state land area) • 1,578 miles (3,592 lane miles) of state, U.S., and interstate
highways (14% of state centerline miles, 12% of lane miles) • 334 bridges 10 feet or longer (7% of state bridges) • 668 miles of rail line (15% of state rail line miles) • 19 public airports (14% of state airports) • 5 public Class 1 rest areas (10% of state rest areas)
Resources • 264 full time employees in FY 2020 • 2 regional offices with 656,195
square feet of space (9% of MnDOT building area) • 72 snow removal vehicles in FY 2020
SERVICES PROVIDED
District 4 is located in west central Minnesota, with offices and truck stations strategically placed throughout the region to ensure safety and efficiency of Minnesota’s transportation. District 4 staff plan, design, construct, and maintain the state and federal highway systems within district boundaries, and manage the aid and assistance given to county and city systems that qualify for state and federal dollars. In our district, we follow a community-focused approach during project development, and work closely with local partners to meet the needs of all transportation system users, while minimizing environmental and construction impacts.
District 4 is committed to delivering a high-level of service on our roadways, and invests in long-term fixes on major corridors such as Interstate 94 and Highway 10 to improve safety and mobility for freight haulers and the traveling public. Winter winds across western Minnesota create significant blowing snow and ice conditions. Through outreach efforts with landowners and farm operators, District 4 is leading the state’s snow fence program and has installed more than 31 miles of permanent and temporary snow fence across the region.
From 2020-23, District 4 will average 9 projects annually, costing approximately $44 million per year. The district accounts for about 5 percent of state construction project spending annually.
PERFORMANCE INDICATORS
MnDOT tracks the performance of the Trunk Highway system with a number of different measures, many of which are published on the transportation performance website (https://performance.minnesotago.org/). MnDOT prioritizes infrastructure improvements on National Highway System (NHS) routes and holds these roads to a higher performance standard than non-NHS routes. This approach allows MnDOT to comply with federal law and manage risks related to statewide travel.
Pavement condition is measured by the percent of miles of highway in poor condition. The system condition is projected to worsen after 2024, though Interstate condition improves significantly before worsening in 2030.
State of Minnesota 97 2022-23 Biennial BudgetNovember 2020

Bridge condition is measured by percent of bridge deck area in poor condition. NHS bridge condition is projected to remain steady through 2029, but then significantly decline by 2030, with approximately 24 percent of bridge deck area in poor condition.
For snowplowing, MnDOT has the goal to return the road to an acceptable driving condition in a prescribed amount of time (“time to bare lane”). The target time varies by the amount of traffic on the road. MnDOT’s goal is to meet the plowing target for each roadway 70 percent of the time in a season.
State of Minnesota 98 2022-23 Biennial BudgetNovember 2020

Transportation District Overview
Metro District
Counties
Anoka Carver
Chisago Dakota
Hennepin Ramsey
Scott Washington
Supports
• 3,169,293 people (56% of state population, 2018 estimate) • Covers 3,237 square miles (4% of state land area) • 1,086 miles (4,079 lane miles) of state, U.S., and interstate
highways (9% of state centerline miles, 14% of lane miles) • 1,433 bridges 10 feet or longer (30% of state bridges) • 655 miles of rail line (14% of state rail line miles) • 10 public airports (8% of state airports) including the
Minneapolis/St. Paul International Airport • 5 public Class 1 rest areas (10% of state rest areas)
Resources • 1,374 full time employees in FY 2020 • 3 regional offices and the Regional Transportation Management
Center (RTMC) with 1,697,432 square feet of space (26% of MnDOT building area)
• 250 snow removal trucks in FY 2020
SERVICES PROVIDED
Located in Eastern Minnesota, MnDOT’s Metro District maintains a multimodal transportation system that includes state, federal, and interstate highways and roads within the eight-county Twin Cities metropolitan area. There are 84 state-aid eligible municipalities in the Metro District, along with the state’s largest metropolitan planning organization (MPO), the Metropolitan Council. Minnesota’s two largest cities, Minneapolis and St. Paul, are located within the Metro District.
Metro District is in the urban core of the Twin Cities, and major industries in the district include business services, information technology, insurance, printing and publishing services, and medical devices. Metro includes many universities and colleges, hospitals, and Fortune-500 company headquarters. The population of the Twin Cities is diverse, with more than 25 percent of the population identifying as people of color1.
The MnDOT team in Metro District plans, designs, constructs, and maintains highway systems within the district's boundaries, and coordinates with cities, counties, and consultants. Metro District manages the aid and assistance given to regional, county, and city systems that qualify for state and federal dollars. Metro District provides support for multimodal transportation, including transit, rail, bicycle, and pedestrian systems.
As population and commerce grows in the Twin Cities, so does traffic congestion. Metro District manages congestion through the operation of the Regional Transportation Management Center (RTMC). The RTMC uses technologies and programs to benefit commuters in the Twin Cities Metro, including: ramp meters, 511mn.org, dynamic message signs, MnPASS system, and the Freeway Incident Response Safety Team (FIRST) program.
Metro District will average 50 construction projects annually from 2020-2023, costing approximately $80 million per year. This district accounts for about 40 percent of state construction project spending annually.
1 U.S. Census Bureau Decennial Census or American Community Survey. 2018
State of Minnesota 99 2022-23 Biennial BudgetNovember 2020

PERFORMANCE INDICATORS
MnDOT tracks the performance of the Trunk Highway system with a number of different measures, many of which are published on the transportation performance website (https://performance.minnesotago.org/). MnDOT prioritizes infrastructure improvements on National Highway System (NHS) routes and holds these roads to a higher performance standard than non-NHS routes. This approach allows MnDOT to comply with federal law and manage risks related to statewide travel.
Pavement condition is measured by the percent of miles of highway in poor condition. The system condition is projected to worsen starting in 2024.
Bridge condition is measured by percent of bridge deck area in poor condition. In Metro District, the percentage of bridge deck area in poor condition grows between 2020 and 2030.
For snowplowing, MnDOT has the goal to return the road to an acceptable driving condition in a prescribed amount of time (“time to bare lane”). The target time varies by the amount of traffic on the road. MnDOT’s goal is to meet the plowing target for each roadway 70 percent of the time in a season.
State of Minnesota 100 2022-23 Biennial BudgetNovember 2020

Transportation District Overview
District 6
Counties
Dodge Fillmore Freeborn Goodhue Houston Mower
Olmsted Rice
Steele Wabasha Winona
Supports
• 510,781 people (9% of state population, 2018 estimate) • Covers 6,801 square miles (9% of state land area) • 1,421 miles (3,700 lane miles) of state, U.S., and interstate
highways (12% of state centerline miles, 13% of lane miles) • 853 bridges 10 feet or longer (18% of state bridges) • 456 miles of rail line (10% of state rail line miles) • 11 public airports (8% of state airports) • 12 public Class 1 rest areas (24% of state rest areas)
Resources • 414 full time employees in FY 2020 • 3 regional offices with 880,366 square feet of space (14% of
MnDOT building area) • 109 snow removal trucks in FY 2020
SERVICES PROVIDED
District 6 is located in Southeastern Minnesota. It shares a border with Wisconsin to the East and Iowa to the South and has two Welcome Centers on Interstates 90 and 35 as people enter Minnesota from these neighboring states. It has three regional offices located in Rochester, Owatonna, and Winona which are also regional trade centers. Major industries in the district include education and knowledge creation, food and livestock processing, and footwear. Rochester, the state’s third most populous city, is also home to internationally renowned medical care and testing facilities. There are 23 truck stations located in District 6, three of which are at the regional offices.
Over the next 10 years, the majority of projects in District 6 will address pavement and bridge condition. MnDOT will also address roadside infrastructure (signage, culverts, guardrail, and lighting), safety improvements, pedestrian infrastructure that does not comply with the Americans with Disabilities Act, and bicycle infrastructure.
District 6 will average 21 projects annually between 2020-2023, costing approximately $80 million per year. This district accounts for about 10 percent of state construction project spending annually.
PERFORMANCE INDICATORS
MnDOT tracks the performance of the Trunk Highway system with a number of different measures, many of which are published on the transportation performance website (https://performance.minnesotago.org/). MnDOT prioritizes infrastructure improvements on National Highway System (NHS) routes and holds these roads to a higher performance standard than non-NHS routes. This approach allows MnDOT to comply with federal law and manage risks related to statewide travel.
Pavement condition is measured by the percent of miles of highway in poor condition. The system condition is projected to worsen after 2024, though Interstate condition improves significantly before worsening in 2030.
State of Minnesota 101 2022-23 Biennial BudgetNovember 2020

Bridge condition is measured by percent of bridge deck area in poor condition. In District 6, bridges on the NHS are projected to fall below target in 2021 with approximately 3 percent of bridge deck area in poor condition.
For snowplowing, MnDOT has the goal to return the road to an acceptable driving condition in a prescribed amount of time (“time to bare lane”). The target time varies by the amount of traffic on the road. MnDOT’s goal is to meet the plowing target for each roadway 70 percent of the time in a season.
State of Minnesota 102 2022-23 Biennial BudgetNovember 2020

Transportation District Overview
District 7
Counties
Blue Earth Brown
Cottonwood Faribault Jackson LeSueur Martin Nicollet Nobles Rock Sibley
Waseca Watonwan
Supports
• 286,607 people (5% of state population, 2018 estimate) • Covers 7,680 square miles (10% of state land area) • 1,269 miles (3,238 lane miles) of state, U.S., and interstate
highways (11% of state centerline miles, 11% of lane miles) • 470 bridges 10 feet or longer (10% of state bridges) • 514 miles of rail line (11% of state rail line miles) • 14 public airports (10% of state airports) • 10 public Class 1 rest areas (20% of state rest areas)
Resources • 338 full time employees in FY 2020 • 2 regional offices with 578,814 square feet of space (9% of
MnDOT building area) • 83 snow removal trucks in FY 2020
SERVICES PROVIDED
District 7 is comprised of 13 counties in south central Minnesota. District 7 staff plan, design, construct, and maintain the state and federal highway system. They provide aid and assistance to the county and city systems that qualify for state and federal dollars. Through partnerships with local governments, agencies and the public, District 7 provides a coordinated transportation system that meets the needs of the many communities it serves.
Minnesota is recognized nationally for pork production, sitting only second to the state of Iowa. While there are hog farming operations throughout Minnesota, the majority are located within District 7. Crop farming and production are also prominent in this district. District 7 is also home to important freight corridors such as US169, I90, Highway 60, and US14. Maintaining these important farm-to-market roads through Minnesota’s varying seasons is of great importance for MnDOT District 7.
District 7 in involved in several unique projects and has an interregional corridor network of four-lane highways, including Hwy 14 from New Ulm to Nicollet which will be built in 2022-2023. District 7 has five recently completed or active Corridor Studies, which involves working closely with the communities impacted by future roadway projects. Conducting Corridor Studies prior to a project provides local partners an opportunity to have input into the project design process. From planning and project development to construction and maintenance, District 7 staff are committed to working closely with the public to ensure community involvement.
South Central Minnesota experiences many challenges on its roadways. From flooded roads to mudslides and tornados, weather-related impacts to the roadways present a challenge to District 7. There is also a growing need for urban reconstruction projects throughout District 7, as well as a goal to reach ADA (American’s With Disabilities) compliance by 2037.
District 7 will average 14 projects annually between 2020-2023, costing approximately $63 million per year and accounting for about 8 percent of state construction project spending annually.
State of Minnesota 103 2022-23 Biennial BudgetNovember 2020

PERFORMANCE INDICATORS
MnDOT tracks the performance of the Trunk Highway system with a number of different measures, many of which are published on the transportation performance website (https://performance.minnesotago.org/). MnDOT prioritizes infrastructure improvements on National Highway System (NHS) routes and holds these roads to a higher performance standard than non-NHS routes. This approach allows MnDOT to comply with federal law and manage risks related to statewide travel.
Pavement condition is measured by the percent of miles of highway in poor condition. The system condition is projected to worsen in 2024, though Interstate condition improves significantly before worsening in 2030.
Bridge condition is measured by percent of bridge deck area in poor condition. NHS bridge condition is projected to remain steady through 2026, but then significantly decline by 2029, with approximately 17 percent of bridge deck area in poor condition by 2030.
For snowplowing, MnDOT has the goal to return the road to an acceptable driving condition in a prescribed amount of time (“time to bare lane”). The target time varies by the amount of traffic on the road. MnDOT’s goal is to meet the plowing target for each roadway 70 percent of the time in a season.
State of Minnesota 104 2022-23 Biennial BudgetNovember 2020

Transportation District Overview
District 8
Counties
Chippewa Kandiyohi
Lac qui Parle Lincoln
Lyon McLeod Meeker Murray
Pipestone Redwood Renville
Yellow Medicine
Supports
• 209,186 people (4% of state population, 2018 estimate) • Covers 8,305 square miles (10% of state land area) • 1,416 miles (2,952 lane miles) of state, U.S., and interstate
highways (12% of state centerline miles, 10% of lane miles) • 358 bridges 10 feet or longer (7% of state bridges) • 480 miles of rail line (10% of state rail line miles) • 17 public airports (13% of state airports)
Resources
• 229 full time employees in FY 2020 • 3 regional offices with 478,351 square feet of space (7% of
MnDOT building area) • 57 snow removal trucks in FY 2020
SERVICES PROVIDED
The staff at MnDOT District 8 operate and maintain the state highway system within Southwest Minnesota. District 8 also manages the financial aid and technical assistance given to county and city systems that qualify for state and federal dollars. 80 percent of District 8 capital resources over the next 10 years will be invested in system preservation to ensure a safe and reliable transportation system. This allows Minnesotans to readily gain access to health care, retail and tourism economies, and provides gateways to markets for vitally important agricultural, food processing, manufacturing, and other businesses.
District 8 uses partnerships to build and strengthen relationships, engage with communities, improve efficiency, save money, and increase sustainability; for example, MnDOT uses agreements to share maintenance facilities with cities and counties. District 8 is committed to developing partnerships with tribal governments, one partnership with the Lower Sioux Indian Community involved the development and installation of road signs in the Dakota and English languages. District 8 also participated in the Advancing Transportation Equity initiative with key community partners, which will help MnDOT and partner organizations learn about transportation inequities, communities with unique transportation needs, and how they can be more equitable.
The winter winds across southwest Minnesota create very challenging snow and ice conditions in District 8. We have more than 6 miles of snow fences to improve driver visibility and safety by preventing snow drifts and ice from forming on roads. Because MnDOT employees are good stewards of the environment, we are committed to using less salt on roadways without jeopardizing public safety.
District 8 will average 13 projects annually between 2020-2023, costing approximately $38 million per year. This district accounts for about 5 percent of state construction project spending annually.
PERFORMANCE INDICATORS
MnDOT tracks the performance of the Trunk Highway system with a number of different measures, many of which are published on the transportation performance website (https://performance.minnesotago.org/). MnDOT prioritizes infrastructure improvements on National Highway System (NHS) routes and holds these roads
State of Minnesota 105 2022-23 Biennial BudgetNovember 2020

to a higher performance standard than non-NHS routes. This approach allows MnDOT to comply with federal law and manage risks related to statewide travel.
Pavement condition is measured by the percent of miles of highway in poor condition. The system condition is projected to starting in 2024.
Bridge condition is measured by percent of bridge deck area in poor condition. In District 8, bridges on the NHS are projected to fall below target in 2027, with approximately 4 percent of bridge deck area in poor condition in 2030.
For snowplowing, MnDOT has the goal to return the road to an acceptable driving condition in a prescribed amount of time (“time to bare lane”). The target time varies by the amount of traffic on the road. MnDOT’s goal is to meet the plowing target for each roadway 70 percent of the time in a season.
State of Minnesota 106 2022-23 Biennial BudgetNovember 2020