Embed Size (px)
Citation preview
The ASH Model for Hypertension Control and role of ASH Regional Chapters
ASH Regional ChaptersASH Clinical HTN SpecialistsThe O’QUIN HTN InitiativeBCBS / O’QUIN HTN Initiative QI-P4P
Collaborative

Year Aware Treated Rx/CControl
2000 63% 47% 50% 25%
2002 63% 50% 64% 30%
2004 67% 54% 64% 33%
2010 80% 72% 70% 50%All data are age-adjusted.
1Egan, Basile: J Invest Med, 2003.2Ong, et al: Hypertension, 2007.
Continuing national leadership role in professional education & research and by developing an educational / interactive website for the lay public
Expanding educational influence thru regional ASH Chapters committed to optimizing awareness, Rx, and control of Htn and concomitant CV risk factors.
Impacting HTN control locally thru a network of ASH Specialists and others focused on patient / community activation and practice optimization
Implementing CQI using a data-driven process.

PA, DE
FLORIDAFLORIDA
Rocky MountainsChapter inPlanning
Patient, provider, community, and systems characteristics vary by region
Local and regional solutions require coordinated & active input from local and regional stakeholders
Chapters serve as a focal point for stakeholders to identify best public health and practice models & methods for prevention and awareness, Rx & control of hypertension & other CV risk factors
Egan, Lackland, Basile: Am J Hypertens 2002;15:372-379.
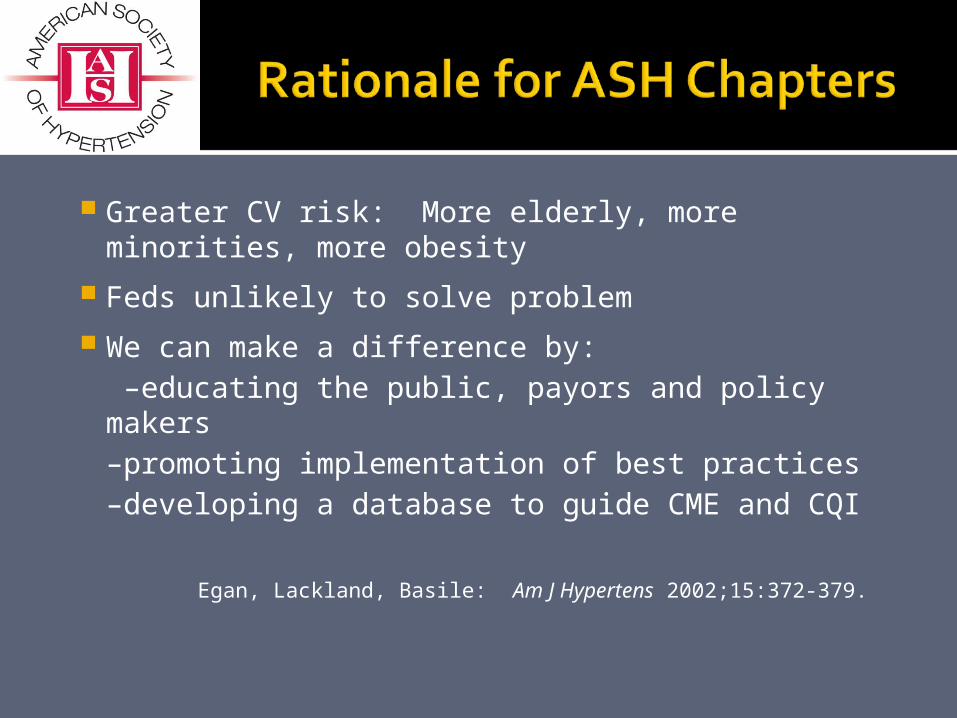
Greater CV risk: More elderly, more minorities, more obesity
Feds unlikely to solve problem
We can make a difference by: –educating the public, payors and policy makers–promoting implementation of best practices–developing a database to guide CME and CQI
Egan, Lackland, Basile: Am J Hypertens 2002;15:372-379.
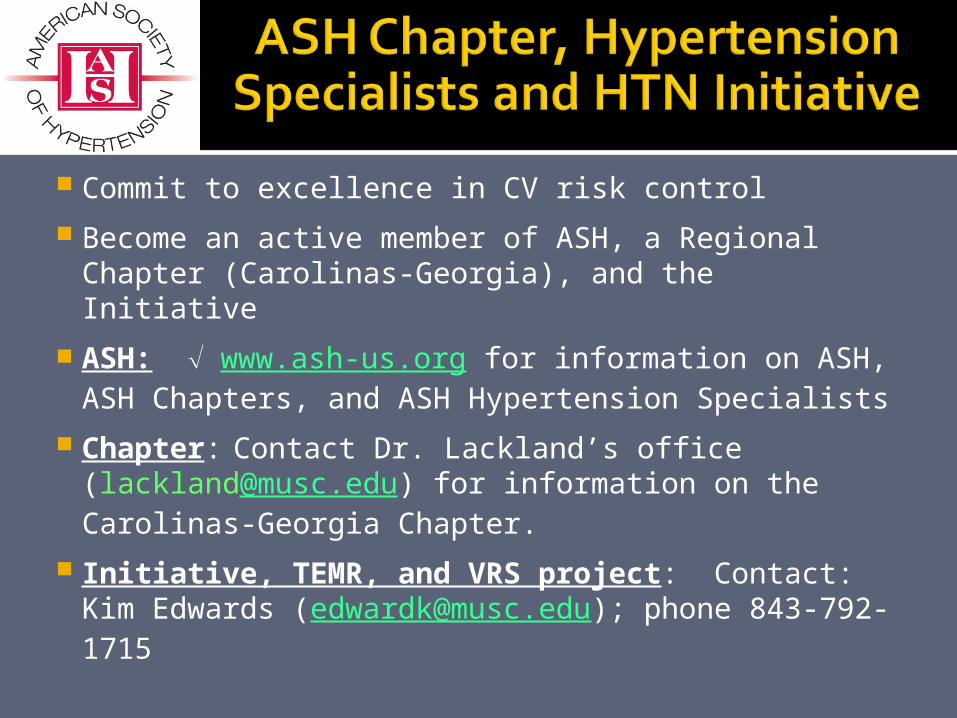
Commit to excellence in CV risk control
Become an active member of ASH, a Regional Chapter (Carolinas-Georgia), and the Initiative
ASH: www.ash-us.org for information on ASH, ASH Chapters, and ASH Hypertension Specialists
Chapter: Contact Dr. Lackland’s office ([email protected]) for information on the Carolinas-Georgia Chapter.
Initiative, TEMR, and VRS project: Contact: Kim Edwards ([email protected]); phone 843-792-1715
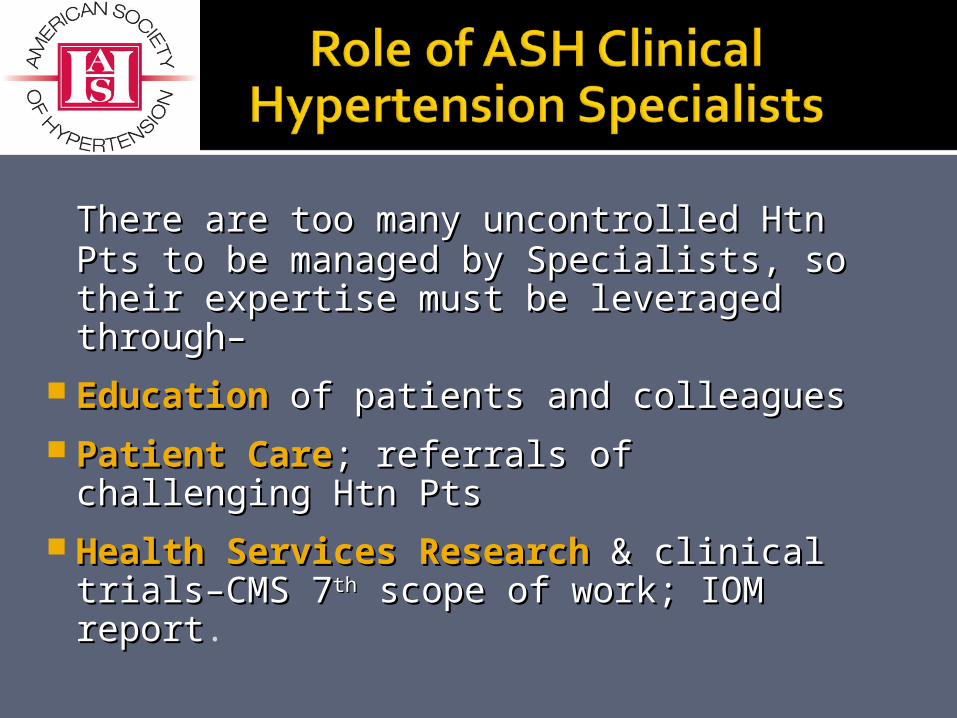
There are too many uncontrolled Htn Pts There are too many uncontrolled Htn Pts to be managed by Specialists, so their to be managed by Specialists, so their expertise must be leveraged throughexpertise must be leveraged through––
EducationEducation of patients and colleaguesof patients and colleagues Patient CarePatient Care; referrals of challenging ; referrals of challenging
Htn PtsHtn Pts Health Services Research Health Services Research & clinical & clinical
trialstrials––CMS 7CMS 7thth scope of work; IOM report scope of work; IOM report.

ASH Clinical HTN Specialists in the Carolinas & Georgia
Clinical Hypertension Specialists in GA, NC, SC. ASH goal: At least 1 HTN Specialists in every country / parish with 1 Specialist for every 20 primary care physicians
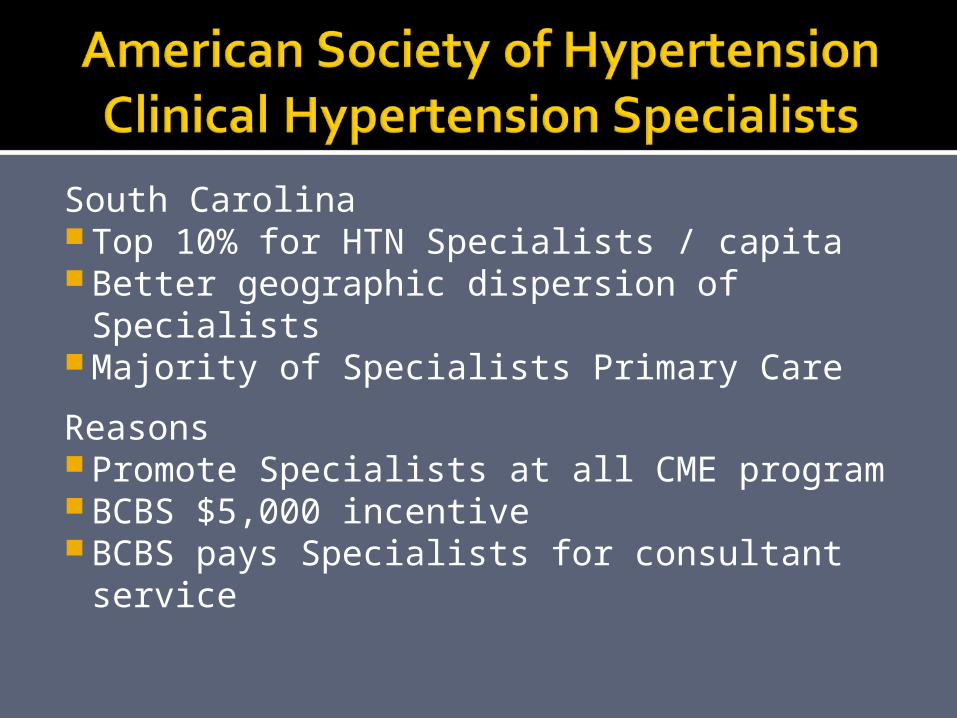
South Carolina Top 10% for HTN Specialists / capita Better geographic dispersion of
Specialists Majority of Specialists Primary Care
Reasons Promote Specialists at all CME program BCBS $5,000 incentive BCBS pays Specialists for consultant
service

The ASH Model for Hypertension Control and role of ASH Regional Chapters
ASH Regional ChaptersASH Clinical HTN Specialists
The O’QUIN HTN InitiativeThe O’QUIN HTN InitiativeBCBS / O’QUIN HTN Initiative QI-P4P
Collaborative

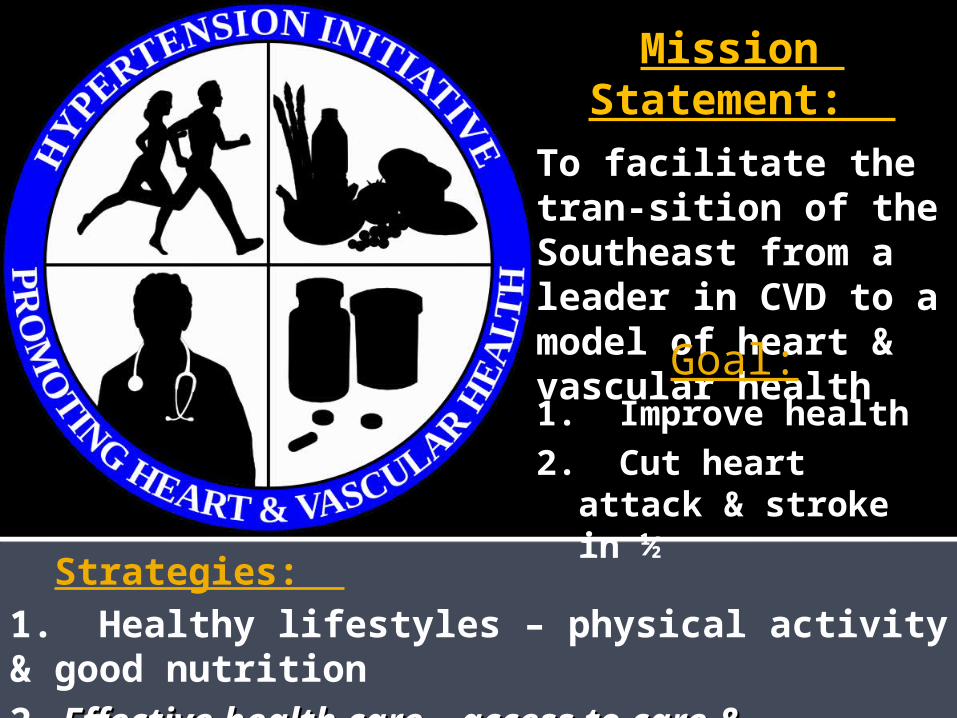
Strategies: 1. Healthy lifestyles – physical activity & Healthy lifestyles – physical activity & good nutrition good nutrition 2. Effective health care – access to care & medications
Mission Statement:
To facilitate the tran-sition of the Southeast from a leader in CVD to a model of heart & vascular health
Goal:1. Improve health2. Cut heart attack
& stroke in ½

Proverbs 23:1-3. Avoid rich (royal) food and gluttony. When you sit to dine with a ruler (royal food), note well what is before you, and put a knife to your throat if you are given to gluttony. Do not crave his delicacies, for that (royal) food is deceptive.
Daniel 1:12,15. Please test your servants for 10 days. Give us nothing but vegetables to eat and water to drink. At the end of 10 days they looked healthier and better nourished than the young men who ate the royal food.
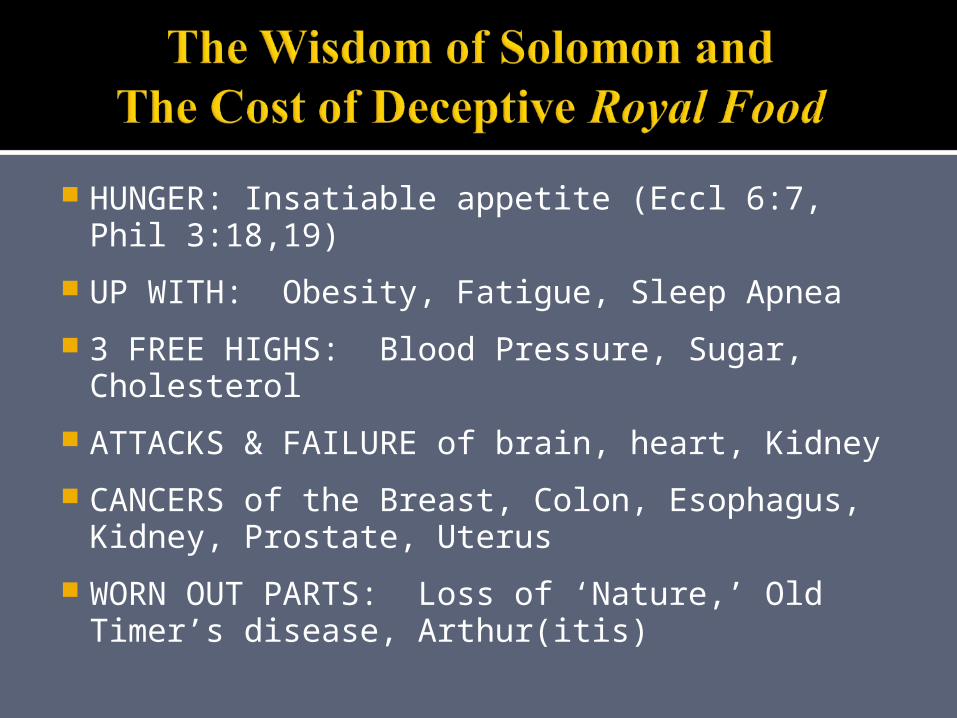
HUNGER: Insatiable appetite (Eccl 6:7, Phil 3:18,19)
UP WITH: Obesity, Fatigue, Sleep Apnea
3 FREE HIGHS: Blood Pressure, Sugar, Cholesterol
ATTACKS & FAILURE of brain, heart, Kidney
CANCERS of the Breast, Colon, Esophagus, Kidney, Prostate, Uterus
WORN OUT PARTS: Loss of ‘Nature,’ Old Timer’s disease, Arthur(itis)


Strategies: 1. Healthy lifestyles – physical activity & good nutrition 2. Effective health care – access to care & . Effective health care – access to care & medicationsmedications
Mission Statement:
To facilitate the tran-sition of the Southeast from a leader in CVD to a model of heart & vascular health
Goal:1. Improve health2. Cut heart attack
& stroke in ½
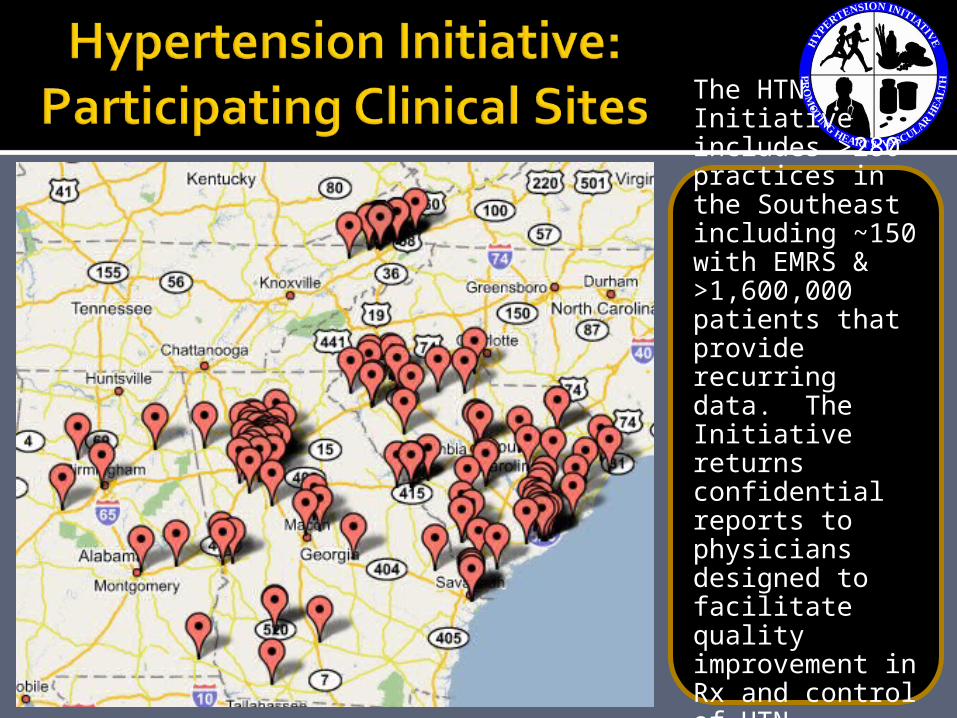
The HTN Initiative includes >280 practices in the Southeast including ~150 with EMRS & >1,600,000 patients that provide recurring data. The Initiative returns confidential reports to physicians designed to facilitate quality improvement in Rx and control of HTN, hyperlipidemia and diabetes.

.
Patients Patient ID (Masked) Birth Date (mo/yr) Race / Ethnicity Sex Insurance Status Zip Code / RUCA
Visits Patient ID (Masked) Date of Visit Site of visit (Masked) Provider Seen (Masked) Weight (kg); Height (m) Systolic , Diastolic BP
Medications Patient ID (Masked) Drug ID (FDA ID/NDID) Start, End Date Dose Unit Frequency
ICD9s / CPT codes Patient ID (Masked) ICD9 / Problem List CPT codes Dates
Labwork Patient ID (Masked) Date of Lab Lab Name Lab Result, Unit
Available in limited data set with IRB approval
Outcomes (SC only) ER visits, Dx, Cost Hosp, Dx, Cost Prescriptions filled (Medicaid)
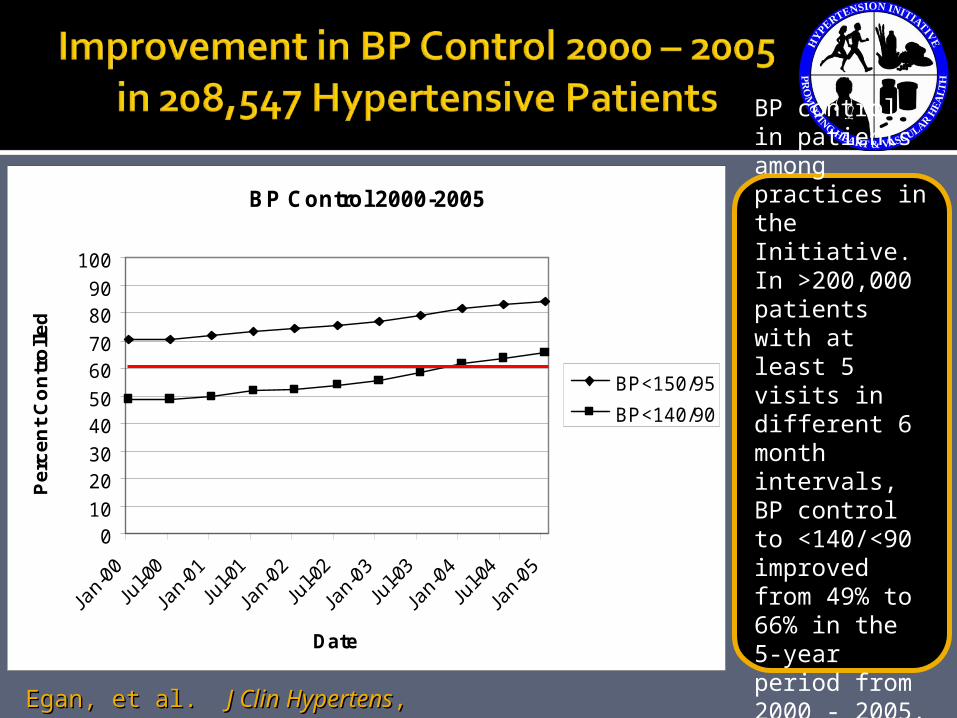
BP Control 2000-2005
010
2030
4050
6070
8090
100
Date
Pe
rce
nt
Co
ntr
oll
ed
BP<150/95
BP<140/90
BP control in patients among practices in the Initiative. In >200,000 patients with at least 5 visits in different 6 month intervals, BP control to <140/<90 improved from 49% to 66% in the 5-year period from 2000 - 2005. Egan, et al. Egan, et al. J Clin HypertensJ Clin Hypertens, 2006., 2006.
0
10
20
30
40
50
60
70
80
90
100
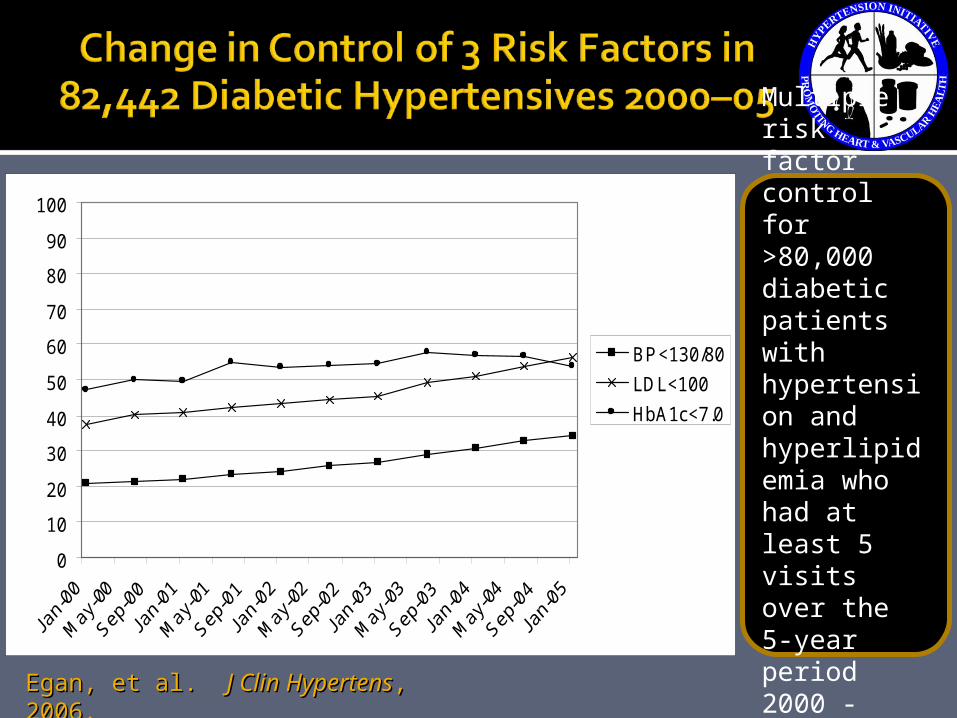
BP<130/80
LDL<100
HbA1c<7.0
Multiple risk factor control for >80,000 diabetic patients with hypertension and hyperlipidemia who had at least 5 visits over the 5-year period 2000 - 200s.
Egan, et al. Egan, et al. J Clin HypertensJ Clin Hypertens, 2006., 2006.
Time Trends
0
10
20
30
40
50
60
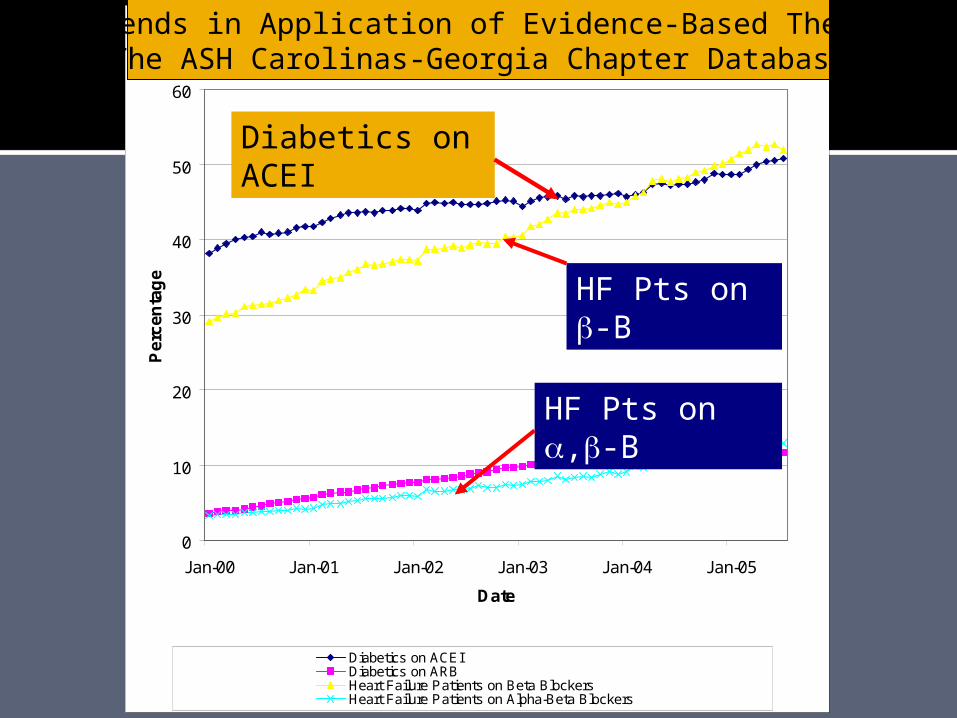
Jan-00 Jan-01 Jan-02 Jan-03 Jan-04 Jan-05
Date
Pe
rce
nta
ge
Diabetics on ACEIDiabetics on ARBHeart Failure Patients on Beta BlockersHeart Failure Patients on Alpha-Beta Blockers
Time Trends in Application of Evidence-Based Therapies:The ASH Carolinas-Georgia Chapter Database
HF Pts on -B
HF Pts on ,-B
Diabetics on ACEI
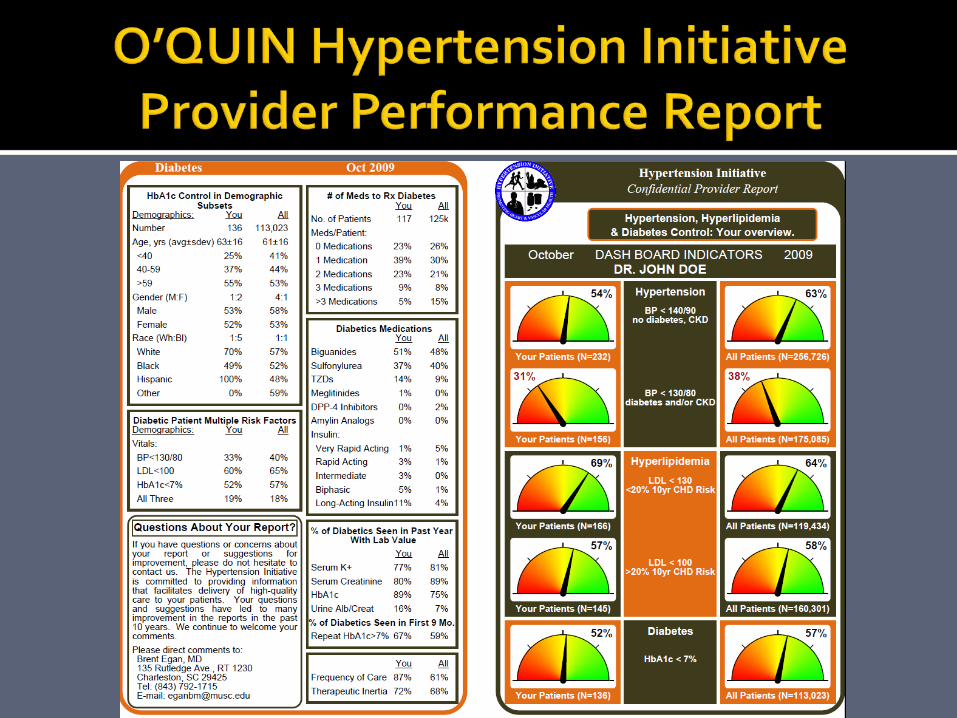
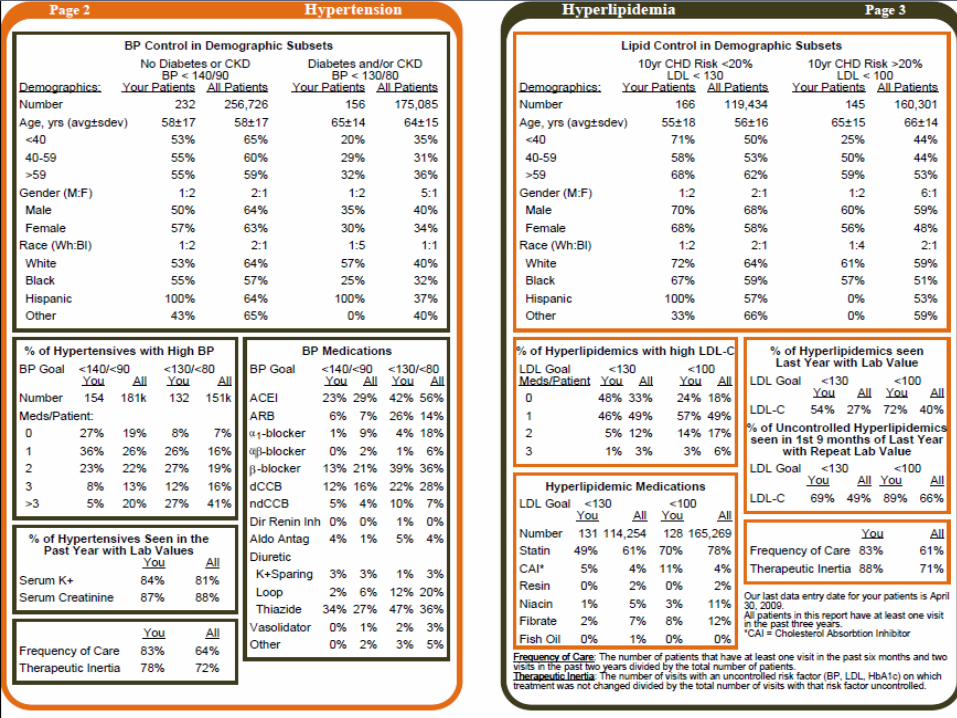
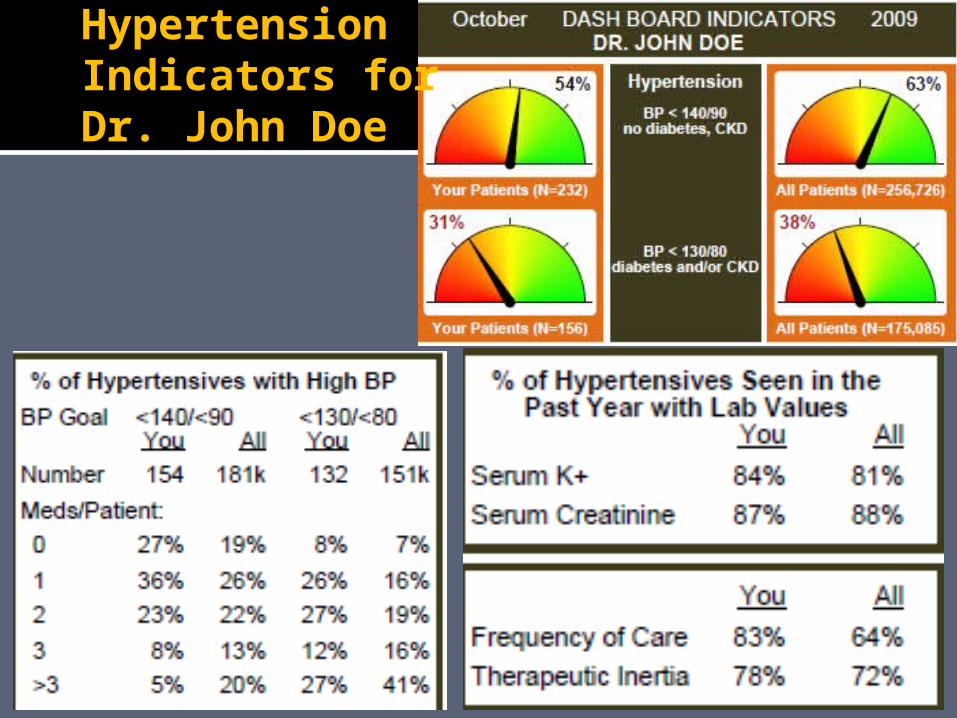
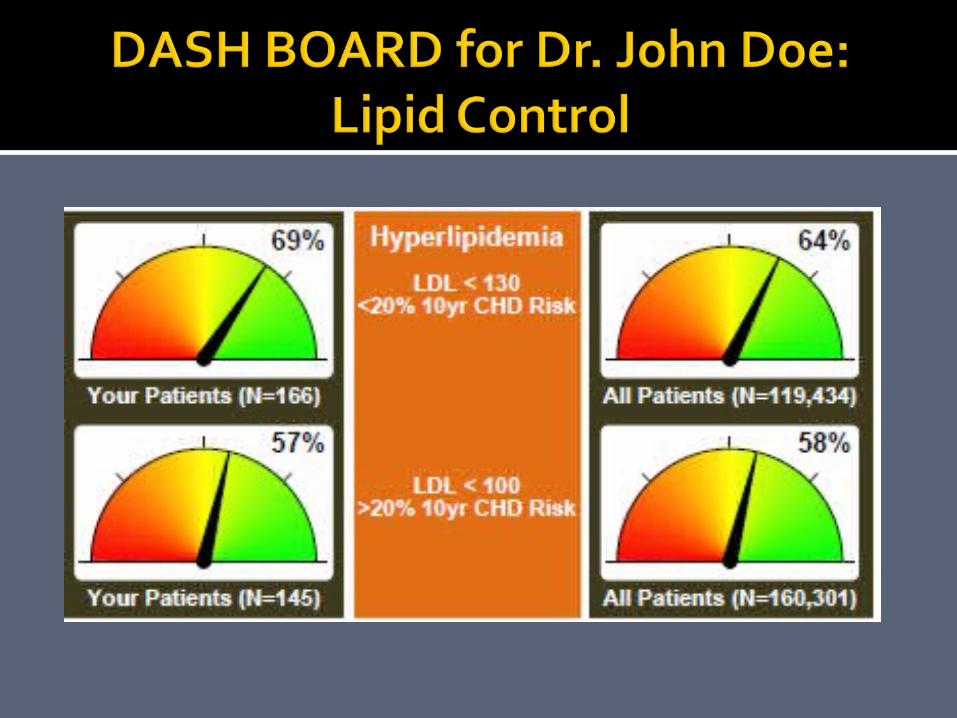
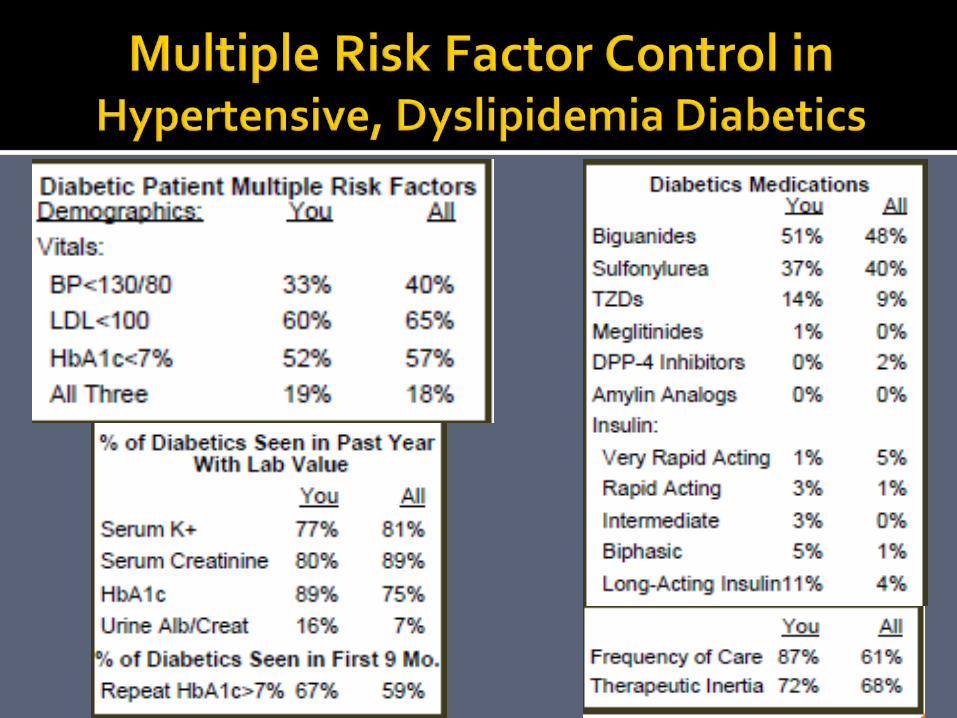
Hypertension Indicators for Dr. John Doe
P<0.01 P<0.001
30.0%
35.0%
40.0%
45.0%
50.0%
55.0%
60.0%
65.0%
70.0%
VA Non-VA
%B
P <
140
/90
Caucasians
African American
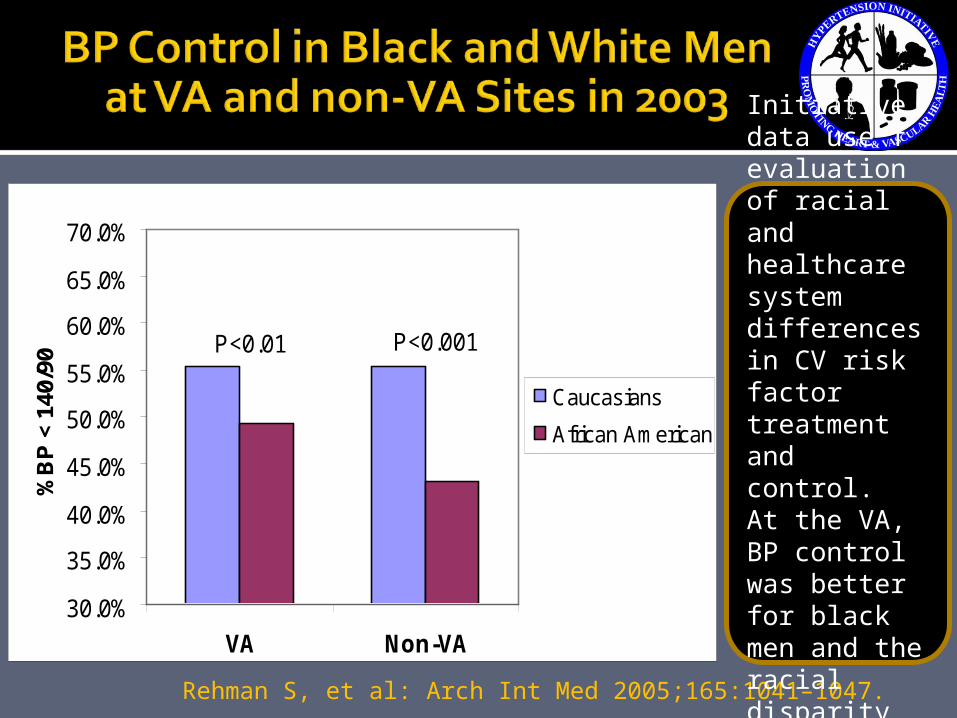
Rehman S, et al: Arch Int Med 2005;165:1041–1047.
Initiative data use f evaluation of racial and healthcare system differences in CV risk factor treatment and control. At the VA, BP control was better for black men and the racial disparity was less.

0
10
20
30
40
50
60
70
80
Q1 Q2 Q3 Q4 Q5
Quintiles of therapeutic inertia score
% w
ith B
P <
140/
90 m
mHg
mm
Hg
First visit
Last visit
Okonofua E, et al: Hypertension 2006;47:1–7.
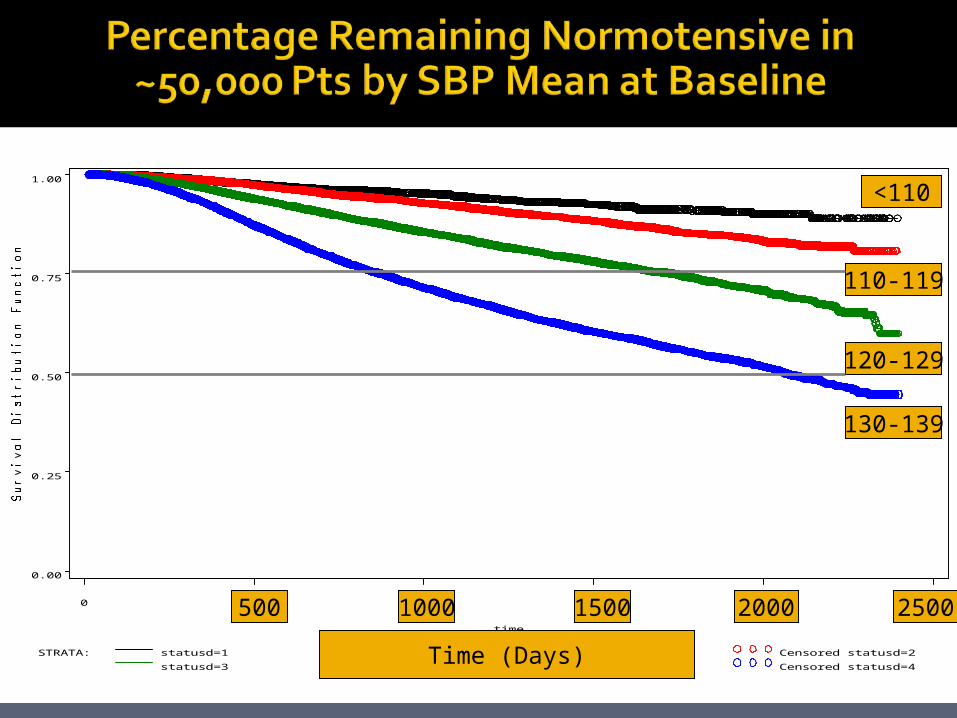
0. 00
0. 25
0. 50
0. 75
1. 00
t i me
0 500 1000 1500 2000 2500
STRATA: s t at usd=1 Censor ed s t at usd=1 st at usd=2 Censor ed s t at usd=2st at usd=3 Censor ed s t at usd=3 st at usd=4 Censor ed s t at usd=4
130-139
120-129
110-119
<110
Time (Days)
500 1000 1500 2000 2500
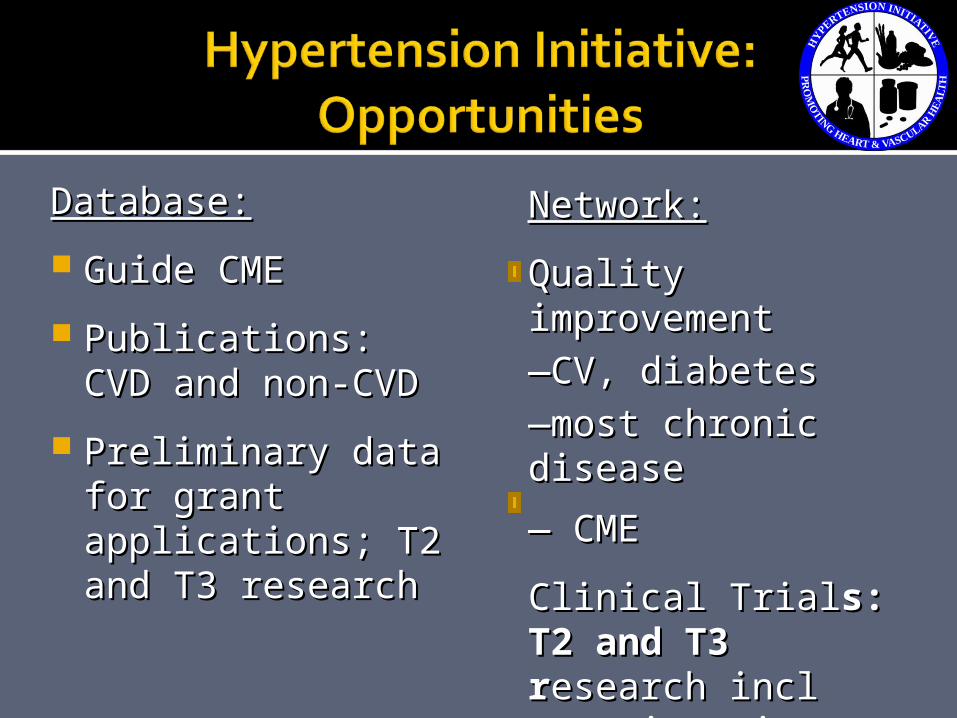
Database:Database:
Guide CMEGuide CME
Publications: CVD Publications: CVD and non-CVDand non-CVD
Preliminary data for Preliminary data for grant applications; grant applications; T2 and T3 researchT2 and T3 research
Network:Network:
Quality Quality improvement improvement
——CV, diabetesCV, diabetes
——most chronic most chronic diseasedisease
— — CMECME
Clinical TrialClinical Trials: T2 s: T2 and T3 rand T3 research esearch incl genetic epi, incl genetic epi, pharmacogenomicspharmacogenomics
Walsh, et al: Med Care 2006.Walsh, et al: Med Care 2006.
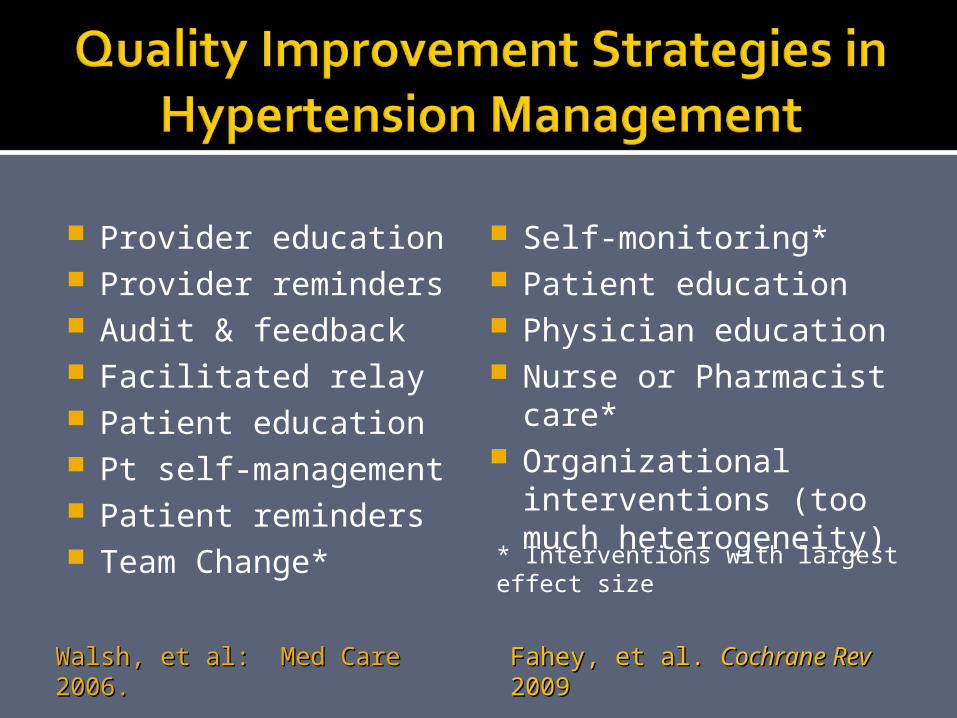
Provider education Provider reminders Audit & feedback Facilitated relay Patient education Pt self-management Patient reminders Team Change*
Fahey, et al. Fahey, et al. Cochrane Rev Cochrane Rev 20092009
Self-monitoring* Patient education Physician education Nurse or Pharmacist
care* Organizational
interventions (too much heterogeneity)
* Interventions with largest effect size
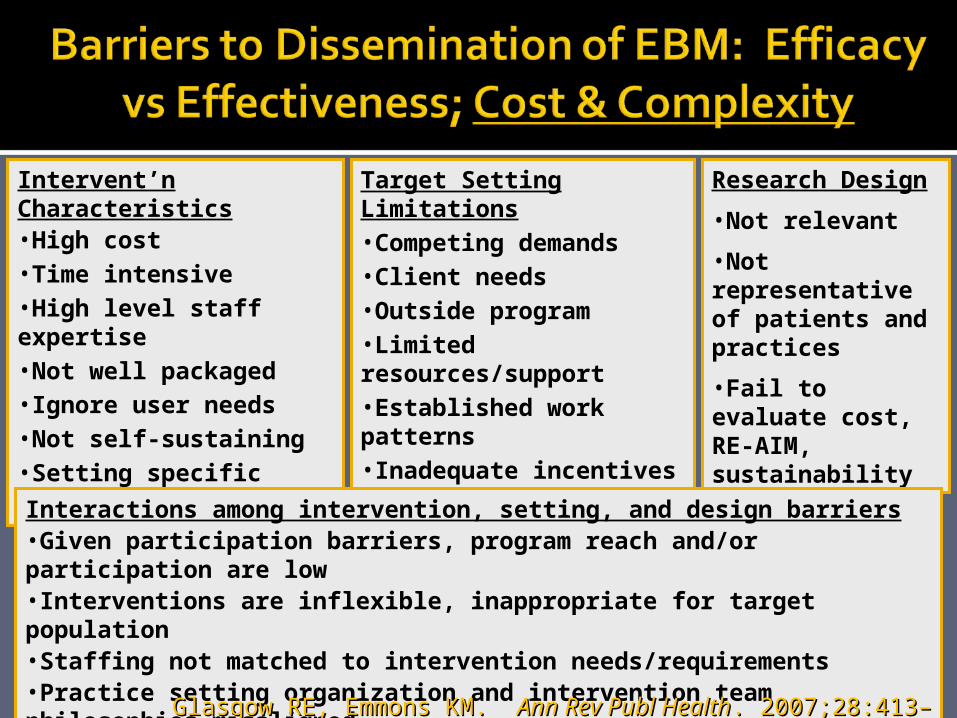
Intervent’n Characteristics•High cost•Time intensive•High level staff expertise•Not well packaged•Ignore user needs•Not self-sustaining•Setting specific•Not ‘customizable’
Target Setting Limitations•Competing demands•Client needs•Outside program•Limited resources/support •Established work patterns•Inadequate incentives•Low-quality implementation
Research Design
•Not relevant
•Not representative of patients and practices
•Fail to evaluate cost, RE-AIM, sustainability
Interactions among intervention, setting, and design barriers•Given participation barriers, program reach and/or participation are low•Interventions are inflexible, inappropriate for target population•Staffing not matched to intervention needs/requirements•Practice setting organization and intervention team philosophies misaligned•Practice setting unable to implement intervention as designed
Glasgow RE, Emmons KM. Glasgow RE, Emmons KM. Ann Rev Publ HealthAnn Rev Publ Health. 2007;28:413–433.. 2007;28:413–433.
The ASH Model for Hypertension Control and role of ASH Regional Chapters
ASH Regional ChaptersASH Clinical HTN Specialists The O’QUIN HTN InitiativeThe O’QUIN HTN Initiative
BCBS / O’QUIN HTN Initiative QI-BCBS / O’QUIN HTN Initiative QI-P4P CollaborativeP4P Collaborative
What’s wrong with the current reimbursement system
P4P: Definition, objectives, measures
Brief review CMS QI Roadmap
AHA translation and QI principles
QI-P4P key design elements
Previous experience; early adopters
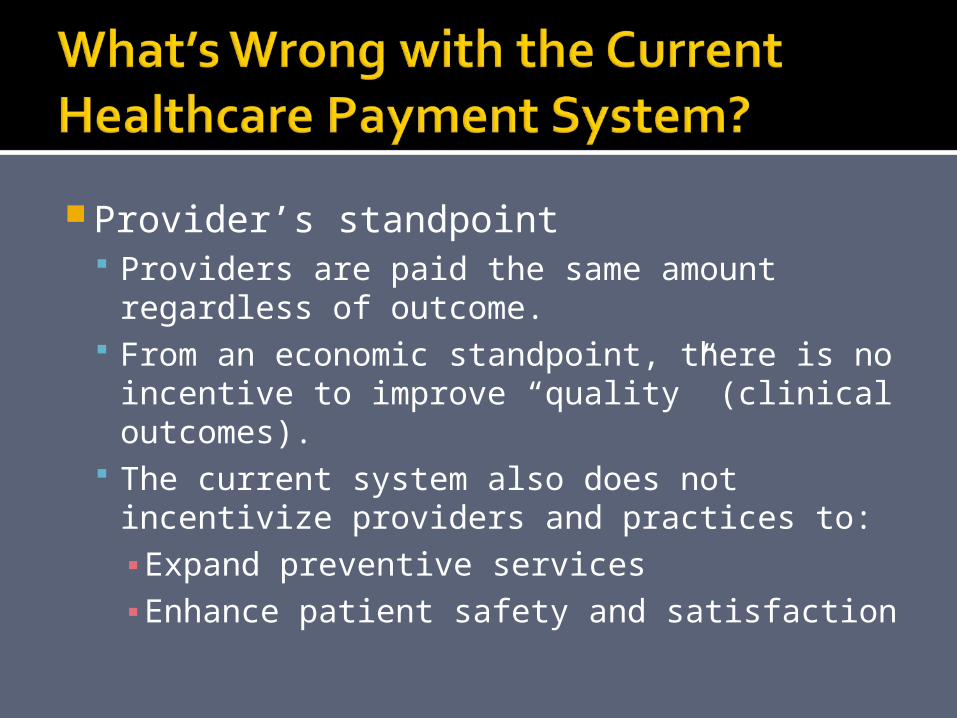
Provider’s standpoint Providers are paid the same amount
regardless of outcome. From an economic standpoint, there is no
incentive to improve “quality” (clinical outcomes).
The current system also does not incentivize providers and practices to:▪ Expand preventive services▪ Enhance patient safety and satisfaction
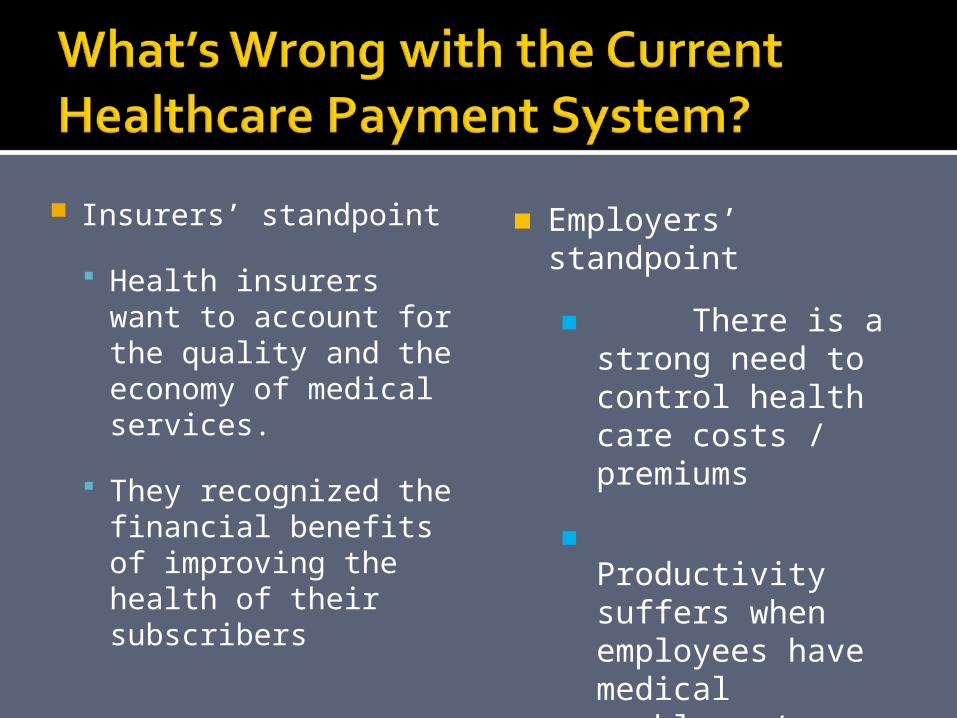
Insurers’ standpoint
Health insurers want to account for the quality and the economy of medical services.
They recognized the financial benefits of improving the health of their subscribers
Employers’ standpoint
There is a strong need to control health care costs / premiums
Productivity suffers when employees have medical problems / issues
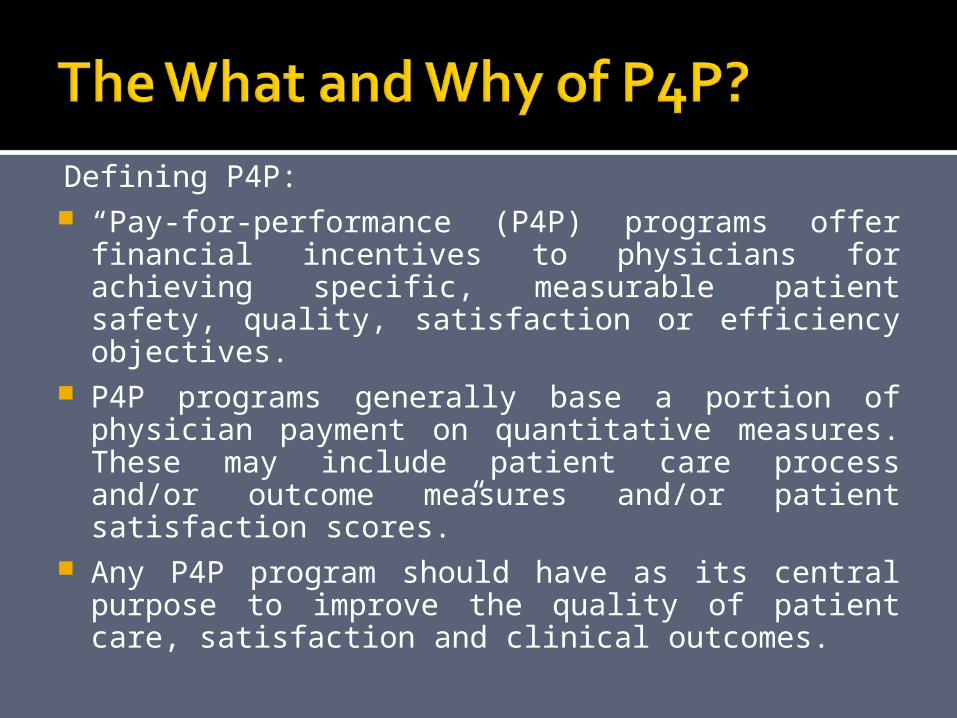
Defining P4P: “Pay-for-performance (P4P) programs offer
financial incentives to physicians for achieving specific, measurable patient safety, quality, satisfaction or efficiency objectives.
P4P programs generally base a portion of physician payment on quantitative measures. These may include patient care process and/or outcome measures and/or patient satisfaction scores.”
Any P4P program should have as its central purpose to improve the quality of patient care, satisfaction and clinical outcomes.
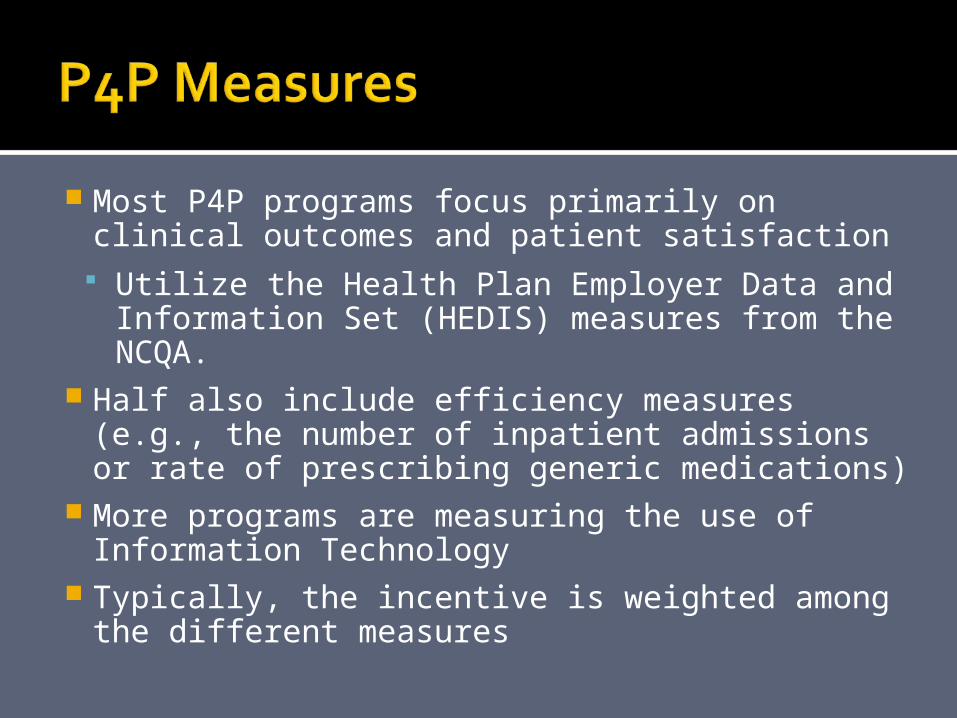
Most P4P programs focus primarily on clinical outcomes and patient satisfaction Utilize the Health Plan Employer Data and
Information Set (HEDIS) measures from the NCQA.
Half also include efficiency measures (e.g., the number of inpatient admissions or rate of prescribing generic medications)
More programs are measuring the use of Information Technology
Typically, the incentive is weighted among the different measures

Make care:
Safe
Effective
Efficient
Patient-centered
Timely
Equitable
Strategies
Work through partnerships
Measure quality and report comparative results
Value-Based Purchasing: improve quality and avoid unnecessary costs
Encourage adoption of effective health information technology
Promote innovation and the evidence base for effective use of technology
Vision: The right care for every person every time
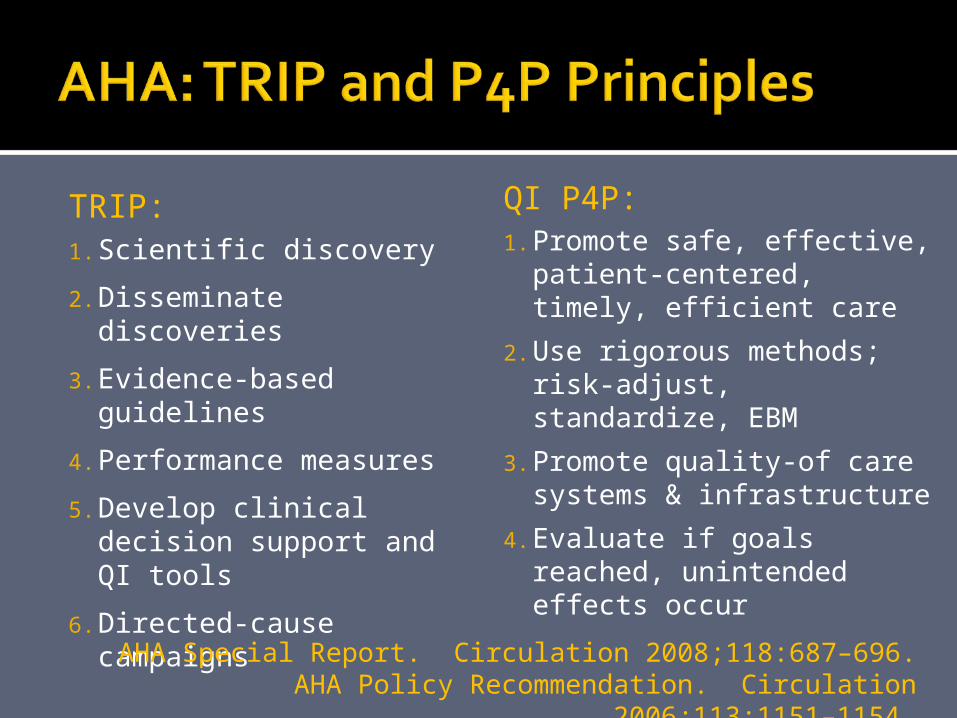
TRIP:1. Scientific discovery
2. Disseminate discoveries
3. Evidence-based guidelines
4. Performance measures
5. Develop clinical decision support and QI tools
6. Directed-cause campaigns
QI P4P:1. Promote safe, effective,
patient-centered, timely, efficient care
2. Use rigorous methods; risk-adjust, standardize, EBM
3. Promote quality-of care systems & infrastructure
4. Evaluate if goals reached, unintended effects occur
AHA Special Report. Circulation 2008;118:687–696.AHA Policy Recommendation. Circulation 2006;113:1151–
1154.
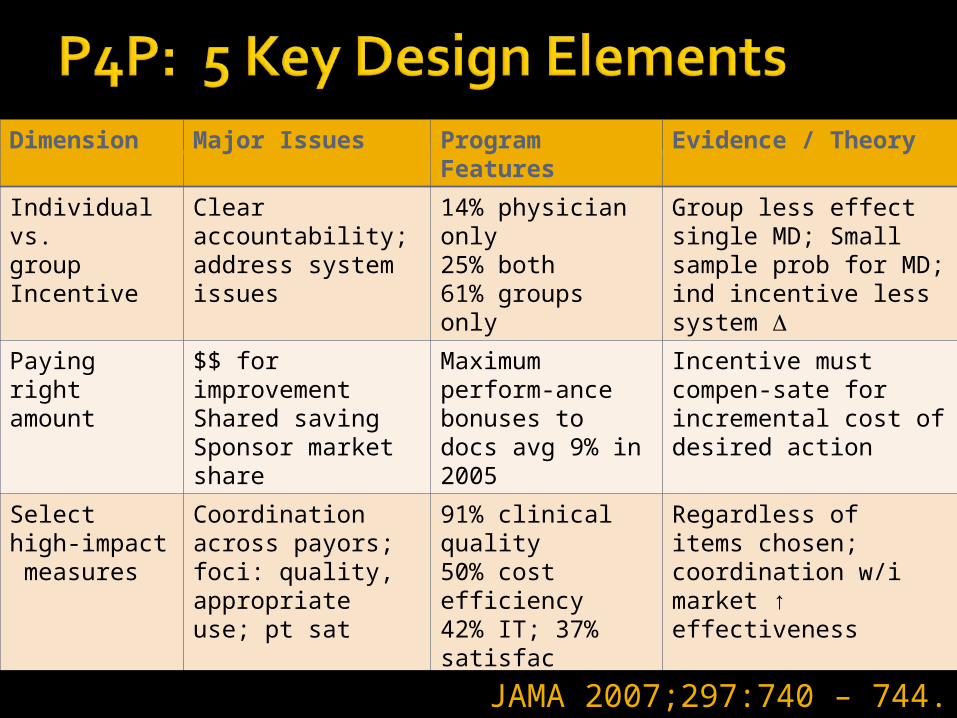
Dimension Major Issues Program Features
Evidence / Theory
Individual vs. group Incentive
Clear accountability; address system issues
14% physician only25% both61% groups only
Group less effect single MD; Small sample prob for MD; ind incentive less system
Paying right amount
$$ for improvementShared savingSponsor market share
Maximum perform-ance bonuses to docs avg 9% in 2005
Incentive must compen-sate for incremental cost of desired action
Select high-impact measures
Coordination across payors; foci: quality, appropriate use; pt sat
91% clinical quality50% cost efficiency42% IT; 37% satisfac
Regardless of items chosen; coordination w/i market ↑ effectiveness
Payment reward for all quality care
1 or more thresholds; reward improvement; $ ea pt mtg standard
70% use thresholds; 25% reward improvements
MDs respond to ↑$ / task; threshold doesn’t reward + or ↑ threshold
QI for under-served groups
Recog extra $$ of improving care; may need pt incentives
Example: $$ for cultural competency training; no data
If higher $$ for improving care in some groups, then reward needs adjustment
JAMA 2007;297:740 – 744.
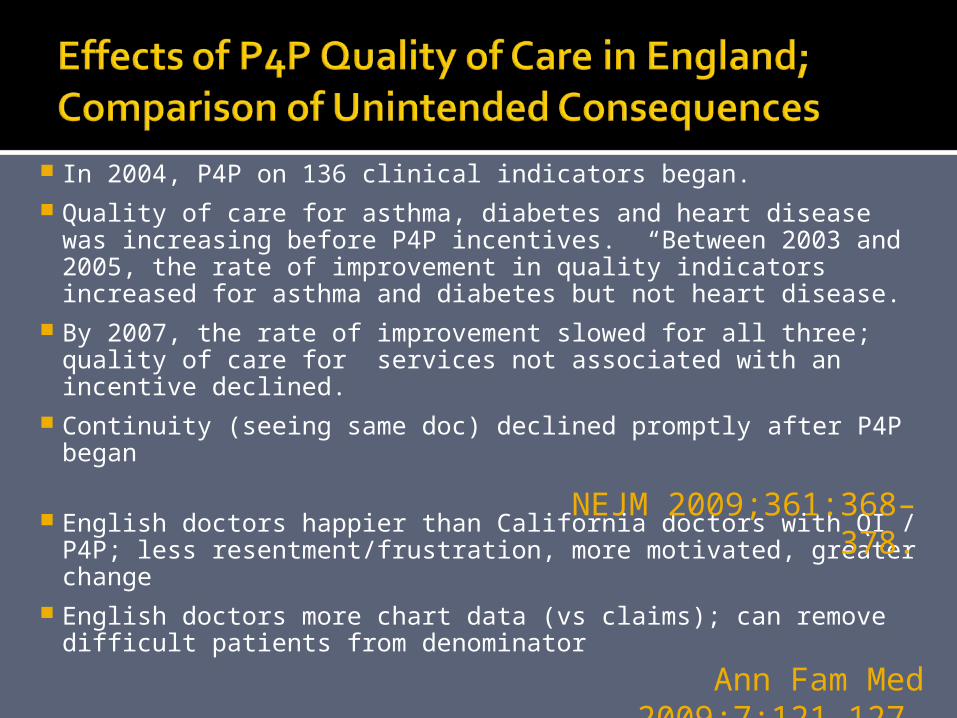
In 2004, P4P on 136 clinical indicators began. Quality of care for asthma, diabetes and heart disease was
increasing before P4P incentives. “Between 2003 and 2005, the rate of improvement in quality indicators increased for asthma and diabetes but not heart disease.
By 2007, the rate of improvement slowed for all three; quality of care for services not associated with an incentive declined.
Continuity (seeing same doc) declined promptly after P4P began
English doctors happier than California doctors with QI / P4P; less resentment/frustration, more motivated, greater change
English doctors more chart data (vs claims); can remove difficult patients from denominator Ann Fam Med
2009;7:121–127.
NEJM 2009;361:368–378.
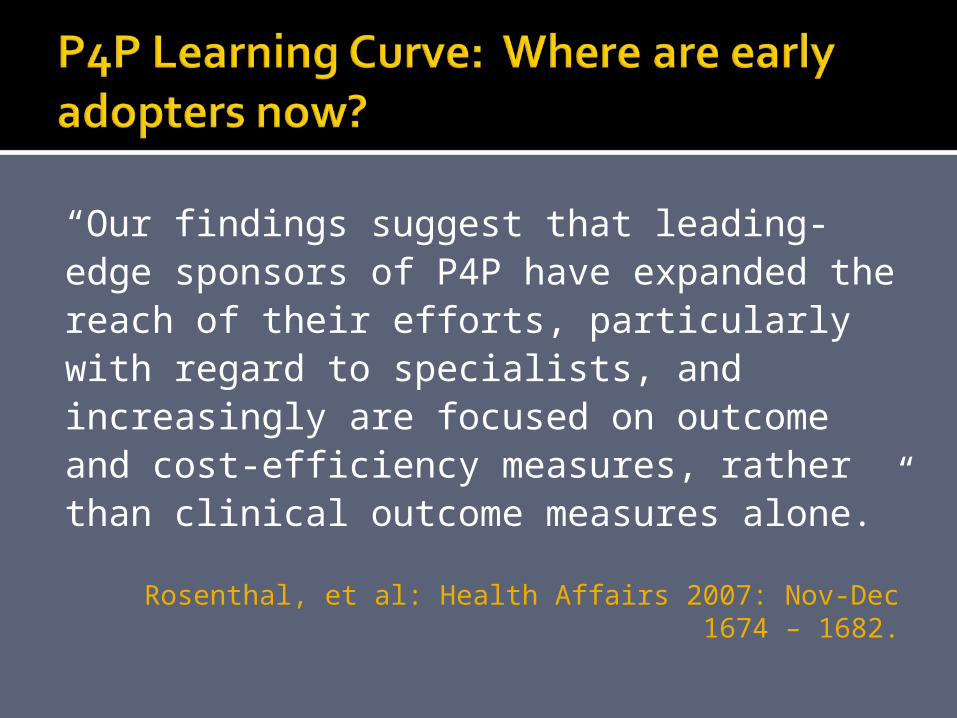
“Our findings suggest that leading-edge sponsors of P4P have expanded the reach of their efforts, particularly with regard to specialists, and increasingly are focused on outcome and cost-efficiency measures, rather than clinical outcome measures alone.”
Rosenthal, et al: Health Affairs 2007: Nov-Dec 1674 – 1682.

Inaugural meeting of the ‘Healthcare Quality and Reimbursement (HQR) Advisory Board’, comprised of key opinion leaders from 12 practices. Three ‘domains’ were identified as essential to a successful collaboration. Quality indicators. Thoughtful selection of high impact process and outcome indicators that can be clearly defined and rigorously measured across practice settings.Quality improvement. Develop, share, refine best practices to ensure productive encounters and attain goals of the process and outcome indicator selected.Reimbursement/incentives. Define & implement incentives that compensate for time and resources invested to meet goals of process and outcome indicators.

Process Outcome
Serum K+ yearly BP <140/<90 if no DM or CKD
Serum creatinine yearly BP <130/<90 if DM and/or CKD
Care freq: monthly until BP controlled then q 3–6 moPrescribed >2 BP Meds

Process OutcomeHbA1c q 3mo until controlled then q 6 mo
HbA1c <7%HbA1c >9%
Lipid profile annually for most LDL <100Serum creat and urine albumin BP <130/<80
BP >140/>90Statin if CAD (eq) or >40 and >1 other CVD riskASA 75–162 mg if CAD or >40 yrs or other CVD risk

Process Outcome
Visit freq: q 6wk until controlled, then q 4 – 6 mo
LDL <100 (optional <70) CHD and risk equiv
Therapeutic Lifestyle Change education
LDL <130 (2+ risk factors, 10-yr CHD risk 10–19%)
Prescribed >1 lipid lowering medication
LDL <160 (0 – 1 risk factors, 10-yr CHD risk <10%)
The ASH Model for Hypertension Control and role of ASH Regional Chapters
ASH Regional ChaptersASH Clinical HTN SpecialistsThe O’QUIN HTN InitiativeBCBS / O’QUIN HTN Initiative QI-P4P
Collaborative