Embed Size (px)
Citation preview
www.MaterialsViews.comwww.advenergymat.de
FULL P
APER
Huei-Ru “Molly” Jhong , Fikile R. Brushett , and Paul J. A. Kenis *The Effects of Catalyst Layer Deposition Methodology on Electrode Performance
© 2013 WILEY-VCH Verlag GmbH & Co. KGaA, WeinheiAdv. Energy Mater. 2013, 3, 589–599
DOI: 10.1002/aenm.201200759
H.-R. “Molly” Jhong, Dr. F. R. Brushett,Prof. P. J. A. KenisDepartment of Chemical & Biomolecular EngineeringUniversity of Illinois at Urbana-ChampaignUrbana IL, USA E-mail: [email protected] H.-R. “Molly” Jhong, Prof. P. J. A. KenisInternational Institute for Carbon Neutral Energy Research(WPI-I2CNER)Kyushu UniversityFukuoka, Japan Prof. F. R. BrushettDepartment of Chemical EngineeringMassachusetts Institute of TechnologyCambridge MA, USA
The catalyst layer of the cathode is arguably the most critical component of low-temperature fuel cells and carbon dioxide (CO 2 ) electrolysis cells because their performance is typically limited by slow oxygen (O 2 ) and CO 2 reduc-tion kinetics. While signifi cant efforts have focused on developing cathode catalysts with improved activity and stability, fewer efforts have focused on engineering the catalyst layer structure to maximize catalyst utilization and overall electrode and system performance. Here, we study the performance of cathodes for O 2 reduction and CO 2 reduction as a function of three common catalyst layer preparation methods: hand-painting, air-brushing, and screen-printing. We employed ex-situ X-ray micro-computed tomography (MicroCT) to visualize the catalyst layer structure and established data processing procedures to quantify catalyst uniformity. By coupling structural analysis with in-situ electrochemical characterization, we directly correlate variation in catalyst layer morphology to electrode performance. MicroCT and SEM analyses indicate that, as expected, more uniform catalyst distribution and less particle agglomeration, lead to better performance. Most importantly, the analyses reported here allow for the observed differences over a large geometric volume as a function of preparation methods to be quantifi ed and explained for the fi rst time. Depositing catalyst layers via a fully-automated air-brushing method led to a 56% improvement in fuel cell performance and a signifi cant reduction in electrode-to-electrode variability. Furthermore, air-brushing catalyst layers for CO 2 reduction led to a 3-fold increase in partial CO current density and enhanced product selectivity (94% CO) at similar cathode potential but a 10-fold decrease in catalyst loading as compared to previous reports.
1. Introduction
Electrodes play a vital role in all devices based on heterogeneous electrochemical reactions for energy conversion, energy storage, and chemical synthesis. The per-formance and durability of these devices is largely determined by the processes that occur at the catalyst layer-electrolyte interface. For example, the widespread commercialization of polymer-electrolyte membrane fuel cells (PEMFCs) has been limited by the cathodic oxygen reduction reaction (ORR) which requires high load-ings of expensive platinum (Pt) catalyst to achieve performance benchmarks. [ 1 ] Furthermore, the development of econom-ically-feasible electrochemical reactors to convert carbon dioxide (CO 2 ) to value-added compounds requires the advent of catalytic material with high activity and selectivity. [ 2 ] While signifi cant research efforts have focused on catalyst discovery and development, considerably fewer efforts have focused on the study of these catalysts after immobilization on gas dif-fusion electrodes (GDEs). Developing an improved understanding of how different catalyst layer deposition methods impact the electrode performance is often key to enhancing overall performance of the elec-trochemical process.
Micro-computed X-ray tomography (MicroCT) is an emerging analytical
technique that measures variations in X-ray attenuation upon rotating samples, to generate three-dimensional (3D) maps of samples with high spatial resolution (1−10 μ m) in a non-destructive fashion over large geometric volumes (on the order of 1 mm 3 ). [ 3 ] Furthermore, variations in X-ray absorption enable identifi cation of different phases/elements, and their distri-bution, within the sample. Typical GDEs, used for fuel cell and CO 2 electroreduction applications, consist of a 5−20 μ m thick catalyst layer deposited on a 200−500 μ m thick gas dif-fusion layer (GDL). Though quite thin, the catalyst layers pri-marily consist of clusters of metallic particles that exhibit high X-ray absorption, enabling identifi cation of small amounts of materials over a broad geometric area (1 mm × 1 mm). While MicroCT enables visualization of catalyst layer structure (down to a voxel size of 1 μ m 3 ) and uniformity across the carbonaceous
589wileyonlinelibrary.comm
590
www.MaterialsViews.comwww.advenergymat.de
FULL
PAPER
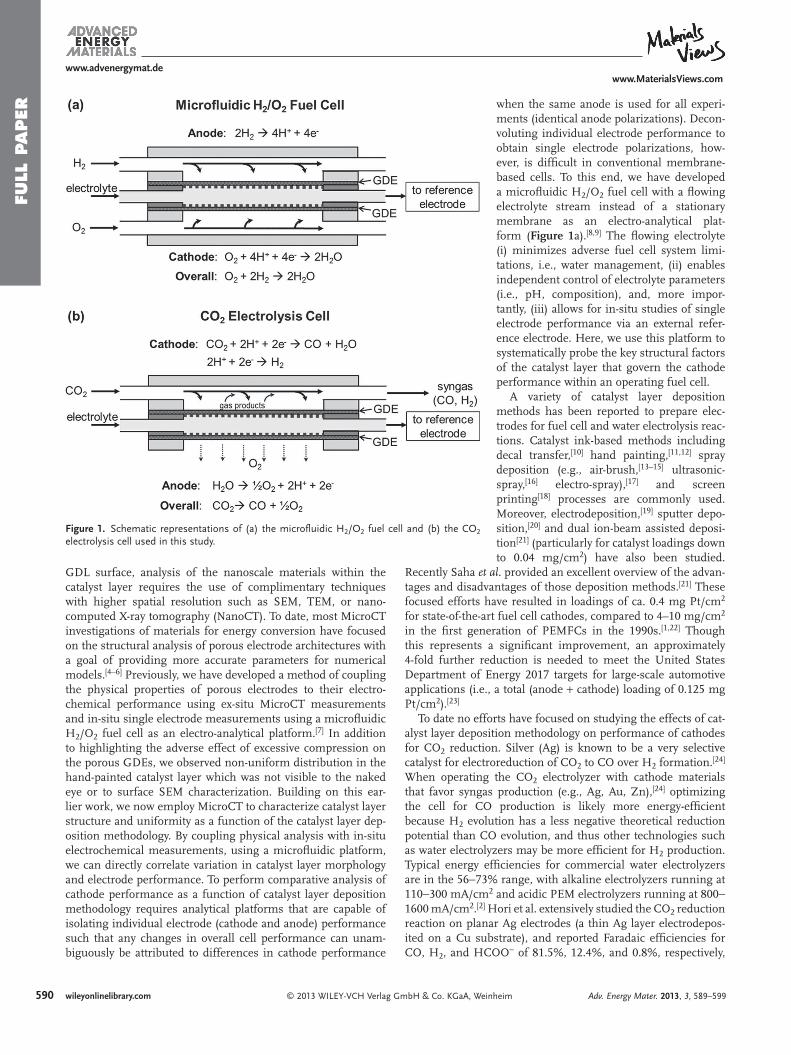
Figure 1 . Schematic representations of (a) the microfl uidic H 2 /O 2 fuel cell and (b) the CO 2 electrolysis cell used in this study.
GDL surface, analysis of the nanoscale materials within the catalyst layer requires the use of complimentary techniques with higher spatial resolution such as SEM, TEM, or nano-computed X-ray tomography (NanoCT). To date, most MicroCT investigations of materials for energy conversion have focused on the structural analysis of porous electrode architectures with a goal of providing more accurate parameters for numerical models. [ 4–6 ] Previously, we have developed a method of coupling the physical properties of porous electrodes to their electro-chemical performance using ex-situ MicroCT measurements and in-situ single electrode measurements using a microfl uidic H 2 /O 2 fuel cell as an electro-analytical platform. [ 7 ] In addition to highlighting the adverse effect of excessive compression on the porous GDEs, we observed non-uniform distribution in the hand-painted catalyst layer which was not visible to the naked eye or to surface SEM characterization. Building on this ear-lier work, we now employ MicroCT to characterize catalyst layer structure and uniformity as a function of the catalyst layer dep-osition methodology. By coupling physical analysis with in-situ electrochemical measurements, using a microfl uidic platform, we can directly correlate variation in catalyst layer morphology and electrode performance. To perform comparative analysis of cathode performance as a function of catalyst layer deposition methodology requires analytical platforms that are capable of isolating individual electrode (cathode and anode) performance such that any changes in overall cell performance can unam-biguously be attributed to differences in cathode performance
wileyonlinelibrary.com © 2013 WILEY-VCH Verlag GmbH & Co. KGaA, Wein
when the same anode is used for all experi-ments (identical anode polarizations). Decon-voluting individual electrode performance to obtain single electrode polarizations, how-ever, is diffi cult in conventional membrane-based cells. To this end, we have developed a microfl uidic H 2 /O 2 fuel cell with a fl owing electrolyte stream instead of a stationary membrane as an electro-analytical plat-form ( Figure 1 a). [ 8 , 9 ] The fl owing electrolyte (i) minimizes adverse fuel cell system limi-tations, i.e., water management, (ii) enables independent control of electrolyte parameters (i.e., pH, composition), and, more impor-tantly, (iii) allows for in-situ studies of single electrode performance via an external refer-ence electrode. Here, we use this platform to systematically probe the key structural factors of the catalyst layer that govern the cathode performance within an operating fuel cell.
A variety of catalyst layer deposition methods has been reported to prepare elec-trodes for fuel cell and water electrolysis reac-tions. Catalyst ink-based methods including decal transfer, [ 10 ] hand painting, [ 11 , 12 ] spray deposition (e.g., air-brush, [ 13–15 ] ultrasonic-spray, [ 16 ] electro-spray), [ 17 ] and screen printing [ 18 ] processes are commonly used. Moreover, electrodeposition, [ 19 ] sputter depo-sition, [ 20 ] and dual ion-beam assisted deposi-tion [ 21 ] (particularly for catalyst loadings down to 0.04 mg/cm 2 ) have also been studied.
Recently Saha et al. provided an excellent overview of the advan-tages and disadvantages of those deposition methods. [ 21 ] These focused efforts have resulted in loadings of ca. 0.4 mg Pt/cm 2 for state-of-the-art fuel cell cathodes, compared to 4–10 mg/cm 2 in the fi rst generation of PEMFCs in the 1990s. [ 1 , 22 ] Though this represents a signifi cant improvement, an approximately 4-fold further reduction is needed to meet the United States Department of Energy 2017 targets for large-scale automotive applications (i.e., a total (anode + cathode) loading of 0.125 mg Pt/cm 2 ). [ 23 ]
To date no efforts have focused on studying the effects of cat-alyst layer deposition methodology on performance of cathodes for CO 2 reduction. Silver (Ag) is known to be a very selective catalyst for electroreduction of CO 2 to CO over H 2 formation. [ 24 ] When operating the CO 2 electrolyzer with cathode materials that favor syngas production (e.g., Ag, Au, Zn), [ 24 ] optimizing the cell for CO production is likely more energy-effi cient because H 2 evolution has a less negative theoretical reduction potential than CO evolution, and thus other technologies such as water electrolyzers may be more effi cient for H 2 production. Typical energy effi ciencies for commercial water electrolyzers are in the 56−73% range, with alkaline electrolyzers running at 110−300 mA/cm 2 and acidic PEM electrolyzers running at 800−1600 mA/cm 2 . [ 2 ] Hori et al. extensively studied the CO 2 reduction reaction on planar Ag electrodes (a thin Ag layer electrodepos-ited on a Cu substrate), and reported Faradaic effi ciencies for CO, H 2 , and HCOO − of 81.5%, 12.4%, and 0.8%, respectively,
heim Adv. Energy Mater. 2013, 3, 589–599
www.MaterialsViews.comwww.advenergymat.de
FULL P
APER
at a current density of 5 mA/cm 2 in 0.1 M KHCO 3 using an H-type glass cell. [ 24 ] Such planar Ag electrodes suffer from low CO 2 concentration at the electrode surface due to the limited CO 2 solubility in aqueous electrolytes. [ 25 ] Yano et al. proposed the use of a Ag mesh as the cathode for CO 2 reduction in a modifi ed H cell in which gaseous CO 2 was effectively delivered to the electrode-electrolyte interface from a gas chamber. [ 26 ] The Ag mesh allows for the reaction to take place at the three-phase gas/solid/liquid interface, which is expected to reduce CO 2 solubility issues as well as mass-transport limitations in aqueous electrolytes. They reported Faradaic effi ciencies for CO and H 2 of ∼ 90% and ∼ 10%, respectively, at a cathode potential of −2 V vs. Ag/AgCl. Unfortunately, no current density data was provided, so it is unclear to what extent the three-phase gas/solid/liquid interface enhances performance. More recently, Delacourt et al. applied Ag catalyst inks on gas diffusion layers (GDLs) via hand-painting or spraying to generate cathodes with a Ag loading of 8-10 mg/cm 2 in an ion-exchange membrane-based CO 2 electrolysis cell (similar to PEMFC confi guration). [ 27 ] They reported Faradaic effi ciencies for CO and H 2 of 82% and 10%, respectively, when operating the cell at 20 mA/cm 2 , at a cathode potential of -1.55 V vs. SCE (ca. -1.51 V vs. Ag/AgCl). While this last study shows that GDEs have the poten-tial to increase the current density, to date very few efforts have focused on improving cathode performance for CO 2 reduction, let alone studying the effects of catalyst layer deposition meth-odology on performance.
Here, we investigate electrodes for two key reactions, the ORR in acidic low-temperature fuel cells (Figure 1 a) and the CO 2 reduction reaction in CO 2 electrolysis cells (Figure 1 b). The slug-gish kinetics associated with both reactions lead to poor perform-ance in actual systems limiting the competitiveness of both tech-nologies. Developing a better understanding of how the method of deposition impacts catalyst layer structure and performance, and more importantly, quantifying the observed differences in catalyst layer structure in 3D and over a large geometric area, will enable electrode optimization, including improved catalyst utilization, and may provide broadly applicable guidelines for other processes relying on electrocatalytic conversion.
2. Results and Discussion
2.1. Linking Structure with Performance of Fuel Cell Cathodes
2.1.1. Effect of Deposition Method
Combined ex-situ MicroCT imaging and in-situ fuel cell anal-ysis can be used to probe the impact of the catalyst layer struc-ture and distribution to its electrochemical performance. To demonstrate the utility of such investigations, we studied the effects of three catalyst layer deposition methodologies (hand painting, air brushing, and screen printing) on fuel cell cathode performance in an acidic H 2 /O 2 fuel cell (Figure 1 a). Specifi -cally, we studied how the differences in structure of the catalyst layers generated by each technique impact electrode perform-ance. Hand painting using a paint brush is often used because it does not require sophisticated apparatus and procedures, and is an effi cient way to make small batches of electrodes. Hwang
© 2013 WILEY-VCH Verlag GmAdv. Energy Mater. 2013, 3, 589–599
et al. reported that air-brushing by hand results in mostly uni-form catalyst layers provided the catalyst ink is not too concen-trated. [ 18 ] For example, in this work we avoided agglomerate formation in the catalyst layer (which occurs if the concentra-tion is too high) by dispersing 4−7 mg of catalyst in 400 μ L of solvent. Koraishy et al. have shown that automated airbrushing leads to more uniform catalyst layers and better performance by studying the effects of a number of parameters on the perform-ance of direct methanol fuel cell cathodes. [ 13 ] Screen printing can lead to catalyst layers with cracks due to slow evaporation rate of solvent from the catalyst ink slurry, [ 18 ] but it is still used for commercial fabrication of electrodes due to good electrode reproducibility. [ 28 ] All of these prior studies used only SEM to characterize the catalyst layer structure for the different deposi-tion methods. Here we will employ MicroCT in combination with SEM to visualize the structure of catalyst layers in 3D and over multiple length scales, ranging from several nanometers to the millimeter scale. To date, such information has typically been obtained by analyzing the sample with SEM after sequen-tial ion milling procedures (i.e., focused ion-beam-scanning electron microscopy, FIB-SEM), [ 29–34 ] or more recently by the use of NanoCT, [ 30 , 35 ] which in some cases is combined with TEM. [ 36 ] Unfortunately, the utility of FIB-SEM is limited to small fi elds of view, 10 μ m × 10 μ m at most, and inherently involves destruction of the sample. The utility of NanoCT is limited to evaluating sub-millimeter size samples, so for the applications studied here a small section needs to be cut out of an electrode, which is non-trivial with respect to avoiding sample damage.
Here we prepared electrodes via automated airbrushing (Figure S1) and hand painting. The Experimental Section describes both methods in more detail. For comparison, com-mercial screen-printed electrodes were also studied. To unam-biguously compare the performance of these three catalyst layers generated by different deposition methods, these two in-house prepared electrodes and commercial screen-printed elec-trode consisted of identical catalyst loadings (1.0 mg Pt/C/cm 2 with 50 wt% Pt so 0.5 mg Pt/cm 2 ) on the same GDL material (ELAT carbon cloth). We ensured the catalyst loading of each electrode generated by different catalyst deposition methods were identical so any changes in the ECSA can only be attrib-uted to differences in catalyst layer deposition methods. More-over, we chose the catalyst loading of 0.5 mg Pt/cm 2 to be con-sistent with the state-of-the-art cathode catalyst loading (0.4 mg Pt/cm 2 ) [ 1 , 22 ] and, hopefully, to provide insights, using realistic loadings, on how optimizing catalyst layer structure can help achieve DOE 2017 targets (i.e., 4-fold further reduction in Pt loading) for large-scale automotive applications without sacri-fi cing performance or durability. [ 23 ] The same anode that was prepared via air brushing with a loading of 1.0 mg Pt/C/cm 2 (50 wt% Pt) was used for all experiments.
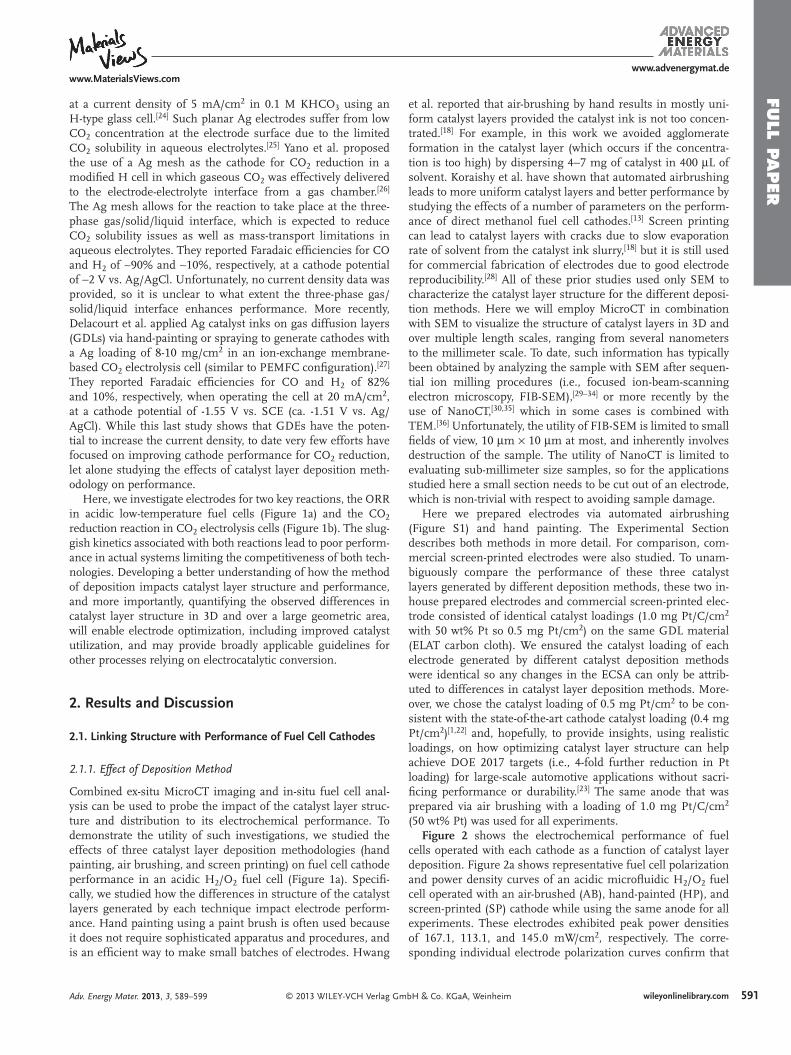
Figure 2 shows the electrochemical performance of fuel cells operated with each cathode as a function of catalyst layer deposition. Figure 2 a shows representative fuel cell polarization and power density curves of an acidic microfl uidic H 2 /O 2 fuel cell operated with an air-brushed (AB), hand-painted (HP), and screen-printed (SP) cathode while using the same anode for all experiments. These electrodes exhibited peak power densities of 167.1, 113.1, and 145.0 mW/cm 2 , respectively. The corre-sponding individual electrode polarization curves confi rm that
591wileyonlinelibrary.combH & Co. KGaA, Weinheim
www.MaterialsViews.comwww.advenergymat.de
FULL
PAPER
Figure 2 . (a) Representative fuel cell polarization and power density curves and (b) corresponding individual electrode polarization curves, of air-brushed, screen-printed, and hand-painted cathodes with the same catalyst loading of 1.0 mg Pt/C/cm 2 (50 wt% Pt). The same anode, pre-pared by the air-brushing deposition method with the catalyst loading of 1.0 mg Pt/C/cm 2 (50 wt% Pt), was used for all experiments. Reactant streams: 10 sccm H 2 /O 2 ; electrolyte: 1.0 M HClO 4 fl owing at 0.6 mL/min; data collected at room temperature.
Air-brushed Screen-printed Hand-painted
0 200 400 600 800
-0.2
0.0
0.2
0.4
0.6
0.8
Cathode
Po
ten
tial
(V
) vs
. Ag
/Ag
Cl
Current Density (mA/cm2)
Anode
(a)
(b)
0 200 400 600 800
Current Density (mA/cm2)
Cathode
0
40
80
120
160
200
240
Po
wer
Den
sity
(m
W/c
m2 )
0.0
0.2
0.4
0.6
0.8
1.0
1.2
1.4
Air-brushed Screen-printed Hand-painted
Cel
l Po
ten
tial
(V
)
these differences in overall fuel cell performance indeed can be attributed to differences in cathode performance (Figure 2 b). Furthermore, these cathode polarization curves show that the shifts in performance can be attributed to differences in kinetic losses (AB < SP < HP) and ohmic losses (AB ≈ SP < HP). Note that the larger than expected anode polarization is due to ohmic losses related to the relatively large electrolyte thickness (0.15 cm) in the microfl uidic platform as compared to Nafi on-based PEMFCs (e.g., ca. 50 μ m for Nafi on 212). While the increase cell resistance can reduce power performance, it does not hinder our ability to perform comparative analyses on the different cathodes.
Figure 3 shows the structural characterization of each cathode as a function of catalyst layer deposition method. After conversion of the raw MicroCT data into 2D radiographic cross-sectional image stacks and 3D tomographic virtual models of the GDE, detailed information regarding layer thickness, internal architecture, and material distribution is obtained for
592 wileyonlinelibrary.com © 2013 WILEY-VCH Verlag Gm
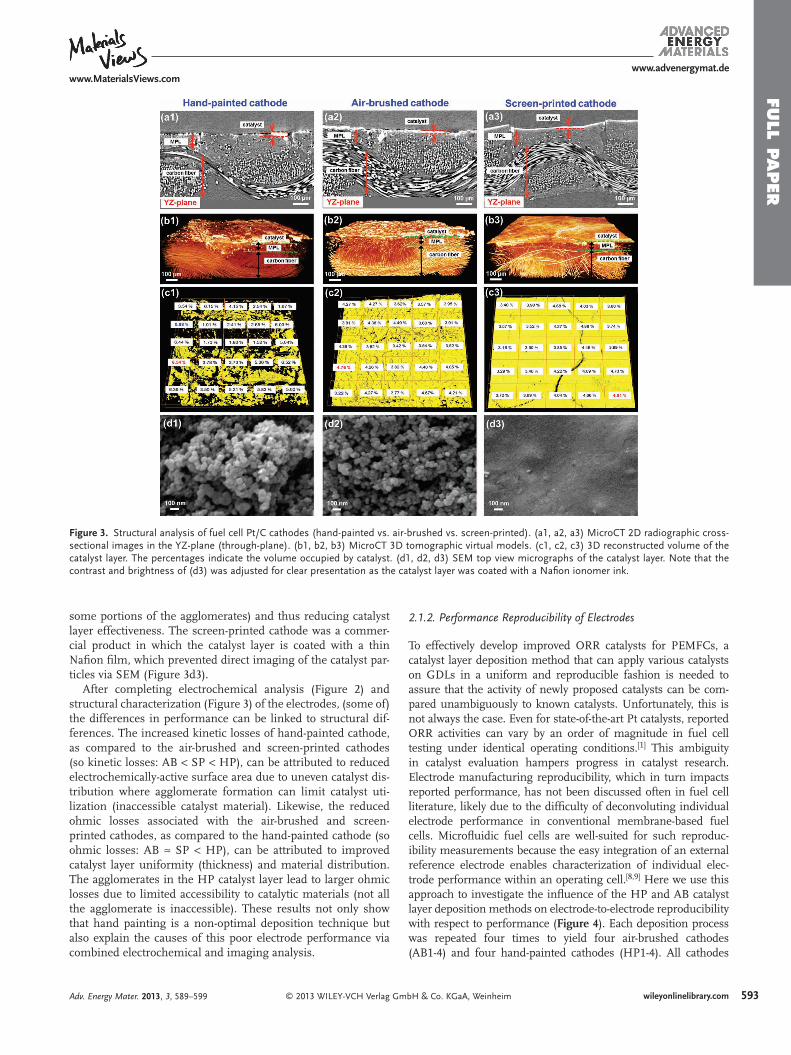
each of the three cathodes. In particular, Figure 3 a1–a3 show through-plane (YZ-plane) 2D radiographic images of the three GDEs with different catalyst layers. In these images, the cata-lyst layer, the microporous layer (MPL), and the macroporous carbon fi ber layer can be distinguished. We observed that the catalyst layer thickness of the HP cathode varies signifi cantly (8 ± 6 μ m excluding cracks in the MPL, but 23 to 49 μ m thick in areas with cracks), compared to the AB (8 ± 2 μ m) and SP cathodes (7 ± 2 μ m). Only the HP cathode shows catalyst dis-tribution in the cracks from the MPL, which is probably due to high liquid content of the catalyst ink when it is deposited via paintbrush, allowing the catalyst particles to seep into cracks. The thickness measurements were performed using a modifi ed version of a previously-reported protocol, [ 37 ] which is described in the Experimental section. In addition, the 3D tomographic GDE virtual models (Figure 3 b1–b3) visualizes the internal architecture and organization in false color, and indicates that the uniformity of catalyst distribution and layer smoothness critically determine electrode performance. Our another pre-viously-reported segmentation (i.e., fi lament tracing method) and analytical methodologies were used to post-process the 2D radiographic cross-sectional images to extract critical structural parameters. [ 7 ] We quantifi ed the uniformity of catalyst distribu-tion (Figure 3 c1–c3) to better understand the extent to which changes in catalyst microstructure correlates to changes in electrochemical performance. Figure 3 c1–c3 show that the HP cathode in particular has a non-uniform catalyst distribution, resulting in reduced performance in comparison with the AB and SP cathodes. Each of the catalyst layers was segmented into 25 normalized volume elements (each 182 μ m × 193 μ m × 60 μ m). The percentage provided in each volume element in Figure 3 c1–c3 indicates the catalyst fraction of the total amount of catalyst, information that is obtained by analysis of the 3D tomographic virtual model. The catalyst distribution of the HP, AB, and SP cathodes ranges from 0.88 to 6.54% ( σ = 1.94%), from 3.22 to 4.76% ( σ = 0.41%), and from 3.19 to 4.91% ( σ = 0.53%), respectively. Clearly the catalyst distribution is more uniform (smaller standard deviations) in the AB and SP cathodes than in the HP cathode.
We also studied the extent of catalyst agglomeration using SEM imaging. The presence of agglomerates is much more profound in the HP catalyst layer than the AB catalyst layer (Figure 3 d1–d2), so the AB catalyst layer likely has a larger electrochemically-active surface area (ECSA) than the HP catalyst layer. This hypothesis is verifi ed by the ECSA measurements, as described in more detail in the Supporting Information. The ECSA of the HP, AB, and SP cathodes are 9, 16, and 10 m 2 /g Pt respectively, which is in agreement with the previously-reported values. [ 1 ] We ensured the catalyst loading of each electrode generated by different catalyst deposition methods were identical so any changes in the ECSA can only be attributed to differences in catalyst layer deposition methods. This likely happens because the agglomerates are trapped and grow in the paintbrush bris-tles and when enough pressure is applied or the paintbrush is wet enough these agglomerates are deposited as solid chunks with limited accessibility in the HP catalyst layer. In addition to reducing ECSA (due to inaccessible catalyst material) and thus catalyst utilization, the agglomerates also results in larger ohmic or mass transport losses (due to limited accessibility to
bH & Co. KGaA, Weinheim Adv. Energy Mater. 2013, 3, 589–599
www.MaterialsViews.comwww.advenergymat.de
FULL P
APER
Figure 3 . Structural analysis of fuel cell Pt/C cathodes (hand-painted vs. air-brushed vs. screen-printed). (a1, a2, a3) MicroCT 2D radiographic cross-sectional images in the YZ-plane (through-plane). (b1, b2, b3) MicroCT 3D tomographic virtual models. (c1, c2, c3) 3D reconstructed volume of the catalyst layer. The percentages indicate the volume occupied by catalyst. (d1, d2, d3) SEM top view micrographs of the catalyst layer. Note that the contrast and brightness of (d3) was adjusted for clear presentation as the catalyst layer was coated with a Nafi on ionomer ink.
some portions of the agglomerates) and thus reducing catalyst layer effectiveness. The screen-printed cathode was a commer-cial product in which the catalyst layer is coated with a thin Nafi on fi lm, which prevented direct imaging of the catalyst par-ticles via SEM (Figure 3 d3).
After completing electrochemical analysis (Figure 2 ) and structural characterization (Figure 3 ) of the electrodes, (some of) the differences in performance can be linked to structural dif-ferences. The increased kinetic losses of hand-painted cathode, as compared to the air-brushed and screen-printed cathodes (so kinetic losses: AB < SP < HP), can be attributed to reduced electrochemically-active surface area due to uneven catalyst dis-tribution where agglomerate formation can limit catalyst uti-lization (inaccessible catalyst material). Likewise, the reduced ohmic losses associated with the air-brushed and screen-printed cathodes, as compared to the hand-painted cathode (so ohmic losses: AB ≈ SP < HP), can be attributed to improved catalyst layer uniformity (thickness) and material distribution. The agglomerates in the HP catalyst layer lead to larger ohmic losses due to limited accessibility to catalytic materials (not all the agglomerate is inaccessible). These results not only show that hand painting is a non-optimal deposition technique but also explain the causes of this poor electrode performance via combined electrochemical and imaging analysis.
© 2013 WILEY-VCH Verlag Adv. Energy Mater. 2013, 3, 589–599
2.1.2. Performance Reproducibility of Electrodes
To effectively develop improved ORR catalysts for PEMFCs, a catalyst layer deposition method that can apply various catalysts on GDLs in a uniform and reproducible fashion is needed to assure that the activity of newly proposed catalysts can be com-pared unambiguously to known catalysts. Unfortunately, this is not always the case. Even for state-of-the-art Pt catalysts, reported ORR activities can vary by an order of magnitude in fuel cell testing under identical operating conditions. [ 1 ] This ambiguity in catalyst evaluation hampers progress in catalyst research. Electrode manufacturing reproducibility, which in turn impacts reported performance, has not been discussed often in fuel cell literature, likely due to the diffi culty of deconvoluting individual electrode performance in conventional membrane-based fuel cells. Microfl uidic fuel cells are well-suited for such reproduc-ibility measurements because the easy integration of an external reference electrode enables characterization of individual elec-trode performance within an operating cell. [ 8 , 9 ] Here we use this approach to investigate the infl uence of the HP and AB catalyst layer deposition methods on electrode-to-electrode reproducibility with respect to performance ( Figure 4 ). Each deposition process was repeated four times to yield four air-brushed cathodes (AB1-4) and four hand-painted cathodes (HP1-4). All cathodes
593wileyonlinelibrary.comGmbH & Co. KGaA, Weinheim
www.MaterialsViews.comwww.advenergymat.de
FULL
PAPER
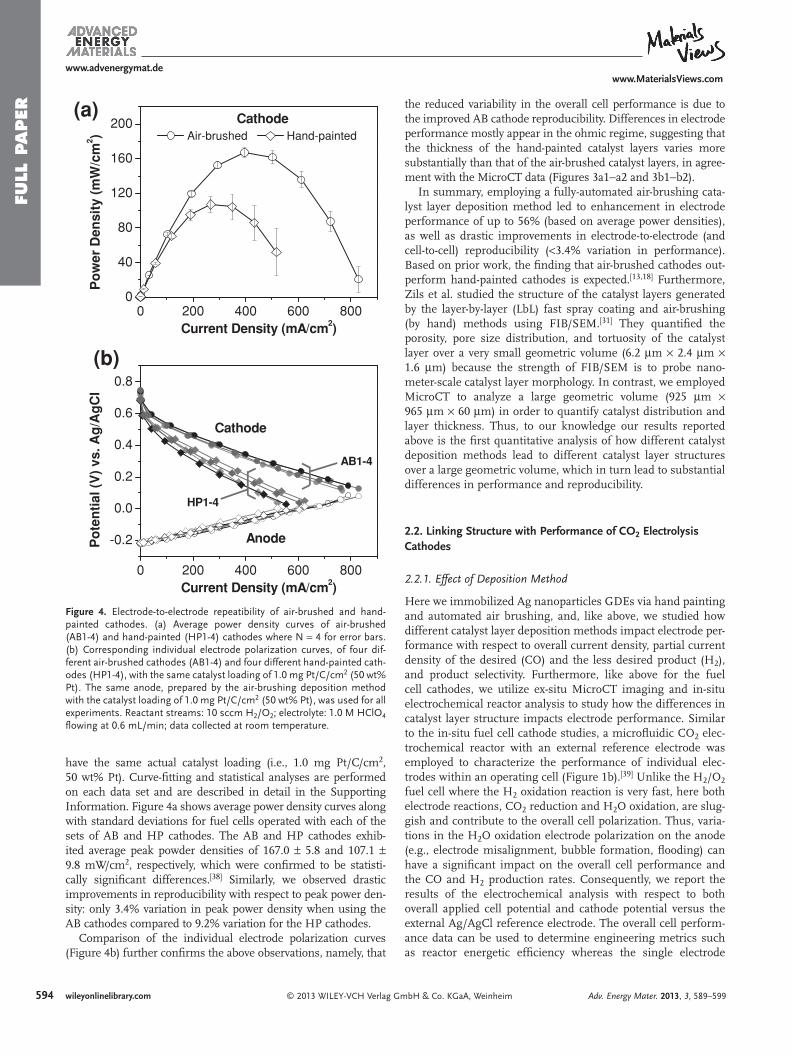
Figure 4 . Electrode-to-electrode repeatibility of air-brushed and hand-painted cathodes. (a) Average power density curves of air-brushed (AB1-4) and hand-painted (HP1-4) cathodes where N = 4 for error bars. (b) Corresponding individual electrode polarization curves, of four dif-ferent air-brushed cathodes (AB1-4) and four different hand-painted cath-odes (HP1-4), with the same catalyst loading of 1.0 mg Pt/C/cm 2 (50 wt% Pt). The same anode, prepared by the air-brushing deposition method with the catalyst loading of 1.0 mg Pt/C/cm 2 (50 wt% Pt), was used for all experiments. Reactant streams: 10 sccm H 2 /O 2 ; electrolyte: 1.0 M HClO 4 fl owing at 0.6 mL/min; data collected at room temperature.
0 200 400 600 800
-0.2
0.0
0.2
0.4
0.6
0.8
AB1-4
Cathode
Po
ten
tial
(V
) vs
. Ag
/Ag
Cl
Current Density (mA/cm2)
Anode
HP1-4
(a)
(b)
Air-brushed Hand-painted
0 200 400 600 8000
40
80
120
160
200 Cathode
Po
wer
Den
sity
(m
W/c
m2 )
Current Density (mA/cm2)
have the same actual catalyst loading (i.e., 1.0 mg Pt/C/cm 2 , 50 wt% Pt). Curve-fi tting and statistical analyses are performed on each data set and are described in detail in the Supporting Information. Figure 4 a shows average power density curves along with standard deviations for fuel cells operated with each of the sets of AB and HP cathodes. The AB and HP cathodes exhib-ited average peak powder densities of 167.0 ± 5.8 and 107.1 ± 9.8 mW/cm 2 , respectively, which were confi rmed to be statisti-cally signifi cant differences. [ 38 ] Similarly, we observed drastic improvements in reproducibility with respect to peak power den-sity: only 3.4% variation in peak power density when using the AB cathodes compared to 9.2% variation for the HP cathodes.
Comparison of the individual electrode polarization curves (Figure 4 b) further confi rms the above observations, namely, that
594 wileyonlinelibrary.com © 2013 WILEY-VCH Verlag Gm
the reduced variability in the overall cell performance is due to the improved AB cathode reproducibility. Differences in electrode performance mostly appear in the ohmic regime, suggesting that the thickness of the hand-painted catalyst layers varies more substantially than that of the air-brushed catalyst layers, in agree-ment with the MicroCT data (Figures 3 a1−a2 and 3 b1−b2).
In summary, employing a fully-automated air-brushing cata-lyst layer deposition method led to enhancement in electrode performance of up to 56% (based on average power densities), as well as drastic improvements in electrode-to-electrode (and cell-to-cell) reproducibility ( < 3.4% variation in performance). Based on prior work, the fi nding that air-brushed cathodes out-perform hand-painted cathodes is expected. [ 13 , 18 ] Furthermore, Zils et al. studied the structure of the catalyst layers generated by the layer-by-layer (LbL) fast spray coating and air-brushing (by hand) methods using FIB/SEM. [ 31 ] They quantifi ed the porosity, pore size distribution, and tortuosity of the catalyst layer over a very small geometric volume (6.2 μ m × 2.4 μ m × 1.6 μ m) because the strength of FIB/SEM is to probe nano-meter-scale catalyst layer morphology. In contrast, we employed MicroCT to analyze a large geometric volume (925 μ m × 965 μ m × 60 μ m) in order to quantify catalyst distribution and layer thickness. Thus, to our knowledge our results reported above is the fi rst quantitative analysis of how different catalyst deposition methods lead to different catalyst layer structures over a large geometric volume, which in turn lead to substantial differences in performance and reproducibility.
2.2. Linking Structure with Performance of CO 2 Electrolysis Cathodes
2.2.1. Effect of Deposition Method
Here we immobilized Ag nanoparticles GDEs via hand painting and automated air brushing, and, like above, we studied how different catalyst layer deposition methods impact electrode per-formance with respect to overall current density, partial current density of the desired (CO) and the less desired product (H 2 ), and product selectivity. Furthermore, like above for the fuel cell cathodes, we utilize ex-situ MicroCT imaging and in-situ electrochemical reactor analysis to study how the differences in catalyst layer structure impacts electrode performance. Similar to the in-situ fuel cell cathode studies, a microfl uidic CO 2 elec-trochemical reactor with an external reference electrode was employed to characterize the performance of individual elec-trodes within an operating cell (Figure 1 b). [ 39 ] Unlike the H 2 /O 2 fuel cell where the H 2 oxidation reaction is very fast, here both electrode reactions, CO 2 reduction and H 2 O oxidation, are slug-gish and contribute to the overall cell polarization. Thus, varia-tions in the H 2 O oxidation electrode polarization on the anode (e.g., electrode misalignment, bubble formation, fl ooding) can have a signifi cant impact on the overall cell performance and the CO and H 2 production rates. Consequently, we report the results of the electrochemical analysis with respect to both overall applied cell potential and cathode potential versus the external Ag/AgCl reference electrode. The overall cell perform-ance data can be used to determine engineering metrics such as reactor energetic effi ciency whereas the single electrode
bH & Co. KGaA, Weinheim Adv. Energy Mater. 2013, 3, 589–599
www.MaterialsViews.comwww.advenergymat.de
FULL P
APER
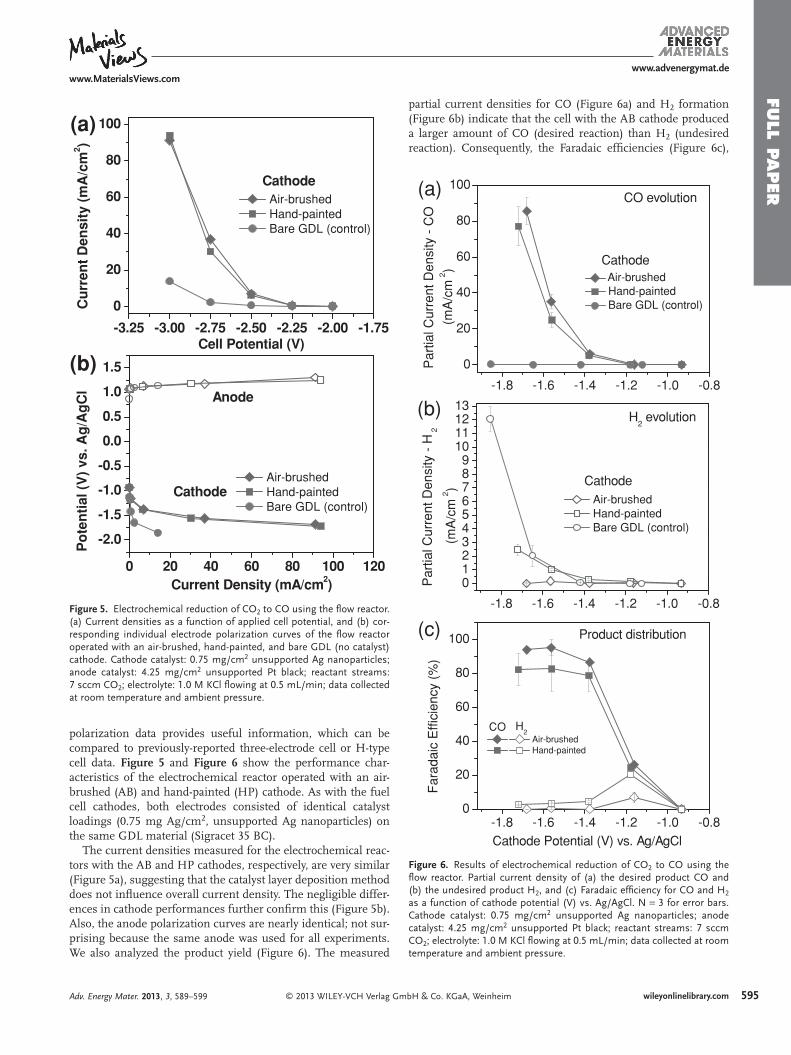
Figure 5 . Electrochemical reduction of CO 2 to CO using the fl ow reactor. (a) Current densities as a function of applied cell potential, and (b) cor-responding individual electrode polarization curves of the fl ow reactor operated with an air-brushed, hand-painted, and bare GDL (no catalyst) cathode. Cathode catalyst: 0.75 mg/cm 2 unsupported Ag nanoparticles; anode catalyst: 4.25 mg/cm 2 unsupported Pt black; reactant streams: 7 sccm CO 2 ; electrolyte: 1.0 M KCl fl owing at 0.5 mL/min; data collected at room temperature and ambient pressure.
Air-brushed Hand-painted Bare GDL (control)
-3.25 -3.00 -2.75 -2.50 -2.25 -2.00 -1.75
0
20
40
60
80
100
Cu
rren
t D
ensi
ty (
mA
/cm
2 )
Cell Potential (V)
Cathode
Air-brushed Hand-painted Bare GDL (control)
0 20 40 60 80 100 120
-2.0
-1.5
-1.0
-0.5
0.0
0.5
1.0
1.5
Cathode
Po
ten
tial
(V
) vs
. Ag
/Ag
Cl
Current Density (mA/cm2)
Anode
(a)
(b)
Figure 6 . Results of electrochemical reduction of CO 2 to CO using the fl ow reactor. Partial current density of (a) the desired product CO and (b) the undesired product H 2 , and (c) Faradaic effi ciency for CO and H 2 as a function of cathode potential (V) vs. Ag/AgCl. N = 3 for error bars. Cathode catalyst: 0.75 mg/cm 2 unsupported Ag nanoparticles; anode catalyst: 4.25 mg/cm 2 unsupported Pt black; reactant streams: 7 sccm CO 2 ; electrolyte: 1.0 M KCl fl owing at 0.5 mL/min; data collected at room temperature and ambient pressure.
Air-brushed Hand-painted
-1.8 -1.6 -1.4 -1.2 -1.0 -0.80
20
40
60
80
100
H2
Product distribution
Far
adai
c E
ffici
ency
(%
)
Cathode Potential (V) vs. Ag/AgCl
CO
Air-brushed Hand-painted Bare GDL (control)
-1.8 -1.6 -1.4 -1.2 -1.0 -0.8
0123456789
10111213
Cathode
Par
tial C
urre
nt D
ensi
ty -
H2
(mA
/cm
2 )
H2 evolution
-1.8 -1.6 -1.4 -1.2 -1.0 -0.8
0
20
40
60
80
100
Air-brushed Hand-painted Bare GDL (control)
Par
tial C
urre
nt D
ensi
ty -
CO
(mA
/cm
2 )
CO evolution
Cathode
(a)
(b)
(c)
polarization data provides useful information, which can be compared to previously-reported three-electrode cell or H-type cell data. Figure 5 and Figure 6 show the performance char-acteristics of the electrochemical reactor operated with an air-brushed (AB) and hand-painted (HP) cathode. As with the fuel cell cathodes, both electrodes consisted of identical catalyst loadings (0.75 mg Ag/cm 2 , unsupported Ag nanoparticles) on the same GDL material (Sigracet 35 BC).
The current densities measured for the electrochemical reac-tors with the AB and HP cathodes, respectively, are very similar (Figure 5 a), suggesting that the catalyst layer deposition method does not infl uence overall current density. The negligible differ-ences in cathode performances further confi rm this (Figure 5 b). Also, the anode polarization curves are nearly identical; not sur-prising because the same anode was used for all experiments. We also analyzed the product yield ( Figure 6 ). The measured
© 2013 WILEY-VCH Verlag Adv. Energy Mater. 2013, 3, 589–599
partial current densities for CO (Figure 6 a) and H 2 formation (Figure 6 b) indicate that the cell with the AB cathode produced a larger amount of CO (desired reaction) than H 2 (undesired reaction). Consequently, the Faradaic effi ciencies (Figure 6 c),
595wileyonlinelibrary.comGmbH & Co. KGaA, Weinheim
www.MaterialsViews.comwww.advenergymat.de
FULL
PAPER
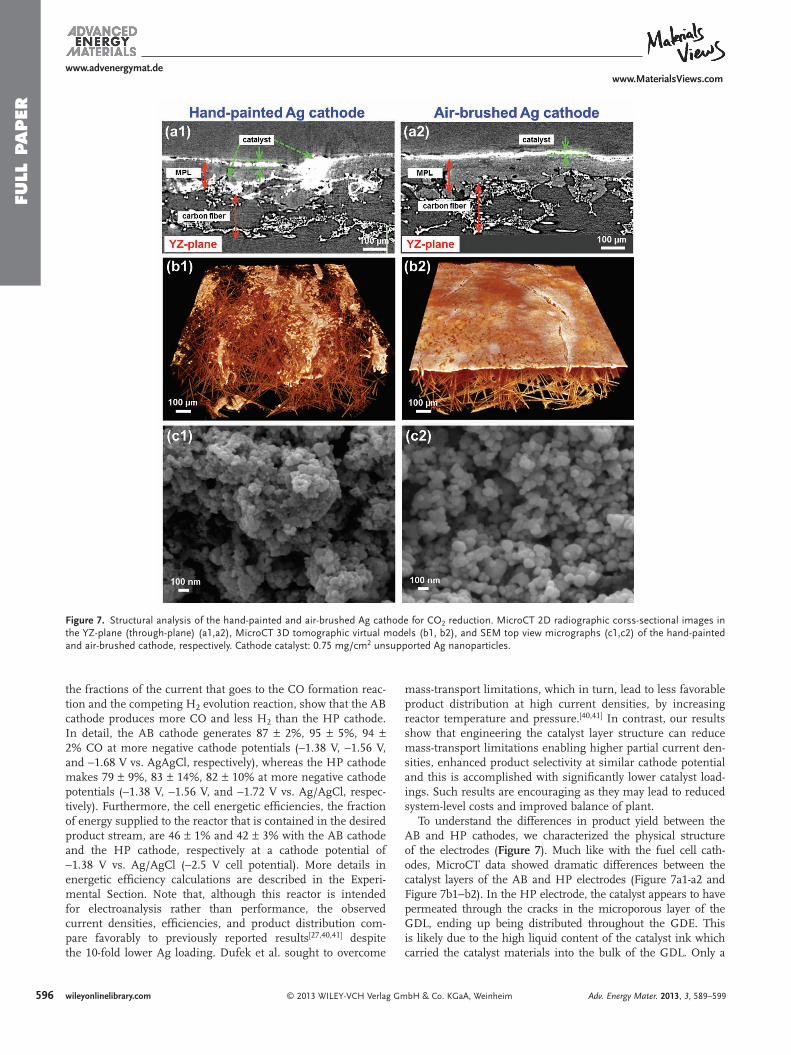
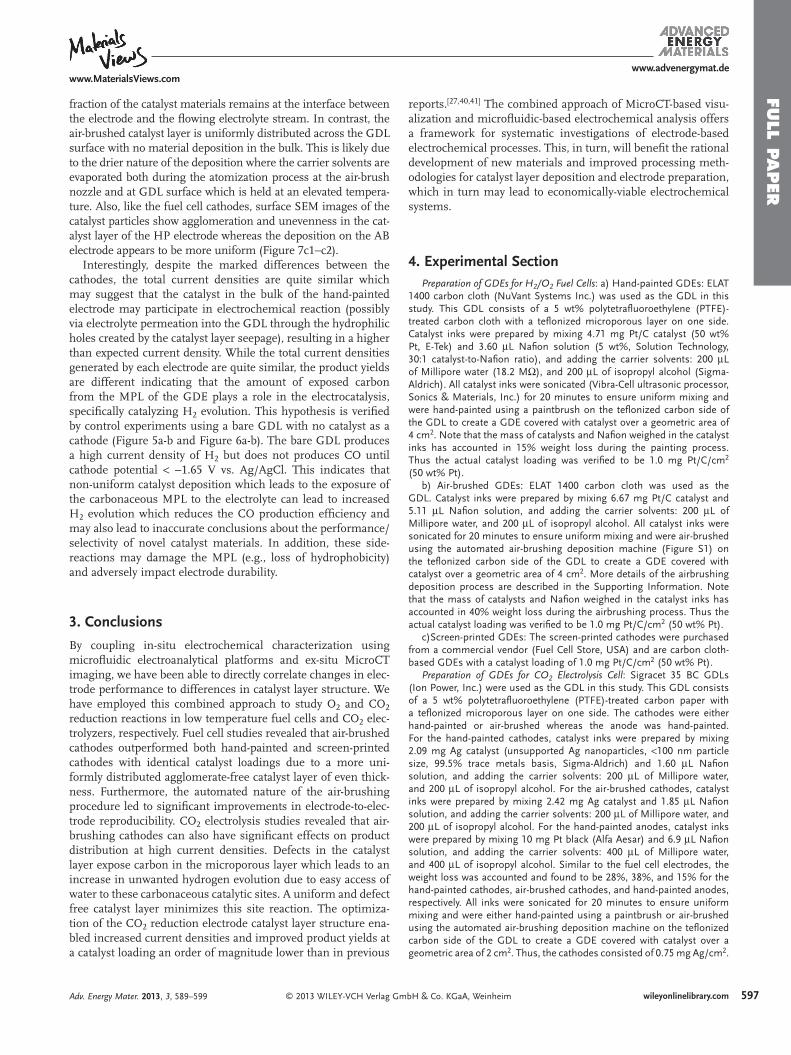
Figure 7 . Structural analysis of the hand-painted and air-brushed Ag cathode for CO 2 reduction. MicroCT 2D radiographic corss-sectional images in the YZ-plane (through-plane) (a1,a2), MicroCT 3D tomographic virtual models (b1, b2), and SEM top view micrographs (c1,c2) of the hand-painted and air-brushed cathode, respectively. Cathode catalyst: 0.75 mg/cm 2 unsupported Ag nanoparticles.
the fractions of the current that goes to the CO formation reac-tion and the competing H 2 evolution reaction, show that the AB cathode produces more CO and less H 2 than the HP cathode. In detail, the AB cathode generates 87 ± 2%, 95 ± 5%, 94 ± 2% CO at more negative cathode potentials (−1.38 V, −1.56 V, and −1.68 V vs. AgAgCl, respectively), whereas the HP cathode makes 79 ± 9%, 83 ± 14%, 82 ± 10% at more negative cathode potentials (−1.38 V, −1.56 V, and −1.72 V vs. Ag/AgCl, respec-tively). Furthermore, the cell energetic effi ciencies, the fraction of energy supplied to the reactor that is contained in the desired product stream, are 46 ± 1% and 42 ± 3% with the AB cathode and the HP cathode, respectively at a cathode potential of −1.38 V vs. Ag/AgCl (−2.5 V cell potential). More details in energetic effi ciency calculations are described in the Experi-mental Section. Note that, although this reactor is intended for electroanalysis rather than performance, the observed current densities, effi ciencies, and product distribution com-pare favorably to previously reported results [ 27 , 40 , 41 ] despite the 10-fold lower Ag loading. Dufek et al. sought to overcome
596 wileyonlinelibrary.com © 2013 WILEY-VCH Verlag Gm
mass-transport limitations, which in turn, lead to less favorable product distribution at high current densities, by increasing reactor temperature and pressure. [ 40 , 41 ] In contrast, our results show that engineering the catalyst layer structure can reduce mass-transport limitations enabling higher partial current den-sities, enhanced product selectivity at similar cathode potential and this is accomplished with signifi cantly lower catalyst load-ings. Such results are encouraging as they may lead to reduced system-level costs and improved balance of plant.
To understand the differences in product yield between the AB and HP cathodes, we characterized the physical structure of the electrodes ( Figure 7 ). Much like with the fuel cell cath-odes, MicroCT data showed dramatic differences between the catalyst layers of the AB and HP electrodes (Figure 7 a1-a2 and Figure 7 b1−b2). In the HP electrode, the catalyst appears to have permeated through the cracks in the microporous layer of the GDL, ending up being distributed throughout the GDE. This is likely due to the high liquid content of the catalyst ink which carried the catalyst materials into the bulk of the GDL. Only a
bH & Co. KGaA, Weinheim Adv. Energy Mater. 2013, 3, 589–599
www.MaterialsViews.comwww.advenergymat.de
FULL P
APER
fraction of the catalyst materials remains at the interface between the electrode and the fl owing electrolyte stream. In contrast, the air-brushed catalyst layer is uniformly distributed across the GDL surface with no material deposition in the bulk. This is likely due to the drier nature of the deposition where the carrier solvents are evaporated both during the atomization process at the air-brush nozzle and at GDL surface which is held at an elevated tempera-ture. Also, like the fuel cell cathodes, surface SEM images of the catalyst particles show agglomeration and unevenness in the cat-alyst layer of the HP electrode whereas the deposition on the AB electrode appears to be more uniform (Figure 7 c1−c2).
Interestingly, despite the marked differences between the cathodes, the total current densities are quite similar which may suggest that the catalyst in the bulk of the hand-painted electrode may participate in electrochemical reaction (possibly via electrolyte permeation into the GDL through the hydrophilic holes created by the catalyst layer seepage), resulting in a higher than expected current density. While the total current densities generated by each electrode are quite similar, the product yields are different indicating that the amount of exposed carbon from the MPL of the GDE plays a role in the electrocatalysis, specifi cally catalyzing H 2 evolution. This hypothesis is verifi ed by control experiments using a bare GDL with no catalyst as a cathode (Figure 5 a-b and Figure 6 a-b). The bare GDL produces a high current density of H 2 but does not produces CO until cathode potential < −1.65 V vs. Ag/AgCl. This indicates that non-uniform catalyst deposition which leads to the exposure of the carbonaceous MPL to the electrolyte can lead to increased H 2 evolution which reduces the CO production effi ciency and may also lead to inaccurate conclusions about the performance/selectivity of novel catalyst materials. In addition, these side-reactions may damage the MPL (e.g., loss of hydrophobicity) and adversely impact electrode durability.
3. Conclusions
By coupling in-situ electrochemical characterization using microfl uidic electroanalytical platforms and ex-situ MicroCT imaging, we have been able to directly correlate changes in elec-trode performance to differences in catalyst layer structure. We have employed this combined approach to study O 2 and CO 2 reduction reactions in low temperature fuel cells and CO 2 elec-trolyzers, respectively. Fuel cell studies revealed that air-brushed cathodes outperformed both hand-painted and screen-printed cathodes with identical catalyst loadings due to a more uni-formly distributed agglomerate-free catalyst layer of even thick-ness. Furthermore, the automated nature of the air-brushing procedure led to signifi cant improvements in electrode-to-elec-trode reproducibility. CO 2 electrolysis studies revealed that air-brushing cathodes can also have signifi cant effects on product distribution at high current densities. Defects in the catalyst layer expose carbon in the microporous layer which leads to an increase in unwanted hydrogen evolution due to easy access of water to these carbonaceous catalytic sites. A uniform and defect free catalyst layer minimizes this site reaction. The optimiza-tion of the CO 2 reduction electrode catalyst layer structure ena-bled increased current densities and improved product yields at a catalyst loading an order of magnitude lower than in previous
© 2013 WILEY-VCH Verlag GmAdv. Energy Mater. 2013, 3, 589–599
reports. [ 27 , 40 , 41 ] The combined approach of MicroCT-based visu-alization and microfl uidic-based electrochemical analysis offers a framework for systematic investigations of electrode-based electrochemical processes. This, in turn, will benefi t the rational development of new materials and improved processing meth-odologies for catalyst layer deposition and electrode preparation, which in turn may lead to economically-viable electrochemical systems.
4. Experimental Section Preparation of GDEs for H 2 /O 2 Fuel Cells : a) Hand-painted GDEs: ELAT
1400 carbon cloth (NuVant Systems Inc.) was used as the GDL in this study. This GDL consists of a 5 wt% polytetrafl uoroethylene (PTFE)-treated carbon cloth with a tefl onized microporous layer on one side. Catalyst inks were prepared by mixing 4.71 mg Pt/C catalyst (50 wt% Pt, E-Tek) and 3.60 μ L Nafi on solution (5 wt%, Solution Technology, 30:1 catalyst-to-Nafi on ratio), and adding the carrier solvents: 200 μ L of Millipore water (18.2 M Ω ), and 200 μ L of isopropyl alcohol (Sigma-Aldrich). All catalyst inks were sonicated (Vibra-Cell ultrasonic processor, Sonics & Materials, Inc.) for 20 minutes to ensure uniform mixing and were hand-painted using a paintbrush on the tefl onized carbon side of the GDL to create a GDE covered with catalyst over a geometric area of 4 cm 2 . Note that the mass of catalysts and Nafi on weighed in the catalyst inks has accounted in 15% weight loss during the painting process. Thus the actual catalyst loading was verifi ed to be 1.0 mg Pt/C/cm 2 (50 wt% Pt).
b) Air-brushed GDEs: ELAT 1400 carbon cloth was used as the GDL. Catalyst inks were prepared by mixing 6.67 mg Pt/C catalyst and 5.11 μ L Nafi on solution, and adding the carrier solvents: 200 μ L of Millipore water, and 200 μ L of isopropyl alcohol. All catalyst inks were sonicated for 20 minutes to ensure uniform mixing and were air-brushed using the automated air-brushing deposition machine (Figure S1) on the tefl onized carbon side of the GDL to create a GDE covered with catalyst over a geometric area of 4 cm 2 . More details of the airbrushing deposition process are described in the Supporting Information. Note that the mass of catalysts and Nafi on weighed in the catalyst inks has accounted in 40% weight loss during the airbrushing process. Thus the actual catalyst loading was verifi ed to be 1.0 mg Pt/C/cm 2 (50 wt% Pt).
c)Screen-printed GDEs: The screen-printed cathodes were purchased from a commercial vendor (Fuel Cell Store, USA) and are carbon cloth-based GDEs with a catalyst loading of 1.0 mg Pt/C/cm 2 (50 wt% Pt).
Preparation of GDEs for CO 2 Electrolysis Cell : Sigracet 35 BC GDLs (Ion Power, Inc.) were used as the GDL in this study. This GDL consists of a 5 wt% polytetrafl uoroethylene (PTFE)-treated carbon paper with a tefl onized microporous layer on one side. The cathodes were either hand-painted or air-brushed whereas the anode was hand-painted. For the hand-painted cathodes, catalyst inks were prepared by mixing 2.09 mg Ag catalyst (unsupported Ag nanoparticles, < 100 nm particle size, 99.5% trace metals basis, Sigma-Aldrich) and 1.60 μ L Nafi on solution, and adding the carrier solvents: 200 μ L of Millipore water, and 200 μ L of isopropyl alcohol. For the air-brushed cathodes, catalyst inks were prepared by mixing 2.42 mg Ag catalyst and 1.85 μ L Nafi on solution, and adding the carrier solvents: 200 μ L of Millipore water, and 200 μ L of isopropyl alcohol. For the hand-painted anodes, catalyst inks were prepared by mixing 10 mg Pt black (Alfa Aesar) and 6.9 μ L Nafi on solution, and adding the carrier solvents: 400 μ L of Millipore water, and 400 μ L of isopropyl alcohol. Similar to the fuel cell electrodes, the weight loss was accounted and found to be 28%, 38%, and 15% for the hand-painted cathodes, air-brushed cathodes, and hand-painted anodes, respectively. All inks were sonicated for 20 minutes to ensure uniform mixing and were either hand-painted using a paintbrush or air-brushed using the automated air-brushing deposition machine on the tefl onized carbon side of the GDL to create a GDE covered with catalyst over a geometric area of 2 cm 2 . Thus, the cathodes consisted of 0.75 mg Ag/cm 2 .
597wileyonlinelibrary.combH & Co. KGaA, Weinheim
59
www.MaterialsViews.comwww.advenergymat.de
FULL
PAPER
The same anode that was used for all measurements consisted of 4.25 mg/cm 2 Pt black.
Cell assembly and Electrochemical Testing : a)H 2 /O 2 fuel cell: The microfl uidic H 2 /O 2 fuel cell was used in this study and has been described previously (Figure 1 a). [ 9 , 37 , 42 ] In short, two GDEs, an anode and a cathode, were placed on opposite sides of a 0.15-cm thick polycarbonate sheet with the 3-cm long and 0.33-cm wide window such that the catalyst layers interfaced with the fl owing liquid electrolyte. The geometric surface area used to calculate current and power density is 1 cm 2 . Two graphite current collectors with access windows and two precision-machined polycarbonate gas fl ow chambers were placed outside the GDEs. The multilayer assembly was held together using binder clips. Fuel cell experiments were conducted using a potentiostat (Autolab PGSTAT-302N, EcoChemie) at room temperature and ambient pressure. H 2 and O 2 gas (laboratory grade, S.J. Smith) are each fed at a fl ow rate of 10 sccm. Electrolyte fl ow rate was 0.6 mL/min controlled by a syringe pump (2200 PHD, Harvard Apparatus). 1.0 M perchloric acid (HClO 4 , Sigma-Aldrich, 99.999%) in Millipore water was used as aqueous electrolyte. After exiting the fuel cell, the electrolyte stream travels through a plastic tube and into a collection beaker which contains a reference electrode (Ag/AgCl in saturated NaCl, BaSi). The tubing serves to ionically connect the reference electrode to the anode and the cathode. No ohmic losses are observed along the length of the tubing. Multimeters, in voltmeter mode, are connected to the reference electrode and each individual electrode to enable single electrode polarization measurements.
b) CO 2 electrolysis cell: In short, two catalyst-coated GDEs, an anode and a cathode, were placed on opposite sides of a 0.15-cm thick poly(methyl methacrylate) (PMMA) sheet with 0.5-cm wide by 2.0-cm long channel such that the catalyst layer interfaced with the fl owing liquid electrolyte. The geometric surface area used to calculate current density is 1 cm 2 . Two aluminum current collectors with access windows were placed outside the two GDEs. On the cathode side an aluminum gas fl ow chamber supplied CO 2 while the anode was open to the atmosphere for O 2 to escape. The assembly was held together with 4 bolts with Tefl on washers to maintain electric isolation between electrodes. CO 2 electrolysis experiments were conducted using a potentiostat at room temperature and ambient pressure. CO2 gas (S.J. Smith, 100%) was fed at a rate of 7 sccm. Electrolyte fl ow rate was 0.5 mL/min controlled by a syringe pump. 1.0 M potassium chloride (KCl, Sigma-Aldirch, ≥ 99.0% pure) in Millipore water was used as aqueous electrolyte. Electrolysis cell polarization curves were obtained by steady-state chronoamperometric measurements at which time gaseous products, as well as unreacted CO 2 , were collected and injected into a gas chromatograph (Trace GC, ThermoFisher Scientifi c) equipped with a thermal conductivity detector for quantitative determination of product composition. As with the fuel cell confi guration, individual anode and cathode polarization curves were independently measured using an external Ag/AgCl reference electrode which was ionically connected to the electrolyzer.
The Faradaic effi ciency ( FE k ) of a gaseous product k was calculated using the following equation:
FE k = nk F x k Fm
I
Where n k is the number of electrons exchanged ( n k = 2 for reduction of CO 2 to CO), F the Faraday’s constant ( F = 96485 C/mol), x k the mole fraction of the gaseous product k in the gaseous mixture (also equal to the volume fraction if gases are assumed to be ideal), F m the molar fl ow rate (mol/s), and I the total current (A). Specifi cally, we calculated x k and F m using the following equations:
xk =
Fv, C O
Fv, C O + Fv, C O2=
Fv, C O / Fv, C O2
1 + Fv, C O / Fv, C O2
Fm = pFv
RT
Where F v,CO and Fv,C O2 are the volumetric fl ow rates (cm 3 /s) of CO and CO 2 , respectively. P is the atmospheric pressure ( P = 1 atm), R the gas constant ( R = 82.06 cm 3 atm K − 1 mol − 1 ), and T the temperature ( T = 293 K).
8 wileyonlinelibrary.com © 2013 WILEY-VCH Verlag G
The energetic effi ciency ( EE k ) for the gaseous product k was calculated using the following equation:
EEk (%) = E o
Vcel l× F E k (%)
Where E o is the equilibrium cell potential ( E o = E o cathode – E o anode = −0.10 V − 1.23 V = −1.33 V for CO 2 reduction to CO and E o = E o cathode − E o anode = 0 V − 1.23 V = −1.23 V for H 2 evolution), V cell is the applied cell potential, and FE k is the Faradaic effi ciency of the gaseous produck k . The overall cell energetic effi ciency is the sum of the energetic effi ciencies for CO and H 2 .
MicroCT Imaging of GDEs : a) Acquisition and Reconstruction of MicroCT Data: We used the same acquisition and reconstruction procedures reported in our prior work. [ 7 ] In short, the whole GDE was clamped in a rotating sample holder and a corner was exposed to the X-ray beam fi eld. During MicroCT imaging (Micro-XCT 400, Xradia), the sample was scanned using an X-ray source at 40 kV and 200 μ A, and 745 projections were collected as the sample was rotated stepwise over 180º with a 10 second exposure time for each projection. The projection images were then processed to reconstruct 2D radiographic cross-sectional image stacks and 3D tomographic virtual models of the GDE. The initial reconstruction of MicroCT data was conducted using the TXM Reconstructor reconstruction software (Xradia), which accompanies the MicroCT hardware. The distances of the sample to the X-ray source (76 mm) and the X-ray detector (28 mm) resulted in a voxel (volume pixel) size of 1 μ m 3 . The fi eld of view (FOV) was approximately 1000 μ m × 1000 μ m.
b) Segmentation and Analytical Methodologies: The Amira visualization software package (Version 5.3, Visage Imaging) was used to quantitatively analyze the catalyst layer structure. First, the 2D cross-sectional image stack was cropped to a discrete volume that is of analytical interest, here a 910 μ m × 965 μ m × 60 μ m section of the catalyst layer. The analytical volume is selected based on criteria that the analytical volume is the majority of the total image volume of the catalyst layer (925 μ m × 965 μ m × 60 μ m). Second, each 2D grayscale image ( e.g. , Figure 3 a1-a3) is segmented to a 2D binary image to help identify and separate voxels predominantly fi lled with materials from those that are predominantly void. As with our prior work, segmentation was performed using the fi lament tracing method, available in Amira v5.3 visualization software. [ 7 ] After segmentation, a 3D reconstructed volume of these binary images was rendered for subsequent quantitative analysis (Figure 3 b1−b3). We measured the uniformity of catalyst distribution by segmenting each of the catalyst layers into 25 normalized volume elements (each 182 μ m × 193 μ m × 60 μ m). The catalyst fraction of the total amount of catalyst in each volume element was measured and is defi ned as: catalyst fraction = (catalyst vox, local )/(catalyst vox, total ), where catalyst vox, local is the number of catalyst voxels in each volume element and catalyst vox, total is the number of catalyst voxels in the entire analytical volume of the catalyst layer. Catalyst layer thickness measurements were performed using a modifi ed version of a previously reported protocol. [ 37 ] In detail, to determine the average layer thickness (Z-direction) of each sample, the through-plane (YZ-plane) cross-sectional images were analyzed. The thickness (Y-direction) of each of these images is one pixel which corresponds to the image resolution (1 μ m). Each layer thickness measurement was taken across a 2D YZ-plane grid with 8 evenly spaced points. Same procedure was repeated for eight evenly spaced 2D YZ-planes along the X-direction, so thickness measurements were conducted on these 64 data points across each catalyst layer. Cross-sectional SEM imaging via nitrogen-cracking was employed to verify the accuracy of the thickness measurements.
SEM Imaging of GDEs : Morphology of catalyst particles within the catalyst layer of each sample was characterized using SEM (Philips XL30 ESEM-FEG). Images were acquired using an acceleration voltage of 7.5 kV, a spot size of 3.0 nm, and a working distance of 5.0 mm, resulting in a magnifi cation of 100,000.
Supporting Information Supporting Information is available from the Wiley Online Library or from the author.
mbH & Co. KGaA, Weinheim Adv. Energy Mater. 2013, 3, 589–599
www.MaterialsViews.comwww.advenergymat.de
FULL P
APER
Acknowledgements We gratefully acknowledge fi nancial support from the Department of Energy (DE-FG02005ER46260), the Department of Energy through an STTR grant to Dioxide Materials and UIUC (DE-SC0004453), the National Science Foundation (CTS 05-47617), and the International Institute of Carbon Neutral Energy Research (WPI-I2CNER), sponsored by the World Premier International Research Center Initiative (WPI), MEXT, Japan. We also acknowledge Leilei Yin for assistance with MicroCT imaging, Scott Robinson for assistance with SEM imaging, Darren Stevenson for the discussion of post-image processing, all from the Beckman Institute, and Matthew Byrne for discussion of statistical analysis.
Received: September 24, 2012 Revised: October 16, 2012
Published online: February 25, 2013
[ 1 ] H. A. Gasteiger , S. S. Kocha , B. Sompalli , F. T. Wagner , Appl. Catal., B 2005 , 56 , 9 .
[ 2 ] D. T. Whipple , P. J. A. Kenis , J. Phys. Chem. Lett. 2010 , 1 , 3451 . [ 3 ] A. Bazylak , Int. J. Hydrogen Energy 2009 , 34 , 3845 . [ 4 ] J. Becker , R. Fluckiger , M. Reum , F. N. Buchi , F. Marone ,
M. Stampanoni , J. Electrochem. Soc. 2009 , 156 , B 1175 . [ 5 ] J. Hinebaugh , Z. Fishman , A. Bazylak , J. Electrochem. Soc. 2010 , 157 ,
B1651 . [ 6 ] Z. Fishman , J. Hinebaugh , A. Bazylak , J. Electrochem. Soc. 2010 , 157 ,
B1643 . [ 7 ] H. R. Jhong , F. R. Brushett , L. L. Yin , D. M. Stevenson , P. J. A. Kenis ,
J. Electrochem. Soc 2012 , 159 , B292 . [ 8 ] F. R. Brushett , W. P. Zhou , R. S. Jayashree , P. J. A. Kenis , J. Electro-
chem. Soc 2009 , 156 , B565 . [ 9 ] F. R. Brushett , H. T. Duong , J. W. D. Ng , R. L. Behrens ,
A. Wieckowski , P. J. A. Kenis , J. Electrochem. Soc. 2010 , 157 , B837 . [ 10 ] J. H. Cho , J. M. Kim , J. Prabhuram , S. Y. Hwang , D. J. Ahn , H. Y. Ha ,
S. K. Kim , J. Power Sources 2009 , 187 , 378 . [ 11 ] B. Millington , S. F. Du , B. G. Pollet , J. Power Sources 2011 , 196 , 9013 . [ 12 ] Y. G. Yoon , G. G. Park , T. H. Yang , J. N. Han , W. Y. Lee , C. S. Kim ,
Int. J. Hydrogen Energy 2003 , 28 , 657 . [ 13 ] B. M. Koraishy , J. P. Meyers , K. L. Wood , J. Electrochem. Soc. 2011 ,
158 , B1459 . [ 14 ] T. Frey , M. Linardi , Electrochim. Acta 2004 , 50 , 99 . [ 15 ] A. Wolz , S. Zils , M. Michel , C. Roth , J. Power Sources 2010 , 195 ,
8162 . [ 16 ] B. Millington , V. Whipple , B. G. Pollet , J. Power Sources 2011 , 196 ,
8500 . [ 17 ] H. J. Choi , J. Kim , Y. Kwon , J. Han , J. Power Sources 2010 , 195 , 160 . [ 18 ] D. S. Hwang , C. H. Park , S. C. Yi , Y. M. Lee , Int. J. Hydrogen Energy
2011 , 36 , 9876 .
© 2013 WILEY-VCH Verlag GmAdv. Energy Mater. 2013, 3, 589–599
[ 19 ] H. S. Kim , N. P. Subramanian , B. N. Popov , J. Power Sources 2004 , 138 , 14 .
[ 20 ] R. O’Hayre , S. J. Lee , S. W. Cha , F. B. Prinz , J. Power Sources 2002 , 109 , 483 .
[ 21 ] M. S. Saha , A. F. Gulla , R. J. Allen , S. Mukerjee , Electrochim. Acta 2006 , 51 , 4680 .
[ 22 ] F. T. Wagner , B. Lakshmanan , M. F. Mathias , J. Phys. Chem. Lett. 2010 , 1 , 2204 .
[ 23 ] M. K. Debe , Nature 2012 , 486 , 43 . [ 24 ] Y. Hori , H. Wakebe , T. Tsukamoto , O. Koga , Electrochim. Acta 1994 ,
39 , 1833 . [ 25 ] A. Yasunishi , F. Yoshida , J. Chem. Eng. Data 1979 , 24 , 11 . [ 26 ] H. Yano , F. Shirai , M. Nakayama , K. Ogura , J. Electroanal. Chem.
2002 , 533 , 113 . [ 27 ] C. Delacourt , P. L. Ridgway , J. B. Kerr , J. Newman , J. Electrochem.
Soc. 2008 , 155 , B42 . [ 28 ] N. Rajalakshmi , K. S. Dhathathreyan , Chem. Eng. J. 2007 , 129 , 31 . [ 29 ] J. R. Wilson , W. Kobsiriphat , R. Mendoza , H. Y. Chen , J. M. Hiller ,
D. J. Miller , K. Thornton , P. W. Voorhees , S. B. Adler , S. A. Barnett , Nat. Mater. 2006 , 5 , 541 .
[ 30 ] H. Ostadi , P. Rama , Y. Liu , R. Chen , X. X. Zhang , K. Jiang , J. Membrane Sci. 2010 , 351 , 69 .
[ 31 ] S. Zils , M. Timpel , T. Arlt , A. Wolz , I. Manke , C. Roth , Fuel Cells 2010 , 10 , 966 .
[ 32 ] H. Schulenburg , B. Schwanitz , N. Linse , G. G. Scherer , A. Wokaun , J. Krbanjevic , R. Grothausmann , I. Manke , J. Phys. Chem. C 2011 , 115 , 14236 .
[ 33 ] C. Ziegler , S. Thiele , R. Zengerle , J. Power Sources 2011 , 196 , 2094 .
[ 34 ] S. Thiele , R. Zengerle , C. Ziegler , Nano Res. 2011 , 4 , 849 . [ 35 ] H. Ostadi , P. Rama , Y. Liu , R. Chen , X. X. Zhang , K. Jiang , Chem.
Eng. Sci. 2010 , 65 , 2213 . [ 36 ] W. K. Epting , J. Gelb , S. Litster , Adv. Funct. Mater. 2012 , 22 , 555 . [ 37 ] F. R. Brushett , M. S. Naughton , J. W. D. Ng , L. L. Yin , P. J. A. Kenis ,
Int. J. Hydrogen Energy 2012 , 37 , 2559 . [ 38 ] D. C. Montgomery , Design and Analysis of Experiments , John Wiley &
Sons, Inc ., Hoboken NJ, 2005 . [ 39 ] D. T. Whipple , E. C. Finke , P. J. A. Kenis , Electrochemical and Solid
State Letters 2010 , 13 , D109 . [ 40 ] E. J. Dufek , T. E. Lister , M. E. McIlwain , J. Appl. Electrochem. 2011 ,
41 , 623 . [ 41 ] E. J. Dufek , T. E. Lister , M. E. McIlwain , J. Electrochem. Soc. 2011 ,
158 , B1384 . [ 42 ] F. R. Brushett , A. S. Hollinger , L. J. Markoski , P. J. A. Kenis , “Micro-
fl uidic Fuel Cells as Microscale Power Sources and Analytical Plat-forms”, presented at Proceedings of ASME 2009 2 nd Micro/Nanoscale Heat & Mass Transfer International Conference , Shanghai, 2009.
[ 43 ] K. C. Neyerlin , W. B. Gu , J. Jorne , H. A. Gasteiger , J. Electrochem. Soc. 2007 , 154 , B631 .
599wileyonlinelibrary.combH & Co. KGaA, Weinheim