Embed Size (px)
Citation preview

““The highest form of human intelligence The highest form of human intelligence is the ability to observe without judgingis the ability to observe without judging””
KrishnamurtiKrishnamurti
““The intuitive mind is a sacred gift and The intuitive mind is a sacred gift and the rational mind is a faithful servant. We the rational mind is a faithful servant. We
have created a society that honors the have created a society that honors the servant and has forgotten the giftservant and has forgotten the gift””
Albert EinsteinAlbert Einstein
““The mind is everything,The mind is everything,what you think you becomewhat you think you become””
BuddhaBuddha
• Precipitation• Condensation, rainfall (spatial & temporal)
Streams & Floods• Nature and cause of floods
• Definitions• The hydrograph
• Discharge vs. time• Flood prediction
• Flood routing• Flood frequency analysis
U6115: Climate & WaterU6115: Climate & WaterFriday, July 11 2003Friday, July 11 2003
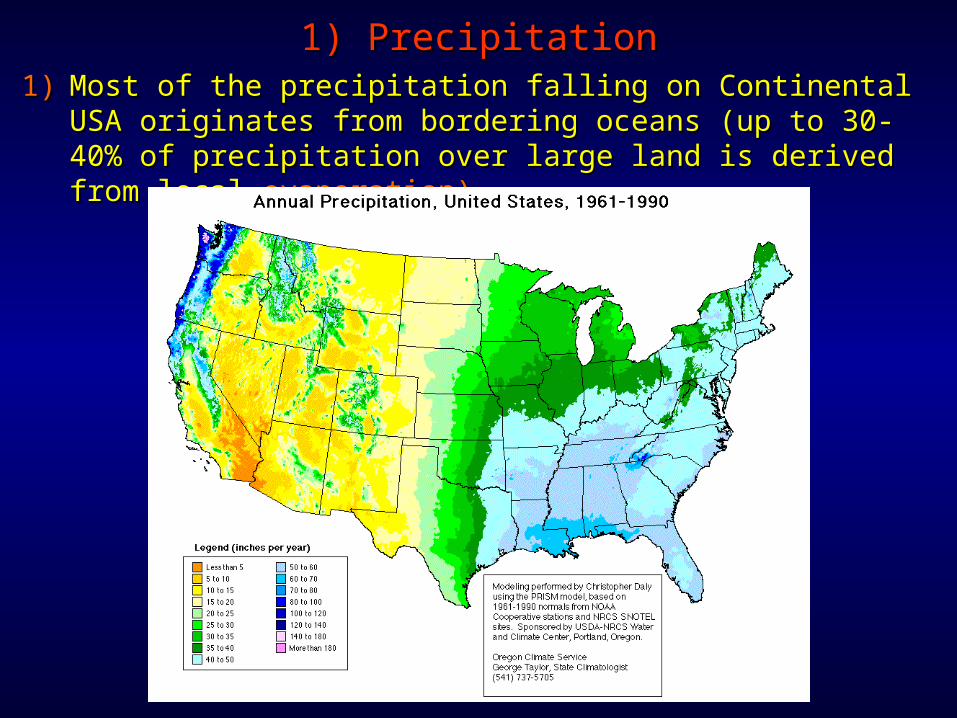
1) Precipitation1) Precipitation1)1) Most of the precipitation falling on Continental USA Most of the precipitation falling on Continental USA
originates from bordering oceans (up to 30-40% of originates from bordering oceans (up to 30-40% of precipitation over large land is derived from local precipitation over large land is derived from local evaporation)evaporation)
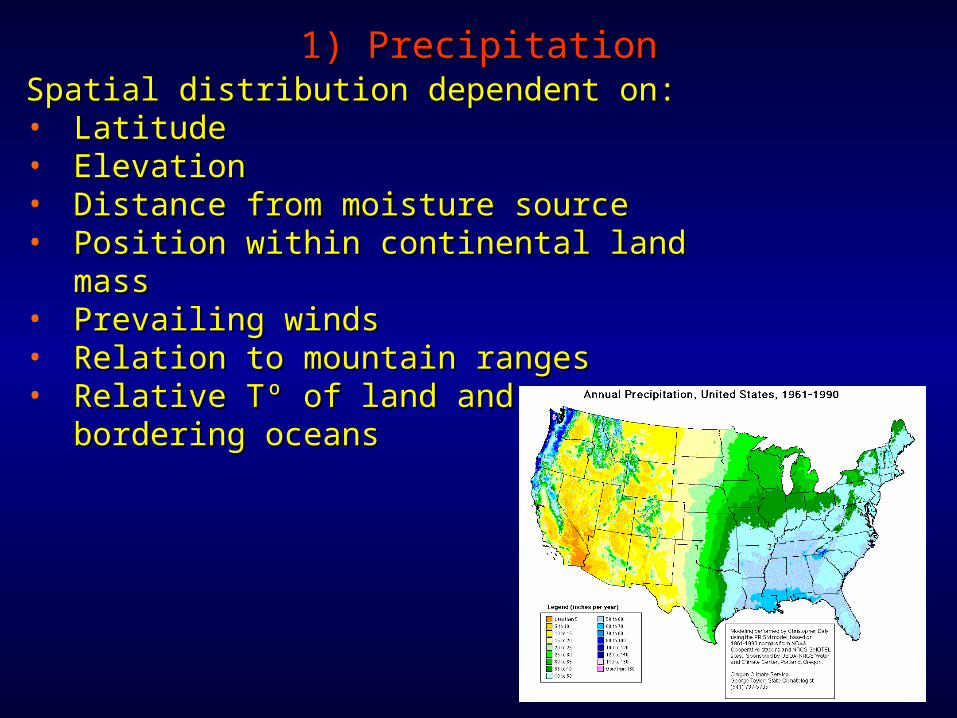
Spatial distribution dependent on:Spatial distribution dependent on:• LatitudeLatitude• ElevationElevation• Distance from moisture sourceDistance from moisture source• Position within continental land massPosition within continental land mass• Prevailing windsPrevailing winds• Relation to mountain rangesRelation to mountain ranges• Relative Tº of land and bordering Relative Tº of land and bordering
oceansoceans
1) Precipitation1) Precipitation
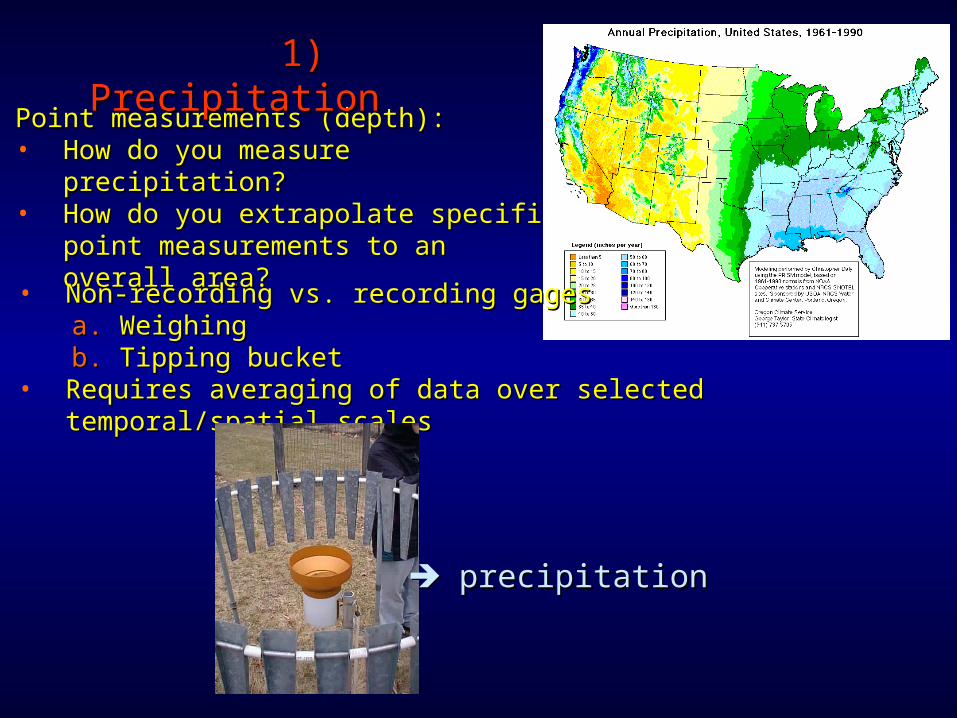
Point measurements (depth):Point measurements (depth):• How do you measure precipitation?How do you measure precipitation?• How do you extrapolate specific point How do you extrapolate specific point
measurements to an overall area?measurements to an overall area?
1) 1) PrecipitationPrecipitation
• Non-recording vs. recording gagesNon-recording vs. recording gagesa.a. WeighingWeighingb.b. Tipping bucketTipping bucket
• Requires averaging of data over selected temporal/spatial Requires averaging of data over selected temporal/spatial scalesscales
precipitationprecipitation
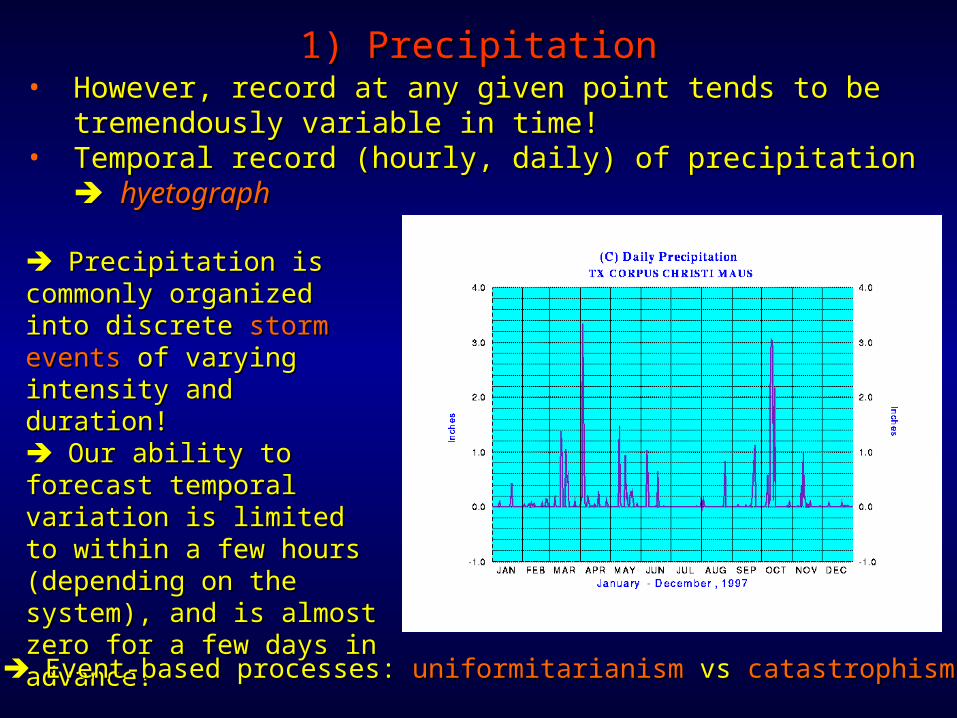
• However, record at any given point tends to be However, record at any given point tends to be tremendously variable in time!tremendously variable in time!
• Temporal record (hourly, daily) of precipitation Temporal record (hourly, daily) of precipitation hyetographhyetograph
1) Precipitation1) Precipitation
Precipitation is Precipitation is commonly organized into commonly organized into discrete discrete storm eventsstorm events of of varying intensity and varying intensity and duration!duration! Our ability to forecast Our ability to forecast temporal variation is temporal variation is limited to within a few limited to within a few hours (depending on the hours (depending on the system), and is almost system), and is almost zero for a few days in zero for a few days in advance!advance!
Event-based processes: Event-based processes: uniformitarianismuniformitarianism vs vs catastrophismcatastrophism
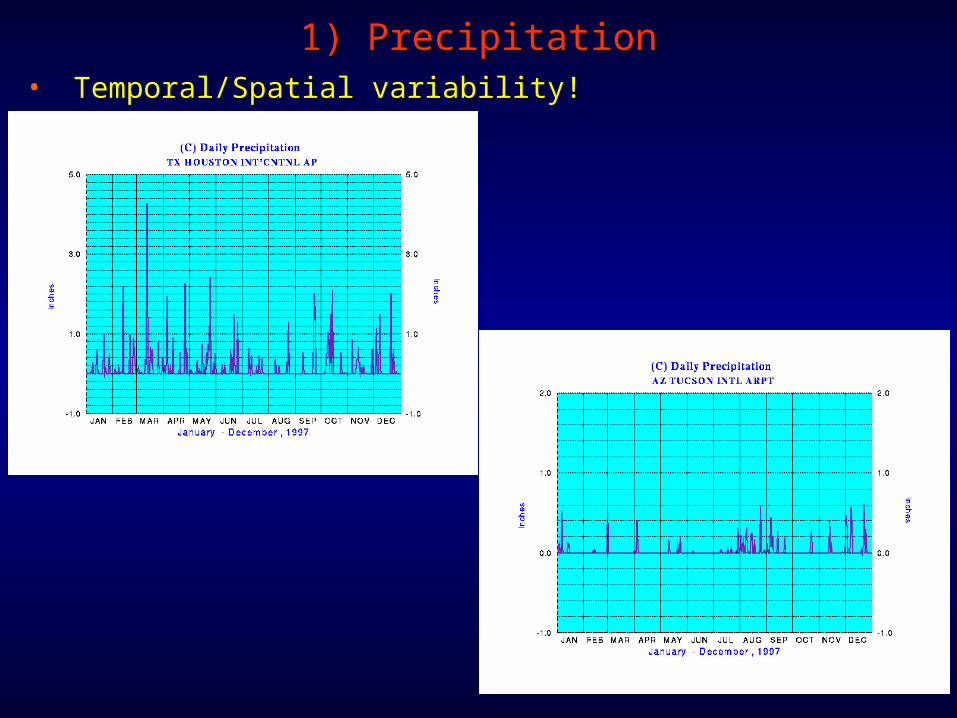
• Temporal/Spatial variability!Temporal/Spatial variability!
1) Precipitation1) Precipitation
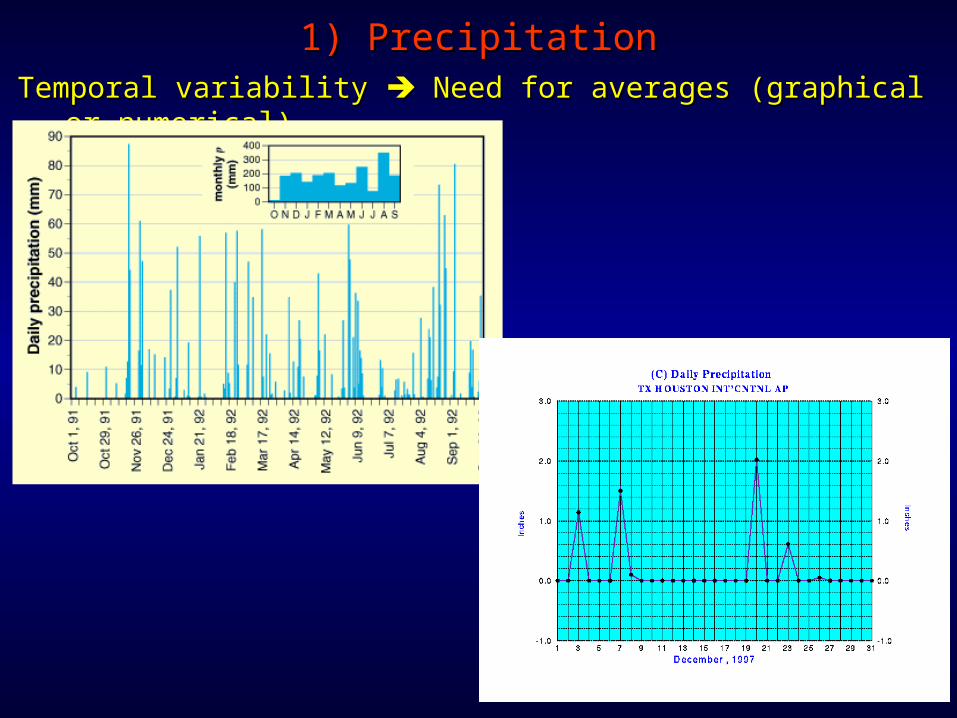
Temporal variability Temporal variability Need for averages (graphical or Need for averages (graphical or numerical)numerical)
1) Precipitation1) Precipitation
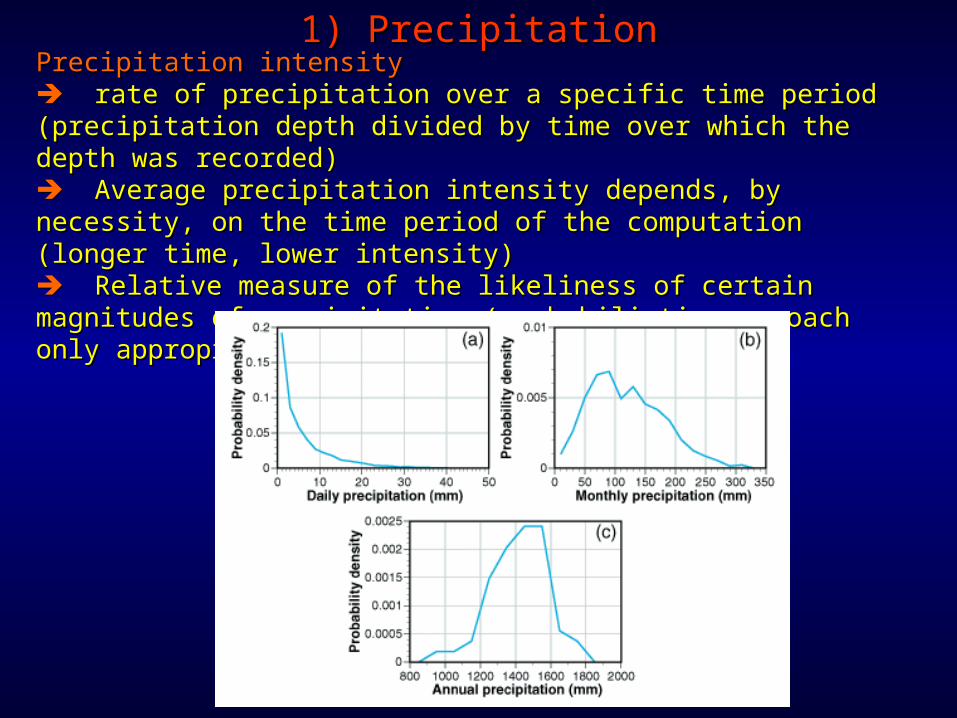
Precipitation intensityPrecipitation intensity rate of precipitation over a specific time period (precipitation rate of precipitation over a specific time period (precipitation depth divided by time over which the depth was recorded)depth divided by time over which the depth was recorded) Average precipitation intensity depends, by necessity, on the Average precipitation intensity depends, by necessity, on the time period of the computation (longer time, lower intensity)time period of the computation (longer time, lower intensity) Relative measure of the likeliness of certain magnitudes of Relative measure of the likeliness of certain magnitudes of precipitation (probabilistic approach only appropriate under precipitation (probabilistic approach only appropriate under certain conditions).certain conditions).
1) Precipitation1) Precipitation
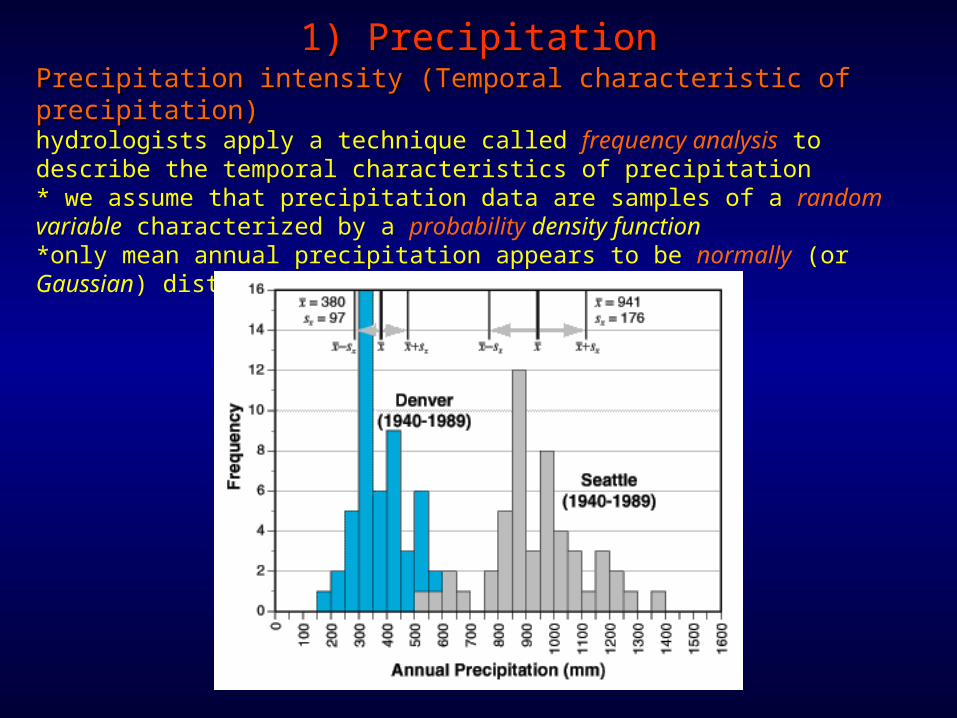
Precipitation intensity (Temporal characteristic of precipitation)Precipitation intensity (Temporal characteristic of precipitation)hydrologists apply a technique called frequency analysis to describe the temporal characteristics of precipitation* we assume that precipitation data are samples of a random variable characterized by a probability density function*only mean annual precipitation appears to be normally (or Gaussian) distributed
1) Precipitation1) Precipitation
Precipitation intensity (Temporal characteristic of precipitation)Precipitation intensity (Temporal characteristic of precipitation)precipitation can be described by a mean and a standard deviation
*this information is useful to determine the exceedance probability (the probability that a certain annual precipitation value is exceeded in a given year) or the return period - the inverse of the exceedance probability).
1) Precipitation1) Precipitation
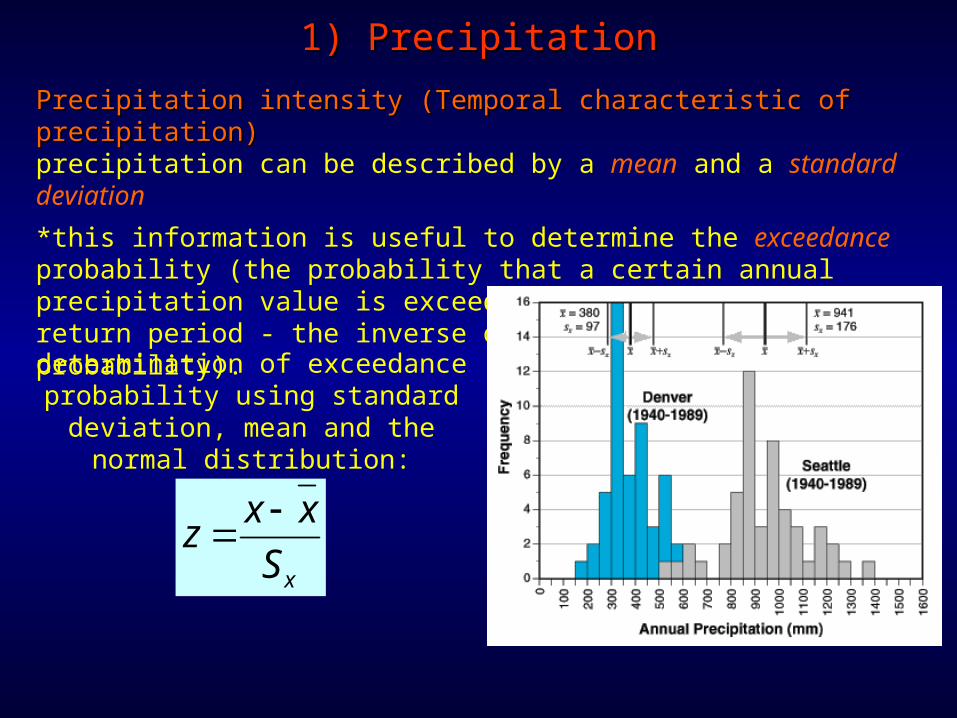
determination of exceedance probability using standard
deviation, mean and the normal distribution:
xS
xxz
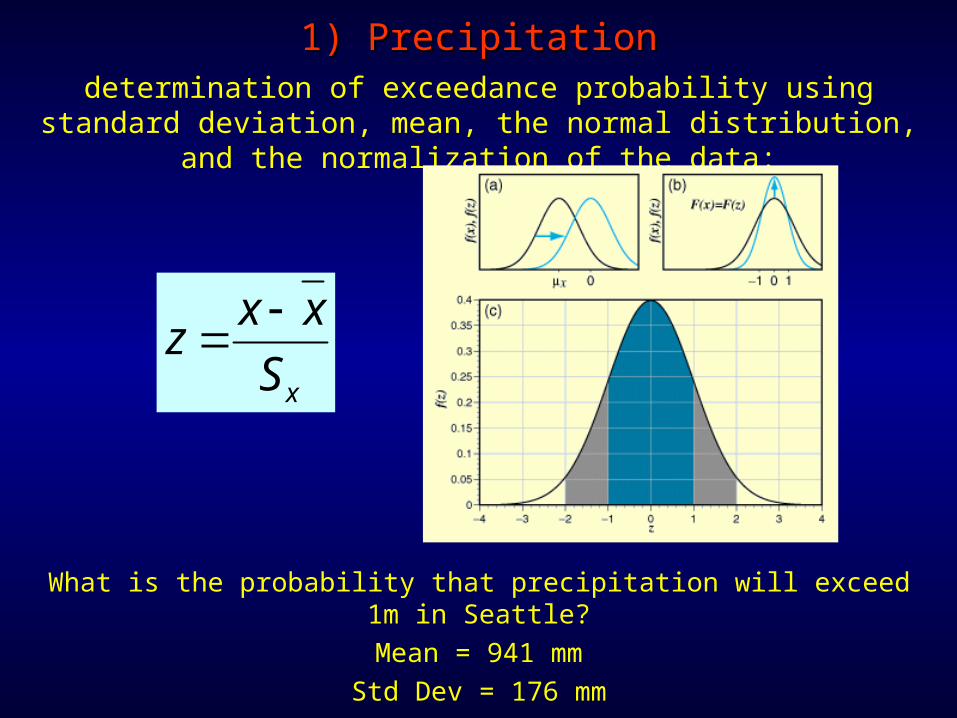
1) Precipitation1) Precipitationdetermination of exceedance probability using standard
deviation, mean, the normal distribution, and the normalization of the data:
xS
xxz
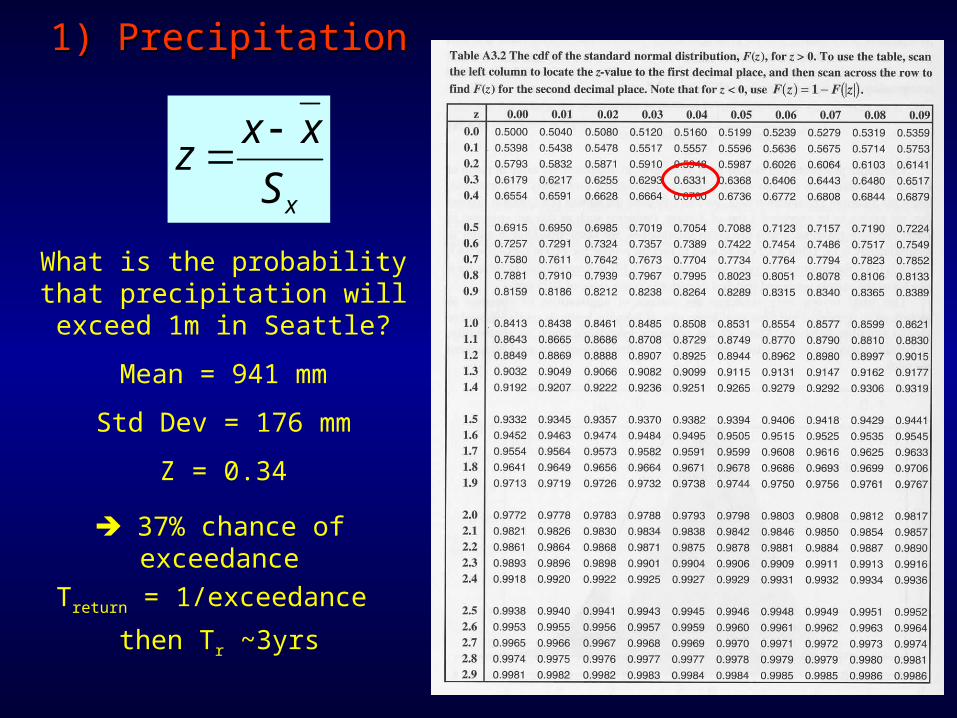
What is the probability that precipitation will exceed 1m in Seattle?
Mean = 941 mmStd Dev = 176 mm
1) Precipitation1) Precipitation
xS
xxz
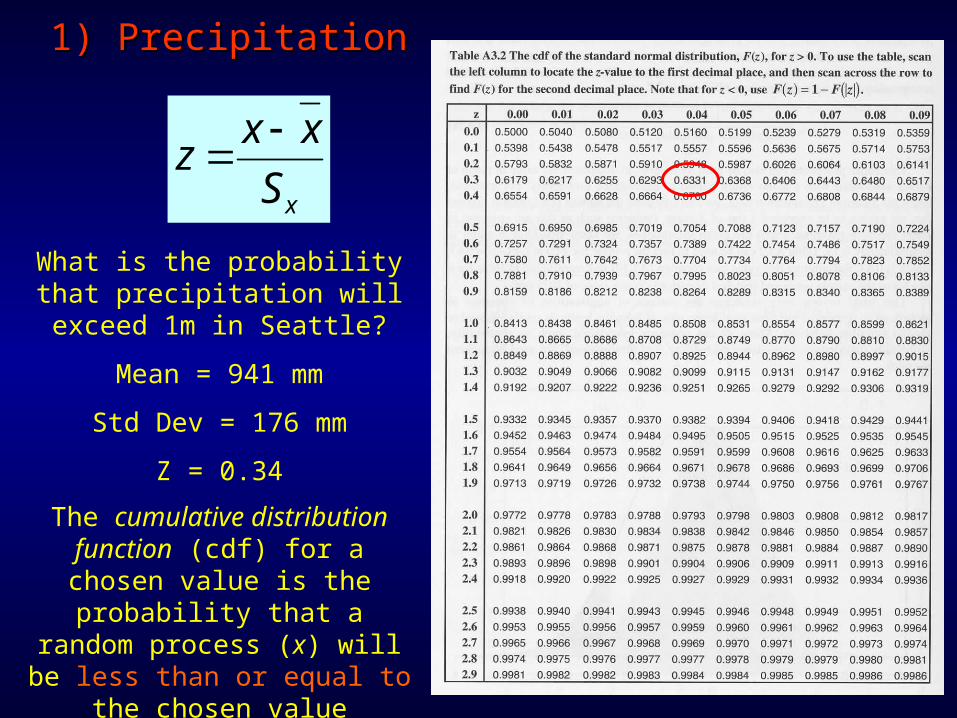
The cumulative distribution function (cdf) for a chosen value is the probability that a random process (x) will be
less than or equal to the chosen value
What is the probability that precipitation will exceed 1m
in Seattle?
Mean = 941 mm
Std Dev = 176 mm
Z = 0.34
1) Precipitation1) Precipitation
xS
xxz
37% chance of exceedance
Treturn = 1/exceedance
then Tr ~3yrs
What is the probability that precipitation will exceed 1m
in Seattle?
Mean = 941 mm
Std Dev = 176 mm
Z = 0.34
1) Precipitation1) Precipitation
xS
xxz
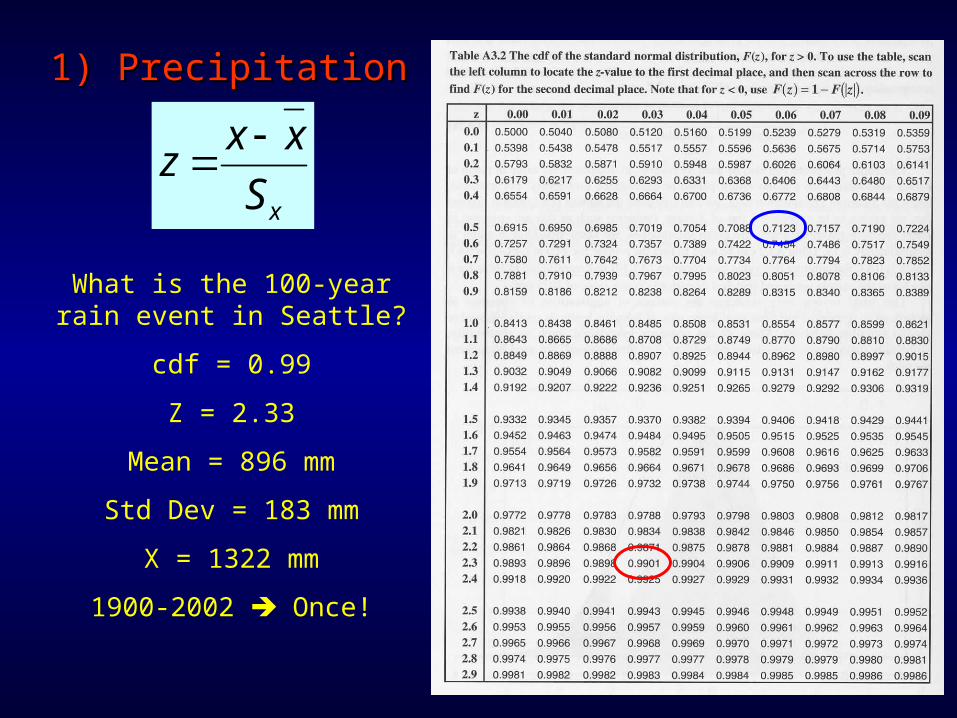
What is the 100-year rain event in Seattle?
cdf = 0.99
Z = 2.33
Mean = 896 mm
Std Dev = 183 mm
X = 1322 mm
1900-2002 Once!
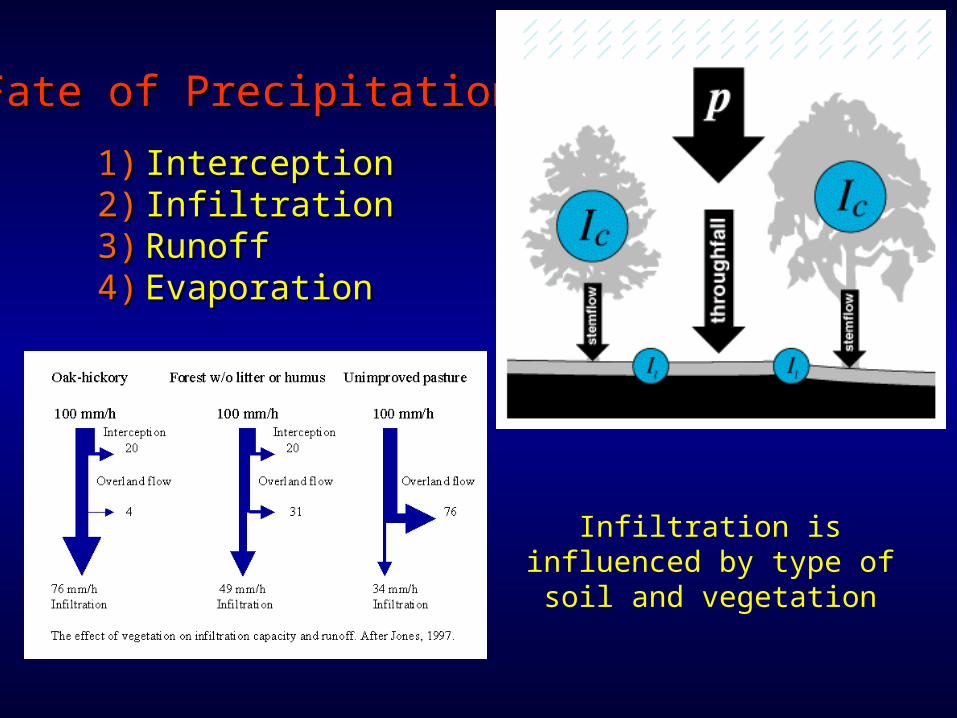
1)1) InterceptionInterception2)2) InfiltrationInfiltration3)3) RunoffRunoff4)4) EvaporationEvaporation
Fate of PrecipitationFate of Precipitation
Infiltration is influenced by type of soil and vegetation
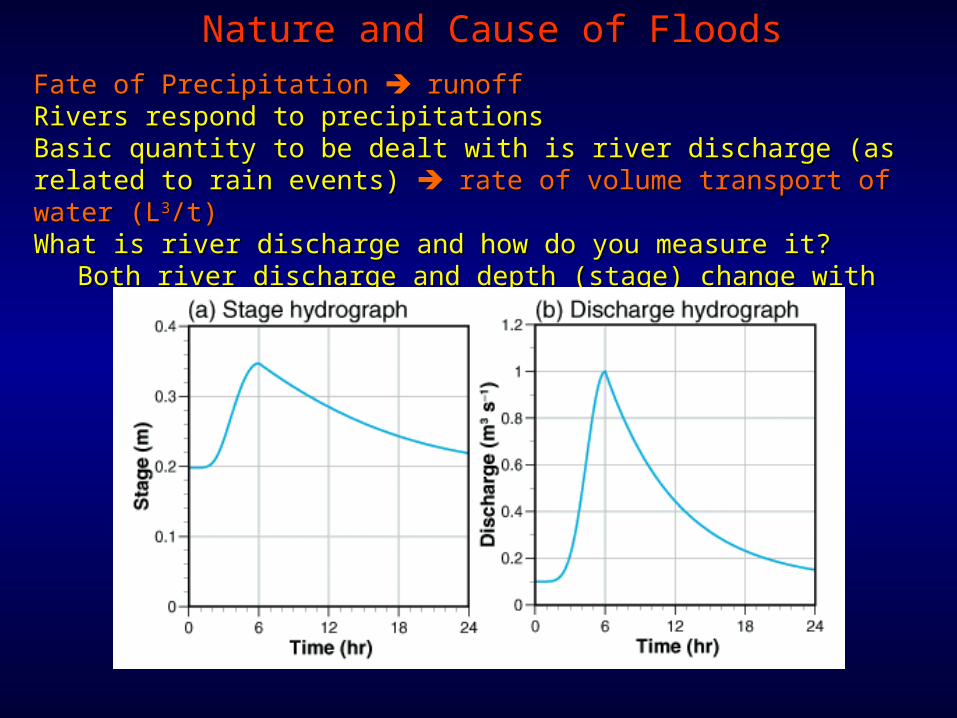
Fate of Precipitation Fate of Precipitation runoff runoffRivers respond to precipitationsRivers respond to precipitationsBasic quantity to be dealt with is river discharge (as related to Basic quantity to be dealt with is river discharge (as related to rain events) rain events) rate of volume transport of water (L rate of volume transport of water (L33/t)/t)What is river discharge and how do you measure it?What is river discharge and how do you measure it?
Both river discharge and depth (stage) change with time.Both river discharge and depth (stage) change with time.
Nature and Cause of FloodsNature and Cause of Floods
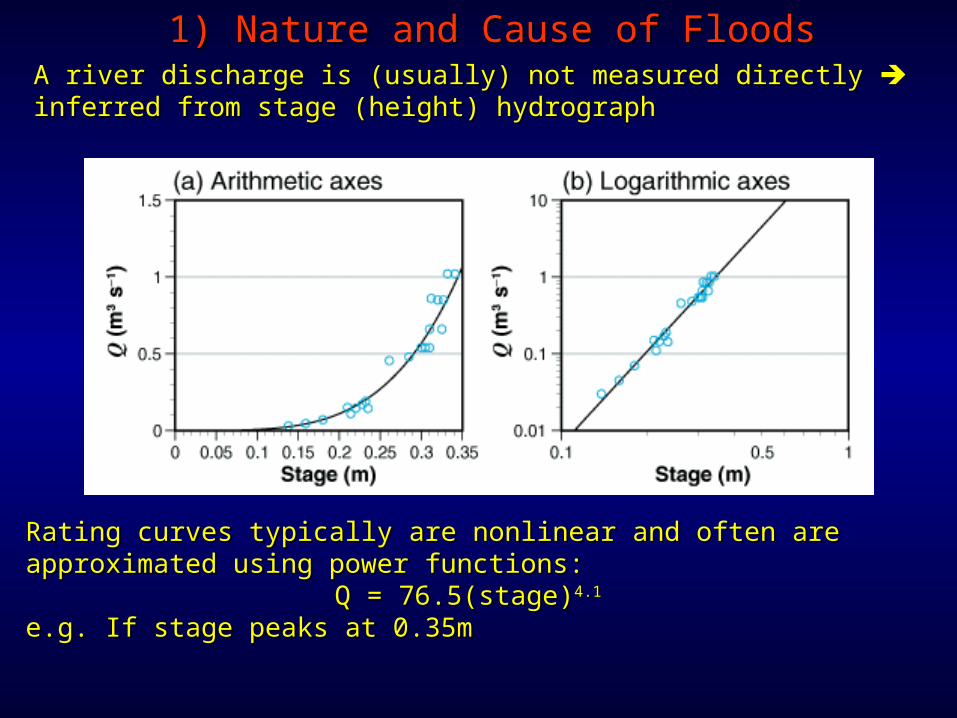
A river discharge is (usually) not measured directly A river discharge is (usually) not measured directly inferred inferred from stage (height) hydrographfrom stage (height) hydrograph
1) Nature and Cause of Floods1) Nature and Cause of Floods
Rating curves typically are nonlinear and often are approximated Rating curves typically are nonlinear and often are approximated using power functions:using power functions:
Q = 76.5(stage)Q = 76.5(stage)4.14.1
e.g. If stage peaks at 0.35me.g. If stage peaks at 0.35m
Nature and Cause of FloodsNature and Cause of Floods
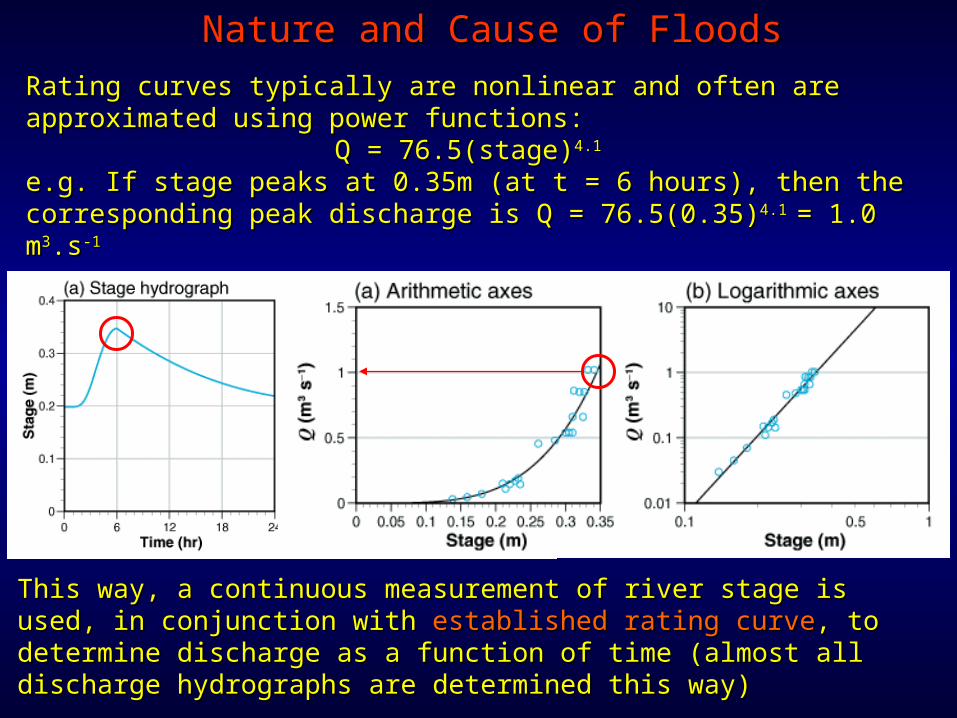
Rating curves typically are nonlinear and often are approximated Rating curves typically are nonlinear and often are approximated using power functions:using power functions:
Q = 76.5(stage)Q = 76.5(stage)4.14.1
e.g. If stage peaks at 0.35m (at t = 6 hours), then the e.g. If stage peaks at 0.35m (at t = 6 hours), then the corresponding peak discharge is Q = 76.5(0.35)corresponding peak discharge is Q = 76.5(0.35)4.1 4.1 = 1.0 m= 1.0 m33.s.s-1-1
This way, a continuous measurement of river stage is used, in This way, a continuous measurement of river stage is used, in conjunction with conjunction with established rating curveestablished rating curve, to determine discharge as , to determine discharge as a function of time (almost all discharge hydrographs are determined a function of time (almost all discharge hydrographs are determined this way)this way)
Nature and Cause of FloodsNature and Cause of Floods
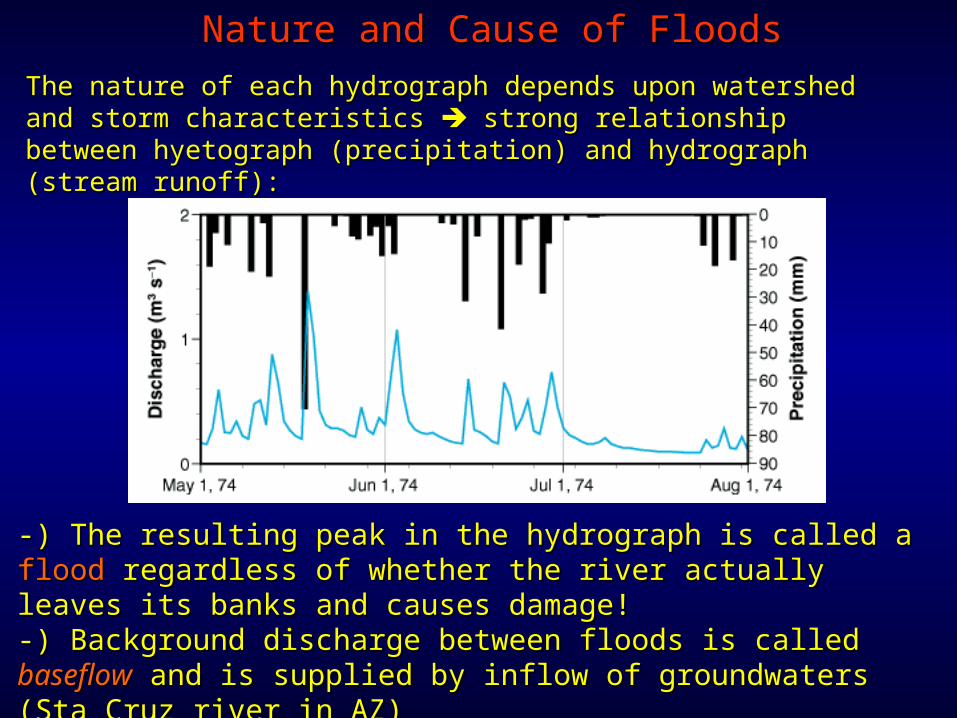
The nature of each hydrograph depends upon watershed and The nature of each hydrograph depends upon watershed and storm characteristics storm characteristics strong relationship between hyetograph strong relationship between hyetograph (precipitation) and hydrograph (stream runoff):(precipitation) and hydrograph (stream runoff):
-) The resulting peak in the hydrograph is called a -) The resulting peak in the hydrograph is called a floodflood regardless of whether the river actually leaves its banks and regardless of whether the river actually leaves its banks and causes damage!causes damage!-) Background discharge between floods is called -) Background discharge between floods is called baseflowbaseflow and is supplied by inflow of groundwaters (Sta Cruz river in and is supplied by inflow of groundwaters (Sta Cruz river in AZ)AZ)
Nature and Cause of FloodsNature and Cause of Floods
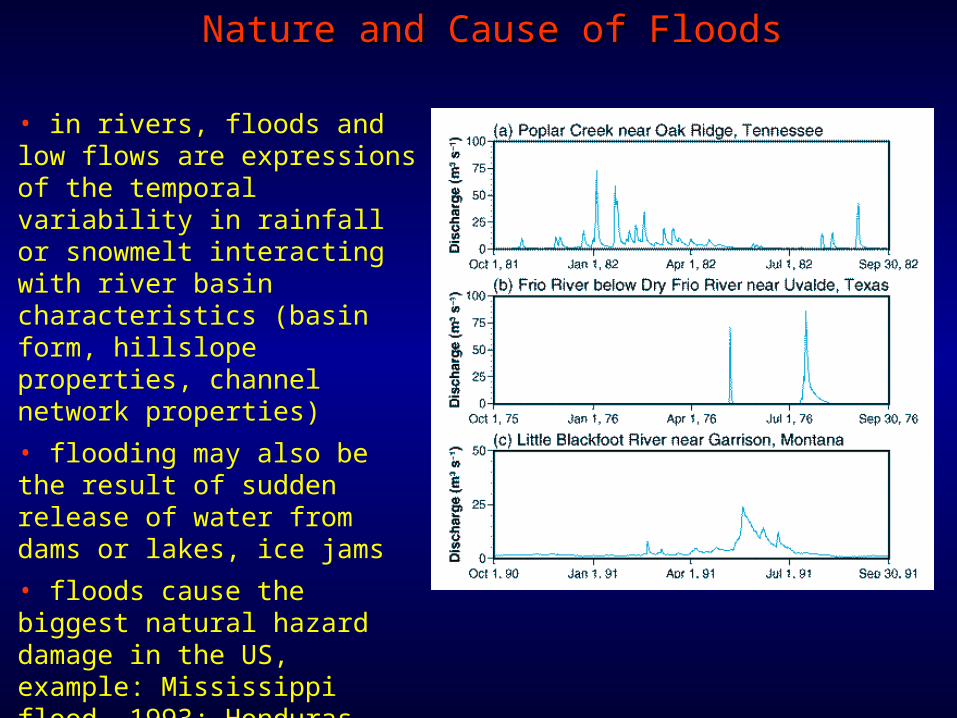
• in rivers, floods and low flows are expressions of the temporal variability in rainfall or snowmelt interacting with river basin characteristics (basin form, hillslope properties, channel network properties)
• flooding may also be the result of sudden release of water from dams or lakes, ice jams
• floods cause the biggest natural hazard damage in the US, example: Mississippi flood, 1993; Honduras, Hurricane Mitch
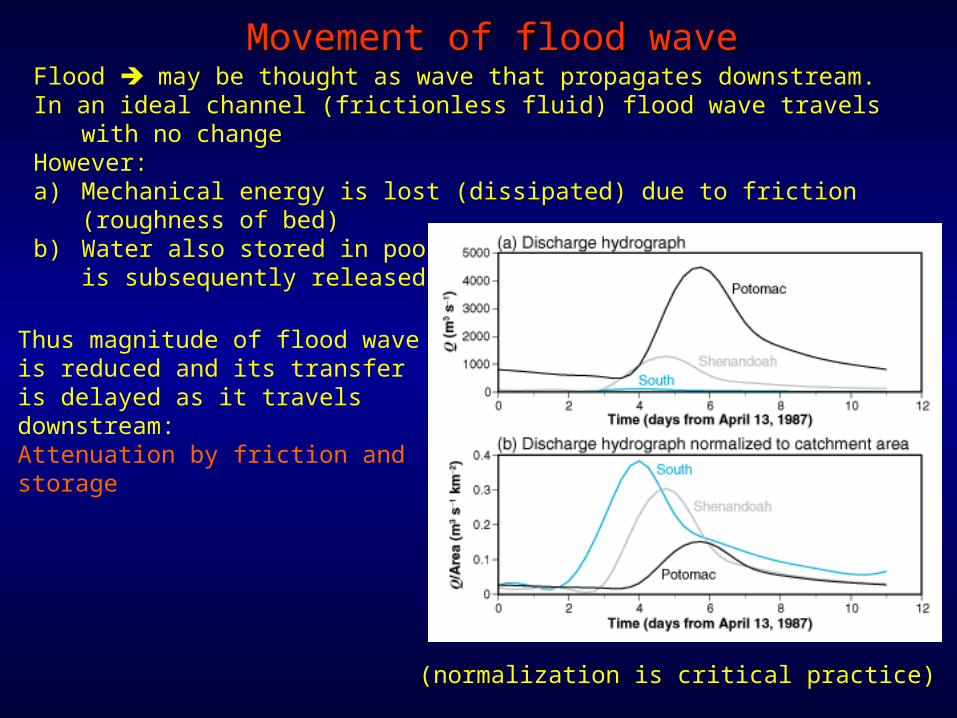
Flood may be thought as wave that propagates downstream.In an ideal channel (frictionless fluid) flood wave travels with no changeHowever:a) Mechanical energy is lost (dissipated) due to friction (roughness of
bed)b) Water also stored in pools, wetlands, and backwaters, and is
subsequently released (delay)
Movement of flood waveMovement of flood wave
Thus magnitude of flood wave is reduced and its transfer is delayed as it travels downstream:Attenuation by friction and storage
(normalization is critical practice)
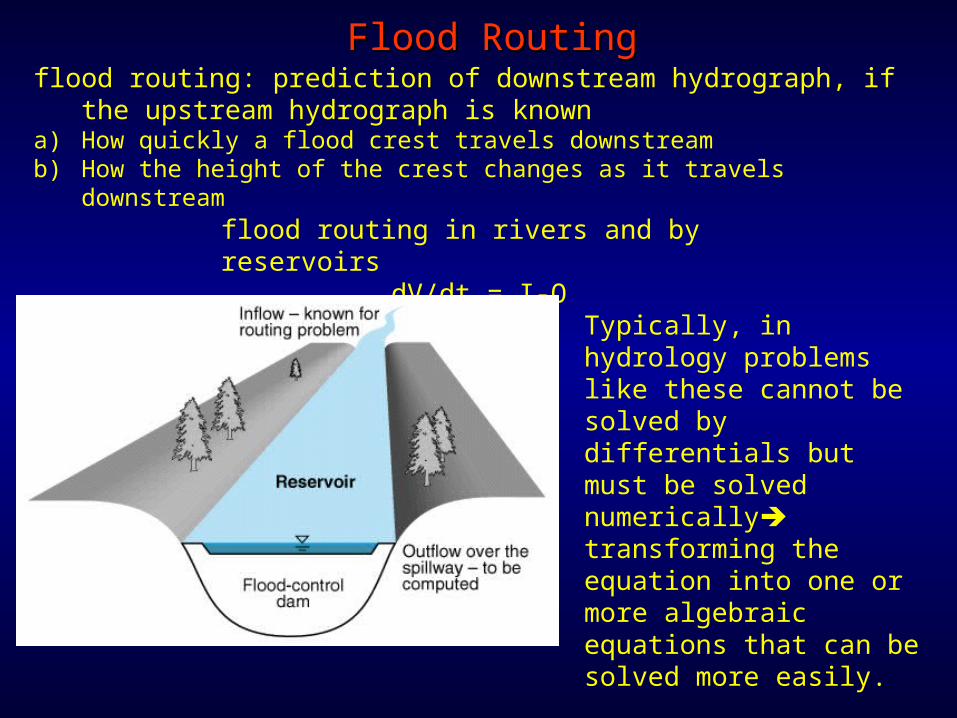
flood routing: prediction of downstream hydrograph, if the upstream hydrograph is known
a) How quickly a flood crest travels downstreamb) How the height of the crest changes as it travels downstream
Flood RoutingFlood Routing
flood routing in rivers and by reservoirs
dV/dt = I-OTypically, in hydrology problems like these cannot be solved by differentials but must be solved numerically transforming the equation into one or more algebraic equations that can be solved more easily.
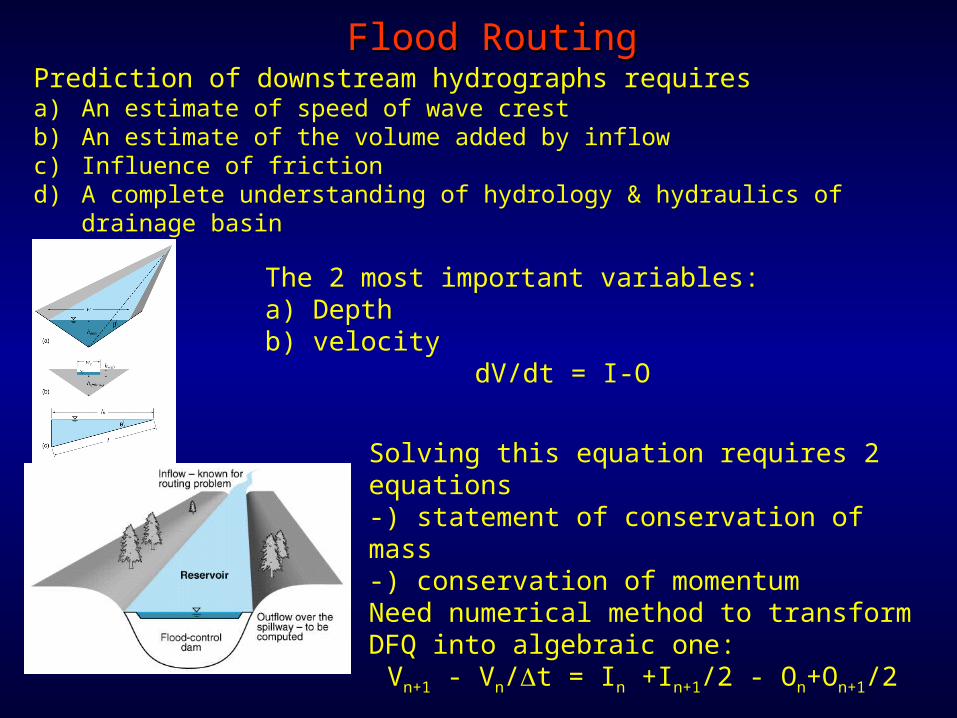
Prediction of downstream hydrographs requiresa) An estimate of speed of wave crestb) An estimate of the volume added by inflowc) Influence of frictiond) A complete understanding of hydrology & hydraulics of drainage
basin
Flood RoutingFlood Routing
Solving this equation requires 2 equations-) statement of conservation of mass-) conservation of momentumNeed numerical method to transform DFQ into algebraic one:
Vn+1 - Vn/t = In +In+1/2 - On+On+1/2
The 2 most important variables:a) Depthb) velocity
dV/dt = I-O
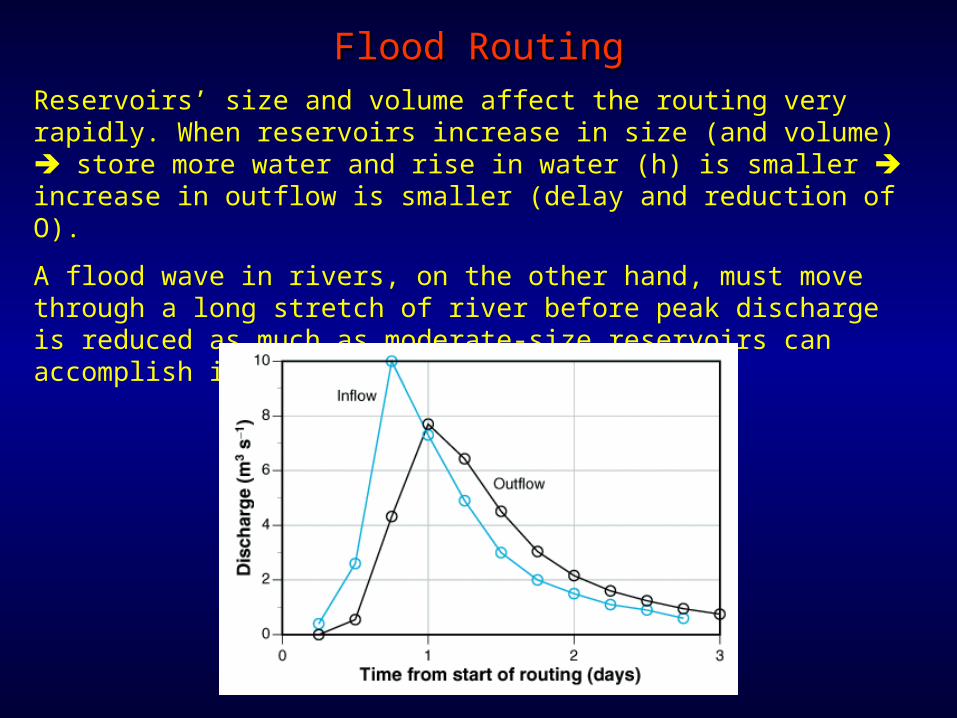
Reservoirs’ size and volume affect the routing very rapidly. When reservoirs increase in size (and volume) store more water and rise in water (h) is smaller increase in outflow is smaller (delay and reduction of O).
A flood wave in rivers, on the other hand, must move through a long stretch of river before peak discharge is reduced as much as moderate-size reservoirs can accomplish in a relative short distance
Flood RoutingFlood Routing
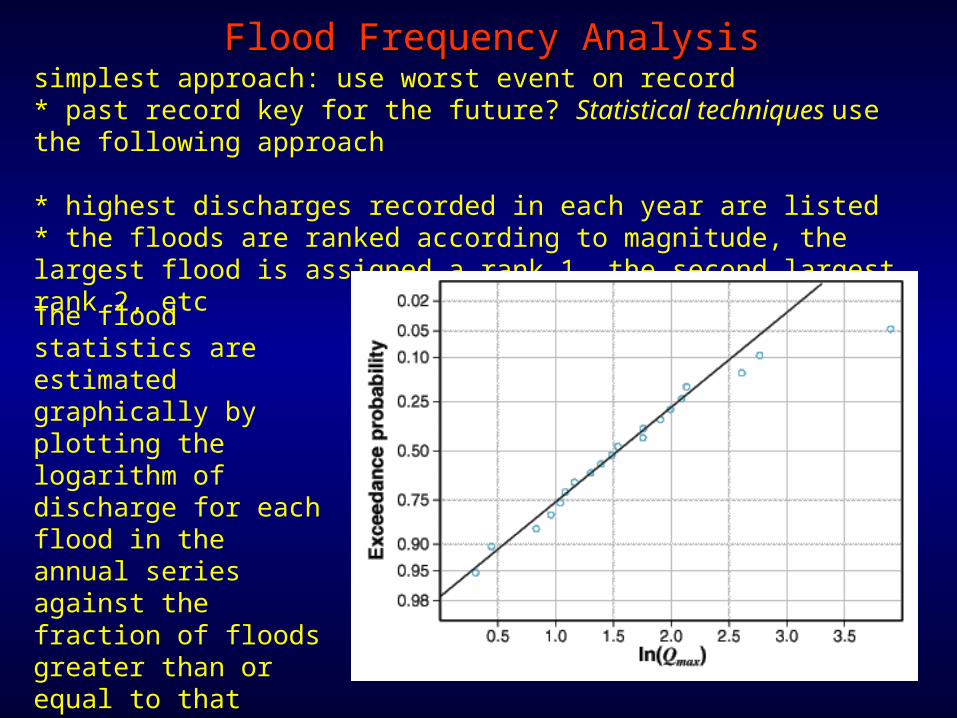
simplest approach: use worst event on record* past record key for the future? Statistical techniques use the following approach
* highest discharges recorded in each year are listed* the floods are ranked according to magnitude, the largest flood is assigned a rank 1, the second largest rank 2, etc
Flood Frequency AnalysisFlood Frequency Analysis
The flood statistics are estimated graphically by plotting the logarithm of discharge for each flood in the annual series against the fraction of floods greater than or equal to that flood; this fraction is given by r/(n+1), where r is the rank of the particular flood
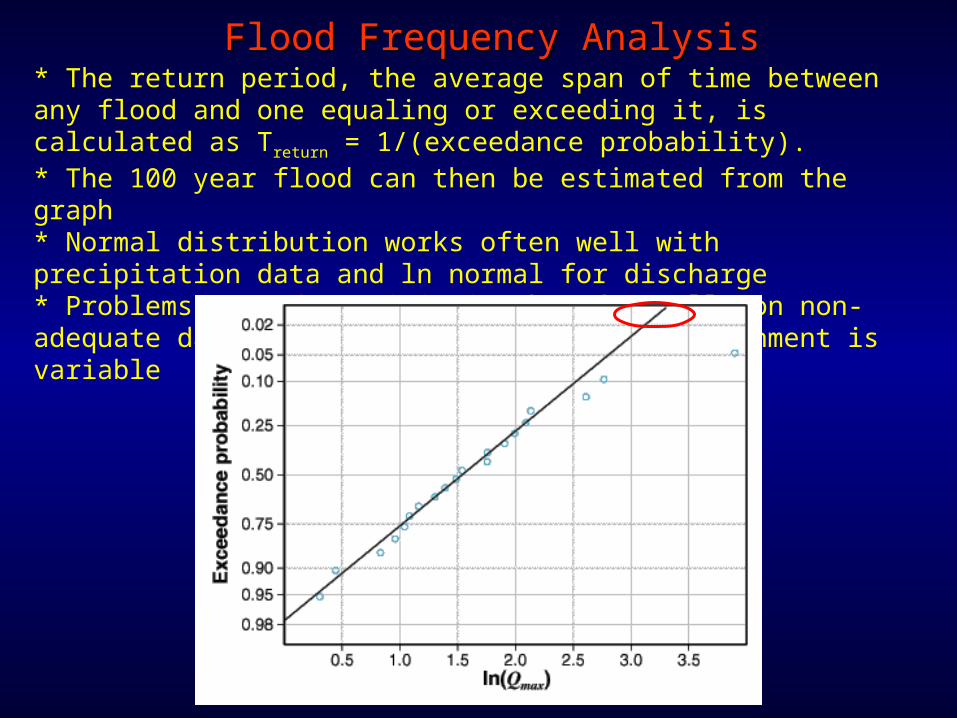
* The return period, the average span of time between any flood and one equaling or exceeding it, is calculated as Treturn = 1/(exceedance probability).* The 100 year flood can then be estimated from the graph* Normal distribution works often well with precipitation data and ln normal for discharge* Problems: not deterministic, based usually on non-adequate data, climate and terrestrial environment is variable
Flood Frequency AnalysisFlood Frequency Analysis