Embed Size (px)
Citation preview
Travel patterns in Scotland
Frank Dixon and Stephen Hinchliffe, Transport Statistics branch,
Scottish Executive
What we will cover Car availability and frequency of driving Frequency of walking and cycling, and use
of buses Travel to work Travel to school Travel Diary results Publications
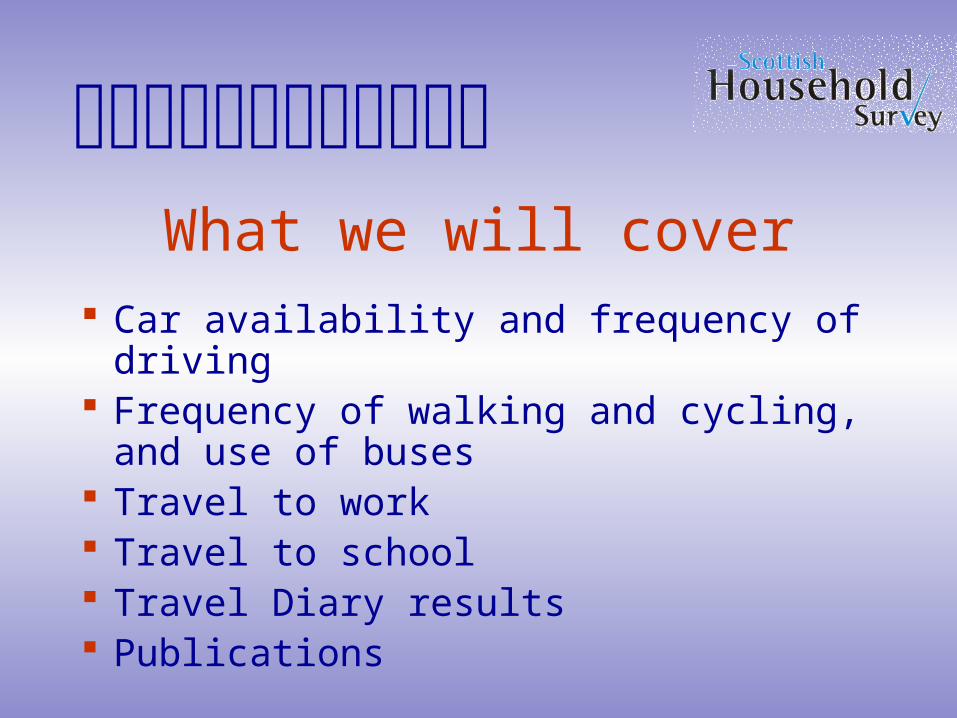
Chart A: Number of cars available for private use by members of the household
by annual net household income
0%
10%
20%
30%
40%
50%
60%
70%
80%
90%
100%
up to£10,000
over£10,000, upto £15,000
over£15,000, upto £20,000
over£20,000, upto £25,000
over£25,000, upto £30,000
over£30,000, upto £40,000
over £40,000
% o
f h
ou
se
ho
lds
3+ cars 2 cars 1 car no car

Chart C: People (aged 17+) with full driving licences, and who drive every day
0
10
20
30
40
50
60
70
80
90
100
17 -19
20 -24
25 -29
30 -34
35 -39
40 -44
45 -49
50 -54
55 -59
60 -64
65 -69
70 -74
75 -79
80 +
Age group
% o
f age
-gro
up
Men with fulldriving licence
Women withfull drivinglicence
Men who driveevery day
Women whodrive every day

Chart H: Walking and cycling for pleasure or to keep fit (on one or more of the previous seven days)
0
10
20
30
40
50
60
16-19 20-24 25-29 30-34 35-39 40-44 45-49 50-54 55-59 60-64 65-69 70-74 75-79 80+
Age Group
% o
f ad
ults
Men walking Women walking Men cycling Women cycling
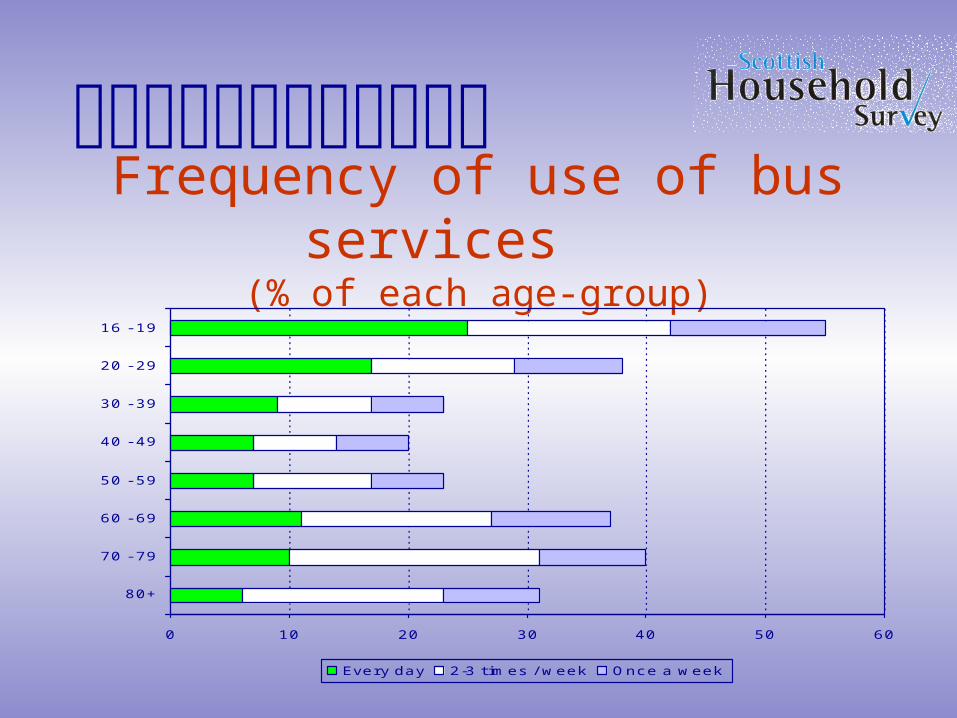
Frequency of use of bus services (% of each age-group)
0 10 20 30 40 50 60
80+
70 - 79
60 - 69
50 - 59
40 - 49
30 - 39
20 - 29
16 - 19
Every day 2-3 times / week Once a week
SHS also asks Users’ views of aspects of bus services Infrequent / non-users’ reasons for not using buses
more often Frequency of use of train services Users’ views of aspects of train services Frequency of use of evening bus and train
services; perception of safety from crime
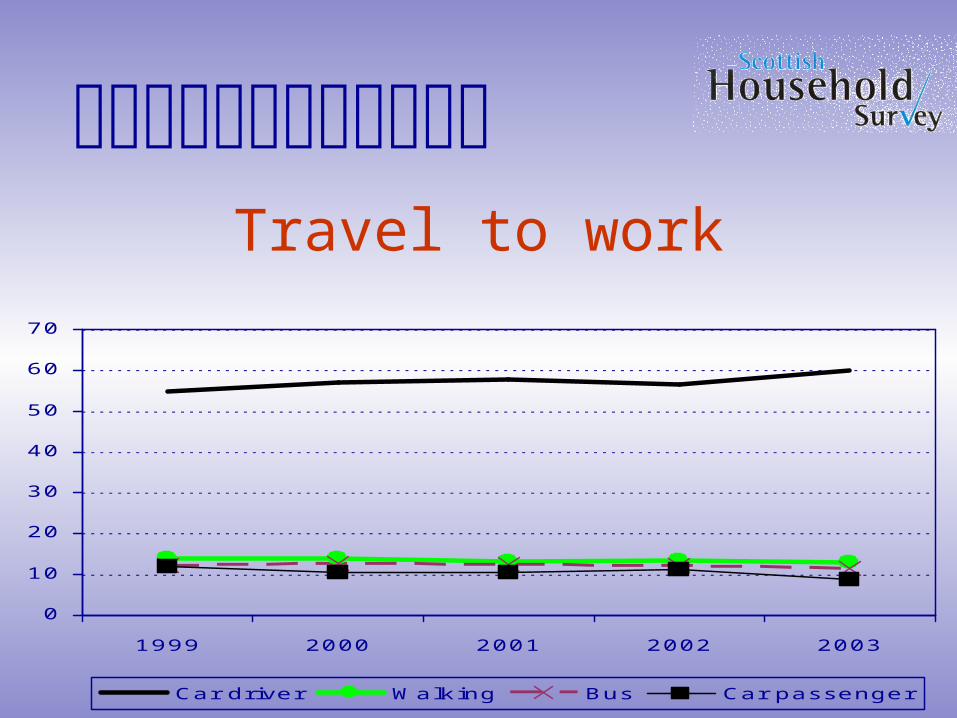
Travel to work
0
10
20
30
40
50
60
70
1999 2000 2001 2002 2003
Car driver Walking Bus Car passenger
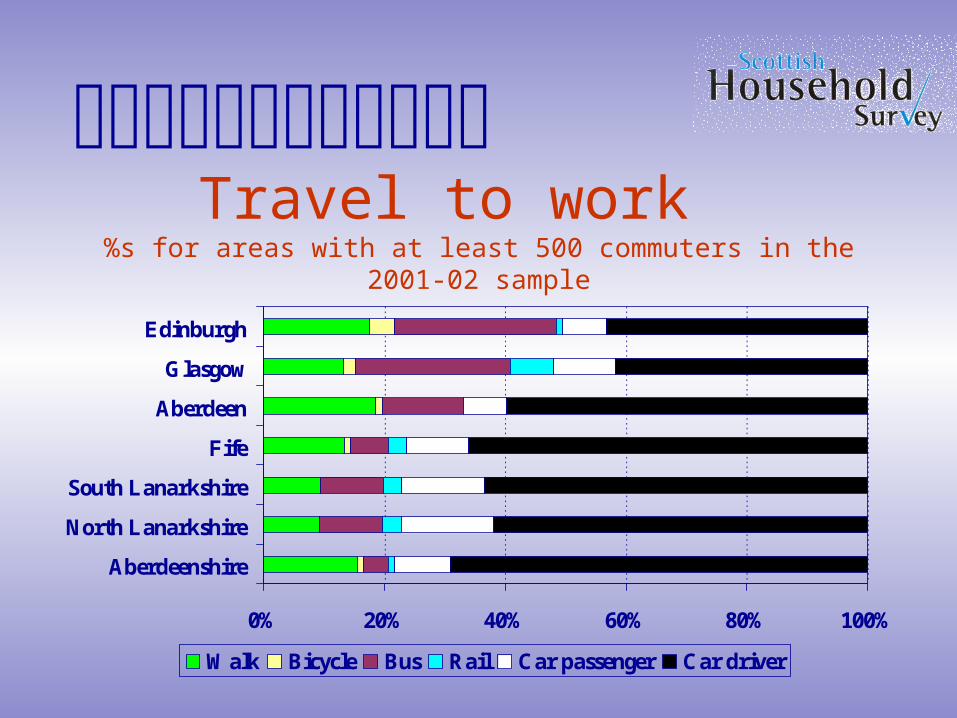
Travel to work %s for areas with at least 500 commuters in the 2001-02 sample
0% 20% 40% 60% 80% 100%
Aberdeenshire
North Lanarkshire
South Lanarkshire
Fife
Aberdeen
Glasgow
Edinburgh
Walk Bicycle Bus Rail Car passenger Car driver
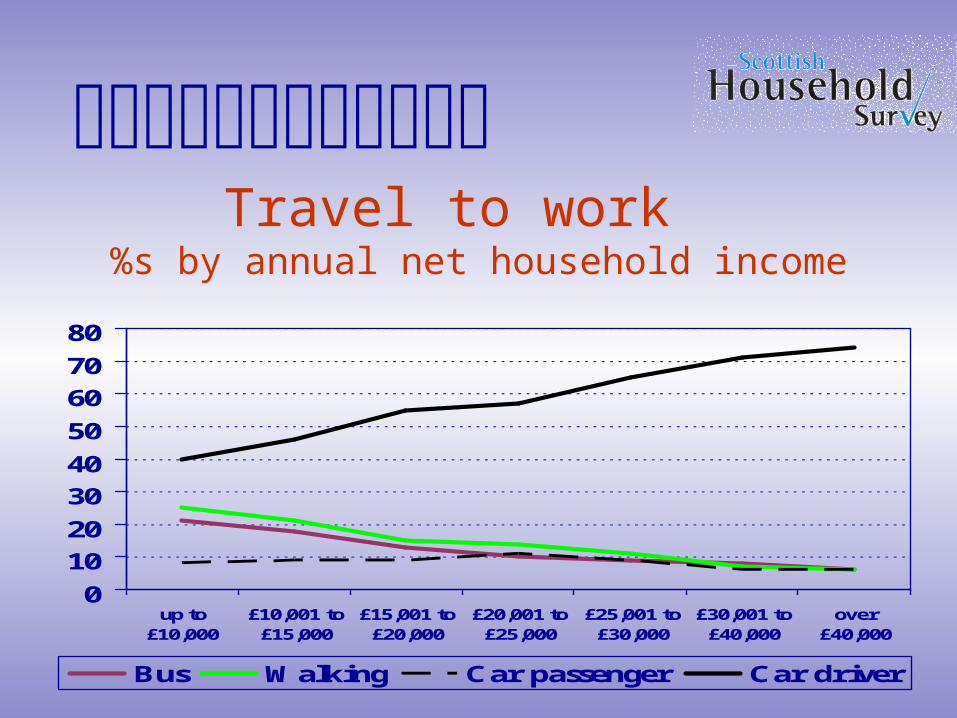
Travel to work %s by annual net household income
0
10
20
30
40
50
60
70
80
up to£10,000
£10,001 to£15,000
£15,001 to£20,000
£20,001 to£25,000
£25,001 to£30,000
£30,001 to£40,000
over£40,000
Bus Walking Car passenger Car driver
SHS also asks Reasons for use of mode of travel to work Whether car commuters could use public transport
If they could, why they don’t If they couldn’t, why they can’t
Mode of travel to work a year ago Reason for change of mode of travel to work

Chart L: Travel to school
0
10
20
30
40
50
60
70
4 5 6 7 8 9 10 11 12 13 14 15 16 17
Age
% o
f p
up
ils
Walking Car or van Bus (any) Other Bicycle
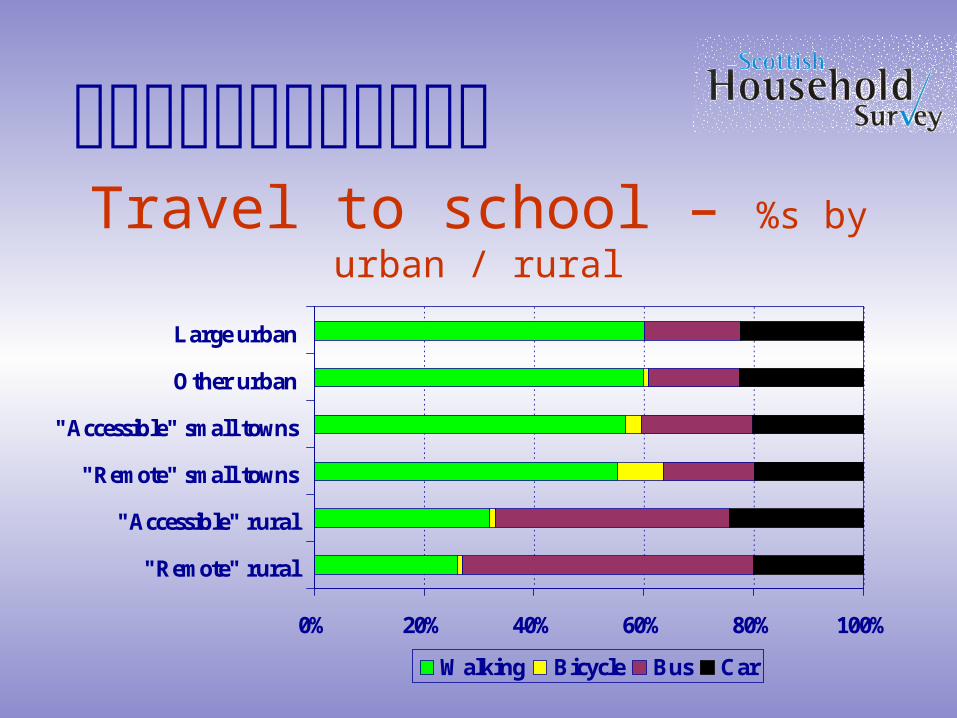
Travel to school – %s by urban / rural
0% 20% 40% 60% 80% 100%
"Remote" rural
"Accessible" rural
"Remote" small towns
"Accessible" small towns
Other urban
Large urban
Walking Bicycle Bus Car
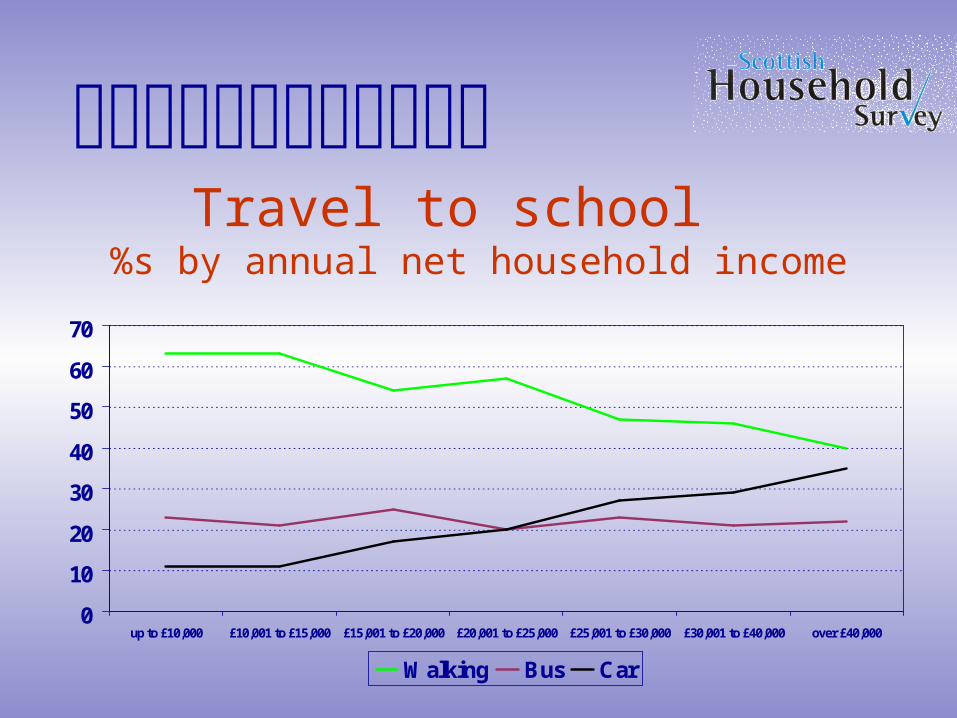
Travel to school %s by annual net household income
0
10
20
30
40
50
60
70
up to £10,000 £10,001 to £15,000 £15,001 to £20,000 £20,001 to £25,000 £25,001 to £30,000 £30,001 to £40,000 over £40,000
Walking Bus Car
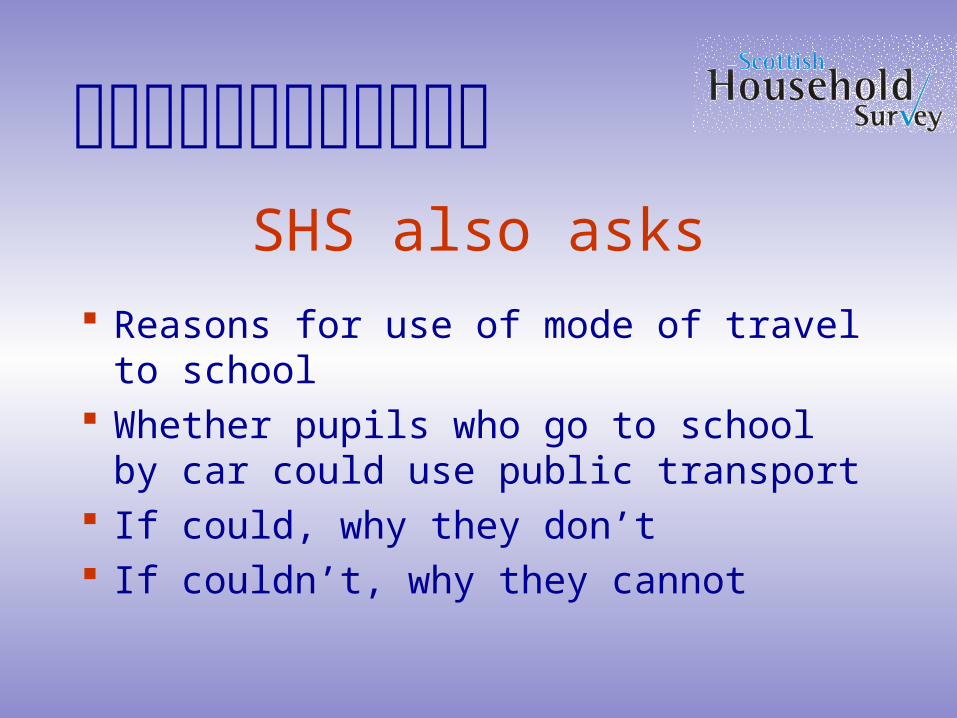
SHS also asks
Reasons for use of mode of travel to school Whether pupils who go to school by car
could use public transport If could, why they don’t If couldn’t, why they cannot
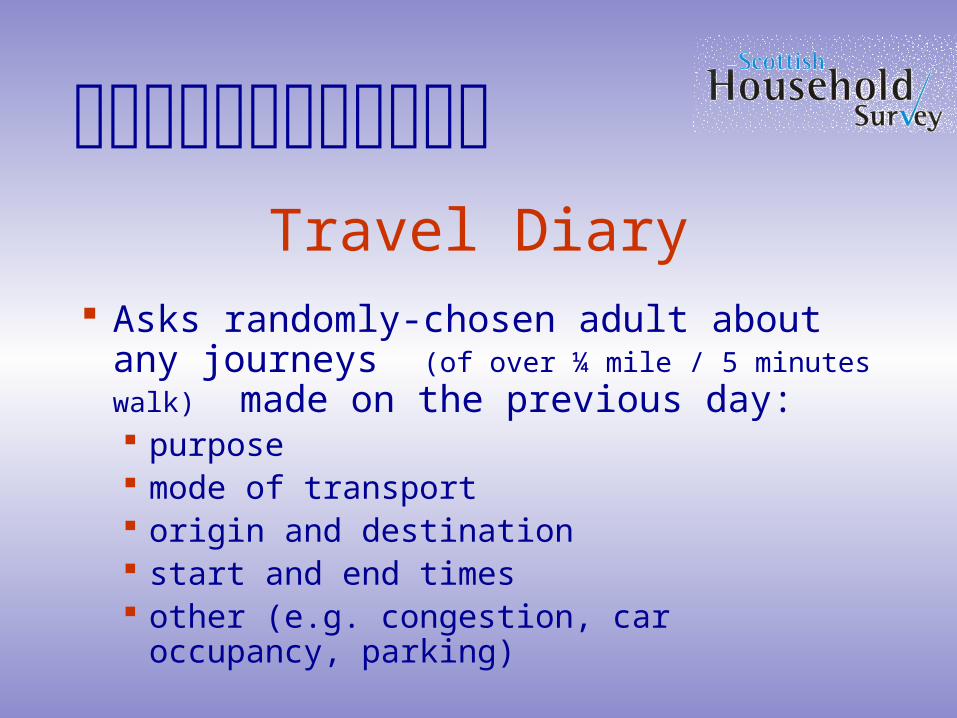
Travel Diary Asks randomly-chosen adult about any
journeys (of over ¼ mile / 5 minutes walk) made on the previous day: purpose mode of transport origin and destination start and end times other (e.g. congestion, car occupancy, parking)
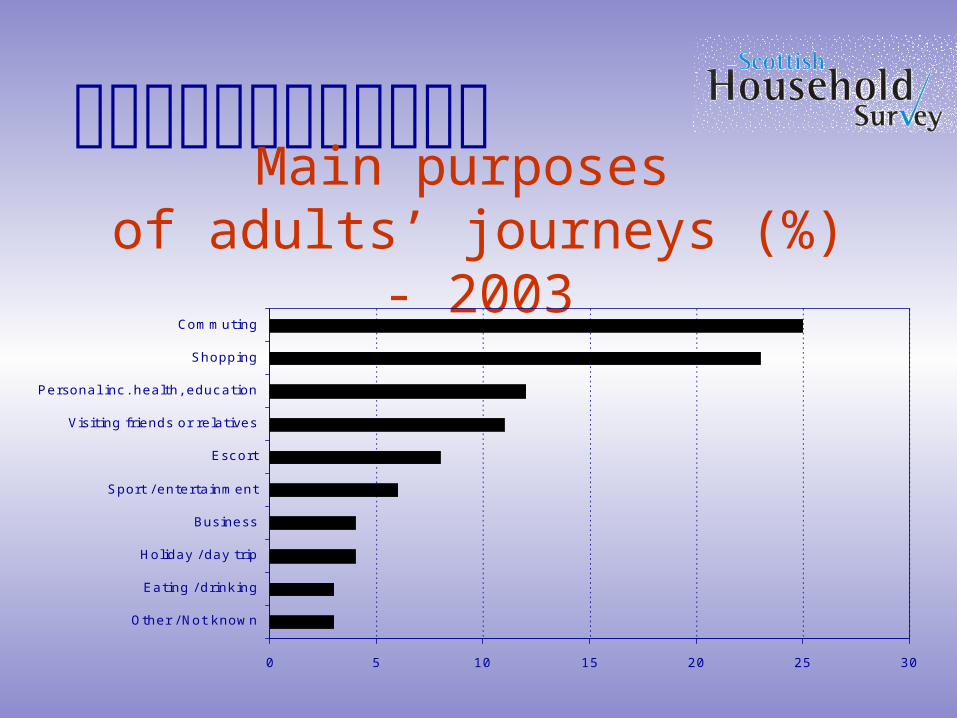
Main purposes of adults’ journeys (%) - 2003
0 5 10 15 20 25 30
Other / Not known
Eating / drinking
Holiday / day trip
Business
Sport / entertainment
Escort
Visiting friends or relatives
Personal inc . health, education
Shopping
Commuting
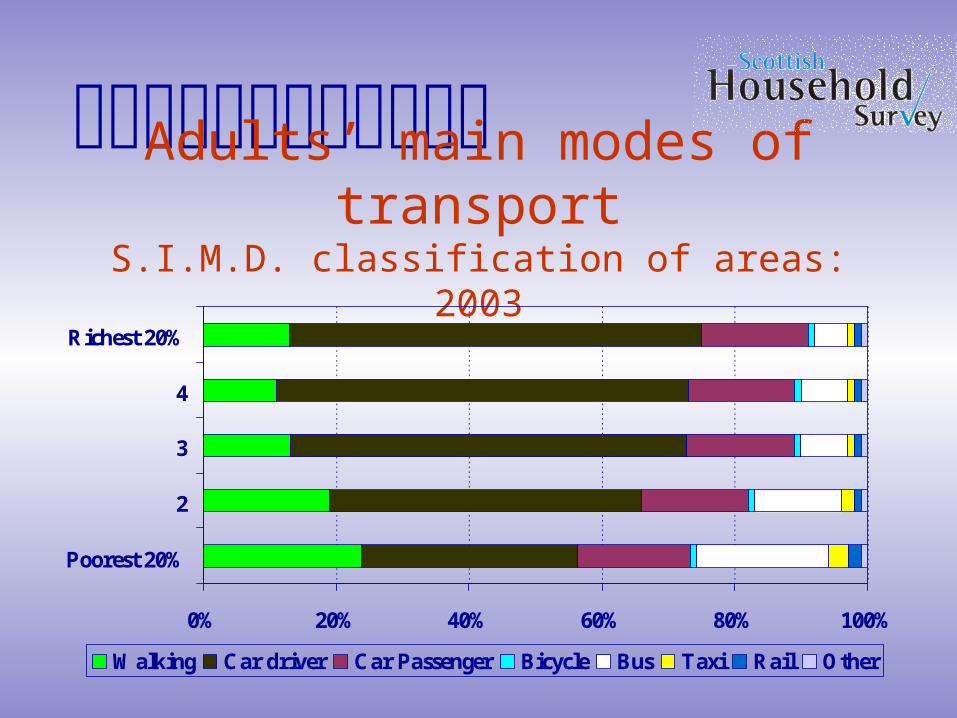
Adults’ main modes of transportS.I.M.D. classification of areas: 2003
0% 20% 40% 60% 80% 100%
Poorest 20%
2
3
4
Richest 20%
Walking Car driver Car Passenger Bicycle Bus Taxi Rail Other
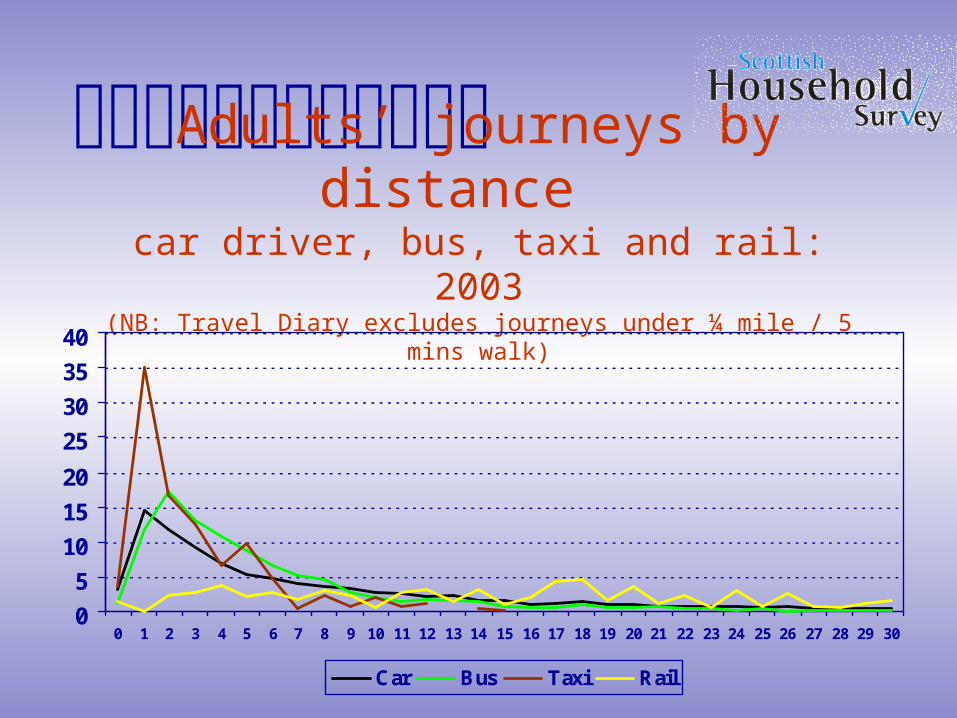
Adults’ journeys by distance car driver, bus, taxi and rail: 2003
(NB: Travel Diary excludes journeys under ¼ mile / 5 mins walk)
0
5
10
15
20
25
30
35
40
0 1 2 3 4 5 6 7 8 9 10 11 12 13 14 15 16 17 18 19 20 21 22 23 24 25 26 27 28 29 30
Car Bus Taxi Rail
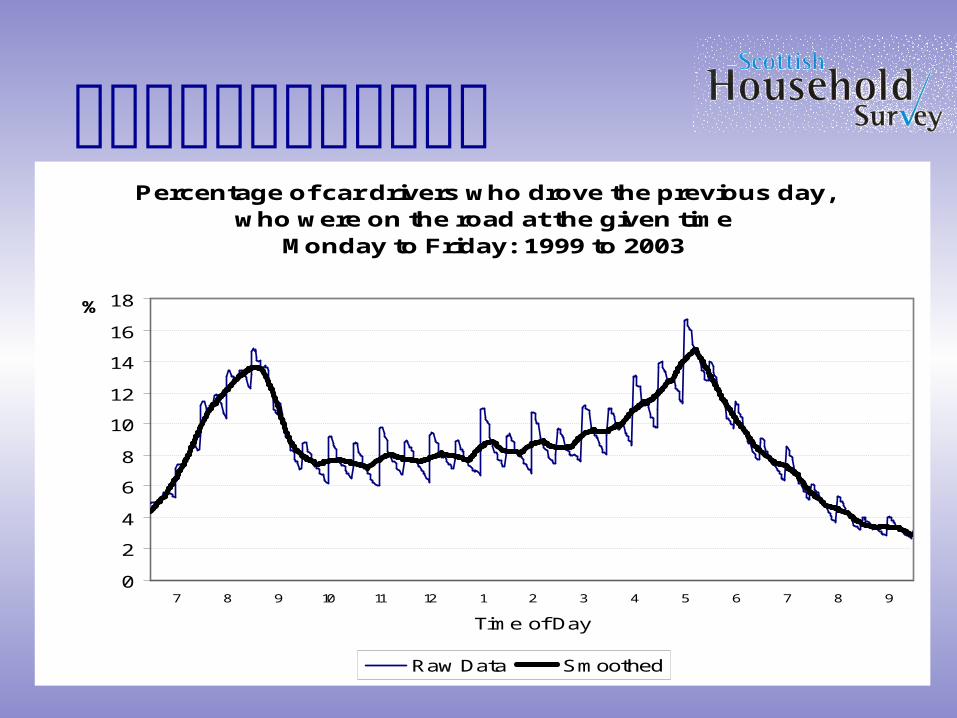
Percentage of car drivers who drove the previous day, who were on the road at the given time
Monday to Friday: 1999 to 2003
0
2
4
6
8
10
12
14
16
18
7 8 9 10 11 12 1 2 3 4 5 6 7 8 9
Time of Day
%
Raw Data Smoothed
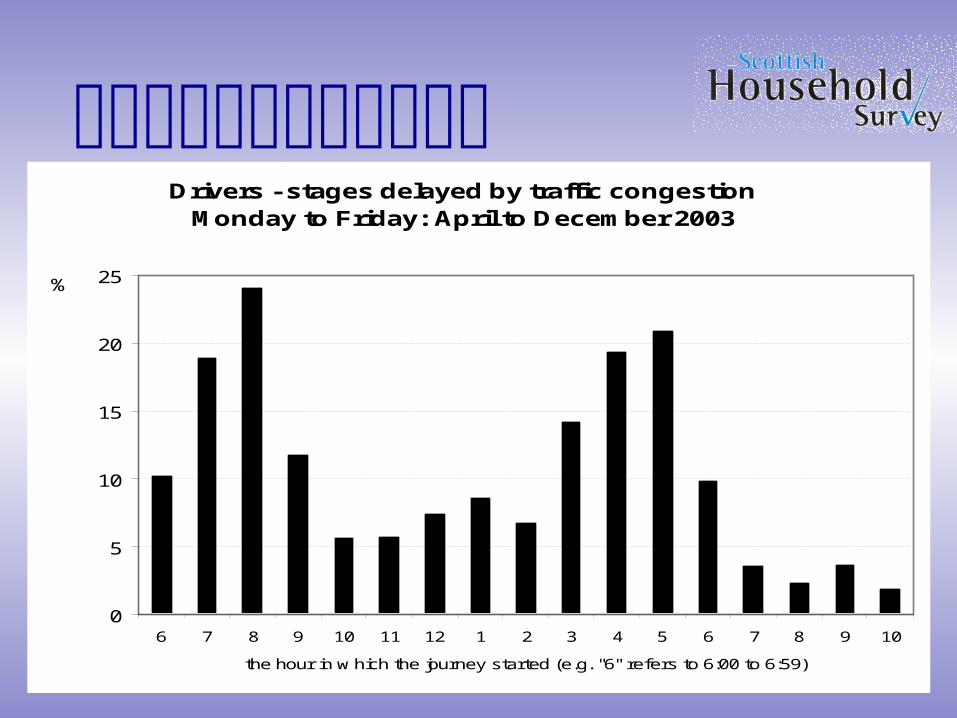
Drivers - stages delayed by traffic congestionMonday to Friday: April to December 2003
0
5
10
15
20
25
6 7 8 9 10 11 12 1 2 3 4 5 6 7 8 9 10
the hour in w hich the journey started (e.g. "6" refers to 6:00 to 6:59)
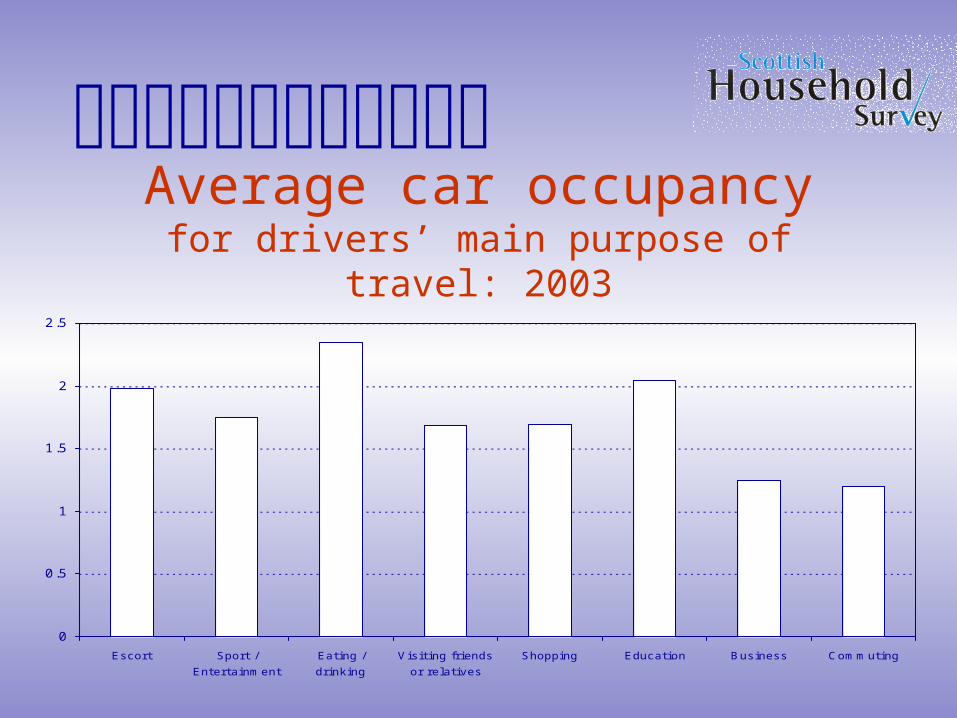
Average car occupancyfor drivers’ main purpose of travel: 2003
0
0.5
1
1.5
2
2.5
Escort Sport /
Entertainment
Eating /
drinking
Visiting friends
or relatives
Shopping Education Business Commuting
Publication of SHS Transport results
Transport Statistics bulletins Other Transport Statistics publications Available from
Blackwell’s Bookshop
www.scotland.gov.uk/transtat/latest Also included in SHS publications
Household TransportMain results for Scotland (apart from Travel Diary)
Car availability, possession of driving licences and frequency of driving Frequency of use of local bus and train services, and users’ views on aspects of them Frequency of walking and cycling, as means of transport and for pleasure or to keep fit Travel to work: mode of transport, reasons for use of mode, could car commuters use
public transport, and why they don’t / can’t Travel to school Other topics, some of which may vary from edition to edition – e.g.
Reported expenditure on fuel for cars How drivers make particular journeys, and could they use other means of transport Methods of obtaining journey planning information Place of work and working pattern Adults in full-time education - travel to place of study Whose car used to travel to work, and where parked Means of travel to work a year ago, and reasons for changes
Transport across Scotlandmain results for Council areas (apart from Travel Diary)
biennial Car availability, driving licences and frequency of driving Frequency of walking and cycling Availability and frequency of bus services Views on the convenience of public transport Travel to work Travel to school Other topics, some of which may vary from edition to edition – e.g.
Perception of safety from crime when travelling in the evening Could car/van commuters use public transport Where commuters usually park
SHS Travel Diary resultsjourneys (over ¼ mile / 5 mins walk) reported by adults
Some results for individual Council areas and/or Council groups Purpose of journey Main mode of transport Distance travelled, and duration of journey Time of day, and day of the week, of travel Car occupancy Other topics, some of which may vary from edition to edition – e.g.:
Journey origins and destinations Journeys into and within Edinburgh and Glasgow Estimated trip rates
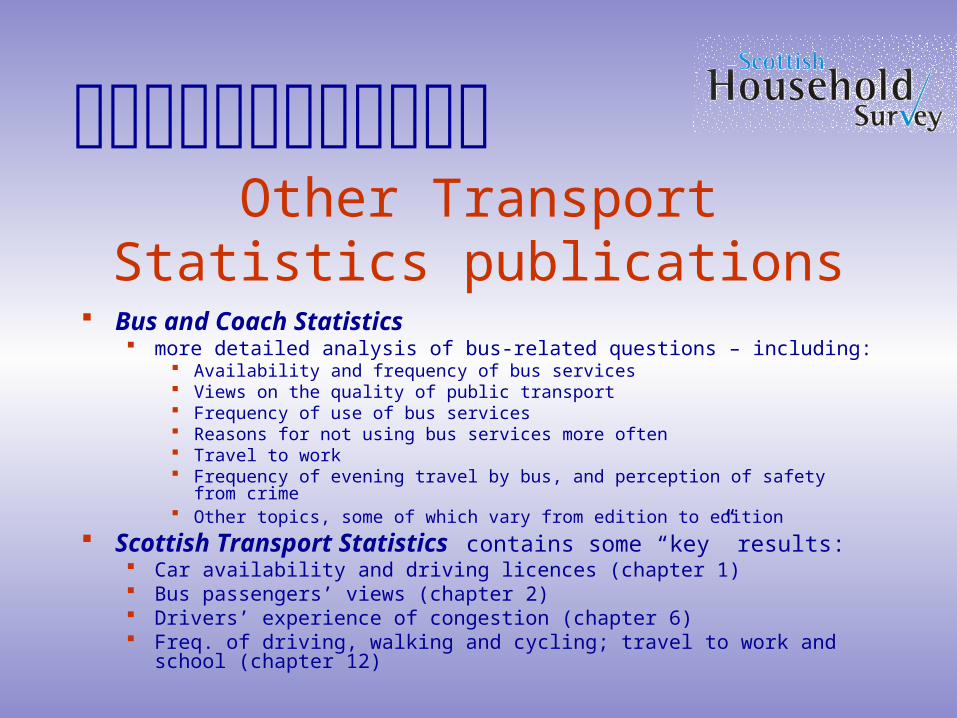
Other Transport Statistics publications
Bus and Coach Statistics more detailed analysis of bus-related questions – including:
Availability and frequency of bus services Views on the quality of public transport Frequency of use of bus services Reasons for not using bus services more often Travel to work Frequency of evening travel by bus, and perception of safety from crime Other topics, some of which vary from edition to edition
Scottish Transport Statistics contains some “key” results: Car availability and driving licences (chapter 1) Bus passengers’ views (chapter 2) Drivers’ experience of congestion (chapter 6) Freq. of driving, walking and cycling; travel to work and school (chapter 12)
Which publication?Which edition?
An Annex in Household Transport: lists all (non-Travel Diary) Transport topics shows in which years they were included in the
SHS questionnaire identifies which editions of Household Transport,
Transport across Scotland and Bus and Coach Statistics analyse them
SHS publications which include Transport results
SHS Annual Report Frequency of travelling by bus and train in the evening, and
perceptions of safety from crime (chapter 4) Travel to work or adults’ education (chapter 5) Travel to school (chapter 5) Cars available to the household (chapter 6) Convenience of public transport, and other services (chapter 7)
Topic Reports (forthcoming) Accessibility and Transport Modal Shift

Any questions ?


![U.S. v. Dixon, 509 U.S. 688 (1993) - Columbus School of Lawclinics.law.edu/res/docs/US-v-Dixon.pdfU.S. v. Dixon, 509 U.S. 688 (1993) Dixon, Dixon. and [1] Dixon. *698. order. Dixon](https://img.pdfslide.net/doc/110x75/5ac1e6007f8b9ad73f8d6ea8/us-v-dixon-509-us-688-1993-columbus-school-of-v-dixon-509-us-688.jpg)