Embed Size (px)
Citation preview

8/6/2019 - ve corelation
http://slidepdf.com/reader/full/-ve-corelation 1/13
1
All over the world the stock market is the most volatile market. In the stock market every second
situation changes due to many different reasons. It is the most risky market to invest and
therefore to compensate the risk the return of the stock market is the highest.
As all investors are risk aversive, they always try to trade-off between risk and return. Investors
manage risk at cost-lower expected returns E(R). To manage risk the best way is to have a
diversified portfolio of securities. And a proper diversified portfolio can only be achieved when
its individual securities have negative correlation between them. The advantage of this negative
correlation between stocks is that when one stock performs well in the market another one
performs badly. If both the stocks perform in a same trend then price of the will increase or
decrease at the same time. If price increases then it is good but if price decreases then the
investor will lose everything.
At first we selected some µA¶ category stocks of Dhaka Stock Exchange (DSE). After that we
looked into the past ten years records of those stocks. And finally we selected ³Bangas´ from
food segment and IFIC Bank Ltd from banking segment. There are a number of reasons behind
choosing these two stocks. First of all they have a good negative correlation (-0.278565947)
between them. Secondly, the segment they belongs food and banking is highly developed and
performing well in a continuous manner. In addition, these two stocks are issuing dividend and
bonus share regularly which is a plus point for any investor.
1.0 INTRODUCTION

8/6/2019 - ve corelation
http://slidepdf.com/reader/full/-ve-corelation 2/13
2
2.1 Inflation
Bangladesh¶s consumers¶ price index (CPI) Inflation has been steadily rising in FY2010,
reaching 8.8% year-on-year in March 2010 up from 3.5% in July 2009, largely because of an
increase in domestic as well as in the global markets food prices. But if we consider the monthly
inflation rate from December 2009 to April 2010 we see a relatively steady situation. During this
time the inflation rate fluctuated between 8.51% and 9.06%.
2.2 Interest Rate
The change in interest rate is highly unlikely for July and August, 2010. Current Bank Rate is
5% and the weighted average interest rates of schedule banks¶ are 7.31% for deposits and 12.31
for advances.
2.3 Economic Condition
GDP growth in FY2010 is projected at 5.5%, lower than in FY2009. The lagged effects of the
global economic crisis on the Bangladesh economy became evident in the last quarter of
FY2009, as reflected in the performance of the country's two main growth drivers² exports and
remittances. Exports continued to decline during July±March FY2010, primarily due to the
decrease in RMG exports; and the slowing of the growth of remittance inflows with the decline
in the export of human resources. Supply-side factors, especially acute shortages of power and
energy, also adversely impacted aggregate growth performance. Despite progress in
implementing the FY2010 fiscal stimulus package, continued underperformance of the annual
development program (ADP) in terms of adding to key infrastructure, affected complementary
private investment. With the global economic recovery gradually gaining momentum and the
domestic growth drivers picking up in response, GDP is expected to grow at 6.3% in FY2011, in
line with the growth pattern observed before the onset of the global crisis.
2.4 Assigning Probability
Based on the above current macro economic analysis of Bangladesh as well as some experts
opinion and analysis we found that the economic condition is likely to remain same for
upcoming months. Therefore, we have decided to assign 50% probability that the economy and
market condition will remain same or normal. On the other hand, we are expecting 30% chance
of economic boom and 20% chance of recession for the near future.
2.0 MACROECONOMIC ANALYSIS

8/6/2019 - ve corelation
http://slidepdf.com/reader/full/-ve-corelation 3/13
3
3.1 Individual Expected Return:
Bangas:
The average return of Bangas for last ten years is 71.22%. Based on our probability
assumption if market remain normal (pr 0.5) the E(R) will be 71.22%, if market faces a
boom (pr 0.3) the E(R) will be 80% and if market faces a recession (p r 0.2) then the E(R)
will be 15%. So based on these probabilities, the E(R) of Bangas is 61.61%.
IFIC:
The average return of IFIC for last ten years is 60.10%. Based on our probability
assumption if market remain normal (pr 0.5) the E(R) will be 60.10%, if market faces a boom (pr 0.3) the E(R) will be 70% and if market faces a recession (p r 0.2) then the E(R)
will be 10%. So based on these probabilities, the E(R) of IFIC is 53.05 %.
Market:
The average return of ³All Share Price Index´ for last ten years is 21.58%. Based on our
probability assumption if market remain normal (pr 0.5) the E(R) will be 21.58%, if market
faces a boom (pr 0.3) the E(R) will be 35% and if market faces a recession (p r 0.2) then the
E(R) will be 15%. So based on these probabilities, the E(R) of ³All Share Price Index´ is
24.29%
ECONOMIC
SITUATION PROBABILITY P0SSIBLE RETURN
BANGAS IFIC Market
BOOM 0.3 80% 70% 35%
NORMAL 0.5 71.22% 60.10% 21.58%
RECESSION 0.2 15% 10% 15%
E(R) 62.61% 53.05% 24.29%
3.0 CALCULATION OF PORTFOLIO EXPECTED RETURN

8/6/2019 - ve corelation
http://slidepdf.com/reader/full/-ve-corelation 4/13
4
3.2 Individual Risk:
Bangas:
Pri K i K K i -K (K i ±K)2 (K i ±K)2 Pri
0.3 80% 62.61% 17.39 302.412 90.724
0.5 71.22% 62.61% 8.61 74.132 37.066
0.2 15% 62.61% -47.61 2266.712 453.342
Total 581.132
= = 24. 1066%
So from the above calculation we find that the risk or the standard deviation of ³Bangas´ is
24.1066.
IFIC:
Pri K i K K i -K (K i ±K)2
(K i ±K)2 Pri
0.3 70% 53.05% 16.95 287.303 86.191
0.5 60.10% 53.05% 7.05 49.703 24.851
0.2 10% 53.05% -43.05 1853.303 370.661
Total 481.703
= = 21.948%
So from the above calculation we find that the risk or the standard deviation of IFIC is21.948.

8/6/2019 - ve corelation
http://slidepdf.com/reader/full/-ve-corelation 5/13
5
Market:
Pri K i K K i -K (K i ±K)2 (K i ±K)2 Pri
0.3 35% 24.29% 10.71% 114.71% 34.41%
0.5 21.58% 24.29% -2.71% 7.34% 3.67%
0.2 15% 24.29% -9.29% 86.31% 17.27%
Total 55.35%
= = 7.44%
So from the above calculation we find that the risk or the standard deviation of Market is
7.44%
3.3 Expected Portfolio Risk and Return:
Through assigning 10 different weights to the two stocks of Bangas and IFIC we tried find the
risk and return of those portfolios. The risk and return of the 10 portfolios are given below-
Portfolio BANGAS IFIC Total Exp Ret Port Var SD
A 100.0% 0.0% 1 62.6% 2.338907 152.9
B 90.0% 10.0% 1 61.7% 1.852334 136.1
C 80.0% 20.0% 1 60.7% 1.429818 119.6
D 70.0% 30.0% 1 59.7% 1.07136 103.5
E 60.0% 40.0% 1 58.8% 0.776958 88.1
F 50.0% 50.0% 1 57.8% 0.546613 73.9
G 40.0% 60.0% 1 56.9% 0.380325 61.7
H 30.0% 70.0% 1 55.9% 0.278095 52.7
I 20.0% 80.0% 1 55.0% 0.239921 49.0
J 10.0% 90.0% 1 54.0% 0.265804 51.6

8/6/2019 - ve corelation
http://slidepdf.com/reader/full/-ve-corelation 6/13
6
3.4 Portfolio Selection:
Step 1:
Based on the expected return and risk we draw an efficient frontier or concave curve. From
the diagram we see portfolio µJ¶ does not falls under the efficient frontier. Therefore, we
eliminated portfolio µJ¶ from our calculation.
Step 2:
After this we calculated the return relative to risk for all remaining 9 portfolios to identify the
most desirable one in terms of its expected return and the risk associated with this.
Portfolio E(R) () RETURN RELATIVE TO RISK
A 62.6 152.9 40.94
B 61.7 136.1 45.33
C 60.7 119.6 50.75
D 59.7 103.5 57.68
E 58.8 88.1 66.74
F 57.8 73.9 78.21
G 56.9 61.7 92.22
H 55.9 52.7 106.07
I 55.0 49.0 112.24
52.0
54.0
56.0
58.0
60.0
62.0
64.0
0.0 50.0 100.0 150.0 200.0
Concave Curve
EXP RETURN

8/6/2019 - ve corelation
http://slidepdf.com/reader/full/-ve-corelation 7/13
7
From the table, we can see that portfolio µI¶ is giving us best possible return relative to risk.
For 100 unit of risk it is giving me 112.24 units of return.
So based on the above all analysis finally we select portfolio µI¶ for investment where the
weight of Bangas is 20% and IFIC is 80%. The expected return for this portfolio is 55.0 %
and risk is 49.0%.

8/6/2019 - ve corelation
http://slidepdf.com/reader/full/-ve-corelation 8/13
8
4.1 Security Analysis
On 25th July, 2010, we purchased ³Bangas´ and ³IFIC´ from the market at the rate of TK
1648.25 and TK 1086 respectively. After holding 8 working days the current market price of theshare of ³Bangas´ and ³IFIC´ is respectively TK 1960 and TK 1099.
4.1.1 Individual Security Outcomes:
Bangas IFIC
Po = 1648.25 Po = 1086
P1 = 1960 P1 = 1099
r = (1960.25-1648.25)/ 1648.25 r = (1099-1086)/1086
=1.19% = 18.93%
4.1.2 Portfolio Outcomes:
Individually ³Bangas´ and ³IFIC´ is giving me a return of 1.19% and 18.93%
respectively. According to portfolio µI¶, with composition of ³Bangas´ 10% and ³IFIC´
Bank 90% the actual return of the portfolio is calculated below-
R P =�Wi.Ri
= 0.10*18.93% + 0.90*1.19%
= 1.893% + 1.071%
= 2.964%
4.1.3 Market Outcomes:
All Share Price Index
Po = 5156.39794
P1 = 5428.01616
r = (5428.01616-5156.39794)/5158.39794
= 5.23%
4.0 PORTFOLIO EVALUATION
8/6/2019 - ve corelation
http://slidepdf.com/reader/full/-ve-corelation 9/13
9
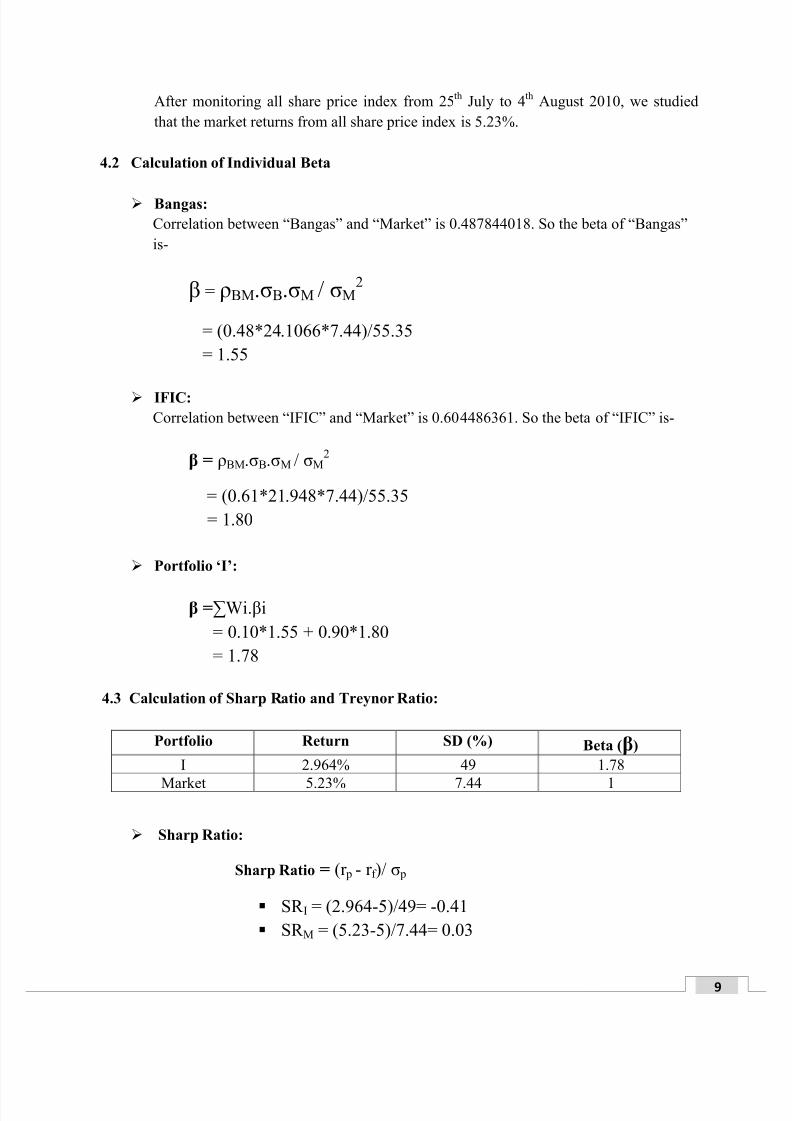
After monitoring all share price index from 25th
July to 4th
August 2010, we studied
that the market returns from all share price index is 5.23%.
4.2 Calculation of Individual Beta
Bangas:
Correlation between ³Bangas´ and ³Market´ is 0.487844018. So the beta of ³Bangas´
is-
= BM.B.M / M2
= (0.48*24.1066*7.44)/55.35
= 1.55
IFIC:
Correlation between ³IFIC´ and ³Market´ is 0.604486361. So the beta of ³IFIC´ is-
= BM.B.M / M2
= (0.61*21.948*7.44)/55.35
= 1.80
Portfolio µI¶:
=�Wi.i
= 0.10*1.55 + 0.90*1.80
= 1.78
4.3 Calculation of Sharp Ratio and Treynor Ratio:
Sharp Ratio:
Sharp Ratio = (r p - r f )/ p
SR I = (2.964-5)/49= -0.41
SR M = (5.23-5)/7.44= 0.03
Portfolio Return SD (%) Beta ()
I 2.964% 49 1.78
Market 5.23% 7.44 1

8/6/2019 - ve corelation
http://slidepdf.com/reader/full/-ve-corelation 10/13
10
Treynor Ratio:
Treynor Ratio = (rp - rf )/ p
TR I = (2.964-5)/1.78= -1.14
TR M = (5.23-5)/1= 0.23
Portfolio Sharp Ratio Treynor Ratio
I -0.41 -1.14
Market 0.03 0.23
From the above table we clearly see that our portfolio µI¶ is performing much lower
than the market bench mark.

8/6/2019 - ve corelation
http://slidepdf.com/reader/full/-ve-corelation 11/13
11
From the above portfolio analysis and evaluation it is clear to us that the portfolio we chose
which failed to satisfy our expectations. From the market analysis we expected a return of 55.0%
but in reality we got a return of only 2.964% which is much lower than our expectations.
On the other hand if we consider the ³Sharp Ratio´ and ³Treynor Ratio´ of the portfolio µI¶ again
we see it performed much lower than the market benchmark. Therefore, we decided to sell the
total portfolio because the returns of individual stocks are 1.19% (Bangas) and 18.93% (IFIC)
also much lower than the individual expected return of 61.61 %(Bangas) and 53.05 % (IFIC).
5.0 RECOMMENDATION

8/6/2019 - ve corelation
http://slidepdf.com/reader/full/-ve-corelation 12/13
12
From the 10 years of Bangas and IFIC we have calculated average return 71.22% and 60.10%
respectively. After that we shaped 10 portfolios in terms of different weights. From these 10
portfolio, portfolio µI¶ is providing us best return relative to risk. From our analysis actual
outcome of Bangas, IFIC and portfolio µI¶ was 1.19%, 1893% and 2.964% respectively. We also
studied the return from all share price index was 5.25% from 25th July 2010 to 4th August 2010.
From view of our analysis the return of portfolio µI¶ is much lower than the expected return as
well as than the return of market portfolio. And also sharp ratio and treynor ratio of our portfolio
µI¶ is very poor comparing to the market bench mark. So we reached at a conclusion to sell the
portfolio.
6.0 CONCLUSION

8/6/2019 - ve corelation
http://slidepdf.com/reader/full/-ve-corelation 13/13
Bangladesh Bank.
Dhaka Stock Exchange.
Debapriya Bhattacharya, Distinguished Fellow, CPD
Towfiqul Islam Khan,Senior Research Associate, CPD The Daily Financial Express.
7.0 REFERENCES